ALGEBRA 2 CHAPTER 11 NOTES - Mr.Bashore...
13
ALGEBRA 2 CHAPTER 11 NOTES Section 11-1 Permutations and Combinations Objectives Solve problems involving the Fundamental Counting Principle. Solve problems involving permutations and combinations. The __________________________________ ___________________________ __________________ - is a way of finding all of the possible _____________ that an event can be performed. To find the number of ways something can be performed, simply _______________________ all of the different ways for each event. A password for a site consists of 4 digits followed by 2 letters. The letters A and Z are not used, and each digit or letter many be used more than once. How many unique passwords are possible? A “make-your-own-adventure” story lets you choose 6 starting points, gives 4 plot choices, and then has 5 possible endings. How many adventures are there? Permutations A _______________________________is a selection of a group of objects in which __________________is important. How many ways can the letters A, B, C be arranged. You can make a tree diagram. To do Permutations, one must use a new math function called a________________________ (___). Find 4! Find 5!/3! Example: How many ways can 8 students sit at 5 desks. 2 Ways to do Permutations: Box Method: Formula Method:
Transcript of ALGEBRA 2 CHAPTER 11 NOTES - Mr.Bashore...

ALGEBRA 2 CHAPTER 11 NOTES Section 11-1 Permutations and Combinations
Objectives Solve problems involving the Fundamental Counting Principle.
Solve problems involving permutations and combinations.
The __________________________________ ___________________________ __________________ - is a way of finding all of the possible _____________ that an event can be performed. To find the number of ways something can be performed, simply _______________________ all of the different ways for each event.
A password for a site consists of 4 digits followed by 2 letters. The letters A
and Z are not used, and each digit or letter many be used more than once. How many unique passwords are possible?
A “make-your-own-adventure” story lets you choose 6 starting points, gives 4 plot choices, and then has 5 possible endings. How many adventures are there?
Permutations
A _______________________________is a selection of a group of objects in which __________________is important.
How many ways can the letters A, B, C be arranged. You can make a tree diagram. To do Permutations, one must use a new math function called a________________________ (___). Find 4! Find 5!/3! Example: How many ways can 8 students sit at 5 desks.
2 Ways to do Permutations:
Box Method:
Formula Method:
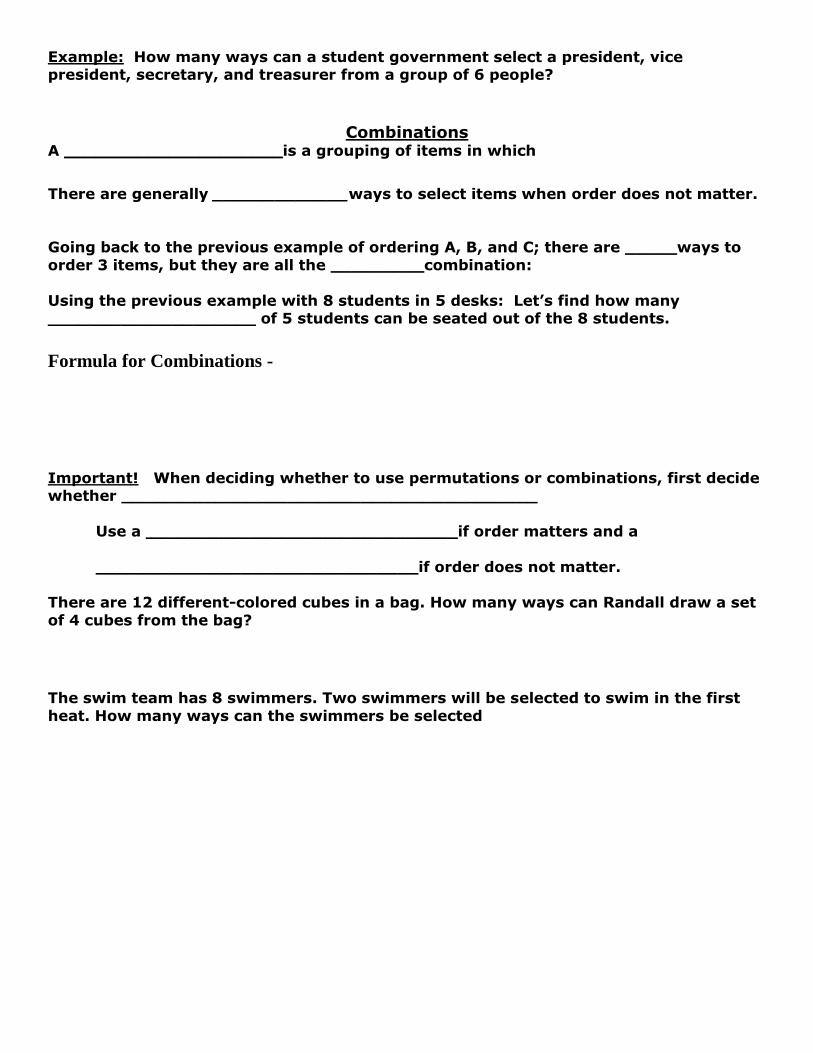
Example: How many ways can a student government select a president, vice president, secretary, and treasurer from a group of 6 people?
Combinations
A _____________________is a grouping of items in which
There are generally _____________ways to select items when order does not matter.
Going back to the previous example of ordering A, B, and C; there are _____ways to
order 3 items, but they are all the _________combination:
Using the previous example with 8 students in 5 desks: Let’s find how many ____________________ of 5 students can be seated out of the 8 students.
Formula for Combinations -
Important! When deciding whether to use permutations or combinations, first decide whether ________________________________________
Use a ______________________________if order matters and a
_______________________________if order does not matter. There are 12 different-colored cubes in a bag. How many ways can Randall draw a set
of 4 cubes from the bag?
The swim team has 8 swimmers. Two swimmers will be selected to swim in the first
heat. How many ways can the swimmers be selected

ALGEBRA 2 CHAPTER 11 NOTES Section 11-2 Probabilities
Objectives Find the theoretical probability of an event.
Find the experimental probability of an event.
_____________________________________is the measure of how likely an
event is to occur.
Each possible result of a probability experiment or situation is an __________
The __________________________is the set of all possible outcomes.
An________________ is an outcome or set of outcomes.
Probabilities are written as fractions or decimals from ________________, or as percents from _______________________
________________________outcomes have the same chance of occurring.
________________________outcomes are outcomes in a specified event. For equally likely outcomes.
The ________________________________________of an event is the ratio of the number of favorable outcomes to the total number of outcomes.
Formula for Theoretical Probability:
Each letter of the word PROBABLE is written on a separate card. The cards are placed face down and mixed up. What is the probability that a randomly selected card has a consonant?
Two number cubes are rolled. What is the probability that the difference between the two numbers is 4?
The sum is 6 The difference is 6. The red cube is greater.
The_____________ of all probabilities in the sample space is _____.
The ______________________________of an event E is the set of all outcomes in the
sample space that are not in E.

There are 25 students in study hall. The table shows the number of students who are studying a foreign language. What is the probability that a randomly selected student
is not studying a foreign language?
Language Number
French 6
Spanish 12
Japanese 3
Using Permutations and Combinations with Probabilities
A DJ randomly selects 2 of 8 ads to play before her show. Two of the ads are by a local retailer. What is the probability that she will play both of the retailer’s ads before her
show?
Geometric probability is a form of theoretical probability determined by a ratio of lengths, areas, or volumes
What would be the probability of randomly hitting the shaded area?
Experimental Probabilites You can estimate the probability of an event by using data, or by_________________.
For example, if a doctor states that an operation “has an 80% probability of success,” 80% is an ____________________of probability based on similar case histories.
Each repetition of an experiment is a_______________. The sample space of an
experiment is the set of all possible outcomes.
The __________________________________ probability of an event is the ratio of
the number of times that the event occurs, the________________________, to the number of trials.
Experimental probability is often used to _______________________________ theoretical probability and to make predictions.
What is the probability of spinning a 4? A number greater than 2?
Number Occurrences
1 6
2 11
3 19
4 14

ALGEBRA 2 CHAPTER 11 NOTES Section 11-3 Independent and Dependent Events
Objectives Determine whether events are independent or dependent.
Find the probability of independent and dependent events.
Independent Events Events are ________________________________________ if the occurrence of one event does not affect the probability of the other.
Events that are Independent:
𝑷(𝑨 𝒂𝒏𝒅 𝑩) =
Example: A six-sided cube is labeled with the numbers 1, 2, 2, 3, 3, and 3. Four sides are colored red, one side is white, and one side is yellow. Find the probability.
Tossing 2, then 2. Tossing red, then white, then yellow
Find the probability of tossing heads, then heads, and then tails when tossing a coin
3 times
Dependent Events
Events are ________________________if the occurrence of one event ________________ the probability of the other.
For example, suppose that there are 2 lemons and
1 lime in a bag. If you pull out two pieces of fruit, the probabilities change depending on the outcome of the first.
To find the probability of dependent events, you can use
________________________________________ the probability of event B, given that event A has occurred.
Events that are Dependent: 𝑷(𝑨 𝒂𝒏𝒅 𝑩) =
Two number cubes are rolled–one white and one yellow. Explain why the events are dependant. Then find the indicated probability.
The white cube shows a 6 and the sum is greater than 9 .
The yellow cube shows an even number and the sum is 5.

The table shows domestic migration from 1995 to 2000. A person is randomly selected. Find each probability.
Domestic Migration by Region
(thousands)
Region Immigrants Emigrants
Northeast 1537 2808
Midwest 2410 2951
South 5042 3243
West 2666 2654
A. that an immigrant is from the West
B. that someone selected from the South region is an immigrant
C. that someone selected is an immigrant and is from the Midwest
In many cases involving random selection, events are independent when there is ________________________________and dependent when there is _____
____________________________.
Two cards are drawn from a deck of 52. Determine whether the events are independent or dependent. Find the probability.
A. selecting two hearts when the first card is replaced
B. selecting two hearts when the first card is not replaced
C. a queen is drawn, is not replaced, and then a king is drawn

ALGEBRA 2 CHAPTER 11 NOTES Section 11-4 Compound Events
Objectives Find the probability of mutually exclusive events.
Find the probability of inclusive events.
Mutually Exclusive Events A ________________________event is an event that describes a single outcome.
A _______________________ event is an event made up of two or more simple events.
__________________________events are events that cannot both occur in the same trial of an experiment. Rolling a 1 and rolling a 2 on the same roll of a number cube
are mutually exclusive events.
If two events are Mutually Exclusive then:
𝑷(𝑨 ∪ 𝑩) =
A group of students is donating blood during a blood drive. A student has a 9/20
probability of having type O blood and a 2/5 probability of having type A blood.
Explain why the events “type O” and “type A” blood are mutually exclusive.
What is the probability that a student has type O or type A blood?
Each student cast one vote for senior class president. Of the students, 25% voted for
Hunt, 20% for Kline, and 55% for Vila. A student from the senior class is selected at random.
Explain why the events “voted for Hunt,” “voted for Kline,” and “voted for Vila” are mutually exclusive.
What is the probability that a student voted for Kline or Vila?
Inclusive Events
___________________________ are events that have _____________________
outcomes in common.

When you roll a number cube, the outcomes “rolling an even number” and “rolling a prime number” are not mutually exclusive. Why?
The Probability of Inclusive Events:
𝑷(𝑨 ∪ 𝑩) = Find the probability on a number cube:
Rolling a 4 or an even number
Rolling an odd number or a number greater than 2
A card is drawn from a deck of 52. Find the probability of each.
Drawing a king or a heart
Drawing a red card (hearts or diamonds) or a face card (jack, queen, or king)
Of 1560 students surveyed, 840 were seniors and 630 read a daily paper. The rest of
the students were juniors. Only 215 of the paper readers were juniors. What is the probability that a student was a senior or read a daily paper?
Of 160 beauty spa customers, 96 had a hair styling and 61 had a manicure. There were
28 customers who had only a manicure. What is the probability that a customer had a hair styling or a manicure?

ALGEBRA 2 CHAPTER 11 NOTES Section 11-5 Measuring Data
Objectives Find measures of central tendency and measures of variation for statistical data.
Examine the effects of outliers on statistical data.
Measures of Central Tendency The ______________is the sum of the values in the set divided by the number of values. It is often represented as _______
The ________________is the middle value or the mean of the two middle values
when the set is ordered numerically.
The _______________is the value or values that occur most often. A data set may
have one mode, no mode, or several modes.
Find the mean, median, and mode of the data.
# of Deer at a feeder each hour: 3, 0, 2, 0, 1, 2, 4
A ___________________________________________is a mean calculated by using frequencies of data values.
Suppose that 30 movies are rated as follows:
Find the average of the stars:
For numerical data, the weighted average of all of those outcomes is called the ____________________________________for that experiment.
The ____________________________________for an experiment is the function that pairs each outcome with its probability.
The probability distribution of successful free throws for a practice set is given below. Find the expected number of successes for one set.
Box and Whisker Plots A _______________________shows the spread of a data set.
It displays 5 key points: the ___________________and
______________________values, the___________________, and the ___ and _______________.

ALGEBRA 2 CHAPTER 11 NOTES Section 11-5 Measuring Data
Objectives Find measures of central tendency and measures of variation for statistical data.
Examine the effects of outliers on statistical data
Box and Whisker (Continued)
The quartiles are the________________ of the lower and upper halves of the data set.
If there are an odd number of data values, _________include the median in either half.
The ___________________________________or IQR, is the difference between the
1st and 3rd
quartiles, or ___________________.
It represents the middle ______of the data.
Make a box-and-whisker plot of the data. Find the interquartile range.
{6, 8, 7, 5, 10, 6, 9, 8, 4}
Measures of Variation
The data sets {19, 20, 21} and {0, 20, 40} have the same mean and median, but the sets are very different. How?
A ______________________is a value that describes the ____________of a data set.
The most commonly used measures of variation are: Range: IQR: Variance: Standard Deviation:
__________ standard deviations indicate data that are clustered near the measures of central tendency, whereas __________ standard deviations indicate data that are _______________________ from the center.
Finding Variance and Standard Deviation
1.
2.
3.
4.

Find the mean and standard deviation for the data set of the number of people getting
on and off a bus for several stops.
{6, 8, 7, 5, 10, 6, 9, 8, 4}
Outliers
An _____________________is an extreme value that is much ______ than or much _________________than the other data values.
Outliers have a strong effect on the______________ and ________________.
One is to look for data values that are more than ___ standard deviations from
the mean.
Find the mean and the standard deviation for the heights of 15 cans. Identify
any outliers, and describe how they affect the mean and the standard deviation.
Can Heights (mm)
92.8 92.8 92.9
92.9 92.9 92.8
92.7 92.9 92.1
92.7 92.8 92.9
92.9 92.7 92.8
Use a Calculater-
Press the STAT button to Enter the data under L1.
Press the STAT and scroll to CALC. Then press #1 (1-Variable Stats)
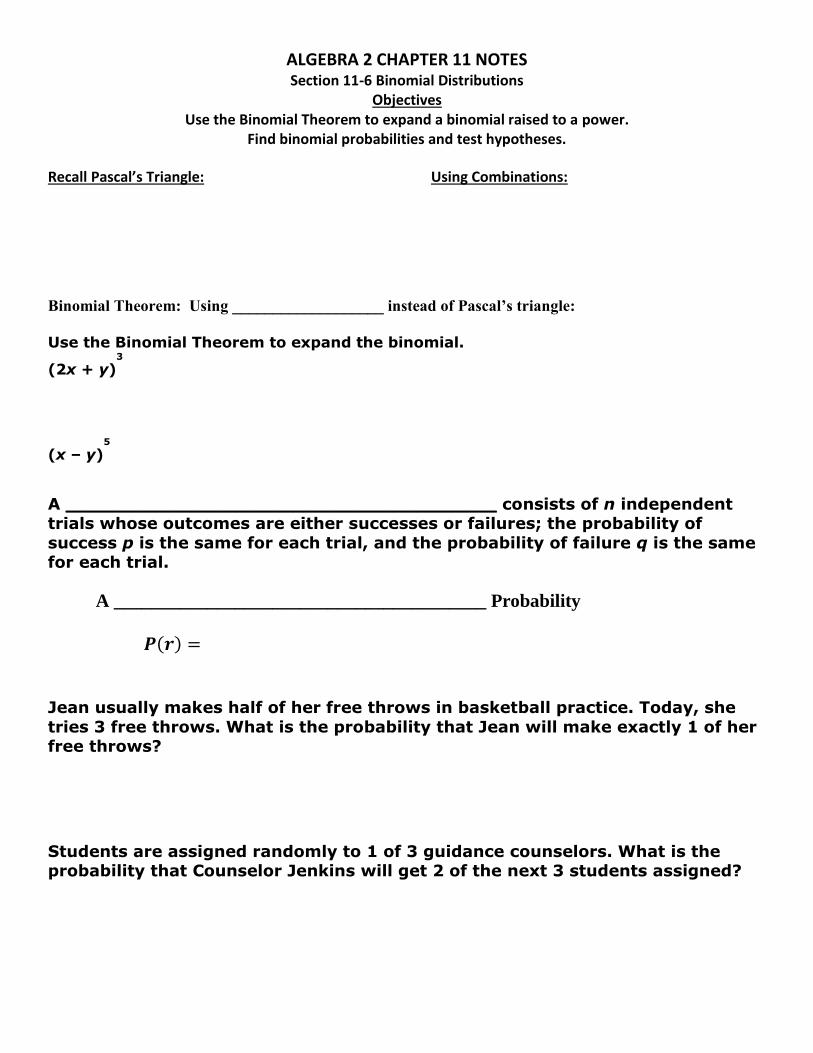
ALGEBRA 2 CHAPTER 11 NOTES Section 11-6 Binomial Distributions
Objectives Use the Binomial Theorem to expand a binomial raised to a power.
Find binomial probabilities and test hypotheses.
Recall Pascal’s Triangle: Using Combinations:
Binomial Theorem: Using ___________________ instead of Pascal’s triangle:
Use the Binomial Theorem to expand the binomial.
(2x + y)3
(x – y)5
A ______________________________________ consists of n independent trials whose outcomes are either successes or failures; the probability of
success p is the same for each trial, and the probability of failure q is the same for each trial.
A ________________________________________ Probability
𝑷(𝒓) =
Jean usually makes half of her free throws in basketball practice. Today, she
tries 3 free throws. What is the probability that Jean will make exactly 1 of her free throws?
Students are assigned randomly to 1 of 3 guidance counselors. What is the probability that Counselor Jenkins will get 2 of the next 3 students assigned?

ALGEBRA 2 CHAPTER 11 NOTES Section 11-7 Normal Distributions
Objectives Recognize normally distributed data.
Use the characteristics of the normal distribution to solve problems Standardized test results, like those used for the ACT, follow ____________________
Probability distributions can be based on either _______________________________
Usually discrete data result from __________________ and continuous data result
from____________________________.
You may be familiar with the bell-shaped curve called the______________________.
A ________________________________________________is a function of the mean and standard deviation of a data set that assigns probabilities to intervals of real
numbers associated with continuous random variables.
The figure shows the percent of data in a normal distribution that falls within a
number of standard deviations from the mean.
Addition shows the following:
• About ___% lie within __ standard deviation of the mean.
• About ___% lie within __ standard deviations of the mean.
• Close to ___% lie within __ standard deviations of the mean
The SAT is designed so that scores are normally distributed with a mean of 500 and a
standard deviation of 100.
What percent of SAT scores are between 300 and 500?
What is the probability that an SAT score is below 700?
What is the probability that an SAT score is less than 400 or greater than 600?
If 80 Juniors take the test, how many will score above 600?