ALFA, S.A.B. DE C.V. FOURTH QUARTER 2018 FINANCIAL … · 1 day ago · ALFA´S FOURTH QUARTER 2018...
50
ALFA, S.A.B. DE C.V. FOURTH QUARTER 2018 FINANCIAL REPORT ALFA reports record EBITDA of US $887 million in 4Q18, up 56% year-over-year Monterrey, N.L., Mexico, February 13, 2019.- ALFA, S.A.B. de C.V. (ALFA), reported today its 4Q18 unaudited financial results. Total revenues were US $4,692 million, up 9% year-on-year driven by higher sales at Alpek. EBITDA was US $887 million, a 56% increase vis-à-vis 4Q17 and 8% higher when excluding extraordinary items in both quarters. Commenting on the Company’s results Mr. Alvaro Fernandez, ALFA’s President, said: “Both the quarter and full year showed good results. The quarter’s EBITDA was up 8% year-on-year in comparable terms and full year 2018 was a strong year for ALFA, with the highest EBITDA ever, even when excluding extraordinary items. During the quarter, two of our companies moved forward with significant strategic transactions that better position both ALFA and the subsidiary companies for future growth. Alpek, along with its joint venture partners, closed the acquisition of M&G’s project in Corpus Christi, while Axtel, aligned with its strategy to focus in the enterprise and government segments, divested its mass-market business, with proceeds utilized to significantly strengthen its balance sheet. This, along with Alpek’s announced sale of its Cogen plants keeps us firmly on track to meet our stated goal of lowering ALFA’s consolidated leverage.” Consolidated capital expenditures and acquisitions amounted to US $262 million during 4Q18. Net Debt at the close of the quarter reached US $6,543 million, 4% higher when compared to US $6,300 million in 4Q17 reflecting mainly the acquisition of PetroquímicaSuape and Citepe (Suape/Citepe) and the contribution for the Corpus Christi Project by Alpek in 2Q18 and 4Q18, respectively. At the end of the quarter, Net Debt to EBITDA improved to 2.3 times and Interest Coverage to 5.8 times from 3.1 times and 4.6 times in 4Q17, respectively. Majority Net Income was US $237 million in 4Q18, a reversal from the US $31 million loss reported in 4Q17. This improvement is mainly explained by increased margins at Alpek, along with extraordinary gains at Alpek and Axtel that resulted in higher year-on-year operating income, as well as by lower exchange losses compared to 4Q17. Selected Financial Information (US $ million) 4Q18 3Q18 4Q17 CH. % vs. 3Q18 CH. % vs. 4Q17 YTD. ‘18 YTD. ‘17 YTD Chg. % Consolidated Revenues 4,692 4,950 4,297 (5) 9 19,055 16,804 13 Sigma 1,596 1,601 1,593 - - 6,336 6,054 5 Alpek 1,758 1,941 1,321 (9) 33 6,991 5,231 34 Nemak 1,078 1,152 1,094 (6) (1) 4,704 4,481 5 Axtel 208 202 226 3 (8) 809 822 (2) Newpek 22 27 31 (18) (29) 108 107 - Consolidated EBITDA 1 887 666 568 33 56 2,858 2,018 42 Sigma 174 180 195 (3) (11) 684 676 1 Alpek 369 274 141 35 163 1,063 384 177 Nemak 171 160 166 7 3 734 715 3 Axtel 206 69 77 199 170 422 290 46 Newpek 16 (2) 3 926 358 31 3 971 Majority Net Income 237 72 (31) 229 871 682 (134) 608 Capital Exp. & Acquisitions 262 198 250 32 5 1,296 1,101 18 Net Debt 6,543 6,901 6,300 (5) 4 6,543 6,300 4 Net Debt/LTM EBITDA * 2.3 2.7 3.1 LTM Interest Coverage * 5.8 5.2 4.6 * Times. LTM = Last 12 months 1 EBTIDA = Operating Income + depreciation and amortization + impairment of assets. CONTENT: SUMMARY OF GROUPS…2 | ALFA FINANCIAL TABLES…6 | ALFA GROUPS FINANCIAL INFORMATION…10 |
Transcript of ALFA, S.A.B. DE C.V. FOURTH QUARTER 2018 FINANCIAL … · 1 day ago · ALFA´S FOURTH QUARTER 2018...

ALFA, S.A.B. DE C.V.
FOURTH QUARTER 2018 FINANCIAL REPORT
ALFA reports record EBITDA of US $887 million in 4Q18, up 56% year-over-year
Monterrey, N.L., Mexico, February 13, 2019.- ALFA, S.A.B. de C.V. (ALFA), reported today its 4Q18 unaudited financial results. Total revenues were US $4,692 million, up 9% year-on-year driven by higher sales at Alpek. EBITDA was US $887 million, a 56% increase vis-à-vis 4Q17 and 8% higher when excluding extraordinary items in both quarters.
Commenting on the Company’s results Mr. Alvaro Fernandez, ALFA’s President, said: “Both the quarter and full year showed good results. The quarter’s EBITDA was up 8% year-on-year in comparable terms and full year 2018 was a strong year for ALFA, with the highest EBITDA ever, even when excluding extraordinary items. During the quarter, two of our companies moved forward with significant strategic transactions that better position both ALFA and the subsidiary companies for future growth. Alpek, along with its joint venture partners, closed the acquisition of M&G’s project in Corpus Christi, while Axtel, aligned with its strategy to focus in the enterprise and government segments, divested its mass-market business, with proceeds utilized to significantly strengthen its balance sheet. This, along with Alpek’s announced sale of its Cogen plants keeps us firmly on track to meet our stated goal of lowering ALFA’s consolidated leverage.”
Consolidated capital expenditures and acquisitions amounted to US $262 million during 4Q18. Net Debt at the close of the quarter reached US $6,543 million, 4% higher when compared to US $6,300 million in 4Q17 reflecting mainly the acquisition of PetroquímicaSuape and Citepe (Suape/Citepe) and the contribution for the Corpus Christi Project by Alpek in 2Q18 and 4Q18, respectively. At the end of the quarter, Net Debt to EBITDA improved to 2.3 times and Interest Coverage to 5.8 times from 3.1 times and 4.6 times in 4Q17, respectively.
Majority Net Income was US $237 million in 4Q18, a reversal from the US $31 million loss reported in 4Q17. This improvement is mainly explained by increased margins at Alpek, along with extraordinary gains at Alpek and Axtel that resulted in higher year-on-year operating income, as well as by lower exchange losses compared to 4Q17.
Selected Financial Information (US $ million)
4Q18 3Q18 4Q17
CH. % vs.
3Q18
CH. % vs.
4Q17 YTD. ‘18 YTD. ‘17
YTD Chg.
%
Consolidated Revenues 4,692 4,950 4,297 (5) 9 19,055 16,804 13 Sigma 1,596 1,601 1,593 - - 6,336 6,054 5 Alpek 1,758 1,941 1,321 (9) 33 6,991 5,231 34 Nemak 1,078 1,152 1,094 (6) (1) 4,704 4,481 5 Axtel 208 202 226 3 (8) 809 822 (2) Newpek 22 27 31 (18) (29) 108 107 -
Consolidated EBITDA 1 887 666 568 33 56 2,858 2,018 42 Sigma 174 180 195 (3) (11) 684 676 1 Alpek 369 274 141 35 163 1,063 384 177 Nemak 171 160 166 7 3 734 715 3 Axtel 206 69 77 199 170 422 290 46 Newpek 16 (2) 3 926 358 31 3 971
Majority Net Income 237 72 (31) 229 871 682 (134) 608 Capital Exp. & Acquisitions 262 198 250 32 5 1,296 1,101 18 Net Debt 6,543 6,901 6,300 (5) 4 6,543 6,300 4
Net Debt/LTM EBITDA * 2.3 2.7 3.1 LTM Interest Coverage * 5.8 5.2 4.6
* Times. LTM = Last 12 months 1 EBTIDA = Operating Income + depreciation and amortization + impairment of assets.
CONTENT: SUMMARY OF GROUPS…2 | ALFA FINANCIAL TABLES…6 | ALFA GROUPS FINANCIAL INFORMATION…10 |
ALFA´S FOURTH QUARTER 2018
2
Summary of subsidiary performance during 4Q18
Sigma’s revenues amounted to US $1,596 million, similar to 4Q17. On a currency neutral basis, revenues were up 4%. Mexico sales increased 8% in pesos, European sales in euros increased 2% and U.S. and Latin American sales were 1% lower than 4Q17. Accumulated 2018 revenues totaled US $6,336 million, a 5% increase over 2017.
Sigma reported 4Q18 EBITDA of US $174 million, 11% lower year-on-year. Excluding Europe´s extraordinary items related to the acquisition of Caroli in 4Q17, EBITDA decreased 5%, impacted mainly by US operations. Accumulated 2018 EBITDA totaled US $684 million, up 1% from 2017. Excluding Europe´s extraordinary items, accumulated EBITDA increased 4%.
During 4Q18, capital expenditures totaled US $73 million. Funds were used for expansion and maintenance projects across the company. Accumulated capital expenditures for the year were US $180 million.
Strong cash flow generation during 4Q18 enabled Sigma to reduce Net Debt by 4% year-on-year to US $1,859 million. Net Debt to EBITDA improved from 2.9 times in 4Q17 to 2.7 times, while Interest Coverage improved from 4.7 times in 4Q17 to 5.3 times.
(See appendix “A” for more comprehensive analysis of Sigma´s 4Q18 financial results)
Alpek´s revenues for 4Q18 totaled US $1,758 million, including US $188 million from Suape/Citepe. Adjusting for the acquired entities in Brazil, 4Q18 revenues were up 19% year-on-year driven by higher average prices.
4Q18 EBITDA was US $369 million, including a net gain of US $188 million from the following three non-operating items: i) a US $220 million non-cash gain on business combination (Suape/Citepe), ii) a US $28 million non-cash inventory loss and iii) a US $4 million net loss from other items such as non-recurring legal fees/expenses. Adjusting for these items, comparable EBITDA was US $181 million and US $124 million in 4Q18 and 4Q17, respectively, a 45% increase.
During 4Q18, Corpus Christi Polymers LLC (“CC Polymers”), a JV between Alpek, Indorama and Far Eastern, obtained regulatory clearance from the Federal Trade Commission (“FTC”) and acquired the Corpus Christi project from M&G USA for an aggregate amount of US $1,199 million in cash and other capital contributions.
Alpek contributed to the JV US $266 million in cash and US $133 million in a non-cash payment associated with a portion of the secured claim with M&G, arising under the original agreement. Alpek will also obtain US $67 million in cash for the remainder of its secured claim, subject to certain conditions. This transaction implies a total recovery of US $200 million from the original agreement with M&G, which was subject to a full asset impairment in 2017. As a result, 4Q18 Operating Income includes a non-cash gain of US $195 million that corresponds to the present value of the total recovery.
Also related to the M&G bankruptcy, the process among Alpek, M&G Mexico and other creditors to approve and implement a definitive restructuring plan, advanced in 4Q18.
Alpek also advanced in the process to sell its Cosoleacaque and Altamira cogeneration power plants, reaching a final agreement with ContourGlobal for an aggregate amount of US $801 million. Pursuant to the agreement, Alpek will maintain a reliable and competitive supply of steam and power for its Mexican facilities through long-term contracts.

ALFA´S FOURTH QUARTER 2018
3
Moreover, the sale implies realizing an attractive return and will strengthen Alpek’s balance sheet and credit metrics even further. Closing of this transaction is expected before the end of the second quarter.
During 4Q18, Alpek made capital investments of US $262 million, mainly associated with the acquisition of the Corpus Christi project from M&G. This compares with capex of US $30 million in 4Q17.
Net Debt as of the end of the quarter was US $1,832 million, up 45% year-on-year, mainly as a result of the Suape/Citepe acquisition in 2Q18 and the contribution to the Corpus Christi project. At quarter end, financial ratios were as follows: Net Debt to EBITDA of 1.7 times and Interest Coverage of 9.9 times. Adjusted by the non-cash gain from the Suape/Citepe acquisition, Net Debt to EBITDA was 2.2 times and Interest Coverage of 7.8 times.
(See appendix “B” for Alpek´s 4Q18 financial report)
Nemak´s 4Q18 sales volume was 11.5 million equivalent units, 4% lower than 4Q17, as volumes in North America (NA) were flat while Europe and Rest of the World (RoW) declined. In Europe, Nemak´s volumes declined mainly due to the effect of lower sales to diesel engine applications together with production delays among OEMs caused by the rollout of new regional emissions testing standards. RoW volumes were down year-on-year as a positive performance in Brazil was not enough to compensate for the impact of production reductions among certain customers in China.
Revenues were US $1,078 million, down 1% year-over-year, reflecting lower volumes sold. 4Q18 EBITDA was US $171 million, up 3% year-on-year, aided by a one-time customer settlement in the amount of US $7.5 million, and lower SG&A expenses, which reflected operating efficiencies and the capitalization of US $6 million of structural and electric vehicle components business expenses. These factors helped to more than offset the impact of lower volumes and higher energy expenses in the quarter. 4Q18 EBITDA per equivalent unit was US $14.9, compared to US $13.8 in 4Q17.
During the quarter, Nemak invested US $132 million to support new product launches in all regions.
Net Debt at the end of 4Q18 totaled US $1,251 million, down 2% from 4Q17, reflecting cash generation during the period. Financial ratios in 4Q18 were: Net Debt to EBITDA of 1.7 times, and Interest Coverage of 7.7 times.
(See appendix “C” for Nemak´s 4Q18 financial report)
On December 17th, Axtel sold its fiber mass-market business (FTTH) that operated in Monterrey, San Luis Potosi, Aguascalientes, Ciudad de Mexico, Ciudad Juarez and the municipality of Zapopan, to Televisa for $4,713 million pesos. Axtel transferred 227,802 mass-market customers, 4,432 km of FTTH fiber optic network and other FTTH mass-market segment assets in these cities. The proceeds from this transaction were used for the partial prepayment of a bank loan for $4,350 million pesos.
Reflecting its expectation to divest the remaining FTTx business, Axtel has recorded all of the Mass Market business as a discontinued operation in its individual report, and its results will reflect the performance of the Enterprise and Government segments only. By contrast, as this is not material to ALFA, our financial results will continue to reflect all operations.
Revenues in the fourth quarter totaled US $208 million, down 8% year-on-year, mainly explained by lower revenues in the Government segment, due to a decline in voice and internet services. By contrast, the Enterprise segment

ALFA´S FOURTH QUARTER 2018
4
continued to grow in IT services and Managed Applications. Other factor contributing to lower revenues was the continued decline of the legacy Wimax service.
4Q18 reported EBITDA was US $206 million, including a gain of US $139 million from the sale of the majority of its mass-market business to Televisa. However, excluding this item and the US $19 million gain related to the 4Q17 sale of transmission towers, EBITDA increased 16% year-on-year. This increase is mainly explained by better performance from the Enterprise and Government segment and merger-related expenses that affected 4Q17.
Capital expenditures were a negative US $178 million in 4Q18, mainly reflecting the divestment in the mass-market segment. At the end of 4Q18, Net Debt was US $686 million, down 30% year on year, mainly reflecting the mass-market sale as proceeds were used to reduce debt. Financial ratios at the end of 4Q18 were: Net Debt to EBITDA of 1.6 times and Interest Coverage of 4.4 times. Adjusting for extraordinary items, Net Debt to EBITDA was 2.4 times and Interest Coverage of 3.0 times.
(See appendix “D” for Axtel´s 4Q18 financial report)
Newpek´s revenues were US $22 million, down 29% from 4Q17, mainly explained by lower revenues in Mexico and lower U.S. production due to the partial sale of Eagle Ford Shale (“EFS”) and the Wilcox field.
At the end of 4Q18 Newpek had 555 producing wells at the EFS in South Texas, down from 648 wells in production at the end of 4Q17, reflecting the partial acreage sale to Sundance Energy earlier in the year, and the sale of the Wilcox field. Additionally, Newpek had 34 wells producing in the Edwards formation in South Texas, where Newpek has a 20% working interest. Production in the U.S. averaged 3.4 thousand barrels of oil equivalent per day (MBOED) during 4Q18, down 45% from 4Q17. In Mexico, production averaged 3.2 MBOED during 4Q18, a 6% decrease year on year.
During the quarter, Newpek signed a purchase and sale agreement with an undisclosed third party to sell approximately 725 net acres in the Wilcox field, which will net proceeds of US $33 million to Newpek. The transaction closed at the beginning of December 2018.
During 4Q18, the company reported EBITDA of US $16 million, compared to US $3 million in 4Q17. Excluding the sale of the Wilcox assets, EBITDA was negative US $6 million, mainly explained by higher expenses in Mexico and in the U.S. during the quarter. Capital expenditures were negative US $27 million reflecting the Wilcox divestiture, while net debt was negative US $18 million at the end of the quarter.
The process to divest the remaining Eagle Ford Shale acreage position continues.
(See appendix “E” for more comprehensive analysis of Newpek´s 4Q18 financial results)
Consolidated financial results 4Q18 consolidated revenues were US $4,692 million, up 9% from US $4,297 million reported in 4Q17. The increase is mainly explained by higher sales at Alpek due to higher average prices and the consolidation of Suape/Citepe. During the quarter, foreign sales represented 67% of the total, up from 66% in 4Q17. Year-to-date, revenues were US $19,055 up 13% from 2017 driven by growth across all business units, except Axtel.
ALFA´S FOURTH QUARTER 2018
5
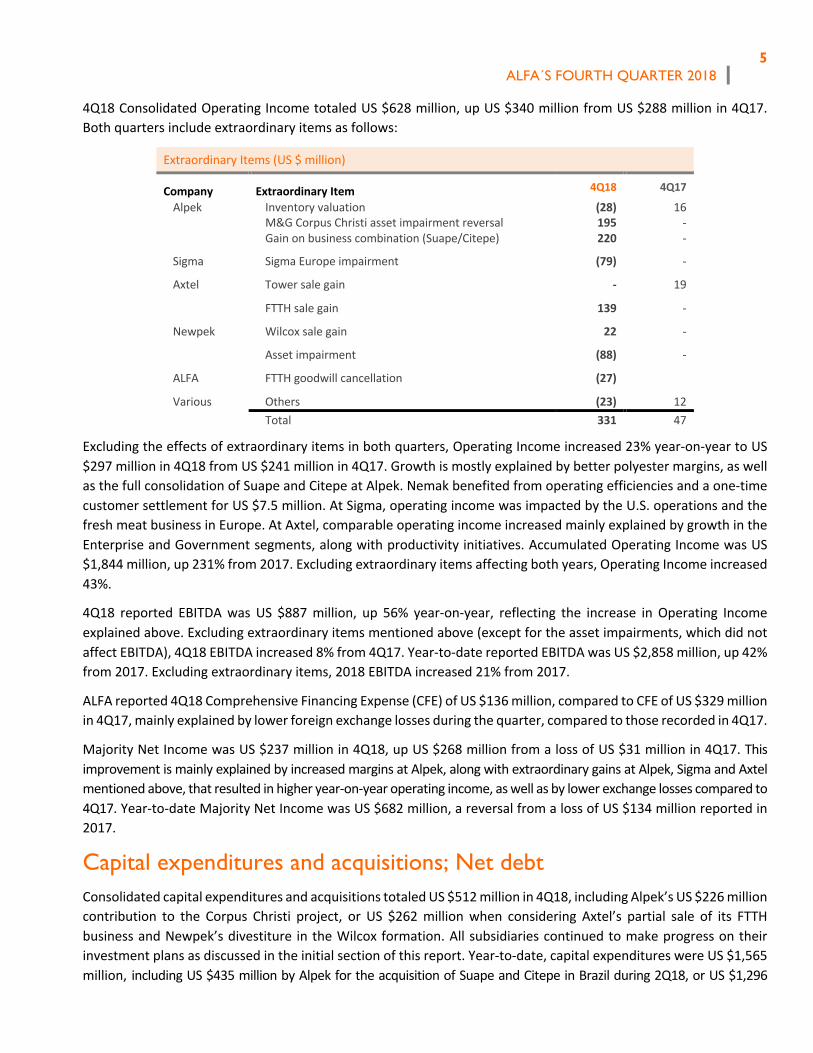
4Q18 Consolidated Operating Income totaled US $628 million, up US $340 million from US $288 million in 4Q17. Both quarters include extraordinary items as follows:
Extraordinary Items (US $ million)
Company Extraordinary Item 4Q18 4Q17
Alpek Inventory valuation (28) 16 M&G Corpus Christi asset impairment reversal 195 - Gain on business combination (Suape/Citepe) 220 -
Sigma Sigma Europe impairment (79) -
Axtel Tower sale gain - 19
FTTH sale gain 139 -
Newpek Wilcox sale gain 22 -
Asset impairment (88) -
ALFA FTTH goodwill cancellation (27)
Various Others (23) 12 Total 331 47
Excluding the effects of extraordinary items in both quarters, Operating Income increased 23% year-on-year to US $297 million in 4Q18 from US $241 million in 4Q17. Growth is mostly explained by better polyester margins, as well as the full consolidation of Suape and Citepe at Alpek. Nemak benefited from operating efficiencies and a one-time customer settlement for US $7.5 million. At Sigma, operating income was impacted by the U.S. operations and the fresh meat business in Europe. At Axtel, comparable operating income increased mainly explained by growth in the Enterprise and Government segments, along with productivity initiatives. Accumulated Operating Income was US $1,844 million, up 231% from 2017. Excluding extraordinary items affecting both years, Operating Income increased 43%.
4Q18 reported EBITDA was US $887 million, up 56% year-on-year, reflecting the increase in Operating Income explained above. Excluding extraordinary items mentioned above (except for the asset impairments, which did not affect EBITDA), 4Q18 EBITDA increased 8% from 4Q17. Year-to-date reported EBITDA was US $2,858 million, up 42% from 2017. Excluding extraordinary items, 2018 EBITDA increased 21% from 2017.
ALFA reported 4Q18 Comprehensive Financing Expense (CFE) of US $136 million, compared to CFE of US $329 million in 4Q17, mainly explained by lower foreign exchange losses during the quarter, compared to those recorded in 4Q17.
Majority Net Income was US $237 million in 4Q18, up US $268 million from a loss of US $31 million in 4Q17. This improvement is mainly explained by increased margins at Alpek, along with extraordinary gains at Alpek, Sigma and Axtel mentioned above, that resulted in higher year-on-year operating income, as well as by lower exchange losses compared to 4Q17. Year-to-date Majority Net Income was US $682 million, a reversal from a loss of US $134 million reported in 2017.
Capital expenditures and acquisitions; Net debt
Consolidated capital expenditures and acquisitions totaled US $512 million in 4Q18, including Alpek’s US $226 million contribution to the Corpus Christi project, or US $262 million when considering Axtel’s partial sale of its FTTH business and Newpek’s divestiture in the Wilcox formation. All subsidiaries continued to make progress on their investment plans as discussed in the initial section of this report. Year-to-date, capital expenditures were US $1,565 million, including US $435 million by Alpek for the acquisition of Suape and Citepe in Brazil during 2Q18, or US $1,296

ALFA´S FOURTH QUARTER 2018
6
million when considering the partial divestment of the mass-market segment in Axtel and the Wilcox and EFS sales in Newpek.
ALFA’s Net Debt amounted to US $6,543 million at the close of 4Q18, 4% higher than the year-ago quarter, mostly reflecting the acquisitions and divestitures mentioned above. At the end of the quarter, financial ratios improved to Net Debt to EBITDA of 2.3 times and Interest Coverage of 5.8 times, compared with 3.1 times and 4.6 times, respectively, in 4Q17.
ALFA´S FOURTH QUARTER 2018
7
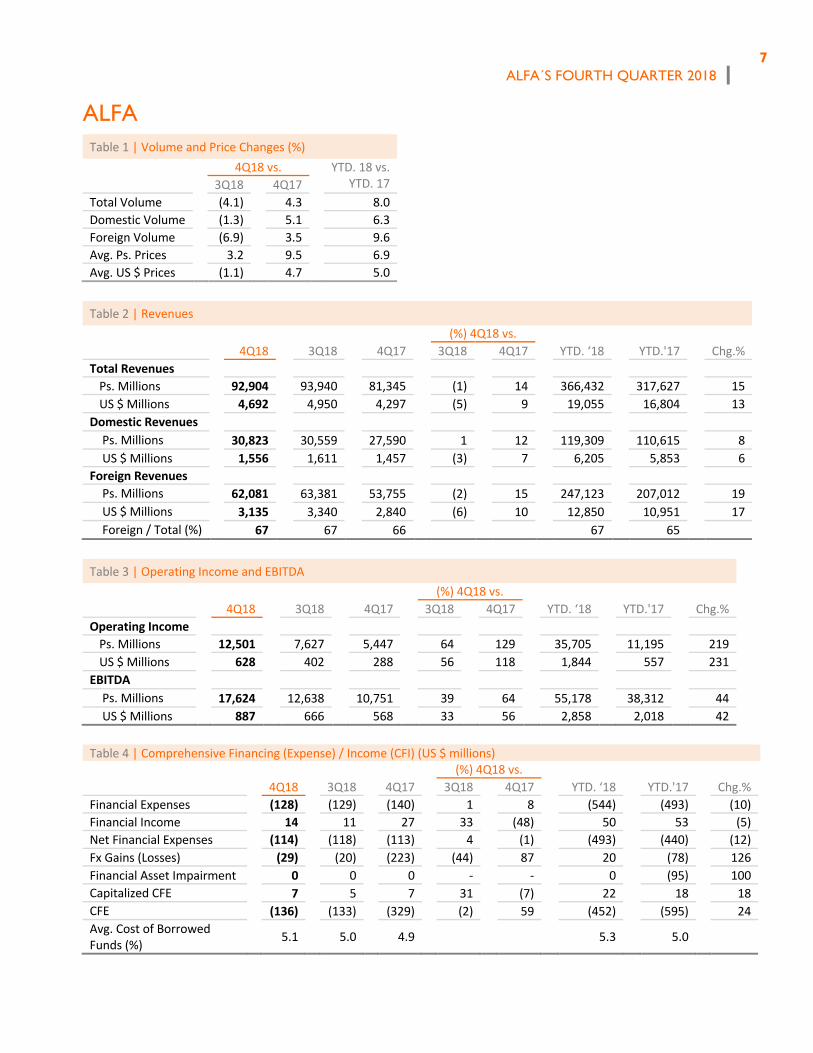
ALFA Table 1 | Volume and Price Changes (%)
4Q18 vs. YTD. 18 vs. YTD. 17 3Q18 4Q17
Total Volume (4.1) 4.3 8.0 Domestic Volume (1.3) 5.1 6.3 Foreign Volume (6.9) 3.5 9.6 Avg. Ps. Prices 3.2 9.5 6.9 Avg. US $ Prices (1.1) 4.7 5.0
Table 2 | Revenues (%) 4Q18 vs. 4Q18 3Q18 4Q17 3Q18 4Q17 YTD. ‘18 YTD.'17 Chg.%
Total Revenues Ps. Millions 92,904 93,940 81,345 (1) 14 366,432 317,627 15 US $ Millions 4,692 4,950 4,297 (5) 9 19,055 16,804 13
Domestic Revenues Ps. Millions 30,823 30,559 27,590 1 12 119,309 110,615 8 US $ Millions 1,556 1,611 1,457 (3) 7 6,205 5,853 6
Foreign Revenues Ps. Millions 62,081 63,381 53,755 (2) 15 247,123 207,012 19 US $ Millions 3,135 3,340 2,840 (6) 10 12,850 10,951 17 Foreign / Total (%) 67 67 66 67 65
Table 3 | Operating Income and EBITDA
(%) 4Q18 vs. 4Q18 3Q18 4Q17 3Q18 4Q17 YTD. ‘18 YTD.'17 Chg.%
Operating Income Ps. Millions 12,501 7,627 5,447 64 129 35,705 11,195 219 US $ Millions 628 402 288 56 118 1,844 557 231
EBITDA Ps. Millions 17,624 12,638 10,751 39 64 55,178 38,312 44 US $ Millions 887 666 568 33 56 2,858 2,018 42
Table 4 | Comprehensive Financing (Expense) / Income (CFI) (US $ millions)
(%) 4Q18 vs. 4Q18 3Q18 4Q17 3Q18 4Q17 YTD. ‘18 YTD.'17 Chg.%
Financial Expenses (128) (129) (140) 1 8 (544) (493) (10) Financial Income 14 11 27 33 (48) 50 53 (5) Net Financial Expenses (114) (118) (113) 4 (1) (493) (440) (12) Fx Gains (Losses) (29) (20) (223) (44) 87 20 (78) 126 Financial Asset Impairment 0 0 0 - - 0 (95) 100 Capitalized CFE 7 5 7 31 (7) 22 18 18 CFE (136) (133) (329) (2) 59 (452) (595) 24 Avg. Cost of Borrowed Funds (%)
5.1
5.0
4.9
5.3 5.0
ALFA´S FOURTH QUARTER 2018
8
ALFA
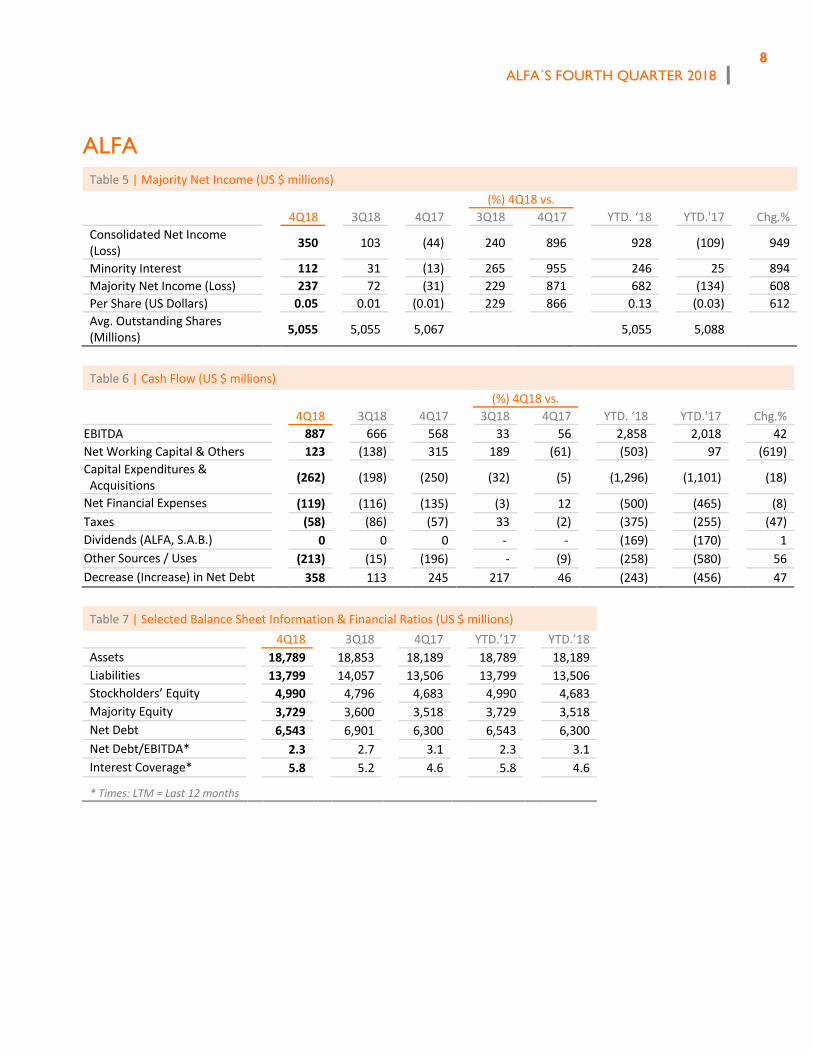
Table 5 | Majority Net Income (US $ millions) (%) 4Q18 vs. 4Q18 3Q18 4Q17 3Q18 4Q17 YTD. ‘18 YTD.'17 Chg.%
Consolidated Net Income (Loss)
350 103 (44) 240 896 928 (109) 949
Minority Interest 112 31 (13) 265 955 246 25 894 Majority Net Income (Loss) 237 72 (31) 229 871 682 (134) 608 Per Share (US Dollars) 0.05 0.01 (0.01) 229 866 0.13 (0.03) 612 Avg. Outstanding Shares (Millions)
5,055 5,055 5,067 5,055 5,088
Table 6 | Cash Flow (US $ millions)
(%) 4Q18 vs. 4Q18 3Q18 4Q17 3Q18 4Q17 YTD. ‘18 YTD.'17 Chg.%
EBITDA 887 666 568 33 56 2,858 2,018 42 Net Working Capital & Others 123 (138) 315 189 (61) (503) 97 (619) Capital Expenditures & Acquisitions
(262) (198) (250) (32) (5) (1,296) (1,101) (18)
Net Financial Expenses (119) (116) (135) (3) 12 (500) (465) (8) Taxes (58) (86) (57) 33 (2) (375) (255) (47) Dividends (ALFA, S.A.B.) 0 0 0 - - (169) (170) 1 Other Sources / Uses (213) (15) (196) - (9) (258) (580) 56 Decrease (Increase) in Net Debt 358 113 245 217 46 (243) (456) 47
Table 7 | Selected Balance Sheet Information & Financial Ratios (US $ millions) 4Q18 3Q18 4Q17 YTD.’17 YTD.’18 Assets 18,789 18,853 18,189 18,789 18,189 Liabilities 13,799 14,057 13,506 13,799 13,506 Stockholders’ Equity 4,990 4,796 4,683 4,990 4,683 Majority Equity 3,729 3,600 3,518 3,729 3,518 Net Debt 6,543 6,901 6,300 6,543 6,300 Net Debt/EBITDA* 2.3 2.7 3.1 2.3 3.1 Interest Coverage* 5.8 5.2 4.6 5.8 4.6
* Times: LTM = Last 12 months

ALFA´S FOURTH QUARTER 2018
9
ALFA
Appendix A ALFA, S.A.B. de C.V. and Subsidiaries BALANCE SHEET Information in millions of Nominal Mexican Pesos (%) Dec 18 vs. Dec 18 Sep 18 Dec 17 Sep 18 Dec 17 Assets CURRENT ASSETS: Cash and cash equivalents 26,411 21,494 32,813 23 (20) Trade accounts receivable 31,625 34,007 27,621 (7) 14 Other accounts and notes receivable 7,841 5,024 6,874 56 14 Inventories 51,790 48,092 44,341 8 17 Other current assets 9,717 11,662 10,486 (17) (7) Total current assets 127,384 120,279 122,135 6 4 INVESTMENTS IN ASSOCIATES AND JOINT VENTURES 9,870 2,774 1,455 256 579 PROPERTY, PLANT AND EQUIPMENT 153,389 151,881 153,642 1 (0) INTANGIBLE ASSETS 52,311 52,741 58,058 (1) (10) OTHER NON-CURRENT ASSETS 26,874 26,985 23,678 (0) 13 Total assets 369,828 354,660 358,968 4 3 LIABILITIES AND STOCKHOLDER'S EQUITY CURRENT LIABILITIES: Current portion of long-term debt 6,509 841 2,454 674 165 Bank loans and notes payable 15,012 10,520 13,134 43 14 Suppliers 64,921 59,759 61,214 9 6 Other current liabilities 26,280 24,230 21,391 8 23 Total current liabilities 112,721 95,351 98,194 18 15 LONG-TERM LIABILITIES: Long-term debt 135,528 140,929 142,799 (4) (5) Deferred income taxes 13,112 12,245 13,874 7 (5) Other liabilities 5,270 10,822 6,693 (51) (21) Estimated liabilities for seniority premiums and pension plans 4,973 5,100 4,982 (2) (0) Total liabilities 271,604 264,447 266,542 3 2 STOCKHOLDERS' EQUITY: Controlling interest: Capital stock 211 211 211 - - Earned surplus 73,179 67,509 69,227 8 6 Total controlling interest 73,390 67,720 69,437 8 6 Total Non-controlling interest 24,834 22,494 22,989 10 8 Total stockholders' equity 98,224 90,214 92,427 9 6 Total liabilities and stockholders' equity 369,828 354,660 358,968 4 3 Current ratio 1.13 1.26 1.25 Debt to equity 2.77 2.93 2.88
ALFA´S FOURTH QUARTER 2018
10
ALFA
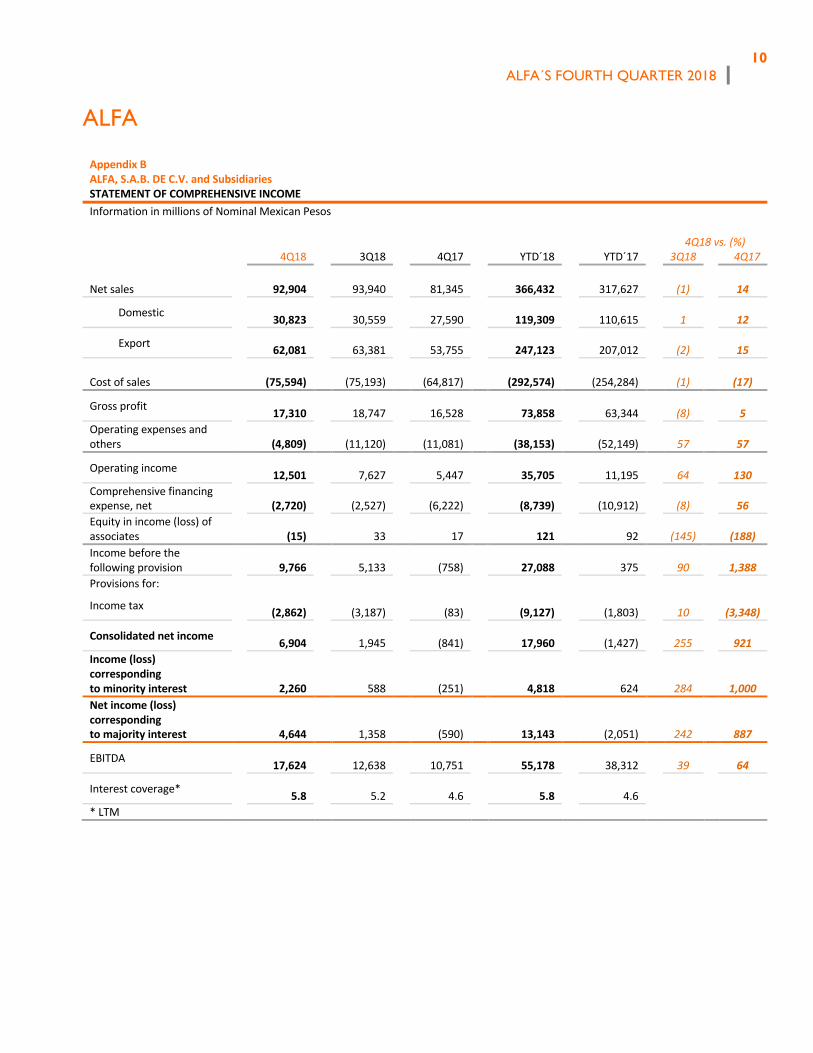
Appendix BALFA, S.A.B. DE C.V. and SubsidiariesSTATEMENT OF COMPREHENSIVE INCOMEInformation in millions of Nominal Mexican Pesos
4Q18 vs. (%)
4Q18 3Q18 4Q17 YTD´18 YTD´17 3Q18 4Q17
Net sales
92,904
93,940
81,345
366,432
317,627 (1) 14
Domestic 30,823
30,559
27,590
119,309
110,615 1 12
Export 62,081
63,381
53,755
247,123
207,012 (2) 15
Cost of sales
(75,594)
(75,193)
(64,817)
(292,574)
(254,284) (1) (17)
Gross profit 17,310
18,747
16,528
73,858
63,344 (8) 5
Operating expenses and others
(4,809)
(11,120)
(11,081)
(38,153)
(52,149) 57 57
Operating income 12,501
7,627
5,447
35,705
11,195 64 130
Comprehensive financing expense, net
(2,720)
(2,527)
(6,222)
(8,739)
(10,912) (8) 56
Equity in income (loss) of associates
(15) 33
17
121
92 (145) (188)
Income before the following provision
9,766
5,133
(758)
27,088
375 90 1,388
Provisions for:
Income tax (2,862)
(3,187)
(83)
(9,127)
(1,803) 10 (3,348)
Consolidated net income 6,904
1,945
(841)
17,960
(1,427) 255 921
Income (loss) corresponding to minority interest
2,260
588
(251)
4,818
624 284 1,000 Net income (loss) corresponding to majority interest
4,644
1,358
(590)
13,143
(2,051) 242 887
EBITDA 17,624
12,638
10,751
55,178
38,312 39 64
Interest coverage* 5.8 5.2
4.6
5.8
4.6
* LTM
ALFA´S FOURTH QUARTER 2018
11
LuisOchoa+52(81)[email protected]
Juan Andrés Martín +52(81)[email protected]
Eugenia Villarreal +52(81)[email protected]
InspIR Group Susan Borinelli +1(646)[email protected]
This release may contain forward-looking information based on numerous variables and assumptions that are inherently uncertain. They involve judgments with respect to, among other things, future economic, competitive and financial market conditions and future business decisions, all of which are difficult or
impossible to predict accurately. Accordingly, results could vary from those set forth in this release. The report presents unaudited financial information. Figures are presented in Mexican pesos or US Dollars, as indicated. Where applicable, peso amounts were translated into US Dollars using the average
exchange rate of the months during which the operations were recorded. Financial ratios are calculated in US Dollars. Due to the rounding up of figures, small differences may occur when calculating percent changes from one period to the other.
APPENDIX: A SIGMA 12 B ALPEK 18 C NEMAK 31 D AXTEL 39 E NEWPEK 48
ALFA´S FOURTH QUARTER 2018
12
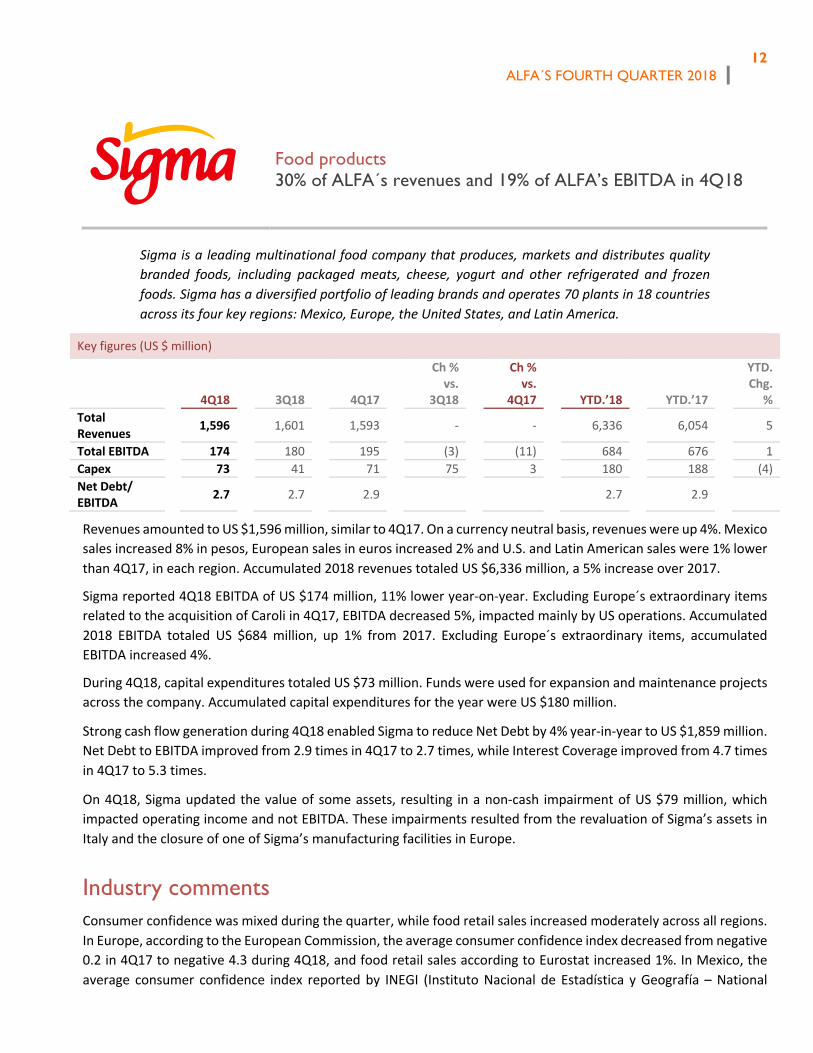
Food products 30% of ALFA´s revenues and 19% of ALFA’s EBITDA in 4Q18
Sigma is a leading multinational food company that produces, markets and distributes quality branded foods, including packaged meats, cheese, yogurt and other refrigerated and frozen foods. Sigma has a diversified portfolio of leading brands and operates 70 plants in 18 countries across its four key regions: Mexico, Europe, the United States, and Latin America.
Key figures (US $ million)
4Q18 3Q18 4Q17
Ch % vs.
3Q18
Ch % vs.
4Q17 YTD.’18 YTD.’17
YTD. Chg.
% Total Revenues
1,596 1,601 1,593 - - 6,336 6,054 5
Total EBITDA 174 180 195 (3) (11) 684 676 1 Capex 73 41 71 75 3 180 188 (4) Net Debt/ EBITDA
2.7 2.7 2.9 2.7 2.9
Revenues amounted to US $1,596 million, similar to 4Q17. On a currency neutral basis, revenues were up 4%. Mexico sales increased 8% in pesos, European sales in euros increased 2% and U.S. and Latin American sales were 1% lower than 4Q17, in each region. Accumulated 2018 revenues totaled US $6,336 million, a 5% increase over 2017.
Sigma reported 4Q18 EBITDA of US $174 million, 11% lower year-on-year. Excluding Europe´s extraordinary items related to the acquisition of Caroli in 4Q17, EBITDA decreased 5%, impacted mainly by US operations. Accumulated 2018 EBITDA totaled US $684 million, up 1% from 2017. Excluding Europe´s extraordinary items, accumulated EBITDA increased 4%.
During 4Q18, capital expenditures totaled US $73 million. Funds were used for expansion and maintenance projects across the company. Accumulated capital expenditures for the year were US $180 million.
Strong cash flow generation during 4Q18 enabled Sigma to reduce Net Debt by 4% year-in-year to US $1,859 million. Net Debt to EBITDA improved from 2.9 times in 4Q17 to 2.7 times, while Interest Coverage improved from 4.7 times in 4Q17 to 5.3 times.
On 4Q18, Sigma updated the value of some assets, resulting in a non-cash impairment of US $79 million, which impacted operating income and not EBITDA. These impairments resulted from the revaluation of Sigma’s assets in Italy and the closure of one of Sigma’s manufacturing facilities in Europe.
Industry comments Consumer confidence was mixed during the quarter, while food retail sales increased moderately across all regions. In Europe, according to the European Commission, the average consumer confidence index decreased from negative 0.2 in 4Q17 to negative 4.3 during 4Q18, and food retail sales according to Eurostat increased 1%. In Mexico, the average consumer confidence index reported by INEGI (Instituto Nacional de Estadística y Geografía – National

ALFA´S FOURTH QUARTER 2018
13
Institute for Statistics and Geography) rose 17% year-on-year and 1% vs 3Q18, while same-store-sales reported by the National Association of Supermarkets and Department Stores (ANTAD) increased 4% year-on-year in nominal pesos. In the U.S., the average consumer confidence index increased 6% year-on-year as reported by The Conference Board, and food retail sales increased 3% year-on-year, reported by the U.S. Census Bureau.
Key raw material prices varied during the quarter. In Europe, prices for pork ham and pork shoulder during 4Q18 decreased 2% and 3%, respectively versus the previous quarter. Year-on-year, pork ham and pork shoulder prices were 3% and 6% lower, respectively.
In the U.S., main raw materials remained high during the quarter. Compared to 4Q17, chicken, turkey thighs and turkey breast were 13%, 28% and 36% higher, respectively. By contrast, pork ham prices were 19% lower. In Mexico, however, pork prices were impacted by the 20% tariffs imposed on June 5th.
Financial results by region During 4Q18, sales in Mexico accounted for 41% of the quarter’s total, while Europe represented 37%, the U.S. 14%, and Latin America 8%.
Europe
Sales in Europe during 4Q18 in euros increased 2% and EBITDA decreased 17% year-on-year. Excluding extraordinary items related to the Caroli acquisition in Romania in 4Q17 EBITDA was 2% higher year-on-year.
The Bureba plant continued to operate as planned and its efficiencies were reflected in better margins for Sigma’s Spanish operation. In Romania, Caroli’s results continued exceeding management’s expectations due to an effective integration process. By contrast, margins from buying live hogs and selling pork carcasses were significantly disrupted during the quarter impacting the fresh meat business during 4Q18.
For full year 2018, excluding extraordinary items, EBITDA was 4% higher vs. 2017.
Mexico
The Mexican operations continued reporting solid results throughout the year. During 4Q18 Mexican sales and EBITDA in pesos increased 8% and 2% year-on-year, respectively. Accumulated EBITDA in pesos for 2018 was 12% higher vs. 2017.
USA
4Q18 U.S. sales decreased 1% due to lower sales volume and EBITDA decreased 25% year-on-year. Results continue to be impacted by higher raw materials costs and higher freight costs associated with the new transportation regulation.
During 4Q18, Sigma began implementing price increases to offset these effects. These price increases contributed to higher margins on a sequential basis and are anticipated to drive further margin improvement going forward. 2018 accumulated EBITDA was 15% lower vs. 2017.
Latam
Fourth quarter 2018 Latin America sales in USD terms decreased 1% year-on-year. By contrast, EBITDA increased 31% year-on-year. 4Q18 margins improved year-on-year throughout the region, benefiting from strong performances of the Peruvian and Dominican Republic operations. Full year 2018 EBITDA was 14% higher vs. 2017.

ALFA´S FOURTH QUARTER 2018
14
Recent Developments Due to MXN/ USD FX volatility concerns, during January 2019, Sigma executed forward currency contracts to reduce potential impact from a short-term peso devaluation. The amount of these transactions was for US $330 million, covering Mexican operations dollars needs for the next four months.
In other news, on January 25, 2019, Sigma announced that Mario H. Páez, Sigma’s President, has decided to retire from the organization, effective July 31, 2019. Rodrigo Fernández, currently Sigma’s Chief Operating Officer, will be appointed Sigma’s President, starting August 1st.
Selected financial information Selected Financial Information (US $ million)
4Q18 3Q18 4Q17
Ch % vs. 3Q18
Ch % vs. 4Q17 YTD.’18 YTD.’17
YTD. Ch. %
Total Revenues 1,596 1,601 1,593 - 0 6,336 6,054 5 Europe 595 568 607 5 (2) 2,281 2,146 6 Mexico 656 668 636 (2) 3 2,607 2,496 4 USA 224 248 227 (10) (1) 976 966 1 Latam 122 117 123 4 (1) 473 446 6
Total EBITDA 174 180 195 (3) (11) 684 676 1 Europe 50 45 64 11 (22) 170 177 (4) Mexico 83 97 84 (14) (1) 353 322 10 USA 27 27 36 - (25) 118 140 (16) Latam 14 10 11 40 27 43 38 13
Capex 73 41 71 75 3 180 188 (4) Net Debt 1,859 1,932 1,936 (4) (4) 1,859 1,936 (4)
Net Debt / EBITDA 2.7 2.7 2.9 LTM Interest Coverage
5.3 5.3 4.7

ALFA´S FOURTH QUARTER 2018
15
SIGMA Table 1 | Volume and Price Changes (%)
4Q18 vs. YTD. ‘18 vs. YTD. ‘17 3Q18 4Q17
Total Volume (0.4) 0.5 2.1 Avg. Ps. Prices 4.6 4.5 4.5 Avg. US $ Prices 0.1 (0.2) 2.5
Table 2 | Revenues (%) 4Q18 vs. 4Q18 3Q18 4Q17 3Q18 4Q17 YTD. ‘18 YTD.'17 Chg.%
Total Revenues Ps. Millions 31,651 30,384 30,162 4 5 121,900 114,222 7 US $ Millions 1,596 1,601 1,593 - - 6,336 6,054 5
Domestic Revenues Ps. Millions 12,992 12,682 12,042 2 8 50,129 47,078 6 US $ Millions 655 668 636 (2) 3 2,607 2,496 4
Foreign Revenues Ps. Millions 18,658 17,701 18,120 5 3 71,771 67,144 7 US $ Millions 941 933 957 1 (2) 3,730 3,558 5 Foreign / Total (%) 59 58 60 59 59
Table 3 | Operating Income and EBITDA
(%) 4Q18 vs. 4Q18 3Q18 4Q17 3Q18 4Q17 YTD. ‘18 YTD.'17 Chg.%
Operating Income Ps. Millions 770 2,433 2,495 (68) (69) 7,438 8,591 (13) US $ Millions 40 128 132 (69) (69) 391 458 (15)
EBITDA Ps. Millions 3,448 3,412 3,699 1 (7) 13,154 12,725 3 US $ Millions 174 180 195 (3) (11) 684 676 1
Table 4 | Selected Balance Sheet Information & Financial Ratios (US $ millions) 4Q18 3Q18 4Q17 YTD.’18 YTD.’17 Assets 5,102 5,185 5,350 5,102 5,350 Liabilities 4,235 4,215 4,423 4,235 4,423 Stockholders’ Equity 867 970 927 867 927 Majority Equity 837 936 892 837 892 Net Debt 1,859 1,932 1,936 1,859 1,936 Net Debt/EBITDA* 2.7 2.7 2.9 2.7 2.9 Interest Coverage* 5.3 5.3 4.7 5.3 4.7
* Times: LTM = Last 12 months

ALFA´S FOURTH QUARTER 2018
16
SIGMA
Appendix A Sigma Alimentos, S.A. de C.V. and Subsidiaries BALANCE SHEET Information in millions of Nominal Mexican Pesos (%) Dec 18 vs. Dec 18 Sep 18 Dec 17 Sep 18 Dec 17 ASSETS CURRENT ASSETS: Cash and cash equivalents 12,213 10,603 12,807 15 (5) Restricted cash 88 51 132 75 (33) Customers, net 5,103 4,941 5,776 3 (12) Income tax recoverable 514 336 819 53 (37) Inventories 14,224 14,831 14,687 (4) (3) Other current assets 2,699 2,809 2,627 (4) 3 Total current assets 34,842 33,570 36,849 4 (5)
NON-CURRENT ASSTES: Property, plant and equipment, net 33,953 32,969 35,268 3 (4) Intangible assets, net 14,503 15,453 15,715 (6) (8) Goodwill 13,567 12,941 14,742 5 (8) Deferred income tax 2,262 2,238 2,792 1 (19) Investments in associates and joint ventures 104 103 93 1 11 Other non-current assets 1,190 263 127 353 840 Total non-current assets 65,578 63,966 68,737 3 (5) Total assets 100,420 97,536 105,586 3 (5) LIABILITIES AND STOCKHOLDER'S EQUITY CURRENT LIABILITIES: Current debt 5,503 652 2,381 744 131 Notes payables 96 82 70 17 37 Suppliers 20,255 18,248 20,867 11 (3) Income tax payable 1,680 1,889 1,784 (11) (6) Provisions 137 189 324 (27) (58) Other current liabilities 5,450 5,546 5,201 (2) 5 Total current liabilities 33,121 26,606 30,626 24 8
NON-CURRENT LIABILITIES: Non-current debt 42,708 45,688 48,033 (7) (11) Notes payables 252 250 310 1 (19) Deferred income taxes 3,704 3,474 4,068 7 (9) Employees benefits 1,395 1,404 1,339 (1) 4 Provisions 97 96 110 1 (12) Income tax payable 1,620 1,277 2,342 27 (31) Other non-current liabilities 461 500 468 (8) (2) Total non-current liabilities 50,237 52,688 56,670 (5) (11) Total liabilities 83,358 79,294 87,297 5 (5) STOCKHOLDERS' EQUITY: Total controlling interest 16,472 17,607 17,597 (6) (6) Total Non-controlling interest 590 635 692 (7) (15) Total stockholders' equity 17,062 18,242 18,289 (6) (7) Total liabilities and stockholders' equity 100,420 97,536 105,586 3 (5)

ALFA´S FOURTH QUARTER 2018
17
SIGMA
Appendix BSigma Alimentos, S.A. de C.V. and SubsidiariesSTATEMENT OF COMPREHENSIVE INCOMEInformation in millions of Nominal Mexican Pesos
(%) 4Q18 vs. 4Q18 3Q18 4Q17 YTD '18 YTD '17 3Q18 4Q17
Revenue 31,651 30,384 30,162 121,900 114,222 4 5
Cost of sales (22,865) (21,815) (21,941) (87,781) (82,748) 5 4
Gross profit
8,785 8,569 8,220 34,119 31,474 3 7
Selling expenses
(5,106) (4,974) (4,677) (19,989) (18,266) 3 9
Administrative expenses
(1,348) (1,314) (1,072) (5,393) (4,781) 3 26
Other income (expenses), net
(1,561) 153 23 (1,299) 164 (1,120) (6,842)
Operating profit
770 2,433 2,495 7,438 8,591 (68) (69)
Comprehensive financing expense, net
(424) (531) (1,057) (1,875) (4,389) (20) (60)
Equity in income (loss) of associates
(1) 17 (0) 15 16 (107) 223
Profit before income tax
344 1,918 1,437 5,578 4,218 (82) (76) Provisions for: Income tax (308) (1,293) 258 (2,719) (2,144) (76) (220)
Net consolidated profit
36 626 1,695 2,859 2,074 (94) (98)
Non-controlling interest
101 11 1,673 2,926 2,032 785 (94)
Controlling interest
(65) 614 22 (68) 42 (111) (395)

Fourth Quarter 2018 (4Q18) |
This release contains forward-looking information based on numerous variables and assumptions that are inherently uncertain. They involve judgments with respect to, among other things, future economic, competitive and financial market conditions and future business decisions, all of which are difficult or impossible to predict accurately. Accordingly, results could vary from those set forth in this release. The report presents unaudited financial information based on International Financial Reporting Standards (IFRS). Figures are stated in nominal Mexican pesos ($) and in current U.S. Dollars (U.S. $), as indicated. Where applicable, peso amounts were translated into U.S. Dollars using the average exchange rate of the months during which operations were recorded. Financial ratios are calculated in U.S. Dollars. Due to the rounding up of figures, small differences may occur when calculating percent changes from one period to the other.
Monterrey, Mexico. February 13, 2019 – Alpek, S.A.B. de C.V. (BMV: ALPEK)
Alpek reports 4Q18 EBITDA of U.S. $369 million
Selected Financial Information (U.S. $ Millions) (%) 4Q18 vs.
4Q18 3Q18 4Q17 3Q18 4Q17 2018 2017 Ch.% Total Volume (ktons) 1,061 1,174 975 (10) 9 4,402 4,012 10 Polyester 851 941 752 (10) 13 3,490 3,105 12 Plastics & Chemicals 210 233 224 (10) (6) 912 906 1 Consolidated Revenues 1,758 1,941 1,321 (9) 33 6,991 5,231 34 Polyester 1,295 1,450 933 (11) 39 5,174 3,724 39 Plastics & Chemicals 400 451 388 (11) 3 1,713 1,506 14 Consolidated EBITDA 369 274 141 35 163 1,063 384 177 Polyester 316 198 77 59 308 788 147 435 Plastics & Chemicals 52 76 64 (32) (19) 276 237 16 Profit Attributable to Controlling Interest 393 80 (30) 390 1,399 697 (319) 318 CAPEX and Acquisitions 262 37 30 616 777 826 236 250 Net Debt 1,832 1,603 1,262 14 45 Net Debt/LTM EBITDA(1) 1.7 1.9 3.3 Interest Coverage(1) 9.9 7.8 4.8
(1) Times: Last 12 months
Operating & Financial Highlights (4Q18)
Alpek
• 4Q18 EBITDA of U.S. $369 million, including a U.S. $220 million non-cash gain on business combination (Suape/Citepe) and a U.S. $28 million non-cash inventory loss, among others
• Reached final agreement with ContourGlobal to sell the Cosoleacaque and Altamira cogeneration power plants for U.S. $801 million
• 1.7 times Net Debt/LTM EBITDA; 2.2 times when adjusted by non-cash gain on business combination. Down from 3.3 times at the close of 2017
Polyester
• 4Q18 Polyester EBITDA of U.S. $316 million, including a U.S. $220 million non-cash gain on business combination (Suape/Citepe), a U.S. $22 million non-cash inventory loss, and U.S. $4 million net loss from other extraordinary items
• Alpek JV obtained regulatory clearance and acquired Corpus Christi project from M&G USA; implied recovery resulted in a U.S. $195 million non-cash gain in 4Q18 Operating Income
Plastics & Chemicals
(P&C)
• 4Q18 P&C EBITDA of U.S. $52 million, including a U.S. $5 million non-cash inventory loss
• P&C volume impacted by downtrend in oil and feedstock prices
• Domestic supply constraints for certain feedstocks weighed on profitability

Fourth Quarter 2018 (4Q18) |
[email protected] www.alpek.com 2
Message from the CEO
Alpek reached record volume, sales and EBITDA in 2018 despite a slowdown at the end of the year amid a steep decline in oil and feedstock prices. Adjusting for a U.S. $220 million non-cash gain on business combination (Suape/Citepe), consolidated EBITDA was U.S. $843 million and U.S. $149 million in 2018 and 4Q18, respectively. In contrast with previous quarters, Alpek’s 4Q18 results reflect temporary distortions on demand and margins caused by the sudden shift in oil and feedstock price trends, among others.
The average spot Brent crude oil price decreased for the first time in 4Q18 after 5 consecutive quarters of sequential increases, driving down petroleum-based feedstock prices. The U.S. reference paraxylene (“Px”) and propylene (“PGP”) contract prices decreased 21% and 30% from September to December, respectively. Lower feedstock prices resulted in a non-cash inventory loss of U.S. $28 million during the fourth quarter and a net, non-cash inventory gain of U.S. $41 million for the full year.
4Q18 Polyester segment EBITDA was U.S. $316 million, including a U.S. $220 million non-cash gain on business combination (Suape/Citepe) which was partially offset by a non-cash inventory loss of U.S. $22 million and a U.S. $4 million net loss from others. Adjusting for these three items, 4Q18 Comparable Polyester EBITDA was U.S. $122 million, up 85% when compared to 4Q17, driven mainly by the year-over-year recovery in global polyester margins plus the integration of Suape/Citepe. In contrast, the segment’s volume was lower and global reference polyester margins decreased quarter-on-quarter, resulting in a 24% Comparable Polyester EBITDA decline versus 3Q18.
Plastics & Chemicals EBITDA was U.S. $52 million in 4Q18. Adjusting for a U.S. $5 million non-cash inventory loss, Comparable P&C EBITDA was U.S. $57 million, down 3% and 22% when compared to 4Q17 and 3Q18, respectively. Polypropylene (“PP”) EBITDA growth versus 4Q17 was more than offset by incremental caprolactam (“CPL”) costs associated to domestic feedstock supply constraints. Quarter-on-quarter, all P&C products were impacted by the sudden drop in feedstock prices which typically causes temporary distortions on demand.
Alpek executed multiple strategic initiatives during the year. Capex totaled U.S. $826 million and U.S. $262 million in 2018 and 4Q18, respectively. The acquisitions of Suape/Citepe in Brazil and the Corpus Christi project in the United States, plus the construction of the Altamira cogeneration power plant in Mexico account for more than 90% of consolidated Capex.
During 4Q18, Corpus Christi Polymers LLC (“CC Polymers”), a JV between Alpek, Indorama and Far Eastern, obtained regulatory clearance from the Federal Trade Commission (“FTC”) and acquired the Corpus Christi project from M&G USA for an aggregate amount of U.S. $1.199 billion in cash and other capital contributions. The Corpus Christi Project assets include the integrated PTA-PET plant under construction in Corpus Christi, Texas, certain M&G intellectual property, and a desalination/boiler plant providing water and steam to the site.
Alpek’s contribution for the closing of the transaction was U.S. $266 million in cash and U.S. $133 million non-cash associated to a portion of the secured claim with M&G, arising under the original agreement. Alpek will also obtain U.S. $67 million in cash for the remainder of its secured claim, subject to certain conditions. This transaction implies a total recovery of U.S. $200 million from the original agreement with M&G, which was subject to a full asset impairment in 2017. As a result, 4Q18 Operating Income includes a non-cash gain of U.S. $195 million that corresponds to the present value of the total recovery.
Fourth Quarter 2018 (4Q18) |
[email protected] www.alpek.com 3
Also related to the M&G bankruptcy, the process among Alpek, M&G Mexico and other creditors to approve and implement a definitive restructuring plan advanced in 4Q18.
In addition, work is underway to start up the 350 MW Altamira cogeneration power plant. We recently moved from the construction phase into commissioning, in preparation for commercial operations in coming months. Simultaneously, Alpek continued to sign long-term power supply agreements with industrial customers amid a favorable Mexican power tariff environment.
Alpek also advanced in the process to sell its Cosoleacaque and Altamira cogeneration power plants, reaching a final agreement with ContourGlobal for an aggregate amount of U.S. $801 million. Pursuant to the agreement, Alpek will maintain a reliable and competitive supply of steam and power for its Mexican facilities through long-term contracts. Moreover, the sale implies realizing an attractive return and will strengthen Alpek’s balance sheet and credit metrics even further. Closing of this transaction is expected before the end of the second quarter.
Alpek’s financial position improved consistently during 2018, even after the Suape/Citepe and Corpus Christi acquisitions. At the close of 2018, Net Debt totaled U.S. $1.832 billion and the leverage ratio (Net Debt to LTM EBITDA) was 1.7 times; down from 3.3 times at the close of 2017, driven by better than expected results. Adjusting for the U.S. $220 million non-cash gain on business combination (Suape/Citepe), the leverage ratio at the close of 2018 was 2.2 times.
Despite the slowdown at the end of the year, 2018 results reflect a favorable oil price environment, the global polyester margin recovery which was amplified by a mid-year spike in Asia, and the successful integration of the Suape/Citepe acquisition, among other non-recurring, Alpek-specific drivers in the P&C segment.
Our outlook for 2019 is based on a lower average Brent oil price year-over-year and lower margins for certain products that benefitted from non-recurring events in 2018. Yet, we maintain positive view for underlying industry margins in the majority of our products, supported by a stable supply/demand balance outlook. 2019 Guidance will be disclosed tomorrow, prior to our 4Q18 Conference Call.

Fourth Quarter 2018 (4Q18) |
[email protected] www.alpek.com 4
Results by Business Segment Polyester (Purified Terephthalic Acid (PTA), Polyethylene Terephthalate (PET), Polyester fibers – 74% of Alpek’s Net Sales)
Fourth quarter 2018 Polyester revenues were up 39% year-on-year driven by higher volume and average prices. In contrast, 4Q18 revenues were 11% lower quarter-on-quarter due mainly to lower volume amid a sequential decline in feedstock prices (e.g. paraxylene and MEG). Average 4Q18 Polyester prices were up 23% when compared to 4Q17 and 1% lower versus 3Q18, reflecting feedstock price volatility at the end of 2018.
Polyester volume was 851 Ktons in 4Q18, including 145 Ktons from Suape/Citepe. Adjusting for the volume
from the acquired entities in Brazil, Polyester was down 6% and 8% when compared to 4Q17 and 3Q18, respectively, as the sudden drop in oil and feedstock prices weighed on demand. For the full year, Polyester volume was 12% higher than the same period in 2017; down 1% when adjusted for Suape/Citepe.
4Q18 segment EBITDA was U.S. $316 million, including a U.S. $220 million non-cash gain on business combination (Suape/Citepe) which was partially offset by a non-cash inventory loss of U.S. $22 million and a U.S. $4 million net loss from others such as non-recurring legal fees/expenses. Adjusting for these three items, 4Q18 Comparable Polyester EBITDA was U.S. $122 million, up 85% when compared to 4Q17, driven mainly by the year-over-year recovery in global polyester margins and the integration of Suape/Citepe. In contrast, global reference polyester margins decreased quarter-on-quarter, and a combination of seasonality plus the sudden drop in oil and feedstock prices weighed on demand in 4Q18, resulting in a 24% Comparable Polyester EBITDA decline versus 3Q18. 2018 Comparable Polyester EBITDA was U.S. $529 million, up 126% versus 2017 despite the end-of-year slowdown. Plastics & Chemicals (P&C) (Polypropylene (PP), Expandable Polystyrene (EPS), Caprolactam (CPL), Other products – 25% of Alpek’s Net Sales)
4Q18 P&C revenues increased 3% year-on-year and decreased 11% quarter-on-quarter as a result of lower volume and mixed average prices. Average fourth quarter 2018 P&C prices were up 10% compared to 4Q17 and down 2% versus 3Q18, due to oil price volatility at the end of 2018.
Fourth quarter 2018 P&C volume was down 6% and 10% when compared to 4Q17 and 3Q18, respectively.
Segment volume was impacted by the sudden drop in feedstock prices which typically cause temporary distortions on demand. For the full year, P&C volume was up 1% as the decrease in certain products was more than offset by EPS volume growth following the capacity expansion in Mexico that was completed in 3Q17.
Segment EBITDA was U.S. $52 million in 4Q18, including a U.S. $5 million non-cash inventory loss. Adjusting
for the inventory loss, Comparable 4Q18 P&C EBITDA was down 3% and 22% versus 4Q17 and 3Q18, respectively. Year-on-year, incremental caprolactam costs associated to domestic feedstock supply constraints more than offset PP EBITDA growth. When compared to 3Q18, all P&C products posted lower EBITDA amid a downtrend in oil and feedstock prices that affected volume. 2018 Comparable P&C EBITDA was U.S. $275 million, up 20% versus 2017 driven by PP and EPS.

Fourth Quarter 2018 (4Q18) |
[email protected] www.alpek.com 5
Consolidated Financial Results
Net Sales: Net Sales for the fourth quarter totaled U.S. $1.758 billion, including U.S. $188 million from Suape/Citepe. Adjusting for the acquired entities in Brazil, 4Q18 Consolidated Net Sales were up 19% year-on-year and down 9% when compared to 3Q18 as a result of lower volume and mixed average prices due to oil price volatility at the end of 2018. Accumulated Net Sales as of December 31, 2018 totaled U.S. $6.991 billion, including U.S. $494 million from Suape/Citepe. 2018 Net Sales were 34% higher when compared with 2017, and increased 24% when adjusted for the acquired entities in Brazil.
EBITDA: 4Q18 EBITDA was U.S. $369 million, including a net gain of U.S. $188 million from the following three non-operating items: i) a U.S. $220 million non-cash gain on business combination (Suape/Citepe), ii) a U.S. $28 million non-cash inventory loss and iii) a U.S. $4 million net loss from others such as non-recurring legal fees/expenses. Adjusting for these items, Comparable Consolidated EBITDA was U.S. $181 million, U.S. $234 million and U.S. $124 million in 4Q18, 3Q18 and 4Q17. Accumulated EBITDA as of December 31, 2018 was U.S. $1.063 billion, including a net gain of U.S. $259 million from the following three non-operating items: i) a U.S. $220 million non-cash gain on business combination, ii) a U.S. $41 million non-cash inventory gain, and iii) a U.S. $2 million net loss from others. Adjusting for these items, 2018 Comparable Consolidated EBITDA was U.S. $804 million, up 74% versus 2017.
Profit (Loss) Attributable to Controlling Interest: Profit Attributable to Controlling Interest for the fourth quarter of 2018 was U.S. $393 million, including the U.S. $220 million non-cash gain on business combination plus a net benefit of U.S. $136 million associated to the recovery of Alpek’s secured claim under the original Corpus Christi agreement with M&G. The net Corpus Christi recovery benefit is comprised of a U.S. $195 million non-cash gain in Operating Income resulting from the partial reversal of the asset impairment that was recognized in 2017, less U.S. $59 million in deferred income tax. 2018 Profit Attributable to Controlling Interest was U.S. $697 million, including a net benefit of U.S. $356 million from the gain on business combination and the Corpus Christi recovery. In contrast, 2017 Loss Attributable to Controlling Interest was U.S. -$319 million, including a net loss of U.S. -$481 million related to M&G provisions and impairments.
Capital Expenditures and Acquisitions (Capex): 4Q18 Capex was U.S. $262 million, compared to U.S. $30 million and U.S. $ 37 million in 4Q17 and 3Q18, respectively. The majority of these funds were invested in the acquisition of the Corpus Christi project from M&G. Accumulated Capex as of December 31, 2018 totaled U.S. $826 million, which includes the acquisitions of Suape/Citepe in Brazil (U.S. $435 million) and the Corpus Christi project in the United States (U.S. $266 million), plus the construction of the Altamira cogeneration power plant in Mexico.
Net Debt: Consolidated Net Debt as of December 31, 2018 was U.S. $1.832 billion, up 45% and 14% year-on-year and quarter-on-quarter, respectively. On an absolute basis, Net Debt increased U.S. $569 million during 2018 as the year’s CAPEX investment of U.S. $826 million was partially offset by better-than-expected EBITDA. As of December 31, 2018, Gross Debt was U.S. $2.043 billion and Cash totaled U.S. $212 million. Financial ratios at the close of 4Q18

Fourth Quarter 2018 (4Q18) |
[email protected] www.alpek.com 6
were: Net Debt to EBITDA of 1.7 times and Interest Coverage of 9.9 times. Adjusted by the non-cash gain from the Suape/Citepe acquisition, Net Debt to EBITDA was 2.2 times and Interest Coverage of 7.8 times.
Appendix A - Tables TABLE 1 | VOLUME (KTONS) (%) 4Q18 vs.
4Q18 3Q18 4Q17 3Q18 4Q17 2018 2017 Ch.%
Total Volume 1,061 1,174 975 (10) 9 4,402 4,012 10 Polyester 851 941 752 (10) 13 3,490 3,105 12 Plastics and Chemicals 210 233 224 (10) (6) 912 906 1
TABLE 2 | PRICE CHANGES (%) (%) 4Q18 vs. 2018 vs. 3Q18 4Q17 2017
Polyester Avg. Ps. Prices 3 28 26 Avg. U.S. $ Prices (1) 23 24 Plastics and Chemicals Avg. Ps. Prices 2 15 15 Avg. U.S. $ Prices (2) 10 13 Total Avg. Ps. Prices 5 28 24 Avg. U.S. $ Prices - 22 22
TABLE 3 | INCOME STATEMENT (U.S. $ Millions) (%) 4Q18 vs.
4Q18 3Q18 4Q17 3Q18 4Q17 2018 2017 Ch.%
Total Revenues 1,758 1,941 1,321 (9) 33 6,991 5,231 34 Gross Profit 181 288 162 (37) 12 938 544 72 Operating expenses and others 327 (56) (52) 684 728 148 (732) 120 Operating income 508 232 110 119 362 1,086 (188) 676
Financial cost, net (45) (81) (68) 45 35 (141) (188) 25 Share of losses of associates (1) - - (100) (100) (2) - (690) Income Tax (60) (50) (62) (20) 3 (178) 106 (269) Consolidated net income 402 101 (20) 299 2,107 765 (271) 383
Controlling Interest 393 80 (30) 390 1,399 697 (319) 318

Fourth Quarter 2018 (4Q18) |
[email protected] www.alpek.com 7
TABLE 4 | REVENUES (%) 4Q18 vs.
4Q18 3Q18 4Q17 3Q18 4Q17 2018 2017 Ch.%
Total Revenues Ps. Millions 34,802 36,833 25,010 (6) 39 134,523 98,998 36 U.S. $ Millions 1,758 1,941 1,321 (9) 33 6,991 5,231 34 Domestic Revenues Ps. Millions 10,195 10,609 8,166 (4) 25 40,289 34,957 15 U.S. $ Millions 516 559 431 (8) 20 2,095 1,846 14 Foreign Revenues Ps. Millions 24,607 26,224 16,844 (6) 46 94,234 64,042 47 U.S. $ Millions 1,243 1,382 890 (10) 40 4,895 3,385 45 Foreign / Total (%) 71 71 67 70 65
TABLE 5 | OPERATING INCOME AND EBITDA
(%) 4Q18 vs.
4Q18 3Q18 4Q17 3Q18 4Q17 2018 2017 Ch.%
Operating Income Ps. Millions 10,167 4,407 2,084 131 388 21,202 (2,854) 843 U.S. $ Millions 508 232 110 119 362 1,086 (188) 676 EBITDA Ps. Millions 7,355 5,200 2,660 41 177 20,607 7,483 175 U.S. $ Millions 369 274 141 35 163 1,063 384 177
TABLE 6 | COMPARABLE EBITDA (%) 4Q18 vs.
4Q18 3Q18 4Q17 3Q18 4Q17 2018 2017 Ch.%
EBITDA Ps. Millions 7,355 5,200 2,660 41 177 20,607 7,483 175 U.S. $ Millions 369 274 141 35 163 1,063 384 177 Adjustments* Ps. Millions (3,938) (762) (309) (417) (1,173) (5,310) 1,322 (502) U.S. $ Millions (188) (40) (16) (368) (1,047) (259) 79 (430) Comparable EBITDA Ps. Millions 3,417 4,437 2,350 (23) 45 15,297 8,806 74 U.S. $ Millions 181 234 124 (22) 46 804 462 74
*Adjustments: Inventory and non-operating, one-time (gains) losses
Fourth Quarter 2018 (4Q18) |
[email protected] www.alpek.com 8
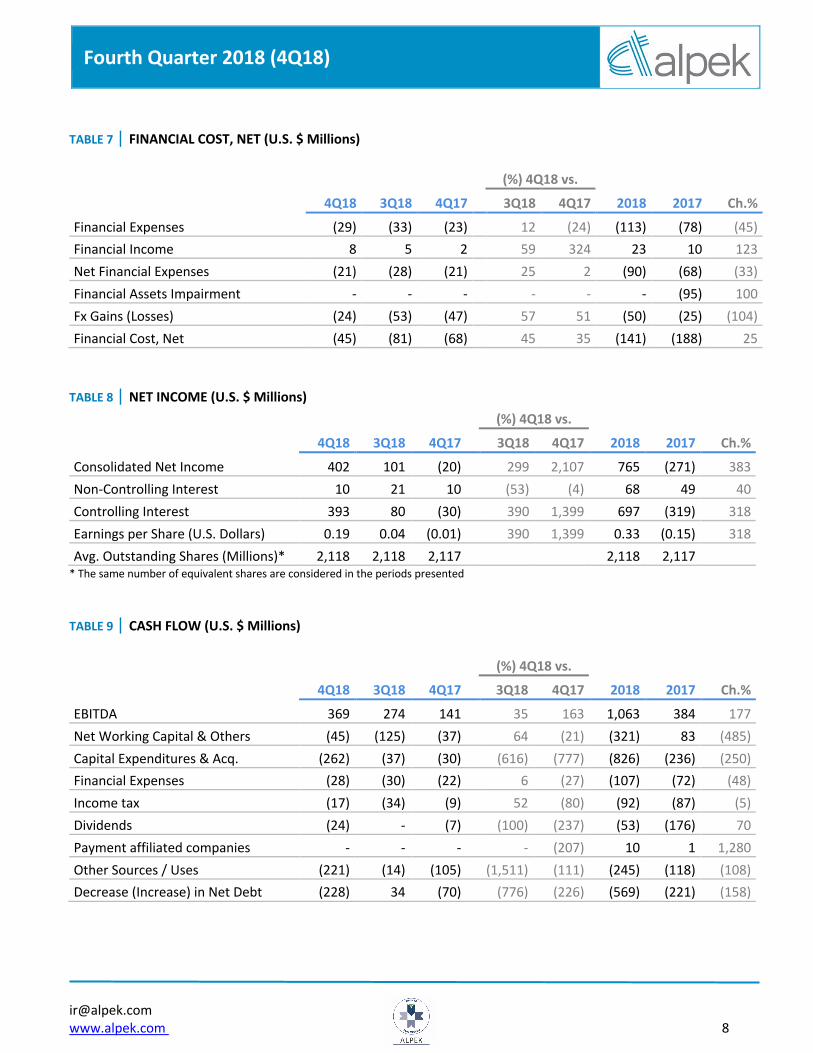
TABLE 7 | FINANCIAL COST, NET (U.S. $ Millions)
(%) 4Q18 vs.
4Q18 3Q18 4Q17 3Q18 4Q17 2018 2017 Ch.%
Financial Expenses (29) (33) (23) 12 (24) (113) (78) (45) Financial Income 8 5 2 59 324 23 10 123 Net Financial Expenses (21) (28) (21) 25 2 (90) (68) (33) Financial Assets Impairment - - - - - - (95) 100 Fx Gains (Losses) (24) (53) (47) 57 51 (50) (25) (104) Financial Cost, Net (45) (81) (68) 45 35 (141) (188) 25
TABLE 8 | NET INCOME (U.S. $ Millions) (%) 4Q18 vs.
4Q18 3Q18 4Q17 3Q18 4Q17 2018 2017 Ch.%
Consolidated Net Income 402 101 (20) 299 2,107 765 (271) 383 Non-Controlling Interest 10 21 10 (53) (4) 68 49 40 Controlling Interest 393 80 (30) 390 1,399 697 (319) 318 Earnings per Share (U.S. Dollars) 0.19 0.04 (0.01) 390 1,399 0.33 (0.15) 318 Avg. Outstanding Shares (Millions)* 2,118 2,118 2,117 2,118 2,117
* The same number of equivalent shares are considered in the periods presented TABLE 9 | CASH FLOW (U.S. $ Millions) (%) 4Q18 vs.
4Q18 3Q18 4Q17 3Q18 4Q17 2018 2017 Ch.%
EBITDA 369 274 141 35 163 1,063 384 177 Net Working Capital & Others (45) (125) (37) 64 (21) (321) 83 (485) Capital Expenditures & Acq. (262) (37) (30) (616) (777) (826) (236) (250) Financial Expenses (28) (30) (22) 6 (27) (107) (72) (48) Income tax (17) (34) (9) 52 (80) (92) (87) (5) Dividends (24) - (7) (100) (237) (53) (176) 70 Payment affiliated companies - - - - (207) 10 1 1,280 Other Sources / Uses (221) (14) (105) (1,511) (111) (245) (118) (108) Decrease (Increase) in Net Debt (228) 34 (70) (776) (226) (569) (221) (158)

Fourth Quarter 2018 (4Q18) |
[email protected] www.alpek.com 9
TABLE 10 | STATEMENT OF FINANCIAL POSITION & FINANCIAL RATIOS (U.S. $ Millions) (%) 4Q18 vs.
4Q18 3Q18 4Q17 3Q18 4Q17
Assets
Cash and cash equivalents 212 229 484 (7) (56) Trade accounts receivable 792 942 544 (16) 45 Inventories 1,245 1,042 829 20 50 Other current assets 348 271 280 29 24 Total current assets 2,597 2,483 2,138 5 21 Investment in associates and others 447 97 33 360 1,257 Property, plant and equipment, net 2,390 2,453 2,105 (3) 14 Goodwill and intangible assets, net 222 208 206 6 8 Other non-current assets 436 488 270 (11) 61 Total assets 6,091 5,730 4,752 6 28 Liabilities & stockholders' equity
Debt 514 280 375 84 37 Suppliers 1,134 1,094 874 4 30 Other current liabilities 311 285 170 9 83 Total current liabilities 1,960 1,659 1,420 18 38 Debt (include debt issuance cost) 1,525 1,547 1,366 (1) 12 Employees´ benefits 56 54 54 4 4 Other long term liabilities 358 631 308 (43) 16 Total liabilities 3,898 3,891 3,147 - 24
Total stockholders' equity 2,193 1,839 1,604 19 37 Total liabilities & stockholders' equity 6,091 5,730 4,752 6 28 Net Debt 1,832 1,603 1,262 14 45 Net Debt/EBITDA* 1.7 1.9 3.3 Interest Coverage* 9.9 7.8 4.8
* Times: last 12 months

Fourth Quarter 2018 (4Q18) |
[email protected] www.alpek.com 10
Polyester TABLE 11 | REVENUES (%) 4Q18 vs.
4Q18 3Q18 4Q17 3Q18 4Q17 2018 2017 Ch.%
Total Revenues Ps. Millions 25,623 27,510 17,668 (7) 45 99,559 70,477 41 U.S. $ Millions 1,295 1,450 933 (11) 39 5,174 3,724 39 Domestic Revenues Ps. Millions 4,973 5,275 3,679 (6) 35 19,510 17,446 12 U.S. $ Millions 252 278 194 (9) 29 1,015 921 10 Foreign Revenues Ps. Millions 20,650 22,235 13,989 (7) 48 80,049 53,031 51 U.S. $ Millions 1,043 1,172 739 (11) 41 4,159 2,804 48 Foreign / Total (%) 81 81 79 80 75
TABLE 12 | OPERATING INCOME AND EBITDA
(%) 4Q18 vs.
4Q18 3Q18 4Q17 3Q18 4Q17 2018 2017 Ch.%
Operating Income Ps. Millions 9,248 3,117 1,022 197 805 16,470 (6,815) 342 U.S. $ Millions 461 164 54 181 757 839 (396) 312 EBITDA Ps. Millions 6,300 3,768 1,467 67 329 15,318 2,970 416 U.S. $ Millions 316 198 77 59 308 788 147 435
TABLE 13 | COMPARABLE EBITDA (%) 4Q18 vs.
4Q18 3Q18 4Q17 3Q18 4Q17 2018 2017 Ch.%
EBITDA Ps. Millions 6,300 3,768 1,467 67 329 15,318 2,970 416 U.S. $ Millions 316 198 77 59 308 788 147 435 Adjustments* Ps. Millions (4,048) (706) (215) (474) (1,782) (5,289) 1,489 (455) U.S. $ Millions (193) (37) (11) (419) (1,602) (258) 87 (398) Comparable EBITDA Ps. Millions 2,252 3,062 1,252 (26) 80 10,029 4,458 125 U.S. $ Millions 122 161 66 (24) 85 529 234 126
*Adjustments: Inventory and non-operating, one-time (gains) losses

Fourth Quarter 2018 (4Q18) |
[email protected] www.alpek.com 11
Plastics & Chemicals TABLE 14 | REVENUES (%) 4Q18 vs. 4Q18 3Q18 4Q17 3Q18 4Q17 2018 2017 Ch.%
Total Revenues Ps. Millions 7,910 8,559 7,342 (8) 8 32,925 28,522 15 U.S. $ Millions 400 451 388 (11) 3 1,713 1,506 14 Domestic Revenues Ps. Millions 4,831 5,253 4,487 (8) 8 20,307 17,511 16 U.S. $ Millions 244 277 237 (12) 3 1,057 925 14 Foreign Revenues Ps. Millions 3,079 3,307 2,855 (7) 8 12,618 11,011 15 U.S. $ Millions 156 174 151 (11) 3 656 581 13 Foreign / Total (%) 39 39 39 38 39
TABLE 15 | OPERATING INCOME AND EBITDA
(%) 4Q18 vs.
4Q18 3Q18 4Q17 3Q18 4Q17 2018 2017 Ch.%
Operating Income Ps. Millions 881 1,306 1,071 (33) (18) 4,735 3,966 19 U.S. $ Millions 45 69 57 (35) (21) 247 208 19 EBITDA Ps. Millions 1,017 1,448 1,203 (30) (15) 5,292 4,519 17 U.S. $ Millions 52 76 64 (32) (19) 276 237 16
TABLE 16 | COMPARABLE EBITDA (%) 4Q18 vs.
4Q18 3Q18 4Q17 3Q18 4Q17 2018 2017 Ch.%
EBITDA Ps. Millions 1,017 1,448 1,203 (30) (15) 5,292 4,519 17 U.S. $ Millions 52 76 64 (32) (19) 276 237 16 Adjustments* Ps. Millions 110 (57) (94) 294 216 (21) (167) 87 U.S. $ Millions 5 (3) (5) 284 208 (1) (8) 87 Comparable EBITDA Ps. Millions 1,127 1,391 1,108 (19) 2 5,271 4,352 21 U.S. $ Millions 57 73 59 (22) (3) 275 229 20
*Adjustments: Inventory and non-operating, one-time (gains) losses

Fourth Quarter 2018 (4Q18) |
[email protected] www.alpek.com 12
Appendix B – Financial Statements
Dec-18 Sep-18 Dec-17 Sep-18 Dec-17ASSETS
CURRENT ASSETS:Cash and cash equivalents 4,168 4,299 8,795 (3) (53) Restricted cash 3 3 763 5 (100) Trade accounts receivable 15,579 17,713 10,739 (12) 45 Other accounts and notes receivable 5,643 3,232 4,152 75 36 Inventories 24,511 19,602 16,364 25 50 Other current assets 1,211 1,860 1,379 (35) (12)
Total current assets 51,115 46,709 42,192 9 21
Investment in associates and others 8,794 1,828 650 381 1,253 Property, plant and equipment, net 47,033 46,150 41,535 2 13 Goodwill and intangible assets,net 4,368 3,922 4,065 11 7 Other non-current assets 8,587 9,183 5,336 (6) 61
Total assets 119,897 107,792 93,778 11 28
LIABILITIES AND STOCKHOLDER'S EQUITYCURRENT LIABILITIES:Debt 10,118 5,263 7,408 92 37 Suppliers 22,330 20,574 17,255 9 29 Other current liabilities 6,128 5,366 3,356 14 83
Total current liabilities 38,576 31,203 28,019 24 38
NON-CURRENT LIABILITIES:Debt (include debt issuance cost) 30,012 29,106 26,958 3 11 Deferred income taxes 4,752 4,382 4,403 8 8 Other non-current liabilities 2,295 7,486 1,673 (69) 37 Employees´ benefits 1,099 1,012 1,061 9 4
Total liabilities 76,734 73,189 62,114 5 24
STOCKHOLDERS´ EQUITY:Controlling interest:Capital stock 6,052 6,052 6,048 - 0 Share premium 9,106 9,071 9,071 - -
Contributed capital 15,158 15,123 15,119 - 0 Earned surplus 22,969 14,391 11,797 60 95
Total controlling interest 38,127 29,514 26,916 29 42 Non-controlling interest 5,036 5,089 4,748 (1) 6
Total stockholders´equity 43,163 34,603 31,664 25 36
Total liabilities and stockholders´ equity 119,897 107,792 93,778 11 28
(%) Dec 18 vs.
STATEMENT OF FINANCIAL POSITIONInformation in Millions of Mexican Pesos
ALPEK, S.A.B DE C.V. and Subsidiaries

Fourth Quarter 2018 (4Q18) |
[email protected] www.alpek.com 13
ALPEK, S.A.B DE C.V. and Subsidiaries
Information in Millions of Mexican Pesos
2018 vs. (%)4Q18 3Q18 4Q17 3Q18 4Q17 2018 2017 2017
Revenues 34,802 36,833 25,010 (6) 39 134,523 98,998 36 Domestic 10,195 10,609 8,166 (4) 25 40,289 34,957 15 Export 24,607 26,224 16,844 (6) 46 94,234 64,041 47
Cost of sales (31,245) (31,365) (21,941) 0 (42) (116,519) (88,598) (32)
Gross profit 3,557 5,468 3,069 (35) 16 18,004 10,400 73
Operating expenses and others 6,610 (1,061) (985) 723 771 3,198 (13,254) 124
Operating income 10,167 4,407 2,084 131 388 21,202 (2,854) 843
Financial result, net (935) (1,548) (1,296) 37 28 (2,783) (3,410) 18
Equity in income of associates and joint ventures (23) 2 - (1,255) (100) (30) (4) (692)
Income before taxes 9,209 2,861 788 222 1,069 18,389 (6,268) 393
Income taxes (1,200) (950) (1,173) (26) (2) (3,455) 1,713 (302)
Consolidated net income 8,009 1,911 (385) 319 2,180 14,934 (4,555) 428
Profit attributable to Controlling interest 7,815 1,516 (577) 416 1,455 13,633 (5,487) 348
Profit attributable to Non-controlling interest 194 395 192 (51) 1 1,301 932 40
STATEMENT OF INCOME
4Q18 vs.(%)
}
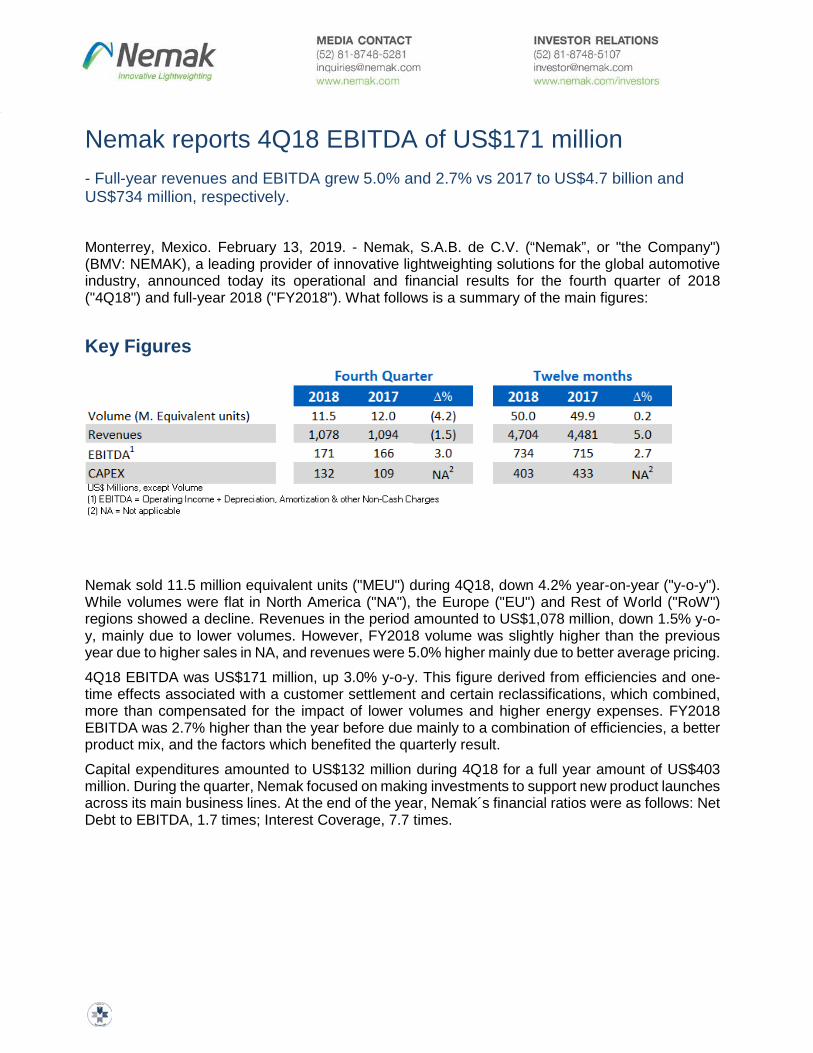
Nemak reports 4Q18 EBITDA of US$171 million
- Full-year revenues and EBITDA grew 5.0% and 2.7% vs 2017 to US$4.7 billion and US$734 million, respectively.
Monterrey, Mexico. February 13, 2019. - Nemak, S.A.B. de C.V. (“Nemak”, or "the Company") (BMV: NEMAK), a leading provider of innovative lightweighting solutions for the global automotive industry, announced today its operational and financial results for the fourth quarter of 2018 ("4Q18") and full-year 2018 ("FY2018"). What follows is a summary of the main figures: Key Figures
Nemak sold 11.5 million equivalent units ("MEU") during 4Q18, down 4.2% year-on-year ("y-o-y"). While volumes were flat in North America ("NA"), the Europe ("EU") and Rest of World ("RoW") regions showed a decline. Revenues in the period amounted to US$1,078 million, down 1.5% y-o-y, mainly due to lower volumes. However, FY2018 volume was slightly higher than the previous year due to higher sales in NA, and revenues were 5.0% higher mainly due to better average pricing.
4Q18 EBITDA was US$171 million, up 3.0% y-o-y. This figure derived from efficiencies and one-time effects associated with a customer settlement and certain reclassifications, which combined, more than compensated for the impact of lower volumes and higher energy expenses. FY2018 EBITDA was 2.7% higher than the year before due mainly to a combination of efficiencies, a better product mix, and the factors which benefited the quarterly result.
Capital expenditures amounted to US$132 million during 4Q18 for a full year amount of US$403 million. During the quarter, Nemak focused on making investments to support new product launches across its main business lines. At the end of the year, Nemak´s financial ratios were as follows: Net Debt to EBITDA, 1.7 times; Interest Coverage, 7.7 times.
February 13, 2019 2
Message from the CEO In 2018 we performed better than the previous year, successfully leveraging operational efficiencies and a better product mix to deliver EBITDA growth of three percent. Europe accounted for most of the difference, aided by the ramp-up of new business in propulsion as well as vehicle structures applications. We saw similar trends in the quarter in terms of regional results, with North America remaining stable and Europe more than compensating for the impact of production reductions among certain customers in Asia.
I am also pleased to share that, during this quarter, we broke new ground in our structural and electric vehicle components (SC/EV) business, winning new contracts to supply complex assembled battery housings and body-in-white components as well as highly integrated e-motor housings. For the full year, we won contracts to produce SC/EV worth US$280 million, bringing the total value of our contracts won to-date in the segment to approximately US$600 million annually.
In 2019, we believe that evolving industry and macroeconomic conditions may continue to generate volatility in our main markets. We will remain focused on optimizing costs and capital expenditures, while at the same strengthening our leadership position in our industry in the medium-to-long term, tapping into accelerating market demand for higher value-added applications and supporting our customers’ shift into lightweighting and electrification.
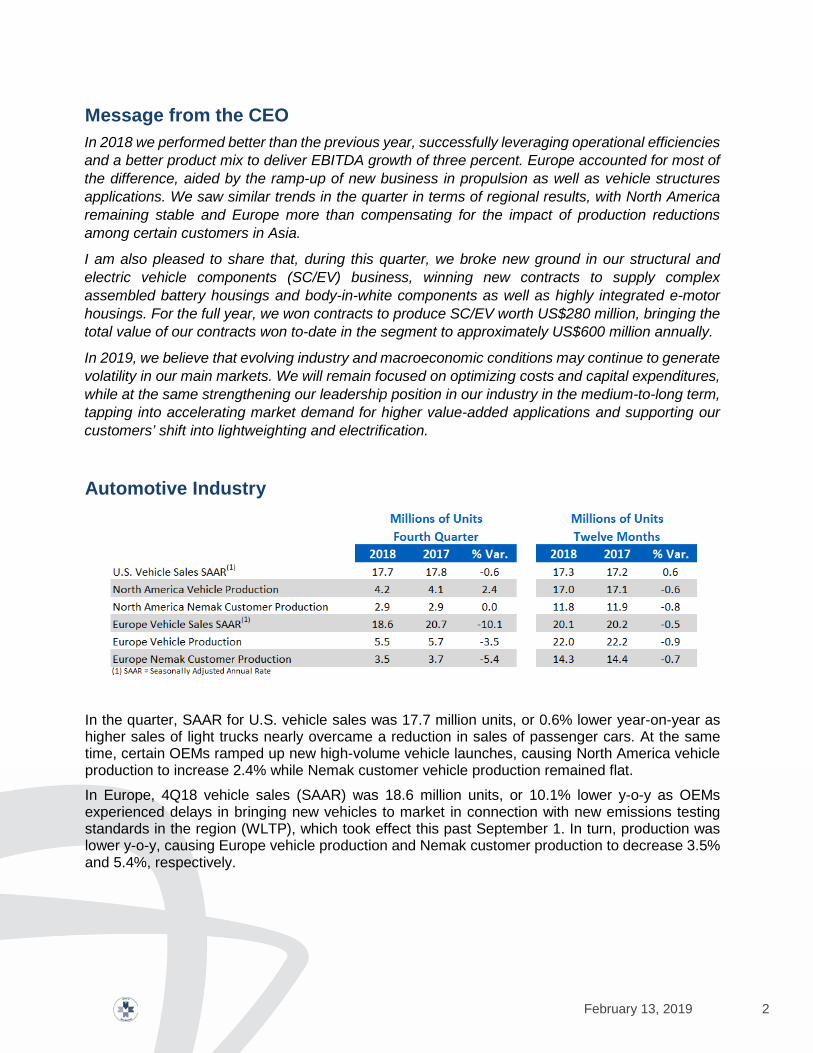
Automotive Industry
In the quarter, SAAR for U.S. vehicle sales was 17.7 million units, or 0.6% lower year-on-year as higher sales of light trucks nearly overcame a reduction in sales of passenger cars. At the same time, certain OEMs ramped up new high-volume vehicle launches, causing North America vehicle production to increase 2.4% while Nemak customer vehicle production remained flat.
In Europe, 4Q18 vehicle sales (SAAR) was 18.6 million units, or 10.1% lower y-o-y as OEMs experienced delays in bringing new vehicles to market in connection with new emissions testing standards in the region (WLTP), which took effect this past September 1. In turn, production was lower y-o-y, causing Europe vehicle production and Nemak customer production to decrease 3.5% and 5.4%, respectively.
February 13, 2019 3
Recent Developments • During 2018, Nemak won contracts in SC/EV worth a total of US$280 million in annual
revenues. This consisted primarily of new business to supply e-mobility applications of European and North American OEMs.
• For the full year, won contracts across its product lines worth a total of US$770 million in annual revenues, approximately half of which represented incremental business.
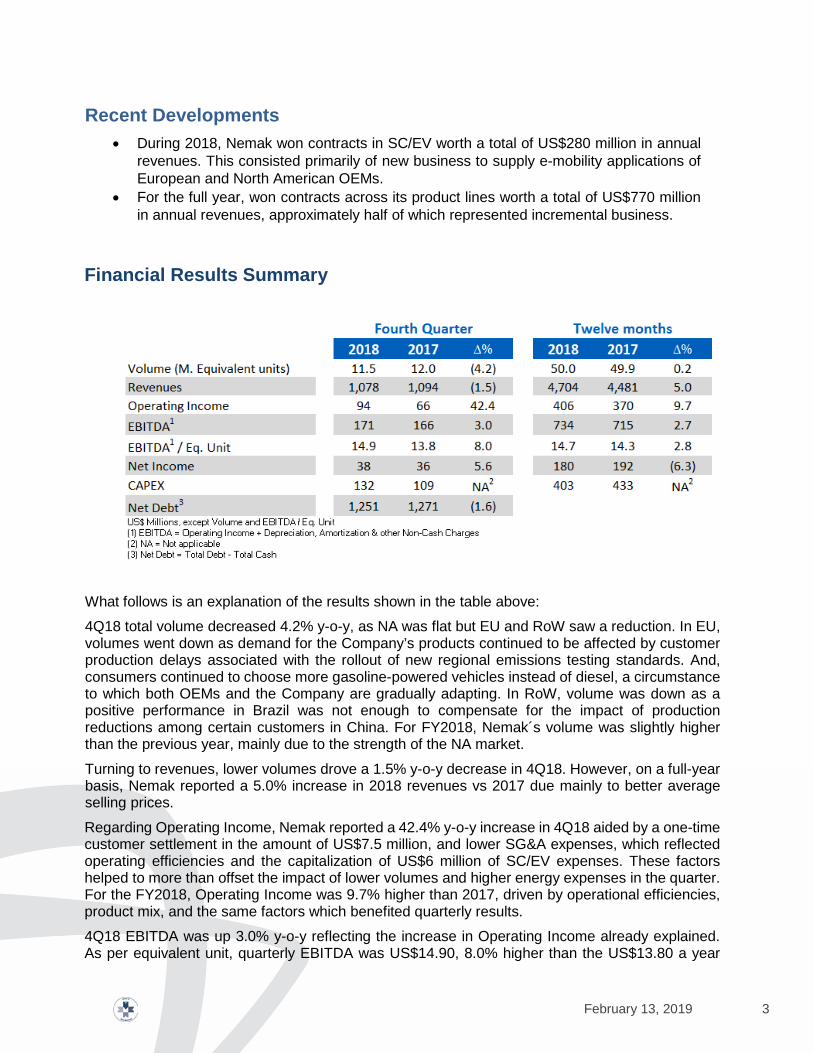
Financial Results Summary
What follows is an explanation of the results shown in the table above:
4Q18 total volume decreased 4.2% y-o-y, as NA was flat but EU and RoW saw a reduction. In EU, volumes went down as demand for the Company’s products continued to be affected by customer production delays associated with the rollout of new regional emissions testing standards. And, consumers continued to choose more gasoline-powered vehicles instead of diesel, a circumstance to which both OEMs and the Company are gradually adapting. In RoW, volume was down as a positive performance in Brazil was not enough to compensate for the impact of production reductions among certain customers in China. For FY2018, Nemak´s volume was slightly higher than the previous year, mainly due to the strength of the NA market.
Turning to revenues, lower volumes drove a 1.5% y-o-y decrease in 4Q18. However, on a full-year basis, Nemak reported a 5.0% increase in 2018 revenues vs 2017 due mainly to better average selling prices.
Regarding Operating Income, Nemak reported a 42.4% y-o-y increase in 4Q18 aided by a one-time customer settlement in the amount of US$7.5 million, and lower SG&A expenses, which reflected operating efficiencies and the capitalization of US$6 million of SC/EV expenses. These factors helped to more than offset the impact of lower volumes and higher energy expenses in the quarter. For the FY2018, Operating Income was 9.7% higher than 2017, driven by operational efficiencies, product mix, and the same factors which benefited quarterly results.
4Q18 EBITDA was up 3.0% y-o-y reflecting the increase in Operating Income already explained. As per equivalent unit, quarterly EBITDA was US$14.90, 8.0% higher than the US$13.80 a year

February 13, 2019 4
ago. For the year as a whole, EBITDA was 2.7% higher than 2017 for the same reason. EBITDA per equivalent unit was US$14.70 in 2018, 2.8% higher than the US$14.30 reported in 2017.
Nemak´s 4Q18 Net Income was US$38 million, up 5.6% y-o-y due to the combined effect of higher operating income and less foreign exchange losses, which more than compensated for higher income taxes. FY2018 Net Income was US$180 million, 6.3% lower than 2017. While FY2018 operating income was higher than 2017, Nemak reported a higher amount of net financial expenses and income taxes.
Capital expenditures amounted to US$132 million during 4Q18, for a total of US$403 million in 2018. Investments were directed towards supporting new product launches in all regions.
As of December 31, 2018, Nemak reported Net Debt in the amount of US$1.25 billion. Financial ratios were: Debt, net of Cash, to EBITDA, 1.7 times; and Interest Coverage, 7.7 times. These ratios compared to 1.9 and 10.1 times, respectively, in 2017.
Regional Results North America
In 4Q18, revenues increased 0.7% y-o-y as volumes were flat and pricing improved marginally. EBITDA was flat y-o-y helped by the above-mentioned capitalization which compensated for the impact of higher energy costs. FY2018 revenues and EBITDA were 6.1% and 1.6% higher than 2017 for the same reasons.
Europe 4Q18 revenues decreased 2.8% y-o-y as lower volumes outweighed higher average selling prices. In contrast, 4Q18 EBITDA was 19.4% higher, aided by a richer product mix combined with the US$7.5 million one-time income already explained. FY2018 revenues and EBITDA were 5.1% and 12.0% higher than 2017 due mainly to efficiencies, product mix, and the above mentioned one-time income.
Rest of the World (RoW) In 4Q18, revenues in RoW decreased by 9.5% y-o-y due mainly to lower sales in China, which more than offset positive results in Brazil. EBITDA was US$7 million lower y-o-y, reflecting lower volumes and a less favorable sales mix. For the same reasons, FY2018, revenues and EBITDA were 1.6% and US$17 million lower than 2017.
------------------

February 13, 2019 5
Methodology for presentation of results The report presents unaudited financial information. Figures are in Mexican pesos or US dollars, as indicated. For income statement items, peso amounts were translated into dollars using the average exchange rate of the months during which the operations were recorded. For balance sheet items, peso amounts were translated into dollars using the end-of-period exchange rate. Financial ratios were calculated in dollars. Due to rounding, small differences may occur when calculating percent changes from one period to another. Conference call information Nemak’s Fourth Quarter 2018 Conference Call will be held on Thursday, February 14, 2019, 11:30 a.m. Eastern Time (10:30 a.m. Mexico City Time). To participate in the conference call, please dial: Domestic U.S.: (877) 407-0784; International: 1-201-689-8560; Mexico Toll Free: 01 800 522 0034. The conference call will be webcast live through streaming audio. If you are unable to participate, the conference call audio and script will be available on Nemak’s website. For more information, please visit investors.nemak.com Forward-looking statements
This report may contain certain forward-looking statements concerning Nemak’s future performance that should be considered as good faith estimates made by the Company. These forward-looking statements reflect management’s expectations and are based upon currently available data and analysis. Actual results are subject to future events and uncertainties, which could materially impact Nemak’s actual performance and results. About Nemak Nemak is a leading provider of innovative lightweighting solutions for the global automotive industry, specializing in the development and manufacturing of aluminum components for powertrain and body structure applications. The Company employs more than 22,000 people at 38 facilities worldwide. In 2018, it generated revenues of US$4.7 billion. For more information about Nemak, visit http://www.nemak.com
Three pages of tables to follow
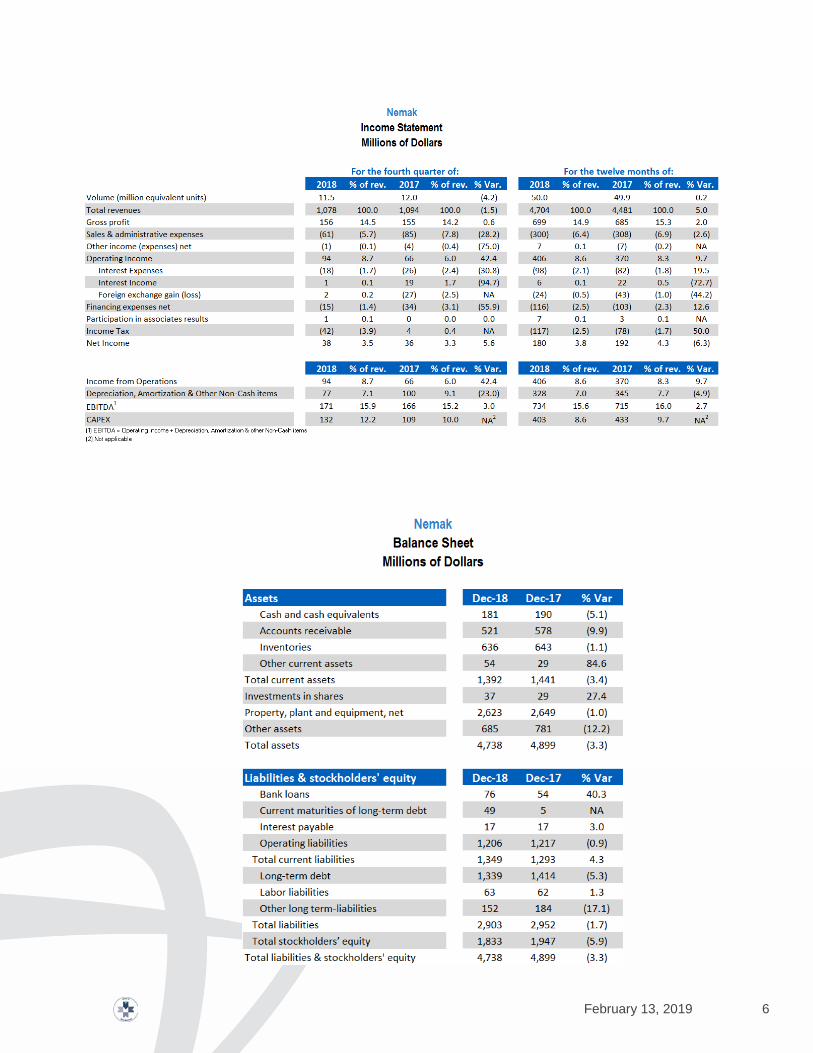
February 13, 2019 6

February 13, 2019 7

February 13, 2019 8

Highlights:
At the end of 2018, Axtel divested a majority share of its fiber (FTTx) mass marketbusiness to completely focus on providing IT and managed Telecom solutions toenterprise and government customers. This transaction is in line with the Company’s
stated strategy and was a key objective since the merger between Alestra and Axtel.
Axtel’s results reflect Mass Market business as discontinued operations, given theexpectation to divest the remaining FTTx business and the complete phase out of thelegacy wireless business.
Fourth quarter performance contributed to positive full year results for the Company.During the year and in peso terms, recurring revenues from the enterprise andgovernment segment increased 6%, supporting a 2% growth of total revenues.EBITDA, excluding Tower Sales, increased 20%.
Since the Alestra-Axtel merger, the Company’s priority has been to improve its capitalstructure. With the proceeds from the sale of the FTTx business, Axtel prepaid Ps.4,350 million in bank debt, reducing its leverage ratio and interest expense andextending the average maturity of its debt from 4.7 to 5.7 years. The Company willcontinue evaluating alternatives to strengthen its capital structure.
Investor Relations:
[email protected]+52(81) 8114-1128
4th 2018Quarter
Media Relations:
[email protected]+52(81) 8114-1144
San Pedro Garza Garcia, Mexico, February 13, 2019 - Axtel, S.A.B. de C.V. (“Axtel” or “the Company”), a Mexican Informationand Communications Technology company, announced today its unaudited fourth quarter results ended December 31, 2018(1).The complete unaudited fourth quarter results of Axtel have been filed with the Mexican Stock Exchange and are also available atthe Company’s website, axtelcorp.mx .
Axtel’s individual results reflect its Mass Market business as discontinued operations. ALFA, however,consolidates both continuing and discontinued operations as shown on the following table. For a completereconciliation of revenues and EBITDA , see page 9.
YTDIn millions 3Q18 4Q17 D%Revenues (Ps.) 3,446 3,140 3,561 10% -3% 12,788 12,544 2%
In USD 174 165 188 5% -8% 664 665 0%
EBITDA (Ps.) (4) 1,097 1,045 1,167 5% -6% 4,393 4,300 2%In USD 55 55 62 1% -10% 228 229 0%
Net (loss) Income (Ps.) 1,242 -542 -923 n.a. n.a. 1,095 62 >100%In USD 60 -29 -49 n.a. n.a. 52 1 >100%
Capital Expenditures (Ps.) 729 576 257 27% >100% 1,644 1,650 0%In USD 37 30 14 21% >100% 85 86 0%
Net Debt (In USD) 686 1,027 973 -33% -30%Net Debt / EBITDA (5) 3.0x 3.5x 3.4x
4Q18 3Q18 4Q17(%) 4Q18 vs.
YTD'18 YTD'17
Revenues from Disc. Op. (Ps.) 685 689 725 -1% -6% 2,773 2,969 -7%In USD 35 36 38 -5% -10% 144 157 -8%
Adjusted Revenues (Ps.) 4,131 3,829 4,286 8% -4% 15,561 15,513 0%In USD 208 202 226 3% -8% 809 822 -2%
EBITDA from Disc. Op. (Ps.) 3,038 266 282 >100% >100% 3,848 1,151 >100%
In USD 151 14 15 >100% >100% 194 61 >100%
Adjusted EBITDA (Ps.) 4,135 1,311 1,450 >100% >100% 8,240 5,451 51%In USD 206 69 77 >100% >100% 422 290 46%
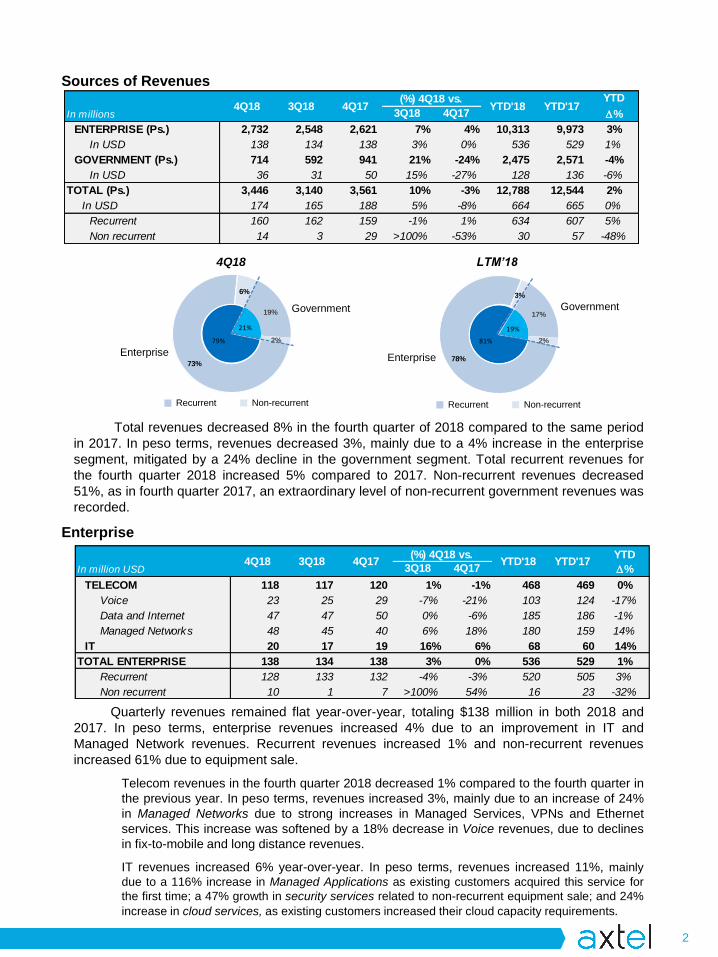
YTDIn million USD 3Q18 4Q17 D%
TELECOM 118 117 120 1% -1% 468 469 0%Voice 23 25 29 -7% -21% 103 124 -17%
Data and Internet 47 47 50 0% -6% 185 186 -1%
Managed Networks 48 45 40 6% 18% 180 159 14%
IT 20 17 19 16% 6% 68 60 14%TOTAL ENTERPRISE 138 134 138 3% 0% 536 529 1%
Recurrent 128 133 132 -4% -3% 520 505 3%
Non recurrent 10 1 7 >100% 54% 16 23 -32%
4Q18 3Q18 4Q17 (%) 4Q18 vs. YTD'18 YTD'17
Sources of Revenues
Quarterly revenues remained flat year-over-year, totaling $138 million in both 2018 and2017. In peso terms, enterprise revenues increased 4% due to an improvement in IT andManaged Network revenues. Recurrent revenues increased 1% and non-recurrent revenuesincreased 61% due to equipment sale.
Telecom revenues in the fourth quarter 2018 decreased 1% compared to the fourth quarter inthe previous year. In peso terms, revenues increased 3%, mainly due to an increase of 24%in Managed Networks due to strong increases in Managed Services, VPNs and Ethernetservices. This increase was softened by a 18% decrease in Voice revenues, due to declinesin fix-to-mobile and long distance revenues.
IT revenues increased 6% year-over-year. In peso terms, revenues increased 11%, mainlydue to a 116% increase in Managed Applications as existing customers acquired this service forthe first time; a 47% growth in security services related to non-recurrent equipment sale; and 24%increase in cloud services, as existing customers increased their cloud capacity requirements.
Enterprise
Total revenues decreased 8% in the fourth quarter of 2018 compared to the same periodin 2017. In peso terms, revenues decreased 3%, mainly due to a 4% increase in the enterprisesegment, mitigated by a 24% decline in the government segment. Total recurrent revenues forthe fourth quarter 2018 increased 5% compared to 2017. Non-recurrent revenues decreased51%, as in fourth quarter 2017, an extraordinary level of non-recurrent government revenues wasrecorded.
81%
19%
78%
3%
17%
2%79%
21%
73%
6%
19%
2%
4Q18 LTM’18
Recurrent Non-recurrent
Enterprise
Government
Recurrent Non-recurrent
Enterprise
Government
YTDIn millions 3Q18 4Q17 D%
ENTERPRISE (Ps.) 2,732 2,548 2,621 7% 4% 10,313 9,973 3%In USD 138 134 138 3% 0% 536 529 1%
GOVERNMENT (Ps.) 714 592 941 21% -24% 2,475 2,571 -4%In USD 36 31 50 15% -27% 128 136 -6%
TOTAL (Ps.) 3,446 3,140 3,561 10% -3% 12,788 12,544 2%In USD 174 165 188 5% -8% 664 665 0%
Recurrent 160 162 159 -1% 1% 634 607 5%
Non recurrent 14 3 29 >100% -53% 30 57 -48%
4Q18 3Q18 4Q17 YTD'18 YTD'17(%) 4Q18 vs.
2
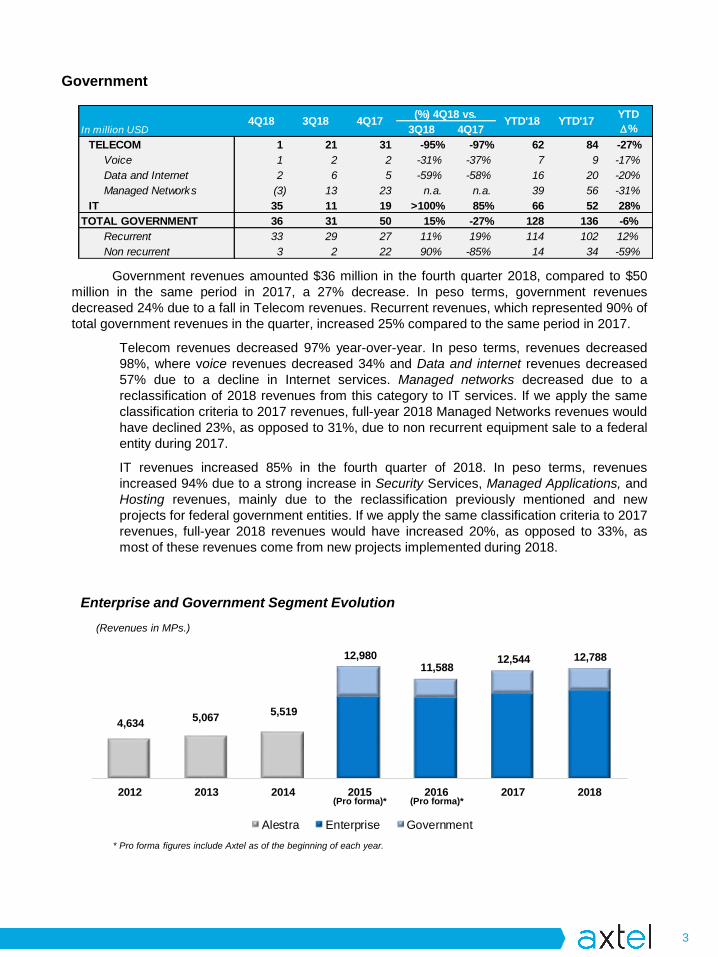
YTDIn million USD 3Q18 4Q17 D%
TELECOM 1 21 31 -95% -97% 62 84 -27%Voice 1 2 2 -31% -37% 7 9 -17%
Data and Internet 2 6 5 -59% -58% 16 20 -20%
Managed Networks (3) 13 23 n.a. n.a. 39 56 -31%
IT 35 11 19 >100% 85% 66 52 28%TOTAL GOVERNMENT 36 31 50 15% -27% 128 136 -6%
Recurrent 33 29 27 11% 19% 114 102 12%
Non recurrent 3 2 22 90% -85% 14 34 -59%
4Q18 3Q18 4Q17 (%) 4Q18 vs. YTD'18 YTD'17
4,634 5,067 5,519
12,980 11,588
12,544 12,788
2012 2013 2014 2015 2016 2017 2018
Alestra Enterprise Government
Government revenues amounted $36 million in the fourth quarter 2018, compared to $50million in the same period in 2017, a 27% decrease. In peso terms, government revenuesdecreased 24% due to a fall in Telecom revenues. Recurrent revenues, which represented 90% oftotal government revenues in the quarter, increased 25% compared to the same period in 2017.
Telecom revenues decreased 97% year-over-year. In peso terms, revenues decreased98%, where voice revenues decreased 34% and Data and internet revenues decreased57% due to a decline in Internet services. Managed networks decreased due to areclassification of 2018 revenues from this category to IT services. If we apply the sameclassification criteria to 2017 revenues, full-year 2018 Managed Networks revenues wouldhave declined 23%, as opposed to 31%, due to non recurrent equipment sale to a federalentity during 2017.
IT revenues increased 85% in the fourth quarter of 2018. In peso terms, revenuesincreased 94% due to a strong increase in Security Services, Managed Applications, andHosting revenues, mainly due to the reclassification previously mentioned and newprojects for federal government entities. If we apply the same classification criteria to 2017revenues, full-year 2018 revenues would have increased 20%, as opposed to 33%, asmost of these revenues come from new projects implemented during 2018.
Government
Enterprise and Government Segment Evolution
(Revenues in MPs.)
* Pro forma figures include Axtel as of the beginning of each year.
(Pro forma)*(Pro forma)*
3
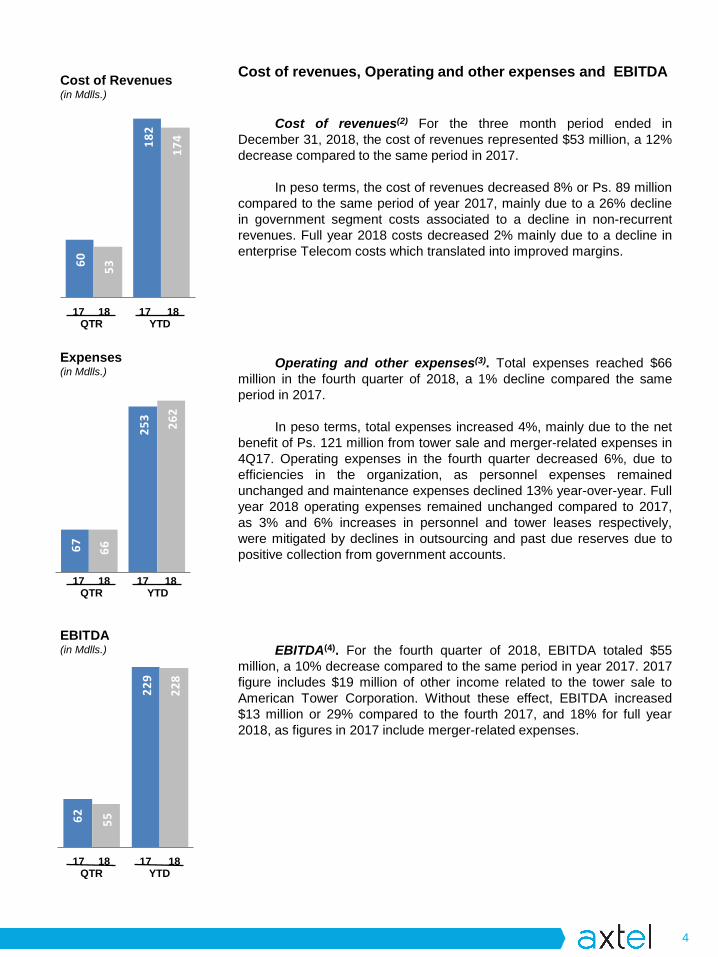
62
22
9
55
22
8
67
25
3
66
26
2
60
18
2
53
17
4
17 1718 18YTDQTR
17 1718 18YTDQTR
17 1718 18YTDQTR
Cost of Revenues(in Mdlls.)
Expenses(in Mdlls.)
EBITDA(in Mdlls.)
Cost of revenues, Operating and other expenses and EBITDA
Cost of revenues(2) For the three month period ended inDecember 31, 2018, the cost of revenues represented $53 million, a 12%decrease compared to the same period in 2017.
In peso terms, the cost of revenues decreased 8% or Ps. 89 millioncompared to the same period of year 2017, mainly due to a 26% declinein government segment costs associated to a decline in non-recurrentrevenues. Full year 2018 costs decreased 2% mainly due to a decline inenterprise Telecom costs which translated into improved margins.
Operating and other expenses(3). Total expenses reached $66million in the fourth quarter of 2018, a 1% decline compared the sameperiod in 2017.
In peso terms, total expenses increased 4%, mainly due to the netbenefit of Ps. 121 million from tower sale and merger-related expenses in4Q17. Operating expenses in the fourth quarter decreased 6%, due toefficiencies in the organization, as personnel expenses remainedunchanged and maintenance expenses declined 13% year-over-year. Fullyear 2018 operating expenses remained unchanged compared to 2017,as 3% and 6% increases in personnel and tower leases respectively,were mitigated by declines in outsourcing and past due reserves due topositive collection from government accounts.
EBITDA(4). For the fourth quarter of 2018, EBITDA totaled $55million, a 10% decrease compared to the same period in year 2017. 2017figure includes $19 million of other income related to the tower sale toAmerican Tower Corporation. Without these effect, EBITDA increased$13 million or 29% compared to the fourth 2017, and 18% for full year2018, as figures in 2017 include merger-related expenses.
4

YTDMillion Pesos 3Q18 4Q17 ∆%
Net interest expense (25) (24) (27) -1% 9% (94) (84) -12%FX gain (loss), net (25) (1) (64) >100% 61% 10 32 -70%Ch. in FV of fin. Instruments (2) (1) 3 >100% n.a. (2) 1 n.a.
Total (52) (26) (88) -100% 42% (87) (51) -69%
4Q18 YTD'17YTD'18(%) 4Q18 vs.4Q173Q18
Million dollars 4Q18 3Q18 4Q172024 Senior Notes 500 500 500 Bank Facilities 95 331 325 Other loans 191 203 189 Other financing obligations 13 22 23 Accrued interests 6 16 7 Total Debt 805 1,071 1,045 (-) Cash and cash equivalents (119) (44) (72) Net Debt 686 1,027 973
Comprehensive Financing Result
Total Debt. At the end of the fourth quarter 2018, total debt decreased $240 million, incomparison with fourth quarter 2017, composed of a $241 million decrease in debt and $1 millionnon-cash increase caused by a 0.3% appreciation of the Mexican peso year-over-year.
Debt reduction of $241 million in comparison with fourth quarter 2017 is explained by (i) a$230 million decrease related to the partial prepayment of the Syndicated Bank facility; (ii) a $15million decrease in a long term bank facility; (iii) an increase of $5 million in other loans andfinancial leases; and (iv) a decrease of $1 million in accrued interests.
Cash. As of the end of the fourth quarter of 2018, the cash balance totaled $114 million,compared to $64 million a year ago, and $35 million at the beginning of the quarter. The cashbalance at the end of the quarter includes $5 million restricted cash and $54 million in cash to bespent in the first quarter 2019 related to value-added tax and other provisioned expenses from theMass Market monetization.
Total Debt and Net Debt (6)
The comprehensive financing cost reached $52 million in the fourth quarter of 2018,compared to $88 million in the year-earlier quarter. This decrease in cost is explained mostly bya decline in FX loss during the fourth quarter of 2018 resulting from a lower amount of USD-denominated debt and a 4.4% depreciation of the Mexican peso against the US dollar,compared to a 7.8% depreciation of the Mexican peso in the fourth quarter of 2017.
In the fourth quarter of 2018, capital investments totaled $37 million. This figure representsa 14% increase compared to $32 million in the year-earlier quarter, without considering the $19million benefit from the tower sale. Additionally, in the fourth quarter 2018, Axtel invested less than$1 million through financial leases, compared to $11 million in the year-earlier quarter.
Capital Expenditures
5
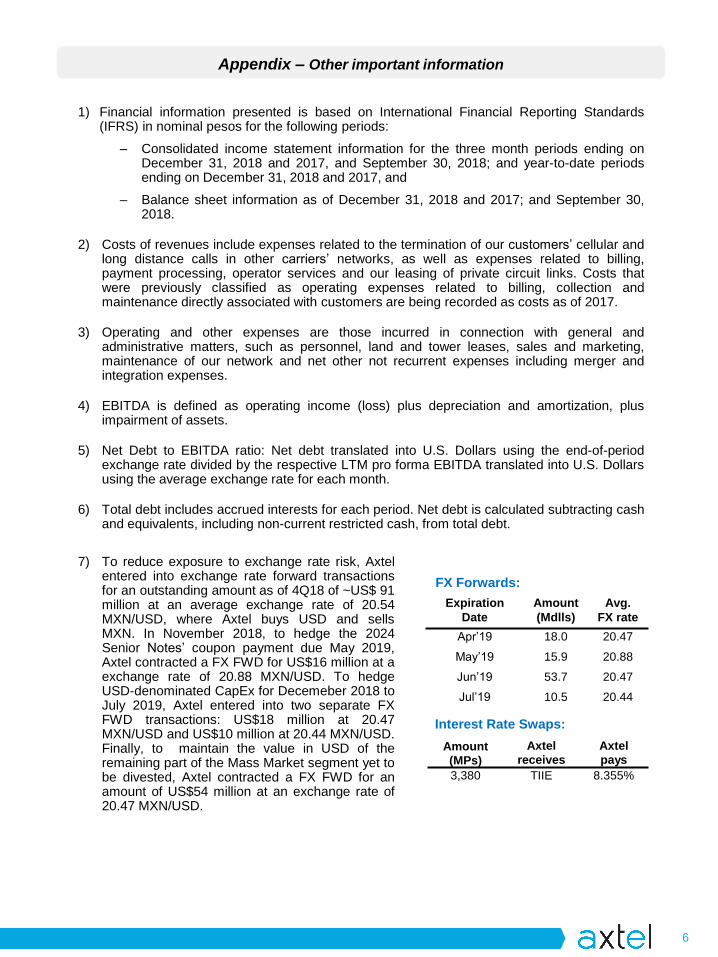
Appendix – Other important information
1) Financial information presented is based on International Financial Reporting Standards(IFRS) in nominal pesos for the following periods:
– Consolidated income statement information for the three month periods ending onDecember 31, 2018 and 2017, and September 30, 2018; and year-to-date periodsending on December 31, 2018 and 2017, and
– Balance sheet information as of December 31, 2018 and 2017; and September 30,2018.
2) Costs of revenues include expenses related to the termination of our customers’ cellular andlong distance calls in other carriers’ networks, as well as expenses related to billing,payment processing, operator services and our leasing of private circuit links. Costs thatwere previously classified as operating expenses related to billing, collection andmaintenance directly associated with customers are being recorded as costs as of 2017.
3) Operating and other expenses are those incurred in connection with general andadministrative matters, such as personnel, land and tower leases, sales and marketing,maintenance of our network and net other not recurrent expenses including merger andintegration expenses.
4) EBITDA is defined as operating income (loss) plus depreciation and amortization, plusimpairment of assets.
5) Net Debt to EBITDA ratio: Net debt translated into U.S. Dollars using the end-of-periodexchange rate divided by the respective LTM pro forma EBITDA translated into U.S. Dollarsusing the average exchange rate for each month.
6) Total debt includes accrued interests for each period. Net debt is calculated subtracting cashand equivalents, including non-current restricted cash, from total debt.
Expiration Date
Amount(Mdlls)
Avg.FX rate
Apr’19 18.0 20.47
May’19 15.9 20.88
Jun’19 53.7 20.47
Jul’19 10.5 20.44
FX Forwards:
Interest Rate Swaps:Amount (MPs)
Axtel receives
Axtel pays
3,380 TIIE 8.355%
7) To reduce exposure to exchange rate risk, Axtelentered into exchange rate forward transactionsfor an outstanding amount as of 4Q18 of ~US$ 91million at an average exchange rate of 20.54MXN/USD, where Axtel buys USD and sellsMXN. In November 2018, to hedge the 2024Senior Notes’ coupon payment due May 2019,Axtel contracted a FX FWD for US$16 million at aexchange rate of 20.88 MXN/USD. To hedgeUSD-denominated CapEx for Decemeber 2018 toJuly 2019, Axtel entered into two separate FXFWD transactions: US$18 million at 20.47MXN/USD and US$10 million at 20.44 MXN/USD.Finally, to maintain the value in USD of theremaining part of the Mass Market segment yet tobe divested, Axtel contracted a FX FWD for anamount of US$54 million at an exchange rate of20.47 MXN/USD.
6

(%) Dec-18 vs.Dec-18 Sep-18 Dec-17 Dec-17
ASSETSCURRENT ASSETSCash and equivalents 2,249,155 651,777 1,257,803 79Accounts receivable 2,660,090 3,024,035 2,679,833 (1)Allowance for doubtful accounts (2,172,343) (2,183,612) (2,089,484) 4Related parties 55,105 40,804 31,702 74Refundable taxes and other accounts receivable 878,686 986,250 832,567 6Advances to suppliers 546,064 652,597 485,729 12Inventories 104,802 295,583 188,885 (45)Derivative Financial Instruments 5,898 - 61,913 (90)Financial Instruments (Zero Strike Call) 129,075 162,105 164,278 (21)Assets classified as held for sale 315,053 - - n.a.Total current assets 6,943,928 5,813,149 5,702,710 22
NON CURRENT ASSETSRestricted cash 93,908 170,644 161,955 (42)Property, plant and equipment, net 16,105,524 18,276,700 19,275,810 (16)Long-term accounts receivable - 8,716 - n.a.Intangible assets, net 1,405,387 1,413,064 1,508,512 (7)Deferred income taxes 2,873,075 3,566,299 3,747,710 (23)Investment in shares of associated co. & other 294,535 157,295 139,427 >100Derivative financial instruments 17,693 - - n.a.Other assets 421,752 400,316 217,646 94Total non current assets 21,211,874 23,993,033 25,051,059 (15)
TOTAL ASSETS 28,155,802 29,806,182 30,753,769 (8)
LIABILITIES & STOCKHOLDERS' EQUITYCURRENT LIABILITIESAccount payable & Accrued expenses 3,547,032 3,482,360 3,881,152 (9)Accrued Interest 123,847 294,305 145,681 (15)Short-term debt - - 700,000 n.a.Current portion of long-term debt 341,981 488,394 533,253 (36)Taxes payable 13,081 38,812 18,616 (30)Derivative Financial Instruments 39,258 25,627 - n.a.Deferred Revenue 536,452 279,386 312,121 72Provisions 312,384 21,440 117,908 >100Other accounts payable 3,863,865 3,044,866 2,195,956 76Total current liabilities 8,777,900 7,675,191 7,904,687 11
LONG-TERM LIABILITIESLong-term debt 15,156,918 19,139,025 19,043,735 (20)Derivative Financial Instruments - 41,034 - n.a.Employee Benefits 592,037 646,049 588,696 1Other LT liabilities 8,040 3,279 724,249 (99)Total long-term debt 15,756,995 19,829,387 20,356,680 (23)
TOTAL LIABILITIES 24,534,895 27,504,577 28,261,368 (13)
STOCKHOLDERS EQUITYCapital stock 464,371 464,371 464,371 0Additional paid-in capital 159,551 159,551 159,551 0Reserve for repurchase of shares - - - n.a.Cumulative earnings (losses) 2,996,985 1,677,683 1,868,480 60
TOTAL STOCKHOLDERS' EQUITY 3,620,907 2,301,605 2,492,402 45
TOTAL LIABILITIES AND STOCKHOLDERS' EQUITY 28,155,802 29,806,182 30,753,769 (8)
Axtel, S.A.B. de C.V. and SubsidiariesUnaudited Consolidated Balance Sheet(in Thousand Mexican pesos)
7
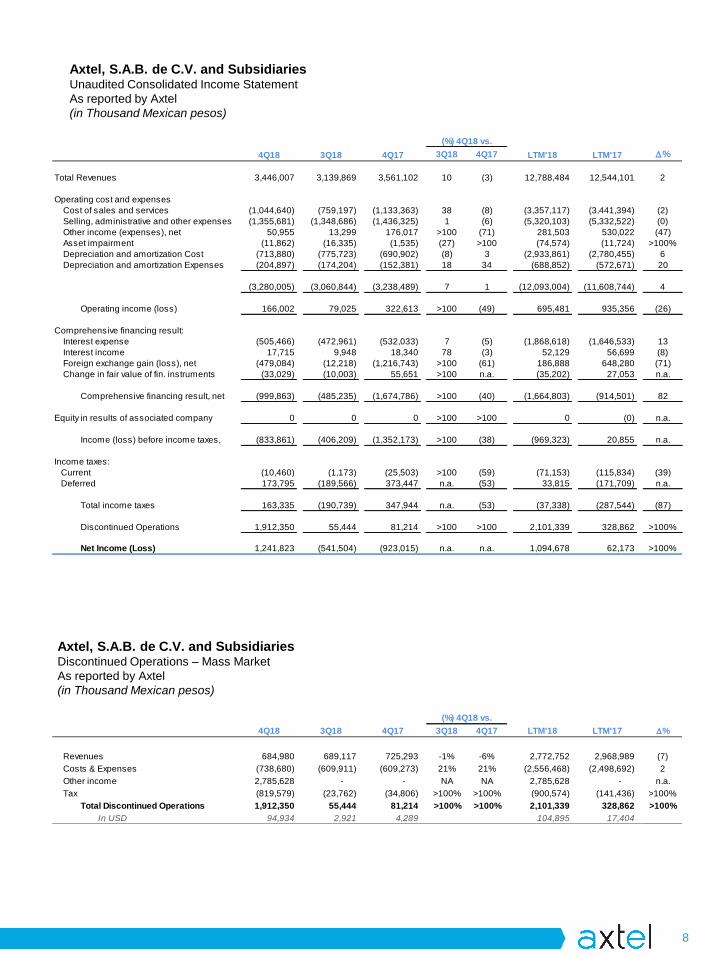
Axtel, S.A.B. de C.V. and SubsidiariesUnaudited Consolidated Income StatementAs reported by Axtel (in Thousand Mexican pesos)
4Q18 3Q18 4Q17 3Q18 4Q17 LTM'18 LTM'17 D%
Total Revenues 3,446,007 3,139,869 3,561,102 10 (3) 12,788,484 12,544,101 2
Operating cost and expensesCost of sales and services (1,044,640) (759,197) (1,133,363) 38 (8) (3,357,117) (3,441,394) (2)Selling, administrative and other expenses (1,355,681) (1,348,686) (1,436,325) 1 (6) (5,320,103) (5,332,522) (0)Other income (expenses), net 50,955 13,299 176,017 >100 (71) 281,503 530,022 (47)Asset impairment (11,862) (16,335) (1,535) (27) >100 (74,574) (11,724) >100%Depreciation and amortization Cost (713,880) (775,723) (690,902) (8) 3 (2,933,861) (2,780,455) 6Depreciation and amortization Expenses (204,897) (174,204) (152,381) 18 34 (688,852) (572,671) 20
(3,280,005) (3,060,844) (3,238,489) 7 1 (12,093,004) (11,608,744) 4
Operating income (loss) 166,002 79,025 322,613 >100 (49) 695,481 935,356 (26)
Comprehensive financing result:Interest expense (505,466) (472,961) (532,033) 7 (5) (1,868,618) (1,646,533) 13Interest income 17,715 9,948 18,340 78 (3) 52,129 56,699 (8)Foreign exchange gain (loss), net (479,084) (12,218) (1,216,743) >100 (61) 186,888 648,280 (71)Change in fair value of fin. instruments (33,029) (10,003) 55,651 >100 n.a. (35,202) 27,053 n.a.
Comprehensive financing result, net (999,863) (485,235) (1,674,786) >100 (40) (1,664,803) (914,501) 82
Equity in results of associated company 0 0 0 >100 >100 0 (0) n.a.
Income (loss) before income taxes, (833,861) (406,209) (1,352,173) >100 (38) (969,323) 20,855 n.a.
Income taxes: Current (10,460) (1,173) (25,503) >100 (59) (71,153) (115,834) (39) Deferred 173,795 (189,566) 373,447 n.a. (53) 33,815 (171,709) n.a.
Total income taxes 163,335 (190,739) 347,944 n.a. (53) (37,338) (287,544) (87)
Discontinued Operations 1,912,350 55,444 81,214 >100 >100 2,101,339 328,862 >100%
Net Income (Loss) 1,241,823 (541,504) (923,015) n.a. n.a. 1,094,678 62,173 >100%
(%) 4Q18 vs.
Axtel, S.A.B. de C.V. and SubsidiariesDiscontinued Operations – Mass MarketAs reported by Axtel(in Thousand Mexican pesos)
8
4Q18 3Q18 4Q17 3Q18 4Q17 LTM'18 LTM'17 D%
Revenues 684,980 689,117 725,293 -1% -6% 2,772,752 2,968,989 (7)Costs & Expenses (738,680) (609,911) (609,273) 21% 21% (2,556,468) (2,498,692) 2Other income 2,785,628 - - NA NA 2,785,628 - n.a.Tax (819,579) (23,762) (34,806) >100% >100% (900,574) (141,436) >100%
Total Discontinued Operations 1,912,350 55,444 81,214 >100% >100% 2,101,339 328,862 >100%In USD 94,934 2,921 4,289 104,895 17,404
(%) 4Q18 vs.

Axtel, S.A.B. de C.V. and SubsidiariesEBITDA Reconciliation(in Thousand Mexican pesos)
Axtel, S.A.B. de C.V. and SubsidiariesRevenues Reconciliation(in Thousand Mexican pesos)
About AXTELAxtel is a Mexican Information and Communication Technology Company that serves the enterprise and governmentsegments with a robust portfolio of IT and Telecommunications solutions through its brand Alestra.
With a network infrastructure of over 40 thousand kilometers of fiber and more than 6,700 square meters of data center,Axtel enables organizations to be more productive and brings people together to improve their quality of life.
As of February 15, 2016, Axtel is a subsidiary of Alfa, which owns 52.8% of its equity.
Axtel shares, represented by Ordinary Participation Certificates, or CPOs, trade on the Mexican Stock Market under thesymbol “AXTELCPO” since 2005.
Axtel’s Investor Relations Center: axtelcorp.mxEnterprise and Government services website: alestra.mx
4Q18 3Q18 4Q17 3Q18 4Q17 LTM'18 LTM'17 D%
Operating income (loss) 166,002 79,025 322,613 >100 (49) 695,481 935,356 (26)Asset impairment 11,862 16,335 1,535 (27) >100 74,574 11,724 >100Depreciation and amortization 918,777 949,927 843,282 (3) 9 3,622,713 3,353,126 8
EBITDA 1,096,641 1,045,287 1,167,430 5 (6) 4,392,767 4,300,206 2In USD 55,374 55,077 61,653 1 (10) 228,321 228,966 (0)
Discontinued Operations (Mass Market)Revenues 684,980 689,117 725,293 (1) (6) 2,772,752 2,968,989 (7)Cost of sales and services (131,676) (111,926) (124,787) 18 6 (479,043) (505,773) (5)Selling, administrative and other expenses (300,893) (311,174) (318,141) (3) (5) (1,231,732) (1,312,208) (6)Other income (expenses), net - FTTx Sale 2,785,628 - - n.a. n.a. 2,785,628 - n.a.
EBITDA Discontinued Operations 3,038,040 266,017 282,365 >100 >100 3,847,606 1,151,009 >100
Adjusted EBITDA 4,134,681 1,311,304 1,449,795 >100 >100 8,240,373 5,451,215 51In USD 206,342 69,094 76,565 >100 >100 421,878 289,921 46
(%) 4Q18 vs.
9
4Q18 3Q18 4Q17 3Q18 4Q17 LTM'18 LTM'17 D%
Revenues 3,446,007 3,139,869 3,561,102 10 (3) 12,788,484 12,544,101 2Revenues from Discontinued Operations 684,980 689,117 725,293 (1) (6) 2,772,752 2,968,989 (7)
Adjusted Revenues 4,130,988 3,828,986 4,286,395 8 (4) 15,561,237 15,513,090 0In USD 208,247 201,749 226,194 3 (8) 808,704 821,703 (2)
(%) 4Q18 vs.
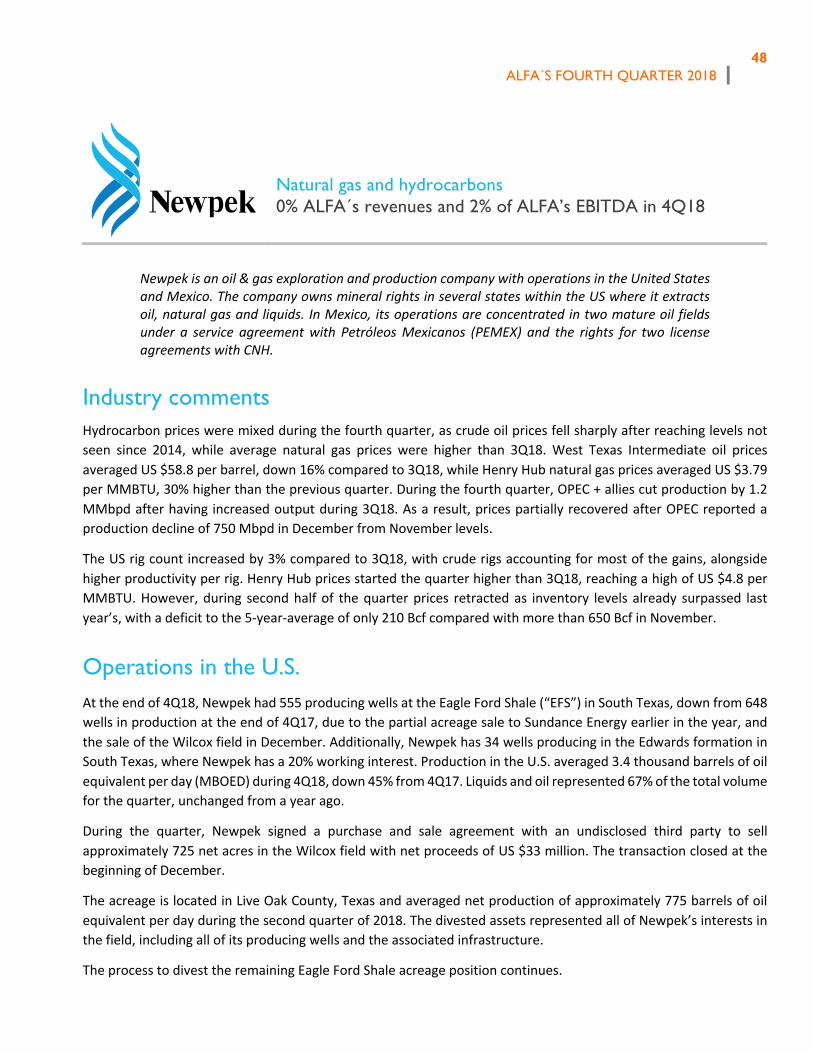
ALFA´S FOURTH QUARTER 2018
48
Natural gas and hydrocarbons 0% ALFA´s revenues and 2% of ALFA’s EBITDA in 4Q18
Newpek is an oil & gas exploration and production company with operations in the United States and Mexico. The company owns mineral rights in several states within the US where it extracts oil, natural gas and liquids. In Mexico, its operations are concentrated in two mature oil fields under a service agreement with Petróleos Mexicanos (PEMEX) and the rights for two license agreements with CNH.
Industry comments Hydrocarbon prices were mixed during the fourth quarter, as crude oil prices fell sharply after reaching levels not seen since 2014, while average natural gas prices were higher than 3Q18. West Texas Intermediate oil prices averaged US $58.8 per barrel, down 16% compared to 3Q18, while Henry Hub natural gas prices averaged US $3.79 per MMBTU, 30% higher than the previous quarter. During the fourth quarter, OPEC + allies cut production by 1.2 MMbpd after having increased output during 3Q18. As a result, prices partially recovered after OPEC reported a production decline of 750 Mbpd in December from November levels.
The US rig count increased by 3% compared to 3Q18, with crude rigs accounting for most of the gains, alongside higher productivity per rig. Henry Hub prices started the quarter higher than 3Q18, reaching a high of US $4.8 per MMBTU. However, during second half of the quarter prices retracted as inventory levels already surpassed last year’s, with a deficit to the 5-year-average of only 210 Bcf compared with more than 650 Bcf in November.
Operations in the U.S. At the end of 4Q18, Newpek had 555 producing wells at the Eagle Ford Shale (“EFS”) in South Texas, down from 648 wells in production at the end of 4Q17, due to the partial acreage sale to Sundance Energy earlier in the year, and the sale of the Wilcox field in December. Additionally, Newpek has 34 wells producing in the Edwards formation in South Texas, where Newpek has a 20% working interest. Production in the U.S. averaged 3.4 thousand barrels of oil equivalent per day (MBOED) during 4Q18, down 45% from 4Q17. Liquids and oil represented 67% of the total volume for the quarter, unchanged from a year ago.
During the quarter, Newpek signed a purchase and sale agreement with an undisclosed third party to sell approximately 725 net acres in the Wilcox field with net proceeds of US $33 million. The transaction closed at the beginning of December.
The acreage is located in Live Oak County, Texas and averaged net production of approximately 775 barrels of oil equivalent per day during the second quarter of 2018. The divested assets represented all of Newpek’s interests in the field, including all of its producing wells and the associated infrastructure.
The process to divest the remaining Eagle Ford Shale acreage position continues.

ALFA´S FOURTH QUARTER 2018
49
Operations in Mexico In Mexico, production averaged 3.2 MBOED during 4Q18, a 6% decrease from 4Q17. The San Andrés field represented 68% of the total production for the quarter, essentially flat year-on-year. There were 131 wells in production in Mexico at quarter’s end, a 2% decrease from the 134 wells in production at the end of 4Q17.
Financial results; Capital expenditures and acquisition; Net debt
4Q18 revenues were US $22 million, down 29% year-on-year, mainly explained by lower revenues in Mexico and lower U.S. production due to the partial EFS sale to Sundance Energy and the divestment of the Wilcox field. 2018 revenues were US $108 million, flat with 2017.
During the quarter, 4Q18 EBITDA was US $16 million, compared to US $3 million in 4Q17. Excluding the sale of the Wilcox assets, EBITDA was negative US $6 million, mainly explained by higher expenses in Mexico and in the U.S. during the quarter. Accumulated EBITDA was US $31 million, compared to EBITDA of US $3 million in 2017. Capital expenditures amounted to negative US $27 million due to the sale of Wilcox field, while net debt was negative US $18 million at the end of the quarter.
Based on expected future cash flows of some of its assets, Newpek recognized a non-cash impairment expense of US $88 million in 4Q18 that affected Operating Income, but not EBITDA.

ALFA´S FOURTH QUARTER 2018
50
NEWPEK Table 1 | Revenues
(%) 4Q18 vs. 4Q18 3Q18 4Q17 3Q18 4Q17 YTD. ‘18 YTD.'17 Chg.%
Total Revenues Ps. Millions 438 511 591 (14) (26) 2,060 2,036 1 US $ Millions 22 27 31 (18) (29) 108 107 -
Domestic Revenues Ps. Millions 238 293 244 (19) (2) 1,011 957 6 US $ Millions 12 15 13 (22) (6) 53 50 5
Foreign Revenues Ps. Millions 200 218 347 (8) (42) 1,049 1,078 (3) US $ Millions 10 11 18 (12) (45) 55 57 (3) Foreign / Total (%) 46 43 59 51 53
Volume Thousands of Barrels of Oil Equivalent Per Day (MBOEPD)
3.4 4.0 6.2 4.4 4.9
Liquid & others as % of total volume
65 64 67 66 67
Table 2 | Operating Income and EBITDA (%) 4Q18 vs. 4Q18 3Q18 4Q17 3Q18 4Q17 YTD. ‘18 YTD.'17 Chg.%
Operating Income
Ps. Millions (1,916) (133) (234) - (720) (1,914) (699) (174) US $ Millions (94) (7) (12) - (666) (94) (37) (154)
EBITDA Ps. Millions 290 (36) 64 911 351 572 50 1,051 US $ Millions 16 (2) 3 926 358 31 3 971
Table 3 | Selected Balance Sheet Information & Financial Ratios (US $ millions) 4Q18 3Q18 4Q17 YTD.’18 YTD.’17 Assets 602 700 647 602 647 Liabilities 224 336 329 224 329 Stockholders’ Equity 378 364 318 378 318 Net Debt (18) 18 34 (18) 34 Net Debt/EBITDA* (0.6) 1.0 12 (0.6) 12 Interest Coverage* (7.8) (4.7) 0.7 (7.8) 0.7
* Times: LTM = Last 12 months