Alexander Wang Beauty - Extension Line Development
129
-
Upload
picha-choo -
Category
Art & Photos
-
view
83 -
download
6
Transcript of Alexander Wang Beauty - Extension Line Development


1
Table of Contents
Executive Summary ------------------------------------------------------------------------------------- 2 Company Summary ------------------------------------------------------------------------------------ 3-9
Brand Profile -------------------------------------------------------------------------------------3-4
Brand Identity ----------------------------------------------------------------------------------- 5-7
Positioning in the Market ---------------------------------------------------------------------- 8-9
Market Analysis ---------------------------------------------------------------------------------------10-47
Size of retail market ---------------------------------------------------------------------------10-14
Key players -------------------------------------------------------------------------------------15-26
SWOT ------------------------------------------------------------------------------------------ 27-30
PESTEL --------------------------------------------------------------------------------------- 31-40
Porter’s 5 Forces ----------------------------------------------------------------------------- 41-43
Positioning for Extension ------------------------------------------------------------------- 44-47
Target Consumer ------------------------------------------------------------------------------------ 48-51
Demographic -------------------------------------------------------------------------------------48
Psychographic ------------------------------------------------------------------------------------49
Behavioral Information ----------------------------------------------------------------------49-50
4Ps Strategy -------------------------------------------------------------------------------------------- 52-68
Product --------------------------------------------------------------------------------------------52
Pricing ------------------------------------------------------------------------------------------ 53-54
Placement ---------------------------------------------------------------------------------------- 55
Promotion-------------------------------------------------------------------------------------- 56-68
Conclusion ------------------------------------------------------------------------------------------------ 69
Bibliography-------------------------------------------------------------------------------------------- 70-71
Appendix----------------------------------------------------------------------------------------------- A1-A2
2
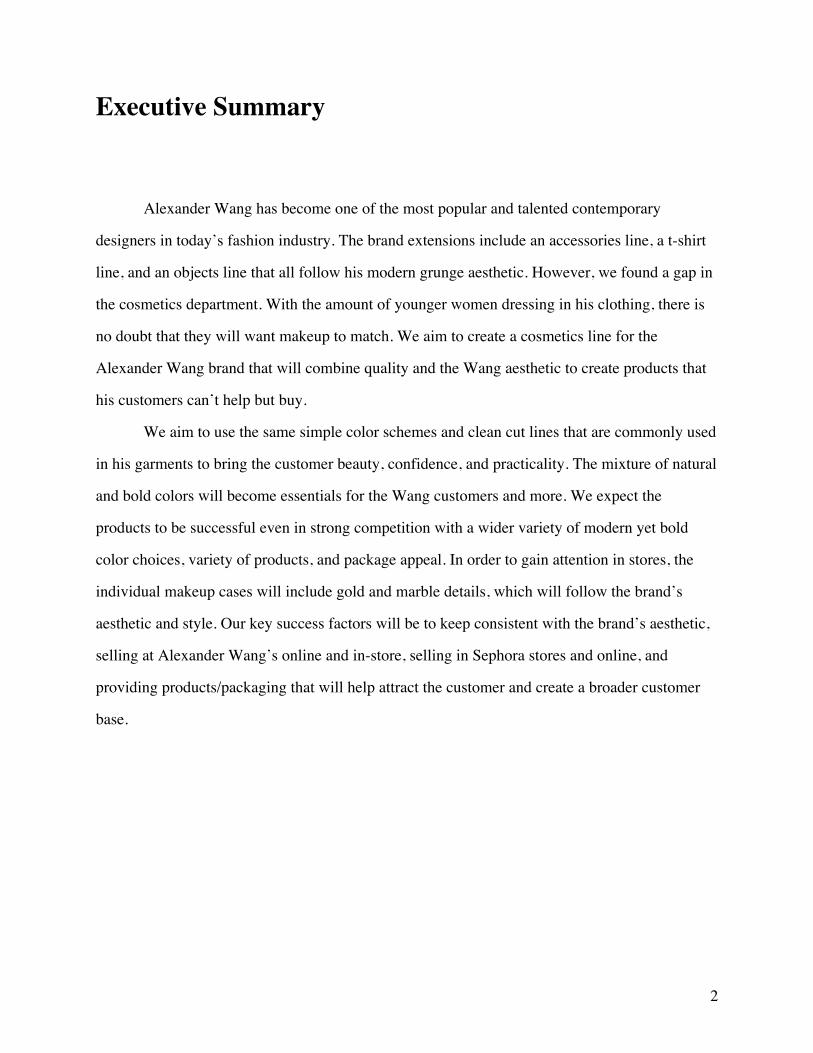
Executive Summary
Alexander Wang has become one of the most popular and talented contemporary
designers in today’s fashion industry. The brand extensions include an accessories line, a t-shirt
line, and an objects line that all follow his modern grunge aesthetic. However, we found a gap in
the cosmetics department. With the amount of younger women dressing in his clothing, there is
no doubt that they will want makeup to match. We aim to create a cosmetics line for the
Alexander Wang brand that will combine quality and the Wang aesthetic to create products that
his customers can’t help but buy.
We aim to use the same simple color schemes and clean cut lines that are commonly used
in his garments to bring the customer beauty, confidence, and practicality. The mixture of natural
and bold colors will become essentials for the Wang customers and more. We expect the
products to be successful even in strong competition with a wider variety of modern yet bold
color choices, variety of products, and package appeal. In order to gain attention in stores, the
individual makeup cases will include gold and marble details, which will follow the brand’s
aesthetic and style. Our key success factors will be to keep consistent with the brand’s aesthetic,
selling at Alexander Wang’s online and in-store, selling in Sephora stores and online, and
providing products/packaging that will help attract the customer and create a broader customer
base.

3
Company Summary
History
Alexander Wang was very young when started his own line of clothing. According to his
online biography from the official website, he attended Parsons School of Design in 2002, but
dropped out after two years of education and interned with various notable fashion companies
such as Marc Jacobs, Derek Lam, and Teen Vogue. This helped to further himself and his name
in the fashion industry. Soon after, in 2005, he launched his own cashmere knitwear collection
and two years later, in 2007, he launched his first women’s ready-to-wear line (official website).
In 2009, Women’s T by Alexander Wang and the accessories line was launched, followed by the
Men’s T line in 2011. All of his success in the industry has taken less then 10 years to evolve,
which shows his talent in fashion and knowing what his customer wants.
Ownership
Santlofer stated in her book, Contemporary Fashion Designers That You Should Know,
that the organization was established by Alexander Wang in 2005 as a family-owned company
with his brother Dennis Wang as chief principal officer, his sister-in-law Aimie Wang as the
CEO, and himself as the creative director. The majority of the funding came from his family and
in 2007, Alexander Wang was awarded $200,00 from the CFDA/Vogue fashion award, which
helped to expand the company (53-54).
Distribution
According to the official Alexander Wang website, “the company opened its first flagship
store in SOHO, New York in 2011, following in 2012 with the second flagship store in Beijing,
and the recent one in Tokyo in 2013.” The expansion of the company into other geographic
regions reflects its effective distribution strategies. Today the company operates in over 15 stores

4
worldwide. It also has many distribution channels, such as e-commerce retailing directly on its
own website as well as selling merchandise to wholesalers like Net-A-Porter. According to
Fashionbi, there are more then 30 department stores and premier retailers, like Neiman Marcus,
Nordstrom, and Barney’s New York, that sell his lines both in store and online. There are also
concessions in department stores and a pop-up shop in collaboration with Joyce at Gateway
Arcade in Hong Kong.
Growth Projections
The beauty industry continues to grow each year according to Franchise Help’s analysis
of the Beauty Industry. They state “for the interested entrepreneur this continuing growth and
evolution offers a diverse menu of opportunity”. They also state that, “The beauty industry
continues to expand globally, with some projections claiming 8.5% growth by 2014”. With the
gradual growth of both the Alexander Wang brand and the beauty industry, this extension should
also grow in popularity after its launch. With the help of e-commerce and wholesale, we hope to
expand the cosmetics extension to all Alexander Wang stores and wholesalers around the world.
5
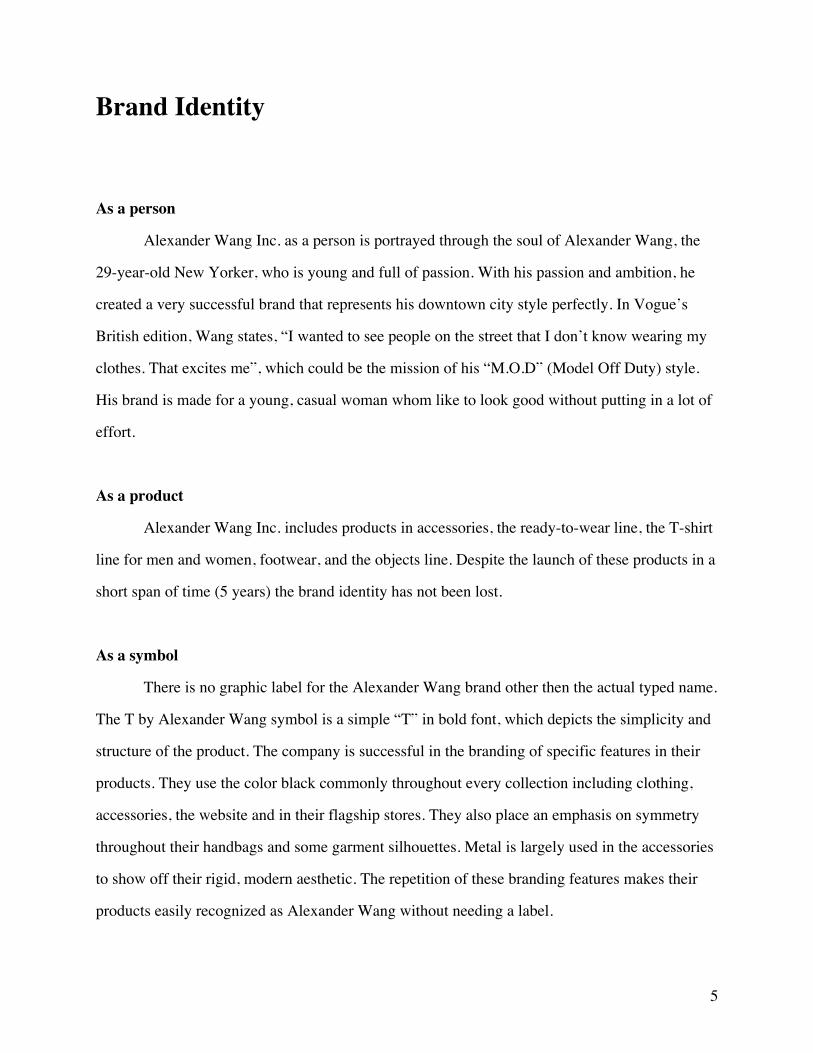
Brand Identity
As a person
Alexander Wang Inc. as a person is portrayed through the soul of Alexander Wang, the
29-year-old New Yorker, who is young and full of passion. With his passion and ambition, he
created a very successful brand that represents his downtown city style perfectly. In Vogue’s
British edition, Wang states, “I wanted to see people on the street that I don’t know wearing my
clothes. That excites me”, which could be the mission of his “M.O.D” (Model Off Duty) style.
His brand is made for a young, casual woman whom like to look good without putting in a lot of
effort.
As a product
Alexander Wang Inc. includes products in accessories, the ready-to-wear line, the T-shirt
line for men and women, footwear, and the objects line. Despite the launch of these products in a
short span of time (5 years) the brand identity has not been lost.
As a symbol
There is no graphic label for the Alexander Wang brand other then the actual typed name.
The T by Alexander Wang symbol is a simple “T” in bold font, which depicts the simplicity and
structure of the product. The company is successful in the branding of specific features in their
products. They use the color black commonly throughout every collection including clothing,
accessories, the website and in their flagship stores. They also place an emphasis on symmetry
throughout their handbags and some garment silhouettes. Metal is largely used in the accessories
to show off their rigid, modern aesthetic. The repetition of these branding features makes their
products easily recognized as Alexander Wang without needing a label.

6
As an organization
Alexander Wang Inc. is privately owned with no public stock. It’s still a family owned
and lead company and as stated in Santlofer’s book about Alexander Wang: “The company has
already spread its business globally with a very clear customer segmentation for the target
market” (Santlofer). This could be one of the leading reasons why the company has grown so
rapidly in such a short period of time. With the opening of their new flagship store in Beijing,
China in 2012, the Wang’s Asian family background and professional analysis/predictions of the
market made this a great business opportunity to help the expansion of their business globally.

7
Brand Identity Matrix

8
Current Positioning the Market Price/Quality Matrix
Price Research of the Market
Price
Qua
lity
Low
High
Low High

9
Alexander Wang’s close competitors in the market include Marc Jacobs, Michael Kors,
Chloe, and Chanel. They all distribute in most high-end department stores and have many retail
stores. They all use e-commerce sites and have their own websites to promote and sell their
products. These brands, however, have been in the market much longer then Alexander Wang,
and therefore have had more experience and a broader customer base. Alexander Wang has
managed to keep up with them in a shorter amount of time, which shows the potential the brand
has in the future.
$0
$500
$1,000
$1,500
$2,000
$2,500
$3,000
Fore
ver
21
Uni
qlo
Zara
RVC
A Ar
man
i Exc
hang
e To
psho
p G
ap
Juic
y Co
utur
e BC
BGM
axaz
ria
Amer
ican
App
arel
J.Cre
w
Alic
e an
d O
livia
Mic
hael
Kor
s Ra
lph
Laur
en
Mar
c Ja
cobs
Alex
ande
r W
ang
Chlo
e Ch
anel
Average Price of Clothing Average Price of Footwear Average Price of Accessories Average Price of Cosmetics

10
Market Analysis
Size of the market
Overview of the make-up industry
Based on the data from DATAMONITOR (see appendix1) there are three major cosmetic
markets throughput the world: Europe, Asia-Pacific, and the United States. The United States
accounts for 20.6% of the global make-up market Value, Europe accounts for 44%, Asia-Pacific
areas accounts for 23.2% and the rest of the world accounts for 12.3%. The U.S market, in
comparison to other areas, has the advantage of geographic unity; in addition, it accounts the
biggest market segmentation among the world as an individual country. Besides, our company
Alexander Wang Inc. was founded in the U.S. Because of these factors, we decided to choose the
U.S to be our first target geographic area to launch our cosmetic line.
United Make-up Market Segmentation 2005-2009

11
The make-up industry is divided into four major categories: the eye make-up, face make-
up, lip make-up, and nail make-up. In 2009, U.S area, the face make-up is the biggest, by
accounting for 36.1% of the total market value. The eye make-up has a share of 31.0% of the
market and then lip make-up has 22.3%, the rest, 10.7%, is nail make-up.
According to Gale American Industry Overview in 2011, the structure of retail products in the
make-up market could be divided into three classes, upscale, mid-level, and low-scale by
classifying their distribution channel and price matrix. The mid-level and low-scale products
sometimes are categorized as mass products and the upscale products are categorized as prestige
products.
Industry value and forecast
In 2005, make-up industry in the United States had a market value of $5577.6 million and
it had a trend of continuous growing pace. From 2005 to 2007 the growth rate was 3.3% and then
it had a decreasing rate from 2007 to 2009, 1.8% and 1.7%. The compound annual growth rate of
the market in this period was 2.5%. From DATAMONITOR's data, the forecast of the market
value in 2014 will be $6,592.8 million, the growth of 2009-2014 will be about 1.4%, and the
market has a trend of being stable.
United States Market Value 2005-2009

12
United States Market Value Forecast 2009-2014
Industry volume and forecast
In 2005, the volume of make-up market in the U.S had $722.3 million units. Then the growth
rate from 2005 to 2007 was 1.8% and it decreased in 2008, the rate was 0.9% and from 2008 to
2009 the growth rate was 0.8%. The growth rate from 2005 to 2009 was 1.3%. From the
forecast, the market volume will reach 784.7 million units in 2014 and the growth rate of 2009 to
2014 will be 0.6%
United States Market Volume 2005-2009

13
United States Market Volume Forecast 2009-1014
Market Share
There are four leading players accounting the majority of the market share, and the entire
industry has a trend of being concentrated. L'Oreal S.A. is the biggest company, generating a
26.7% share of the market's value. Estee Lauder Companies Inc., has 19.0% of the market share
and Revlon, Inc. accounts the 18.1%. Then the rest 36.1% separates to other companies.
Market
Analysis

14
Based on the factors of market segmentation, market volume and value in cosmetic
industry in the U.S, we could see that the U.S is a big market compared to other geographic
areas. Even though the overall growth rate is small our target geographic area still has greater
capacity to allow more companies to involve into the cosmetic industry.
Moreover, the majority of cosmetic industry was occupied by three companies, so that
our new line might have less chance to gain big market share but there are opportunities for us to
develop our products to be at the up-scale level and gain higher profits.

15
Key Players
The four leading and largest cosmetic companies in the U.S. Market are L’Oreal, Estee
Lauder, Revlon, and P&G; all which hold about three-fourths of the total market value in 2009
(75.7%).
L’Oreal S.A
The L'Oréal Group is the largest cosmetics company. It is based in France and operates
over 130 countries worldwide. Its cosmetic production comprises of 4 categories: fragrance,
make-up, hair, and skin care products. It has more than 23 well-known international brands in the
cosmetic segment as well as The Body Shop and dermatology (Datamonitor).
L’Oreal Cosmetics Segments (Excluding any Fragrances, Hair Care, and Dermatology)
Sales, L'Oréal S.A., 26.7, 27%
Sales, Estée Lauder
Companies Inc., 19, 19% Sales, Revlon
Inc., 18.1, 18%
Sales, P&G, 11.7, 12%
Sales, Others, 24.3, 24%
U.S. Makeup Market Value in 2009 $6,164.3 million.

16
* Brands that offer makeup and color cosmetics
Based on the company’ s brands offered and financial report from Datamonitor, leading
and well-known makeup brands like Lancome, YSL Beaute, Giorgio Armani Beauty, and Urban
Decay are potential competitors to Alexander Wang beauty extension line. YSL Beaute and
Armani Beauty are designer’ s extension line (beauty) and focus on makeup and color cosmetics,
while Lancome focuses more on its fragrance and skin care lines. Compared to Alexander Wang
Inc, which has a fresher and modern aesthetic, both YSL Beaute and Armani Beauty are rather
Types of Merchandise
Brand Names
Distribution Channels
Consumer Products
L’Oreal Paris*
Garnier
Maybeline New York*
Softsheen Carson
Essie*
Le Club des Creatures de Beaute*
- Mass Merchandiser - Beauty Superstores - Drug Stores - Supermarket -E-commerce
Luxury Products
Lancome*
YSL Beaute*
Armani Beauty*
Helena Rubinstein*
Biotherm
Shu Uemura
Kiehl’ s
Urban Decay*
- Premium Department Stores (Nordstorm, Belk, Macy’s, Barney’ s New York) - High-end Outlets (Saks Fifth) - Brands’ Own Boutiques - Travel Retails - Brands’ Websites - E-commerce

17
considered classic cosmetics and also have higher price points. Today L’Oreal is still the largest
company that dominates and specializes in the cosmetic industry. It has a large amount of
financial resource to spend on media especially in advertising (television commercials,
magazines, and Internet) which is the most important promotional tool in the beauty market.
However, L’ Oreal is still subjected to lose market share in prestige and designers’ name
cosmetics segment. Makeups in consumer products segment such as L’ Oreal Paris and
Maybeline New York are negligible since they have different price lines, distribution channels,
and target markets.
Estée Lauder Companies, Inc.
Estée Lauder is the second largest cosmetics and beauty company based in New York
City. It markets as well as manufactures makeup, skin care, hair care, and fragrance products
over 140 countries. It also has wholly-owned offices in 43 countries worldwide.
Estée Lauder Cosmetics Segments (Excluding any Fragrances, Hair Care, and Dermatology)
* Brands that offer makeup and color cosmetic
Types of Merchandise
Brand Names
Distribution Channels
Mid-Premium Luxury
Products
Bobbi Brown*
Estee Lauder*
M.A.C.*
Clinique
Aramis
Jo Malone
La Mer
La Series
- Premium Department Stores (Nordstorm, Belk, Macy’s, Barney’s New York) - High-end Outlets (Saks Fifth) - Brands’ Own Boutiques - Travel Retails - Brands’ Websites - E-commerce

18
While the company emphasizes skin care and fragrances more, Estée Lauder, M.A.C.,
and Bobbi Brown are still leading brands that dominate makeup and color cosmetics segment.
M.A.C. and Bobbi Brown would be considered major competitors but may have slightly lower
price to Alexander Wang’s beauty line since they both are considered artistry cosmetics rather
than designers’ lines. Both brands, however, share similar aesthetics in terms of product,
packaging, and store design (minimal, sleek, edgy, and dark)
Revlon, Inc.
According to Datamonitor, Revlon, Inc. is the third largest cosmetics and beauty
company. Unlike the other top players, Revlon offer very few skin care products but highly
emphasizes on their makeup and color cosmetics segment. The company operates in 14 countries
outside the U.S. with products distributed and sold over 100 countries worldwide. The company
sells their cosmetics under its Revlon brand. Leading product brands are makeup such as
ColorStay, Revlon Age Defying, Revlon Beyond Natural, Revlon Matte, and Revlon Super
Lustrous. Recently in 2009, the company launched its mineral makeup collection under the brand
name ColorStay. Unlike L’Oreal and Estee Lauder, the majority of Revlon’s target consumers
are considered mass market and thus the company distributes its products through mass retailers,
chain drug store, as well as certain department stores (Datamonitor).
P&G Co.
From P&G’s 2009 official financial report, the company generated total revenue at $114
billion. The revenue from the beauty segment (including skin care, makeup, and hair care)
accounted for 23% of the total revenue or $26.3 billion. The company had 14.3% on profit
margin or $3.76 billions. The cosmetic brand that generated the most profit in makeup lines was
CoverGirl. It was the largest color cosmetic brand in the U.S. The cosmetic products are sold
primary in drugstores, convenience stores, and supermarkets targeting the mass market. In 2008,
CoverGirl LashBlast mascara was the company’s strongest eye makeup product and took much

19
share from L’Oreal’s Maybeline. P&G spends around 10% of its budget on digital marketing.
Celebrity endorsement and advertising is the company’s main promotional tool. CoverGirl’s
main competitor is L’Oreal’s brand Maybeline New York. Another P&G’s makeup brand is Max
Factor which sells products primary in Europe. Both CoverGirl and Max Factor represented
around 6% of the company’s total revenue.
Other competitors that sell their cosmetic products in drugstores and supermarkets are
Revlon, Almay, L’oreal, NYC Cosmetics, and Wet ‘n’ Wild Cosmetics.
Other private brands
Other private brands that had 24% of total market share in 2009 included Avon,
Neutrogena (Johnson & Johnson), Benefit Cosmetics, Illamasqua, Eye Lips Face (ELF), Stila,
Clarins, and Nars.
Marc Jacobs Beauty
Marc Jacobs just recently launched his new beauty line in September 2013. The first
beauty store was launched in Manhattan as well as the color collections and custom-designer
fixtures in 11 existing Marc Jacobs locations. There are currently about 300 Marc Jacobs store
globally and Robert Duffy, CEO of Marc Jacobs International, L.L.C., stated that more beauty
sections will be added to the stores soon. Marc Jacobs Beauty also distributed its product at 330
Sephora freestanding stores in North America. The beauty line generated around $1 million sale
in just two weeks with mascara and liquid eyeliner being the best sellers. It is projected that the
color collection will generate $ 15 million at retail from August through December and $20
million at retail at the end of 2014. The makeup line is expected to be launched in Europe in
2014 as well with the Middle East and Asia to follow. The product mix consists of four
categories: eye, lip, face, and nail (Irdale and Naughton).
20
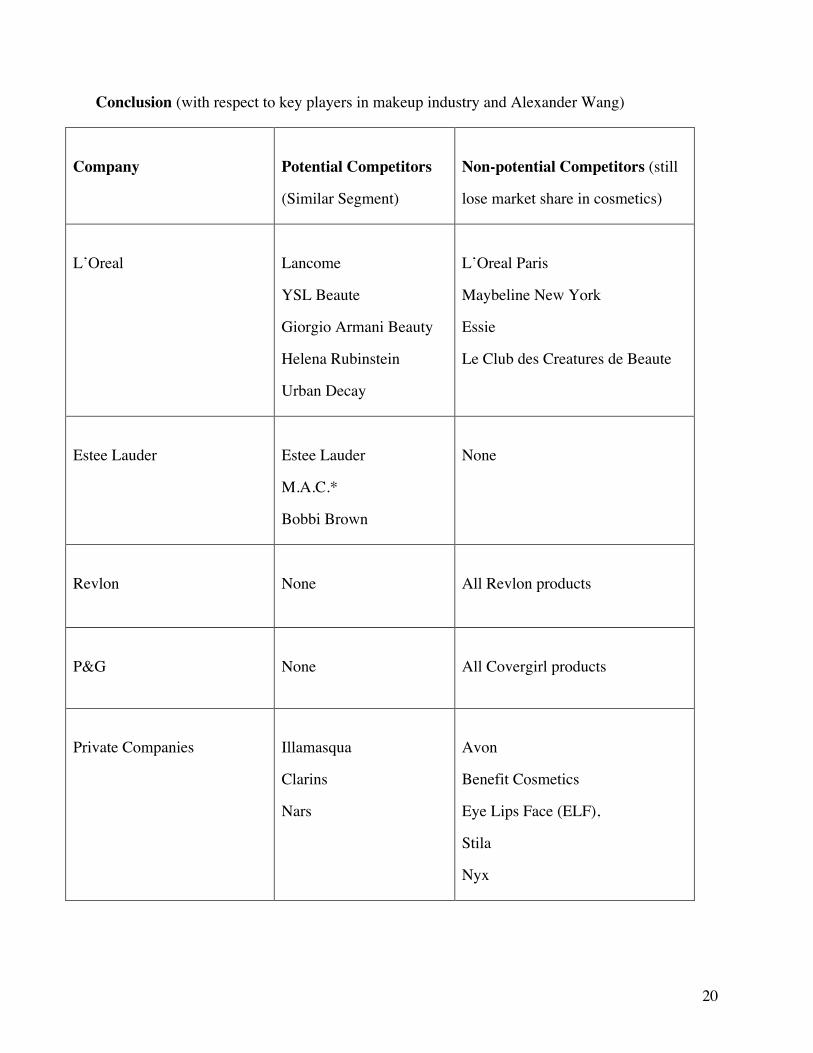
Conclusion (with respect to key players in makeup industry and Alexander Wang)
Company
Potential Competitors
(Similar Segment)
Non-potential Competitors (still
lose market share in cosmetics)
L’Oreal
Lancome
YSL Beaute
Giorgio Armani Beauty
Helena Rubinstein
Urban Decay
L’Oreal Paris
Maybeline New York
Essie
Le Club des Creatures de Beaute
Estee Lauder
Estee Lauder
M.A.C.*
Bobbi Brown
None
Revlon
None
All Revlon products
P&G
None
All Covergirl products
Private Companies
Illamasqua
Clarins
Nars
Avon
Benefit Cosmetics
Eye Lips Face (ELF),
Stila
Nyx

21
Designers’ lines
Chanel
Dior
Dolce&Gabbana Beauty
Marc Jacobs Beauty
None
Alexander Wang will rarely compete with make-up brands at mass-market level, such as
Covergirl and Revlon, since its products target at different consumers, have higher price range,
and are distributed at different segment retailers. Most of the competitive brands are prestige
products with unique designs and premium quality. Designers’ names and aesthetics are
commonly used as selling point. Classic designer brands like Chanel, Dior, YSL, Armani have
higher price range, while artistry brands like MAC, Illamasqua, Nars, and Urban Decay are
lower. Lancome, Estee Lauder, and Clarins are operated under the companies that primarily
specialize in cosmetics. Even though these competitive brands have different price points, they
are still distributed at the same or similar retailers such as premium department stores
(Nordstorm, Belk, Macy’ s, Barney’ s New York), high-end outlets (Saks Fifth), travel retails
(Airports, Duty Free shops). For example at a premium department store, MAC and Chanel
cosmetics may have their concessions next to each other; either brand can attract the customers
at the moment regardless of different price lines and thus they are subjected to compete each
other for market share in makeup.
Marc Jacobs Beauty may be the most relevant competitor to Alexander Wang’s beauty
line since their brands target toward the similar age group of young consumers or the millennial.
Marc Jacobs and Alexander Wang may share very similar price ranges, products design and
aesthetics because their characteristics are considered modern and young. Since both brands
possess very talented designers and earn their recognition and popularity in the recent years, they
are still subjected to compete each other at the cosmetics level. However, Marc Jacobs has higher

22
competitive advantage in terms of the company’s size and popularity. While Marc Jacobs gears
toward the younger millennial group, Alexander Wang may gain advantage from the older
millennial; however, they can still share the overlapped age group of consumers.
Potential Competitors (with respect to Alexander Wang beauty line)
Types of Makeup
Brands
Classic Designers
Chanel
Dior
YSL
Armani Beauty
Helena Rubinstein
Modern Designers
Dolce&Gabbana
Marc Jacobs Beauty
Premium Artistry
MAC
Illamasqua
Lower-Premium Artistry
Urban Decay
Nars
Cosmetic Specialists
Estee Lauder
Clarins

23
Financial and investment analysis
L’Oreal generated total revenues of $ 24.3 billion (2009) with $22.6 billion in cosmetics
segment (93% of total revenues) The company’s net income was around $2.5 billion. The U.S.
market accounted for 24.4% of the total revenue or around $5.9 billion. The company had 10.3%
profit margin (Datamonitors).
Estée Lauder generated total revenue around $7.3 billion at the end of June 2009 with net
income at $ 218.4 million. The revenue from makeup segment accounted for $2.8 billion (38%
of the total revenue). The lower net sales from the company’s heritage brands and the makeup
artist brands were the causes of revenue decline in the recent years. The U.S. market accounted
for 41.2% of the total revenue (around $3 billion) The company also had 3% on profit margin in
2009 (Datamonitor).

24
Revlon, Inc. generated $1.3 billion at the end of December 2009. The company earned
total net income at $48.4 million. The revenue from beauty care and fragrance accounted for
$510,4 million (39.4% of total revenue). The decline in revenue came from lower net sales of
certain makeup products. The U.S. market accounts for 57.7% of the total revenue or around
$747.9 million. The company had 3.8% on profit margin. The revenue growth has decreased
since 2006 (Datamonitor).

25
2009 Financial Report L’Oreal Estee Lauder Revlon
Revenue (Billions $) 24.3 7.3 1.3
US Revenue (Billions $) 5.93 3 0.75
Revenue Growth Flat/Slight Decrease
Profit Margin Slight Decrease Dramatic Decrease Slight Decrease
Impact on profit margin (from both L’Oreal and Estee Lauder’s 2009 annual report)
- Increase in operation expense
- Decrease in net sales
- Recession / uncertain economic environment
- Exchange rate / depreciation and losses from foreign exchange transaction
- Higher cost of global IT system

26
Forecast
According to Datamonitor:
Compound annual growth rate from 2009-2014: flat/ slight decrease
Slight increase in market value or 7% in 2014
As a new entrant in makeup market, Alexander Wang will launch its makeup line only in
the U.S. during the first 6 months. Like Marc Jacob Beauty, if Alexander Wang could get shelf
space at Sephora, there is a chance the company will get market share up to $1-1.5 million in
sales for the first month after launch, and around $7 million at the end of six-month period
(assuming that Marc Jacobs and Alexander Wang will share equal shelf space) However, if the
company decides to expand and sell its products oversea, it will be subjected to impacts like
exchange rate and global costs which might lead to decrease in net sales as well as high costs and
expenses.

27
SWOT Analysis
Strengths!- Brand Loyalty!- Emerging and talented designer!- Unique and modern design!- The designer’s name is brand identity!- Very fast growing company!- Strong product differentiation!- No need to compete with mass market segment!- Financial resource!- Private and Family Owned Company!-High potential in creating extension or diffusion lines.!- Perceived high quality products!
Weaknesses!- Very small market share at the early stage!- Low economies of scale!- Fewer relationship with manufacturers and retailers compared to other brands!- No experience in cosmetics production!- Not owning or manufacturing the products and depending on cosmetic manufacturers!- Low ability to bargain with suppliers!- High advertising and media cost!- Need to negotiate with retailers for self space!
Opportunities!- Fashion is a major influence on the cosmetic industry!- Consumers differentiate themselves through styles and brands of makeup products offered!- Consumers prefer designer brands over retailer or generic brands!- Stable and slightly growing market growth!- High growth of beauty superstores such as Sephora!- Being less subjected to price war.!- Recession-proof products !- Huge market size!- Cosmetics are main financial resources for major fashion companies.!
Threats!- Very high competition and pressure from the larger and well-established key players in cosmetic industry.!- Competition with other designer beauty lines (Marc Jacobs, YSL Beaute, Chanel)!- Being subjected to acquisition from larger companies. (Armani Beauty YSL to L’Oreal)!- Customers’ demand in safety and organic certification. (Higher cost)!- Green movement causing limited use in certain raw materials (microbead)!
28
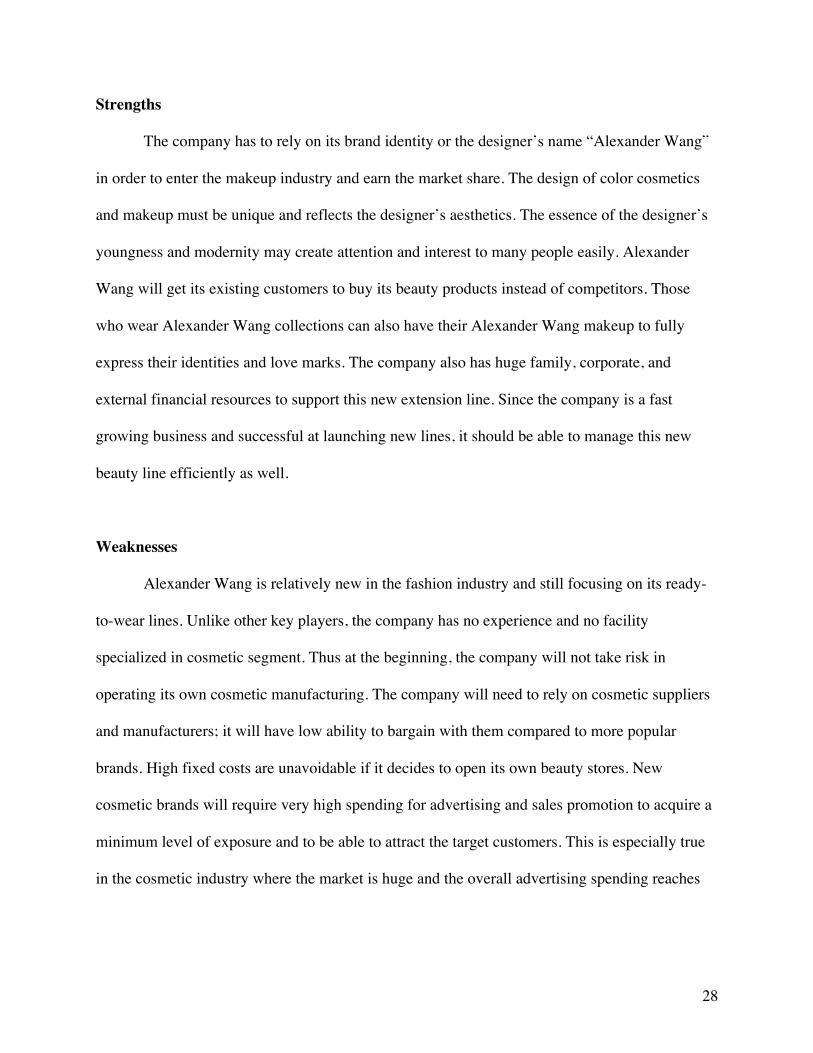
Strengths
The company has to rely on its brand identity or the designer’s name “Alexander Wang”
in order to enter the makeup industry and earn the market share. The design of color cosmetics
and makeup must be unique and reflects the designer’s aesthetics. The essence of the designer’s
youngness and modernity may create attention and interest to many people easily. Alexander
Wang will get its existing customers to buy its beauty products instead of competitors. Those
who wear Alexander Wang collections can also have their Alexander Wang makeup to fully
express their identities and love marks. The company also has huge family, corporate, and
external financial resources to support this new extension line. Since the company is a fast
growing business and successful at launching new lines, it should be able to manage this new
beauty line efficiently as well.
Weaknesses
Alexander Wang is relatively new in the fashion industry and still focusing on its ready-
to-wear lines. Unlike other key players, the company has no experience and no facility
specialized in cosmetic segment. Thus at the beginning, the company will not take risk in
operating its own cosmetic manufacturing. The company will need to rely on cosmetic suppliers
and manufacturers; it will have low ability to bargain with them compared to more popular
brands. High fixed costs are unavoidable if it decides to open its own beauty stores. New
cosmetic brands will require very high spending for advertising and sales promotion to acquire a
minimum level of exposure and to be able to attract the target customers. This is especially true
in the cosmetic industry where the market is huge and the overall advertising spending reaches
29
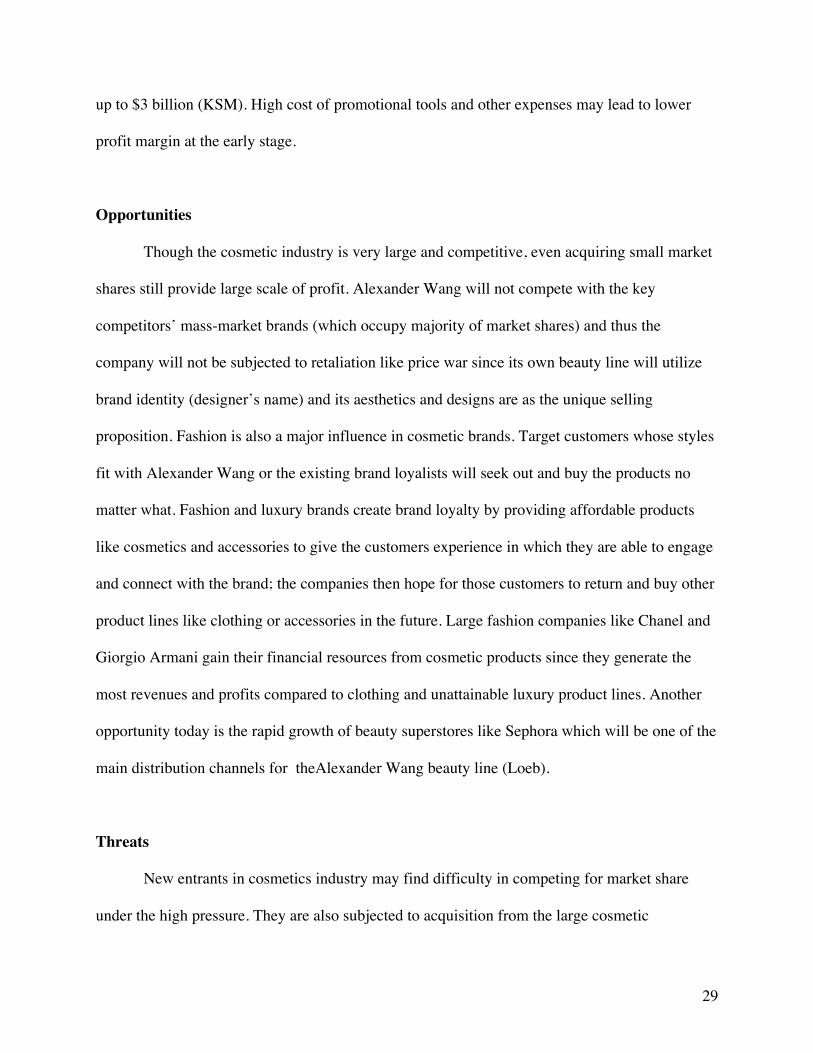
up to $3 billion (KSM). High cost of promotional tools and other expenses may lead to lower
profit margin at the early stage.
Opportunities
Though the cosmetic industry is very large and competitive, even acquiring small market
shares still provide large scale of profit. Alexander Wang will not compete with the key
competitors’ mass-market brands (which occupy majority of market shares) and thus the
company will not be subjected to retaliation like price war since its own beauty line will utilize
brand identity (designer’s name) and its aesthetics and designs are as the unique selling
proposition. Fashion is also a major influence in cosmetic brands. Target customers whose styles
fit with Alexander Wang or the existing brand loyalists will seek out and buy the products no
matter what. Fashion and luxury brands create brand loyalty by providing affordable products
like cosmetics and accessories to give the customers experience in which they are able to engage
and connect with the brand; the companies then hope for those customers to return and buy other
product lines like clothing or accessories in the future. Large fashion companies like Chanel and
Giorgio Armani gain their financial resources from cosmetic products since they generate the
most revenues and profits compared to clothing and unattainable luxury product lines. Another
opportunity today is the rapid growth of beauty superstores like Sephora which will be one of the
main distribution channels for theAlexander Wang beauty line (Loeb).
Threats
New entrants in cosmetics industry may find difficulty in competing for market share
under the high pressure. They are also subjected to acquisition from the large cosmetic

30
companies. (Even fashion brands like YSL and Giorgio Armani operate their beauty lines under
L’Oreal) Customers’ demand in safety and organic products are also rising. The company must
ensure those qualities with the suppliers and manufacturers. Corporate social responsibility is
also a major issue in many businesses today, especially large and international corporations.
Alexander Wang must be very careful with issues like product testing and labor conditions that
might be able to create a negative image since the company used to get involved with such
lawsuits.

31
PESTEL
Political Factors
Democratic and Stable
The U.S government is known for being democratic, fair and transparent policies. U.S is a
developed country with a stable society, and the government is open and welcome to the
development of new businesses. This government attitude could reduce the barriers for us to
launch the new product line.
Well-Organized Government Structure
In the United States, even the federal laws are mostly enacted by Congress, they still
authorize certain government agencies to create regulations. There are two major organizations
that are involved in the cosmetic, toiletry and fragrance industry: the CTFA and FDA. Each
agency has its clear responsibility and authority
Cosmetic, Toiletry and Fragrance Association
The CTFA stands for Cosmetic, Toiletry and Fragrance Association, was founded in
1894 and majorly provides the services of scientific, legal, regulatory, and legislative and also
represents manufactures, distributors and industry suppliers. The Cosmetic Ingredient Review
(CIR), conducted by a panel of scientific and medical experts, was developed under the CTFA’s
sponsorship in the mid-1970s and it gathers information about ingredient safety and makes the
information available to manufacturers.
FDA and Its Regulation
The FDA stands for Food and Drug Administration. This organization involves in the
industry of food, drugs, medical devices, radiation-emitting products, vaccines, blood and
32
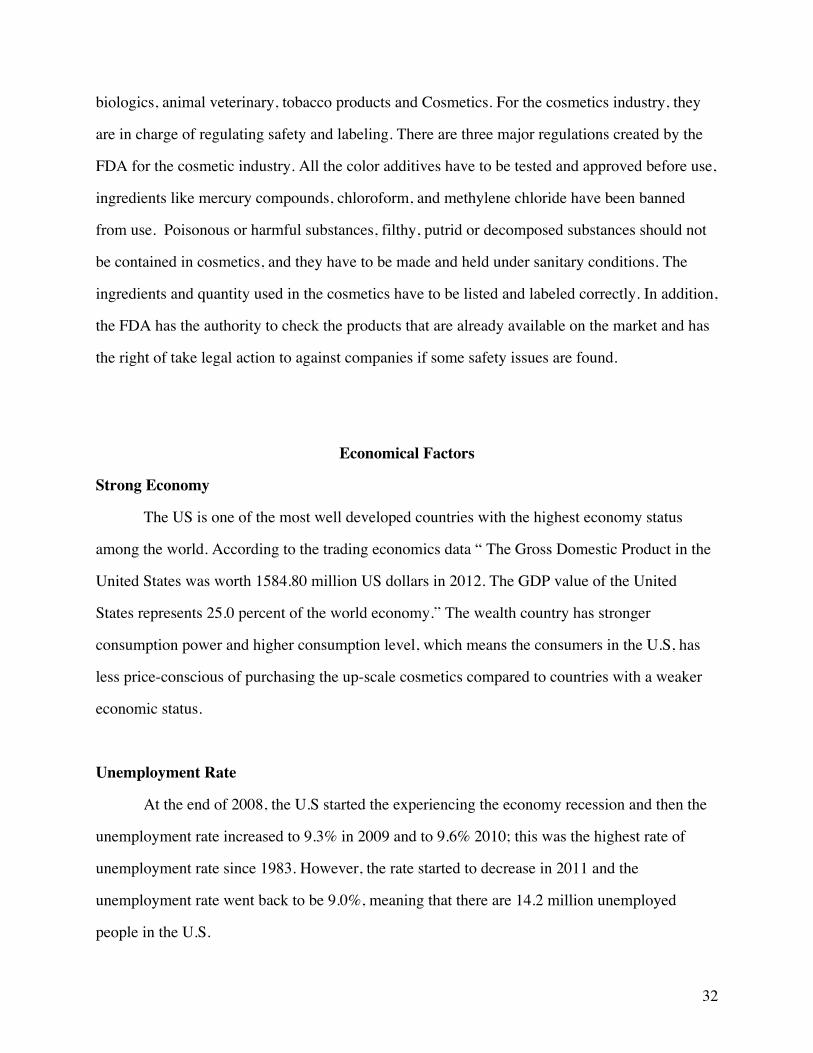
biologics, animal veterinary, tobacco products and Cosmetics. For the cosmetics industry, they
are in charge of regulating safety and labeling. There are three major regulations created by the
FDA for the cosmetic industry. All the color additives have to be tested and approved before use,
ingredients like mercury compounds, chloroform, and methylene chloride have been banned
from use. Poisonous or harmful substances, filthy, putrid or decomposed substances should not
be contained in cosmetics, and they have to be made and held under sanitary conditions. The
ingredients and quantity used in the cosmetics have to be listed and labeled correctly. In addition,
the FDA has the authority to check the products that are already available on the market and has
the right of take legal action to against companies if some safety issues are found.
Economical Factors
Strong Economy
The US is one of the most well developed countries with the highest economy status
among the world. According to the trading economics data “ The Gross Domestic Product in the
United States was worth 1584.80 million US dollars in 2012. The GDP value of the United
States represents 25.0 percent of the world economy.” The wealth country has stronger
consumption power and higher consumption level, which means the consumers in the U.S, has
less price-conscious of purchasing the up-scale cosmetics compared to countries with a weaker
economic status.
Unemployment Rate
At the end of 2008, the U.S started the experiencing the economy recession and then the
unemployment rate increased to 9.3% in 2009 and to 9.6% 2010; this was the highest rate of
unemployment rate since 1983. However, the rate started to decrease in 2011 and the
unemployment rate went back to be 9.0%, meaning that there are 14.2 million unemployed
people in the U.S.

33
Recession and Its Recovery
U.S has its strength as a well-developed economy but the economy was involved in some
big recessions in the past. The latest one is the recession in 2008 and it lasted for two consecutive
years. Then the U.S government took the action of bring the massive fiscal stimulus to recover
the economic status from the recession and in 2011. Currently the economy status has been
recovered from the recession and is back on track, with a stable growth rate.
The cosmetic industry is not influenced by the economic situations easily. During the past
recession in 1930, it established the “recession proof” image and it didn’t fluctuate much in the
1960s and 1980s recession either. Moreover, during the recent recession in the early 2000s, the
market started to be resuscitating and the cosmetic industry was one of the industries in the
fastest pace, it grew from $11.8 billion in 2003 to $13 billion in 2005 and the growth is
continuing with the recovery of the economy.
No matter how much the economy fluctuates, women still wear the make-up. Make-up
products are usually considered as inexpensive and small objects which lead the price conscious
to be weak for the cosmetic products.

34
Social Factors
Income distribution
Income distribution in different age groups
The age group from 45-54 has the highest median income and age group of 15-24 has the
lowest median income from the record in 2011 and 2012 in the U.S. Overall the median income
has a trend of growing up from 2011 to 2012 in every age group.
Income distribution in different region
0
10,000
20,000
30,000
40,000
50,000
60,000
70,000
Median income in 2011
Median income in 2012
15-24 years 25-34 years 35-44years 45-54 years 55-64 years 65 years and older
44,000 46,000 48,000 50,000 52,000 54,000 56,000
Median income in
2011
Median income in
2012
Northeast Midwest South West
35
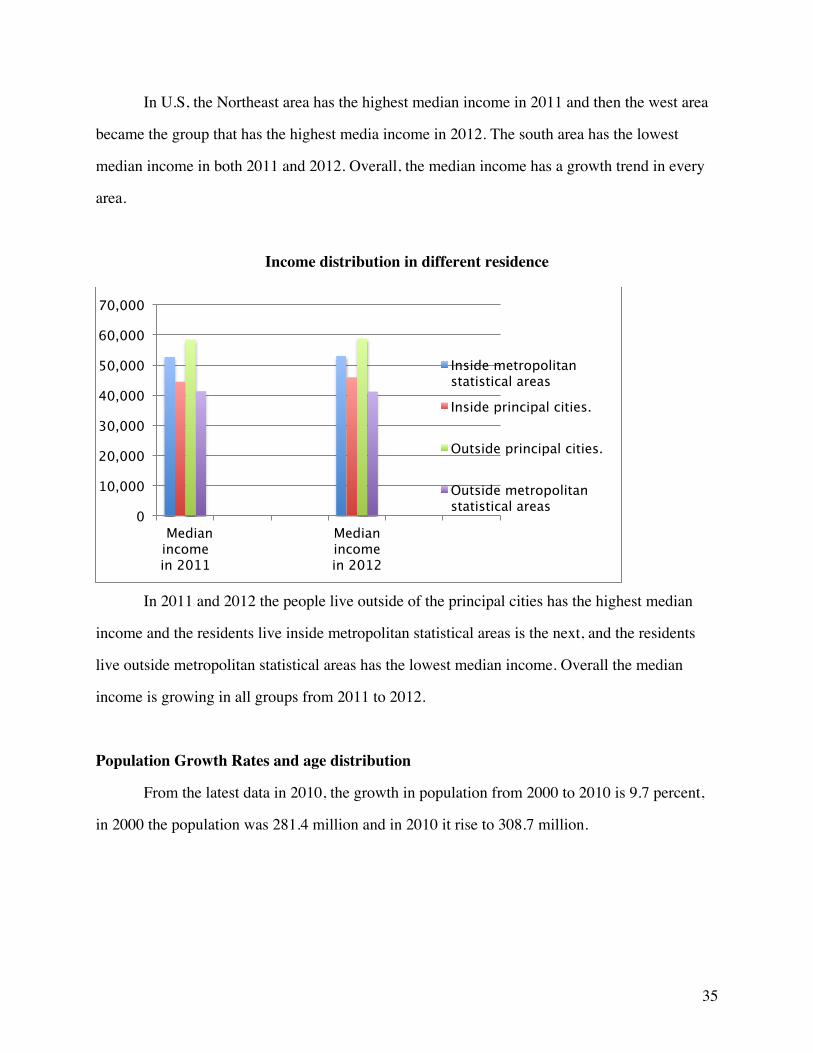
In U.S, the Northeast area has the highest median income in 2011 and then the west area
became the group that has the highest media income in 2012. The south area has the lowest
median income in both 2011 and 2012. Overall, the median income has a growth trend in every
area.
Income distribution in different residence
In 2011 and 2012 the people live outside of the principal cities has the highest median
income and the residents live inside metropolitan statistical areas is the next, and the residents
live outside metropolitan statistical areas has the lowest median income. Overall the median
income is growing in all groups from 2011 to 2012.
Population Growth Rates and age distribution
From the latest data in 2010, the growth in population from 2000 to 2010 is 9.7 percent,
in 2000 the population was 281.4 million and in 2010 it rise to 308.7 million.
0
10,000
20,000
30,000
40,000
50,000
60,000
70,000
Median income in 2011
Median income in 2012
Inside metropolitan statistical areas Inside principal cities.
Outside principal cities.
Outside metropolitan statistical areas

36
From the data of age distribution from 1960 to 2010, the median age changed from 29.5
to 37.2, the U.S has a trend of ageing.

37
Social Mobility and Education
The mobility of people in the U.S is not high, the age group from 18 to 24 has the biggest
mobility and other than that, other groups are more stable.
People age over 18, 30% of them have graduated in for high school and 18% of them
have graduated college and obtained bachelor degree, and 9.8% percent of people obtained
higher degree. The overall education level in the U.S is considered as high.
Attitude towards cosmetic and fashion
From the previous economic recession, and also the period of abundance, people started
to pursuit low cost products like fast fashion or counterfeit cosmetics instead of high quality
products. This trend could be a one of the threats to gain the market share.
(United States Census Bureau)
Technological Factors
Focus on reformulating products to rely on natural products
Because of the macro development of technology the consumers are becoming more educated
on choosing their products that’s good for them. The overall trends of going green also
influenced the cosmetic industry, and consumers are pursuing the green products. The research
and technological improvements should focus on vegetable and plant materials instead of
synthetic chemicals to satisfy consumer’s demands for mildness and reduced toxicity.
Short life cycle and fast path of technological obsolescence
In the time of abundance period, there are more products available on the market than the actual
demand from consumers and also the high technology were developed to provide more channels
for people to receive information and compare the products. These factors could influence the
life cycle and obsolescence for the products and this also apply to the cosmetic industry.

38
U.S is in the leader place of innovation
In our target country, the United States has strength of being as one of the leaders in the
technology innovation since the World War II. The technical strength could benefit the cosmetic
industry as well. It might be more opportunities to involve high technology into the cosmetic or
make-up and skin care tools. Besides, popularize of using high technology could provide better
e-commerce and advertising channels.
The growth of pharmaceutical markets
From the country analysis the pharmaceutical markets have a growing trend in the U.S.
Mean while, the cosmeceutical (cosmetics and pharmaceutical) had big market share and
consumer popularity in Europe and Asia but not yet U.S. These types of products might have a
chance to be developed and spread with the trend of “going-green”.
Color IQ by Sephora
Sephora developed the best beauty invention of the year in 2013, the Pantone color IQ,
the device they developed could scan your face and found out what the color of customer’s skin
and then help the customer to find out the right products in right color to match their skin.
Environmental Factors
“going green” trend
Many surveys demonstrated the increase of consumer awareness for the environmental
issues, and there are three major concerns from the consumers, animal right, availability of clean
air and water, and waste management.
Well-establish environmental policies
The United States has a well-established environmental policy framework both federal
and state. The Environmental Protection Agency (EPA) is the agency under the federal
government that protect human health and environment and the smaller agencies exist under
them take control of manage the water, air and waste. The Clean Air act was one of the major

39
regulations established to improve the air quality.
Poor performance
Even the U.S is in a leading place among many areas in the world, but the environmental
performance is not satisfactory. The U.S government is trying to find the solution or develop
new technologies to improve current status.
Animal Testing
The animal right is one of the major concern from environmental aspect. In cosmetic
industry, the animal testing is the major issue that receiving against voice and complains from
consumer. However according to CTFA, the cosmetic, toiletries and Fragrance Association, this
issue cannot be avoided and they believe that human health and safety is more important.
Recyclable products and energy
Under the trend of going green the recyclable products and energy is favored. Even the
ingredients of cosmetic are either nature or synthesized, the package of the products could use
more recyclable material and provide consumer a more green and environmental concerned
impression.
Legal factors
Well-established legal framework for business in the U.S
The legal framework in the U.S has been well-established, and each state has its
individual state laws function with the federal law system. This complete system gives the clear
guide of what is allowed and what is not for the business which could protect the overall
environment and avoid vicious competition.
Multiplicity of state laws
Besides the federal law system, the state laws in the United States varies in region, and
this gives difficulty for business to expand and follow the laws in different state at the same time.

40
FDA labeling regulations
FDA, the food and drug administration, have a specific labeling regulation for cosmetic
industry and FDA states “The FD&C Act prohibits the marketing of adulterated or misbranded
cosmetics in interstate commerce”. All the ingredients and quantity has to be clearly labeled.
Foreign investment is favored in the U.S
The U.S is the largest direct foreign investment receipt among the world, and the U.S
government has an open attitude to the investment. This policy could bring more chances for
business to obtain financial support from other countries and also might attract investor from
foreign country to start the business in the U.S.

41
Porter’s 5 Forces
The following information refers primarily from Datamonitor See Appendix
Competitive Rivalry: Moderate!- Top companies at luxury level focus their production more on skin care and fragrances.!- In U.S., major companies diversify their products geographically.!- Top players hold 75% of the total market share.!- Other 25% contains global and recognizable brands including designers’ beauty lines.!- Large cosmetic companies have their own facilities specialize in product development and SCM.!- High fixed cost for new companies.!
Bargaining Power of Suppliers: Moderate!- Raw materials like chemical and mineral products for cosmetics are commonly available.!- Cosmetic products can be produced with many alternative raw materials.!- Switching suppliers (manufacturers) have very little negative consequence to the production.!- Suppliers (manufacturers) are large in scales!- Raw material suppliers are not dependent solely to the cosmetic manufacturers. The same goes with cosmetic manufacturers where they are not dependent to the retailers.!
Bargaining Power of Customers: Moderate to High!- Retailers have strong position as distributors!- Consumers differentiate themselves through different styles and brands.!- Company is obliged to offer products that are in trend and needed by the customers.!- Customers have multiple brands to choose from.!- The larger the retailers, the greater the power customers have.!
Threat of New Entrant: Moderate to High!- The strength of brand identity, brand loyalty, and differentiations are the keys to prevent threats from the larger companies.!- Designer and fashion names for cosmetics can negate the competition at mass-market level.!- New Entrants may be able to target niche markets.!- Low economies of scale.!- Products are subjected to price war from the similar brands.!- Less power in fighting for shelf space.!- New Entrants have difficulty in international expansion.!
Threat of Substitution: Low!- Very few substitutions for makeup.!- Designer names make it impossible for substitution.!- People who disinterest in brand name may choose other brands that offer the same types of products. (Old people)!- People may use natural and traditional cosmetics instead of manufactured products!

42
Bargaining Power of Suppliers - Moderate
From the Datamonitor, it rather explains the relationship between raw material suppliers
and the company that will manufacture its own products. For this case, Alexander Wang is not a
manufacture and the company will not operate its own cosmetic manufacturing facility since it
would cost too much. Based on this case, we can assume that the company has to rely on
cosmetic manufacturers for the production. The manufacturers will have bargaining power with
Alexander Wang. Since manufacturers are commonly available, switching manufacturers may
not affect the company’s production. Manufacturers are not dependent solely on Alexander
Wang since there are more private cosmetic brands that are willing to do business with them.
Bargaining Power of Customers – Moderate to High
Alexander Wang is likely to distribute its beauty products through its own stores and
Sephora. At Sephora, customers would have many brands to choose from. The larger the store,
the more cosmetics brand Sephora will offer. Besides the shelf space and display, Alexander
Wang needs to offer unique colors and designs in order to attract potential customers from other
brands, especially Marc Jacobs Beauty. At Alexander Wang Store, customers are obliged to buy
its product, while at Sephora, the customers who are more price-conscious may choose other
brands that have similar qualities or colors.
Threat of New Entrant – Moderate to High
Distribution channels for Alexander Wang’s beauty line in the U.S. are limited when
compared to other brands like Marc Jacobs Beauty. Other than Sephora, Alexander Wang has
only few stores in the U.S. that can install the makeup section. However, Alexander Wang does
not have to compete on price with mass-market brands. The company will target to niche market
at the early stage since the company has very low economies of scale. The only concern is that
the company will subjected to compete and spend on promotional tools to attract potential

43
consumers. As soon as the beauty line grows more, the company hopes to be able to open more
beauty stores as well as gain more shelf space at other high-end retailers.
Threat of Substitution - Low
There is rarely any alternative product to makeup, unless people decided to use natural
and traditional cosmetics from plants such as raw flower dye for blush or tree bark powder.
Companies or designers offer unique packaging designs in which it’s impossible for brand
loyalists to change. However, those who do not have brand loyalty may buy other designer’s
brand based on the similar value of makeup, for example a girl may buy either Chanel or YSL
lipsticks but not L’ Oreal Paris lipstick since it’s considered as a mass-market product;
Alexander Wang beauty line may also face this kind of situation. People who are disinterested in
brand names like senior citizens may choose other brands that offer the same types of products
regardless of the brand names.
Competitive Rivalry - Moderate
Alexander Wang may not be able to compete the top players since the company is small
and not specialized in cosmetics. The company can disregard high fixed cost since it won’t likely
to own its cosmetic manufactures. However, top companies like L’Oreal and Estee Lauder are
now focusing more on skin care and fragrance segments; with the rapid growth of the company,
it is an opportunity for Alexander Wang to focus on makeup and gain some share from the 25%
of the market. The company will have to compete with other designers’ cosmetic lines that are
more popular, such as Marc Jacobs Beauty and YSL Beaute. Again, Alexander Wang needs to
rely on its unique designs, name, and brand loyalty.

44
Positioning for Extension
Price Matrix

45
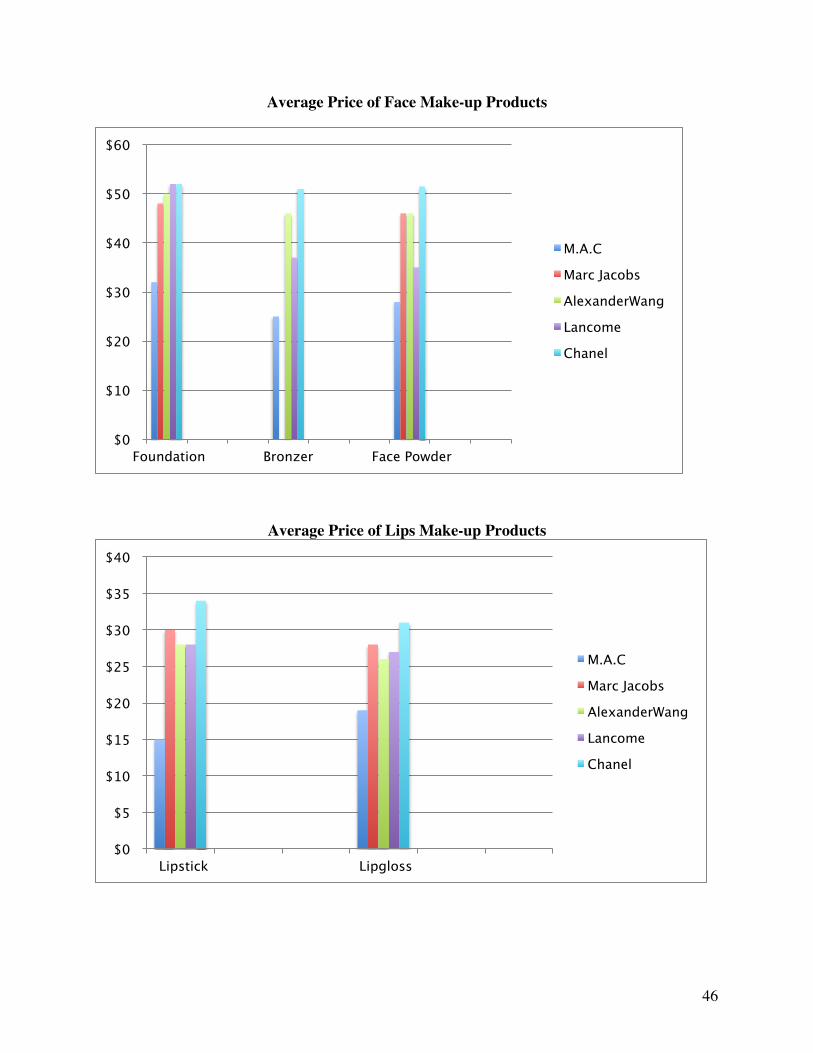
By analyzing the market and the market, and from the price and quality matrix we
selected the major competitors that really close to our market position and target customers, to be
M.A.C, Marc Jacobs, Lancome and Chanel. We chose M.A.C because of their similar aesthetic
to our company in the packaging design and we have the target customer in the younger age.
Marc Jacobs is the most direct brand we are competing to, they started from fashion then extend
the beauty line just several months ago. Lancome is one of the biggest cosmetic brands and has
similar price level to us, and the Chanel gained its fame in fashion industry too and it’s one of the
most high-end cosmetic brands. From these reasons, we chose these four companies to compare
the price.
Average Price Of Eye Makeup Products
$0
$10
$20
$30
$40
$50
$60
$70
Mascara Liquid Eyeliner Pencil Eyeliner Single Eyeshadow Basic Eyeshadow Set
M.A.C
Marc Jacobs
AlexanderWang
Lancome
Chanel
46
Average Price of Face Make-up Products
Average Price of Lips Make-up Products
$0
$10
$20
$30
$40
$50
$60
Foundation Bronzer Face Powder
M.A.C Marc Jacobs AlexanderWang Lancome Chanel
$0
$5
$10
$15
$20
$25
$30
$35
$40
Lipstick Lipgloss
M.A.C Marc Jacobs AlexanderWang Lancome Chanel

47
Average Price of Brushes
The price of Lancome and Marc Jacobs is very close and this is also where our price ranges is,
but lower than Chanel but higher than M.A.C to keep our brand image of being high-end.
All of our direct competitors have their own retail store in the shopping department, and
wholesale it to Sephora. They also use e-commerce to wholesale and retail as well. Since we
share the target customer and in the same market position, we are intending to sale our products
in the same distribution channels as our competitors did.
$0.00
$10.00
$20.00
$30.00
$40.00
$50.00
$60.00
$70.00
$80.00
$90.00
Powder Brush Bronzer Brush Eyeshadow Brush Eyebow Brush
M.A.C Marc Jacobs AlexanderWang Lancome Chanel
48
Target Consumer
Demographic
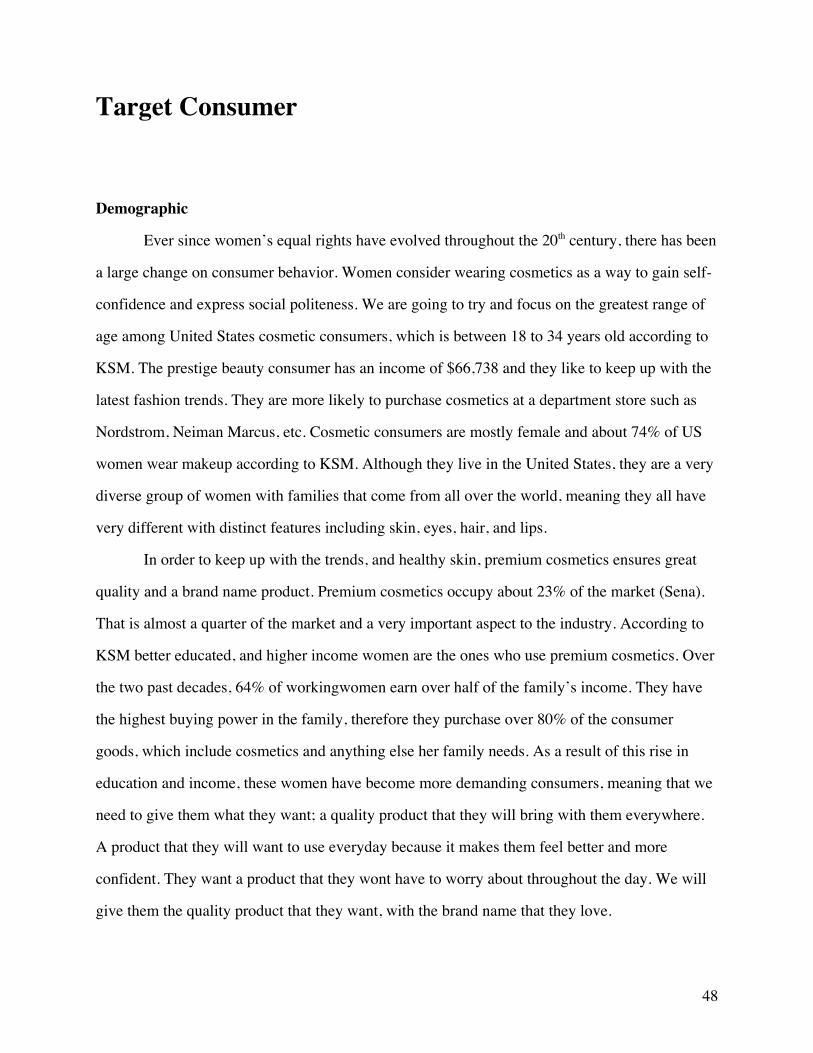
Ever since women’s equal rights have evolved throughout the 20th century, there has been
a large change on consumer behavior. Women consider wearing cosmetics as a way to gain self-
confidence and express social politeness. We are going to try and focus on the greatest range of
age among United States cosmetic consumers, which is between 18 to 34 years old according to
KSM. The prestige beauty consumer has an income of $66,738 and they like to keep up with the
latest fashion trends. They are more likely to purchase cosmetics at a department store such as
Nordstrom, Neiman Marcus, etc. Cosmetic consumers are mostly female and about 74% of US
women wear makeup according to KSM. Although they live in the United States, they are a very
diverse group of women with families that come from all over the world, meaning they all have
very different with distinct features including skin, eyes, hair, and lips.
In order to keep up with the trends, and healthy skin, premium cosmetics ensures great
quality and a brand name product. Premium cosmetics occupy about 23% of the market (Sena).
That is almost a quarter of the market and a very important aspect to the industry. According to
KSM better educated, and higher income women are the ones who use premium cosmetics. Over
the two past decades, 64% of workingwomen earn over half of the family’s income. They have
the highest buying power in the family, therefore they purchase over 80% of the consumer
goods, which include cosmetics and anything else her family needs. As a result of this rise in
education and income, these women have become more demanding consumers, meaning that we
need to give them what they want; a quality product that they will bring with them everywhere.
A product that they will want to use everyday because it makes them feel better and more
confident. They want a product that they wont have to worry about throughout the day. We will
give them the quality product that they want, with the brand name that they love.

49
Psychographics
This customer is more likely to live in urban areas in the Northeast and West regions.
They spend about $34 a month on beauty products. They like their cosmetics to be easy to use,
and fun yet sophisticated. They keep themselves clean and live a healthy lifestyle. These females
care about their appearance and how they look, while still keeping there skin, face, eyes, hair,
etc. up to par. It is part of a daily routine for these women. Waking up, working out, taking a
shower, getting dressed and putting on their makeup. It is a routine that about 74% of U.S.
women do every morning (KSM) and it is only getting more popular with time. These women
like to read magazines and are influenced by what they see in their advertisements. They are
concerned about social and environmental issues and are more likely to buy a product for a cause
(KSM). They want a product that is hypoallergenic and natural not something that will clog
pores and cause breakouts. She is always searching for a product that works and makes her feel
confident about herself. When she puts her makeup on in the morning she wants that feeling of
fulfillment so that she can go out into her hectic life without having to worry about how her
makeup looks. She wants it to be long lasting so she wont have to re-apply halfway through the
day because she wont have time with her busy schedule. She wants to know that is she is
spending money on value and brand, and that she is gaining their aesthetic and value that she
wants with her purchase.
Behavioral Information
The average US woman spends $144 annually on cosmetics (Women Wear Daily, 2011).
More and more cosmetic consumers are shopping online with websites like Amazon, EBay, and
Sephora. 28% of online beauty shoppers buy off of Amazon, 18% off of Sephora, 13% off of
EBay, and the rest include online drugstores, department stores, and mass retailors (referring to
figure 5 graph). According to the figure 1 graph, 28% of beauty shoppers research products
online before they purchase them in the store. 16% shop online to replenish and try new
products. 56% mostly buy online because they know what they want and can order it quickly and

50
from their homes. 42% of women are most likely to purchase a product after hearing good
reviews from their family and friends (KSM). Mass merchandisers and drug stores are the most
popular channels for cosmetics consumer to purchase from because of their price and selection.
This consumer loves to engage in conversation about their beauty products, and therefore use
social media. Websites/apps like Facebook, Twitter, Google, and many different blogs help this
consumer to communicate with other consumers about what products they did and didn’t like. A
large part of the cosmetic industry is the advertisements on television and in magazines. There is
no doubt that consumers are influenced by magazines and television to buy beauty products. In
fact, 58% of cosmetic advertisement spending goes into magazines, 31% goes into network and
cable TV, and the remaining 11% goes into syndication and web display. This shows the
importance of advertisements in the cosmetic industry, especially in women’s fashion
magazines.
KSM

51
With our demographic, psychographic, and behavioral research, we have found an
industry that is important to the US woman and is growing in popularity each year. We have
found a large market for cosmetics among working/active women in the US. By targeting a
younger customer, we will follow the brands aesthetic and gain the widest range of customers.
Using social media sites like Instagram, Facebook, and Twitter, will help promote our new
extension and communicate with our customers. With a wide range of consumers purchasing and
researching products online, we will make sure to use e-commerce sites like Sephora. With
cosmetics as a necessity in a women’s everyday life, our products will be very accessible and
easily a favorite among the premium cosmetics.

52
The 4Ps
Product
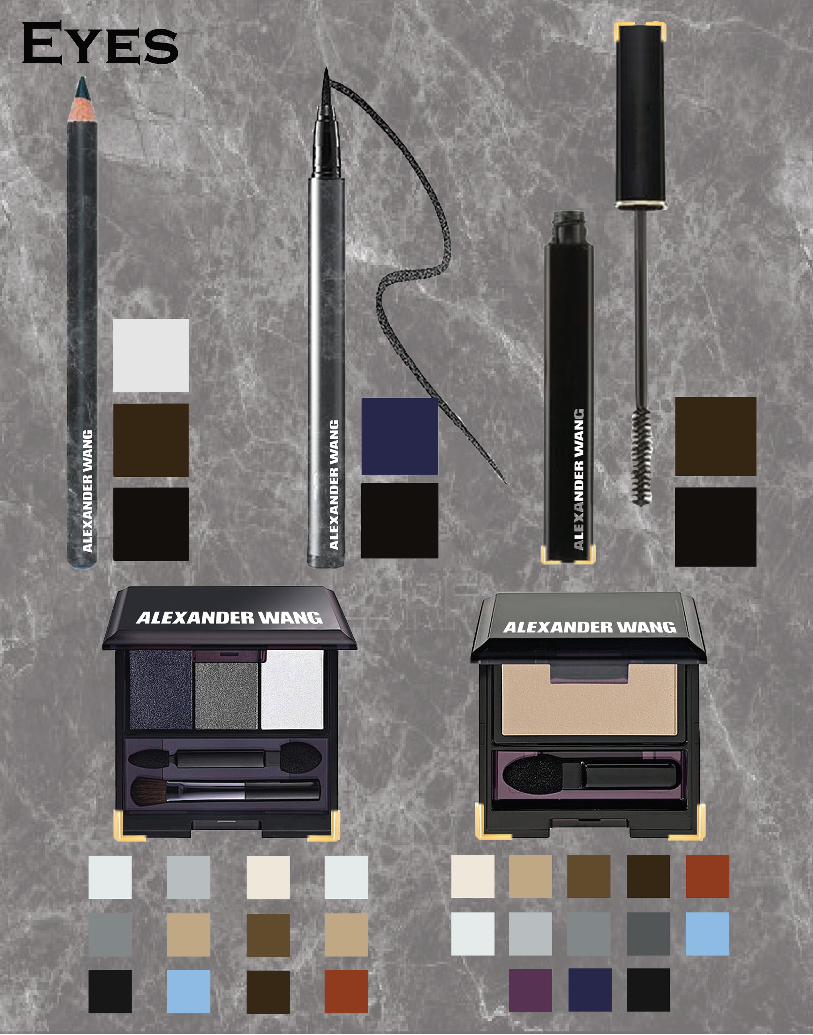
Our premium cosmetics line for Alexander Wang will include eyeliner, mascara, eye
shadow, lipstick, lip-gloss, foundation, powder, bronzer, and cosmetic brushes. We want to cover
all the essentials that women want and need when putting on their makeup everyday. We also
want to provide quality natural makeup that is not harmful to the skin. We will use a mineral
base for all face powders and eye shadows in order to ensure safety and quality. By including the
dark marble texture on our round products and the gold accented corners on our square products,
we maintain the Wang aesthetic throughout the collection. With a range of different colors, we
aim to target most, if not all, ethnicities and eye colors. We chose to create liquid and pencil
eyeliner for our customers so they can choose as they please. For the pencil eyeliner and mascara
colors, a simple black and brown will match any eye color and skin tone. For the liquid, a simple
navy and black for customers bold side. For eye shadows, the colors are drawn from Alexander
Wang’s last three collections. With a mix of natural browns, shades of grey, and subtle pops of
color, there is a shade for everyone. For our face products including liquid foundation, powder,
and bronzer, a range of bronze and yellow skin tones can match with most skin tones. For our
lipsticks and gloss, we chose natural pinks, pale browns, and a mix of bold colors. Our brushes
include an eyeliner brush, an eye shadow brush, a powder brush, and a bronzer brush. They are
the essential brushes needed to complete any beauty look. We decided to provide eye shadow
and brush values packs so you can get a variety of products in one. Our eye shadow groupings
will include three colors that go with different eye colors. Our brush value pack will include mini
brushes with a case for any traveling our customer may do.


Face & Lips


53
Price
The pricing strategy for our new extend line Alexander Wang Beauty is based on three major
factors, the price of our fashion products positioned in the market and our competitors’ retail
price, and our cost or expense of our products.
First, by looking and analyzing our company Alexander Wang Inc.’s position in the market,
our price of fashion products, including the clothing, footwear, accessories, is really close to
Ralph Lauren, Marc Jacobs. Brands like Chanel and Cloe has higher average price than us,
especially in clothing and accessories. Since we are developing a horizontal brand extension,
then our pricing strategies will be kept as same as our fashion products. Our new cosmetic line
will be in the same price zone in the market position.
Second, by researching our competitors in the cosmetic industry and we found four major
competitors that are really close to our price range. The M.A.C, Marc Jacobs, Lancome and
Chanel. Since Alexander Wang has its fame for fashion already and it is growing a really fast
pace, it is one of the stimulus for consumers to take the purchasing action for our new cosmetic
products, consider this factor we decided to set up our price to be higher than the M.A.C even
our target customer is the same. Chanel has much higher market position than Alexander Wang
and they have a long history for the brand and stronger customer loyalty than Alexander Wang,
so our price range will be lower than Chanel. Then we decided to set our price to be really close
to Marc Jacobs and Lancome.
Moreover, Our products will all be produced in nature materials so the cost of technologies
and ingredients will increase, in order to keep our mark up and margin our retail price has to be
set up high enough to maintain the goal. Our package design for our products is new and fresh,
some interesting elements have been added into these could increase the cost of packaging which
could increase the expense too. So our overall price is considered to be high. Specifically,we
decided to set up some of our unique designed products to be higher than our most director
competitor to gain the customer who purchasing for our aesthetics. Then we set up the lipstick

54
and lip-gloss to be lower than our competitors, since these is the most often purchased due to its
color verities so that customer might try our products because of the lower price.

Product Price Sheet

55
Placement
We will sell our products in all Alexander Wang stores including the new flagship store
in Beijing. In store, we want to place the products near the check out counter so when entering
the store, leaving the store, and purchasing, the products will be easily seen. We will also sell at
beauty counters in department stores that sell the Alexander Wang ready-to-wear lines. These
include Neiman Marcus, Bloomingdales, Saks Fifth Avenue, Barney’s, and many more. Sephora
is one of our most important places to sell our products. We want to keep up with our
competitors and many are selling in Sephora stores. Sephora is one of the most popular online
and in store beauty distributers in the world.
A huge aspect of our placement will be on the Internet and phone apps. Our products will
also be sold in these department stores online website as well as our own. Our presence in e-
commerce is very important in order to follow what our customer wants. Most importantly we
want to sell our product on the Sephora online store as well. Our placement online and in store
will make it easy for our customer to shop for our products and know where to find them. We
want to make their experience stress free and easy.

56
Promotion
As a new entrant to cosmetic industry, Alexander Wang beauty line needs to use many
promotional tools to gain minimum level of exposure to the potential consumers.
At the early stage, the company will focus primarily on reach strategy with heavy advertising and
public relations in order to build brand awareness and brand loyalty. Sales promotion will keep at
minimum since it is not effective for high-end cosmetic brands. Personal selling will put
emphasis on in-store customer services.
Product Lifecycle (with respect to Alexander Wang Beauty)
Introduction – Heavy advertising campaign and public relations to build brand awareness.
Growth – Heavy advertising campaign and public relations to build brand loyalty.
Maturity - Advertising and personal selling to maintain distribution.
Decline –Introducing new cosmetic collections.
Advertising Campaign
Advertising campaign is necessary to let the customers be aware of Alexander Wang’s
new beauty line. With continuity in advertising, customers will be able to recognize this new
brand and finally take action in buying the products. The ad content will primarily shows
Alexander Wang’s models along with the products in which the aesthetics and styles are similar
to Alexander Wang’s ads for clothing line.

57

58
Advertising
Three main media types will be used to reach customers: fashion magazine, outdoor
advertising, and internet advertising.
Fashion Magazine + Digital Magazine
According to KSM, high-end beauty consumers are best reached through magazine and
digital media. Alexander Wang’s consumers fall into this category in which they reflect the
young, urban, prestige costumers where they can be influenced by surround media. High-end
consumers can be easily influenced by fashion magazines. They are also the highest magazine
readers among the groups. Magazines also have high-pass-along rate and reproduction.
In 2010, the beauty industry spent approximately $3 billion in advertising with 58%
represented fashion magazine ad ($1.6 billion) (KSM). Alexander Wang beauty line needs to
plan carefully on its advertising budget and publication. Alexander Wang will contract
publishers in advanced to ask for a single or double spread in the fashion magazines (as well as
digital magazine) Potential publishers are Vogue, Elle, Harper Bazaar, Marie Claire, and Allure.

59
Vogue has the most readers among all fashion magazines; it is a great advantage to gain high
exposure from Vogue. The publisher also has an established relationship with Alexander Wang.
Elle and Harper Bazaar are considered high-end fashion magazines which target Alexander
Wang’s customers. Marie Claire and Allure though focus more on mass-market level, they
dedicate majority of their contents on cosmetics which will somehow generate attention among
consumers who are interested in cosmetic products. Digital, mobile, and social media usages
have been gaining popularity in the past few years and are projected to increase even higher.
Fashion Magazines are trying to provide online and mobile applications on various devices such
as smartphone and digital tablets. (KSM)
60
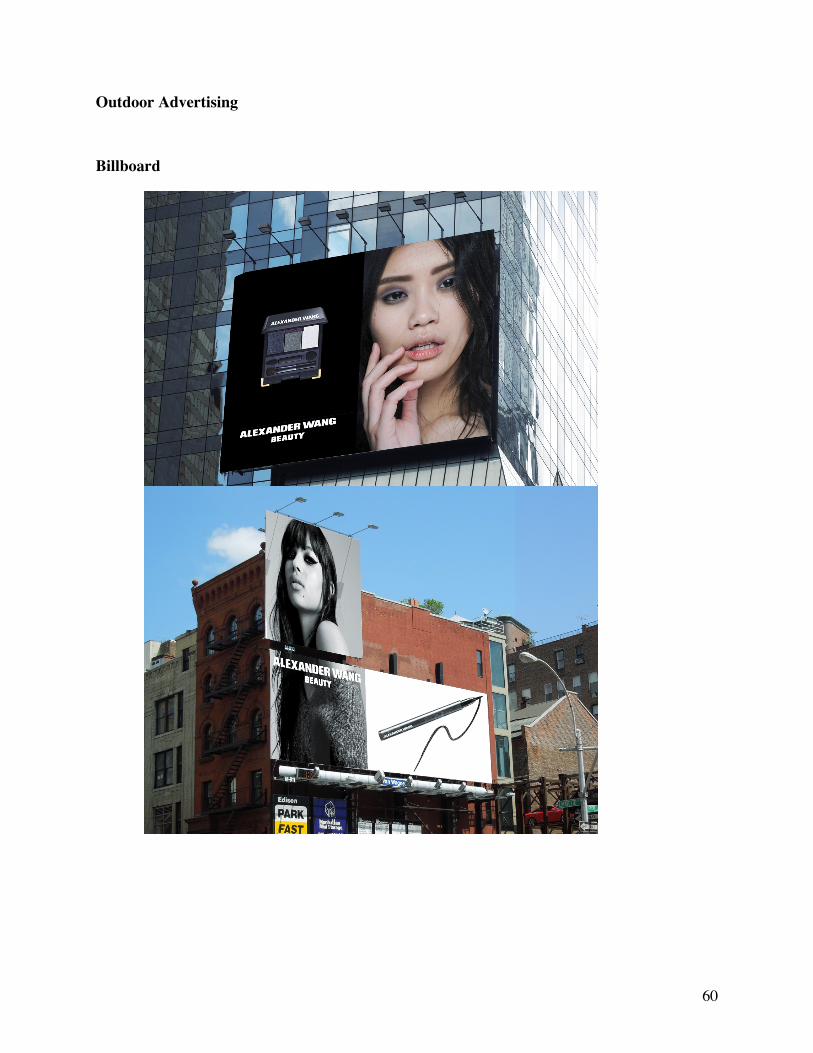
Outdoor Advertising
Billboard

61
Billboard will be highly effective in urban areas and large cities where most target
consumers live, such as New York City, Los Angeles, and Miami. However, the advertisings are
subjected to high noise level which can distract the consumers. Billboard is also appropriate for
the start-up brand with limited budget since the cost of media is moderate and the message of the
ad can reach numerous target audiences.
Mall Advertising
Alexander Wang will distribute cosmetic products through premium department stores as
well as beauty stores like Sephora. Mall banner has a very high advantage in which it attracts
many potential customers and there’s also higher chance the customers will go to the store and
buy the products after they see that ad.
62
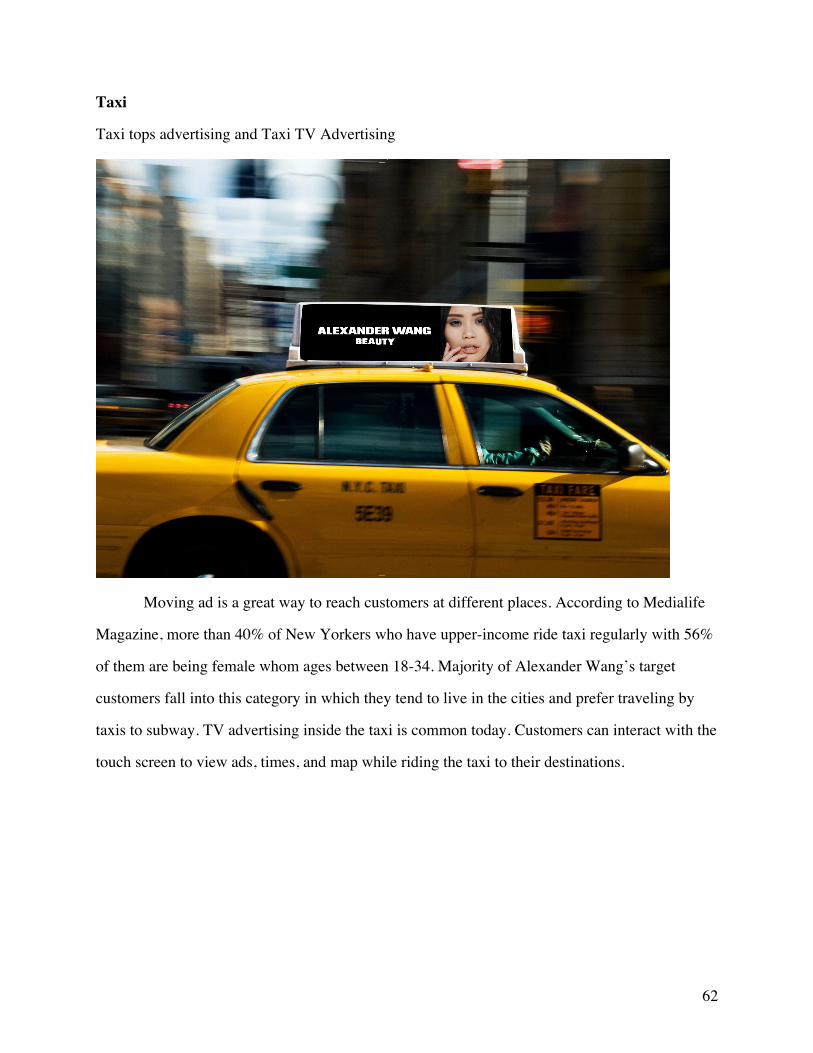
Taxi
Taxi tops advertising and Taxi TV Advertising
Moving ad is a great way to reach customers at different places. According to Medialife
Magazine, more than 40% of New Yorkers who have upper-income ride taxi regularly with 56%
of them are being female whom ages between 18-34. Majority of Alexander Wang’s target
customers fall into this category in which they tend to live in the cities and prefer traveling by
taxis to subway. TV advertising inside the taxi is common today. Customers can interact with the
touch screen to view ads, times, and map while riding the taxi to their destinations.
63
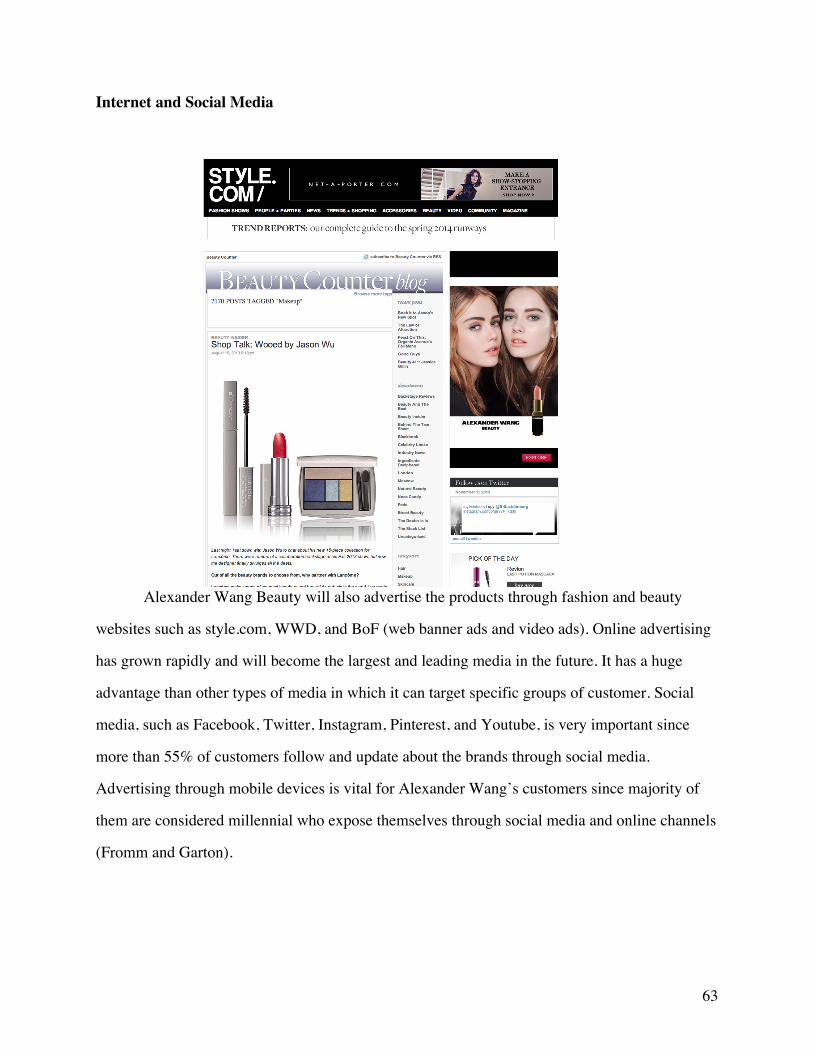
Internet and Social Media
Alexander Wang Beauty will also advertise the products through fashion and beauty
websites such as style.com, WWD, and BoF (web banner ads and video ads). Online advertising
has grown rapidly and will become the largest and leading media in the future. It has a huge
advantage than other types of media in which it can target specific groups of customer. Social
media, such as Facebook, Twitter, Instagram, Pinterest, and Youtube, is very important since
more than 55% of customers follow and update about the brands through social media.
Advertising through mobile devices is vital for Alexander Wang’s customers since majority of
them are considered millennial who expose themselves through social media and online channels
(Fromm and Garton).

64
Public Relations
Press Release and Blogger Reviews
In order to capture media attention, publicity is used to introduce new cosmetic products.
Alexander Wang Beauty will send public release to fashion presses, publishers and bloggers. In
addition to press release, the company will give away test-products to the selected bloggers in
advanced, so they can review them and publish online articles during the launch period. Fashion
and beauty bloggers are influential to customers who spend time online finding information
about the products.
Fashion Show
Alexander Wang can also promote its beauty line during Ready-to-Wear fashion show in
which each season the company can introduce a new set of make up along with the collections.
65
The event will create attention to the new beauty collection in advanced before the it hit the store
in next season.
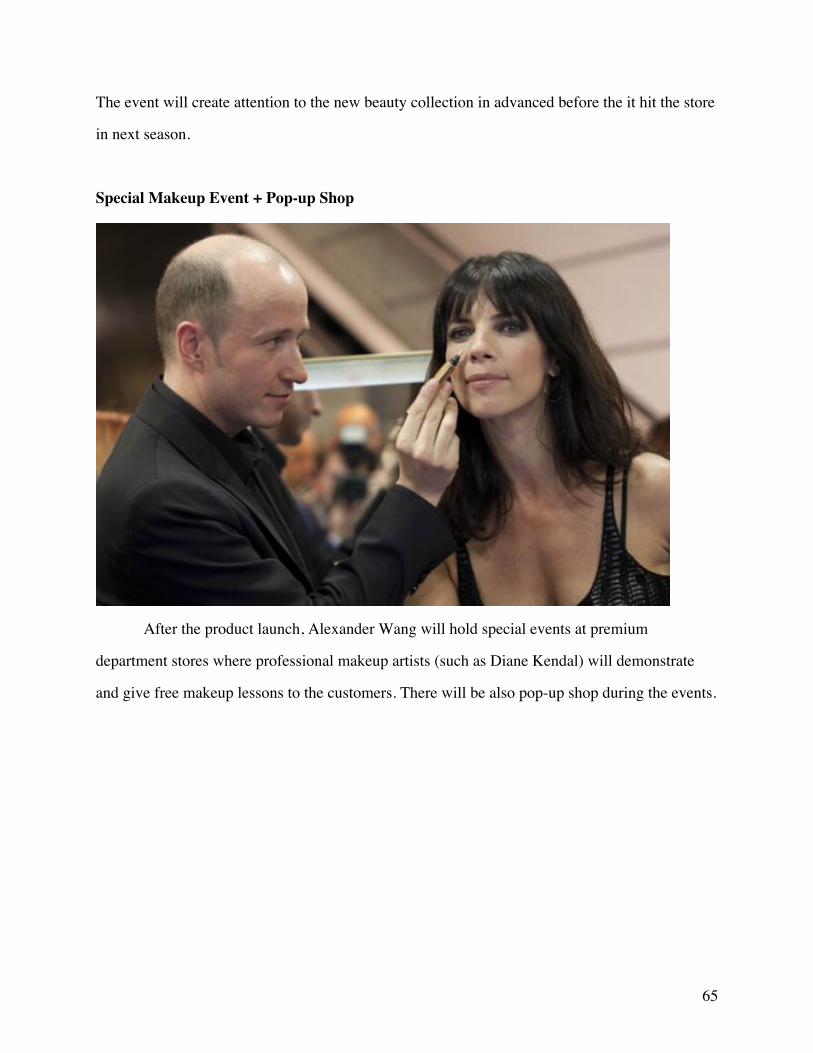
Special Makeup Event + Pop-up Shop
After the product launch, Alexander Wang will hold special events at premium
department stores where professional makeup artists (such as Diane Kendal) will demonstrate
and give free makeup lessons to the customers. There will be also pop-up shop during the events.

66
Promotion Calendar
Fashion Magazines
Vogue, Elle, and Harpers Bazaar will do the pre-launch advertising in their September
Issues (August) to create attention. Elle and Harpers Bazaar will continue to advertise during
launch period. Since Vogue’s September Issue has the highest sales and exposure level, it
doesn’t need to advertise more because it already got attention from majority of the audiences;
and also that the magazine will probably focus more on high-end ready-to-wear lines for
Spring/Summer season. Allure and Marie Claire will start advertising right after the launching.
People who read both magazine and have interests in cosmetic products will seek out and buy the
makeup right away. They will also advertise again during November before Christmas season.
Another same paradigm of advertising will occur after January or the period before Fall/Winter
fashion week, where additional collections and new colors will be introduced in February.

67
Outdoor Advertising
Billboards and taxis will start advertising at most 3 days prior launching date since both
requires time to setup completely. They will continue to advertise for another month before the
ads get obsolete (especially for people who see the ads everyday). Another advertising will occur
after February, or during Fall/Winter fashion week.
Indoor Advertising
Advertisings will start after the product hit the department stores. When potential or
target customers see the ads, there’s a higher chance that they will go directly to the stores and
buy the products. The department stores will advertise again during holiday seasons.
Online Advertising
Web banner ads will appear regularly on various fashion and beauty sites after launch
period and will continue after the post launch until the end of December (one month before a
new collection comes out) Video advertising will stay on sites only launch period to create
attention and interest to the target customers.
Social Media Advertising
Facebook and Twitter are great tools to provide teasers during pre-launching to create
hype and gain customers awareness. Both media will promote and share ads after the launch
periods. Alexander Wang will create Instagram account and customers will likely to buy the
products and share images among their peers. Twitter is a great tool to promote contests and
offer free samples. Customers and makeup artists would also share makeup tutorials and video
reviews on Youtube, and probably on other social media platform as well.

68
Public Relations
Press Releases will be sent to publishers and bloggers to be aware of the new makeup
line. In order to create attention with potential customers or early adopters, online news sites,
magazines, and blogs will publish short articles about the upcoming new products during pre-
launch. Product sample will be given away to selected bloggers and makeup artists. After
launching, blog reviews and forums will be available for at most 2 months
Events
The makeup products will be used during fashion weeks to attract people who watch the
shows. New collections and colors will be introduced every season.
During the post-launch period, department stores will hold special events (and temporary pop-up
shop) in October and December where professional makeup artists will give free makeup lessons
to the customers.

69
Conclusion Based on our extensive research into our target market, we aim to build a successful
premium cosmetics line for Alexander Wang. The cosmetics industry is very competitive, but
with our potential growth and well planned market strategy, we will have a competitive
advantage. With our product, pricing, placement, and promotion we will differentiate ourselves
from the competition.

70
Bibliography
Barson, Donna C. "GCI Magazine." Technology, Science and Beauty Innovation. GCI Magazine, n.d. Web. 15 Nov. 2013. <http://www.gcimagazine.com/business/management/innovation/99878449.html>.
"Country Information." Marketline. N.p., June 2012. Web. 15 Nov. 2013.
<http://www.marketline.com/overview/country-information/>. "Cosmetics & Toiletries." CTFA Technical Guidelines Available Soon. N.p., n.d. Web. 15 Nov.
2013. <http://www.cosmeticsandtoiletries.com/regulatory/region/northamerica/5955241.html>.
Douglas, Joanna. "Sephora Color IQ: Best Beauty Invention of the Year." Yahoo Shine. N.p., 9
Aug. 2013. Web. 15 Nov. 2013. <http://shine.yahoo.com/shine-beauty/sephora-color-iq-best-beauty-invention-180400418.html>.
Estee Lauder Companies. "2009 Annual Report." Estee Lauder Companies. Estee Lauder, n.d.
Web. 16 Nov. 2013. <http://investors.elcompanies.com/phoenix.zhtml?c=109458&p=irol-reportsannual>.
"FDA.gov Homepage." U S Food and Drug Administration Home Page. N.p., n.d. Web. 15 Nov.
2013. <http://www.fda.gov/>. Fromm, Jeff, and Garton Christie. Marketing to Millennials. New York: Barkley, 2013. Print. Iredale, Jessica. "Undercover Shopper: Expanding the Marc Jacobs Empire." WWD. Conde Nast,
n.d. Web. 16 Nov. 2013. <http://www.wwd.com/beauty-industry-news/retailing/undercover-shopper-expanding-the-empire-7109078?src=search_links>.
Kelly, Scott, and Madison. KSM Media. Rep. N.p., n.d. Web. 5 Nov. 2013. <https://attachment.fbsbx.com/file_download.php?id=532482016848041&eid=AS umoolNs6TAr3x7qzXy98VeVdNEENiiopXESgs_EliaPiPNt67Eapekk1fWwo- Alf4&inline=1&ext=1384537883&hash=ASsgcqYUtzoeUdbh>. L'Oreal Group. "2009 Financial Statement." Loreal Finance. Loreal, n.d. Web. 16 Nov. 2013.
<http://www.loreal-finance.com/_docs/us/rapport-2009/LOreal_Rapport_Annuel-Tome_2_va.pdf>.
Naughton, Julie. "Marc Jacobs Launching Beauty at Sephora." WWD. Conde Nast, n.d. Web. 16
Nov. 2013. <http://www.wwd.com/beauty-industry-news/color-cosmetics/marc-jacobs-launches-beauty-at-sephora-6989744>.
P&G, ed. "P&G 2009 Annual Report." P&G. P&G, n.d. Web. 16 Nov. 2013.
<http://www.pg.com/annualreport2009/_downloads/PG_2009_AnnualReport.pdf>. "People and Households." Unites States Census Bureau. U.S. Department of Commerce, n.d.
Web. 15 Nov. 2013. <http://www.census.gov/people/>. "Perfumes, Cosmetics and Other Toiletries (American Industry Overview)." WARC. The Gale
Group, 2011. Web. 15 Nov. 2013. <https://attachment.fbsbx.com/file_download.php?id=566876930058524&eid=ASuR0HlEhKJmtBhTWRVFWH55kbSLgNU1llJDVMNk4tbICe8pQKtUn5xKUeqIE6f_-rY&inline=1&ext=1384552191&hash=ASutHrMNJIBytjee>.

71
Sena, Matt. "Beauty Industry Analysis 2013 – Cost & Trends." Beauty Industry Analysis 2013. Franchise Help Holdings, n.d. Web. 09 Nov. 2013. <http://www.franchisehelp.com/industry-reports/beauty-industry-report>. "The Anxiety Gap." WWD. N.p., 9 Sept. 2011. Web. 15 Nov. 2013. <http://www.wwd.com/beauty-industry-news/retailing/the-anxiety-gap- 5110857>. "United States GDP." TRADING ECONOMICS. N.p., 2013. Web. 15 Nov. 2013.
<http://www.tradingeconomics.com/united-states/gdp>. Vasquez, Diego. "Your client’s ad in and on taxi cabs." Medialife Magazine. Medialife, n.d.
Web. 16 Nov. 2013. <http://www.medialifemagazine.com/your-clients-ad-in-and-on-taxi-cabs/>.
"Welcome to the CTFA." Home. Forbes Packaging, n.d. Web. 15 Nov. 2013.
<http://www.ctfa.org.nz/>.

Appendix A1

www.datamonitor.com Datamonitor USA 245 Fifth Avenue 4th Floor New York, NY 10016 USA t: +1 212 686 7400 f: +1 212 686 2626 e: [email protected]
Datamonitor Europe 119 Farringdon Road London EC1R 3DA United Kingdom t: +44 20 7551 9000 f: +44 20 7675 7500 e: [email protected]
Datamonitor Middle East and North America Datamonitor PO Box 24893 Dubai, UAE t: +49 69 9754 4517 f: +49 69 9754 4900 e: datamonitormena@ datamonitor.com
Datamonitor Asia Pacific Level 46, 2 Park Street Sydney, NSW 2000 Australia t: +61 2 8705 6900 f: +61 2 8705 6901 e: [email protected]
United States - Make-Up 0072 - 0700 - 2009
© Datamonitor. This profile is a licensed product and is not to be photocopied Page 1
INDUSTRY PROFILE
Make-Up in
the United States
Reference Code: 0072-0700
Publication Date: May 2010

EXECUTIVE SUMMARY
United States - Make-Up 0072 - 0700 - 2009
© Datamonitor. This profile is a licensed product and is not to be photocopied Page 2
EXECUTIVE SUMMARY
Market value
The United States make-up market grew by 1.7% in 2009 to reach a value of $6,164.3 million.
Market value forecast
In 2014, the United States make-up market is forecast to have a value of $6,592.8 million, an increase of
7% since 2009.
Market volume
The United States make-up market grew by 0.8% in 2009 to reach a volume of 760.7 million units.
Market volume forecast
In 2014, the United States make-up market is forecast to have a volume of 784.7 million units, an
increase of 3.2% since 2009.
Market segmentation I
Face make-up is the largest segment of the make-up market in the United States, accounting for 36.1% of
the market's total value.
Market segmentation II
The United States accounts for 20.6% of the global make-up market value.
Market share
L'Oreal S.A. is the leading player in the United States make-up market, generating a 26.7% share of the
market's value.
Market rivalry
The US make-up market is tending towards concentration, with the top three players holding 63.9% of the
total market by value.
CONTENTS
United States - Make-Up 0072 - 0700 - 2009
© Datamonitor. This profile is a licensed product and is not to be photocopied Page 3
TABLE OF CONTENTS
EXECUTIVE SUMMARY 2
MARKET OVERVIEW 7
Market definition 7
Research highlights 8
Market analysis 9
MARKET VALUE 10
MARKET VOLUME 11
MARKET SEGMENTATION I 12
MARKET SEGMENTATION II 13
MARKET SHARE 14
COMPETITIVE LANDSCAPE 15
LEADING COMPANIES 17
L'Oreal S.A. 17
Estee Lauder Companies Inc., The 22
Revlon, Inc. 26
MARKET DISTRIBUTION 30
MARKET FORECASTS 31
Market value forecast 31
Market volume forecast 32
MACROECONOMIC INDICATORS 33
APPENDIX 35
Methodology 35
Industry associations 36
Related Datamonitor research 36
Disclaimer 37
ABOUT DATAMONITOR 38
Premium Reports 38
Summary Reports 38
CONTENTS
United States - Make-Up 0072 - 0700 - 2009
© Datamonitor. This profile is a licensed product and is not to be photocopied Page 4
Datamonitor consulting 38

CONTENTS
United States - Make-Up 0072 - 0700 - 2009
© Datamonitor. This profile is a licensed product and is not to be photocopied Page 5
LIST OF TABLES
Table 1: United States make-up market value: $ million, 2005–09(e) 10
Table 2: United States make–up market volume: million units, 2005–09(e) 11
Table 3: United States make-up market segmentation I:% share, by value, 2009(e) 12
Table 4: United States make-up market segmentation II: % share, by value, 2009(e) 13
Table 5: United States make-up market share: % share, by value, 2009(e) 14
Table 6: L'Oreal S.A.: key facts 17
Table 7: L'Oreal S.A.: key financials ($) 19
Table 8: L'Oreal S.A.: key financials (€) 20
Table 9: L'Oreal S.A.: key financial ratios 20
Table 10: Estee Lauder Companies Inc., The: key facts 22
Table 11: Estee Lauder Companies Inc., The: key financials ($) 24
Table 12: Estee Lauder Companies Inc., The: key financial ratios 24
Table 13: Revlon, Inc.: key facts 26
Table 14: Revlon, Inc.: key financials ($) 27
Table 15: Revlon, Inc.: key financial ratios 28
Table 16: United States make-up market distribution: % share, by value, 2009(e) 30
Table 17: United States make-up market value forecast: $ million, 2009–14 31
Table 18: United States make–up market volume forecast: million units, 2009–14 32
Table 19: United States size of population (million), 2005–09 33
Table 20: United States gdp (constant 2000 prices, $ billion), 2005–09 33
Table 21: United States gdp (current prices, $ billion), 2005–09 33
Table 22: United States inflation, 2005–09 34
Table 23: United States consumer price index (absolute), 2005–09 34
Table 24: United States exchange rate, 2005–09 34
CONTENTS
United States - Make-Up 0072 - 0700 - 2009
© Datamonitor. This profile is a licensed product and is not to be photocopied Page 6
LIST OF FIGURES
Figure 1: United States make-up market value: $ million, 2005–09(e) 10
Figure 2: United States make–up market volume: million units, 2005–09(e) 11
Figure 3: United States make-up market segmentation I:% share, by value, 2009(e) 12
Figure 4: United States make-up market segmentation II: % share, by value, 2009(e) 13
Figure 5: United States make-up market share: % share, by value, 2009(e) 14
Figure 6: L'Oreal S.A.: revenues & profitability 21
Figure 7: L'Oreal S.A.: assets & liabilities 21
Figure 8: Estee Lauder Companies Inc., The: revenues & profitability 25
Figure 9: Estee Lauder Companies Inc., The: assets & liabilities 25
Figure 10: Revlon, Inc.: revenues & profitability 28
Figure 11: Revlon, Inc.: assets & liabilities 29
Figure 12: United States make-up market distribution: % share, by value, 2009(e) 30
Figure 13: United States make-up market value forecast: $ million, 2009–14 31
Figure 14: United States make–up market volume forecast: million units, 2009–14 32

MARKET OVERVIEW
United States - Make-Up 0072 - 0700 - 2009
© Datamonitor. This profile is a licensed product and is not to be photocopied Page 7
MARKET OVERVIEW
Market definition
The make-up market consists of eye make-up, face make-up, lip make-up and nail make-up. The market
is valued according to retail selling price (RSP) and includes any applicable taxes. Any currency
conversions used in the creation of this report have been calculated using constant 2009 annual average
exchange rates.
For the purpose of this report the Americas is deemed to comprise Argentina, Brazil, Canada, Chile,
Colombia, Mexico, Venezuela, and the US.

MARKET OVERVIEW
United States - Make-Up 0072 - 0700 - 2009
© Datamonitor. This profile is a licensed product and is not to be photocopied Page 8
Research highlights
The US make-up market generated total revenues of $6.2 billion in 2009, representing a compound
annual growth rate (CAGR) of 2.5% for the period spanning 2005-2009.
Face make-up sales proved the most lucrative for the US make-up market in 2009, generating total
revenues of $2.2 billion, equivalent to 36.1% of the market's overall value.
The performance of the market is forecast to decelerate, with an anticipated CAGR of 1.4% for the five-
year period 2009-2014, which is expected to lead the market to a value of $6.6 billion by the end of 2014.
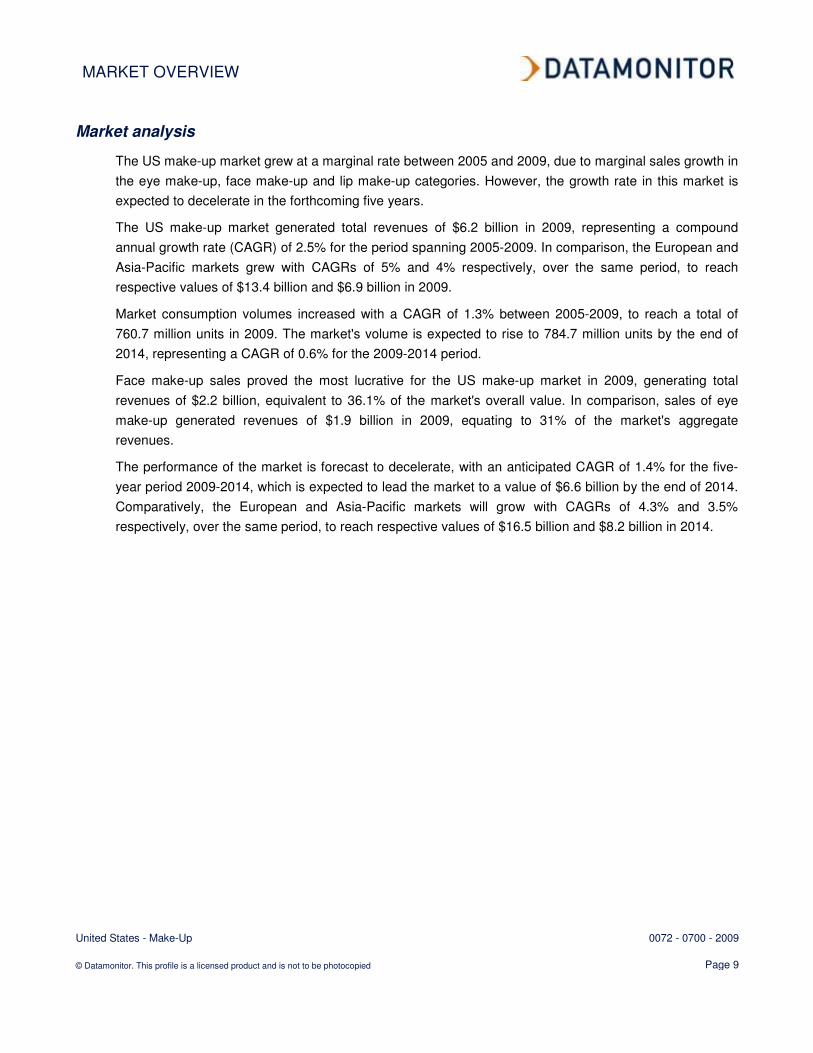
MARKET OVERVIEW
United States - Make-Up 0072 - 0700 - 2009
© Datamonitor. This profile is a licensed product and is not to be photocopied Page 9
Market analysis
The US make-up market grew at a marginal rate between 2005 and 2009, due to marginal sales growth in
the eye make-up, face make-up and lip make-up categories. However, the growth rate in this market is
expected to decelerate in the forthcoming five years.
The US make-up market generated total revenues of $6.2 billion in 2009, representing a compound
annual growth rate (CAGR) of 2.5% for the period spanning 2005-2009. In comparison, the European and
Asia-Pacific markets grew with CAGRs of 5% and 4% respectively, over the same period, to reach
respective values of $13.4 billion and $6.9 billion in 2009.
Market consumption volumes increased with a CAGR of 1.3% between 2005-2009, to reach a total of
760.7 million units in 2009. The market's volume is expected to rise to 784.7 million units by the end of
2014, representing a CAGR of 0.6% for the 2009-2014 period.
Face make-up sales proved the most lucrative for the US make-up market in 2009, generating total
revenues of $2.2 billion, equivalent to 36.1% of the market's overall value. In comparison, sales of eye
make-up generated revenues of $1.9 billion in 2009, equating to 31% of the market's aggregate
revenues.
The performance of the market is forecast to decelerate, with an anticipated CAGR of 1.4% for the five-
year period 2009-2014, which is expected to lead the market to a value of $6.6 billion by the end of 2014.
Comparatively, the European and Asia-Pacific markets will grow with CAGRs of 4.3% and 3.5%
respectively, over the same period, to reach respective values of $16.5 billion and $8.2 billion in 2014.
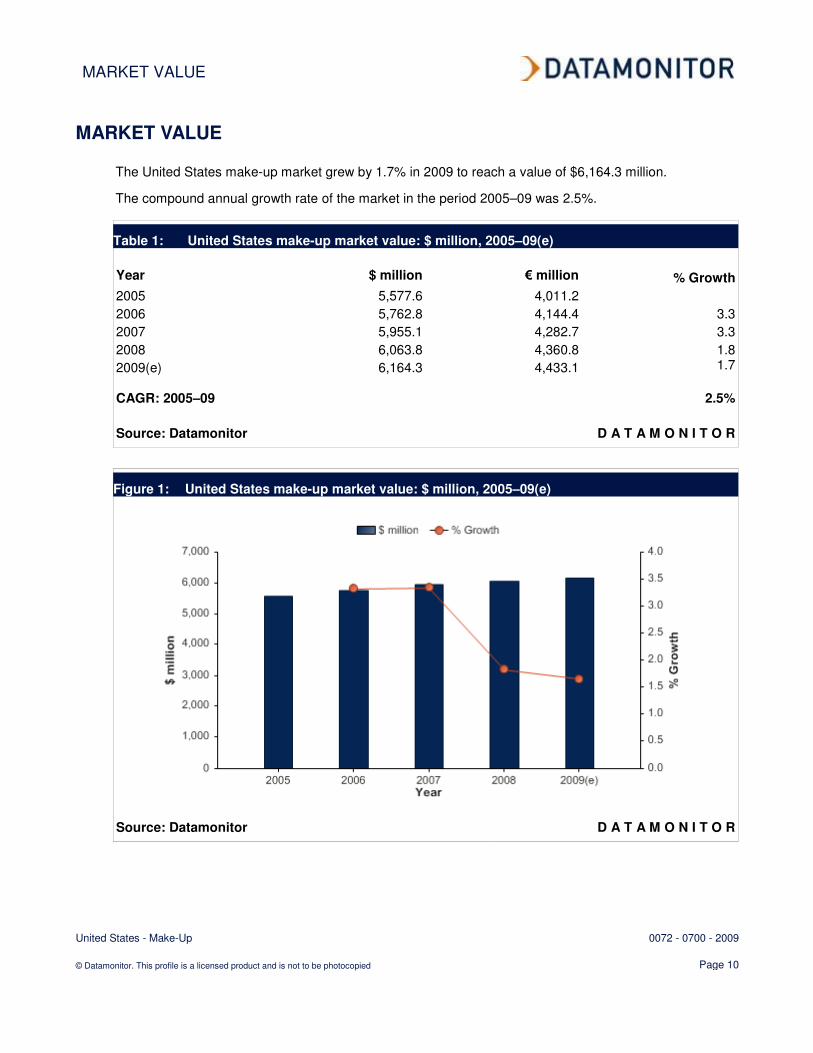
MARKET VALUE
United States - Make-Up 0072 - 0700 - 2009
© Datamonitor. This profile is a licensed product and is not to be photocopied Page 10
MARKET VALUE
The United States make-up market grew by 1.7% in 2009 to reach a value of $6,164.3 million.
The compound annual growth rate of the market in the period 2005–09 was 2.5%.
Table 1: United States make-up market value: $ million, 2005–09(e)
Year $ million € million % Growth
2005 5,577.6 4,011.2
2006 5,762.8 4,144.4 3.3
2007 5,955.1 4,282.7 3.3
2008 6,063.8 4,360.8 1.8
2009(e) 6,164.3 4,433.1 1.7
CAGR: 2005–09 2.5%
Source: Datamonitor D A T A M O N I T O R
Figure 1: United States make-up market value: $ million, 2005–09(e)
Source: Datamonitor D A T A M O N I T O R

MARKET VOLUME
United States - Make-Up 0072 - 0700 - 2009
© Datamonitor. This profile is a licensed product and is not to be photocopied Page 11
MARKET VOLUME
The United States make-up market grew by 0.8% in 2009 to reach a volume of 760.7 million units.
The compound annual growth rate of the market in the period 2005–09 was 1.3%.
Table 2: United States make–up market volume: million units, 2005–09(e)
Year million units % Growth
2005 722.3
2006 735.0 1.8
2007 748.1 1.8
2008 754.9 0.9
2009(e) 760.7 0.8
CAGR: 2005–09 1.3%
Source: Datamonitor D A T A M O N I T O R
Figure 2: United States make–up market volume: million units, 2005–09(e)
Source: Datamonitor D A T A M O N I T O R

MARKET SEGMENTATION I
United States - Make-Up 0072 - 0700 - 2009
© Datamonitor. This profile is a licensed product and is not to be photocopied Page 12
MARKET SEGMENTATION I
Face make-up is the largest segment of the make-up market in the United States, accounting for 36.1% of
the market's total value.
The eye make-up segment accounts for a further 31% of the market.
Table 3: United States make-up market segmentation I:% share, by value, 2009(e)
Category % Share
Face make-up 36.1%
Eye make-up 31.0%
Lip make-up 22.3%
Nail make-up 10.7%
Total 100%
Source: Datamonitor D A T A M O N I T O R
Figure 3: United States make-up market segmentation I:% share, by value, 2009(e)
Source: Datamonitor D A T A M O N I T O R

MARKET SEGMENTATION II
United States - Make-Up 0072 - 0700 - 2009
© Datamonitor. This profile is a licensed product and is not to be photocopied Page 13
MARKET SEGMENTATION II
The United States accounts for 20.6% of the global make-up market value.
Europe accounts for a further 44% of the global market.
Table 4: United States make-up market segmentation II: % share, by value, 2009(e)
Category % Share
Europe 44.0%
Asia-Pacific 23.2%
United States 20.6%
Rest of the World 12.3%
Total 100%
Source: Datamonitor D A T A M O N I T O R
Figure 4: United States make-up market segmentation II: % share, by value, 2009(e)
Source: Datamonitor D A T A M O N I T O R

MARKET SHARE
United States - Make-Up 0072 - 0700 - 2009
© Datamonitor. This profile is a licensed product and is not to be photocopied Page 14
MARKET SHARE
L'Oreal S.A. is the leading player in the United States make-up market, generating a 26.7% share of the
market's value.
Estée Lauder Companies Inc., The accounts for a further 19% of the market.
Table 5: United States make-up market share: % share, by value, 2009(e)
Company % Share
L'Oreal S.A. 26.7%
Estée Lauder Companies Inc., The 19.0%
Revlon, Inc. 18.1%
Others 36.1%
Total 100%
Source: Datamonitor D A T A M O N I T O R
Figure 5: United States make-up market share: % share, by value, 2009(e)
Source: Datamonitor D A T A M O N I T O R

COMPETITIVE LANDSCAPE
United States - Make-Up 0072 - 0700 - 2009
© Datamonitor. This profile is a licensed product and is not to be photocopied Page 15
COMPETITIVE LANDSCAPE
The make-up market will be analyzed taking manufacturers of make-up products as players. The key
buyers will be taken as retailers, and chemical companies and mineral producers as the key suppliers.
The US make-up market is tending towards concentration, with the top three players holding 63.9% of the
total market by value.
The market leaders own a variety of recognized brands and operate in various segments of the market,
such as: eye make-up, face make-up, lip make-up and nail make-up. Fashion is a major influence on the
make-up market, with consumers differentiating themselves quite strongly through the styles and brands
of make-up products offered. Therefore, buyer power is greater amongst larger retailers
(supermarkets/hypermarkets) as switching costs for buyers are not particularly high. However, retailers
often occupy a strong position in the supply chain, which allows them to negotiate favorable contracts with
manufacturers, thereby enhancing buyer power. The wide range of brands available, with accompanying
variations in quality and price, means that buyer power is prevented from becoming disproportionately
strong in this market. Supplier power is also moderate, to the extent that the raw materials for the end
product are commonly available. Entry into this market would be highly dependent on the growth
prospects and also on the size of the existing players. Furthermore, make-up products have few
substitutes wherein manufacturers may face indirect competition from traditional cosmetics, such as
henna or kohl. However they are not likely to be a serious threat in the major markets. Rivalry in the
market is assessed as moderate with most of the companies being geographically diversified but
relatively high fixed costs.
Major manufacturers tend to advertise to consumers in order to build brand loyalty. Retailers are
positioned at the end of the value chain, which implies that they are obliged to offer buyers what they
want, in a market that is subject to unpredictable changes in fashion. This reduces buyer power, as most
retailers must stock popular brands in order to maintain their own sales volumes. Moreover, fashion has a
major influence on the make-up market. Consumers can differentiate themselves quite strongly through
the styles and brands of make-up products they choose, which also weakens buyer power. However,
retailers often occupy a strong position in the supply chain, which allows them to negotiate favorable
contracts with manufacturers, thereby enhancing buyer power. Where brand loyalty exists, it is more likely
that customer would prefer designer brands over retailer brands, although some designer labels also
have their own retail operations for which a large market exists. Direct selling is possible: for example,
Avon avoids the conventional retail distribution network, by using a direct sales force. This is made up of
third party independent contractors (not employees), who buy Avon products at a discount and then sell
to end-users. This limits the power of contractors to set the prices, thus weakening the buyer power.
Overall, buyer power in the make-up market is moderate.
Make-up products are typically manufactured using a range of chemical and mineral products, such as
essential oils, which are widely available from a large number of chemical companies. Packaging is
another significant input. The quality of many of the raw materials is important and chemicals used in

COMPETITIVE LANDSCAPE
United States - Make-Up 0072 - 0700 - 2009
© Datamonitor. This profile is a licensed product and is not to be photocopied Page 16
these products must be of a suitable standard for manufacturing consumer products. Supplier switching
costs are negligible for make-up manufacturers; inputs are typically undifferentiated; and products can be
made with a range of alternative raw materials, which reduces supplier power. Suppliers are often small in
scale compared to large manufacturers and consequently their power is reduced, but this is offset by the
fact that chemical producers gain revenues from a wide variety of sources, reducing their dependence on
cosmetics manufacturers. Overall, supplier power with respect to the make-up market is moderate.
The US make-up market comprises a small number of brands, some widely recognized, which have
strong market position. Large firms benefit from scale economies which allow them to compete more
effectively on price, consequently, new companies entering the market may find it difficult to compete.
Retaliation by existing players, such as the launch of a price war, is a possibility, especially where a new
entrant moves into a more concentrated segment. Furthermore, the brand strength of major
manufacturers is considerable, which may negate much of the effect of low switching costs. New entrants
may be able to start on a small scale, operating within a particular niche, such as make-up with anti-
ageing components. However, product testing and research would be both: time-consuming and costly. In
addition, new entrants will need to persuade stores to stock their products, and major retailers aware of
their importance in the distribution chain, may be unwilling to risk displacing existing brands for the sake
of new ones. Substantial funds are also needed to start a business in this market, with capital required for
investment in production, distribution, and also advertising (which is crucial for success in this market).
However, due to the high sales volumes of make-up products and low product differentiation, it is
common for the companies to enter the lower end of the make-up market. Due to the high brand strength
of leading make-up manufacturers, it is difficult for new companies to develop their brands to compete at
an international level. Overall, the threat of new entrants with respect to the make-up market is moderate.
Make-up products have few substitutes as such. The conventional manufacturers may face indirect
competition from mineral make-up products. They are believed to be more natural, light and allergy free
as there are no chemicals, fragrances or preservatives in their contents. Mineral make-up products are
available in the form of foundations and loose powder. These claim to remove the wrinkles which one
gets due to aging process, acne, pimple scars or any other blemish present on the skin. Overall, the
threat of substitutes is assessed as weak.
The US make-up market is tending towards concentration, with the top three players holding 63.9% of the
total market by value. As many large players have their own production facilities, fixed costs are relatively
high, which serves to enhance rivalry. Retailers may be unwilling to switch between market players, as
their customers are likely to seek the leading brands. The diverse product range offered by some major
players, including skincare and hair care products, reduces their reliance on the make-up products, and
thus somewhat eases rivalry. This diversification protects the company’s business against competitive
pressures in any one particular market. As most companies own large production facilities, the need to
divest such assets on exiting the global market constitutes an exit barrier and therefore a driver of
competition. However, most of these companies are geographically diversified which weakens rivalry to
some extent. Overall, rivalry in the make-up market is moderate.
LEADING COMPANIES
United States - Make-Up 0072 - 0700 - 2009
© Datamonitor. This profile is a licensed product and is not to be photocopied Page 17
LEADING COMPANIES
L'Oreal S.A.
Table 6: L'Oreal S.A.: key facts
Head office: 41, Rue Martre, 92117 Clichy, Cedex, FRA
Telephone: 33 1 47 56 70 00
Fax: 33 1 47 56 86 42
Local office: L'Oreal USA, 575 Fifth Avenue, New York, New York 10017, USA
Telephone: 1 212 984 4894
Website: www.loreal.com
Financial year-end: December
Ticker: OR
Stock exchange: Euronext Paris
Source: company website D A T A M O N I T O R
L'Oreal is a France-based global cosmetics company, engaged in the production and marketing of a
range of perfume, make-up, hair and skin care products. The company operates in over 130 countries. It
markets 23 international brands such as L'Oreal Paris, Garnier, Maybelline, SoftSheen Carson, CCB
Paris, L'Oreal Professional, Kerastase, Redken, Matrix, Mizani, Lancome, Biotherm, Helena Rubinstein,
Kiehl's, Shu Uemura, and Giorgio Armani.
In addition, the company has a financial stake in Sanofi-Aventis, a pharmaceutical company specializing
in therapeutic areas of cardiovascular, thrombosis, central nervous system, oncology, metabolic
disorders, internal medicine and vaccines.
L'Oreal operates through three business segments: cosmetics, the Body Shop, and dermatology.
The cosmetics segment of L'Oreal functions through four operating segments: professional products,
consumer products, luxury products and active cosmetics.
The professional products sub-segment markets hair care products to professional hairdressers, who use
or sell these products in their hair salons. The sub-segment offers differentiated brands to improve the
quality of services in hair colorants, permanent waves, styling and haircare. The professional products
sub-segment comprises four brands: L'Oreal Professionel, Kerastase, Redken, Matrix, Mizani, Shu
Uemura Art of Hair and Keraskin Esthetics. Play Ball and Texture Expert, two sub brands under L’oreal
Professionnel and Kerastase are extremely doing well in the US. Pureology is the leading color care
LEADING COMPANIES
United States - Make-Up 0072 - 0700 - 2009
© Datamonitor. This profile is a licensed product and is not to be photocopied Page 18
brand in the US. Redken 5th Avenue is the popular haircare brand in Latin American countries. The
brands L’oreal Professionnel, Kerastase and Matrix are the major growth drivers.
The consumer products sub-segment sells products through mass-market retailing channels. The
consumer products range includes hair care, skin care and make-up; and perfume products. The leading
brands in this sub-segment include L'Oreal Paris, Garnier, Maybelline New York, Softsheen-Carson and
Le Club des Createurs. Softsheen Carson is the major growth driver in the South Africa.
The luxury products sub-segment markets premium products and services to consumers through retail
outlets such as department stores, perfumeries, travel retail and the group’s own boutiques. The
company’s luxury products include skin-care, make-up and fragrances. With the acquisition of YSL
Beaute in mid 2008, the company enhanced its luxury products portfolio. The luxury products portfolio
includes leading brands such as Lancome, Helena Rubinstein, Biotherm, Shu Uemura, YSL Beaute, and
Kiehl's. The sub-segment also includes perfume brands: Giorgio Armani, Ralph Lauren, Cacharel, Diesel
and Viktor & Rolf.
The active cosmetics sub-segment sells dermo-cosmetic skin care products through pharmacies and
specialist retailers. Pharmacists and dermatologists also offer advice on using the company's products at
the point of sale. The brands in this segment include: Vichy, La Roche-Posay, Inneov, Sanoflore and
Skinceuticals. Aminexil Energy, a brand under Vichy is a popular brand under premature hair loss
product.
The cosmetics segment also comprises various product categories such as skincare (facial skincare,
body care and sun protection), hair care products, make-up, hair colorants, perfumes, and other products.
The company offers make-up products under the brand names L’Oreal Paris, Le Club Des Createurs,
Maybelline New York, Helena Rubinstein, Shu Uemura and YSL Beaute among others.
L'Oreal took over The Body Shop International in 2006. The Body Shop operates a chain of cosmetics
stores specializing in skin and hair care products made from natural ingredients. The Body Shop sells
over 1,200 health and beauty products, across 59 countries. Its traditional emphasis has been on
shampoos, bath products, soaps, skin creams and conditioners made from natural ingredients. The
company also sells beauty and personal care accessories including exfoliating bath gloves, mitts, body
buffers, foot files, and muscle toning, relaxing and invigorating massagers. In addition, it also markets
men's toiletry ranges, perfumes and seasonal products.
The dermatology segment includes dermatological and pharmaceutical activities of the company.
Galderma Laboratories (dermatological company), a joint venture with Nestle, specializes in skin diseases
such as rosacea, psoriasis, eczema, and skin infections such as acne.
In September 2008, the company launched a new lipstick line under the brand name Rouge Volupte. In
the same month, Body Shop introduced mineral make-up range under the brand Nature’s Minerals.

LEADING COMPANIES
United States - Make-Up 0072 - 0700 - 2009
© Datamonitor. This profile is a licensed product and is not to be photocopied Page 19
In March 2009, L’Oreal Paris launched new make-up collection under the Studio Secrets Professional
brand name.
In April 2009, the company's subsidiary, L’Oreal USA, signed an agreement for the acquisition of Idaho
Barber and Beauty Supply (IBB), a distributor of professional products to hair salons in several states in
the North West of the US, particularly Idaho, Montana and Washington. Further, in December 2009,
L’Oreal USA acquired Maly’s Midwest and Marshall Salon Services, distributors of professional products
to hair salons across eight states in the US Midwest region.
Key Metrics
L'Oreal generated revenues of $24.3 billion in the financial year (FY) ended December 2009, a decrease
of 0.4% compared to 2008. The company's net income totaled $2.5 billion in FY2009, a decrease of 8%
compared to 2008.
The cosmetics segment recorded revenues of $22.6 billion in the FY2009, a decrease of 0.6% compared
to 2008. The decline in the revenues was primarily due to the declining sales of the cosmetics products in
the Western Europe, Latin America and Eastern Europe.
The body shop segment recorded revenues of $1 billion in FY2009, a decrease of 3.9% compared to
2008.
North America (including the US) accounted for 24.4% of the total revenues in FY2009. Revenues from
North America reached $5.9 billion in FY2009, an increase of 2.3% over 2008.
Table 7: L'Oreal S.A.: key financials ($)
$ million 2005 2006 2007 2008 2009
Revenues 20,207.6 21,956.3 23,725.7 24,392.1 24,295.8
Net income (loss) 2,742.5 2,865.8 3,693.2 2,709.1 2,492.1
Total assets 33,213.9 34,461.0 32,164.9 31,852.3 32,387.1
Total liabilities 12,832.9 14,125.9 13,444.9 15,774.5 13,478.4
Employees 52,403 60,851 63,358 67,662 64,643
Source: company filings D A T A M O N I T O R

LEADING COMPANIES
United States - Make-Up 0072 - 0700 - 2009
© Datamonitor. This profile is a licensed product and is not to be photocopied Page 20
Table 8: L'Oreal S.A.: key financials (€)
€ million 2005 2006 2007 2008 2009
Revenues 14,532.5 15,790.1 17,062.6 17,541.8 17,472.6
Net income (loss) 1,972.3 2,061.0 2,656.0 1,948.3 1,792.2
Total assets 23,886.1 24,783.0 23,131.7 22,906.9 23,291.5
Total liabilities 9,228.9 10,158.8 9,669.0 11,344.4 9,693.1
Source: company filings D A T A M O N I T O R
Table 9: L'Oreal S.A.: key financial ratios
Ratio 2005 2006 2007 2008 2009
Profit margin 13.6% 13.1% 15.6% 11.1% 10.3%
Revenue growth 6.5% 8.7% 8.1% 2.8% (0.4%)
Asset growth 17.2% 3.8% (6.7%) (1.0%) 1.7%
Liabilities growth 7.8% 10.1% (4.8%) 17.3% (14.6%)
Debt/asset ratio 38.6% 41.0% 41.8% 49.5% 41.6%
Return on assets 8.9% 8.5% 11.1% 8.5% 7.8%
Revenue per employee $385,619 $360,821 $374,471 $360,499 $375,846
Profit per employee $52,335 $47,096 $58,291 $40,039 $38,551
Source: company filings D A T A M O N I T O R

LEADING COMPANIES
United States - Make-Up 0072 - 0700 - 2009
© Datamonitor. This profile is a licensed product and is not to be photocopied Page 21
Figure 6: L'Oreal S.A.: revenues & profitability
Source: company filings D A T A M O N I T O R
Figure 7: L'Oreal S.A.: assets & liabilities
Source: company filings D A T A M O N I T O R

LEADING COMPANIES
United States - Make-Up 0072 - 0700 - 2009
© Datamonitor. This profile is a licensed product and is not to be photocopied Page 22
Estee Lauder Companies Inc., The
Table 10: Estee Lauder Companies Inc., The: key facts
Head office: 767 Fifth Avenue New York City, New York 10153, USA
Telephone: 1 212 572 4200
Fax: 1 212 572 3941
Website: www.elcompanies.com
Financial year-end: June
Ticker: EL
Stock exchange: New York
Source: company website D A T A M O N I T O R
The Estee Lauder Companies (Estee Lauder) manufactures and markets makeup, skin care, fragrances
and hair care products in over 140 countries spanning the Americas, Europe, the Middle East, Africa and
Asia Pacific. It has wholly owned or majority-owned offices in 43 countries and territories. Since its
foundation in 1946, the company has been controlled by the Lauder family. The members of the Lauder
family have approximately 88% of the outstanding voting power in the company's common stock. It is
headquartered in New York City, New York.
Estee Lauder sells its products through different channels like department stores, specialty retailers,
perfumeries, freestanding stores, direct response TV, travel retail, internet, and pharmacies, prestige hair
salons and spas. The company also sells through freestanding company-owned stores and spas, Estee
Lauder's authorized web sites, stores on cruise ships and direct marketing through television.
Some of the best known brands of the company include Estee Lauder, Aramis, Clinique, Lab Series,
Origins, M.A.C, Bobbi Brown, La Mer, Aveda, Jo Malone, Bumble and Bumble, Darphin and Ojon. The
company is also the global licensee of the Kiton, Tommy Hilfiger, Donna Karan, Michael Kors, Sean John,
Missoni, Tom Ford, Mustang, American Beauty, Flirt!, Good skin, grassroots, and Daisy Fuentes. .
Estee Lauder primarily operates through five product categories: makeup, skin care, fragrance, hair care
and other.
The makeup products category offers products such as lipsticks, mascaras, foundations, eyeshadows,
nail polishes and powders. Many of the products are offered in an extensive array of shades and colours.
The company also sells related items such as compacts, brushes and other makeup tools. The
company’s key brands for its makeup products include Estee lauder, Clinique, Origins, MAC, Bobbi
Brown, Aveda, Darphin, American Beauty and Flirt.

LEADING COMPANIES
United States - Make-Up 0072 - 0700 - 2009
© Datamonitor. This profile is a licensed product and is not to be photocopied Page 23
Estee Lauder's skincare products category markets products for women and men including moisturizers,
creams, lotions, cleansers, sun screens and self-tanning products.
The fragrance products category offers a variety of fragrances for women and men. The fragrances are
sold in various forms including perfume sprays and colognes, as well as lotions, powders, creams and
soaps that are based on a particular fragrance.
The hair care products category offers products primarily used in salons and freestanding retail stores;
these include hair colour and styling products, shampoos, conditioners and finishing sprays.
The other products category includes the sales of ancillary products and services other than skin care,
makeup, fragrance, and hair care products.
In March 2009, the company launched makeup and fragrance products under the Bronze Goddess brand
name. In July, it introduced a new range of lip pencil and eye pencil under the, Stay-in-Place brand name.
The company also launched a new range of mineral based makeup products.
Key Metrics
Estee Lauder generated revenues of $7.3 billion in the financial year (FY) ended June 2009, a decrease
of 7.4% compared to the previous year. The company's net income totaled $218.4 million in FY2009, a
decrease of 53.9% compared to 2008.
The makeup division accounted for 38.7% of the total revenues in the FY2009. Revenues from the
makeup division reached $2.8 billion in the FY2009, a decrease of 5.6% compared to 2008. The decline
in the revenue was primarily attributed to the lower net sales from the company's heritage brands and the
makeup artist brands.
The US accounted for 41.2% of the total revenues in FY2009. Revenues from the US reached $3 billion
in FY2009, a decrease of 7.8% compared to 2008.
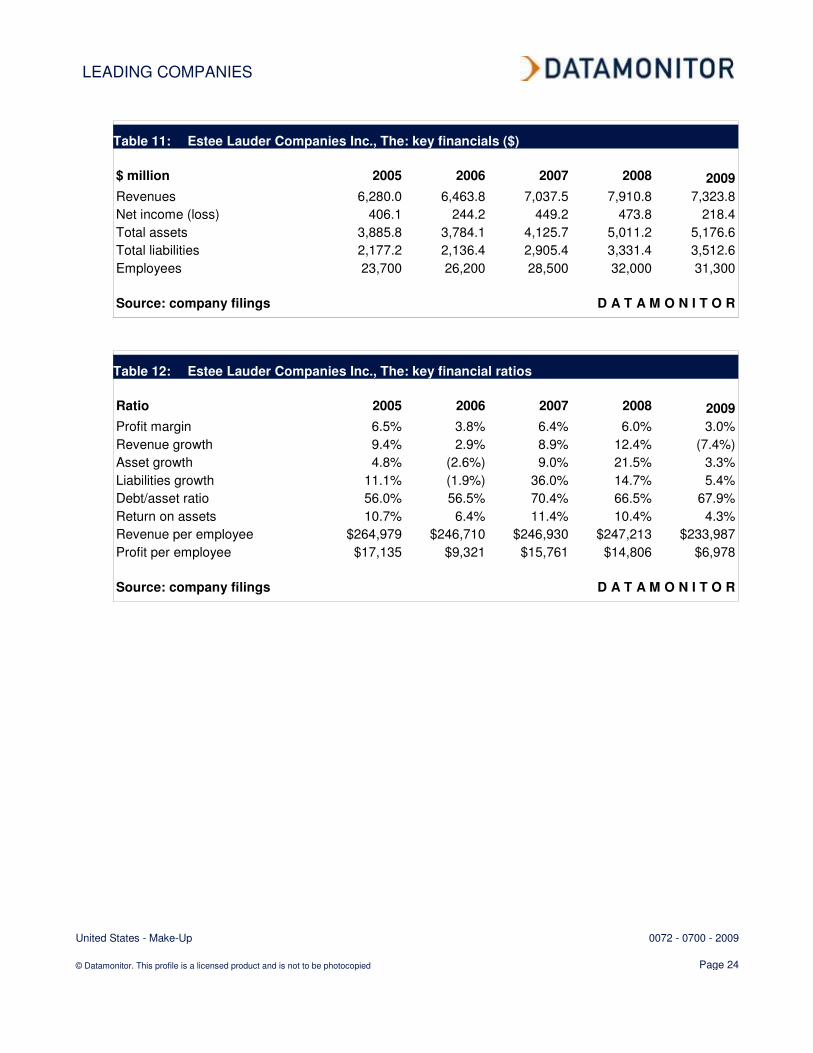
LEADING COMPANIES
United States - Make-Up 0072 - 0700 - 2009
© Datamonitor. This profile is a licensed product and is not to be photocopied Page 24
Table 11: Estee Lauder Companies Inc., The: key financials ($)
$ million 2005 2006 2007 2008 2009
Revenues 6,280.0 6,463.8 7,037.5 7,910.8 7,323.8
Net income (loss) 406.1 244.2 449.2 473.8 218.4
Total assets 3,885.8 3,784.1 4,125.7 5,011.2 5,176.6
Total liabilities 2,177.2 2,136.4 2,905.4 3,331.4 3,512.6
Employees 23,700 26,200 28,500 32,000 31,300
Source: company filings D A T A M O N I T O R
Table 12: Estee Lauder Companies Inc., The: key financial ratios
Ratio 2005 2006 2007 2008 2009
Profit margin 6.5% 3.8% 6.4% 6.0% 3.0%
Revenue growth 9.4% 2.9% 8.9% 12.4% (7.4%)
Asset growth 4.8% (2.6%) 9.0% 21.5% 3.3%
Liabilities growth 11.1% (1.9%) 36.0% 14.7% 5.4%
Debt/asset ratio 56.0% 56.5% 70.4% 66.5% 67.9%
Return on assets 10.7% 6.4% 11.4% 10.4% 4.3%
Revenue per employee $264,979 $246,710 $246,930 $247,213 $233,987
Profit per employee $17,135 $9,321 $15,761 $14,806 $6,978
Source: company filings D A T A M O N I T O R

LEADING COMPANIES
United States - Make-Up 0072 - 0700 - 2009
© Datamonitor. This profile is a licensed product and is not to be photocopied Page 25
Figure 8: Estee Lauder Companies Inc., The: revenues & profitability
Source: company filings D A T A M O N I T O R
Figure 9: Estee Lauder Companies Inc., The: assets & liabilities
Source: company filings D A T A M O N I T O R
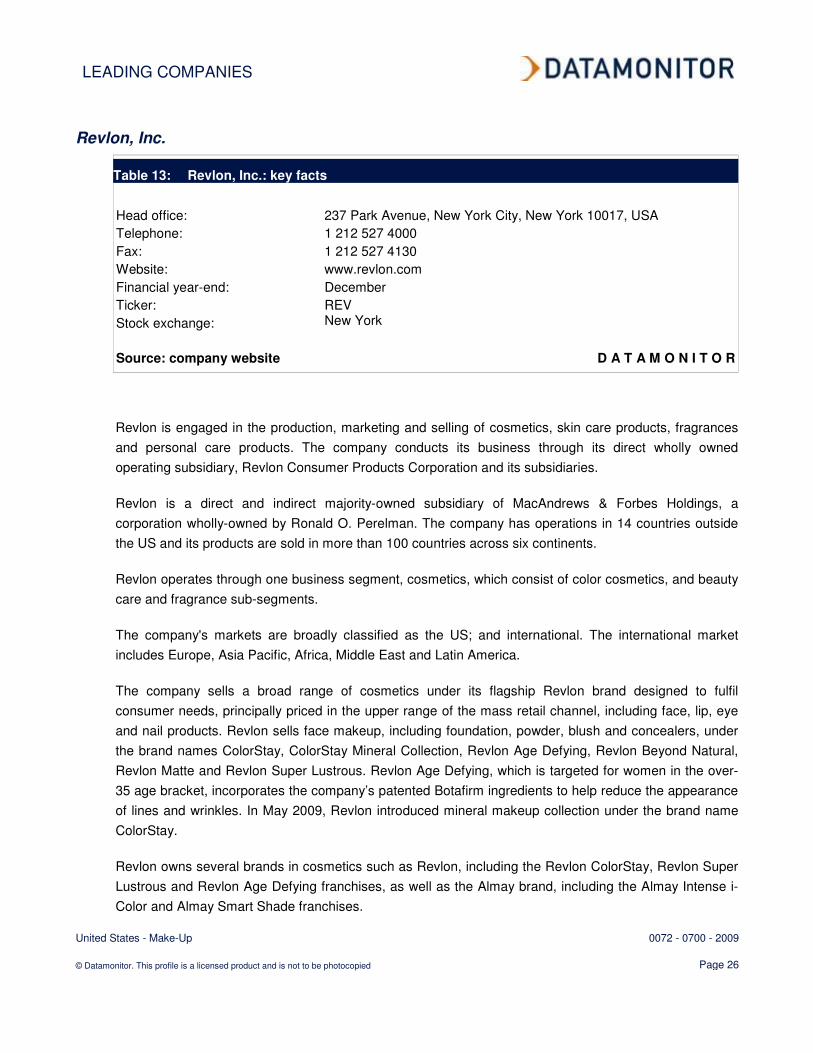
LEADING COMPANIES
United States - Make-Up 0072 - 0700 - 2009
© Datamonitor. This profile is a licensed product and is not to be photocopied Page 26
Revlon, Inc.
Table 13: Revlon, Inc.: key facts
Head office: 237 Park Avenue, New York City, New York 10017, USA
Telephone: 1 212 527 4000
Fax: 1 212 527 4130
Website: www.revlon.com
Financial year-end: December
Ticker: REV
Stock exchange: New York
Source: company website D A T A M O N I T O R
Revlon is engaged in the production, marketing and selling of cosmetics, skin care products, fragrances
and personal care products. The company conducts its business through its direct wholly owned
operating subsidiary, Revlon Consumer Products Corporation and its subsidiaries.
Revlon is a direct and indirect majority-owned subsidiary of MacAndrews & Forbes Holdings, a
corporation wholly-owned by Ronald O. Perelman. The company has operations in 14 countries outside
the US and its products are sold in more than 100 countries across six continents.
Revlon operates through one business segment, cosmetics, which consist of color cosmetics, and beauty
care and fragrance sub-segments.
The company's markets are broadly classified as the US; and international. The international market
includes Europe, Asia Pacific, Africa, Middle East and Latin America.
The company sells a broad range of cosmetics under its flagship Revlon brand designed to fulfil
consumer needs, principally priced in the upper range of the mass retail channel, including face, lip, eye
and nail products. Revlon sells face makeup, including foundation, powder, blush and concealers, under
the brand names ColorStay, ColorStay Mineral Collection, Revlon Age Defying, Revlon Beyond Natural,
Revlon Matte and Revlon Super Lustrous. Revlon Age Defying, which is targeted for women in the over-
35 age bracket, incorporates the company’s patented Botafirm ingredients to help reduce the appearance
of lines and wrinkles. In May 2009, Revlon introduced mineral makeup collection under the brand name
ColorStay.
Revlon owns several brands in cosmetics such as Revlon, including the Revlon ColorStay, Revlon Super
Lustrous and Revlon Age Defying franchises, as well as the Almay brand, including the Almay Intense i-
Color and Almay Smart Shade franchises.

LEADING COMPANIES
United States - Make-Up 0072 - 0700 - 2009
© Datamonitor. This profile is a licensed product and is not to be photocopied Page 27
Its women’s hair colour portfolio include brands such as Revlon Colorsilk, Revlon frost & glow, Revlon
colourist; beauty tools portfolio include Revlon brand; Ultima II and Gatineau brands in skincare; Mitchum
in personal care products; and Charlie and Jean Nate in fragrances.
The company’s principal customers include large mass volume retailers, chain drug and food in the US,
as well as certain department stores and other specialty stores, such as perfumeries, outside the US. The
company also sells beauty products to the US military exchanges and commissaries and has a licensing
business pursuant to which the company licenses certain of its key brand names to third parties for
complimentary beauty-related products and accessories.
Key Metrics
Revlon generated revenues of $1.3 billion in the financial year (FY) ended December 2009, a decrease of
3.8% compared to 2008. The company's net income totaled $48.8 million in FY2009, a decrease of
15.7% compared to 2008.
Beauty care and fragrance sub-segment accounted for 39.4% of the total revenues during FY2009.
Revenues from beauty care and fragrance sub-segment reached $510.4 million in FY2009, a decrease of
1% compared to 2008.
Color cosmetics sub-segment accounted for 60.6% of the total revenues in FY2009. Revenues from color
cosmetics reached $785.5 million in FY2009, a decrease of 5.5% compared to 2008. The decline in the
beauty care and fragrance, and color cosmetics sub-segments was primarily due to the lower net sales of
Revlon and Almay color cosmetics and certain beauty care products.
The US accounted for 57.7% of the total revenues in FY2009. Revenues from the US reached $747.9
million in FY2009, a decrease of 4.4% compared to 2008.
Table 14: Revlon, Inc.: key financials ($)
$ million 2005 2006 2007 2008 2009
Revenues 1,332.3 1,298.7 1,367.1 1,346.8 1,295.9
Net income (loss) (83.7) (251.3) (16.1) 57.9 48.8
Total assets 1,043.7 931.9 889.3 813.4 794.2
Total liabilities 2,139.6 2,161.7 1,971.3 1,926.2 1,779.8
Employees 6,800 6,000 5,600 5,600 4,800
Source: company filings D A T A M O N I T O R

LEADING COMPANIES
United States - Make-Up 0072 - 0700 - 2009
© Datamonitor. This profile is a licensed product and is not to be photocopied Page 28
Table 15: Revlon, Inc.: key financial ratios
Ratio 2005 2006 2007 2008 2009
Profit margin (6.3%) (19.4%) (1.2%) 4.3% 3.8%
Revenue growth 2.7% (2.5%) 5.3% (1.5%) (3.8%)
Asset growth 4.3% (10.7%) (4.6%) (8.5%) (2.4%)
Liabilities growth 5.9% 1.0% (8.8%) (2.3%) (7.6%)
Debt/asset ratio 205.0% 232.0% 221.7% 236.8% 224.1%
Return on assets (8.2%) (25.4%) (1.8%) 6.8% 6.1%
Revenue per employee $195,926 $216,450 $244,125 $240,500 $269,979
Profit per employee ($12,309) ($41,883) ($2,875) $10,339 $10,167
Source: company filings D A T A M O N I T O R
Figure 10: Revlon, Inc.: revenues & profitability
Source: company filings D A T A M O N I T O R
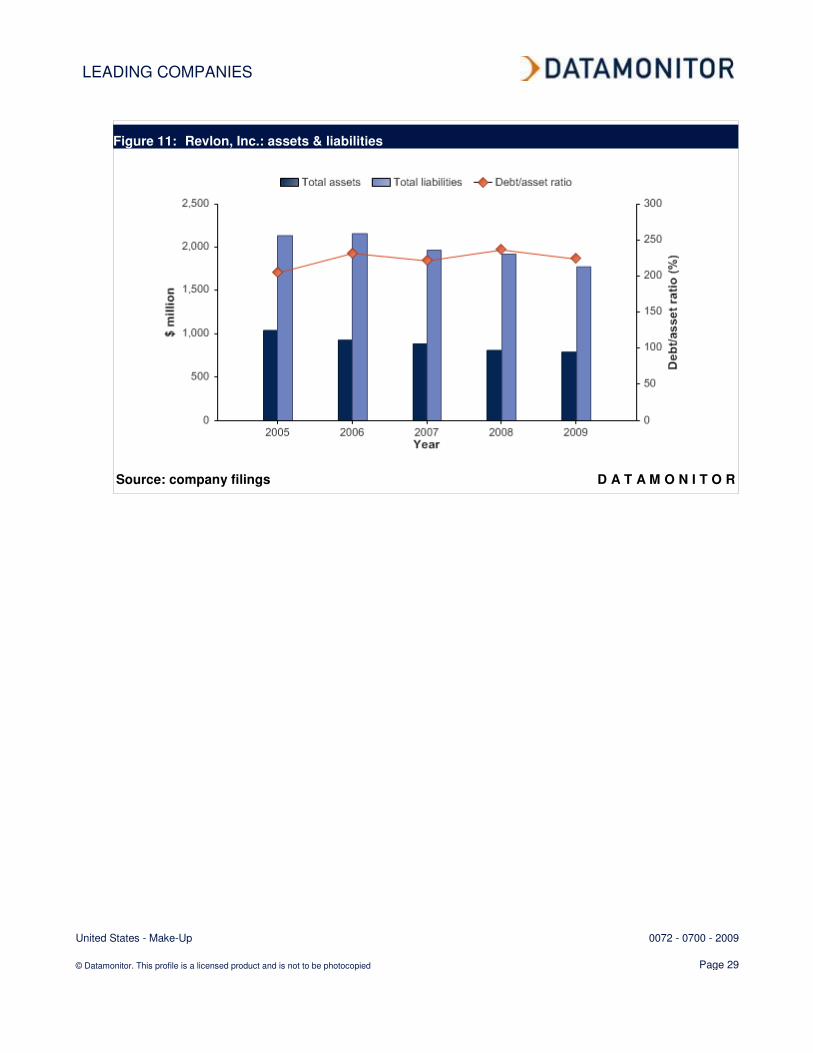
LEADING COMPANIES
United States - Make-Up 0072 - 0700 - 2009
© Datamonitor. This profile is a licensed product and is not to be photocopied Page 29
Figure 11: Revlon, Inc.: assets & liabilities
Source: company filings D A T A M O N I T O R
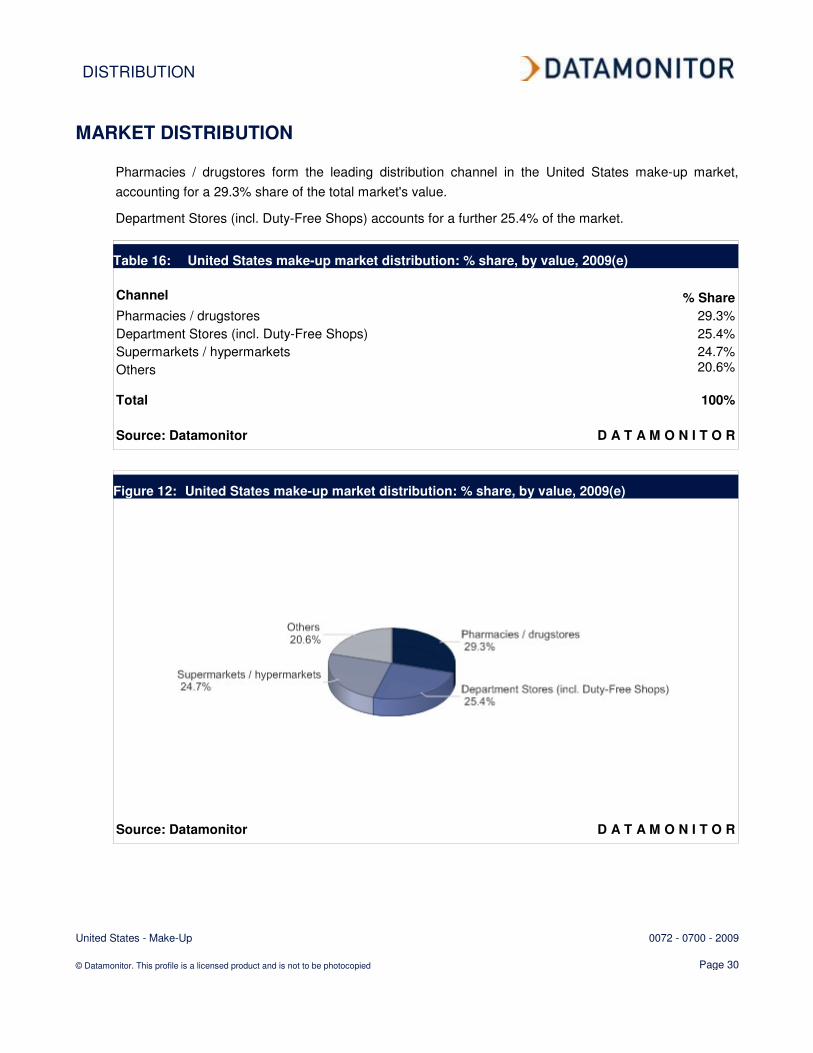
DISTRIBUTION
United States - Make-Up 0072 - 0700 - 2009
© Datamonitor. This profile is a licensed product and is not to be photocopied Page 30
MARKET DISTRIBUTION
Pharmacies / drugstores form the leading distribution channel in the United States make-up market,
accounting for a 29.3% share of the total market's value.
Department Stores (incl. Duty-Free Shops) accounts for a further 25.4% of the market.
Table 16: United States make-up market distribution: % share, by value, 2009(e)
Channel % Share
Pharmacies / drugstores 29.3%
Department Stores (incl. Duty-Free Shops) 25.4%
Supermarkets / hypermarkets 24.7%
Others 20.6%
Total 100%
Source: Datamonitor D A T A M O N I T O R
Figure 12: United States make-up market distribution: % share, by value, 2009(e)
Source: Datamonitor D A T A M O N I T O R

MARKET FORECASTS
United States - Make-Up 0072 - 0700 - 2009
© Datamonitor. This profile is a licensed product and is not to be photocopied Page 31
MARKET FORECASTS
Market value forecast
In 2014, the United States make-up market is forecast to have a value of $6,592.8 million, an increase of
7% since 2009.
The compound annual growth rate of the market in the period 2009–14 is predicted to be 1.4%.
Table 17: United States make-up market value forecast: $ million, 2009–14
Year $ million € million % Growth
2009 6,164.3 4,433.1 1.7%
2010 6,258.4 4,500.8 1.5%
2011 6,346.0 4,563.8 1.4%
2012 6,428.8 4,623.3 1.3%
2013 6,507.1 4,679.6 1.2%
2014 6,592.8 4,741.3 1.3%
CAGR: 2009–14 1.4%
Source: Datamonitor D A T A M O N I T O R
Figure 13: United States make-up market value forecast: $ million, 2009–14
Source: Datamonitor D A T A M O N I T O R

MARKET FORECASTS
United States - Make-Up 0072 - 0700 - 2009
© Datamonitor. This profile is a licensed product and is not to be photocopied Page 32
Market volume forecast
In 2014, the United States make-up market is forecast to have a volume of 784.7 million units, an
increase of 3.2% since 2009.
The compound annual growth rate of the market in the period 2009–14 is predicted to be 0.6%.
Table 18: United States make–up market volume forecast: million units, 2009–14
Year million units % Growth
2009 760.7 0.8%
2010 766.3 0.7%
2011 771.2 0.6%
2012 775.6 0.6%
2013 779.9 0.6%
2014 784.7 0.6%
CAGR: 2009–14 0.6%
Source: Datamonitor D A T A M O N I T O R
Figure 14: United States make–up market volume forecast: million units, 2009–14
Source: Datamonitor D A T A M O N I T O R

MACROECONOMIC INDICATORS
United States - Make-Up 0072 - 0700 - 2009
© Datamonitor. This profile is a licensed product and is not to be photocopied Page 33
MACROECONOMIC INDICATORS
Table 19: United States size of population (million), 2005–09
Year Population (million) % Growth
2005 295.6 0.9%
2006 298.4 0.9%
2007 301.3 1.0%
2008 304.1 0.9%
2009(e) 307.2 1.0%
Source: Datamonitor D A T A M O N I T O R
Table 20: United States gdp (constant 2000 prices, $ billion), 2005–09
Year Constant 2000 Prices, $ billion % Growth
2005 11,165.8 3.0%
2006 11,478.4 2.8%
2007 11,716.7 2.1%
2008 11,807.4 0.8%
2009(e) 11,518.0 (2.5%)
Source: Datamonitor D A T A M O N I T O R
Table 21: United States gdp (current prices, $ billion), 2005–09
Year Current Prices, $ billion % Growth
2005 12,638.4 6.5%
2006 13,398.9 6.0%
2007 14,077.6 5.1%
2008 14,441.4 2.6%
2009(e) 14,039.7 (2.8%)
Source: Datamonitor D A T A M O N I T O R

MACROECONOMIC INDICATORS
United States - Make-Up 0072 - 0700 - 2009
© Datamonitor. This profile is a licensed product and is not to be photocopied Page 34
Table 22: United States inflation, 2005–09
Year Inflation Rate (%)
2005 3.4%
2006 3.2%
2007 2.8%
2008 4.0%
2009(e) (0.4%)
Source: Datamonitor D A T A M O N I T O R
Table 23: United States consumer price index (absolute), 2005–09
Year Consumer Price Index (2000 =
100) % Growth
2005 113.4 3.4%
2006 117.1 3.2%
2007 120.4 2.9%
2008 125.2 4.0%
2009(e) 124.8 (0.4%)
Source: Datamonitor D A T A M O N I T O R
Table 24: United States exchange rate, 2005–09
Year Exchange rate (€/$)
2005 1.2430
2006 1.2547
2007 1.3683
2008 1.4633
2009 1.3905
Source: Datamonitor D A T A M O N I T O R
APPENDIX
United States - Make-Up 0072 - 0700 - 2009
© Datamonitor. This profile is a licensed product and is not to be photocopied Page 35
APPENDIX
Methodology
Datamonitor Industry Profiles draw on extensive primary and secondary research, all aggregated,
analyzed, cross-checked and presented in a consistent and accessible style.
Review of in-house databases – Created using 250,000+ industry interviews and consumer surveys
and supported by analysis from industry experts using highly complex modeling & forecasting tools,
Datamonitor’s in-house databases provide the foundation for all related industry profiles
Preparatory research – We also maintain extensive in-house databases of news, analyst
commentary, company profiles and macroeconomic & demographic information, which enable our
researchers to build an accurate market overview
Definitions – Market definitions are standardized to allow comparison from country to country. The
parameters of each definition are carefully reviewed at the start of the research process to ensure they
match the requirements of both the market and our clients
Extensive secondary research activities ensure we are always fully up-to-date with the latest
industry events and trends
Datamonitor aggregates and analyzes a number of secondary information sources, including:
- National/Governmental statistics
- International data (official international sources)
- National and International trade associations
- Broker and analyst reports
- Company Annual Reports
- Business information libraries and databases
Modeling & forecasting tools – Datamonitor has developed powerful tools that allow quantitative
and qualitative data to be combined with related macroeconomic and demographic drivers to create
market models and forecasts, which can then be refined according to specific competitive, regulatory
and demand-related factors
Continuous quality control ensures that our processes and profiles remain focused, accurate and
up-to-date
APPENDIX
United States - Make-Up 0072 - 0700 - 2009
© Datamonitor. This profile is a licensed product and is not to be photocopied Page 36
Industry associations
Cosmetic, Toiletry, and Fragrance Association
1101 17th Street, NW, Suite 300, Washington D.C. 20036-4702, USA
Tel.: 1 202 331 1770
Fax: 1 202 331 1969
www.ctfa.org
Related Datamonitor research
Industry Profiles
Make-Up in Asia-Pacific
Make-Up in Europe
Make-Up in Germany
Make-Up in Japan
Make-Up in China
Make-Up in India
Make-Up in Italy
Make-Up in Spain
Make-Up in Denmark
Make-Up in Belgium
Make-Up in Canada
APPENDIX
United States - Make-Up 0072 - 0700 - 2009
© Datamonitor. This profile is a licensed product and is not to be photocopied Page 37
Disclaimer
All Rights Reserved.
No part of this publication may be reproduced, stored in a retrieval system or transmitted in any form
by any means, electronic, mechanical, photocopying, recording or otherwise, without the prior
permission of the publisher, Datamonitor plc.
The facts of this report are believed to be correct at the time of publication but cannot be guaranteed.
Please note that the findings, conclusions and recommendations that Datamonitor delivers will be
based on information gathered in good faith from both primary and secondary sources, whose
accuracy we are not always in a position to guarantee. As such Datamonitor can accept no liability
whatever for actions taken based on any information that may subsequently prove to be incorrect.

ABOUT DATAMONITOR
United States - Make-Up 0072 - 0700 - 2009
© Datamonitor. This profile is a licensed product and is not to be photocopied Page 38
ABOUT DATAMONITOR
The Datamonitor Group is a world-leading provider of premium global business information, delivering
independent data, analysis and opinion across the Automotive, Consumer Markets, Energy & Utilities,
Financial Services, Logistics & Express, Pharmaceutical & Healthcare, Retail, Technology and
Telecoms industries.
Combining our industry knowledge and experience, we assist over 6,000 of the world’s leading
companies in making better strategic and operational decisions.
Delivered online via our user-friendly web platforms, our market intelligence products and services
ensure that you will achieve your desired commercial goals by giving you the insight you need to best
respond to your competitive environment.
Premium Reports
Datamonitor's premium reports are based on primary research with industry panels and consumers.
We gather information on market segmentation, market growth and pricing, competitors and products.
Our experts then interpret this data to produce detailed forecasts and actionable recommendations,
helping you create new business opportunities and ideas.
Summary Reports
Our series of company, industry and country profiles complements our premium products, providing
top-level information on 30,000 companies, 3,000 industries and 100 countries. While they do not
contain the highly detailed breakdowns found in premium reports, profiles give you the most important
qualitative and quantitative summary information you need - including predictions and forecasts.
Datamonitor consulting
We hope that the data and analysis in this profile will help you make informed and imaginative business
decisions. If you have further requirements, Datamonitor’s consulting team may be able to help you. For
more information about Datamonitor’s consulting capabilities, please contact us directly at

Copyright of Make-Up Industry Profile: United States is the property of Datamonitor Plc and its content maynot be copied or emailed to multiple sites or posted to a listserv without the copyright holder's express writtenpermission. However, users may print, download, or email articles for individual use.

Appendix A2

KSM CATEGORY INSIGHTS
Beauty

Category Insights: Beauty
!
1!!
Category Prestige Food/Drug/MassTotal&Beauty +5% +4%Total&Makeup +5% +6%Total&Skincare +6% +3%Total&Fragrance +6% Flat
Sources :&The&NPD&Group&&&SymphonyIRI&Group
Prestige2vs.2Food/Drug/MassDollar2Percent2Change2(First2Quarter22011)
Key$Insights$• Overall!cosmetics!and!
toiletries!market!is!expected!to!be!up!3.1%93.6%!in!2011!vs.!2010!
• 74%!of!U.S.!women!currently!wear!makeup!
• Beauty!industry!accounted!for!nearly!$3!billion!in!reported!advertising!spending!in!2010!
When!the!going!gets!tough,!women!turn!to!lipstick!to!make!themselves!feel!better,!right?!Surprisingly!not.!Despite!belief!to!the!contrary,!the!beauty!market!is!not!recession!proof.!Like!many!product!categories,!the!beauty!industry!and!prestige!brands!specifically!are!impacted!by!the!economy.!Prestige!beauty!sales!in!the!U.S.!dropped!6%!in!2009!vs.!2008,!but!early!signs!of!a!post9recession!rebound!offer!reasons!to!hope.!The!overall!cosmetics!and!toiletries!market!in!2011!is!expected!to!be!up!3.193.6%!over!2010,!with!the!prestige!market!accounting!for!a!significant!portion!of!the!growth!with!!8910%!increases!in!sales!(Kline!&!Company,!Inc.).!
What!this!means!for!beauty!brands!is!that!consumers!purchase!beauty!products!in!good!times!and!bad,!but!their!behavior!is!influenced!by!the!economy.!Given!the!current!economic!volatility,!brands!should!be!mindful!of!this!when!developing!their!marketing!plans.!The!opportunity!exists!for!beauty!brands!to!generate!sales!in!hard!times!by!targeting!the!right!audience!with!the!right!message!at!the!right!price!point.!Through!KSM’s!planning!process,!we!are!able!to!uncover!consumer!and!brand!insights!to!inform!our!media!plans!and!meet!client’s!marketing!objectives.!!!The!following!category!brief!will!provide!an!industry!overview,!snapshot!of!the!beauty!consumer!and!an!analysis!of!the!current!advertising!landscape.!Finally,!
KSM!will!detail!key!insights!and!opportunities!for!beauty!brands!to!grow!their!market!share!and!sales!in!today’s!economy.!!!!Industry$Overview$While!beauty!has!two!faces!–!prestige!and!mass!–!both!segments!are!showing!signs!of!a!post9recession!rebound.!Total!U.S.!beauty!sales!in!the!prestige!and!FDM!segments!trended!similarly!in!first!quarter!2011,!up!5%!and!4%,!respectively!(NPD!Group).!
Within!the!prestige!makeup!category,!all!segments!(Face,!Eyes,!Lip,!Sets,!Other!Color!and!Nail)!posted!healthy!sales!gains,!with!trends!in!dramatic!eyes,!soft!lip!shades,!and!bold!and!bright!nail!colors!contributing!to!the!increase.!The!biggest!growth!in!the!prestige!makeup!category!came!from!the!smallest!segment.!The!total!nail!category!grew!57%!in!dollar!sales!in!January!through!May!2011!vs.!the!same!period!in!2010!(NPD!Group).!!Despite!the!growth,!consumers!continue!to!be!cautious!about!beauty!spending.!According!to!Mintel,!a!leading!research!provider!utilized!by!KSM,!38%!of!female!makeup!users!only!buy!makeup!when!they!run!out!of!something!(strictly!replacement!purchases).!25%!only!buy!makeup!on!sale.!Only!31%!have!not!changed!their!makeup!buying!behavior!as!a!result!of!the!slow!rate!of!the!economic!recovery!(Mintel).!$$ $

Category Insights: Beauty
!
2!!
The$Beauty$Consumer$As!74%!of!U.S.!women!wear!makeup,!the!potential!consumer!base!for!beauty!brands!is!significant.!However,!as!the!demographics!and!psychographics!of!consumers!vary!considerably!within!the!category,!it!is!important!for!brands!to!have!a!full!understanding!of!their!consumers.!To!help!discover!this!knowledge,!KSM!has!access!to!a!full!suite!of!syndicated!and!proprietary!research!tools!that!assist!our!media!strategists!in!uncovering!consumer!insights!and!opportunities!that!deliver!on!marketing!objectives.!!To!illustrate!the!distinctions!between!consumers,!KSM!conducted!a!target!audience!analysis!for!three!different!beauty!consumers!–!the!mass,!prestige!and!teen!beauty!segments.!Among!the!adult!segments,!the!prestige!beauty!consumers!were!more!affluent!and!educated,!while!the!mass!segment!was!in!line!with!national!averages.!Further,!the!prestige!consumers!were!more!likely!to!reside!in!urban!areas!in!the!Northeast!and!West!regions,!while!the!mass!and!teen!beauty!consumers!were!more!evenly!distributed!across!the!U.S.!All!segments!showed!interest!in!fashion,!but!the!prestige!beauty!consumer!expressed!the!greatest!desire!and!necessary!means!to!purchase!the!latest!beauty!products.!!From!a!media!perspective,!the!prestige!beauty!consumer!is!best!reached!through!magazine!and!digital,!but!it!is!important!to!utilize!a!more!diverse!media!mix!for!the!mass!and!teen!beauty!consumers!due!to!their!varied!media!usage.!As!the!teen!beauty!consumer!looks!to!TV!to!know!what’s!in!fashion,!TV!could!play!an!important!role!for!advertisers.!
!!Consumer$Purchase$Behaviors$
Source:!Experian!Simmons:!2011!Spring!NCS!/!NHCS!Adults!2!Year,!2011!Spring!Teens!Full!Year.!Numbers!reflect!indices.!
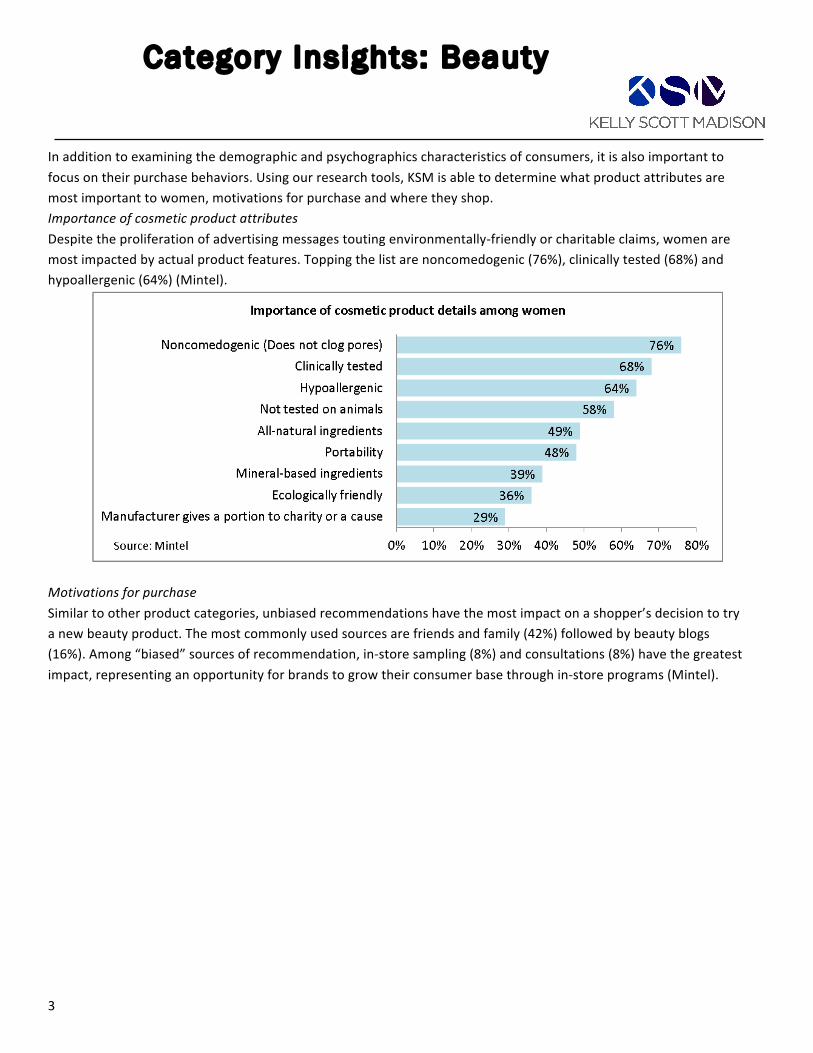
Category Insights: Beauty
!
3!
!
In!addition!to!examining!the!demographic!and!psychographics!characteristics!of!consumers,!it!is!also!important!to!
focus!on!their!purchase!behaviors.!Using!our!research!tools,!KSM!is!able!to!determine!what!product!attributes!are!
most!important!to!women,!motivations!for!purchase!and!where!they!shop.!!!!
Importance!of!cosmetic!product!attributes!Despite!the!proliferation!of!advertising!messages!touting!environmentally9friendly!or!charitable!claims,!women!are!
most!impacted!by!actual!product!features.!Topping!the!list!are!noncomedogenic!(76%),!clinically!tested!(68%)!and!
hypoallergenic!(64%)!(Mintel).!
!
Motivations!for!purchase!Similar!to!other!product!categories,!unbiased!recommendations!have!the!most!impact!on!a!shopper’s!decision!to!try!
a!new!beauty!product.!The!most!commonly!used!sources!are!friends!and!family!(42%)!followed!by!beauty!blogs!
(16%).!Among!“biased”!sources!of!recommendation,!in9store!sampling!(8%)!and!consultations!(8%)!have!the!greatest!
impact,!representing!an!opportunity!for!brands!to!grow!their!consumer!base!through!in9store!programs!(Mintel).!
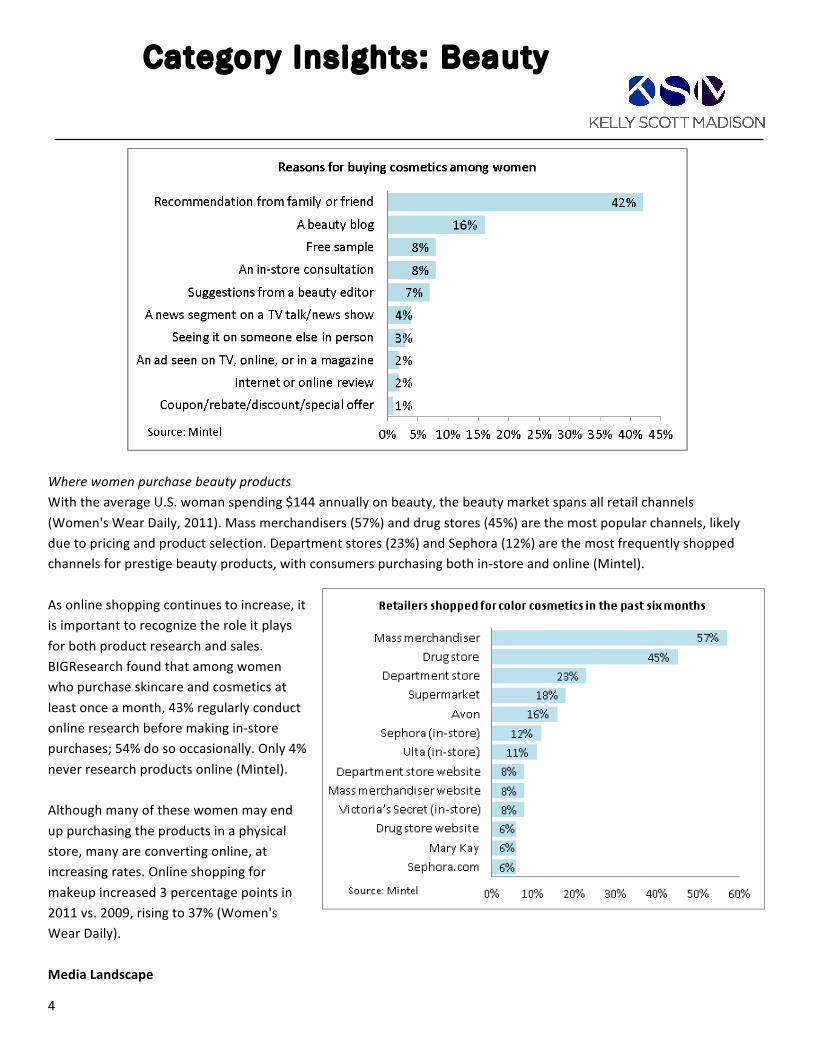
Category Insights: Beauty
!
4!!
!Where!women!purchase!beauty!products!With!the!average!U.S.!woman!spending!$144!annually!on!beauty,!the!beauty!market!spans!all!retail!channels!(Women's!Wear!Daily,!2011).!Mass!merchandisers!(57%)!and!drug!stores!(45%)!are!the!most!popular!channels,!likely!due!to!pricing!and!product!selection.!Department!stores!(23%)!and!Sephora!(12%)!are!the!most!frequently!shopped!channels!for!prestige!beauty!products,!with!consumers!purchasing!both!in9store!and!online!(Mintel).!!As!online!shopping!continues!to!increase,!it!is!important!to!recognize!the!role!it!plays!for!both!product!research!and!sales.!BIGResearch!found!that!among!women!who!purchase!skincare!and!cosmetics!at!least!once!a!month,!43%!regularly!conduct!online!research!before!making!in9store!purchases;!54%!do!so!occasionally.!Only!4%!never!research!products!online!(Mintel).!!Although!many!of!these!women!may!end!up!purchasing!the!products!in!a!physical!store,!many!are!converting!online,!at!increasing!rates.!Online!shopping!for!makeup!increased!3!percentage!points!in!2011!vs.!2009,!rising!to!37%!(Women's!Wear!Daily).!!Media$Landscape$

Category Insights: Beauty
!
5!!
Not!surprisingly!given!the!size!of!the!market,!the!beauty!industry!accounted!for!nearly!$3!billion!in!reported!advertising!spending!in!2010.!Top!advertisers!included!L'Oreal!Paris,!Maybelline!New!York!and!Cover!Girl,!with!each!accounting!for!899%!of!the!overall!spending!(Kantar!Media).!!
Magazine!spending!represented!58%!of!the!category!ad!spending,!which!equates!to!$1.6!billion!(Kantar!Media).!While!it’s!likely!the!ad!spending!numbers!are!somewhat!inflated!due!to!reporting!methodologies,!the!influence!of!magazines!in!consumer!beauty!purchases!cannot!be!denied.!The!most!frequently!used!magazine!genre!was!Women’s!Fashion!&!Beauty,!with!Allure,!InStyle,!ELLE!and!Glamour!nabbing!the!most!advertising!pages!(GfK!MRI!Starch!Advertising!Research).!!As!consumer!media!habits!continue!to!shift!to!digital,!magazine!publishers!are!developing!new!ways!of!retaining!readers!and!encouraging!engagement,!such!as!tablet!editions,!apps!and!QR!codes.!As!of!August!2011,!62%!of!Publishers!Information!Bureau!(PIB)!member!publications!offer!
an!app,!and!this!number!is!rapidly!growing!(MPA).!Within!the!TV!properties,!the!networks!received!42%!of!the!spending,!with!national!cable!close!behind!at!34%.!Cable!networks!receiving!the!most!spending!were!Lifetime,!MTV,!E!!and!VH1!(Kantar!Media).!!Even!though!beauty!brands!are!still!allocating!the!majority!of!their!budgets!to!traditional!offline!media,!they!are!increasingly!turning!to!digital,!mobile,!social!media!and!search!to!drive!interaction!with!consumers.!While!advertising!spending!for!these!vehicles!is!difficult!to!project,!they!are!playing!a!larger!role!in!beauty!marketer’s!media!mixes,!especially!as!mobile!devices!continue!to!gain!in!popularity.!Innovative!beauty!brands!are!increasing!their!reach!by!targeting!consumers!through!relevant!devices.!!Since!women!love!to!engage!in!conversations!about!beauty!products,!social!media!such!as!Facebook,!Twitter,!Google!+!and!blogger!programs!merit!strong!consideration!for!beauty!advertisers’!media!plans.!Typically,!sponsored!messages!from!beauty!brands!are!more!accepted!than!other!categories,!so!advertisers!can!use!this!to!their!advantage!to!encourage!engagement!with!consumers.!As!the!average!beauty!brand!has!373,639!“Likes”!on!their!U.S.!Facebook!page!(eMarketer),!the!potential!reach!of!social!media!is!considerable.!!Impact!of!Print!Positioning!on!Ad!Effectiveness!
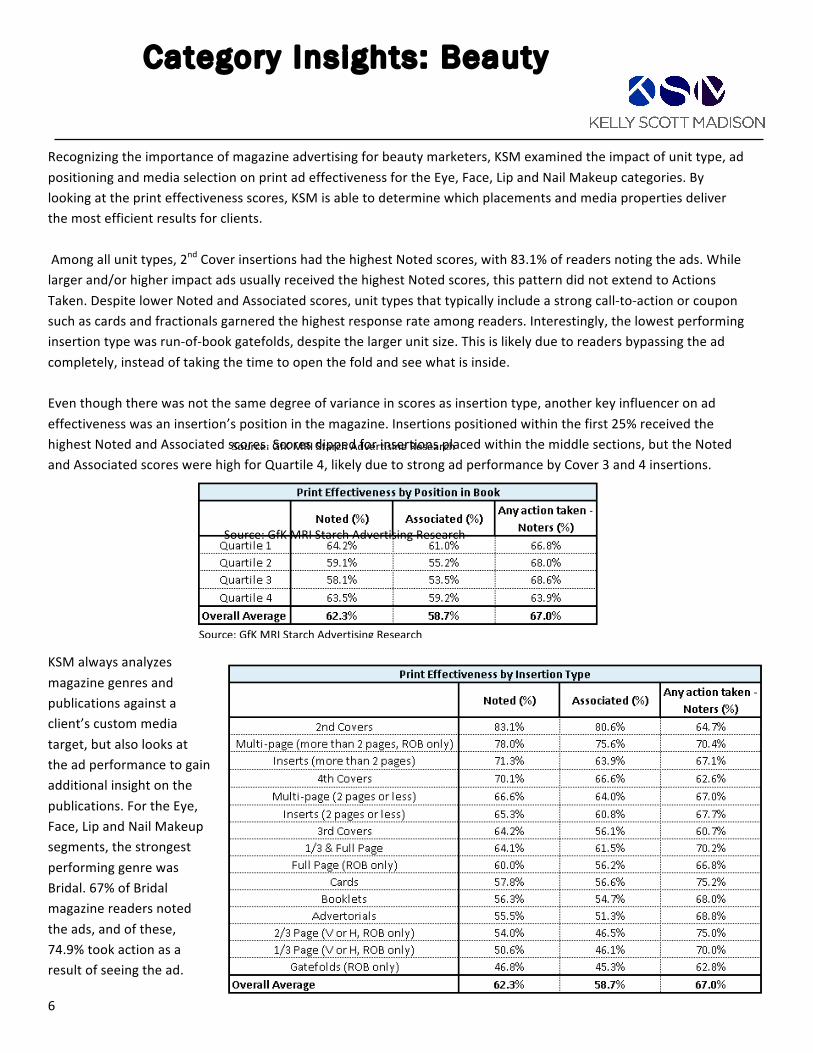
Category Insights: Beauty
!
6!!
Recognizing!the!importance!of!magazine!advertising!for!beauty!marketers,!KSM!examined!the!impact!of!unit!type,!ad!positioning!and!media!selection!on!print!ad!effectiveness!for!the!Eye,!Face,!Lip!and!Nail!Makeup!categories.!By!looking!at!the!print!effectiveness!scores,!KSM!is!able!to!determine!which!placements!and!media!properties!deliver!the!most!efficient!results!for!clients.!!!Among!all!unit!types,!2nd!Cover!insertions!had!the!highest!Noted!scores,!with!83.1%!of!readers!noting!the!ads.!While!larger!and/or!higher!impact!ads!usually!received!the!highest!Noted!scores,!this!pattern!did!not!extend!to!Actions!Taken.!Despite!lower!Noted!and!Associated!scores,!unit!types!that!typically!include!a!strong!call9to9action!or!coupon!such!as!cards!and!fractionals!garnered!the!highest!response!rate!among!readers.!Interestingly,!the!lowest!performing!insertion!type!was!run9of9book!gatefolds,!despite!the!larger!unit!size.!This!is!likely!due!to!readers!bypassing!the!ad!completely,!instead!of!taking!the!time!to!open!the!fold!and!see!what!is!inside.!!!Even!though!there!was!not!the!same!degree!of!variance!in!scores!as!insertion!type,!another!key!influencer!on!ad!effectiveness!was!an!insertion’s!position!in!the!magazine.!Insertions!positioned!within!the!first!25%!received!the!highest!Noted!and!Associated!scores.!Scores!dipped!for!insertions!placed!within!the!middle!sections,!but!the!Noted!and!Associated!scores!were!high!for!Quartile!4,!likely!due!to!strong!ad!performance!by!Cover!3!and!4!insertions.!
!!
KSM!always!analyzes!magazine!genres!and!publications!against!a!client’s!custom!media!target,!but!also!looks!at!the!ad!performance!to!gain!additional!insight!on!the!publications.!For!the!Eye,!Face,!Lip!and!Nail!Makeup!segments,!the!strongest!performing!genre!was!Bridal.!67%!of!Bridal!magazine!readers!noted!the!ads,!and!of!these,!74.9%!took!action!as!a!result!of!seeing!the!ad.!
!! Source:!GfK!MRI!Starch!Advertising!Research!
Source:!GfK!MRI!Starch!Advertising!Research!
!
!! Source:!GfK!MRI!Starch!Advertising!Research!
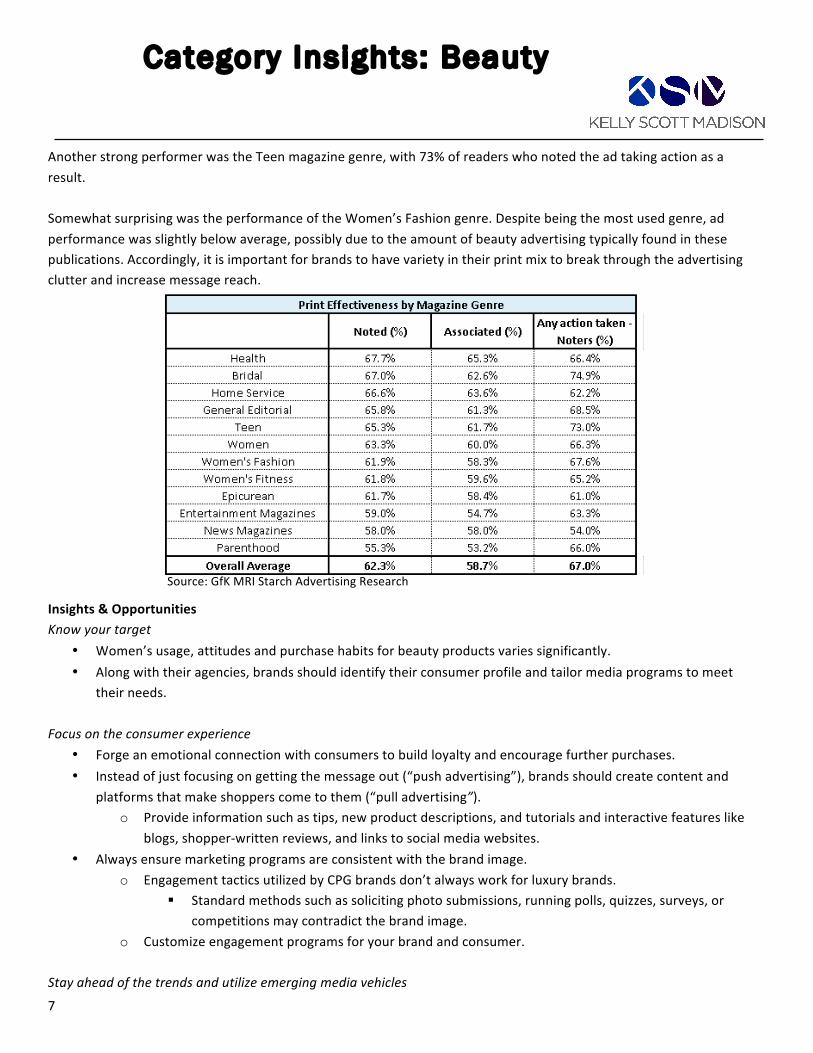
Category Insights: Beauty
!
7!!
Another!strong!performer!was!the!Teen!magazine!genre,!with!73%!of!readers!who!noted!the!ad!taking!action!as!a!result.!!!Somewhat!surprising!was!the!performance!of!the!Women’s!Fashion!genre.!Despite!being!the!most!used!genre,!ad!performance!was!slightly!below!average,!possibly!due!to!the!amount!of!beauty!advertising!typically!found!in!these!publications.!Accordingly,!it!is!important!for!brands!to!have!variety!in!their!print!mix!to!break!through!the!advertising!clutter!and!increase!message!reach.!
!$Insights$&$Opportunities$Know!your!target!
• Women’s!usage,!attitudes!and!purchase!habits!for!beauty!products!varies!significantly.!• Along!with!their!agencies,!brands!should!identify!their!consumer!profile!and!tailor!media!programs!to!meet!
their!needs.!!Focus!on!the!consumer!experience!
• Forge!an!emotional!connection!with!consumers!to!build!loyalty!and!encourage!further!purchases.!• Instead!of!just!focusing!on!getting!the!message!out!(“push!advertising”),!brands!should!create!content!and!
platforms!that!make!shoppers!come!to!them!(“pull!advertising”).!o Provide!information!such!as!tips,!new!product!descriptions,!and!tutorials!and!interactive!features!like!
blogs,!shopper9written!reviews,!and!links!to!social!media!websites.!• Always!ensure!marketing!programs!are!consistent!with!the!brand!image.!
o Engagement!tactics!utilized!by!CPG!brands!don’t!always!work!for!luxury!brands.!! Standard!methods!such!as!soliciting!photo!submissions,!running!polls,!quizzes,!surveys,!or!
competitions!may!contradict!the!brand!image.!o Customize!engagement!programs!for!your!brand!and!consumer.!
!Stay!ahead!of!the!trends!and!utilize!emerging!media!vehicles!!
Source:!GfK!MRI!Starch!Advertising!Research!
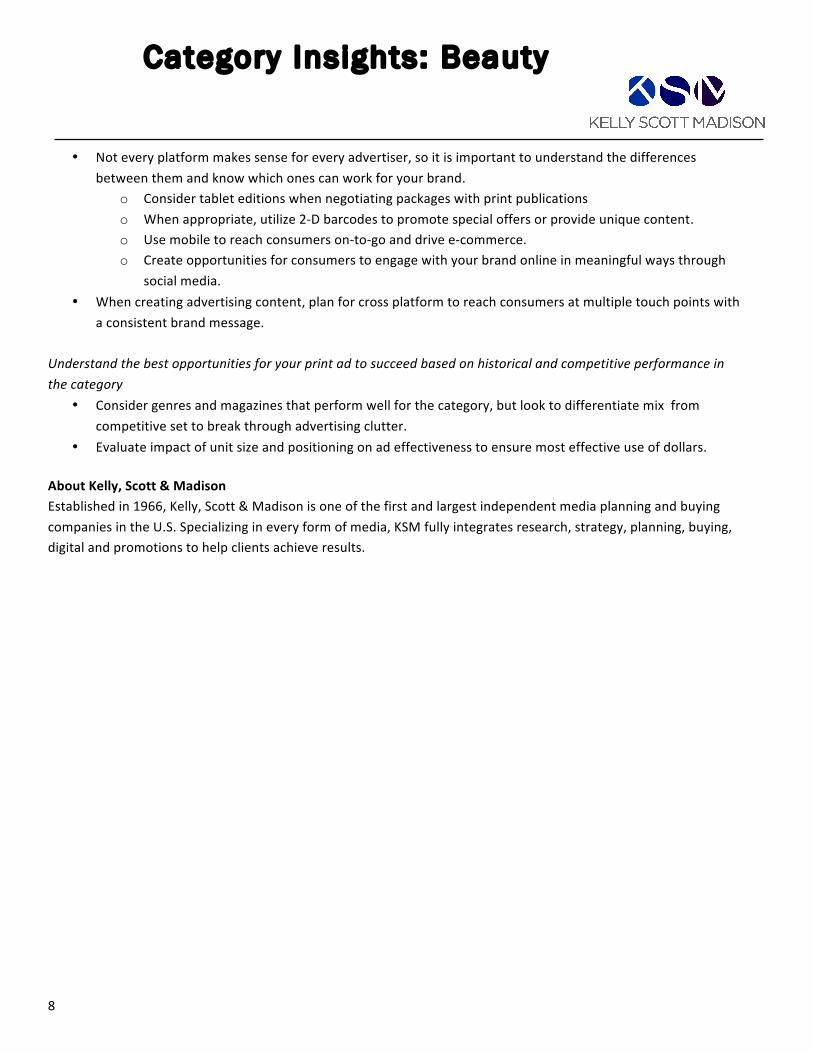
Category Insights: Beauty
!
8!!
• Not!every!platform!makes!sense!for!every!advertiser,!so!it!is!important!to!understand!the!differences!between!them!and!know!which!ones!can!work!for!your!brand.!
o Consider!tablet!editions!when!negotiating!packages!with!print!publications!o When!appropriate,!utilize!29D!barcodes!to!promote!special!offers!or!provide!unique!content.!o Use!mobile!to!reach!consumers!on9to9go!and!drive!e9commerce.!o Create!opportunities!for!consumers!to!engage!with!your!brand!online!in!meaningful!ways!through!
social!media.!• When!creating!advertising!content,!plan!for!cross!platform!to!reach!consumers!at!multiple!touch!points!with!
a!consistent!brand!message.!!Understand!the!best!opportunities!for!your!print!ad!to!succeed!based!on!historical!and!competitive!performance!in!the!category!
• Consider!genres!and!magazines!that!perform!well!for!the!category,!but!look!to!differentiate!mix!!from!competitive!set!to!break!through!advertising!clutter.!
• Evaluate!impact!of!unit!size!and!positioning!on!ad!effectiveness!to!ensure!most!effective!use!of!dollars.!$About$Kelly,$Scott$&$Madison$Established!in!1966,!Kelly,!Scott!&!Madison!is!one!of!the!first!and!largest!independent!media!planning!and!buying!companies!in!the!U.S.!Specializing!in!every!form!of!media,!KSM!fully!integrates!research,!strategy,!planning,!buying,!digital!and!promotions!to!help!clients!achieve!results.!
! !

Category Insights: Beauty
!
9!!
Works$Cited!eMarketer.!(2011,!May!14).!Average!Number!of!"Likes"!on!a!U.S.!Brand's!Facebook!Pages,!by!Industry.!Retrieved!from!www.eMarketer.com!
Experian!Simmons.!2011!Spring!NCS/NHCS!Adult!2!Year.!!
Experian!Simmons.!2011!Spring!Teens!Full!Year.!!
GfK!MRI!Starch!Advertising!Research.!(2011).!
Kantar!Media.!(2011).!
Kline!&!Company,!Inc.!(2011).!Beauty!Retailing!United!States!U!2011!Fall!Preview.!!
Mintel.!(April!2011).!Beauty!Retailing.!!
Mintel.!(July!2011).!Color!Cosmetics.!!
MPA.!(2011).!Personal!Mobile!Devices:!Tablets,!EUReaders!and!Smartphones.!The!Association!of!Magazine!Media.!
NPD!Group.!(2011,!August!18).!Men's!and!Women's!Fragrance!Likely!to!Exceed!2008!Levels!in!Second!Half.!
NPD!Group.!(2011,!June!2011).!NPD!SymphonyIRI!Beauty!Cross!Channel!Monitor!Reports!a!Total!View!of!U.S.!Beauty!Market.!
NPD!Group.!(2011,!July!27).!Women!Look!to!Dramatic!Eyes,!Soft!Lip!Shades,!and!Bold,!Bright!Nail!Colors.!
Women's!Wear!Daily.!(2011,!September!9).!The!Anxiety!Gap.!
!
$