Alex Kaplan
20
Better Economic Outcomes: Public-Private Partnerships in Risk Management State Resilience and Economic Growth Summit Alex Kaplan
Transcript of Alex Kaplan

Better Economic Outcomes: Public-Private Partnerships in Risk Management State Resilience and Economic Growth Summit Alex Kaplan

Alex Kaplan | Global Partnerships | October 7, 2014 2
0
50
100
150
200
250
300
350
400
450
1970 1975 1980 1985 1990 1995 2000 2005 2010
Insured losses Uninsured losses 10 per. Mov. Avg. (Total Insured Losses) 10 per. Mov. Avg. (Total Eco Losses)
The cost of disasters is growing and the portion absorbed by governments and its citizens are even greater.
Global natural catastrophe losses, 1970-2013 (in USD bn)
Source: Swiss Re sigma 1/2014

Alex Kaplan | Global Partnerships | October 7, 2014
Disasters place a significant burden on the public sector
Natural catastrophe losses • Despite prevention and mitigation efforts, no country can fully insulate itself against extreme natural disasters
• The brunt of economic losses from natural disasters ends up with individuals, corporations and governments, both on national and sub-national level
• Government budgets are impacted by: • Primary effects include immediate expenses
for emergency relief efforts, costs for rebuilding public infrastructure or loss of capital and durable goods
• Secondary effects, for instance, include lower economic growth, lower tax and non-tax revenues, budget deficits, increased indebtedness and costs from refinancing, higher inflation or currency movements
3
0
50
100
150
200
250
300
350
400
450 Insured losses
Uninsured losses
Alex Kaplan | Global Partnerships | October 7, 2014
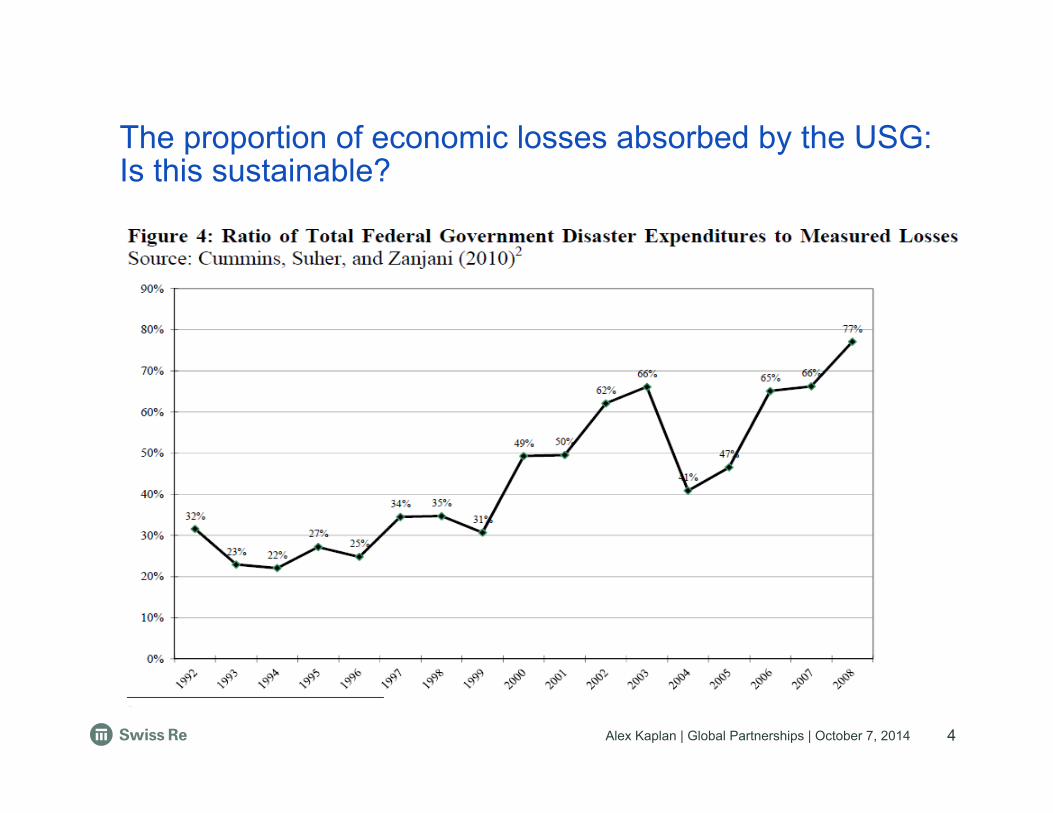
The proportion of economic losses absorbed by the USG: Is this sustainable?
4

Alex Kaplan | Global Partnerships | October 7, 2014
5
Growth of values is the main driver of increasing natural catastrophe losses
Increasing values
Concentration in exposed areas
Increasing vulnerability
Growing insurance penetration
Changing hazard (climate variability, climate change)
Shanghai 1990 - 2010
Loss history is not a good guide for risk, models are an indispensable tool Source: weburbanist.com
Alex Kaplan | Global Partnerships | October 7, 2014
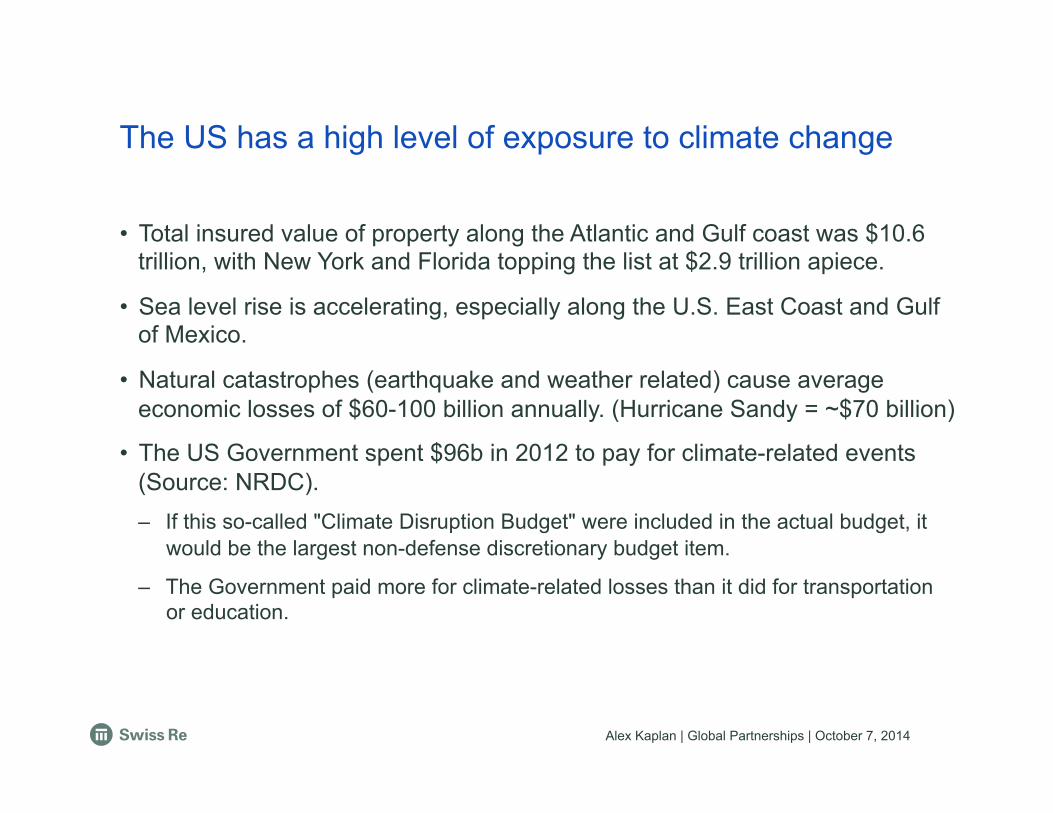
• Total insured value of property along the Atlantic and Gulf coast was $10.6 trillion, with New York and Florida topping the list at $2.9 trillion apiece.
• Sea level rise is accelerating, especially along the U.S. East Coast and Gulf of Mexico.
• Natural catastrophes (earthquake and weather related) cause average economic losses of $60-100 billion annually. (Hurricane Sandy = ~$70 billion)
• The US Government spent $96b in 2012 to pay for climate-related events (Source: NRDC). – If this so-called "Climate Disruption Budget" were included in the actual budget, it
would be the largest non-defense discretionary budget item.
– The Government paid more for climate-related losses than it did for transportation or education.
6
The US has a high level of exposure to climate change

Alex Kaplan | Global Partnerships | October 7, 2014
7
Closing the Gap: Including ex-ante instruments into the overall risk financing strategy
Including ex-ante instruments in the overall risk financing mix helps a government to lower its financial exposure to catastrophic risks, natural and
man-made.
n Smaller gap between economic and insured losses
n Reduced financial burden for the government after an event
n Less volatility for the state budget and more planning certainty
Debt financing
Tax increases
Donor assistance
Budget reallocation
Others
Ex-post financing
Reserve funds, parametric
reinsurance, catastrophe
bonds
(Re-)insurance policies
Private Citizens / Individuals
Corporations / Commercial Enterprises
Government’s exposure
(state budget)
(Re-)insurance policies
Ex-ante risk financing

Alex Kaplan | Global Partnerships | October 7, 2014
The Solutions
Alex Kaplan | Global Partnerships | October 7, 2014 9
9
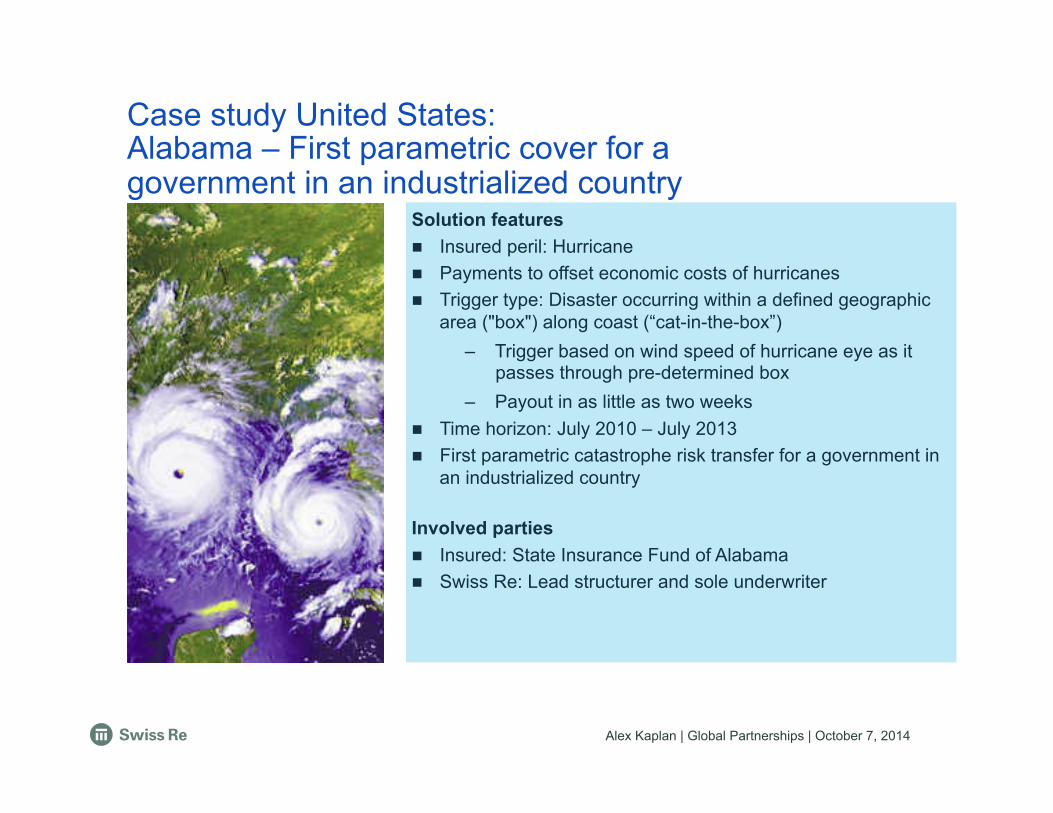
Case study United States: Alabama – First parametric cover for a government in an industrialized country
Solution features n Insured peril: Hurricane n Payments to offset economic costs of hurricanes n Trigger type: Disaster occurring within a defined geographic
area ("box") along coast (“cat-in-the-box”) – Trigger based on wind speed of hurricane eye as it
passes through pre-determined box – Payout in as little as two weeks
n Time horizon: July 2010 – July 2013 n First parametric catastrophe risk transfer for a government in
an industrialized country
Involved parties n Insured: State Insurance Fund of Alabama n Swiss Re: Lead structurer and sole underwriter

Alex Kaplan | Global Partnerships | October 7, 2014 10
Case study Uruguay: Largest Energy Risk Transfer to Protect Against Drought Risk
Solution features • Insured peril: Drought • Payments to be used to purchase energy from alternative
sources when drought conditions cause lack of hydro power • Derivative contract: between UTE, Uruguayan state-owned
hydro-electric power company, and World Bank Treasury. Risk is then placed in the market
• Payment mechanics: – Trigger: Level of rainfall monitored at weather stations – Settlement: Market price of brent crude oil
• Time horizon: January 2014– July 2015 • Transaction Size: USD 500 million • Largest of it's kind in the weather risk management market Involved parties • Client: UTE (Uruguayan state-owned power company) • Arranger: World Bank Treasury • Risk Takers: Swiss Re and Allianz
Alex Kaplan | Global Partnerships | October 7, 2014 11
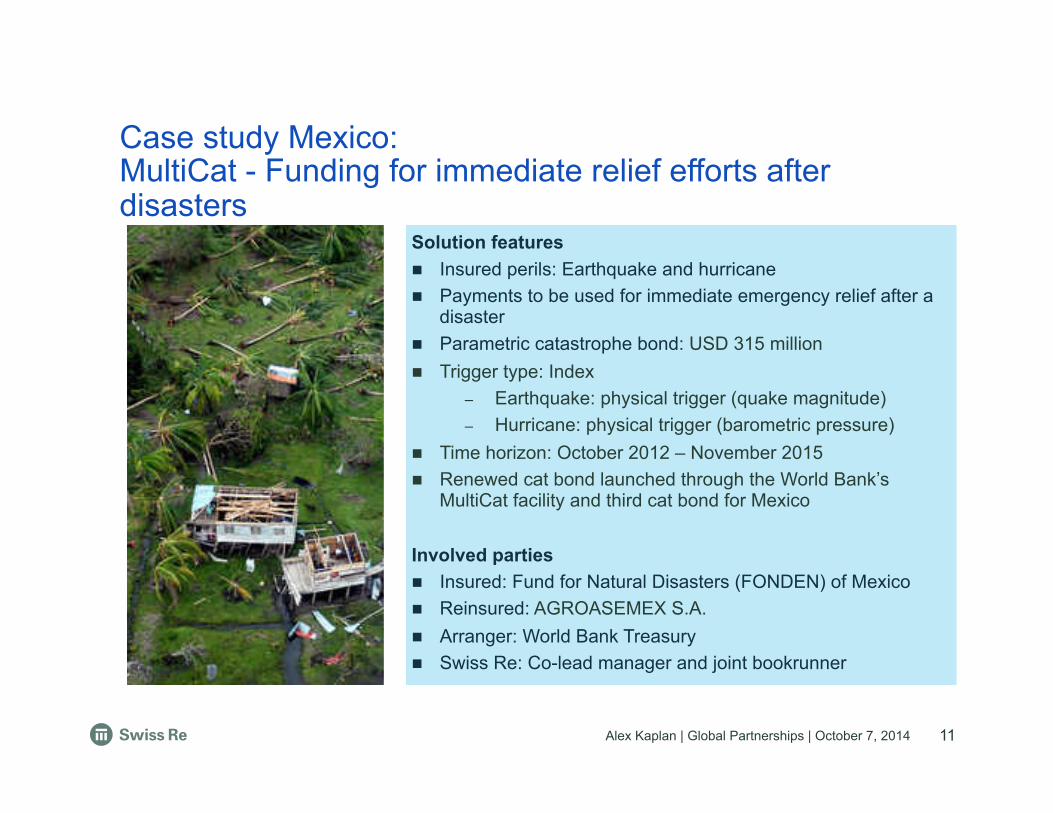
Case study Mexico: MultiCat - Funding for immediate relief efforts after disasters
Solution features n Insured perils: Earthquake and hurricane n Payments to be used for immediate emergency relief after a
disaster n Parametric catastrophe bond: USD 315 million n Trigger type: Index
– Earthquake: physical trigger (quake magnitude) – Hurricane: physical trigger (barometric pressure)
n Time horizon: October 2012 – November 2015 n Renewed cat bond launched through the World Bank’s
MultiCat facility and third cat bond for Mexico Involved parties n Insured: Fund for Natural Disasters (FONDEN) of Mexico n Reinsured: AGROASEMEX S.A. n Arranger: World Bank Treasury n Swiss Re: Co-lead manager and joint bookrunner
Swiss Re Global Partnerships | January 2013
Alex Kaplan | Global Partnerships | October 7, 2014 12
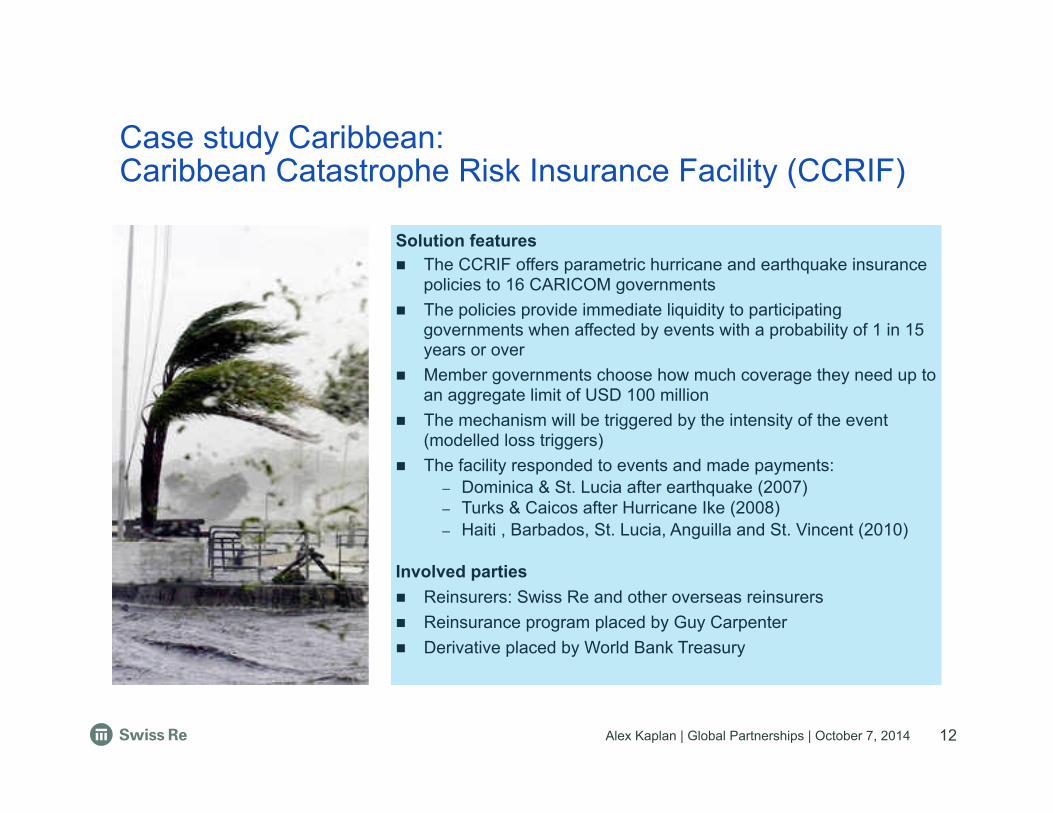
Case study Caribbean: Caribbean Catastrophe Risk Insurance Facility (CCRIF)
Solution features n The CCRIF offers parametric hurricane and earthquake insurance
policies to 16 CARICOM governments n The policies provide immediate liquidity to participating
governments when affected by events with a probability of 1 in 15 years or over
n Member governments choose how much coverage they need up to an aggregate limit of USD 100 million
n The mechanism will be triggered by the intensity of the event (modelled loss triggers)
n The facility responded to events and made payments: – Dominica & St. Lucia after earthquake (2007) – Turks & Caicos after Hurricane Ike (2008) – Haiti , Barbados, St. Lucia, Anguilla and St. Vincent (2010)
Involved parties n Reinsurers: Swiss Re and other overseas reinsurers n Reinsurance program placed by Guy Carpenter n Derivative placed by World Bank Treasury
Swiss Re Global Partnerships | January 2013

Alex Kaplan | Global Partnerships | October 7, 2014 13
Case study: Miami Dade County Public Schools– Custom multi-year structured cover
Solution features n Insured peril: Named Windstorm and associated flood n Multi-year structured cover: USD 100m n Covering indemnified losses from NWS to soften impact to
broader school system – 3 year coverage with unlimited reinstatements – Term Aggregate Deductible – Fixed premium over term – No claims bonus
n Time horizon: May 2013– May 2016 n Customized multi-year structured risk transfer for major
school district Involved parties n Insured: Miami-Dade County Public Schools n Swiss Re: Lead structurer and sole underwriter n Broker: AJ Gallagher

Alex Kaplan | Global Partnerships | October 7, 2014
Economics of Climate Adaptation
14 14
Please find the full study at www.swissre.com/climatechange

Alex Kaplan | Global Partnerships | October 7, 2014
• Assess total climate risk – Today's climate risk
– Future climate change scenarios
• Using Swiss Re's proprietary catastrophe models, current and future hazards are translated to economic loss potential
• Various resiliency strategies can be implemented to demonstrate savings of each measure considered.
• Powerful tool to allow decision makers to understand current and future risk and benefit of long term action
Economics of Climate Adaptation (ECA) Comprehensive Risk Assessment, from Hazard to Cost
15
Alex Kaplan | Global Partnerships | October 7, 2014
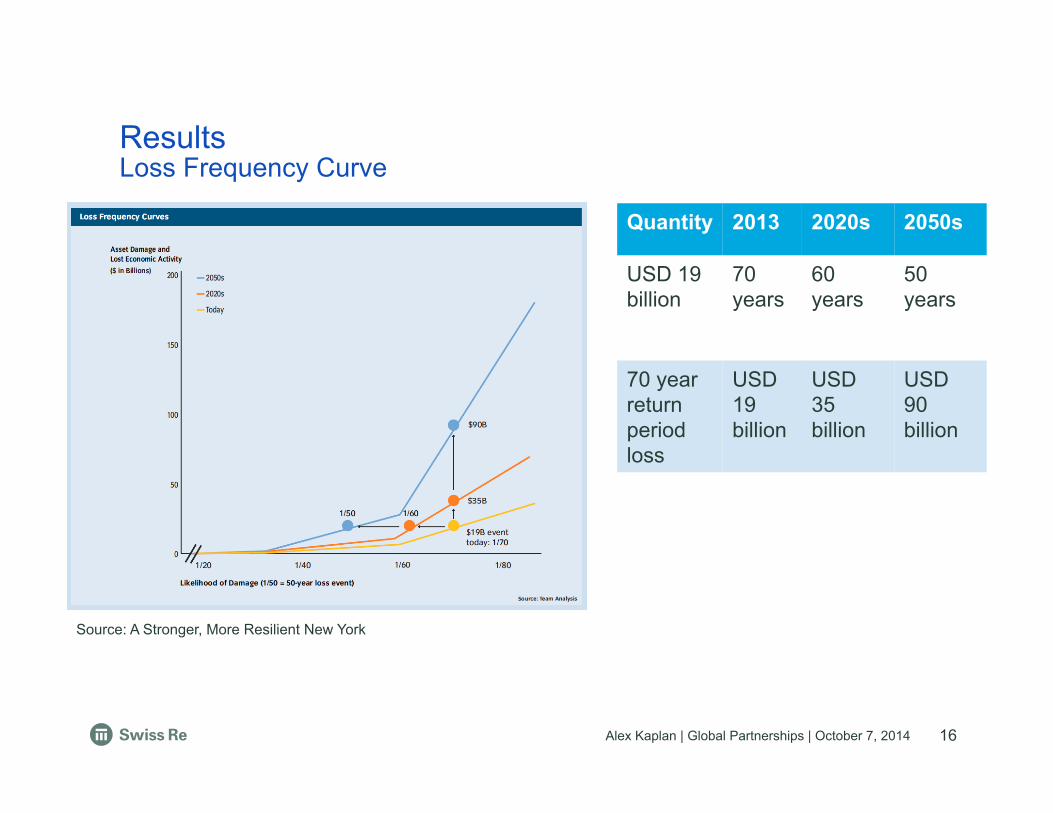
Quantity 2013 2020s 2050s
USD 19 billion
70 years
60 years
50 years
70 year return period loss
USD 19 billion
USD 35 billion
USD 90 billion
Results Loss Frequency Curve
16
Source: A Stronger, More Resilient New York

Alex Kaplan | Global Partnerships | October 7, 2014
• Average annual impact to assets and GDP
• Some years will have a single or multiple large losses, other years will be zero.
• Today: USD 1.7 billion
• 2050s: USD 4.4 billion – USD 1.5 billion from sea
level rise
– USD 1.2 billion from changes in storm frequency
Results Annual Expected Loss (AEL)
17
Source: A Stronger, More Resilient New York

Alex Kaplan | Global Partnerships | October 7, 2014
• Model can be used to assess the financial savings from various mitigation efforts.
• Combining the modeled savings with cost estimates can provide helpful guidance for decision makers when selecting which efforts to focus on.
• NYC decided to focus on efforts where the cost-benefit ratio was less than 2.
Results Cost-Benefit Analysis
18
Source: A Stronger, More Resilient New York
Alex Kaplan | Global Partnerships | October 7, 2014 19

Alex Kaplan | Global Partnerships | October 7, 2014
Legal notice
20
©2014 Swiss Re. All rights reserved. You are not permitted to create any modifications or derivative works of this presentation or to use it for commercial or other public purposes without the prior written permission of Swiss Re.
The information and opinions contained in the presentation are provided as at the date of the presentation and are subject to change without notice. Although the information used was taken from reliable sources, Swiss Re does not accept any responsibility for the accuracy or comprehensiveness of the details given. All liability for the accuracy and completeness thereof or for any damage or loss resulting from the use of the information contained in this presentation is expressly excluded. Under no circumstances shall Swiss Re or its Group companies be liable for any financial or consequential loss relating to this presentation.