Alan M. Taylor - TU Wien · Alan M. Taylor 65 Globalization: A Historical Perspective Today,...
18
Alan M. Taylor Professor of Economics University of California, Davis
-
Upload
phungtuong -
Category
Documents
-
view
215 -
download
1
Transcript of Alan M. Taylor - TU Wien · Alan M. Taylor 65 Globalization: A Historical Perspective Today,...

Alan M. TaylorProfessor of EconomicsUniversity of California, Davis

Alan M. Taylor
◊ 65
Globalization:A Historical Perspective
Today, globalization is probably one of the most overused words in eco-nomics, if not in all of daily life. Even so it seems fundamental to any un-derstanding of our present predica-ment. Its potential benefits seem all too apparent. The fast growing devel-oping economies are all very well in-tegrated into the world economy; conversely, no economically isolated country has ever really prospered. Thus it was no surprise to hear UN Secretary General Kofi Annan say that “the main losers in today’s very unequal world are not those that are too exposed to globalization, but those who have been left out.”
The question I want to ask is: how can history help us understand this phenomenon of globalization? A re-cent wave of research has focused on the causes and consequences of glo-balization and is based on a interdisci-plinary approach which brings to-gether international economics, eco-nomic growth, and economic history. Methodologically this kind of histori-cal approach has appeal since the global economic laboratory, if you will, provides data not only across space but also across time, from pre-vious centuries to the present era.
An emerging subfield called New Comparative Economic History, is devoted to exploring relationships over the very long run. Its strategy is to focus on the economic environ-ment and look across institutions, re-gimes, and policies – and link these to outcomes such as growth, infla-tion, trade, capital movements, and so on. In this lecture I will focus on some of the lessons of that history and how they can help us make sense of
the current era of globalization, and I want to focus on three distinct themes.
First, despite the common per-ception that globalization today is something new and remarkable I want to argue that this is not really the case and rather that there was a precursor to the present era of globalization. Moreover, we can make some inter-esting comparisons between the pres-ent era and the past era and learn something from them. One dramatic difference is the ability of the global capital market in the past to direct capital flows to poor countries, as compared to today. The weakness of capital flows to poor countries has al-ready been alluded to in several of the presentations in the conference so far, but I want to make some further ob-servations. Indeed, today it seems as if many of the flows go in reverse or “uphill” from poor to rich – this was something that Malcolm Knight al-luded to. It turns out that this was much less the case 100 years ago – an interesting observation in and of it-self. And thinking about these differ-ences, and what lies behind them, can help us better understand where the challenges lie for today’s emerging markets. In brief, for countries with weak institutions the prospects of a high pay-off from financial globaliza-tion look to be rather poor.
Second, I am going to try to draw another lesson from historical re-search. There is no doubt that open-ing up to the global capital market can place constraints on policymak-ers. This notion is summed up in the famous macroeconomic policy trilemma. A most important implica-

66 ◊
Alan M. Taylor
tion of the trilemma is that fixed ex-change rates and open capital markets pose the greatest threat to policymak-ers’ autonomy. And as we know from recent experience, this type of policy regime can brutally expose any in-consistent policies. Remarkably, his-torical research has shown that these constraints are as tight today as they were under the gold standard a cen-tury ago. This is very striking because we know that the gold standard was, of course, a very hard regime. Yet, today, policymakers often act with-out due consideration of the strait-jacket imposed by their regime choices when they take on an open peg. The crises in developing countries in the last decade have ensured, perhaps, that this lesson has finally been learned, albeit at a great cost. The fi-nancial opening of emerging markets will now proceed with those recent crises in mind and possibly, as a re-sult, in a much more measured and cautious way. And again, the relation-ship with institutions is clear: coun-tries with weaker institutions face a bigger downside from financial glo-balization if they have not taken on board the lessons of the trilemma.
Third, in light of these first two observations, I conclude with a dis-cussion of whether globalization can survive. I will answer with a qualified yes. Perhaps a more qualified yes than a global optimist would have offered a decade ago during the heady days of the Washington Consensus Mark 1. But by now, in contrast, we are all well aware that many of the poorest countries may have little to gain and much to risk from a headlong rush to-wards unfettered capital mobility. Those very poor countries have such low productivity that little new capi-
tal would flow in (and in some cases might on net flow out) offering few gains. Meanwhile, their macroeco-nomic policy frameworks and finan-cial systems are so fragile that the risk of crisis can be very high.
These lessons are now widely grasped – something has changed on the way to what I think of as the Washington Consensus Mark 2. The realization has dawned that the costs and benefits of financial globalization have to be weighed up on a case-by-case basis. True, eventually we would hope that all countries would proceed through economic and institutional development to a point where they will follow today’s advanced coun-tries in embracing global capital mar-kets. And once at that emerging stage, the gains from opening will outweigh the potential risks. For those reasons, I will conclude on a cautiously opti-mistic note that globalization is still the future, although it may take some time to reach its full fruition.
To start with a look at history, we can examine some important trends in the data from globalization in the past and present to see some interest-ing parallels and differences between the two eras.
One thing we should note is the remarkable quantitative similarities between globalization in the past, 100 years ago, and today. For example, based on data taken from my work with Maurice Obstfeld, we know that around 1870 the ratio of foreign as-sets to GDP in the world economy was under 10%; yet just under a cen-tury later the ratio was fairly similar, around 10% in 1960. But there fol-lowed in each era a spectacular growth in foreign investment. The foreign assets to GDP ratio rose to

◊ 67
Alan M. Taylor
about 20% in 1913 and about 30% in 1980 and roughly 60% by the year 2000. In both eras there was a dra-matic take-off in foreign investment, a pattern that is supported by many other measures of financial integra-tion, and which leads us to some in-teresting preliminary observations. While globalization had proceeded in a more or less unidirectional fashion for four centuries up to 1913, in the course of the twentieth century, mea-sures of global integration followed a pronounced U-shape (chart 1). In fact by the middle of the twentieth cen-tury the world had virtually retreated into autarky. This lecture is going to focus mainly on macroeconomic trends since time is limited but some of the patterns are obviously true with respect to the integration of goods markets, and on so many di-mensions we can properly speak of two eras of globalization.
What happened in between? Well, in short, two wars and a Great De-pression. These severe dislocations destroyed all the features of the global economy that had been almost taken for granted in 1913. In many countries, monetary policy was removed from
the gold anchor by the needs of infla-tionary finance in wartime and as a defence against deflation in the 1930s. Discretion took the place of rules and the political calculus changed: the nominal anchor had to take a back seat to macroeconomic management – in democracies, political pressure mounted behind the expectation that governments would use aggregate de-mand policies to try to sustain full employment. Other countries sought autonomy by reaching for capital con-trols. Many countries did so during wartime, and others did so when fac-ing devaluation pressure and gold drain. Thus, by the 1930s and 1940s, monetary autonomy was the cat that had gotten out of the bag. And it has proven very hard to put it back.
In the rebuilding of the world economy that took place after World War II, a different compromise was made under the Bretton Woods sys-tem. Capital controls, which had long been considered anathema, a danger-ous heresy, had become an accepted norm. Why was that choice made? Well, that is something to be con-fronted in a moment, when we turn to the trilemma. But the basic idea is
Chart 1
The Evolution of the Global Capital Market
120
100
80
60
40
20
0
%
Assets/sample GDP
1860
Assets/world GDP
Source: Obstfeld and Obstfeld and Obstf Taylor (2004).Taylor (2004).T
1880 1900 1920 1940 1960 1980

68 ◊
Alan M. Taylor
that capital mobility had to be sacri-ficed to protect pegged exchange rates and, supposedly, make the world safe for trade. For a while it worked. But by the 1960s and 1970s, this sys-tem was no longer stable. Capital mo-bility began to reassert itself despite policymakers’ best efforts to restrain it. And although countries had the ability to adjust dollar pegs through bilateral realignments, the centre country, the United States itself, had no such flexibility. Hence, when the
U.S.A. faced adjustment pressure, coordination was insufficient, and the system unraveled. The result was generalized floating among the rich countries. But as these pegs broke, so too did the case for capital controls. Starting in the late 1970s, the devel-oped countries started to lead the world down the path towards finan-cial openness.
Even in European countries, where mutual pegged exchange rates were not so easily discarded, it was a
Gross Capital Flows
% of GDP
Chart 2a
Source: IMF Source: IMF Source: World Economic Outlook, October 2001,ld Economic Outlook, October 2001,ld Economic Outlook, Figure 4.1, October 2001, Figure 4.1, October 2001, and Figure 4.1, and Figure 4.1, April 2005, Figure 3.2.il 2005, Figure 3.2.il 2005,
Gross
Advanced Economies Developing Countries
FDI Portfolio and banks
Capital Controls
% of country year observations
No restriction Restriction
Industrial Countries: Capital ContrIndustrial Countries: Capital ContrIndustrial Countries: ols2
(percent of all countries)Emerging Market Countries:Emerging Market Countries:Emerging Mark Capital Contret Countries: Capital Contret Countries: ols Capital Controls Capital Contr 2
(percent of all countries)
Chart 2b

◊ 69
Alan M. Taylor
different imperative – that of the EU single market – which pushed in the same direction towards financial openness. And this trend within the EU was not easily reversed, even when tensions inherent in the tri-lemma erupted from time to time, as in the 1992 ERM crisis.
Summary data from the IMF’s World Economic Outlook show that policy changes were correlated on a broad level with changes in capital flows (chart 2). These data offer some prima facie evidence that controls were binding on international invest-ment and that barriers were impor-tant in holding back the expansion of the global financial market.
What happened to flows? After the 1970s, with financial markets be-coming more open, capital flows could surge. They surged first in the countries that opened first: the ad-vanced industrial countries. By 1999, flows of foreign investment in indus-trial countries had risen to about 17% of GDP, about four times their level in 1970. What is also striking in these data is that when barriers started to be dismantled in emerging markets in the 1980s and 1990s, there was also a surge of investment inflows there too, albeit with more volatility. In emerging markets flows had risen to 5% of GDP by 1999, where such flows had been essentially negligible in 1970.
What happened to controls? The data on capital market restrictions show that industrial countries moved to a system with no restrictions fairly rapidly in the 1980s and 1990s; in emerging markets the share of coun-tries with restrictions is still fairly high, perhaps above 50% even today, but the trend is also toward fewer restrictions.
However, we now encounter per-haps the first element of surprise for economists familiar with the neoclas-sical model. Why was so much capital moving between the rich countries in this period? And why was (and is) so little capital flowing to developing countries? This is a famous paradox, one discussed by the Nobel Laureate Robert Lucas. In the Lucas paradox, a naïve neoclassical model suggests that the marginal product of capital ought to be tens if not hundreds of times higher in poor countries compared to rich OECD countries. If that were the case why was any investment hap-pening at all in the rich world?
Well, Lucas, of course, was point-ing out that the model was fundamen-tally wrong. And the same faulty logic keeps on reappearing in public de-bate. I remember the 1994 debate on CNN between Al Gore and Ross Perot, the maverick presidential can-didate and anti-NAFTA campaigner. Perot thought the integration of the U.S. and Mexican economies would lead to what he called a “giant sucking sound” – meaning that he thought all investment would head south of the border. Gore demolished Perot’s ar-gument by pointing out that Mexican wages may well be one-fifth of the U.S. level, but the Mexican economy was only one-fifth as efficient as America: ergo, no real cost advan-tage. Everyone agrees Gore won that debate, but the ideas do not go away. The identity of the workers in ques-tion may sometimes change – think of Chinese factory workers, Indian back office staff, or Polish plumbers – but the fear of the sucking sound persists.

70 ◊
Alan M. Taylor
This begs the question: what is behind those efficiency differences if they really explain the Lucas paradox? It cannot simply be an efficiency-as-technology story. Mexican firms and firms in other poor countries have access to the same high technology, blueprints, and ideas as everyone else. So, economists have come to the con-clusion that we must interpret mac-roeconomic efficiency differently – as being driven by something else. And for want of a better word, or even a clear understanding, economists have labelled that something else “institu-tions.”
In data from the IMF World Eco-nomic Outlook (chart 3) we can see the state of institutions across the world using familiar qualitative mea-sures such as rule of law, property rights, voice in the accountability and so forth. In 1970, the range of insti-tutions was much wider and there were larger areas on the map with poor institutions. So there has been some institutional convergence in the last 20 or 30 years: perhaps suggest-ing better growth prospects for some developing countries. So, here then is one very important factor for us to consider in discussing whether capital
Evolution of Economic Institutions
Source: IMF Source: IMF Source: World Economic Outlook, September 2005,ld Economic Outlook, September 2005,ld Economic Outlook, Figure 3.3. September 2005, Figure 3.3. September 2005,
Chart 3
Economic Freedom Index;Economic Freedom Index; higher = betterhigher = better

◊ 71
Alan M. Taylor
is flowing to the right places – or backwards, or uphill, or however we want to put it. To some degree, capi-tal has been prevented from moving to poor countries by high barriers to capital mobility in poor countries; but capital has also been discouraged from moving by low productivity lev-els in the poor countries. These two explanations have very different pol-icy implications, a point to which I will return later.
But these findings should also in-spire us to look back on a historical time scale to see whether similar ex-planations apply to the patterns of capital flows in other eras.
We can put this finding in some historical perspective by comparing capital flows to poor countries now and in the past. Again, drawing from from my work with Obstfeld, chart 4 shows a histogram, with poor coun-tries on the left, rich countries on the right, sorted by the per capita in-come, and showing how much of the total foreign investment each group of countries managed to attract.
Here we clearly see a major dif-ference between the global capital market of today and that of 100 years
ago. In the late nineteenth century age of globalization, capital flows from Britain flowed to both rich and poor countries. The rich countries were mainly the “new settler” coun-tries of the New World: Canada, Aus-tralia, Argentina – and for a time the United States, before it became a net saver. Those countries were labour scarce and also capital scarce, because they were land abundant. But what we also see in 1913 is that the distri-bution of foreign investments also included a very significant lower tail, with large flows to the two lower quintiles of the world income distri-bution. So the 1913 distribution of foreign investment was bimodal, with twin peaks of the top and at the bot-tom. Capital flowed to rich and poor and poor andcountries.
But the data for the present era, for 1997, show a different pattern. Scarcely any capital is reaching poor countries today. The conclusion must be that the Lucas paradox was not as strong 100 years ago as it is today. Why was that so?
Well, the answers are sometimes a little controversial. Of course it is tempting to say it was all due to
Chart 4
Foreign Capital Inflows to Rich and Poor Countries: Then Versus Now
Average foreign capital to GDP ratio, %
<20
Source: Obstfeld and Obstfeld and Obstf Taylor (2004).Taylor (2004).T
20–40 40–60 60–80 >80
50
40
30
20
10
0
1913, gross stocks1913, gross stocks1913, 1997, gross stocks1997, gross stocks1997,
Per capita income range of receiving countries (U.S.A. = 100).S.A. = 100).S.A.

72 ◊
Alan M. Taylor
imperialism. Indeed, many of the in-vestments in poor countries were in colonies, colonies of Britain and colo-nies of other countries. And there is no doubt that a statistical analysis shows that if you control for empire, it always exerts a large, positive, and significant effect on capital flows. But I should point out that this is not the entire story. The most important test case is Latin America, the only large developing region in the world (with the exception, perhaps, of China and Japan) to escape formal imperial in-fluence early in the nineteenth cen-tury and so become an independent region with sovereignty. Unless we appeal to broad notions of informal empire it is very difficult to explain why so much foreign capital also flowed into Latin America in this pe-riod – except perhaps as an indication that low barriers to capital mobility and sufficiently high efficiency based on institutional development in the region, served to support foreign in-vestment.
Now today it appears those kinds of conditions no longer prevail and the institutional divergence between rich and poor countries has become quite marked by the late twentieth century. Under these conditions high barriers and low productivity in poor countries make it no surprise when we observe most capital flows going from rich countries to other rich countries.
We should also note one other re-lated feature: today’s flows are mainly in gross rather than net form. Rich countries are not generally strongly on one side of the surplus or deficit side of the current account (with one key exception). Thus, as chart 5 shows, the growth in the stock of for-eign capital has been dramatic since 1980. But when you net it out and ask, was this accompanied by a great net movement of capital from credi-tors to debtors within the same sam-ple? – the answer is no. The trends for net capital flows have been flat and at a much lower level. One hun-
Chart 5
Development versus Diversification Finance: Net and Gross Positions 1980–1995
80
70
60
50
40
30
20
10
0
%
Assets/sample GDP
1980
Net assets of creditors/sample GDP
Source: Obstfeld and Obstfeld and Obstf Taylor (2004).Taylor (2004).T
1985 1990 1995
Liabilities/sample GDP Net liabilities of debtors/sample GDP

◊ 73
Alan M. Taylor
dred years ago, the picture was dif-ferent. The world’s major creditors like Britain accumulated very large net foreign asset positions – in Brit-ain’s case perhaps plus 200% of GDP. And those net positions were very close to the gross asset positions. So capital flowed mostly in a one way di-rection from rich creditor to poor debtor. But now capital flows more in a two-way pattern of risk-sharing ex-change between rich country pairs.
What do we learn from this? The lesson is that the rich countries of to-day did not need what we might call development finance. They did not need the kind of one-way capital flows that we encounter in standard neoclassical models. Rather, the rich countries to-day have been engaged in what we might call diversification finance. The risk-sharing benefits of financial glo-balization have promoted large gross flows with close to zero net flows. It is an important observation, which shows that we are seeing rather a dif-ferent type of globalization today than 100 years ago, even though on some dimensions the indicators look rela-tively similar. In fact, it is only really
in the last few years with the emer-gence of the so called “global imbal-ances” that large net flows have hap-pened at all in the present era. But these new flows are really not yet large enough, nor persistent enough, to alter the basic message that diversi-fication finance still dominates net flows in today’s global economy.
Perhaps one of the most remark-able examples of this kind of two way flow is the spectacular build-up of reserves by emerging market econo-mies today and I want to turn to this as I try to link these lessons to the trilemma.
Chart 6 shows net capital flows to emerging markets. The bars show net inflows to the emerging markets. On the negative side are some large flows of resident lending, meaning some people within the country want to hedge their bets and put assets out-side the country. But the large nega-tive amounts are the official settle-ments balance, showing the acquisi-tion of reserves by the authorities within these countries. These stocks of reserves have become huge in the last 3 or 4 years. In fact, these flows
Net Capital Flows to Emerging Market Economies
USD billion
1980
Reserves
Source: MarSource: MarSource: tin WolfWolfWolf, olf “Fixing Global Finance”. SAIS Lectures“Fixing Global Finance”. SAIS Lectures“Fixing Global Finance”. , March 2006., March 2006.,
Chart 6
600
400
200
0
–200
–400
–600
–8001982 1984 1986 1988 1990 1992 1994 1996 1998 2000 2002 2004 2006
Resident lending Official floOfficial floOff ws (other), netws (other), netws (other), Private flows (other), netws (other), netws (other),

74 ◊
Alan M. Taylor
now more than fully offset the private inflows. That is, if you could just sub-tract all of the official intervention, there would not be a Lucas paradox in these countries!
The reason capital is on net flow-ing out of these countries is massive reserve accumulation. And there is a smoking gun here, which is 1997, which occurs about two thirds of the way through the sample in chart 6. Many of these countries observed a massive crisis where many central banks did not have sufficient reserves to protect themselves against specula-tive attack and exchange rate crises. That ended emerging market boom one, and we are now in emerging market boom two. But this one is being accompanied by much more precautionary behaviour on the part of host countries’ central banks. They are accumulating much more massive war chests of reserves.
What is going on? I think future research will be needed to find out exactly what is driving this kind of behaviour, but it does look as if it is a heavy dose of precautionary motives on the part of these central banks that still desire to maintain pegs or dirty floats. In the meantime, of course, they are providing a very helpful credit line to Uncle Sam. The special status of the U.S. dollar is probably crucial in this argument – it being the dominant reserve currency, at least for now, and the currency that most of these countries want to peg to for trade or credit related reasons.
Behind the scenes there is also the notion of “original sin” – whereby many of these countries have been unable to borrow in their own cur-rencies as we learned this morning. That may be starting to change. So,
it is not clear that this behaviour can (or should) carry on forever. How big do the war chests need to be? Pre-sumably when you have the reserves you need to protect yourself, you stop buying the insurance. But for the mo-ment we are still in the midst of this spectacular reserve build-up.
Capital is not simply not flowing into poor countries today, it is flow-ing in a seemingly uphill direction from poor to rich countries in accord with the Lucas paradox. And it is strongly correlated with massive re-serve accumulation.
We have not seen a giant sucking sound except in the wrong direction. This may be because developing coun-tries have low efficiency as well as controls. But many emerging coun-tries also want to maintain pegs, be-cause they have fear of floating for various reasons. Thus temporary re-serve accumulation is a big part of their balance of payments at present.
These points emphasize that we also need to understand the exchange rate regime fully in order to under-stand what is happening in today’s global capital markets. So we need to turn to the lessons from history with respect to macroeconomic policy re-gimes. Or to put it differently, we need to look at the historical record to see how and why globalization puts constraints on policymakers.
To simplify, I am going to employ a narrative device: the macroeco-nomic policy trilemma. A trilemma is like a dilemma, except it is fifty percent more problematic. Instead of there being two choices, there are three. The three choices are the typi-cal policy goals: a fixed exchange rate for stability or integration reasons; capital mobility, for financial flexibil-
◊ 75
Alan M. Taylor
ity on the external balance; and mon-etary policy autonomy, as a way of engaging in macroeconomic manage-ment.
Now, of course you cannot have all three. That is a basic lesson from macroeconomic theory in the open economy. And why is that? Because interest arbitrage means that an open peg must set its interest rate equal to the base rate, modulo a risk premium. An example would be Austria before the euro. To have had interest rates deviate from German levels, Austria would have had to either start float-ing against the Deutsche mark, so that expected depreciation could break simple interest parity; or else Austria would have had to prevent in-terest arbitrage in the first place by putting on capital controls. Thus, you have to choose two out of three, that is a trilemma.
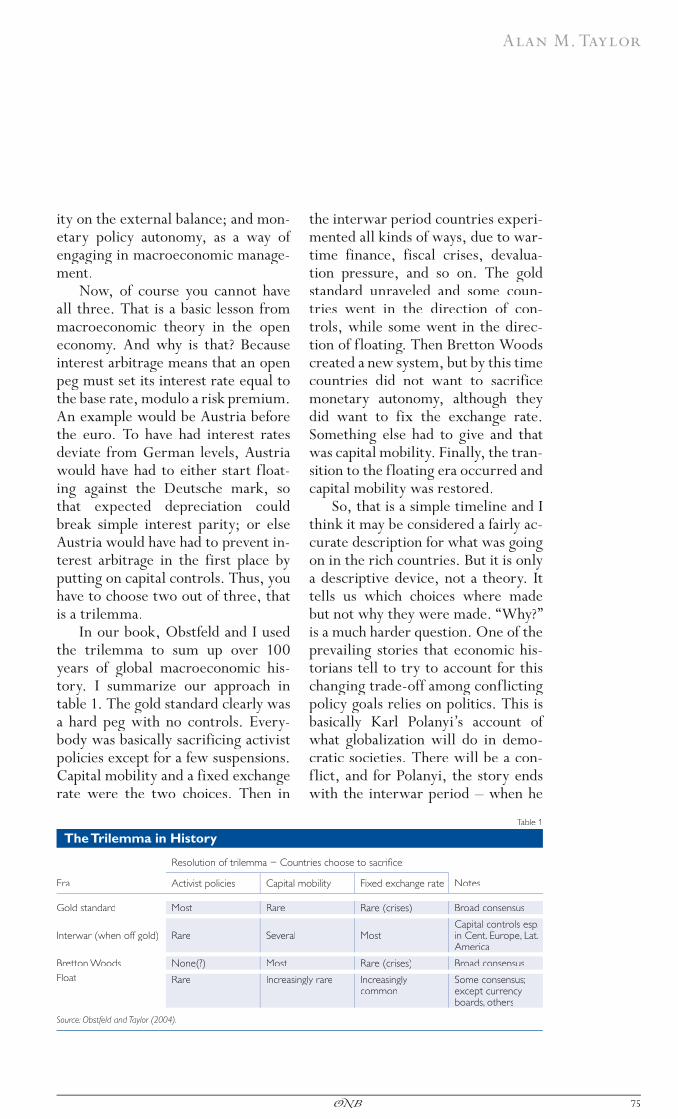
In our book, Obstfeld and I used the trilemma to sum up over 100 years of global macroeconomic his-tory. I summarize our approach in table 1. The gold standard clearly was a hard peg with no controls. Every-body was basically sacrificing activist policies except for a few suspensions. Capital mobility and a fixed exchange rate were the two choices. Then in
the interwar period countries experi-mented all kinds of ways, due to war-time finance, fiscal crises, devalua-tion pressure, and so on. The gold standard unraveled and some coun-tries went in the direction of con-trols, while some went in the direc-tion of floating. Then Bretton Woods created a new system, but by this time countries did not want to sacrifice monetary autonomy, although they did want to fix the exchange rate. Something else had to give and that was capital mobility. Finally, the tran-sition to the floating era occurred and capital mobility was restored.
So, that is a simple timeline and I think it may be considered a fairly ac-curate description for what was going on in the rich countries. But it is only a descriptive device, not a theory. It tells us which choices where made but not why they were made. “Why?” is a much harder question. One of the prevailing stories that economic his-torians tell to try to account for this changing trade-off among conflicting policy goals relies on politics. This is basically Karl Polanyi’s account of what globalization will do in demo-cratic societies. There will be a con-flict, and for Polanyi, the story ends with the interwar period – when he
Table 1
The Trilemma in History
Resolution of trilemma – Countries choose to sacrifi ce:
Era Activist policies Capital mobility Fixed exchange rate Notes
Gold standard Most Rare Rare (crises) Broad consensus
Interwar (when off gold) Rare Several MostCapital controls esp. in Cent. Europe, Lat. America
Bretton Woods None(?) Most Rare (crises) Broad consensusFloat Rare Increasingly rare Increasingly
commonSome consensus; except currency boards, others
Source: Obstfeld and Taylor (2004).

76 ◊
Alan M. Taylor
writes his great work he thinks that the world is headed irreversibly into autarky since domestic interests ex-pressed through the ballot box will require the shutting down of global markets: it is even a fairly accurate story from the interwar period and even through the Bretton Woods era. To accommodate monetary autonomy and full employment goals, some-thing has to give. The Bretton Woods’ solution was to force capital mobility to go out the window. But now we are in a rather different scenario, one not anticipated by Polani or Keynes
or other policymakers of the mid-twentieth century, where a floating exchange rate acts as the ultimate shock absorber in a world of mobile capital. Why the change?
Yet another problem is that the timeline and theory do not fit the periphery very well. In the develop-ing countries the trade-off was very different. We can speculate that there are some important differences here, one of which is that the developing world has generally been slower in moving down the path toward de-mocracy, which is undoubtedly true, and so the pressures on monetary policy from a populist dimension were perhaps weaker. That is not to say that they have not made them-selves felt in some countries particu-larly strongly. But there are obviously
other important factors in play and I would single out one.
The fear of floating derived in part from original sin, whereby emerging markets had currency mis-matches causing them to be much keener to peg. On the other hand, they also wanted access to external finance and so found capital controls unwelcome. This put them in a very uncomfortable position – a bipolar choice as Stan Fischer has called it. Either they could adopt a very hard peg and give up autonomy or adopt floating with a risk of large valuation effects on external wealth. And that is probably why we have seen more policy experimentation and more volatility in many of these developing coun-tries. In this way the trilemma story can still be applied to the developing countries but only if we understand that the costs and benefits, and the trade-offs were a little bit different.
Still, should we believe the tri-lemma story anyway? I now present one brief table of results from work (Obstfeld et al., 2005) where Maurice Obstfeld, Jay Shambaugh, and I tried to estimate whether countries did in fact face the constraints implied by the trilemma.
We compared the historical clas-sical gold standard period before World War I with the Bretton Woods and the post-Bretton Woods eras. We were interested in whether a country that pegs to some base currency has to follow the base interest rate and sacrifice monetary autonomy. We re-gressed the change in the home inter-est rate on the change in the base in-terest rate and looked for a large and significant slope coefficient and a high measure of fit as evidence of foregone autonomy.

◊ 77
Alan M. Taylor
What did we find? In table 2, col-umns 1 and 2, before World War I there was a strong past through from the base rate to the local rate for pegs, with a coefficient of 0.51. It is not one, because the gold standard (like many fixed regimes) had target zone attributes, which provided limited room for manoeuvre. In contrast, for floating regimes before World War I, the coefficient was 0.16 and there was no fit at all. So the regime mattered; open pegs had tight constraints, floats did not. This illustrates the policy dilemma facing open countries. In column 3, under Bretton Woods we finally see the other element in the trilemma with capital controls pres-ent. With controls, pegging should not constrain monetary autonomy, and the data say as much. Here pegs could have an interest rate policy in-dependent of the base: that was, after all, exactly the point of Bretton Woods. There were no floating re-gimes in Bretton Woods, so column 4 is empty. Finally, columns 5 and 6 show the post-Bretton Woods era, and again we can compare pegs and floats in an era of globalization, and we find coefficients that are fairly consistent with our story. A coeffi-cient of about 0.5 on pegs is very sim-ilar to what we found in the gold stan-dard era. If you peg today it is really
just as hard a regime as if you pegged under the gold standard, so watch out. Floating countries have a higher coefficient than a century ago, but also a pretty large standard error. It could be that there is more policy correlation in contemporary floats either because of more global shocks or because there has also been a great deal of convergence on inflation tar-gets and other ways of conducting monetary policy.
The bottom line is that the tri-lemma works in practice, not just in theory. Pegging today is a really hard regime, a tight constraint. It is like being on gold a hundred years ago. Nobody thought of that as a soft re-gime. So you really ought to have pretty compelling reasons to peg to-day. Either because you have fear of floating or perhaps you have a lack of pressure for an autonomous monetary policy. The factors pushing develop-ing countries toward pegging are these kinds of special factors, factors that are largely absent in the devel-oped countries.
There has to be some concern here about that particular regime choice. The emerging market open pegs were precisely the regimes that blew up in the 1990s. It is very hard for countries to credibly say “we are going to peg forever.” My real point
Table 2
Evidence for the Trilemma: Interest Rate Comovement by Regime Type
Interest rate pass-through regression, using annual data, in differences. OLS regression of home country interest rate on base country interest rate
Gold Standard de jure Bretton Woods Post-Bretton Woods
peg fl oat peg fl oat peg fl oatN 355 140 142 . . 748 1171Slope 0.51 0.16 -0.05 0.46 0.3std. error 0.04 0.06 0.1 0.04 0.1R2 0.36 0.05 0 0.19 0.01
Source: Obstfeld et al. (2005).

78 ◊
Alan M. Taylor
here is that we must focus on the developing countries because that is where the policy challenges are prob-ably the greatest. What we have there are the most serious crisis risks. Many of these countries obviously have a fear of floating, a major balance sheet problem; they also have policy vola-tility, and underlying political weak-nesses. Many of them may be subject to larger economic shocks, to the terms of trade or to the foreign inter-est rate plus the risk premium. Many of them have weaker institutions, fi-nancial sector weaknesses, a lack of central bank independence, and fiscal fragility.
So, summing up, can globaliza-tion survive in this kind of environ-ment and by survive I do not just mean within the rich world, but across the whole world? Can it survive in a way that addresses Kofi Anan’s concern – and everybody else’s concern – that globalization be not just a rich coun-try phenomenon, but have the ability to bring everyone along the path to higher productivity, higher standards of living and full integration into a prosperous world economy?
I offer a cautious yes, and I will try to spell out the reasons. I think there are great benefits arising from global-ization, and I am not going to contra-dict what was said by the earlier speakers. The problem is that as of now, these benefits are not clearly availale in all countries. The benefits of globalization may be very low in poor countries until they fix their in-stitutional environment. The reason they are poor has a lot to do with poor institutions. The benefits of globaliza-tion, however, might be much higher in emerging markets. That is why they are called emerging markets. And in
the case of those countries where capital controls might be binding on foreign investment and where a relax-ation of restrictions on capital mobil-ity could ease the savings constraint, globalization can encourage further investment in those countries and put them on a faster growth track.
So the benefits are lower in poor countries, higher in emerging mar-kets. The costs of globalization follow an exact opposite pattern. They are probably very high in poor countries where they do not have the financial architecture and the supervision and the prudential regulation to manage the dangers of financial openness as well. The costs of crises are always there, but the probabilities are lower – not zero, but lower – in more insti-tutionally advanced emerging markets.
I think of these nuances as being the key difference between Washing-ton Consensus 1 and Washington Consensus 2. A one-size fits all recommendation – that everybody should just open up and liberalize their financial markets – is no longer defensible. A simple minded approach of just saying everybody should finan-cially liberalize right now and all will be well – that is an idea that seems to have gone out of the window.
Though, I am not sure it was ever really taken seriously. It is a little bit of a caricature that has been circulat-ing – that there was this “IMF-Wall Street-Treasury complex,” a scary sounding idea that brings to mind visions of sinister conspiracies, black helicopters, and so on. Allegedly, the devious plan was to get everybody to indiscriminately open their capital ac-count in the 1990s. You can hear plenty of people in the anti-global lobby talk-ing about it in those terms even today.

◊ 79
Alan M. Taylor
But the reality was rather differ-ent. One could look at, say, IMF ad-vice to Thailand before, during, and after the crisis. One might read some of Stanley Fischer’s descriptions of how policy was conducted, or accounts of journalists like Paul Blustein of the Washington Post. What comes across is a much more detailed view of how globalization was handled by various countries. In many cases the view of how globalization should have been handled did not conform to what was actually done. There was far too much short term landing in foreign curren-cies, for example. We all know where that led.
Here is Fischer giving his AEA Ely Lecture in 2003, looking back on this experience:
“There is far more controversy about capital account liberalization as part of a growth strategy than there is about current account liberalization. That is not surprising, for as the Asian crisis drove home, a country with an open capital account is more vulner-able to external shocks than one that is closed to external capital flows.
In considering capital account lib-eralization, I assume that countries will and should at some stage in the course of their development want to lib-eralize the capital account and inte-grate into global capital markets. This view is based in part on the fact that the most advanced economies all have open capital accounts; it is also based on the conclusion that the potential benefits of well-phased and well-sequenced integration into the global capital markets – and this includes the benefits obtained by allowing for-eign competition in the financial sec-tor – outweigh the costs”. (emphasis added)
I agree with Fischer. We should expect developing countries to want to globalize eventually. But not the poor ones; and not all at once. But there is a trend towards more open-ing over time as more countries grad-uate to “emerging market” status.
This is more or less what we see happening, despite all the anti-global rhetoric and the associated fears that globalization might face a backlash. If you look at the indicators of capital market openness you will see some occasional stops and starts. We might see some reversion to capital controls
– for example, as in Malaysia during and after the crisis. But like most emerging markets, in the long run Malaysia wanted to restore an open capital market and eventually took the controls off. In most emerging countries, if policymakers temporar-ily reach for controls they still do want to eventually withdraw them and become a part of the global capi-tal market, like all other members of the developed-country club. How-ever, in non-emergers – that is, the very poorest developing countries with the weakest institutions – con-trols remain highly prevalent, as prob-ably they should, given the relative costs and benefits.
Still, some countries are going to make the wrong choices. When do benefits outweigh the costs? We can

80 ◊
Alan M. Taylor
run regressions all we want, but in the real world we cannot capture all of the costs and benefits that coun-tries face. We will probably see coun-tries open up too soon and have a crisis or three; we will also see coun-tries open up too late and postpone growth. But I do not think we should underestimate the probability that these transitions will continue and carry the world towards greater openness. Institutional transitions do happen. Countries do improve their institutions. The historical data show that.
So to conclude, I do want to look on the bright side. We do hope that all countries will develop better insti-tutions and will progress towards prosperity as they would even if they were closed economies. There will probably be setbacks along the way.
But once countries mature enough, the benefits of globalization will out-weigh the costs and I expect that openness with follow from that.
One may look back at the twen-tieth century and see that great U-shape in the pattern of globaliza-tion, that great autarkic detour that we took in the history of the world economy, and one may be tempted to ask – will it happen again? I do not think that great reversal can be fully attributed to a rational calculus – to political economy or to changes in the tradeoffs between openness and autarky. I think what it can primarily be attributed to are two world wars and a great depression. And as long as we can avoid a repeat of those sorry events, we should avoid another great reversal. õ
ReferencesBlustein, P. 2001. The Chastening: Inside the Crisis that Rocked the Global Financial.
System and Humbled the IMF. Public Affairs.Fischer, S. 2003. Globalization and Its Challenges. In: American Economic Review Papers
and Proceedings. May. 1–32.Obstfeld, M., J. C. Shambaugh and A. M. Taylor. 2005. The Trilemma in History:
Tradeoffs among Exchange Rates, Monetary Policies, and Capital Mobility. In: Review of Economics and Statistics 87. August. 423–38.
Obstfeld, M. and A. M. Taylor. 2004. Global Capital Markets: Integration, Crisis, and Growth. Japan-U.S. Center Sanwa Monographs on International Financial Markets. Cambridge: Cambridge University Press.