hwbdocuments.env.nm.gov Alamos National Labs/TA 33/47… · " ~~-} 1J -" ~) ~ \:::, Los . ~~ Alamos...
115
" 1J -" \:::, Los . Alamos National ENVIRONMENTAL RESTORATION / Unltierslty of Ca/Nomla Environmental Restoration, MS M992 Los Alamos, New Mexico 87545 505-665-4557 FAX 505-665-4747 Ms. Barbara Driscoll RCRA Permits Branch US Environmental Protection Agency Region 6 1445 Ross Ave., Suite 1200 Dallas, TX 75202-2733 Date: Refer to: U.S. Department of Energy r(f;tl / Los Alamos Area Office, MS A316 1 / Los Alamos, New Mexico 87544 505-665-7203 (.,; v FAX 505-665-4504 / flAY 2 4 1995 . /tJ EM/ER:95-224 i!J. tf1:u_ © rn D\\7 rg '\ MAY 3 J 1995 .\i SUBJECT: RESPONSE TO NOTICE Of DEFICIENCY (NOD) CONCERNING RESOURCE CONSERVATION AND RECOVERY ACT FACILITY INVESTIGATION (RFI) TECHNICAL AREA (TA) 33. WORK BREAKDOWN STRUCTUiffi-NUMBER 1.4.2.6.1.3.1.4 Dear Ms. Driscoll: Enclosed is the Los Alamos National Laboratory's (the Laboratory's) response to the Environmental Protection Agency's NOD concerning the RFI Report for TA-33 dated January 26, 1995, and a certification form signed by the appropriate Laboratory official. The NOD was received at the Los Alamos Area Office on April28, 1995. A response within thirty days is required by the regulatory agency. The enclosed response shows the comments from the NOD and proposed responses. The majority of the package consists of technical details of calculations and support documentation as attachments to this NOD response. A documented quality review of the enclosed response has been performed in accordance with administrative procedure LANL-ER-AP-01.3. /lll/lllll///lllll/11111//lll/ 4719
Transcript of hwbdocuments.env.nm.gov Alamos National Labs/TA 33/47… · " ~~-} 1J -" ~) ~ \:::, Los . ~~ Alamos...
" ~~-} 1J
-" ~)
~ \:::,
Los . ~~
Alamos National Laboratory~~ ENVIRONMENTAL RESTORATION ~ / ~
Unltierslty of Ca/Nomla Environmental Restoration, MS M992 Los Alamos, New Mexico 87545 505-665-4557 FAX 505-665-4747
Ms. Barbara Driscoll RCRA Permits Branch US Environmental Protection Agency Region 6 1445 Ross Ave., Suite 1200 Dallas, TX 75202-2733
Date: Refer to:
U.S. Department of Energy r(f;tl / Los Alamos Area Office, MS A316 1 / Los Alamos, New Mexico 87544 ~
505-665-7203 (.,; v FAX 505-665-4504 /
flAY 2 4 1995 . /tJ ~ EM/ER:95-224 ~. i!J. tf1:u_
~rn © rn D\\7 rg ~~ '\ MAY 3 J 1995 .\i ~
SUBJECT: RESPONSE TO NOTICE Of DEFICIENCY (NOD) CONCERNING RESOURCE CONSERVATION AND RECOVERY ACT FACILITY INVESTIGATION (RFI) REPORT~OR TECHNICAL AREA (TA) 33. WORK BREAKDOWN STRUCTUiffi-NUMBER 1.4.2.6.1.3.1.4
Dear Ms. Driscoll:
Enclosed is the Los Alamos National Laboratory's (the Laboratory's) response to the Environmental Protection Agency's NOD concerning the RFI Report for TA-33 dated January 26, 1995, and a certification form signed by the appropriate Laboratory official. The NOD was received at the Los Alamos Area Office on April28, 1995. A response within thirty days is required by the regulatory agency.
The enclosed response shows the comments from the NOD and proposed responses. The majority of the package consists of technical details of calculations and support documentation as attachments to this NOD response. A documented quality review of the enclosed response has been performed in accordance with administrative procedure LANL-ER-AP-01.3.
/lll/lllll///lllll/11111//lll/ 4719
Ms. Driscoll -2-· EM/ER:95-224
Please let me know if there are any questions about this response to the NOD, or contact Brad Martin at (505) 667-6080 or Everett Trollinger at (505) 667-5801.
Sincerely,
~~~Manager Environmental Restoration
JJ/TT/bp
Enclosures: {1) Response · ,' (2) Si-d <r. e~4=ication Form
• " I /L;~L!i l i •. ' (W,\ I "..i ~ ',tl
Cy (w /enc.): \ )! :\ B. Garcia, NMEU" _ _. · ....
1 T. Glatzmaier;· E>D~W, MS M992 D. Griswold, ERD, AL, MS A906 B. Martin, CST-18, MS E525 D. Mcinroy, EM/ER, MS M992 E. Merrill, HQ, EM-452 G. Rael, ERD, AL, MS A906 T. Taylor, AAMEP, LAAO, MS A316
~ Th~d~ Ft::Program Manager Los Alamos Area Office
E. Trollinger, AAMEP, LAAO, MS A316 J. White, ESH-19, MS K498 S. Yanicak, NMED-AIP, MS J993 EM/ER File, MS M992 LAAO File, MS A316 RPF, MS M707
Cy (w /o enc.): T. Baca,EM,MSJ591 J. Jansen, EM/ER, MS M992 W. Spurgeon, HQ, EM-452 J. Vozella, AAMEP, LAAO, MS A316 N. Weber, Bureau Chief, NMED-AIF, MS J993 File: 1.4.2.6.1.3.1.4
Environmental
Restoration
An Equal Opportunity Employer/Opefated by the University of California
.,
: t
CERTIFICATION
I certify under penalty of law that these documents and all attachments were prepared under my direction or supervision in accordance with a system designed to assure that qualified personnel properly gather and evaluate the information submitted. Based on my inquiry of the person or persons who manage the system, or those persons directly responsible for gathering the information, the information submitted is, to the best of my knowledge and belief, true, accurate, and complete. I am aware that there are significant penalties for submitting false information, including the possibility of fine and imprisonment for knowing violation.
Document Title:
Name:
Name:
Response To Notice Of Deficiency (NOD) Concerning Resource Conservation And Recovery Act Facility Investigation (RFI) Report For Technical Area (TA) 33 Work Breakdown Structure Number 1.4.2.6.1.3.1.4
fom Baca, Program Director Environmental Management Los Alamos National Laboratory
or
Jorg Jansen, Project Manager Environmental Restoration Project
Los Abmo~itiJ.lf!L-ry
Joseph Vozella, Acting Assistant Area Manager of Environment Projects Environment, Safety, and Health Branch DOE-Los Alamos Area Office
Theodore J. Taylor Program Manager
or
Environment Restoration Program DOE-Los Alamos Area Office
Date: shr:,..lct\
Date: _~__,_)_"2-_'2----:...) _q_{ __

" '' t ,..,.,
NOO Beosonse for TA-33 Bf! Report Qated J&nuaor 31. 1995
Response to Notice of Deficiency RFI Report LA·UR·95·882
Operable Unit 1122, TA·33
In the notice of deficiency for the January 31, 1995, RCRA facility investigation (RFI) report f~r
Technical Area 33, (TA-33) the Environmental Protection Agency (EPA) requested figures and
several sets of calculations. Los Alamos National Laboratory (LANL) is supplying the requested
information as attachments to this response (Table 1).
TABLE 1
LIST OF ATTACHMENTS
DEFICIENCY ATTACHMENT SUBJECT NUMBER NUMBER
2 2-1 Calculations: mean and upper confidence limit for lead
2 2-2 Lead modelina results for PRS 33-004(i)
4 4-1 Fiaures of overlapping PASs in LA-UR-95-882
5 5-1 Lead modeling results for PRS 33-015
6 6-1 Equations used in risk assessment at PRS 33-011{C!}_
6 6-2 Attachment 1 Appendix K (LANL 1993 1 017)
6 6-3 Risk assessment results at PRS 33-011{a)
6 6-4 Copy: Bradley et al. (1993, 1144)
List of Deficiencies
1 • Statistical Methodology, p. 21 - LANL should provide the methodology of how
they will compare the upper tolerance limits from the background data with the upper
confidence limits calculated from data for the risk assessment.
Response: LANL does not plan to compare the upper tolerance limits (UTLs) for the
TA-33
background population to upper confidence limits (UCLs) on the means over exposure
units calculated for risk assessments. UTLs are used solely to compare potential release
site (PRS) concentration data to local background levels in order to determine whether a
particular constituent may have been released from that PRS. UCLs on means are
compared with risk-based thresholds such as cleanup levels or preliminary remediation
goals. The UCL is used as the concentration input term in the performance of a risk
assessment.
May23, 1995

NO[) RespaJStt forTA-33 klrl R1mt [)aled Jji!WI'f 31 I 1995
2 • 33-004(1) - In order for EPA to evaluate the risk assessment which was conducted LANL
must provide their calculations and a computer printout verifying their reported values.
Response: Two attachments are provided.
• Attachment 2-1 describes how the mean and 95% UCL concentrations for soil lead
levels were developed. The calculations from SPLUS programming code are also
included in Attachment 2-1.
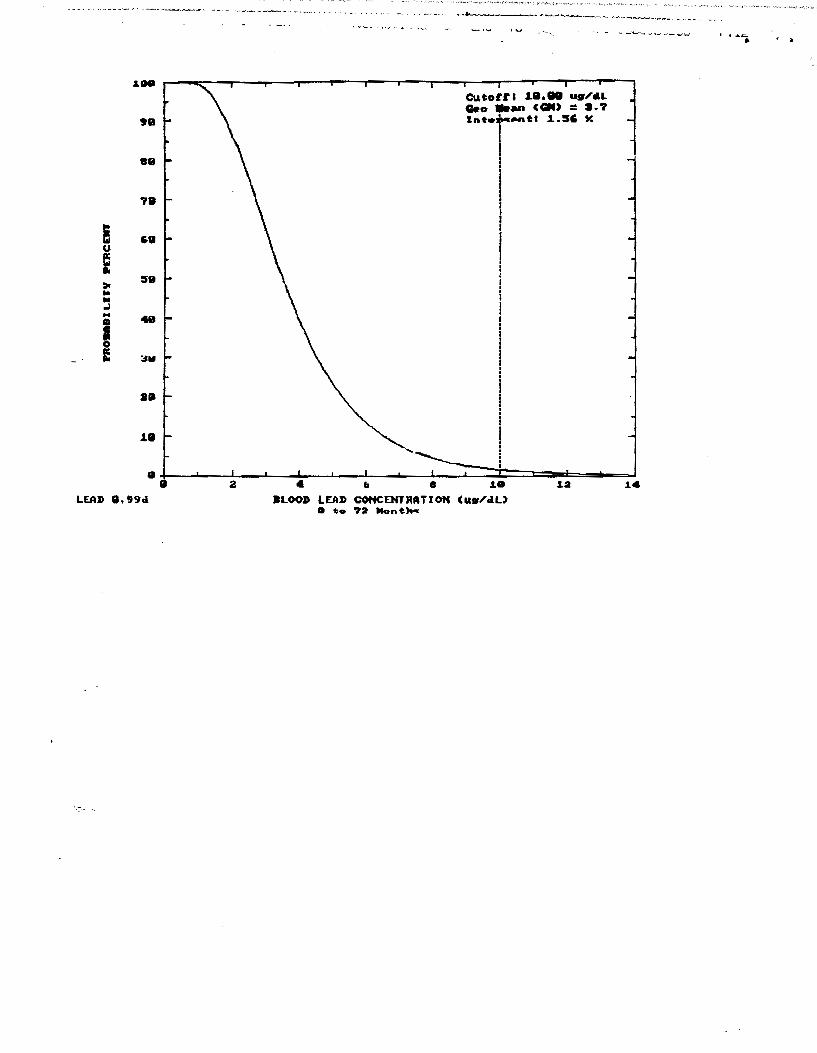
• Attachment 2-2 is the computer printout generated by running EPA's Integrated
Exposure Uptake Biokinetic (IEUBK) Model, Version 0.99d, for lead in children (EPA
1994, 1178). The printout presents the multimedia exposure parameters (i.e., input)
used in running the model, as well as the modeling results.
The value of the 95% UCL concentration is 211 mglkg for lead in soil at PAS
33-004(i). This value was used as input to the IEUBK model (soil and dust), as stated
in the first paragraph, last sentence, on page 70 of the AFI report. The value of
416.3 mglkg was incorrectly reported in the second paragraph, last sentence, on
page 70 .
. The other input parameters were developed in accordance with EPA's Guidance
Manual for the Integrated Exposure Uptake Biokinetic Manual for Lead in Children
(EPA 1994, 1178). The model itself was developed by EPA and was not modified in
any way for the modeling exercise conducted at PAS 33-004(i).
3. 33-GOS(a,b,c)- Toluene was reported in a method blank, as well as several samples;
however this information was not presented in the report. LANL needs to provide this
information.
Response: On page 74, third paragraph of the AFI report, organic compounds found in samples
at the former site of TA-33-21 were attributed to overlapping PAS 33-011 (a) because
organic contaminants are more characteristic of the PAS 33-011(a) drum storage area
than of the plutonium cleanup investigation of PASs 33-G05(a,b,c) (LANL 1995, 1212).
Because of this transfer of contaminants, no organics were reported for PASs
33-005(a,b,c). Instead, all organics at the former site of TA-33-21 are reported on pages
109 and 110 of the AFI report in conjunction with PAS 33-011 (a). The toluene
contaminated blank is mentioned in the first paragraph of the Data Qualifications box at
May 23,1995 2 TA-33
, • t
NOD Beosonse for TA-33 REI Beoort Pate<! January 31. 1995
the end of Table 4-17 on page 11 0. Toluene is not reported in the tables because its
presence in the samples Is considered lab contamination.
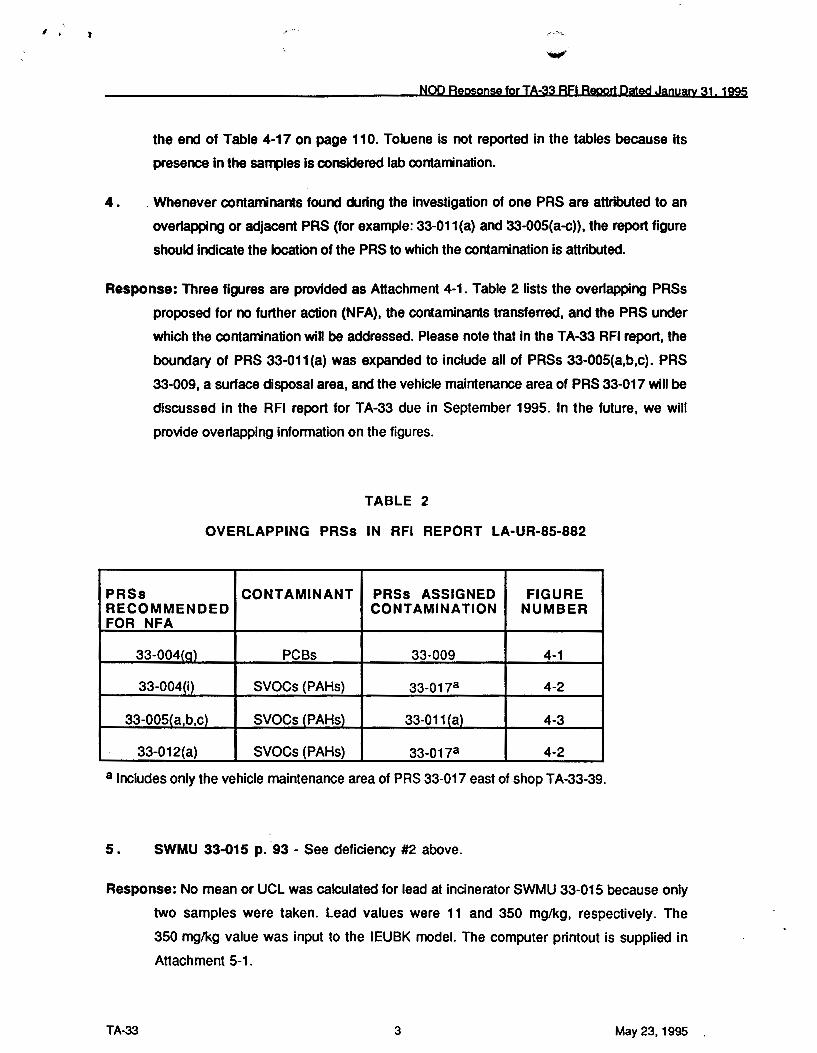
4. _Whenever contaminants found during the investigation of one PRS are attributed to an
overlapping or adjacent PRS (for example: 33-011 (a) and 33-00S(a-c)), the report figure
should indicate the location of the PRS to which the contamination is attributed.
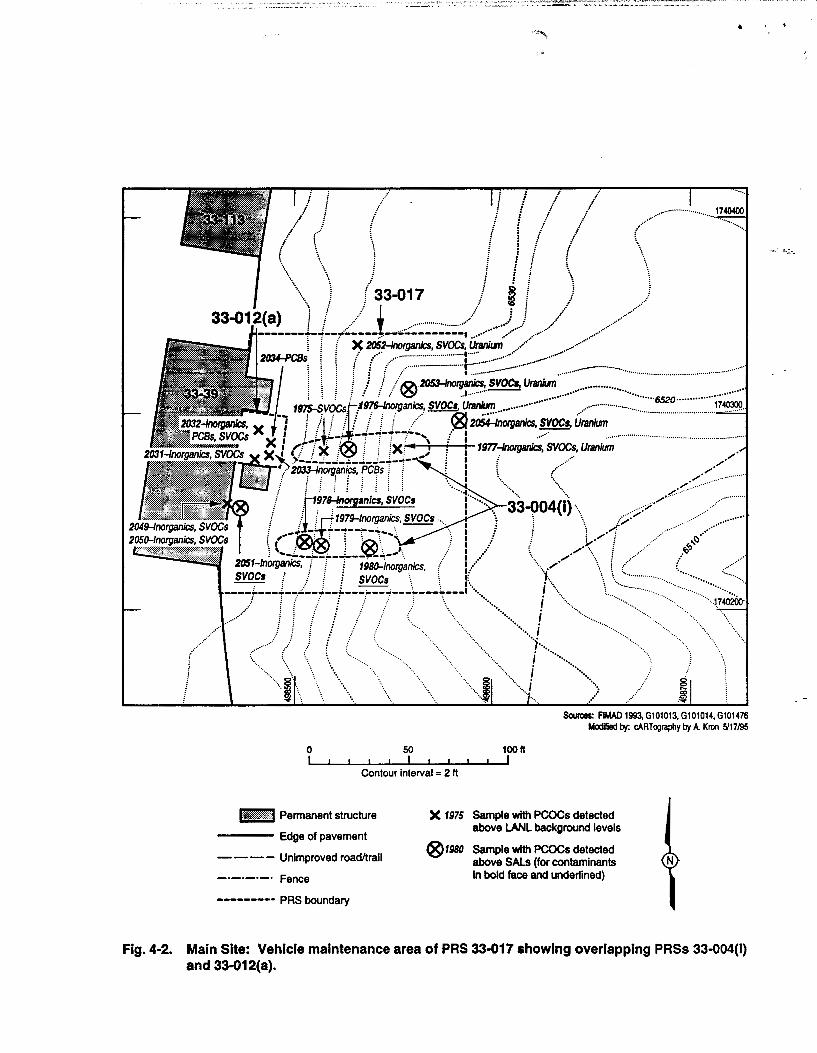
Response: Three figures are provided as Attachment 4-1. Table 2 lists the overlapping PRSs
proposed for no further action (NFA), the contaminants transferred, and the PRS under
which the contamination will be addressed. Please note that in the TA-33 RFI report, the
boundary of PRS 33-011(a) was expanded to include all of PRSs 33-00S(a,b,c). PRS
33-009, a surface disposal area, and the vehicle maintenance area of PRS 33-017 will be
discussed in the RFI report for TA-33 due in September 1995. In the future, we will
provide overlapping information on the figures.
TABLE 2
OVERLAPPING PASs IN RFI REPORT LA-UR-85-882
PASs CONTAMINANT PASs ASSIGNED FIGURE RECOMMENDED CONTAMINATION NUMBER FOR NFA
33-004(g) PCBs 33-009 4-1
33-004(i) SVOCs (PAHs) 33-017a 4-2
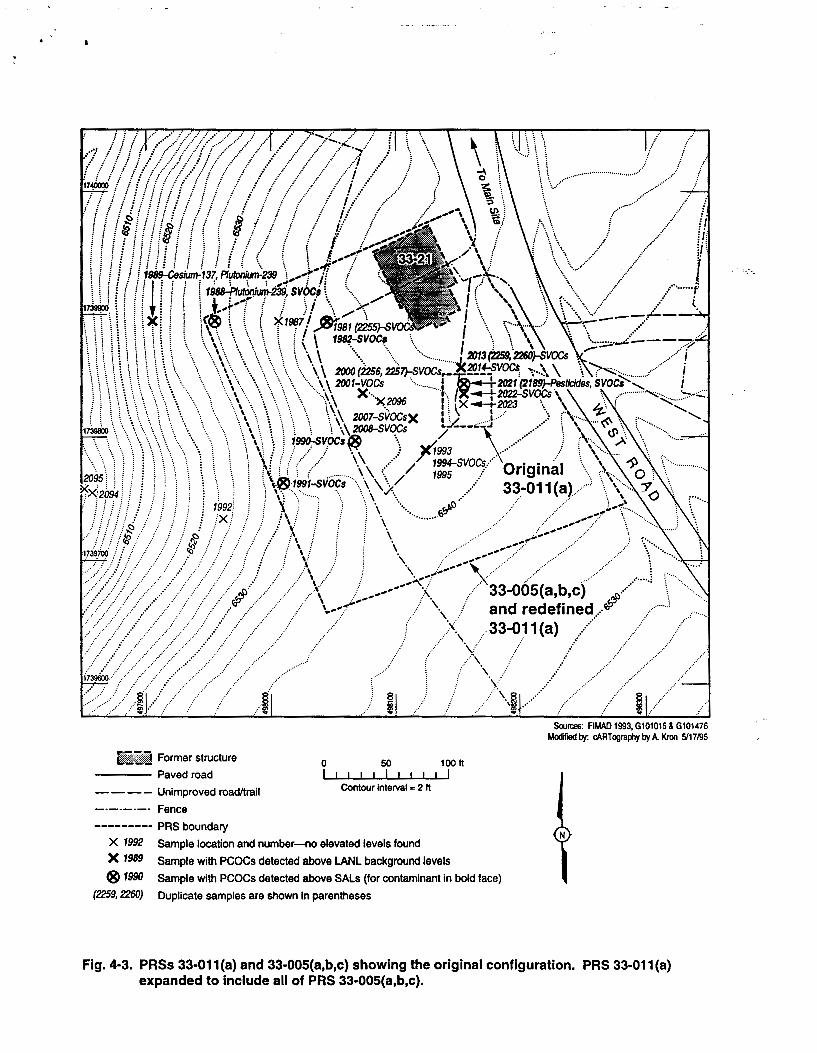
33-00S(a b c) SVOCs (PAHs) 33-011 (a) 4-3
33-012(a) SVOCs (PAHs) 33-017a 4-2
a Includes only the vehicle maintenance area of PRS 33-017 east of shop TA-33-39.
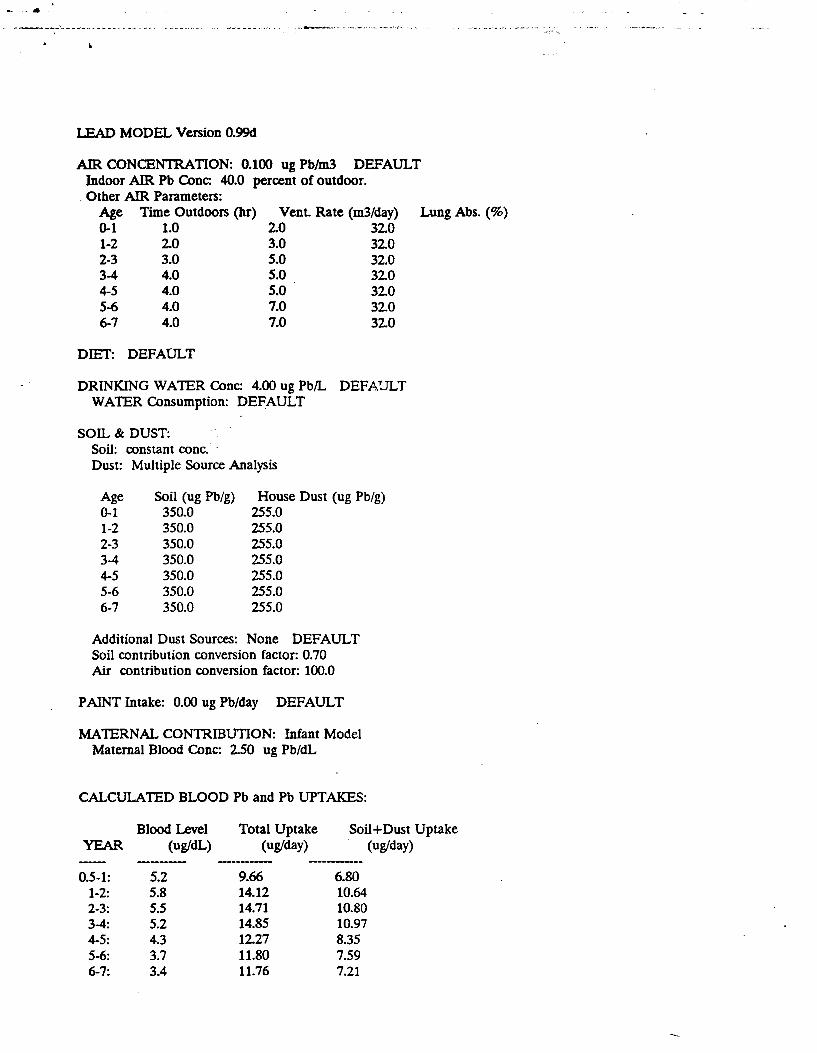
5. SWMU 33-015 p. 93- See deficiency #2 above.
Response: No mean or UCL was calculated for lead at incinerator SWMU 33-015 because only
two samples were taken. Lead values were 11 and 350 mglkg, respectively. The
350 rng/kg value was input to the IEUBK model. The computer printout is supplied in
Attachment 5-1.
TA-33 3 May 23, 1995 .
-NO[) An • • !S9 brTA-33 Bfl Remrt fWed .krwy 31 1995
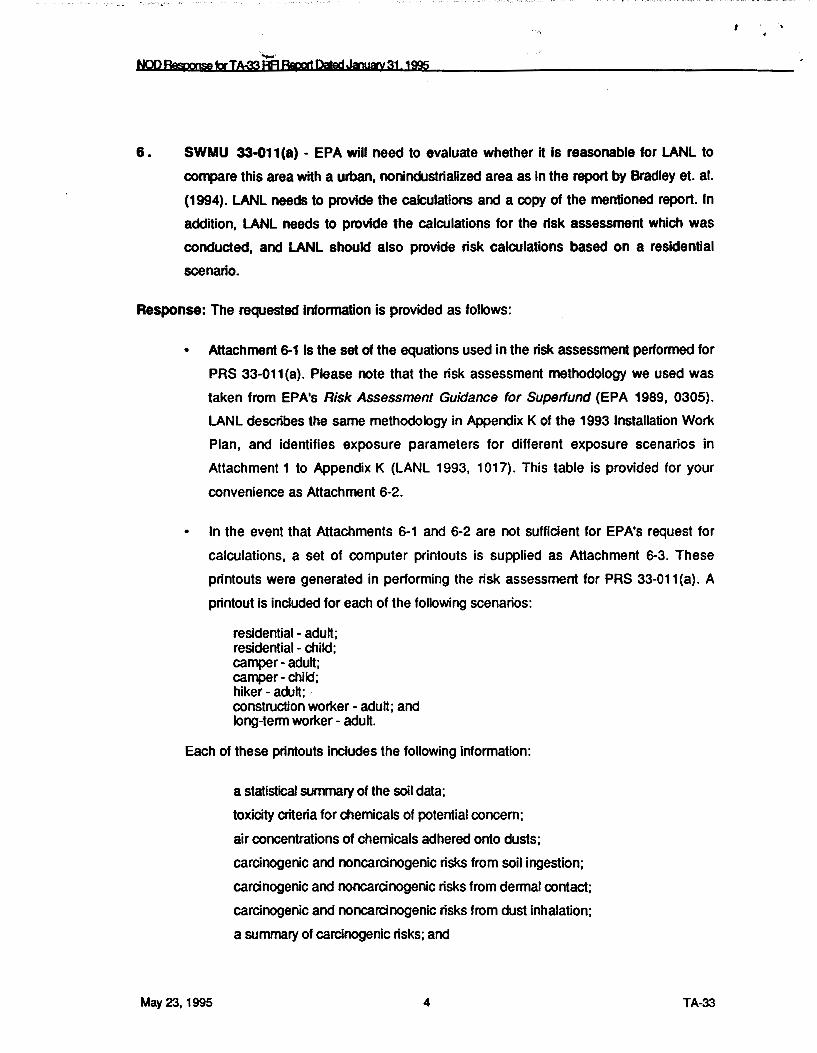
6. SWMU 33-G11(a)- EPA will need to evaluate whether it is reasonable for LANL to
compare this area with a urban, nonindustria&zed area as in the report by Bradley et. al.
(1994). LANL needs to provide the calculations and a copy of the mentioned report. In
addition, LANL needs to provide the calculations for the risk assessment which was
conducted, and LANL should also provide risk calculations based on a residential
scenario.
Response: The requested information is provided as follows:
• Attachment 6-1 is the set of the equations used in the risk assessment performed for
PRS 33-011 (a). Please note that the risk assessment methodology we used was
taken from EPA's Risk Assessment Guidance for Superfund (EPA 1989, 0305).
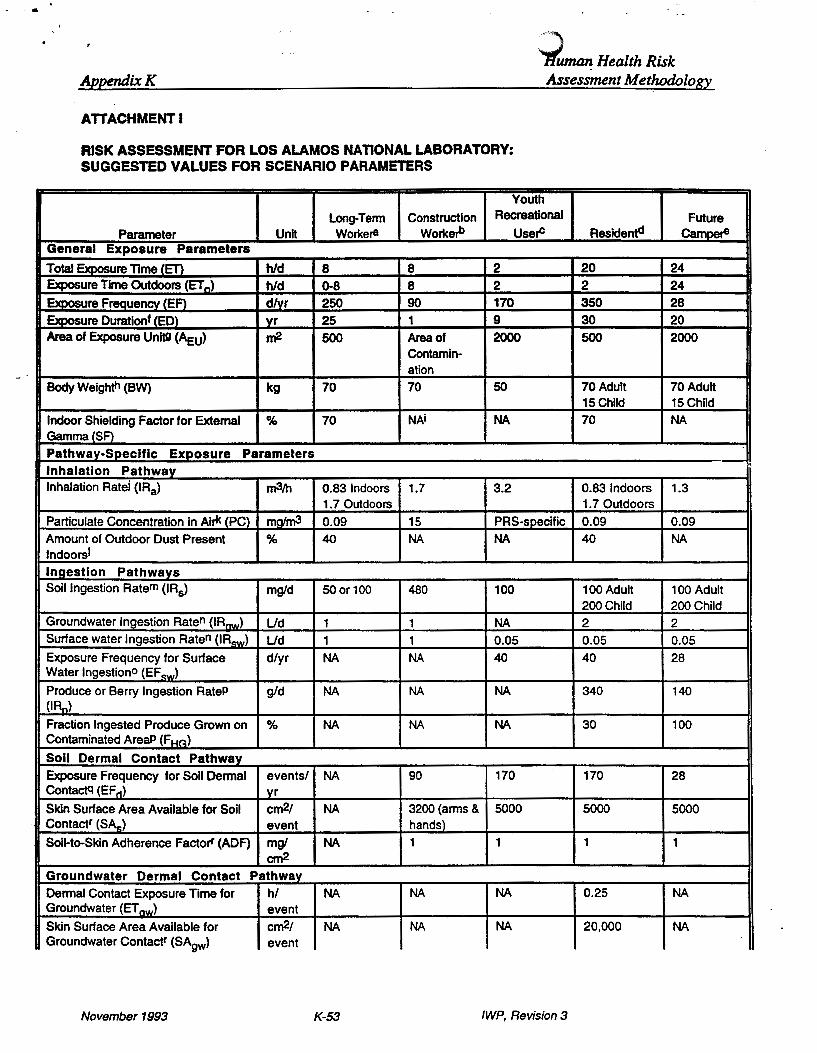
LANL describes the same methodology in Appendix K of the 1993 Installation Work
Plan, and identifies exposure parameters for different exposure scenarios in
Attachment 1 to Appendix K (LANL 1993, 1 017). This table is provided for your
convenience as Attachment 6-2.
In the event that Attachments 6-1 and 6-2 are not sufficient for EPA's request for
calculations, a set of computer printouts is supplied as Attachment 6-3. These
printouts were generated in performing the risk assessment for PRS 33-011 (a). A
printout is included for each of the following scenarios:
residential- adult; residential- child; camper- adult; camper- child; hiker - adult; . construction worker- adult; and long-term worker - adult.
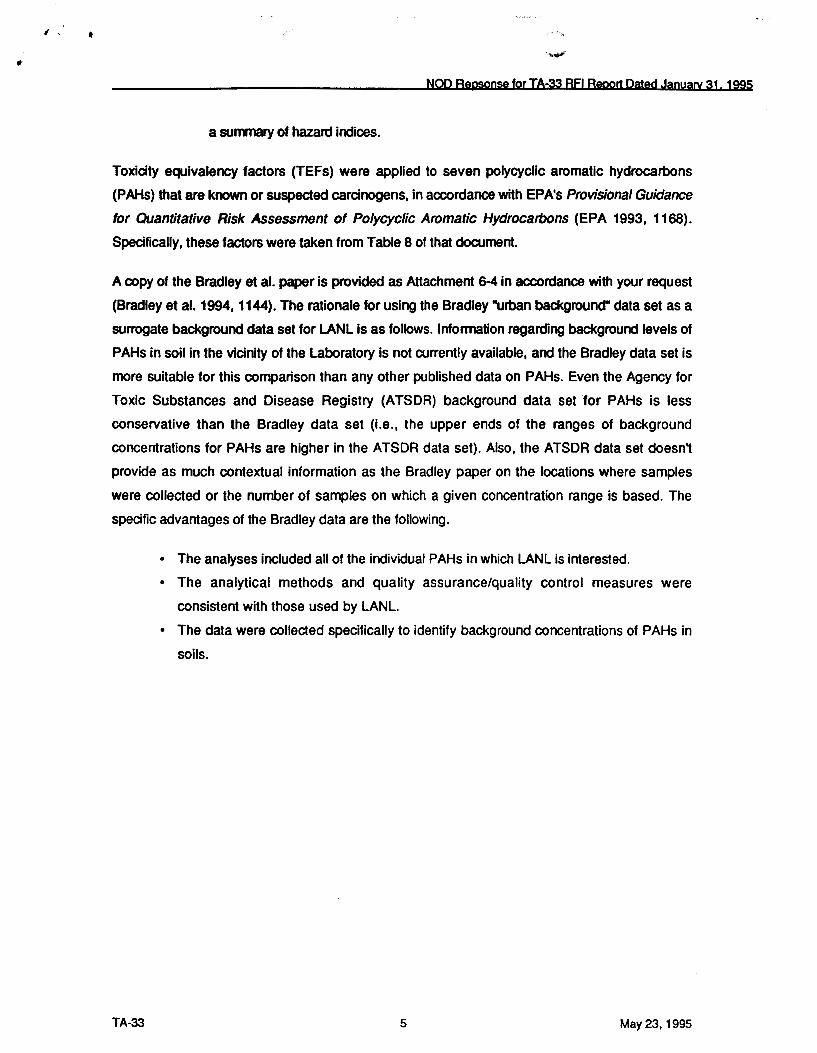
Each of these printouts includes the following information:
May23,1995
a statistical summary of the soil data;
toxicity criteria for chemicals of potential concern;
air concentrations of chemicals adhered onto dusts;
carcinogenic and noncarcinogenic risks from soil ingestion;
carcinogenic and noncarcinogenic risks from dermal contact;
carcinogenic and noncarcinogenic risks from dust inhalation;
a summary of carcinogenic risks; and
4 TA-33
" . NOO Repsonse for TA-33 REI Report Dated January 31. 1995
a sunvnary of hazard indices.
Toxicity equivalency factors (TEFs) were applied to seven polycyclic aromatic hydrocarbons
(PAHs) that are known or suspected carcinogens, in accordance with EPA's Provisional Guidance
for Quantitative Risk Assessment of Polycyclic Aromatic Hydrocarbons (EPA 1993, 1168).
Specifically, these factors were taken from Table 8 of that document.
A copy of the Bradley et al. paper is provided as Attachment 6-4 in accordance with your request
(Bradley et al. 1994, 1144). The rationale for using the Bradley •urban backgrouoo- data set as a
surrogate background data set for LANL is as follows. Information regarding background levels of
PAHs in soil in the vicinity of the Laboratory is not currently available, and the Bradley data set is
more suitable for this comparison than any other published data on PAHs. Even the Agency for
Toxic Substances and Disease Registry (ATSDR) background data set for PAHs is less
conservative than the Bradley data set (i.e., the upper ends of the ranges of background
concentrations for PAHs are higher in the ATSDR data set). Also, the ATSDR data set doesn't
provide as much contextual information as the Bradley paper on the locations where samples
were collected or the number of samples on which a given concentration range is based. The
specific advantages of the Bradley data are the following.
TA-33
• The analyses included all of the individual PAHs in which LANL is interested.
• The analytical methods and quality assurance/quality control measures were
consistent with those used by LANL.
• The data were collected specifically to identify background concentrations of PAHs in
soils.
5 May 23, 1995
-NO() Becmp JorTA-33 REI Bemt [)alad Jjlllm 31 I 1995
References
Bradley, L. N.J., B. H. Magee, and S. L. Allen, 1994, •Background levels of PolycycDc Aromatic
Hydrocarbons (PAH) and Selected Metals In New England Urban Soils; In Journal of Soil
Contamination, Vol. 3(4), p.349. (Bradley et al. 1994, 1144)
EPA (US Environmental Protection Agency), December 1989. •Risk Assessment Guidance for
Superfund, Volume I, Human Health Evaluation Manual (Part A); Interim Final, EPA 54011-89/002,
Office of Emergency and Remedial Response, Washington, DC. (EPA 1989, 0305)
EPA (US Environmental Protection Agency), July 1993. "Provisional Guidance for Quantitative
Risk Assessment of Polycyclic Aromatic Hydrocarbons," EPA/600/R-93/089, Office of Research
and Development, Washington, DC. (EPA 1993, 1168)
EPA (US Environmental Protection Agency), February 1994. Guidance Manual for the Integrated
Exposure Uptake Biokinetic Model for Lead in Children, EPA 540-R-93-081, Office of Emergency
and Remedial Response, Washington, DC. (EPA 1994, 1178)
Gilbert, R. 0., 1987. Statistical Methods for Environmental Pollution Monitoring, Reinhold Van
Nostrand, New York, New York. (Gilbert 1987, 0312)
LANL (los Alamos National laboratory), November 1993. "Installation Work Plan for
Environmental Restoration," Los Alamos National Laboratory Report LA-UR-93-3987, Los
Alamos, New Mexico. (LANL 1993, 1017)
LANL (Los Alamos National Laboratory), January 31, 1995. "Field Unit 3, Operable Unit 1122,
Technical Area 33, RFI Report for PASs 33-004(d), 33-004(g), 33-004(h), 33-004(i), 33-005(a),
33-005(b), 33-005(c), 33-010(e), 33-010(f), 33-011(e), 33-012(a), 33-015, 33-007(c), 33-
011 (a)," los Alamos National Laboratory Report LA-UR-95-882, Los Alamos, New Mexico.
(LANL 1995, 1212)
May 23, 1995 6 TA-33
·. --~----• ............ ..__. ___ .... . I I
Attachment 2-1
Mean and 95% Upper Confidence Limit for Lead at PRS 33-004(1)
TA-33 May23,1995
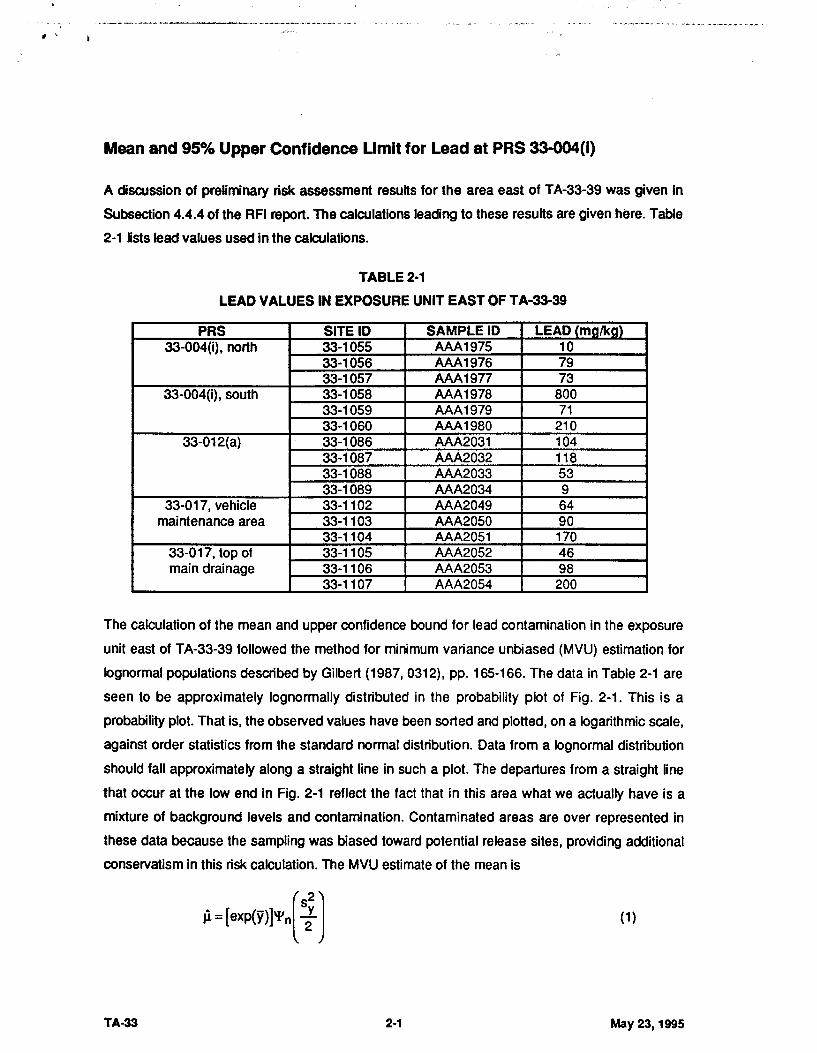
Mean and 95% Upper Confidence Limit for Lead at PRS 33-004(1)
A discussion of preliminary risk assessment results for the area east of T A-33-39 was given in
Subsection 4.4.4 of the RFI report. The calculations leading to these results are given here. Table
2-1 lsts lead values used in the calculations.
TABLE2·1
LEAD VALUES IN EXPOSURE UNIT EAST OF TA-33-39
PRS SITE ID SAMPLEID LEAD (mg/kg) 33-004(i). north 33-1055 AAA1975 10
33-1056 AAA1976 79 33-1057 AAA1977 73
33-004(i), south 33-1058 AAA1978 800 33-1059 AAA1979 71 33-1060 AAA1980 210
33-012(a) 33-1086 AAA2031 104 33-1087 AAA2032 118 33-1088 AAA2033 53 33-1089 AAA2034 9
33-017, vehicle 33-1102 AAA2049 64 maintenance area 33-1103 AAA2050 90
33-1104 AAA2051 170 33-017, top of 33-1105 AAA2052 46 main drainage 33-1106 AAA2053 98
33-1107 AAA2054 200
The calculation of the mean and upper confidence bound for lead contamination in the exposure
unit east of TA-33-39 followed the method for minimum variance unbiased (MVU) estimation for
lognormal populations described by Gilbert (1987, 0312), pp. 165-166. The data in Table 2-1 are
seen to be approximately lognormally distributed in the probability plot of Fig. 2-1. This is a
probability plot. That is, the observed values have been sorted and plotted, on a logarithmic scale,
against order statistics from the standard normal distribution. Data from a lognormal distribution
should fall approximately along a straight line in such a plot. The departures from a straight line
that occur at the low end in Fig. 2-1 reflect the fact that in this area what we actually have is a
mixture of background levels and contamination. Contaminated areas are over represented in
these data because the sampling was biased toward potential release sites, providing additional
conservatism in this risk calculation. The MVU estimate of the mean is
Ji = [ exp()') ]'1' .( ·n (1)
TA-33 2-1 May 23,1995
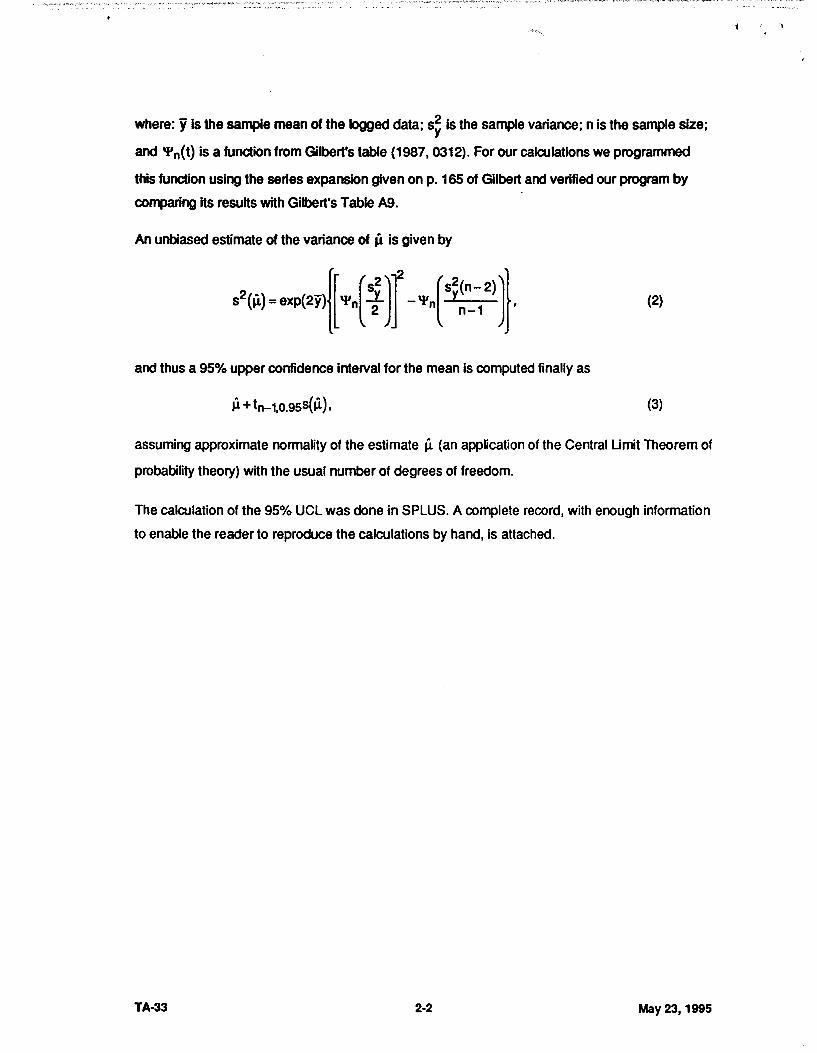
where: y is the sample mean of the logged data; s~ is the sample variance; n is the sample size;
and 'P0 (t) is a function from Gilbert's table (1987, 0312). For our calrulations we programmed
this function using the series expansion given on p. 165 of Gilbert and verified our program by
comparing its results with Gilbert's Table A9.
An unbiased estimate of the variance of J1 is given by
(2)
and thus a 95% upper confidence interval for the mean is computed finally as
Jl + tn-1,0.9ss(Jl), (3)
assuming approximate normality of the estimate J1 (an application of the Central Umit Theorem of
probabifity theory) with the usual number of degrees of freedom.
The calculation of the 95% UCL was done in SPLUS. A complete record, with enough information
to enable the reader to reproduce the calculations by hand, is attached.
TA-33 2-2 May 23,1995
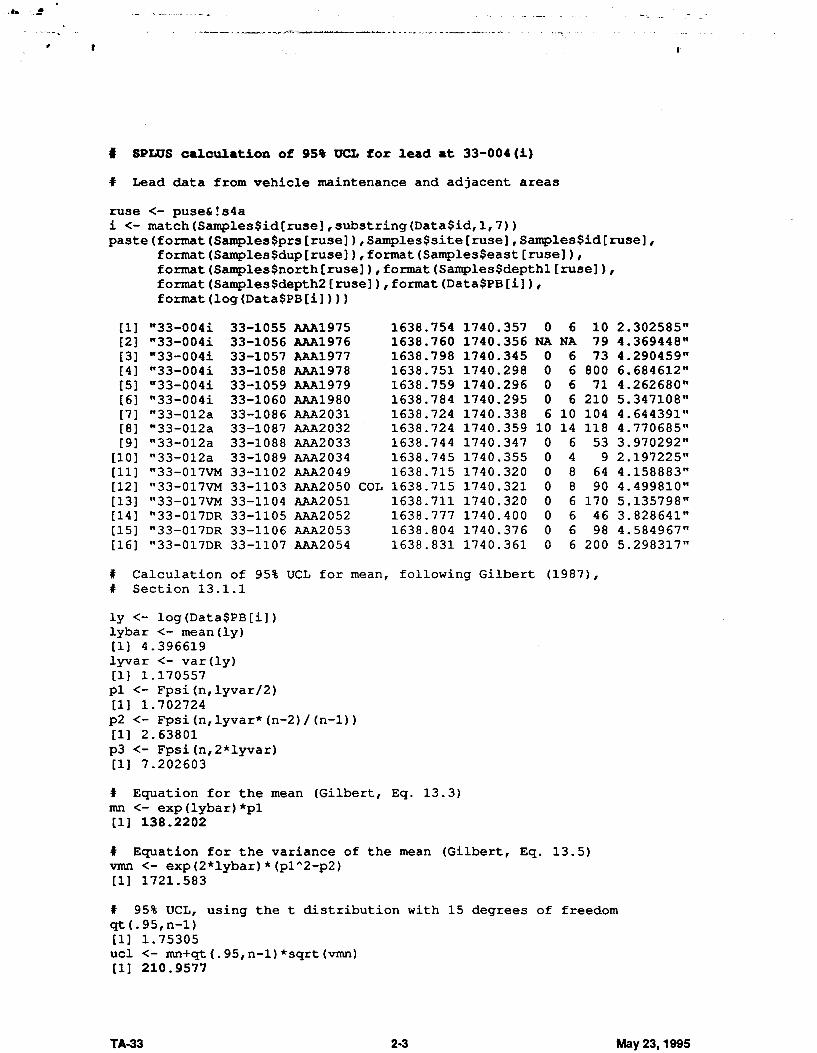
I SPLUS ca1culation of 95t UCL for 1ead at 33-004(i)
t Lead data from vehicle maintenance and adjacent areas
ruse <- puse&!s4a i <- match(Samples$id[ruse],substring(Data$id,1,7)) paste(format(Samples$prs[ruse]),Samples$site[ruse],Samples$id[ruse],
format(Samples$dup[ruse]),format(Samples$east[ruse]), format(Samples$north[ruse]),format(Samples$depth1[ruse]), format(Samples$depth2[ruse]),format(Data$PB[i]), format(log(Data$PB[i])))
[1] "33-004i 33-1055 AAA1975 1638.754 1740.357 [2] "33-004i 33-1056 AAA1976 1638.760 1740.356 [3] "33-004i 33-1057 AAA1977 1638.798 1740.345 [4] "33-004i 33-1058 AAA1978 1638.751 1740.298 [5) "33-004i 33-1059 AAA1979 1638.759 1740.296 [6) "33-004i 33-1060 AAA1980 1638.784 1740.295 [7] "33-012a 33-1086 AAA2031 1638.724 1740.338 [8] "33-012a 33-1087 AAA2032 1638.724 1740.359 [9] "33-012a 33-1088 AAA2033 1638.744 1740.347
[10] "33-012a 33-1089 AAA2034 1638.745 1740.355 [11] "33-017VM 33-1102 AAA2049 1638.715 1740.320 [12] "33-017VM 33-1103 AAA2050 COL 1638.715 1740.321 [13] "33-017VM 33-1104 AAA2051 1638.711 1740.320 [14] "33-017DR 33-1105 AAA2052 1638.777 1740.400 [15] "33-017DR 33-1106 AAA2053 1638.804 1740.376 [16] "33-017DR 33-1107 AAA2054 1638.831 1740.361
t Calculation of 95% UCL for mean, following Gilbert t Section 13.1.1
ly <- log(Data$PB[i]) lybar <- mean(ly) [1] 4. 396619 lyvar <- var(ly) [1] 1.170557 p1 <- Fpsi(n,lyvar/2) [1) 1. 702724 p2 <- Fpsi(n,lyvar*(n-2)/(n-1)) [1] 2. 63801 p3 <- Fpsi(n,2*lyvar) [1] 7. 202603
f Equation for the mean (Gilbert, Eq. 13.3) rnn <- exp(lybar)*p1 [1) 138.2202
0 6 10 NA NA 79
0 6 73 0 6 800 0 6 71 0 6 210 6 10 104
10 14 118 0 6 53 0 4 9 0 8 64 0 8 90 0 6 170 0 6 46 0 6 98 0 6 200
(1987),
f Equation for the variance of the mean (Gilbert, Eq. 13.5) vrnn <- exp(2*lybar)*(p1~2-p2)
[1] 1721.583
2.302585" 4.369448" 4.290459" 6.684612" 4.262680" 5.347108" 4.644391" 4.770685" 3.970292" 2 .197225" 4.158883" 4.499810" 5.135798" 3.828641" 4.584967" 5.298317"
f 95% UCL, using the t distribution with 15 degrees of freedom qt(.95,n-1) [1] 1.75305 ucl <- rnn+qt(.95,n-1)*sqrt(vrnn) [1) 210.9577
TA-33 2·3 May23, 1995
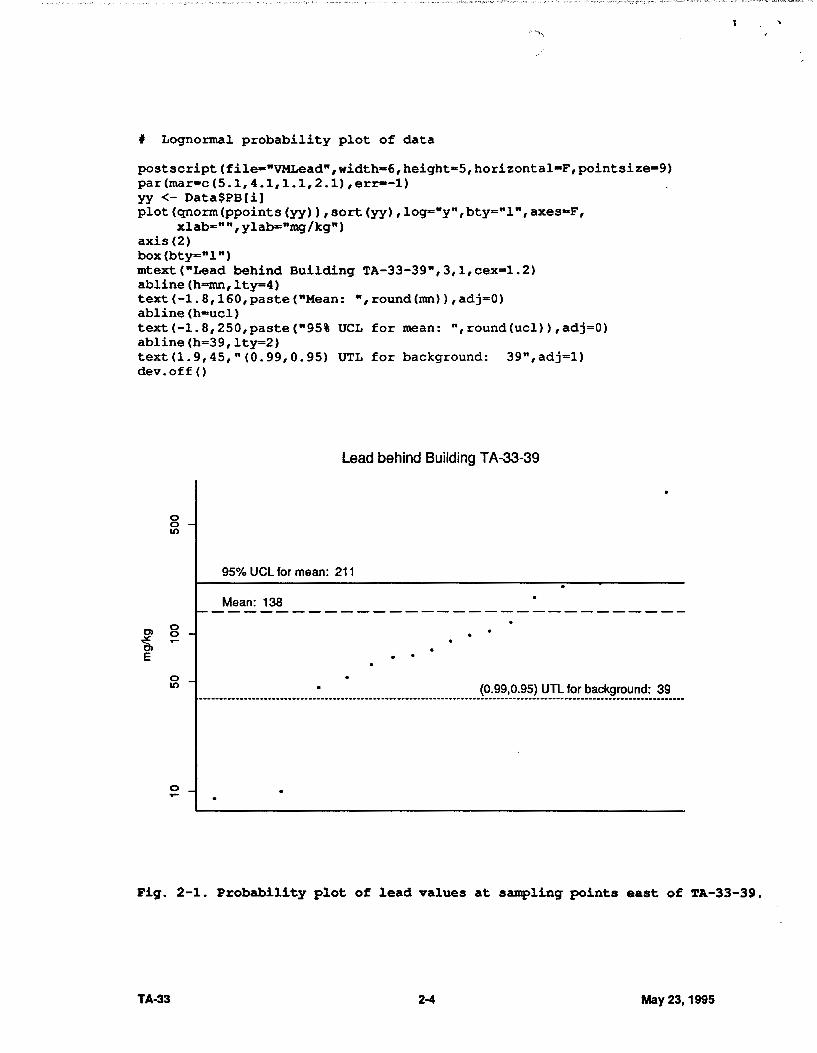
f Lognormal probability plot of data
postscript(file•"VMLead",width-6,height•5,horizontal•F,pointsize•9) par(mar=c(5.1,4.1,1.1,2.l),err=-l) yy <- Data$PB[i] plot(qnorm(ppoints(yy)),sort(yy),log="y",bty="l",axes=F,
xlab="",ylab="mg/kg") axis(2) box(bty="l") mtext("Lead behind Building TA-33-39",3,l,cex=l.2) abline(h=mn,lty=4) text(-1.8,160,paste("Mean: ",round(mn)),adj=O) abline(h=ucl) text(-1.8,250,paste("95% UCL for mean: ",round(ucl)),adj=O) abline(h=39,lty=2) text(l.9,45,"(0.99,0.95) UTL for background: 39",adj=l) dev.off ()
Cl
~ E
0 0 ll)
0 0
Lead behind Building TA-33-39
95% UCL for mean: 211
Mean: 138
0 ll) (0.99,0.95) UTL for background: 39 ---·----------------------------------------------------------·----------------------------------------------------------
0
Fig. 2-1. Probability plot of lead values at sampling points east of TA-33-39.
TA-33 2-4 May 23,1995

' . '
# Fpsi is the function for which a series expansion is provided # in Eq. (13.4), p. 165 of Gilbert (1987).
Fpsi <- function(n, t, tol=le-6) nxt <- (t*(n-1))/n psi <- l+nxt k <- 1 while(nxt > tol) {
k <- k+1 nxt <- (nxt*t*((n-1)/n)*((n-1)/(n-1+2*(k-1))))/k psi <- psi+nxt
return(psi)
f Verify by reproducing part of Gilbert's Table A9, p. 263:
x <- seq(0.1,2.0,0.1) y <- c(2,5,8,10,15,20,30,50,100) z <- matrix(NA,length(x),length(y)) for (i in 1:length(x)) { for (j in 1 :length (y)) {
z[i,j] <- Fpsi(y[j],x[i]) } }
dimnames(z) <- list(x,y) round(z,3)
2 0.1 1.050 0.2 1.102 0.3 1.154 0.4 1.207 0.5 1.261 0. 6 1. 315 0.7 1.371 0.8 1.427 0.9 1.485
1 1. 543 1.1 1.602 1.2 1.662 1. 3 1. 724 1.4 1. 786 1.5 1.849 1. 6 1. 913 1. 7 1. 977 1.8 2.043 1.9 2.110
2 2.178
TA-33
5 1. 082 1.169 1.260 1.356 1.457 1. 563 1. 675 1. 792 1. 915 2.044 2.180 2.321 2.470 2.626 2.788 2.959 3.137 3.323 3.518 3. 721
8 1. 091 1.187 1.291 1.401 1. 519 1. 645 1. 779 1. 922 2.074 2.235 2.407 2.589 2.783 2.988 3.206 3.437 3.682 3.942 4.216 4.506
10 1. 093 1.194 1.302 1.418 1.542 1. 675 1. 818 1.971 2.135 2.310 2.498 2.698 2.911 3.139 3.382 3.642 3.918 4.212 4.525 4.858
15 1. 097 1.203 1.317 1.441 1.574 1. 719 1. 876 2.045 2.227 2.424 2.636 2.864 3.111 3.376 3.661 3.967 4.297 4.651 5.031 5.439
20 1. 099 1.207 1.325 1.453 1.592 1.743 1.907 2.085 2.278 2.487 2. 714 2.960 3.226 3.513 3.825 4.161 4.525 4.917 5.341 5.799
2-5
30 1.101 1.212 1.333 1. 465 1.610 1.768 1. 940 2.128 2.333 2.557 2.800 3.066 3.354 3.669 4. 011 4.383 4.788 5.227 5.705 6.224
50 1.103 1.216 1.340 1. 476 1.625 1.789 1. 968 2.165 2.381 2.617 2.876 3.159 3.470 3.809 4.181 4.587 5.031 5.517 6.048 6.628
100 1.104 1.218 1.345 1. 484 1.637 1. 805 1.990 2.194 2.419 2.666 2.938 3.236 3.565 3.926 4.323 4.759 5.239 5.766 6.344 6.980
May 23,1995

... -~-.--------..
Attachment 2-2
Computer printout generated by running EPA's Integrated Exposure Uptake
Blok/netlc (IEUBK) Model (Version 0.99d) for lead In children
TA-33 May 23,1995

. ' .. .t:. .. - --···· •. -·- .....
Table 1. Results of the EPA t.e.d Modal (VlMSlon Q.99d) Based on 96% UCL Lead Conoentl'.tion In Soil
AIR CONCENllU.TION: 0.100 'lfJ Phl~'t nFFAlJI T Indoor AIR Pb Cone: 40.0 peroent of outdoor. Other AIR Paramatena:
Age nm. Outdoors (tv) Vent. Rete (~day) Lung Abs. <'J') Q-1 1.0 2.0 32.0 1 -2 2.0 :).0 a2.0 2-3 1.0 5.0 32.0 3-4 4.0 5.0 ~-0 4-5 4.0 5.0 32.0 5-6 4.0 7 .o 32.0 6-7 4.0 1.0 ~u
DtET; ~FI\.IJLT
DRINKING WATER Cone: 4.00 ug Pbll CEFAULT WATER Conaumption: DEFAULT
&OU .• DUST: Soil: constant cone. n.~: MultipiA Source Analysis
Age Soil (ug Pblg) House Dus1 (ug Pb/g} Q-1 211.0 157.7 1-2 211.0 157.7 2-3 211.0 '57.7 1).4 211 .o t57.7 4-5 211.0 157.7 5-6 211.0 157.7 6-7 211.0 157.7
Aeldl110nal Uust :;>ourcee: Nona D!!!FAUL T Soil contribution eonvo11ion factor. 0. 70 /I!Jr ~ntrii;!Yti<;>r> ~nvet"'lion faetor: 1 0(1.0
PAINT tmake: 0.00 ug Pblday DEFAULT
MATERNAL CONTRIBUTION: Infant Model Mat.rnull 6l<.o<.xJ Our w. 2.GO 'IV PU/.JL
CALCULATED BLOOD Pb and Pb UPTAKES: Blood lovel TO!al Uptakt Soil+ Oust Uptake
YEAR (ug/dl) (ugfclay) (ug/day)
0.5-1: 3.9 7.21 4.27 1-Q: -4.3 10.32 S.7:! 2-3: 4.0 10.S2 6.79 3-4: 3.8 10.85 U7 4-5: 3.2 9.17 5.19 5-6: 2.8 8.96 4.70 ~7: 2.6 9.06 4.45
Dlot Uptako W&'tMUptake Palllt Uptake Air Uptake YEAR (ug/day) (ug/day) (ug/day) (ug/day)
0.5-1: 2.55 0.37 0.00 0.03 1-2: 2.64 0.91 0.00 0.04 N. 2.88 0.88 0.00 0.08 3-4; 2.91 0..99 0.00 0.08 4-5: 2.86 1.05 0.00 0.08 8-6: 3.04 1.11 0.00 0.11 6-7; 3.36 1.13 o.oo 0.11
..... _ ... ~ ... ~· . - - -- -·"-'·- .......... _._,_,._,
I • .._£:... • ' . a.IMI
~torr: 18.80 u•'•~ Glto .. .., CQI) ~ a.?
'II ln··r--t:: 1.sc Y.
. 88 • I
..,. I I
8 I 58 I u
15 . • I 58 :
> f .. ... : ,.l l .. .. i II
I I I I .
~ I
"" . I . . . .
a• I I
i 18 i
i I
8 (I c & • .1.8 J.a l.C
LEAD 8. !J9d .LOO:D LEAD COHCEHTRATIOM <u•'dL) a *• 'l':t Non ~)t4r

••
Attachment 4-1
Three Figures Showing Overlapping PRSs
TA-33 May 23,1995

Fig. 4-1. Area 6: PAS 33-009 showing overlapping PAS 33-004(g).
Sources: FIMAD 1993,6101009,6101010,6101476 Modified by: cARTography by A. Kron 5/17195
lmll) Pennanent structure
Paved road
Unimproved road/trail
-·-·-·-·-·-· Fence
Storm drain/culvert
PAS boundary
X 2156 Sample location and number-no elevated
levels found
X2t52 Sample with PCOCs detected above LANL
background level
0 50 100ft I I I I I I I I I I I
Contour Interval = 2 II
•
•
0 I
50 I I I
100ft I
•
Sources: FIMAD 1993, G101013, G101014, G101476 Modified by: cARTography by A. Kron ~17195
Contour interval = 2 It
lillMf:tNI Permanent structure
---- Edge of pavement
---- Unimproved road/trail
-·-·-·-· Fence
--------· PAS boundary
X 1975 Sample with PCOCs detected above LANL background levels
®t980 Sample with PCOCs detected above SALs (for contaminants In bold face and underlined)
Fig. 4-2. Main Site: Vehicle maintenance area of PRS 33.017 showing overlapping PRSs 33.004{1) and 33.012{a).
OSUl\d Former structure ---- Paved road
---- Unimproved road/trail
-·-·-·-· Fence
--------- PAS boundary
0 50 100ft I I I I I I I I I I
Contour Interval = 2 It
X 1992 Sample location and number-no elevated levels found
X 1989 Sample with PCOCs detected above LANL background levels
® 1990 Sample with PCOCs detected above SALs (for contaminant in bold face)
(2259, 2260) Duplicate samples are shown In parentheses
Sources: FIMAO 1993, G101015 & G101476 Mod'lfled by: cARTography by A. Kron 5117195
Fig. 4-3. PASs 33·011 (a} and 33-00S(a,b,c} showing the original configuration. PAS 33-011 (a} expanded to include all of PAS 33-00S(a,b,c).
~~ • ___ .,.r ~·\ ....... -~ 0' ~- ~ _, _ _.,-..._ .. L" .... --<r ... · ....... ,_ .... ~.-- ~-- --·•-•"
TA-33
Attachment 5-1
Risk Assessment Calculations for Lead at
PRS 33-015
May 23,1995
-- ·- . -~--··'-~~-··-··- .. -·.- -- _..,._
'
LEAD MODEL Version 0.99d
AIR CONCEN'IRATION: 0.100 ug Pb/m3 DEFAULT Indoor AIR Pb Cone: 40.0 percent of outdoor. Other AIR Parameters:
Age TilDe Outdoors (br) VenL Rate (m3/day) 0-1 1.0 2.0 32.0 1-2 2.0 3.0 32.0 2-3 3.0 5.0 32.0 3-4 4.0 5.0 32.0 4-5 4.0 5.0 32.0 5-6 4.0 7.0 32.0 6-7 4.0 7.0 32.0
DIET: DEFAULT
DRINKING WATER Cone: 4.00 ug Pb/L DEFAULT WATER Consumption: DEF:AULT
SOIL& DUST: Soil: constant cone. · Dust: Multiple Source Analysis
Age 0-1 1-2 2-3 3-4 4-5 5-6 6-7
Soil (ug Pb/g) 350.0 350.0 350.0 350.0 350.0 350.0 350.0
House Dust (ug Pb/g) 255.0 255.0 255.0 255.0 255.0 255.0 255.0
Additional Dust Sources: None DEFAULT Soil contribution conversion factor: 0. 70 Air contribution conversion factor: 100.0
PAINT Intake: 0.00 ug Pb/day DEFAULT
MATERNAL CONTRIDUTION: Infant Model Maternal Blood Cone: 2.50 ug Pb/dL
CALCULATED BLOOD Pb and Pb UPTAKES:
Lung Abs. (%)
Blood Level Total Uptake Soil+Dust Uptake YEAR (ug/dL) (ug/day) (ug/day)
--- ------ -------0.5-1: 5.2 9.66 6.80
1-2: 5.8 14.12 10.64 2-3: 5.5 14.71 10.80 3-4: 5.2 14.85 10.97 4-5: 4.3 12.27 8.35 5-6: 3.7 11.80 7.59 6-7: 3.4 11.76 7.21
- ---· ------------------·-------------- ··-----· ----------------··-~- ···---- ··-·---·------·~·. __ ..._ ___ ~ -···-------~----··
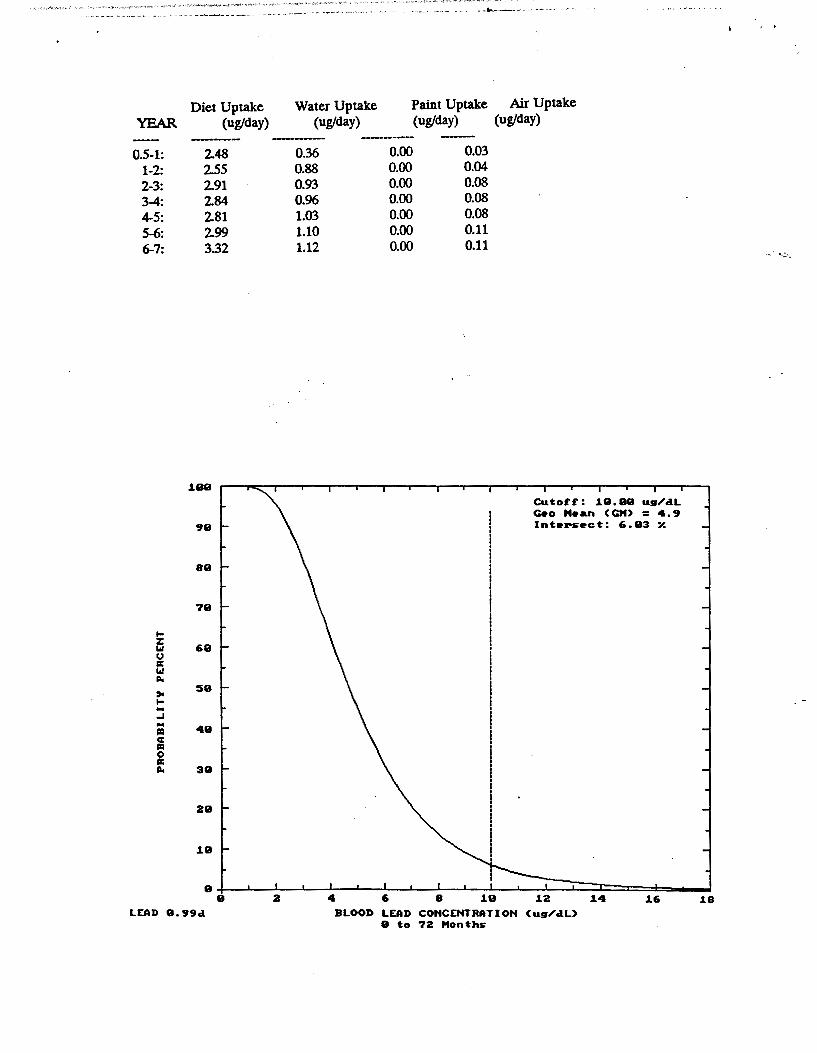
Diet Uptake YEAR (ug/day)
----0.5-1: 248
1-2: 255 2-3: 291 3-4: 284 4-5: 281 5-6: 299 6-7: 3.32
.uta
99
89
79
... z "' 69 u llo:
"' "' > 59 ... ... _, ... 49 Ill cz:
= 0 II:
"' 39
29
l.GI
8 8
LEAD Gl.99d
Water Uptake Paint Uptake Air Uptake (ug/day) (ug/day) (ug/day)
------0.36 0.88 0.93 0.96 1.03 1.10 1.12
-------0.00 0.00 0.00 0.00 0.00 0.00 0.00
8
0.03 0.04 0.08 0.08 0.08 0.11 0.11
.18
Cutott: .18.89 ug/dL C.o Mttan <CM> : 4. 9 lnt•rs•ct: 6.83 Y.
.12 .14 .16 BLOOD LEAD COHCEHTRATIOH (ug/dL)
8 to 72 Months
-·· :_-_
.18

.. ~ .
. ... _ __,....,...,.,._ .. __ _...,. -·--
Attachment 6-1
Equations Used In the Risk Assessment Performed for
PRS 33-011 (a)
TA-33 May23,1995
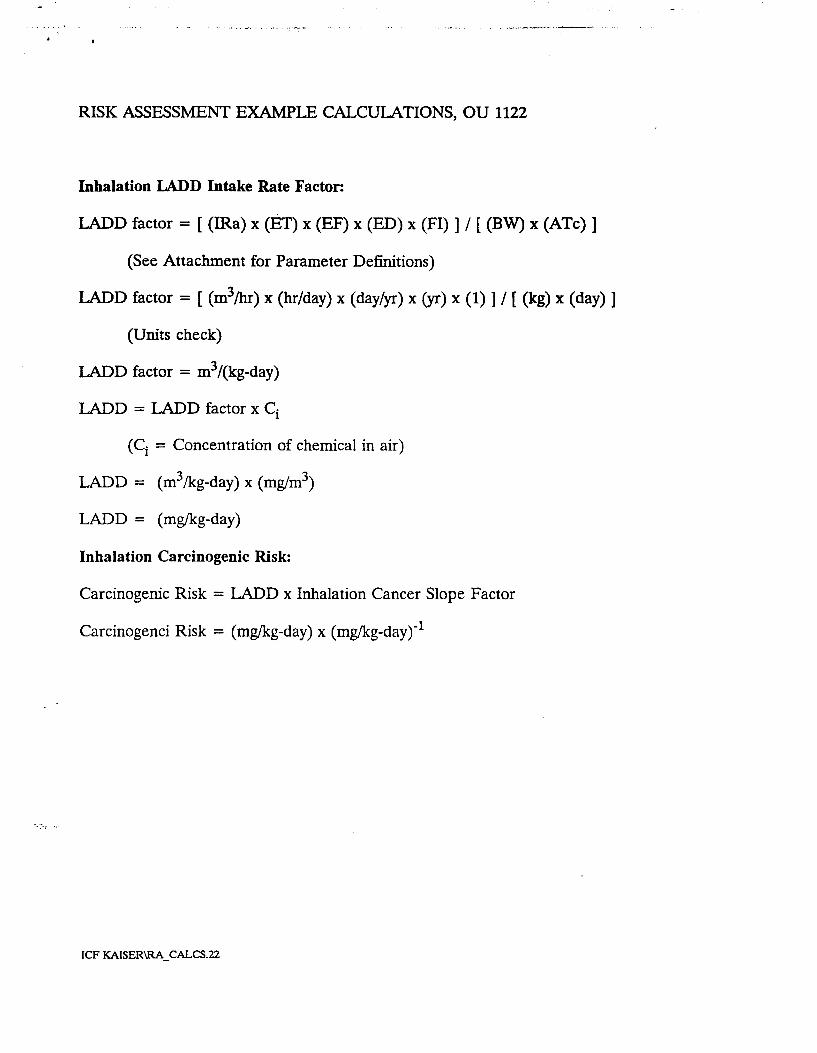
RISK ASSESSMENT EXAMPLE CALCULATIONS, OU 1122
Inhalation LADD Intake Rate Factor:
LADD factor= [(IRa) x (ET) x (EF) x (ED) x (FI)] I [ (BW) x (ATe)]
(See Attachment for Parameter Definitions)
LADD factor = [ (m3/hr) x (hrlday) x (day/yr) x (yr) x (1) ] I [ (kg) x (day) ]
(Units check)
LADD factor= m31(kg-day)
LADD = LADD factor X ci
(Ci = Concentration of chemical in air)
LADD = (m3 /kg-day) x (mg!m3)
LADD = (mg/kg-day)
Inhalation Carcinogenic Risk:
Carcinogenic Risk = LADD x Inhalation Cancer Slope Factor
Carcinogenci Risk = (mg/kg-day) x (mg/kg-dayr1
ICF KAISER\RA _ CALCS.22
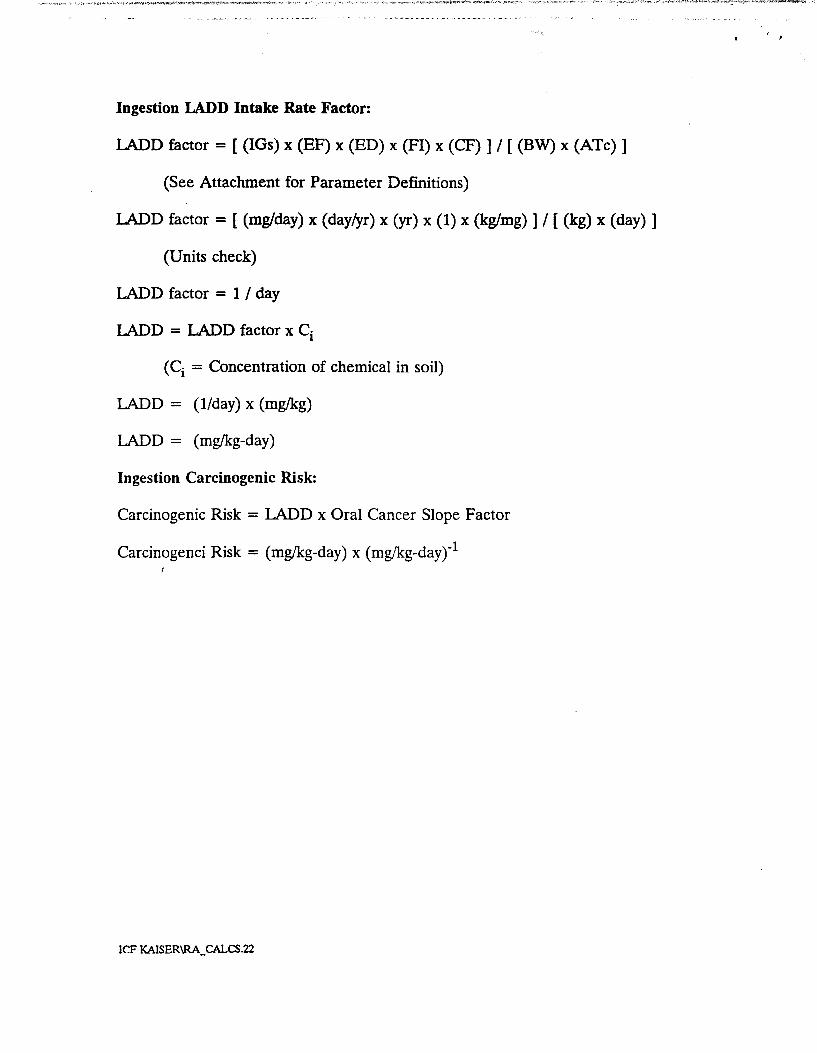
Ingestion LADD Intake Rate Factor:
LADD factor = [ (IGs) x (EF) x (ED) x (FI) x (CF) ] I [ (BW) x (ATe) ]
(See Attachment for Parameter Definitions)
LADD factor = [ (mg/day) x (daylyr) x (yr) x (1) x (kg/mg) ] I [(kg) x (day) ]
(Units check)
LADD factor= 1 I day
LADD = LADD factor X ci
(Ci = Concentration of chemical in soil)
LADD = (11day) x (mg!kg)
LADD = (mg!kg-day)
Ingestion Carcinogenic Risk:
Carcinogenic Risk = LADD x Oral Cancer Slope Factor
Carcinogenci Risk = (mg!kg-day) x (mg!kg-dayr1
ICF KAISER\RA_ CALCS.22

Ingestion ADD Intake Rate Factor:
ADD factor = [ (IGs) x (EF) x (ED) x (FI) x (CF) ] I [ (BW) x (ATnc) ]
(See Attachment for Parameter Definitions)
ADD factor = [ (mg/day) x (daylyr) x (yr) x (1) x (kg/mg) ] I [ (kg) x (day) ]
(Units check)
ADD factor = 1lday
ADD = ADD factor X ci
(Ci = Concentration of chemical in soil)
ADD = (11day) x (mg/kg)
ADD = (mg/kg-day)
Ingestion Noncarcinogenic Effect:
Noncarcinogenic Effect = ADD I Oral Reference Dose
Noncarcinogenic Effect = (mg/kg-day) I (mg/kg-day)
ICF KAISER\RA _ CALCS.22
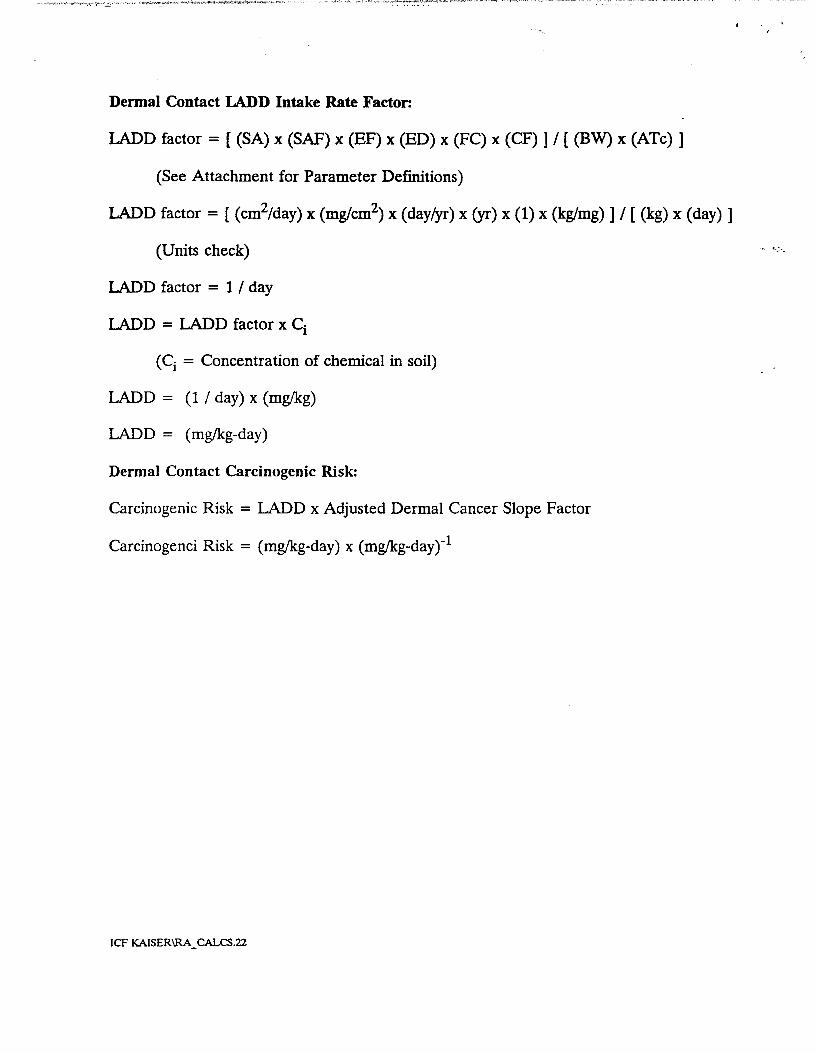
Dermal Contact LADD Intake Rate Factor:
IADD factor = [(SA) x (SAF) x (EF) x (ED) x (FC) x (CF) ] I [ (BW) x (ATe) ]
(See Attachment for Parameter Definitions)
IADD factor = [ (cm21day) x (mg/cm2) x (day/yr) x (yr) x (1) x (kg/mg)] I [(kg) x (day) ]
(Units check)
IADD factor= 1 I day
IADD = LADD factor X ci
(Ci = Concentration of chemical in soil)
IADD = (1 I day) x (mg!kg)
LADD = (mg/kg-day)
Dermal Contact Carcinogenic Risk:
Carcinogenic Risk = LADD x Adjusted Dermal Cancer Slope Factor
Carcinogenci Risk = (mg/kg-day) x (mg/kg-dayr1
ICF KAISER\RA_CALCS.22
.•. -- .... ;_._
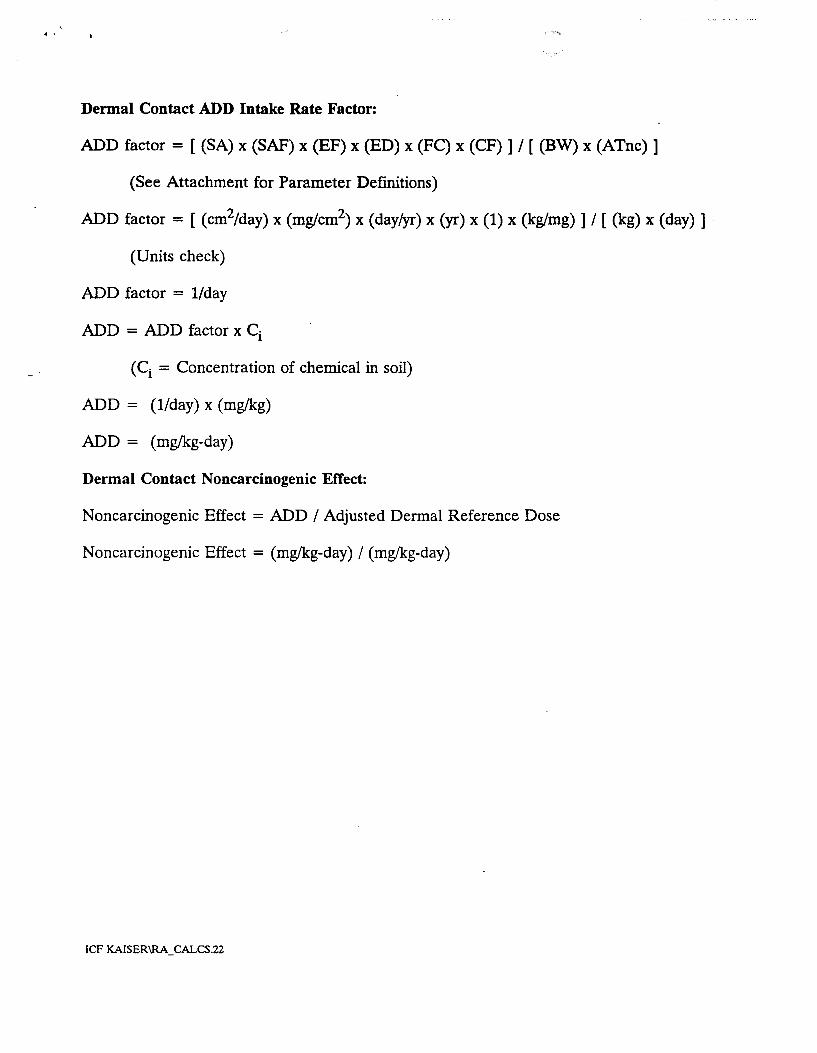
Dermal Contact ADD Intake Rate Factor:
ADD factor = [ (SA) x (SAF) x (EF) x (ED) x (FC) x (CF) ] I [ (BW) x (ATnc) ]
(See Attachment for Parameter Definitions)
ADD factor = [ (cm2/day) x (mg!cm2) x (day!yr) x (yr) x (1) x (kg/mg)] I [(kg) x (day)]
(Units check)
ADD factor= 1lday
ADD = ADD factor X ci
(Ci = Concentration of chemical in soil)
ADD = (1lday) x (mg/kg)
ADD = (mg!kg-day)
Dermal Contact Noncarcinogenic Effect:
Noncarcinogenic Effect = ADD I Adjusted Dermal Reference Dose
Noncarcinogenic Effect = (mg!kg-day) I (mg/kg-day)
ICF KAISER\RA_ CALCS.22
. .. --
~-- ·---'· ~-- _._...__ .. ________ _.,J: ............... ---.
Attachment 6-2
Copy of Attachment 1 to Appendix K of the LANL 1993 Installation Work
Plan
TA-33 May 23,1995
AppendixK
ATTACHMENT I
.:;;uman Health Risk Assessment Methodology
RISK ASSESSMENT FOR LOS ALAMOS NATIONAL LABORATORY: SUGGESTED VALUES FOR SCENARIO PARAMETERS
Youth
Long-Term Construction Recreational Future Parameter Unit Worker6 Workerb Use,.C Resldentd Campe,e
General Exposure Parameters
Total Exposure Time (ET) h/d 8 8 2 20 24 Exposure Time Outdoors (ET 0 ) h/d 0-8 8 2 2 24
FYr\tml1re FreQuencv (EF) d/yr 250 90 170 350 28
Exposure Durationf (ED) vr 25 1 9 30 20
Area of Exposure Unll9 <Aeu> rr;!. 500 Area of 2000 500 2000 Contamin-ation
Body Weighth (BW) kg 70 70 50 70Adult 70 Adult 15Child 15Child
Indoor Shielding Factor for External % 70 NAi NA 70 NA Gamma(SF)
Pathway-Specific Exposure Parameters Inhalation Pathway Inhalation Ratei (IR8 ) m3/h 0.83 Indoors 1.7 3.2 0.83 Indoors 1.3
1. 7 Outdoors 1. 7 Outdoors
Particulate Concentration in Airk (PC) mg!m3 0.09 15 PAS-specific 0.09 0.09
Amount of Outdoor Dust Present % 40 NA NA 40 NA lndoorsl
Ingestion Pathways Soil Ingestion Ratem (IRs) mg/d 50 or 100 480 100 100 Adult 100 Adult
200Child 200 Child Groundwater Ingestion Raten (IRnw) Ud 1 1 NA 2 2 Surface water Ingestion Raten (IR~) Ud 1 1 0.05 0.05 0.05
Exposure Frequency for Surface d/yr NA NA 40 40 28 Water lngestiono (EF !':w)
Produce or Berry Ingestion RateP g/d NA NA NA 340 140 (IRn)
Fraction Ingested Produce Grown on o/o NA NA NA 30 100 Contaminated AreaP (FHG)
Soli Dermal Contact Pathway
Exposure Frequency for Soil Dermal events/ NA 90 170 170 28 ContactCI (EFri) vr
Skin Surface Area Available for Soil cm2/ NA 3200 (arms & 5000 5000 5000 Contactr (SAs) event hand~
Soil-to-Skin Adherence Factorr (ADF) mg/ NA 1 1 1 1 cm2
Groundwater Dermal Contact Pathwa_y
Dermal Contact Exposure Time for h/ NA NA NA 0.25 NA Groundwater (ET owl event
Skin Surface Area Available for cm2/ NA NA NA 20,000 NA Groundwater Contactr (SA w> g event
November 1993 K-53 IWP, Revision 3
'
Human Health Risk Assessment Method?Jtr,gy AppendixK
Youth
1.ang-Term Construction Recreational Future Parameter Unit Worker8 Workerb UserC Resldentd Camper8
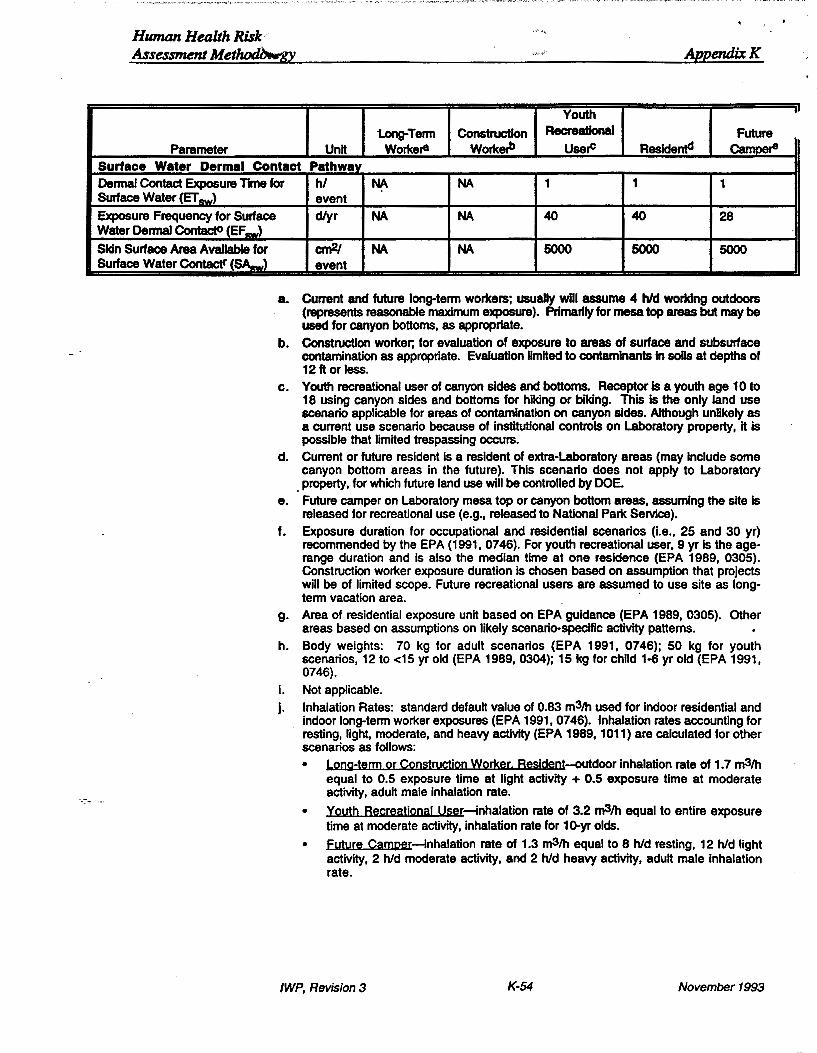
Surface Water Dermal Contact Pathway
Dennal Contact Exposure Time for hi NA NA 1 1 1 Surface Water (ET ,_)
Exposure Frequency for Surface Water Oennal ContactO (EF -> Skin Surface Area Available for Surface Water Contact" (BA_)
event dlyr NA NA 40 40 28
crr{J./ NA NA 5000 5000 5000 event
a. Current and future long-term workers; usually will assume 4 hid working outdoors (represents reasonable maximum exposure). Primarily for mesa top areas but may be used for canyon bottoms, as appropriate.
b. Construction worker; for evaluation of exposure to areas of surface and subsurface contamination as appropriate. Evaluation limited to contaminants in soils at depths of 12ft or Jess.
c. Youth recreational user of canyon sides and bottoms. Receptor is a youth age 10 to 18 using canyon sides and bottoms for hiking or biking. This is the only land use scenario applicable for areas of contamination on canyon sides. Although unlikely as a current use scenario because of institutional controls on Laboratory property, It is possible that limited trespassing occurs.
d. Current or future resident is a resident of extra-Laboratory areas (may include some canyon bottom areas in the future). This scenario does not apply to Laboratory
. property, for which future land use will be controlled by DOE. e. Future camper on Laboratory mesa top or canyon bottom areas, assuming the site is
released for recreational use (e.g., released to National Park Service). f. Exposure duration for occupational and residential scenarios (i.e., 25 and 30 yr)
recommended by the EPA (1991, 0746). For youth recreational user, 9 yr is the agerange duration and is also the median time at one residence (EPA 1989, 0305). Construction worker exposure duration is chosen based on assumption that projects will be of limited scope. Future recreational users are assumed to use site as long-term vacation area. ·
g. Area of residential exposure unit based on EPA guidance (EPA 1989, 0305). Other areas based on assumptions on likely scenario-specific activity patterns.
h. Body weights: 70 kg for adult scenarios (EPA 1991, 0746); 50 kg for youth scenarios, 12 to <15 yr old (EPA 1989, 0304); 15 kg for child 1-6 yr old (EPA 1991, 0746).
i. Not applicable.
j. Inhalation Rates: standard default value of 0.83 m3Jh used for indoor residential and indoor long-term worker exposures (EPA 1991, 0746). Inhalation rates accounting for resting, light, moderate, and heavy activity (EPA 1989, 1 011) are calculated for other scenarios as follows: • Long-term or Construction Wod<er. Resjcient-outdoor inhalation rate of 1.7 m3/h
equal to 0.5 exposure time at light activity + 0.5 exposure time at moderate activity, adult male inhalation rate.
• Youth Recreational User-inhalation rate of 3.2 rn3/h equal to entire exposure time at moderate activity, inhalation rate for 1o-yr olds.
• Future Camper-inhalation rate of 1.3 rn3/h equal to 8 h/d resting, 12 h/d light activity, 2 hid moderate activity, and 2 hid heavy activity, adult male Inhalation rate.
/WP, Revision 3 K-54 November 1993
..
AppendixK ·· .Juman Health Risk
Assessment Methodology
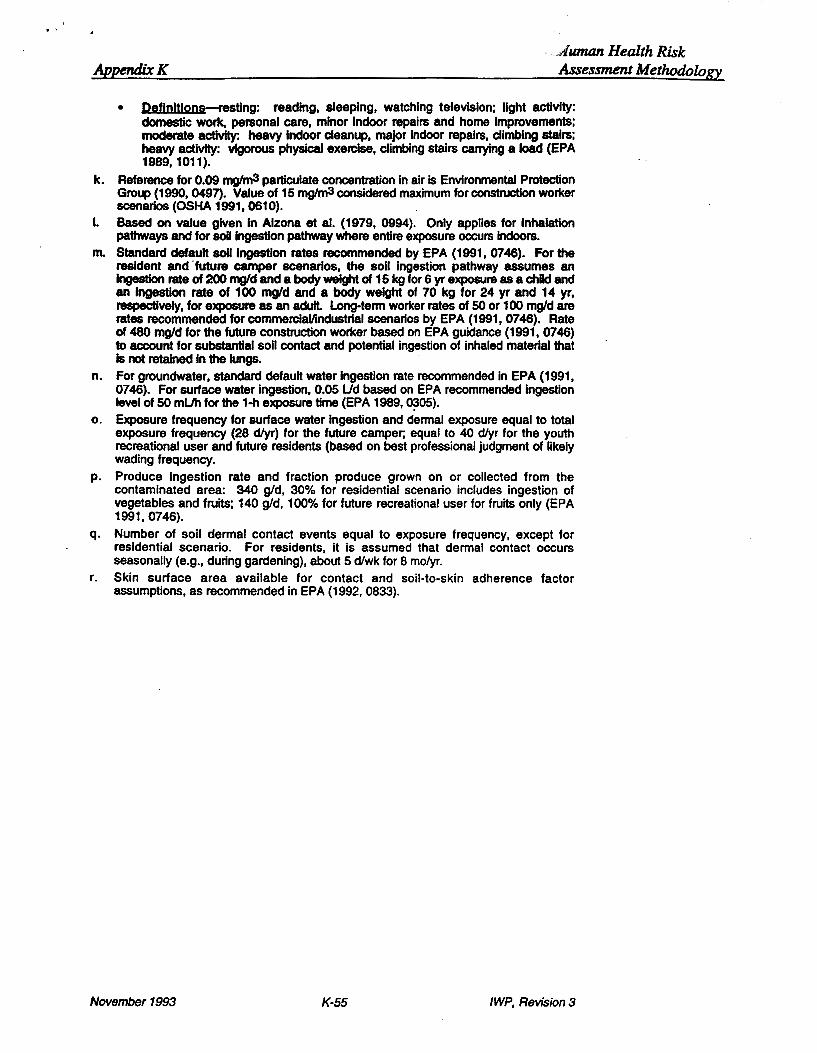
• pef!nblons-restlng: reading, sleeping, watching television; light activity: domestic work, personal care, minor Indoor repairs and home improvements; moderate actlvHy: heavy Indoor cleanup, major indoor repairs, climbing stairs; heavy activity: vigorous physical exercise, climbing stairs carrying a load (EPA 1989, 1011).
k. Reference for 0.09 rngtm3 particulate concentration in air is Environmental Protection GrouP (1990, 0497). Value of 15 mglm3 considered maximum for construction worker scenarios (OSHA 1991, 0610).
I. Based on value given In Alzona et at. (1979, 0994). Only applies for inhalation pathways and for soli Ingestion pathway where entire exposure occurs Indoors.
m. Standard default soil Ingestion rates recommended by EPA (1991, 0746). For the resident and ·future camper scenarios, the soli Ingestion pathway assumes an Ingestion rate of 200 mgld and a body weight of 15 kg for 6 yr exposure as a child and an Ingestion rate of 100 mg/d and a body weight of 70 kg for 24 yr and 14 yr, respectively, for exposure es an adult Long-term worker rates of 50 or 100 mgld are rates recommended for commercial/industrial scenarios by EPA (1991, 0746). Rate of 480 mgld for the future construction worker based on EPA guidance (1991, 0746) to account for substantial soil contact and potential ingestion of inhaled material that Is not retained in the lungs.
n. For groundwater, standard default water ingestion rate recommended in EPA (1991, 0746). For surface water ingestion, 0.05 Ud based on EPA recommended ingestion level of 50 mLJh for the 1-h exposure time (EPA 1989, <>;305).
o. Exposure frequency for surface water ingestion and dermal exposure equal to total exposure frequency (28 dlyr) for the future camper; equal to 40 dlyr for the youth recreational user and future residents (based on best professional judgment of likely wading frequency.
p. Produce ingestion rate and fraction produce grown on or collected from the contaminated area: 340 gld, 30o/o for residential scenario includes ingestion of vegetables and fruits; 140 gld, 100% for future recreational user for fruits only (EPA 1991, 0746).
q. Number of soil dermal contact events equal to exposure frequency, except for residential scenario. For residents, it is assumed that dermal contact occurs seasonally (e.g., during gardening), about 5 d/wk for 8 molyr.
r. Skin surface area available for contact and soil-to-skin adherence factor assumptions, as recommended in EPA (1992, 0833).
November 1993 K-55 IWP, Revision 3

Attachment 6-3
Computer Printouts Generated in Performing the Risk Assessment for
PRS 33-Q11(a)
A printout is included for each of the following scenarios:
residential- adult;
TA-33
residential- child; camper - adult; camper- child; hiker - adult; construction worker - adult; and long-term worker - adult.
May 23,1995

TABLEC-C STATISTICAL SUMMARY OF SOIL DATA PIPE STORAGE YARD, BUILDING 21 LANL. LOS ALAMOS, NEW MEXICO
COPCs FOO
Semlvolatlles Benzo(a)anthracene S/26 Benzo(a)pyrane 6/26 Benzo(b}fluoranthene 6126 Benzo(g,h,l)perylene 4/26 Benzo(k}fluoranthene 6/26 Chrysene 6/26 Dlbenzo(a,h} anthracene 1/26 lndeno(1,2,3-cd}pyrene 5/26
COPCs '"' Chemicals of potential concern FOD '"' Frequency of detection Cone. = Concentration UCL = Upper confidence limit Max. = Maximum detected concentration All concentrations are in units of mg/kg.
losalams\bldg21 -c.wk3
Minimum Detected
Cone.
< 0.33 < 0.33 <0.33 <0.33 < 0.33 < 0.33 < 0.33 < 0.33
Maximum Arithmetic Lesser of Detected Mean 95%UCL Max. or
Cone. 95% UCL
26.9 0.625 0.976 0.976 28.8 0.708 1.118 1.118 28.4 0.659 1.029 1.029 12.6 0.407 0.586 0.586 21.4 0.651 1.009 1.009 29.2 0.721 1.141 1.141
4.7 0.260 0.340 0.340 14.3 0.438 0.637 0.637
Nov. '94

(
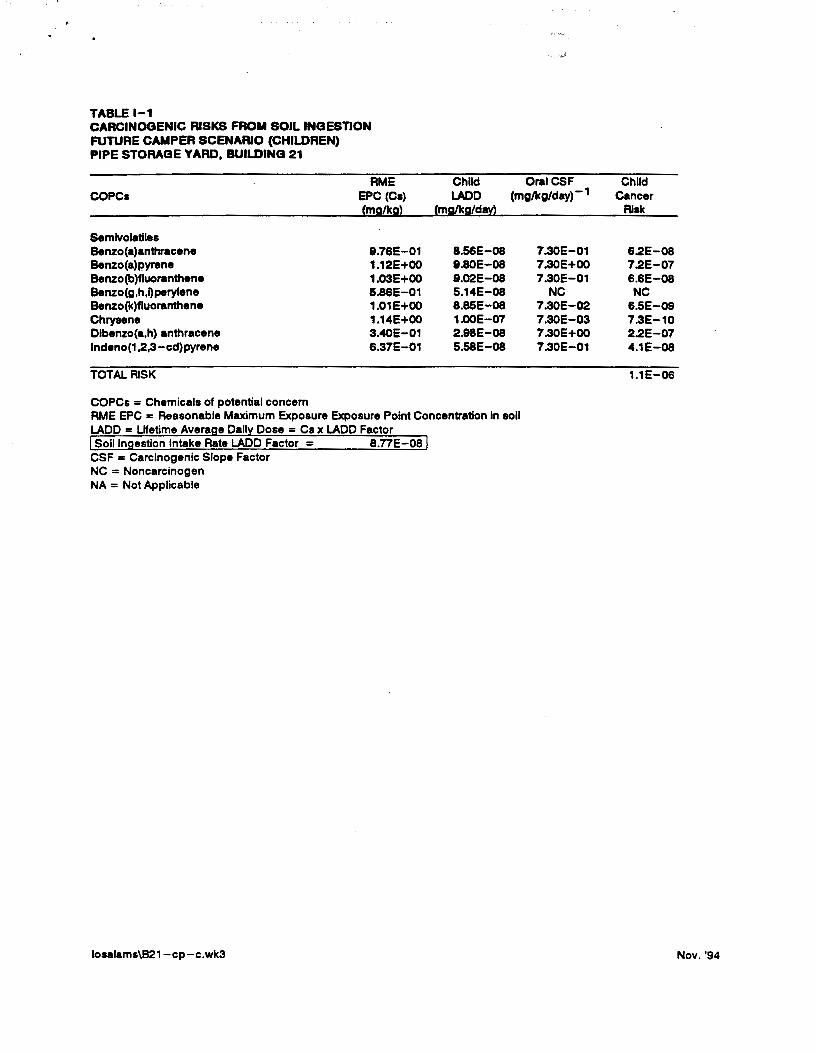
TABLEI-1 CARCINOGENIC RISKS FROM SOIL INGESTION FUTURE RESIDENT SCENARIO (ADULTS) PIPE STORAGE YARD, BUILDING 21
RME Adult OraiCSF COPCa EPC (Ca) LADD (mg/kg/day) - 1
(mg/ka> (mg/kg/day)
S.mlvolatllea Benzo(a)anthracene 8.76E-01 5.73E-o7 Benzo(a)pyrene 1.12E+OO 8.56E-07 Benzo(b)fluoranthene 1.03E+OO 6.04E-07 Benzo(g,h,Qperylene s.ase..:.o1 3.44E-07 Benzo(k)fluoranthene 1.01E+OO 5.92E-07 Chryaene 1.14E+OO 6.70E-07 Dlbenzo(a,h) anthracene 3.40E-01 2.00E-07 lndeno(1 ,2,3-cd)pyrene 6.37E-01 3.74E-07
TOTAL RISK
COPCs = Chemicals of potential concern RME EPC = Reasonable Maximum Exposure Exposure Point Concentration In soli LADD - LHetime Avera e Oail Dose - Cs x LADD Factor Soil In estion Intake Rate LADD Factor = 5.87E-07
CSF = Carcinogenic Slope Factor NC = Noncarcinogen NA = Not Applicable
losalams\bldg21-a.wk3
7.30E-01 7.30E+OO 7.30E-01
NC 7.30E-02 7.30E-03 7.30E+OO 7.30E-01
Adult Cancer
Risk
4.2E-07 4.8E-06 4.4E-07 NC
4.3E-08 4.8E-09 1.5E-06 2.7E-07
7.4E-06
Nov. '94

-- ~ .
TABLEI-2 NONCARCINOGENIC RISKS FROM SOIL INGESTION FUTURE RESIDENT SCENARIO (ADULTS) PIPE STORAGE YARD, BUILDING 21
COPCs
Semivolatiles Benzo(a)anthracene Benzo(a)pyrene Benzo(b)fluoranthene Benzo(g,h,l)perylene Benzo(k)fluoranthene Chrysene Dibenzo(a,h) anthracene lndeno(1,2,3-cd)pyrene
TOTAL HAZARD INDEX
NC = Noncarcinogen NA = Not Applicable
losalams\bldg21-a.wk3
RME EPC (Cs) (mQikg)
9.76E-01 1.12E+OO 1.o3E+OO 5.86E-01 1.01E+OO 1.14E+OO 3.40E-01 6.37E-01
1.37E-06
Adult Chronic Adult ADD Oral RfD HQ
(mglkg/day) (mglkg/day)
1.34E-06 NA NA 1.53E-06 NA NA 1.41E-06 NA NA 8.03E-07 NA NA 1.38E-06 NA NA 1.56E-06 NA NA 4.66E-07 NA NA 8.73E-07 NA NA
O.OE+OO
Nov. '94

TABLED-1 CARCINOGENIC RISKS FROM DERMAL CONTACT FUTURE RESIDENT SCENARIO (ADULTS) PIPE STORAGE YARD, BUILDING 21
RME COPCa EPC (Ca)
(m~S}
Semivolllllles Benzo(a)anthracene 9.76E-01 Benzo(a)pyrene 1.12E+OO Benzo(b)luoranthene 1.03E+OO Benzo(SI,h,i)perylene 5.86E-D1 Benzo(k)luoranthene 1.01E+OO Chryaene 1.14E+OO Dlbenzo(a.h) anthracene 3.40E-01 lndeno(1,2,3-cd)pyrene 8.37E-01
TOTAL RISK
AF • Aderence Factor
DermiiiAF (unltl•••>
0.15 0.15 0.15 0.15 0.15 0.15 0.15 0.15
RME EPC • Reasonable Maximum Expoaure Exposure Point Concentration LADD • Lifetime Avera e Dail Dose • Cs x LADD Factor Dermal Contact Intake Rate LADD Factor = 2.94E-05
CSF • Carcinogenic Slope Factor NC • Noncarcinogen NA • Not Applicable
losalams\bldg21-Lwk3
Adult Adjuatecl Adult LADD Dermlll CSF Cencer
(mal!!glday} (malkglday}-1 Risk
4.30E-06 1.69E-01 3.7E-06 4.82E-06 1.69E+OO 4.3E-05 4.53E-06 1.69E-01 3.9E-06 2.58E-06 NC NC 4.44E-06 1.69E-02 3.9E-07 5.02E-06 1.69E-03 4.4E-08 1J50E-06 8.69E+OO 1.3E-05 2.80E-06 1.69E-01 2.4E-06
6.6E-05
Nov. '94
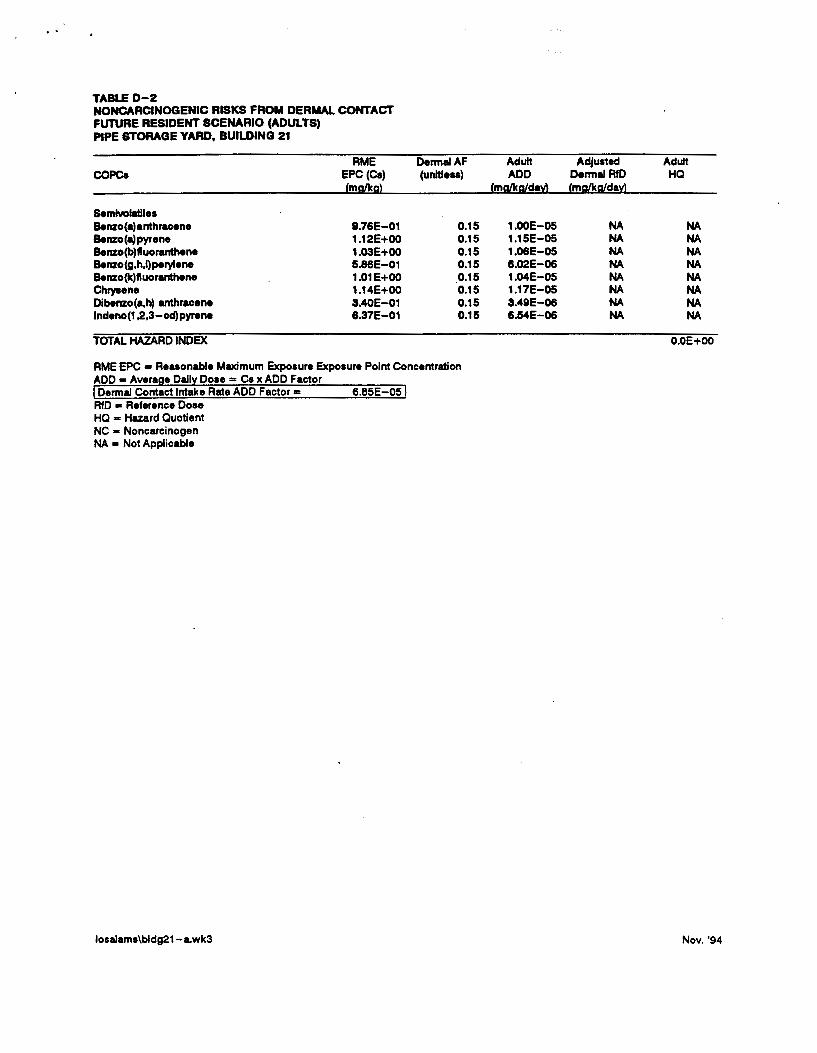
TABLED-2 NONCARCINOGENIC RISKS FROM DERMAL CONTACT FUTURE RESIDENT SCENARIO (ADULTS) PIPE STORAGE YARD, BUILDING 21
COPCa
S.mlvolatiles Benzo(a)anthracene Benzo(a)pyrene Benzo(b)tluoranthene Benzo(g,h,i)perylene Benzo{k)tluoranthene Chryaene Dibenzo(a,h) anthracene lndeno(1 ,2,3-cd)pyrene
TOTAL HAZARD INDEX
RfD • Reference Dose HQ • Hazard Quotient NC • Noncarcinogen NA • Not Applicable
losalams\bldg21-awk3
RME EPC (Ca) 'mal!! a}
8.76E-01 1.12E+OO 1.03E+OO 15.86E-01 1.01E+OO 1.14E+OO 3.40E-01 6.37E-01
6.85E-05
DermaiAF (unltleu)
0.15 0.15 0.15 0.15 0.15 0.15 0.15 0.15
Adult Adjusted Adult ADD Dermal RfD HQ
{ma/kglda~ {msl!!slda~
1.00E-05 NA NA 1.15E-05 NA NA 1.06E-05 NA NA 6.02E-06 NA NA 1.04E-05 NA NA 1.17E-05 NA NA 3.49E-06 NA NA 6.54E-06 NA NA
O.OE+OO
Nov. '94
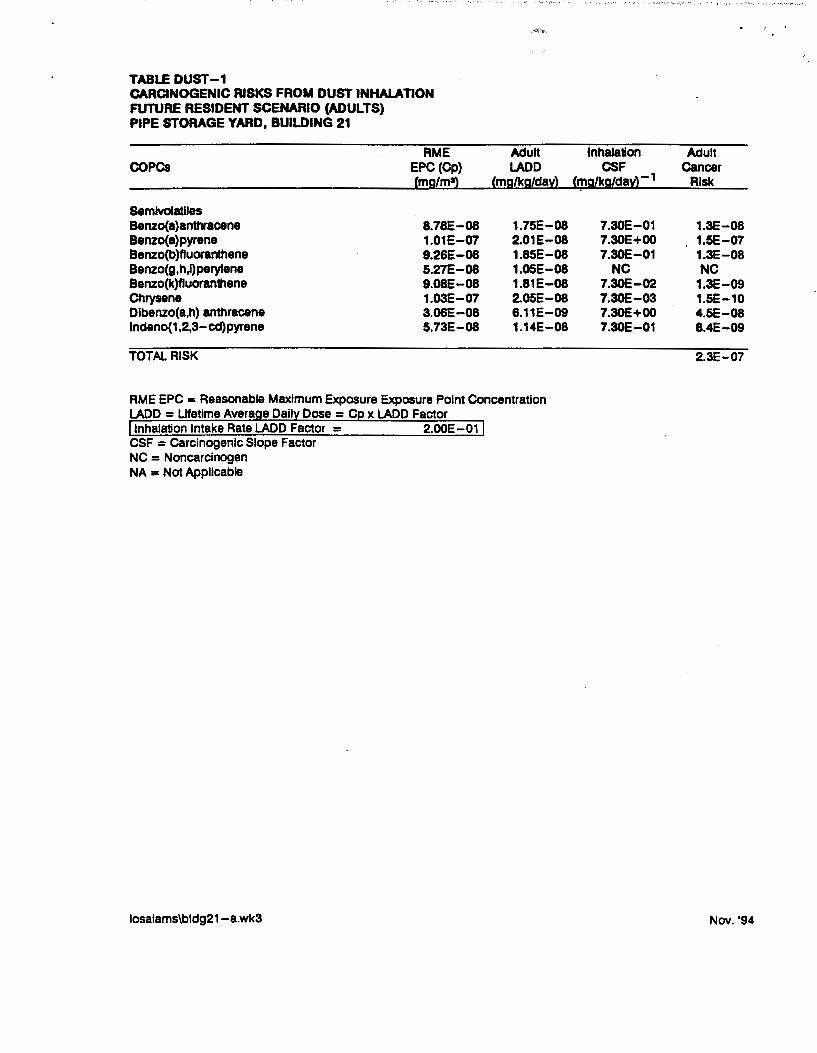
TABLE DUST-1 CARCINOGENIC RISKS FROM DUST INHALATION FUTURE RESIDENT SCENARIO (ADULTS) PIPE STORAGE YARD, BUILDING 21
RME COPCs EPC (Cp)
Cmg/mS)
Semlvolatlles Benzo(a)anttvacene 8.78E-08 Benzo(a)pyrene 1.01E-07 Benzo(b)ftuoranthene 9.26E-08 Benzo(g,h,l)perylene 5.27E-08 Benzo(k)ftuoran1hene 9.08E-08 Chrysene 1.03E-07 Dlbenzo(a,h) anthracene 3.06E-08 lndeno(1,2,3-cd)pyrene 5.73E-08
TOTAL RISK
Adult LADD
Cmg/kg/day)
1.75E-08 2.01E-08 1.85E-08 1.05E-08 1.81E-08 2.05E-08 6.11E-09 1.14E-08
RME EPC = Reasonable Maximum Exposure Exposure Point Concentration LADD = Lifetime Avera e Dail Dose = C x LADD Factor Inhalation Intake Rate LADD Factor = 2.00E-01
CSF = carcinogenic Slope Factor NC = Noncarcinogen NA = Not Applicable
losalams\bldg21-a.wk3
Inhalation Adult CSF cancer
C~g/kg/davl-1 Risk
7.30E-01 1.3E-08 7.30E+OO 1.5E-07 7.30E-01 1.3E-08
NC NC 7.30E-02 1.3E-09 7.30E-03 1.5E-10 7.30E+OO 4.5E-08 7.30E-01 8.4E-09
2.3E-07
Nov. '94

TABLE DUST -2 NONCARCINOGENIC HAZARD INDICES FROM DUST INHALAnON FUTURE RESIDENT SCENARIO (ADULTS) PIPE STORAGE YARD, BUILDING 21
RME Adult COPCs EPC(Cp) ADD
(mg/m') (mglkg/day)
Semtvolatlles Benzo(a)anthracene 8.78E-08 4.09E-08 Benzo(a)pyrene 1.01E-07 4.69E-08 Benzo(b)fluoranthene 9.26E-08 4.31E-08 Benzo(g ,h,l)perylene 5.27E-08 2.46E-08 Benzo(k)fluoranthene 9.08E-08 4.23E-08 Chrysene 1.03E-07 4.78E-08 Dibenzo(a,h) anthracene 3.06E-08 1.43E-08 lndeno(1 ,2,3-cd)pyrene 5.73E-08 2.67E-08
TOTAL HAZARD INDEX
RME EPC = Reasonable Maximum Exposure Exposure Point Concentration ADD = Avera e Dail Dose = C x ADD Factor Inhalation Intake Rate ADD Factor= 4.66E-01
RfD = Reference Dose HQ = Hazard Quotient NC = Noncarcinogen NA = Not Applicable
losalams\bldg21-a.wk3
Inhalation Adult RfD HQ
(mg/kg/day)
NA NA NA NA NA NA NA NA NA NA NA NA NA NA NA NA
O.OE+OO
Nov. '94
>'
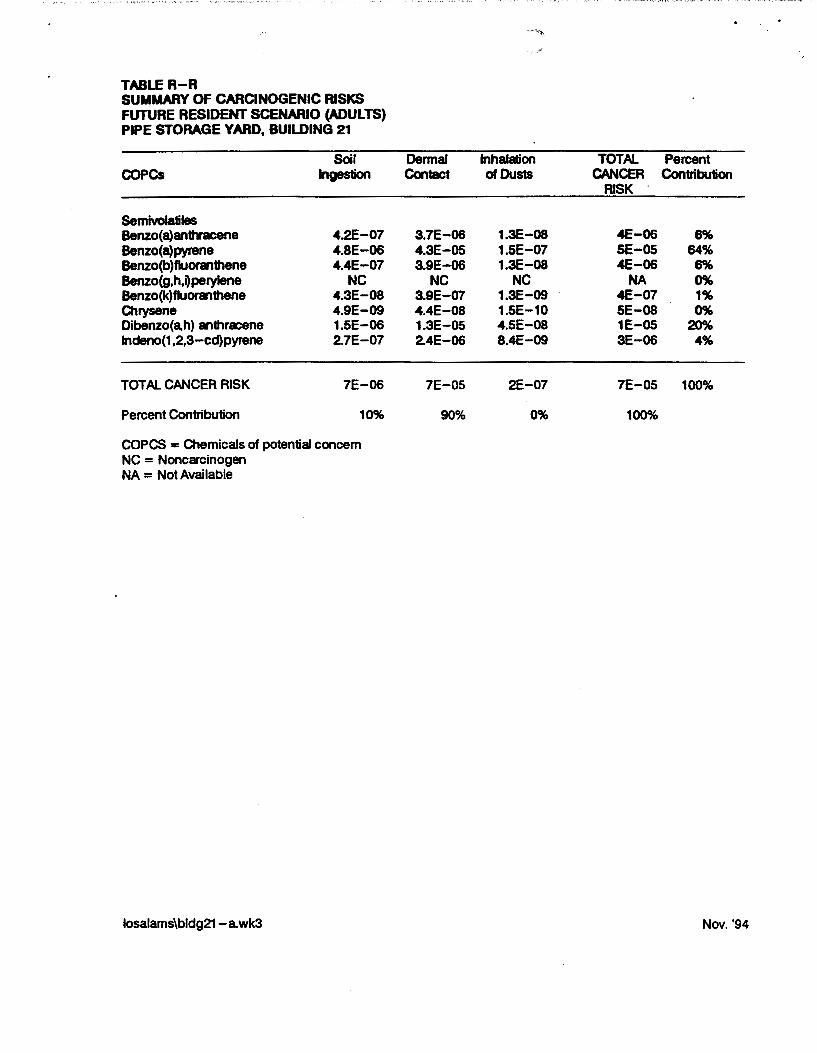
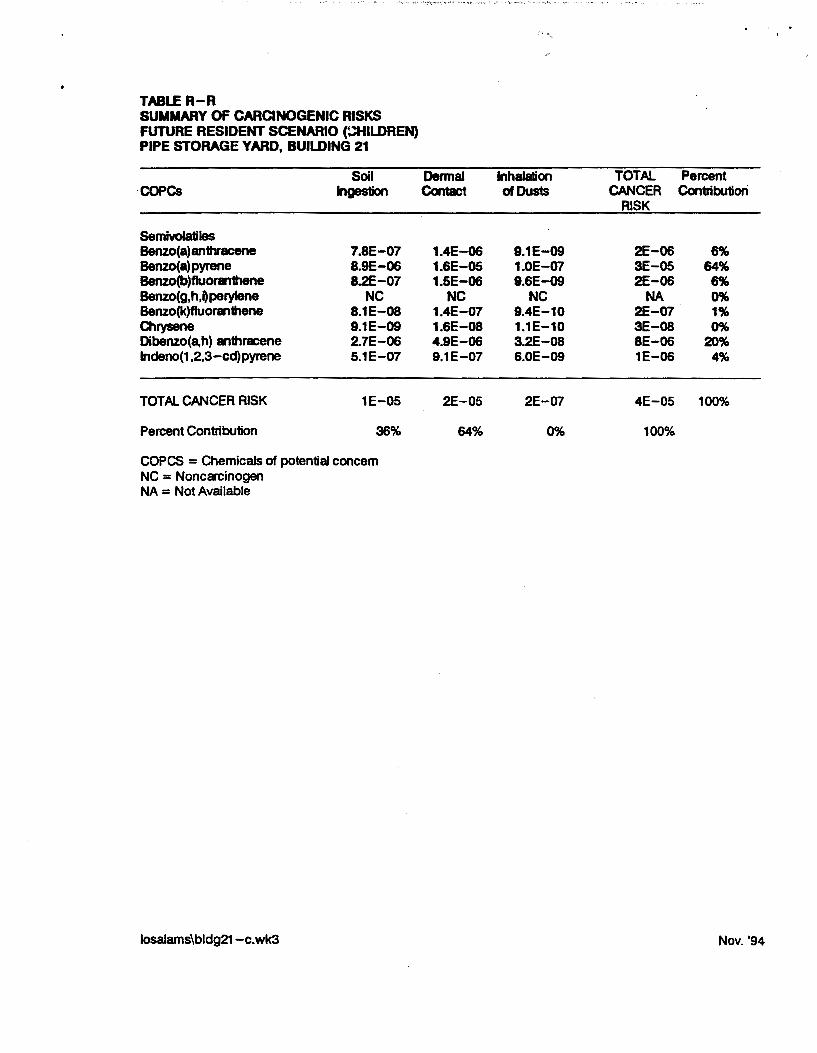
TABLER-A SUMMARY OF CARCINOGENIC RISKS FUTURE RESIDENT SCENARIO (ADULTS) PIPE STORAGE YARD, BUILDING 21
Soil Dermal Inhalation TOTAL Percent COPCs Ingestion Contact of Dusts CANCER Contribution
RISK
Semivolatiles Benzo(a)anttvacene 4.2E-07 3.7E-06 1.3E-08 4E-06 6% Benzo(a)pyrene 4.8E-06 4.3E-05 1.5E-07 SE-05 64% Benzo(b)fluon11thene 4.4E-07 3.9E-06 1.3E-08 4E-06 6% Benzo(g,h,Operylene NC NC NC NA 0% Benzo(k)fluon11thene 4.3E-08 3.9E-07 1.3E-09 4E-07 1% Chrysene 4.9E-09 4.4E-08 1.5E-10 SE-08 0% Oibenzo(a,h) anthra:ene 1.5E-06 1.3E-05 4.5E-08 1E-05 20% lndeno(1,2,3-cd)pyrene 2.7E-07 2.4E-06 8.4E-09 3E-06 4%
TOTAL CANCER RISK 7E-06 7E-05 2E-07 7E-05 100%
Percent Contribution 10% 90% 0% 100%
COPCS = Chemicals of potential concem NC = Noncarcinogen NA = Not Available
losalams\bldg21-awk3 Nov. '94
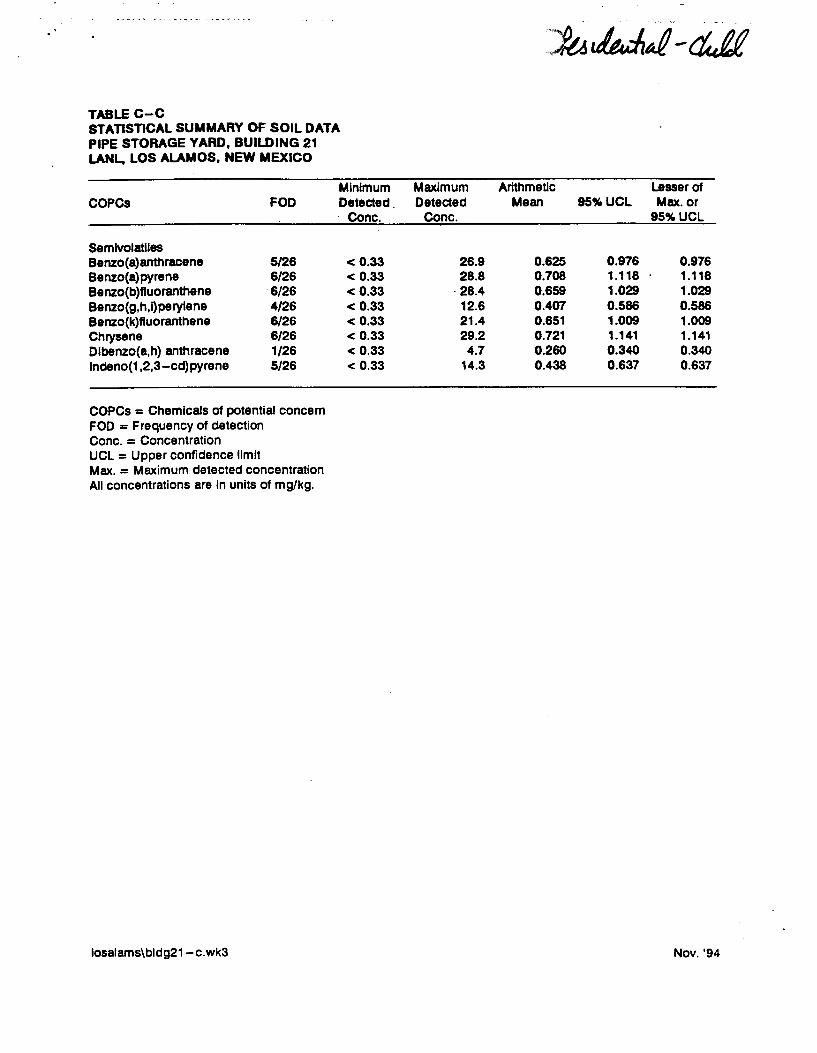
TABLE C-C STATISTICAL SUMMARY OF SOIL DATA PIPE STORAGE YARD, BUILDING 21 LANL, LOS ALAMOS, NEW MEXICO
COPCs FOD
Semlvolatlles Benzo(a)anthracene 5/26 Benzo(a)pyrene 6/26 Benzo(b)fluoranthene 6/26 Benzo(g,h,ijperylene 4/26 Benzo(k)fluoranthene 6/26 Chrysene 6/26 Dlbenzo(a,h) anthracene 1/26 lndeno(1 ,2,3-cd)pyrene 5/26
COPCs = Chemicals of potential concern FOD = Frequency of detection Cone. = Concentration UCL = Upper confidence limit Max.= Maximum detected concentration All concentrations are in units of mg/kg.
losalams\bldg21-c.wk3
Minimum Detected
Cone.
<0.33 < 0.33 <0.33 < 0.33 < 0.33 < 0.33 < 0.33 < 0.33
Maximum Arithmetic Lesser of Detected Mean 95%UCL Max. or
Cone. 95%UCL
26.9 0.625 0.976 0.976 28.8 0.708 1.118 1.118
. 28.4 0.659 1.029 1.029 12.6 0.407 0.586 0.586 21.4 0.651 1.009 1.009 29.2 0.721 1.141 1.141
4.7 0.260 0.340 0.340 14.3 0.438 0.637 0.637
Nov. '94

(
TABLEE-E EXPOSURE PARAMETERS PIPE STORAGE YARD, BUILDING 21 LANL. LOS ALAMOS, NEW MEXICO
Elg:!Qsure Parameter Svmbol Inhalation Rate - Indoor air IRa Inhalation Rate - outdoor air IRa SoD lnaestlon Rate IGs Skin SUrface Area Exposed SA Soil-skin Adherence Factor SAF
eTime ET eFreauencv EF
Exposure Duration ED FractiOn Ingested, Inhaled or
Contacted from Site Fl orFC Conversion Factor CF BodvWeight BW Averaaing Time - Cancer ATe Averagino Time - NonCancer ATnc
Units ms/hr ms/hr
ma/dav Crn'l/dav matcfn'l hr/dav days/YI_ _year
unltless kg/ma
kg davs davs
Residents References Adults Children
0.83 0.66 EPA 1991 1.7 1.3 EPA 1991 100 200 EPA 1991
5000 2000 EPA 1992 1 1 Assumed
20 20 Assumed 350 350 EPA 1992
30 6 EPA 1989
1 1 1E-06 1E-06 Conversion Factor
70 15 EPA 1991 25550 25550 365 davs/vear x 70years (lifetime) 10950 2190 365 dm/vear x ED
LADD/ADD = Lifetime Average Daily Dose/Average Dally Dose
Inhalation LADD Intake Rate Factors- outdoor air 2.00E-01 1.42E-01 Inhalation ADD Intake Rate Factors- outdoor air 4.66E-01 1.66E+OO Soil Ingestion LADD Intake Rate Factors 5.87E-07 1.10E-06 Soil Ingestion ADD Intake Rate Factors 1.37E-06 1.28E-05 Dermal Contact LADD Intake Rate Factors 2.94E-05 1.10E-05 Dermal Contact ADD Intake Rate Factors 6.85E-05 1.28E-04
losalarns\bldg21 -c.wk3 Nov. '94

TABLEI-1 CARCINOGENIC RISKS FROM SOIL INGESTION FUTURE RESIDENT SCENARIO (CHILDREN) PIPE STORAGE YARD, BUILDING 21
RME Child OraiCSF COPCa EPC (Ca) LADD (mg/kg/day)- 1
{mg!kg} {mg!kg/dav)
Semlvolatiles Benzo(a)anthracene 8.76E-01 1.07E-06 Benzo(a)pyrene 1.12E+OO 1.23E-06 Benzo(b)fiUoranthene 1.03E+OO 1.13E-06 Benzo(g,h,Qperylene 5.86E-01 6.42E-07 Benzo(k)fluoranthene 1.01E+OO 1.11E-06 Chryaene 1.14E+OO 1.25E-06 Dibenzo(a,h) anthracene 3.40E-01 3.73E-07 lndeno(1 ,2,3-cd)pyrene 6.37E-01 6.9BE-07
TOTAL RISK
COPCs = Chemicals of potential concern RME EPC = Reasonable Maximum Exposure Exposure Point Concentration in soil LADD = Lifetime Avera e Dail Dose = Cs x LADD Factor Soil In estion Intake Rate LADD Factor = 1.10E-06
CSF = Carcinogenic Slope Factor NC = Noncarcinogen NA = Not Applicable
losalams\bldg21 -c.wk3
7.30E-01 7.30E+OO 7.30E-01
NC 7.30E-02 7.30E-03 7.30E+OO 7.30E-01
Child Cancer
Risk
7.8E-07 8.8E-06 8.2E-07 NC
8.1E-OB 8.1E-09 2.7E-06 5.1E-07
1.4E-05
Nov. '94

TABLEI-2 NONCARCINOGENIC RISKS FROM SOIL INGESTION FUTURE RESIDENT SCENARIO (CHILDREN) PIPE STORAGE YARD, BUILDING 21
COPCs
Semlvolatiles Benzo(a)anthracene Benzo(a)pyrene Benzo(b)fluoranthene Benzo(g,h,qperytene Benzo(k)fluoranthene Chryeene Dibenzo(a,h) anthracene lndeno{1 ,2,3-cd)pyrene
TOTAL HAZARD INDEX
NC = Noncarcinogen NA = Not Applicable
losalams\bldg21 -c.wk3
RME EPC (Cs) (mgjkg}
8.76E-01 1.12E+OO 1.03E+OO 5.86E-01 1.01E+OO 1.14E+OO 3.40E-01 6.37E-01
1.28E-05
Child Chronic Child ADD Oral RfD HQ
{mg/kg/dav) {mglkg/davl
1.25E-OS NA NA 1.43E-05 NA NA 1.32E-05 NA NA 7.49E-06 NA NA 1.29E-OS NA NA 1.46E-05 NA .NA 4.35E-06 NA NA 8.14E-06 NA NA
O.OE+OO
Nov. '94

TABLED-1 CARCINOGENIC RISKS FROM DERMAL CONTACT FUTURE RESIDENT SCENARIO (CHILDREN) PIPE STORAGE YARD, BUILDING 21
RME COPCa EPC (Ca)
(ma/kg}
Semivolatiles Benzo(a)anthracene 8.76E-01 Benzo(a)pyrene 1.12E+OO Benzo(b)ftuoranthene 1.03E+OO Benzo(g,h,l)perylene S.86E-01 Benzo(k)ftuoranthene 1.01E+OO Ch~ene 1.14E+OO Dibenzo(a,h) anthracene 3.40E-01 lndeno(1 ,2,3-cc:l)pyrene 6.37E-01
TOTAL RISK
AF • Aderence Factor
Dermal AF (unitleaa)
0.15 0.15 0.15 0.15 0.15 0.15 0.15 0.15
RME EPC = Reuonable Maximum Expoaure Exposure Point Concentration LADD = Ufetime Avera e Dail Doae • Ca x LADD Factor Dermal Contact Intake Rate LADD Factor • 1.1 OE-05
CSF = Carcinogenic Slope Factor NC = Noncarcinogen NA • Not Applicable
losalams\bldg21-c.wk3
Child Adjusted Child LADD Dermal CSF Cancer
(mlll!!glda:rl (mlll!!glda~}- 1 Riak
1.60E-06 8.69E-01 1.4E-06 1.84E-06 8.69E+OO 1.6E-05 1.69E-06 8.69E-01 1.5E-06 8.63E-07 NC NC 1.86E-06 8.69E-02 UE-07 1.88E-06 8.69E-03 1.6E-OB S.59E-07 8.69E+OO 4.9E-06 1.05E-06 8.69E-01 9.1E-07
2.5E-05
Nov. '94

TABLED-2 NONCARCINOGENIC RISKS FROM DERMAL CONTACT FUTURE RESIDENT SCENARIO (CHILDREN) PIPE STORAGE YARD, BUILDING 21
COPCa
S.mivalllllea Benzo(.,anttncene Benzo(ltpyrene Benzo(btluoranthene Benzo(g.h,i)perylene Benzo(lc)luoranthene Chryaene Oibenzo(a.h) anthracene lndeno(1,2,3-cd)J¥8ne
TOTALHAZARDINDEX
RfD =- Reference Dose HQ • HIIZard Quotient NC = Noncarcinogen NA = Not Applicable
losalama\bldg21-c.wk3
RME EPC (Ca) (m~g}
8.76E-01 1.12E+OO 1.03E+OO 5.86E-01 1.01E+OO 1.14E+OO 3.40E-01 8.37E-01
1.28E-04
DermeiAF
(unltl•••>
0.15 0.15 0.15 0.15 0.15 0.15 0.15 0.15
Child Adjusted Child ADD DermeiAfD HQ
(mSil!!gfday} (m~glday}
1.87E-05 NA NA 2.14E-05 NA NA 1.97E-05 NA NA 1.12E-05 NA NA 1.84E-05 NA NA 2.19E-05 NA NA 6.52E-06 NA NA 1.22E-05 NA NA
O.OE+OO
Nov. '94
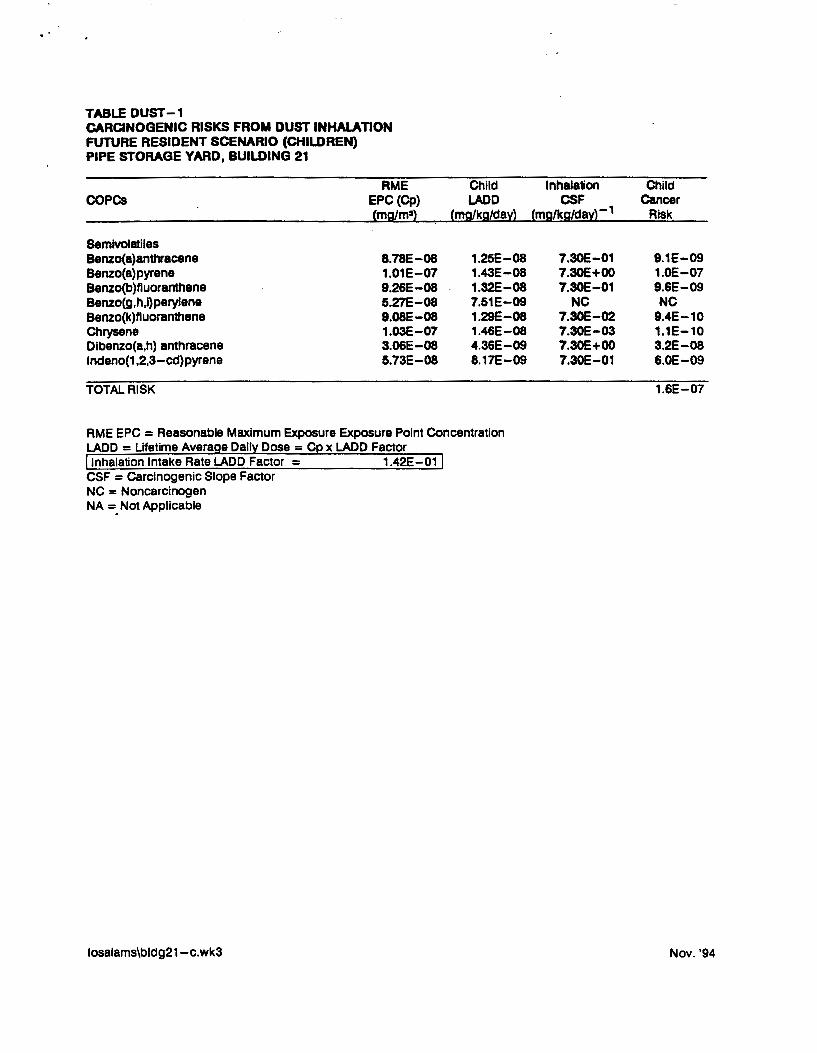
TABLE DUST-1 CARCINOGENIC RISKS FROM DUST INHALATION FUTURE RESIDENT SCENARIO (CHILDREN) PIPE STORAGE YARD, BUILDING 21
RME COPCs EPC(Cp)
(mg/m3)
Semlvolatiles Benzo(a)anthracene 8.78E-08 Benzo(a)pyrene 1.01E-07 Benzo(b)fluoranthene 9.26E-08 Benzo(g,h,l)perylene 5.27E-08 Benzo(k)fluoranthene 9.08E-08 Chrysene 1.03E-07 Dlbenzo(a,h) anthracene 3.06E-08 lndeno(1,2,3-cd)pyrene 5.73E-08
TOTAL RISK
Child LADD
(mg/kg/day)
1.25E-08 1.43E-08 1.32E-08 7.51E-09 1.29E-08 1.46E-08 4.36E-09 8.17E-09
RME EPC = Reasonable Maximum Exposure Exposure Point Concentration LADD = Lifetime Avera e Dail Dose = C x LADD Factor Inhalation Intake Rate LADD Factor = 1.42E-01
CSF = Carcinogenic Slope Factor NC = Noncarcinogen NA =.Not Applicable
losalams\bldg21-c.wk3
Inhalation Child CSF cancer
(mg/kg/day}-1 Risk
7.30E-01 9.1E-09 7.30E+OO 1.0E-07 7.30E-01 9.6E-09
NC NC 7.30E-02 9.4E-10 7.30E-03 1.1E-10 7.30E+OO 3.2E-08 7.30E-01 6.0E-09
1.6E-07
Nov. '94
TABLER-A SUMMARY OF CARCINOGENIC RISKS FUTURE RESIDENT SCENARIO (~ILDREN) PIPE STORAGE YARD, BUILDING 21
Soil Dermal Inhalation TOTAL Percent ·COPCs Ingestion Contact of Dusts CANCER Contribution
RISK
Semivolatiles Benzo(a)an1tvacene 7.8E-07 1.4E-06 9.1E-09 2E-06 6% Benzo(a)pyrene 8.9E-06 1.6E-05 1.0E-07 3E-05 64% Benzo(b)fluo1Wl1hene 8.2E-07 1.5E-06 9.6E-09 2E-06 6% Benzo(g,h,Operylene NC NC NC NA 0% Benzo(k)fluora11hene 8.1E-08 1.4E-07 9.4E-10 2E-07 1% Chrysene 9.1E-09 1.6E-08 1.1E-10 3E-08 0% Dibenzo(a,h) anthracene 2.7E-06 4.9E-06 3.2E-08 SE-06 20% lndeno(1 .2.3-cd)pyrene 5.1E-07 9.1E-07 6.0E-09 1E-06 4%
TOTAL CANCER RISK 1E-05 2E-05 2E-07 4E-05 100%
Percent Contribution 36% 64% 0% 100%
COPCS = Chemicals of potential concern NC = Noncarcinogen NA = Not Available
losalams\bldg21-c.wk3 Nov. '94
..
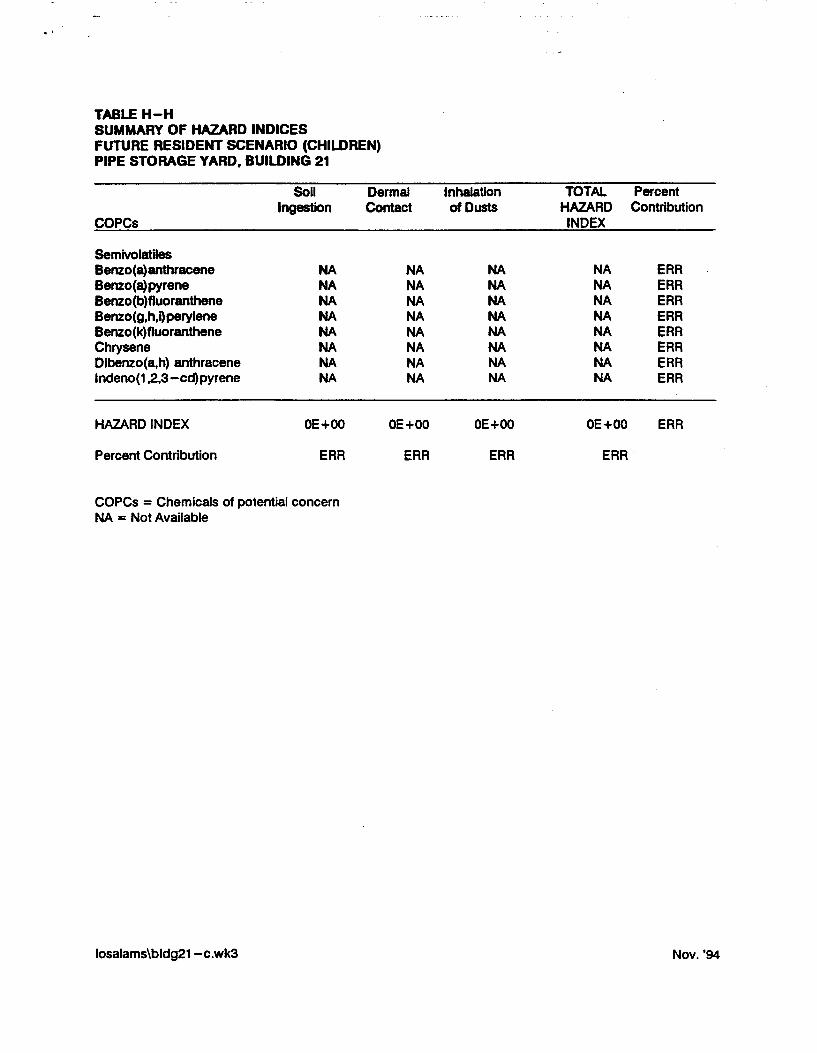
TABLE H-H SUMMARY OF HAZARD INDICES FUTURE RESIDENT SCENARIO (CHILDREN) PIPE STORAGE YARD, BUILDING 21
Soil Dermal Inhalation TOTAL Percent Ingestion Contact of Dusts HAZARD Contribution
COPCs INDEX
Semivolatiles Benzo(a)anthracene NA NA NA NA ERR Benzo(a)pyrene NA NA NA NA ERR Benzo(b)fluoranthene NA NA NA NA ERR Benzo(g,h.~perylene NA NA NA NA ERR Benzo(k)fluoranthene NA NA NA NA ERR Chrysene NA NA NA NA ERR Dibenzo(a,h) anthracene NA NA NA NA ERR lndeno(1,2,3-cd)pyrene NA NA NA NA ERR
HAZARD INDEX OE+OO OE+OO OE+OO OE+OO ERR
Percent Contribution ERR ERR ERR ERR
COPCs = Chemicals of potential concern NA = Not Available
losalams\bldg21 -c.wk3 Nov. '94

TABLEC-C STATISTICAL SUMMARY OF SOIL DATA PIPE STORAGE YARD, BUILDING 21 LANL, LOS ALAMOS, NEW MEXICO
COPCs FOD
Semivolatiles Benzo(a)anthracene 5/26 Benzo(a)pyrene 6/26 Benzo(b)fluoranthene 6/26 Benzo(g,h,Qperylene 4/26 Benzo(k)fluoranthene 6/26 Chrysene 6/26 Dlbenzo(a,h) anthracene 1/26 lndeno(1 ,2,3-cd)pyrene 5/26
COPCs = Chemicals of potential concern FOD = Frequency of detection Cone. = Concentration UCL = Upper confidence limit Max. = Maximum detected concentration All concentrations are in units of mg/kg.
losaiams\B21-cp-a.wk3
Minimum Detected
Cone.
< 0.33 < 0.33 < 0.33 < 0.33 < 0.33 < 0.33 < 0.33 < 0.33
Maximum Arithmetic Lesser of Detected Mean 95%UCL Max. or
Cone. 95%UCL
26.9 0.625 0.976 0.976 28.8 0.708 1.118 1.118 28.4 0.659 1.029 1.029 12.6 0.407 0.586 0.586 21.4 0.651 1.009 1.009 29.2 0.721 1.141 1.141 4.7 0.260 0.340 0.340
14.3 0.438 0.637 0.637
Nov. '94

TABLEI-1 CARCINOGENIC RISKS FROM SOIL INGESTION FUTURE CAMPER SCENARIO (ADULTS) PIPE STORAGE YARD, BUILDING 21
RME Adult OraiCSF COPCs EPC (Cs) LADD (mg/kg/day)- 1
(mg/kg) (ms/kg/davl
Semlvolatiles Benzo(a)anthracene 8.76E-D1 3.06E-08 Benzo(a)pyrene 1.12E+OO 3.SOE-08 Benzo(b)fluoranthene 1.03E+OO 3.22E-08 Benzo(g,h,l)perylene 5.86E-01 1.83E-08 Benzo(k)fluoranthene 1.01E+OO 3.16E-08 Chrysene 1.14E+OO 3.57E-08 Dlbenzo(a,h) anthracene 3.40E-01 1.06E-08 lndeno(1 ,2,3-cd)pyrene 6.37E-D1 1.99E-08
TOTAL RISK
COPCs = Chemicals of potential concern RME EPC = Reasonable Maximum Exposure Exposure Point Concentration in soil LADD = Lifetime Avera e Dail Dose = Cs x LADD Factor Soil In estion Intake Rate LADD Factor = 3.13E-08
CSF = Carcinogenic Slope Factor NC = Noncarcinogen NA = Not Applicable
losalams\821 -cp-a.wk3
7.30E-01 7.30E+OO 7.30E-01
NC 7.30E-02 7.30E-03 7.30E+OO 7.30E-01
Adult Cancer
Risk
2.2E-08 2.6E-07 2.4E-oa NC
2.3E-09 2.6E-10 7.BE-08 1.5E-08
4.DE-07
Nov. '94

..
TABLEI-2 NONCARCINOGENIC RISKS FROM SOIL INGESTION FUTURE CAMPER SCENARIO (ADULTS) PIPE STORAGE YARD, BUILDING 21
COPCa
Semivolatilea Benzo(a)anthracene Benzo(a)pyrene Benzo(b)fluoranthene Benzo(g,h,Qperylene Benzo (k)fluoranthene Chryaene Dibenzo(a,h) an~racene lndeno(1,2,3-cd)pyrene
TOTAL HAZARD INDEX
NC = Noncarcinogen NA = Not Applicable
losalams\B21-cp-a.wk3
RME EPC (Ca) (mg/kg)
8.76E-01 1.12E+OO 1.03E+OO 5.86E-01 1.01E+OO 1.14E+OO 3.40E-01 6.37E-01
1.02E-06
Adult Chronic Adult ADD Oral FifO HQ
(mg/kg/day) (mg/kg/day)
S.SSE-07 NA NA 1.14E-06 NA NA 1.05E-06 NA NA 5.99E-07 NA NA 1.03E-06 NA NA 1.17E-06 NA NA 3.48E-07 NA NA 6.52E-07 NA NA
O.OE+OO
Nov. '94

TABLE D-1 CARCINOGENIC RISKS FROM DERMAL CONTACT FUTURE CAMPER SCENARIO (ADULTS) PIPE STORAGE YARD, BUILDING 21
AF • Aderence Factor RME EPC • Reasonable Maximum Exposure Exposure Point Concentration LADD .. Ufetime Avera e Dail Dose • Ca x LADD Factor Dermal Contact Intake Rate LADD Factor"" 1.57E-06
CSF • Carcinogenic Slope Factor NC • Noncarcinogen NA • Not Applicable
losalams\821 -cp-Lwk3 Nov. '94
........ _.
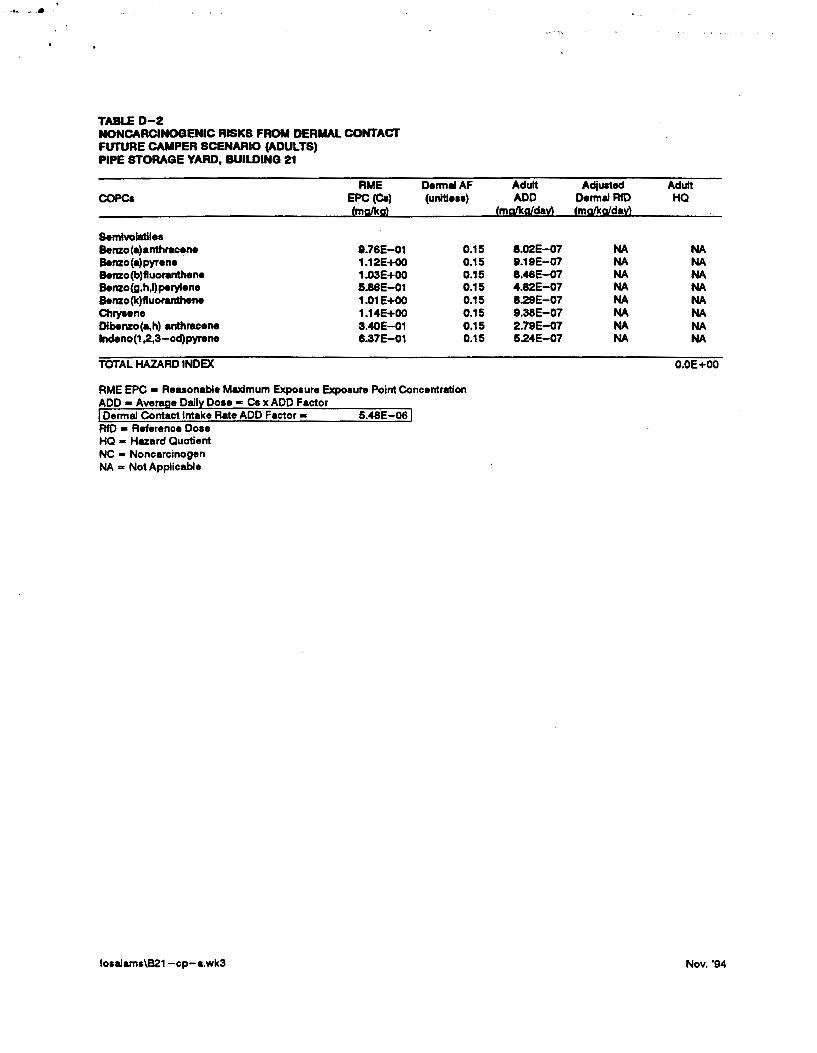
TABLE D-2 NONCARCINOGENIC RISKS FROM DERMAL CONTACT FUTURE CAMPER SCENARIO (ADULTS) PIPE STORAGE YARD, BUILDING 21
COPCa
Semlvolatilea Benzo(a)anthracene Benzo(a)pyrene Benzo(b)ftuoranthene Benzo(g,h,l)perylene Benzo(k)ftuoranthene Chryaene Dibenzo(a,h) anthracene lndeno(1 ,2,3-cd)pyrene
TOTAL HAZARD INDEX
NC • Noncarcinogen NA = Not Applicable
loaalama\B21-cp-a.wk3
RME EPC (C.) fmSJL!!sl
8.76E-01 1.12E+OO 1.03E+OO 5.86E-01 1.01E+OO 1.14E+OO 3.40E-01 6.37E-01
5.48E-06
Dermal AF (unltleaa)
0.15 0.15 0.15 0.15 0.15 0.15 0.15 0.15
Adult Adjusted Adult ADD Dermal RfO HQ
fmSJL!!SJlda~ {malkglda~}
8.02E-07 NA NA 8.19E-07 NA NA 8.46E-07 NA NA 4.82E-07 NA NA 8.29E-07 NA NA 9.38E-07 NA NA 2.79E-07 NA NA 5.24E-07 NA NA
O.OE+OO
Nov. '94
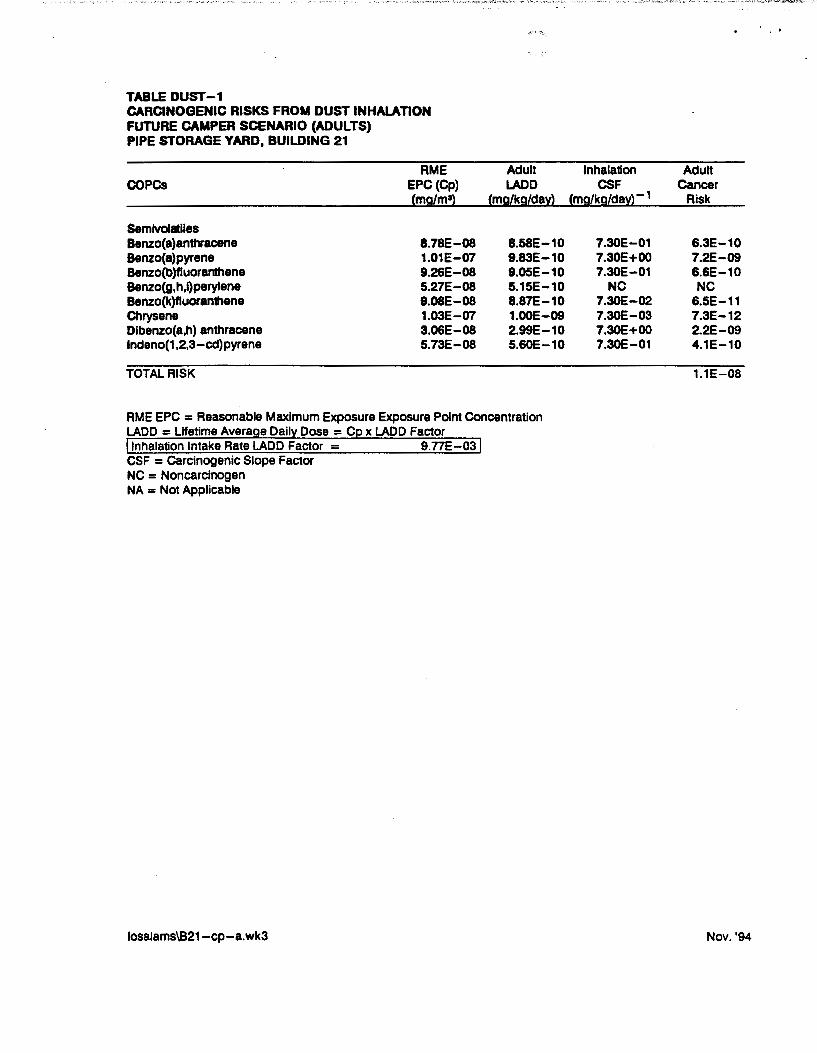
TABLE DUST-1 CARCINOGENIC RISKS FROM DUST INHALATION FUTURE CAMPER SCENARIO (ADULTS) PIPE STORAGE YARD, BUILDING 21
RME COPCs EPC (Cp)
(mg/m~)
Semlvolatlles Benzo(a)anttYacene 8.78E-08 Benzo(a)pyrene 1.01E-07 Benzo(b)fluoranthene 8.26E-08 Benzo(g,h,l)perylene 5.27E-08 Benzo(k)fluoran1hene 8.08E-08 Chrysene 1.03E-07 Dibenzo(a,h) anthracene 3.06E-08 lndeno(1 ,2,3-cd)pyrene 5.73E-08
TOTAL RISK
Adult lADD
(mg/kg/da~)
8.58E-10 8.83E-10 8.05E-10 5.15E-10 8.87E-10 1.00E-09 2.99E-10 S.&OE-10
RME EPC = Reasonable Maximum Exposure Exposure Point Concentration LADD =Lifetime Avera a Dail Dose= C x lADD Factor Inhalation Intake Rate LADD Factor = s.nE-03
CSF = carcinogenic Slope Factor NC = Noncarcinogen NA =Not Applicable
losalams\B21-cp-a.wk3
' .
Inhalation Adult CSF Cancer
(mg/kg/da~)- 1 Risk
7.30E-01 6.3E-10 7.30E+OO 7.2E-09 7.30E-01 6.6E-10
NC NC 7.30E-02 6.5E-11 7.30E-03 7.3E-12 7.30E+OO 2.2E-09 7.30E-01 4.1E-10
1.1E-08
Nov. '94

TABLE DUST -2 NONCARCINOGENIC HAZARD INDICES FROM DUST INHALAnON FUTURE CAMPER SCENARIO (ADULTS) PIPE STORAGE YARD, BUILDING 21
RME Adult COPCs EPC (Cp) ADD
Cmg/m') (mg/kg/day)
Semlvolatiles Benzo(a)anthracene 8.78E-08 3.00E-09 Benzo(a)pyrene 1.01E-07 3.44E-09 Benzo(b)fluoranthene 9.26E-08 3.17E-09 Benzo(g,h,l) perytene 5.27E-08 1.80E-09 Benzo(k)fluoranthene 9.08E-08 3.10E-09 Chrysene 1.03E-07 3.51E-09 Dibenzo(a,h) anthracene 3.06E-08 1.05E-09 lndeno(1 ,2,3-cd)pyrene 5.73E-08 1.96E-09
TOTAL HAZARD INDEX
RME EPC = Reasonable Maximum Exposure Exposure Point Concentration ADD = Avera e Dail Dose = C x ADD Factor Inhalation Intake Rate ADD Factor = 3.42E -02
RfD = Reference Dose HQ = Hazard Quotient NC = Noncarcinogen NA = Not Applicable
losalams\821-cp-a.wk3
Inhalation Adult RfD HQ
(mg/kg/day)
NA NA NA NA NA NA NA NA NA NA NA NA NA NA NA NA
O.OE+OO
Nov. '94
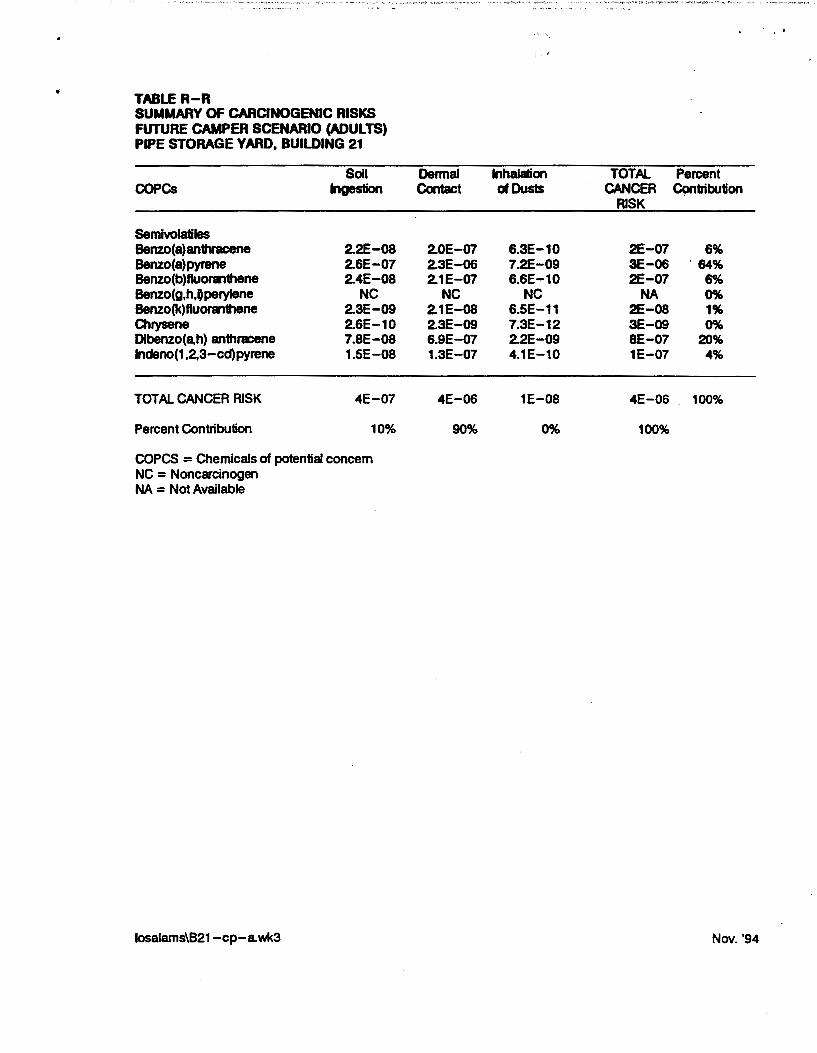
• TABLE R-R SUMMARY OF CARCINOGENIC RISKS FUTURE CAMPER SCENARIO (ADULTS) PIPE STORAGE YARD, BUILDING 21
Soil Dermal Inhalation TOTAL Percent COPCs Ingestion Contact mOusts CANCER C9ntribution
RISK
Semivolatiles Benzo(a)an1hracene 2.2E-08 2.0E-07 6.3E-10 2E-07 6% Benzo(a)pyrene 2.6E-07 2.3E-06 7.2E-09 3E-06 . 64% Benzo(b)fluoralthene 2.4E-08 2.1E-07 6.6E-10 2E-07 6% Benzo(g,h,~perylene NC NC NC NA 0% Benzo(k)fluoralthene 2.3E-09 2.1E-08 6.5E-11 2E-08 1% Quysene 2.6E-10 2.3E-09 7.3E-12 3E-09 0% Oibenzo(a,h) anthracene 7.8E-08 6.9E-07 2.2E-09 SE-07 20% lndeno(1 ,2,3-cd)pyrene 1.5E-08 1.3E-07 4.1E-10 1E-07 4%
TOTAL CANCER RISK 4E-07 4E-06 1E-08 4E-06 100%
Percent Contribution 10% 90% 0% 100%
COPCS = Chemicals of potential concern NC = Noncarcinogen NA = Not Available
losalams\B21-cp-awk3 Nov. '94

TABLE H-H SUMMARY OF HAZARD INDICES FUTURE CAMPER SCENARIO (ADULTS) PIPE STORAGE YARD, BUILDING 21
Soil Dermal Inhalation TOTAL Percent Ingestion Contact of Dusts HAZARD Contribution
COPCs INDEX
Semivolatiles Benzo(a)anthracene NA NA NA NA ERR Benzo(a)pyrene NA NA NA NA ERR Benzo(b)fluoranthene NA NA NA NA ERR Benzo(g,h,ij perylene NA NA NA NA ERR Benzo(k)fluoranthene NA NA NA NA ERR Chrysene NA NA NA NA ERR Dibenzo(a,h) anthracene NA NA NA NA ERR lndeno(1 ,2,3 -cd) pyrene NA NA NA NA ERR
HAZARD INDEX OE+OO OE+OO OE+OO OE+OO ERR
Percent Contribution ERR ERR ERR ERR.
COPCs = Chemicals of potential concern NA = Not Available
losalams\B21-cp-a.wk3 Nov. '94
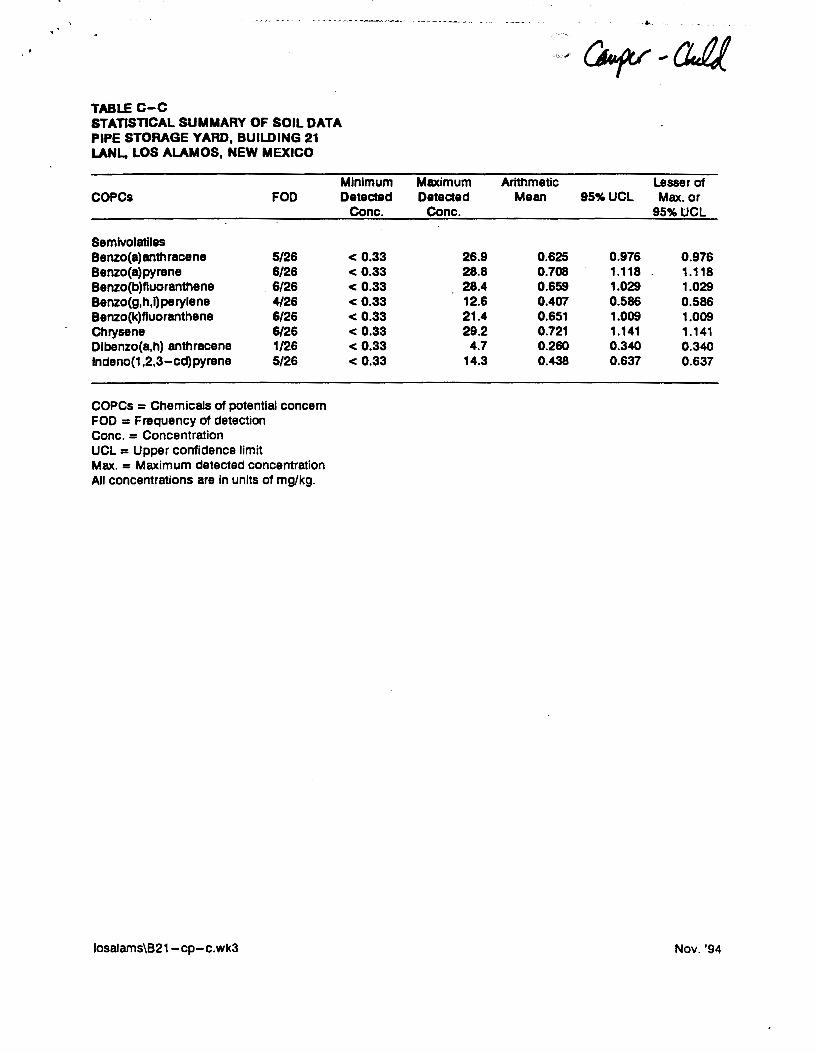
TABLE C-C STATISTICAL SUMMARY OF SOIL DATA PIPE STORAGE YARD, BUILDING 21 LANL, LOS ALAMOS, NEW MEXICO
COPCs
Semlvolatiles Benzo(a)anthracene Benzo(a)pyrene Benzo(b)fluoranthene Benzo(g,h,l)perylene Benzo(k)fluoranthene Chrysene Oibenzo(a,h) anthracene lndeno(1,2,3-cd)pyrene
FOD
5/26 6/26
. 6/26 4/26 6/26 6/26 1/26 5/26
COPCs = Chemicals of potential concern FOD = Frequency of detection Cone. = Concentration UCL = Upper confidence limit Max. = Maximum detected concentration All concentrations are In units of mg/kg.
losalams\B21-cp-c.wk3
Minimum Deteded
Cone.
< 0.33 < 0.33 < 0.33 < 0.33 < 0.33 < 0.33 < 0.33 < 0.33
Maximum Deteded
Cone.
26.9 28.8 28.4 12.6 21.4 29.2
4.7 14.3
Arithmetic Lesser of Mean 95% UCL Max. or
95% UCL
0.625 0.976 0.976 0.708 1.118 1.118 0.659 1.029 1.029 0.407 0.586 0.586 0.651 1.009 1.009 0.721 1.141 1.141 0.260 0.340 0.340 0.438 0.637 0.637
Nov. '94

TABLEE-E EXPOSURE PARAMETERS PIPE STORAGE YARD, BUILDING 21 LANL, LOS ALAMOS, NEW MEXICO
Exposure Parameter Svmbol Inhalation Rate - Indoor air IRa Inhalation Rate - outdoor air IRa Soillnaestion Rate IGs Skin Surface Area Exposed SA Soil-skin Adherence Factor SAF Exposure Tme ET Exposure Freauencv EF ExPOsure Duration ED Fraction Ingested, Inhaled or
Contacted from Site Fl orFC Conversion Factor CF BodvWeiaht BW Averaaina Time - Cancer ATe Averaaina Time - NonCancer ATnc
Units rnl/hr rnl/hr
ma/dav cma/dav materna hr/dav davs/vr
vear
unltless ka/ma
ka davs davs
Residents R8ferences Adults Children
1.3 0.66 EPA 1991 1.3 0.66 EPA 1991 100 200 EPA 1991
5000 2000 EPA 1992 1 1 Assumed
24 24 IWP 1993 28 28 IWP 1993 20 6 IWP 1993
1 1 Assumed 1E-06 1E-06 Conversion Factor
70 15 EPA 1991 25550 25550 365 davs/vear x 70 years (lifetime) 7300 2190 365 davs/vear x ED
LADD/ADD = Lifetime Average Daily Dose/Average Daily Dose
Inhalation LADD Intake Rate Factors - outdoor air 9.nE-03 6.94E-03 Inhalation ADD Intake Rate Factors - outdoor air 3.42E-02 8.10E-02 Soil Ingestion LADD Intake Rate Factors 3.13E-08 e.ne-oe Soil Ingestion ADD Intake Rate Factors 1.10E-07 1.02E-06 Dermal Contact LADD Intake Rate Factors 1.57E-06 e.nE-07 Dermal Contact ADD Intake Rate Factors 5.48E-06 1.02E-05
losalams\B21-cp-c.wk3 Nov. '94
TABLEI-1 CARCINOGENIC RISKS FROM SOIL INGESTION FUTURE CAMPER SCENARIO (CHILDREN) PIPE STORAGE YARD, BUILDING 21
RME Child OralCSF COPCs EPC (Ca) LADD (mg/kg/day)- 1
{mg/kg} {mt:llkg/dav)
Semlvolatiles Benzo(a)anthracene 8.76E-01 B.56E-08 Benzo(a) pyrene 1.12E+OO e.aoE-08 Benzo(b)fluoranthene 1.03E+OO 8.02E-08 Benzo(g,h,l)perylene 5.86E-01 5.14E-08 Benzo(k)fluoranthene 1.01E+OO e.esE-08 Chryaene 1.14E+OO 1.00E-07 Oibenzo(a,h) anthracene 3.40E-01 2.8BE-08 lndeno(1 ,2,3-cd)pyrene 6.37E-01 S.SBE-08
TOTAL RISK
COPCs = Chemicals of potential concern RME EPC = Reasonable Maximum Exposure Exposure Point Concentration in soil LADD = LHetime Avera e Dail Dose = Cs x LADD Factor Soil In estion Intake Rate LADD Factor = B.nE-08
CSF = Carcinogenic Slope Factor NC = Noncarcinogen NA = Not Applicable
losalams\821 -cp-c.wk3
7.30E-01 7.30E+OO 7.30E-01
NC 7.30E-02 7.30E-03 7.30E+OO 7.30E-01
Child Cancer
Risk
6.2E-08 7.2E-07 6.6E-08 NC
6.5E-09 7.3E-10 2.2E-07 4.1E-08
1.1E-06
Nov. '94
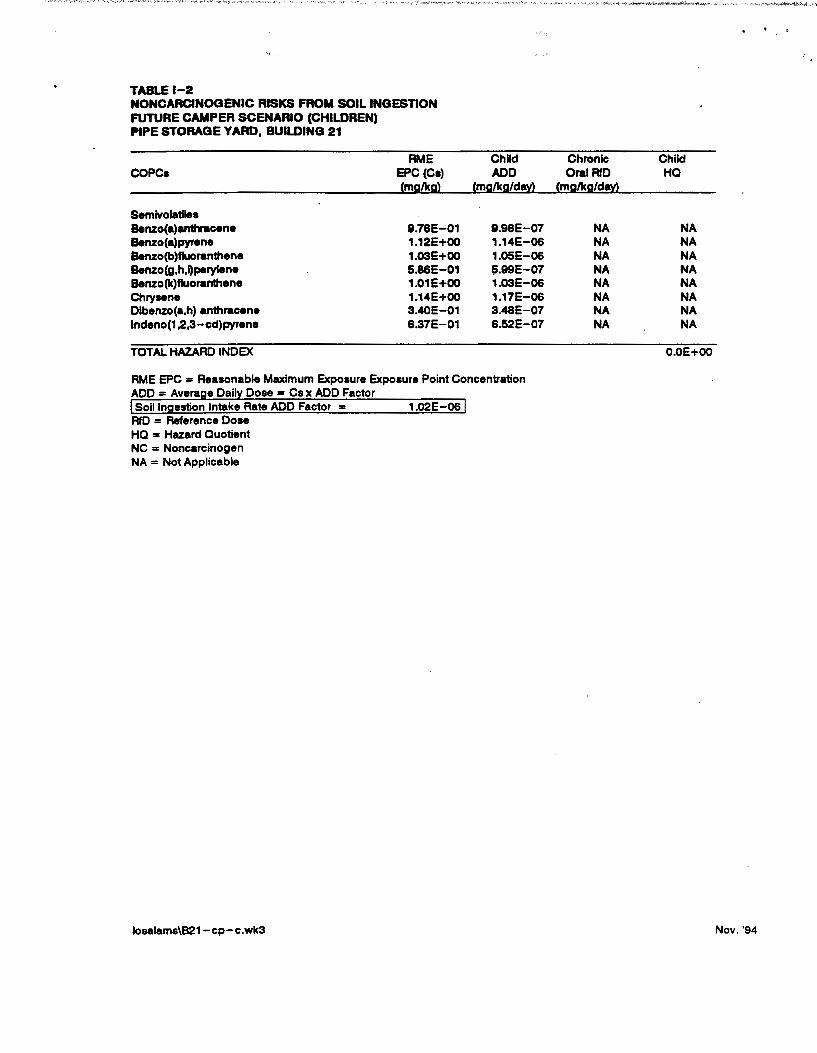
TABLEI-2 NONCARCINOGENIC RISKS FROM SOIL INGESTION FUTURE CAMPER SCENARIO (CHILDREN) PIPE STORAGE YARD, BUILDING 21
COPCa
Semivolatilea Benzo(a)anthracene Benzo(a)pyrene Benzo(b)fluoranthene Benzo(g,h,l)perylene Benzo(k)fluoranthene Chryaene Dibenzo(a,h) anthracene lndeno(1,2,3-cd) pyrene
TOTAL HAZARD INDEX
NC = Noncarcinogen NA = Not Applicable
loaalama\B21-cp-c.wk3
RME EPC (Ca) {mglksl
8.76E-01 1.12E+OO 1.03E+OO 5.86E-01 1.01E+OO 1.14E+OO 3.40E-01 8.37E-01
1.02E-06
Child Chronic Child ADD Oral RfD HQ
{mg/kg/dav} {mg/kg/dav)
8.9BE-07 NA NA 1.14E-06 NA NA 1.05E-06 NA NA ~.99E-07 NA NA 1.03E-06 NA NA 1.17E-06 NA NA 3.48E-07 NA NA 6.52E-07 NA NA
O.OE+OO
Nov. '94

.•.
TABLED-1 CARCINOGENIC RISKS FROM DERIIAL CONTACT FUTURE CAMPER SCENARIO (CHILDREN) PIPE STORAGE YARD, BUILDING 21
RME COPe. EPC {Ca)
'mSJL.l!S}
Semivolatilea Benzo(a)anthracene 8.76E-01 Benzo(a)pyrene 1.12E+OO Benzo(b)fluoranthene 1.03E+OO Benzo(g,h,l)perylene 5.86E-01 Benzo(k)fluoranthene 1.01E+OO Chryaene 1.14E+OO Dlbenzo(a,h) anthracene 3.40E-01 lndeno(1.2,3-cd)pyrene 6.37E-01
TOTAL RISK
AF • Aderence Factor
DermaiAF (unltleaa)
0.15 0.15 0.15 0.15 0.15 0.15 0.15 0.15
RME EPC • Reuonable Maximum Expoaure Expoaure Point Concentration LADD - Ufetime Avera e Dail Doae • Ca x LADD Factor Dermal Contact Intake Rate LADD Factor"' 8.77E-07
CSF "' Carcinogenic Slope Factor NC • Noncarcinogen NA • Not Applicable
losalams\821 -cp-c.wk3
Child Adjusted Child LADD Dermal CSF Cancer
'mSJL.l!gldaxl 'mSJL.!!gLdaxl- 1 Riak
1.28E-07 8.69E-01 1.1E-07 1.47E-07 8.69E+OO 1.3E-06 1.35E-07 a.ese-ot 1.2E-07 7.71E-08 NC NC 1.33E-07 8.69E-02 1.2E-08 1.50E-07 8.69E-03 1.3E-09 4.47E-08 8.69E+OO 3.9E-07 8.38E-08 8.69E-01 7.3E-08
2.0E-06
Nov. '94
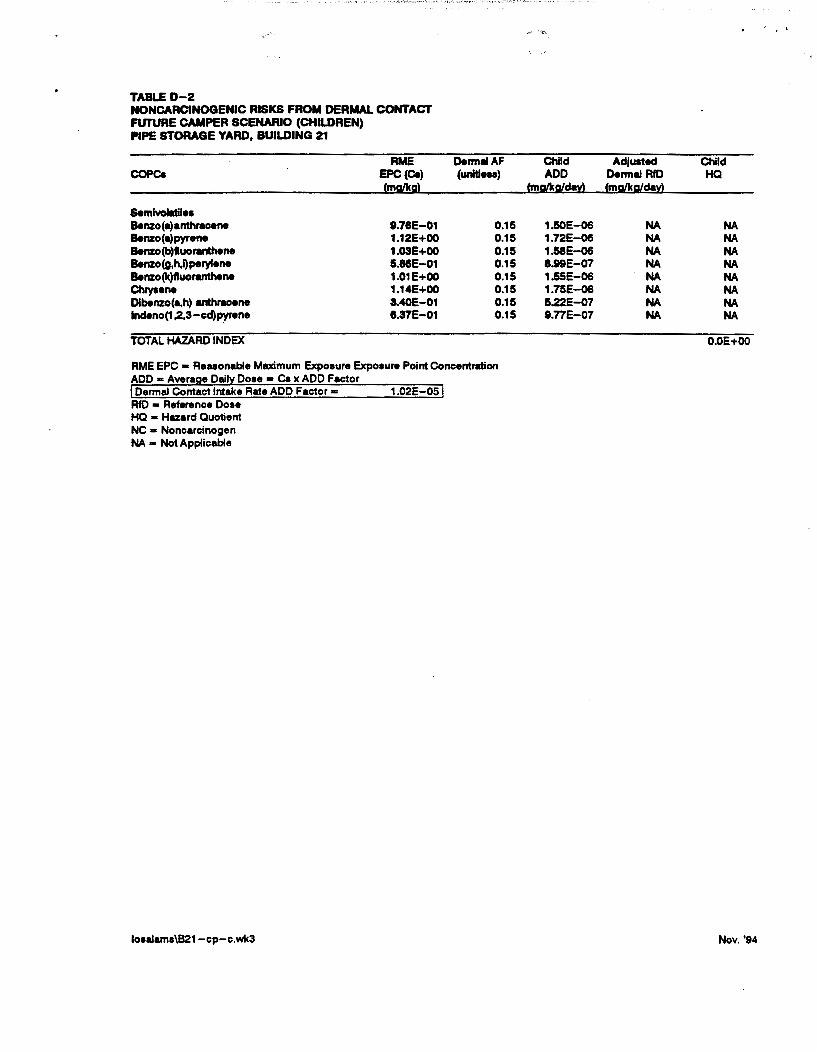
TABLED-2 NONCARCINOGENIC RISKS FROM DERMAL CONTACT FUTURE CAMPER SCENARIO (CHILDREN) PIPE STORAGE YARD, BUILDING 21
COPe.
S.mlvolatilea Benzo(a)anthracene Benzo(a)pyrene Benzo(b)tluoi'Mthene Benzo(g,h,l)perylene Benzo(k)tluoi'Mthene Chryaene Dlbenzo(a.h) anthracene lndeno(1 ,2,3-cd)pyrene
TOTAL HAZARD INDEX
NC • Noncarcinogen NA • Not Applicable
loaalama\821 -cp-c.wk3
RME EPC(Ca) (m~g}
1.76E-01 1.12E+OO 1.03E+OO 5.86E-o1 1.01E+OO 1.14E+OO a.40E-o1 6.37E-01
1.02E-05
' ' '
Derm81AF Child Adjusted Child (unltl ... ) ADD Dermal RfD HQ
f!!!~gldar} (m~gldar}
0.15 1.50E-06 NA NA 0.15 1.72E-06 NA NA 0.15 1.58E-06 NA NA 0.15 8.99E-07 NA NA 0.15 1.55E-06 NA NA 0.15 1.75E-06 NA NA 0.15 5.22E-07 NA NA 0.15 1.77E-07 NA NA
O.OE+OO
Nov. '94
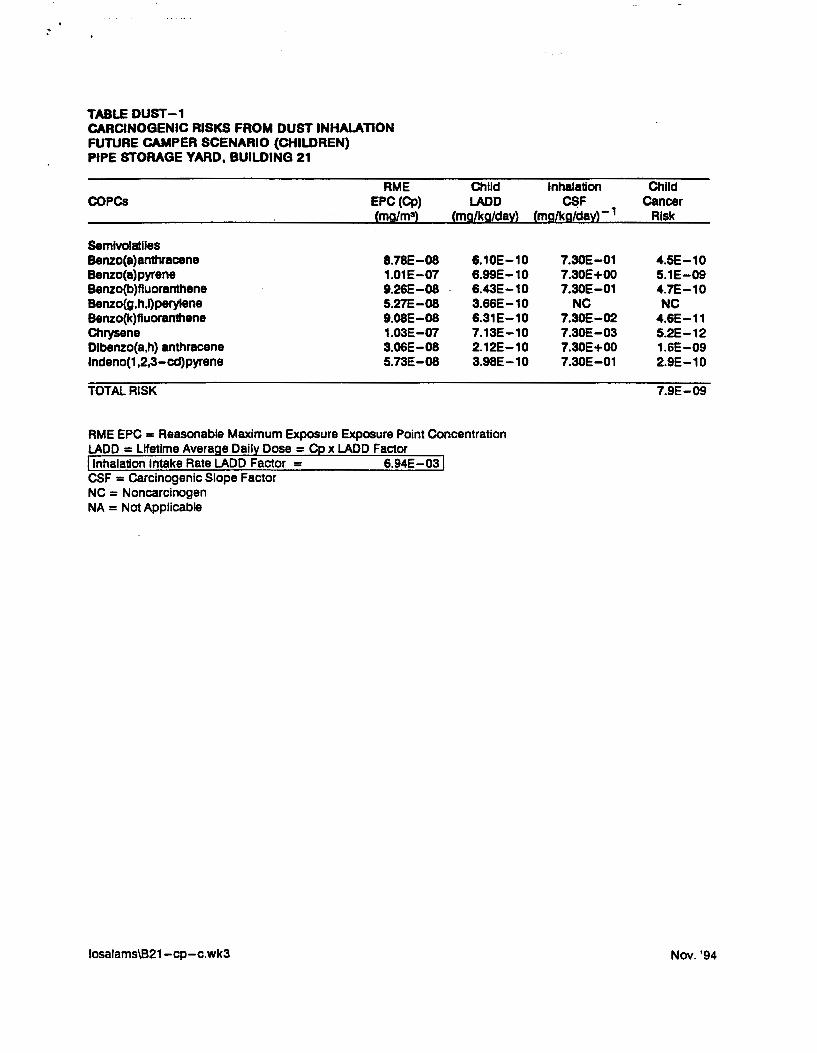
TABLE DUST-1 CARCINOGENIC RISKS FROM DUST INHALATION FUTURE CAMPER SCENARIO (CHILDREN) PIPE STORAGE YARD, BUILDING 21
RME COPCs EPC(Cp)
(mg/m3}
Semivolatiles Benzo(a)anttvacene 8.78E-08 Benzo(a)pyrene 1.01E-07 Benzo(b)fluoranthene 9.26E-08 Benzo(g,h,l)perylene 5.27E-08 Benzo(k)fluoran1hene 9.08E-08 Chrysene 1.03E-07 Dlbenzo(a,h) anthracene 3.06E-08 lndeno(1,2,3-cd)pyrene 5.73E-08
TOTAL RISK
Child LADD
{mg/kg/da~}
6.10E-10 6.99E-10 6.43E-10 3.66E-10 6.31E-10 7.13E-10 2.12E-10 3.98E-10
RME EPC = Reasonable Maximum Exposure Exposure Point Concentration LADD = Lifetime Avera e Dail Dose = C x LADD Factor Inhalation Intake Rate LADD Factor = 6.94E-03
CSF = carcinogenic Slope Factor NC = Noncarcinogen NA = Not Applicable
losalams\B21-cp-c.wk3
Inhalation Child CSF cancer
(mg£kg/da~}- 1 Risk
7.30E-01 4.5E-10 7.30E+OO 5.1E-09 7.30E-01 4.7E-10
NC NC 7.30E-02 4.6E-11 7.30E-03 5.2E-12 7.30E+00 1.6E-09 7.30E-01 2.9E-10
7.9E-09
Nov. '94

TABLER-R SUMMARY OF CARCINOGENIC RISKS FUTURE CAMPER SCENARIO (CHILDREN) PIPE STORAGE YARD, BUILDING 21
Soil Dermal COPCs Ingestion Contact
Semivolatiles Benzo(a)anttncene 6.2E-08 1.1E-07 Benzo(a)pyrene 7.2E-07 1.3E-06 Benzo(b)fluo11111hene 6.6E-08 1.2E-07 Benzo(g,h,~perylene NC NC Benzo(k)fluor1111hene 6.5E-09 1.2E-08 Chrysene 7.3E-10 1.3E-09 Oibenzo(a,h) an1hra:ene 2.2E-07 3.9E-07 lndeno(1 ,2,3-cd)pyrene 4.1E-08 7.3E-08
TOTAL CANCER RISK 1E-06 2E-06
Percent Contribution 36% 64%
COPCS = Chemicals of potential concern NC = Noncarcinogen NA = Not Available
losalams\821 -cp-c. wk3
Inhalation TOTAL of Dusts CANCER
RISK
4.5E-10 2E-07 5.1E-09 2E-06 4.7E-10 2E-07
NC NA 4.6E-11 2E-08 5.2E-12 2E-09 1.6E-09 6E-07 2.9E-10 1E-07
SE-09 3E-06
0% 100%
Percent Contribution
6% 64%
6% 0% 1% 0%
20% 4%
100%
Nov. '94
. ' '

TABLE H-H SUMMARY OF HAZARD INDICES FUTURE CAMPER SCENARIO (CHILDREN) PIPE STORAGE YARD. BUILDING 21
Soil Dermal Inhalation TOTAL Percent Ingestion Contact of Dusts HAZARD Contribution
COPCs INDEX
Semivolatiles Benzo(a)anthracene NA NA NA NA ERR Benzo(a)pyrene NA NA NA NA ERR Benzo(b)fluoranthene NA NA NA NA ERR Benzo(g,h,~perylene NA NA NA NA ERR Benzo(k)fluoranthene NA NA NA NA ERR Chrysene NA NA NA NA ERR Dibenzo(a,h) anthracene NA NA NA NA ERR lndeno(1 ,2,3-cd)pyrene NA NA NA NA ERR
HAZARD INDEX OE+OO OE+OO OE+OO OE+OO ERR
Percent Contribution ERR ERR ERR ERR
COPCs = Chemicals of potential concern NA = Not Available
losalams\B21-cp-c.wk3 Nov. '94
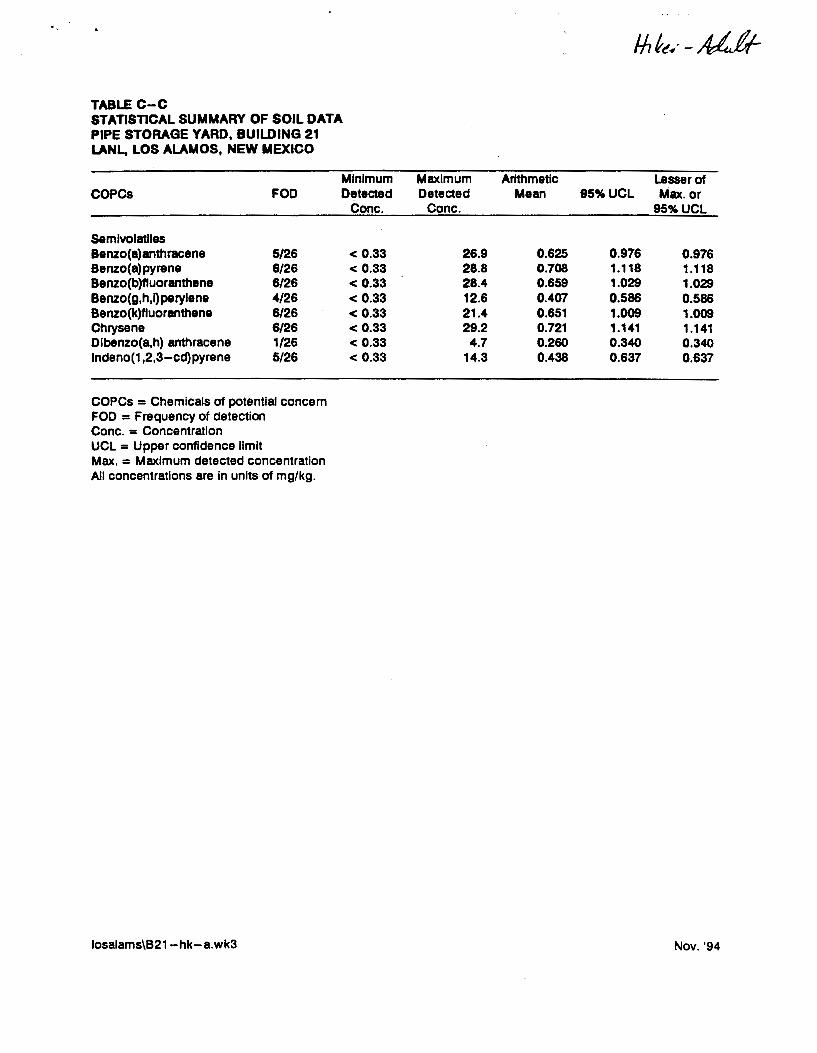
TABLE C-C STATISTICAL SUMMARY OF SOIL DATA PIPE STORAGE YARD, BUILDING 21 LANL, LOS ALAMOS, NEW MEXICO
COPCs FOO
Semlvolatiles Benzo(a)anthracene 5/26 Benzo(a)pyrene 6/26 Benzo(b)fluoranthene 6/26 Benzo(g,h,Qperylene 4/26 Benzo(k)fluoranthene 6/26 Chrysene 6/26 Olbenzo(a,h) anthracene 1/26 lndeno(1,2,3-cd)pyrene 5/26
COPCs = Chemicals of potential concern FOD = Frequency of detection Cone. = Concentration UCL = Upper confidence limit Max. = Maximum detected concentration All concentrations are in units of mg/kg.
losalams\B21-hk-a.wk3
Minimum Detected
Cone.
< 0.33 < 0.33 < 0.33 < 0.33 < 0.33 < 0.33 < 0.33 < 0.33
Maximum Arithmetic Lasser of Detected Mean 85%UCL Max. or
Cone. 95%UCL
26.9 0.625 0.976 0.976 28.8 0.708 1.118 1.118 28.4 0.659 1.029 1.029 12.6 0.407 0.586 0.586 21.4 0.651 1.009 1.009 29.2 0.721 1.141 1.141
4.7 0.260 0.340 0.340 14.3 0.438 0.637 0.637
Nov. '94

TABLED-1 AIR CONCENTRATIONS OF CHEMICALS ADHERED ONTO DUSTS PIPE STORAGE YARD, BUILDING 21 LANL. LOS ALAMOS, NEW MEXICO
COPCs
Semivolatlles Benzo(a)an1hracene Benzo(a)pyrene Benzo(b)fluoranthene Benzo(g,h,ijperytene Benzo{k)fluoranthene Chrysene Oibenzo(a,h) anthracene lndeno(1 ,2,3-cd)pyrene
COPCs = Chemicals of potential concern
RME EPC (Cs) (mg!kg)
9.76E-01 1.12E+OO 1.03E+OO 5.86E-01 1.01E+OO 1.14E+OO 3.40E-01 6.37E-01
RME EPC = Reasonable Maximum Exposure Exposure Point Concentration Cs = Concentration in soil Cp = Concentration in dust particles = Cs x PC PC= Particulate Concentration in Air= 9 x 10⁻⁸ kg/m3
losalams\B21-hk-a.wk3
RME EPC (Cp) (mg/m1)
8.78E-08 1.01E-07 9.26E-08 5.27E-08 9.08E-08 1.03E-07 3.06E-08 5.73E-08
Nov. '94

.·
TMLET-T TOlCICITY CRITERIA FOR CHEIIICALS OF P01'Bf1W.. CONCERN PIPE STORAGE YARD. BUIU.G 21 I.ANL. LOS ALMIOS, NEW MEXICO
llftlalion COPes CSf
(ma!kW4M_,
8ernMJIItilel llenlo(a)Mihracene 7.30E-G1 a.nzo{a)pyNM 7.30E+OO llenlo(b)tuoranlhene 7.30E-G1 llenlo(g.h,Qperytene NA Benzo(k)...,..,.,_ 7.30E-02 ChryMne 7.30E-G3 Dibenzo(a.h) anlhracene 7.30E+OO lndeno(1,2.3-cd)py.- 7.30E-G1
COPCa • Chemicals of potenlial concern CSF - c.-Slq)e Factor FlO - fWerence Dose
Chroric Chror*: OlaiCSF Inhalation liD
(mal!«!!da" _, (mg/kalda\'2
7.30E-G1 .NA 7.30E+OO NA 7.30E-G1 NA NA NA 7.30E-02 NA 7.30E-G3 NA 7.30E+OO NA 7.30E-G1 NA
Adjusted Dermal CSF • Chronic Olal CSF I Olal Abaorption Fraction Adjusted Dermal FlO • Chronic Olal RfD x Olal Abaorption Fraction NA- No ~ble data
loaaJams\821-hk-Lwk3
Ctwonic Olal Adjlllted AdjUited OnaiFID Abeorption DermaiCSF Dermal FlO
(!!!Aikqfdayl Fraction (mq/kalday) _, (malkalday)
NA 0.84 1.119E-G1 NA NA 0.84 1.119E+OO NA NA 0.84 uae-o1 NA NA G.84 NA NA NA 0.84 1.119E-02 NA NA 0.84 a.eeE-03 NA NA 0.84 1.119E+OO NA NA 0.84 1.68E-01 NA
Nov. '94

TABLEE-E EXPOSURE PARAMETERS PIPE STORAGE YARD, BUILDING 21 LANL, LOS ALAMOS, NEW MEXICO
ExDosure Parameter Svmbol Inhalation Rate -Indoor air IRa Inhalation Rate - outdoor air IRa Soil lnaestlon Rate IGs Skin Surface Area ExDosed SA Soil-skin Adherence Factor SAF :mosure Time ET :xposure Freauencv EF :xposure Duration ED
Fraction Ingested, Inhaled or Contacted from Site Fl orFC
Conversion Factor CF BodvWeiaht BW Averaaina Time - Cancer ATe Averagina Time - NonCancer ATnc
Not calculated
Hiker Units Adults fnl/hr 3.2 fnl/hr 3.2
ma/dav 100 cmz/dav 5000 matcmz 1 hr/dav 2 davslvr 170
year 9
unitless 1 ka/ma 1E-06
ka 70 davs 25550 davs 3285
LADD/ADD = Lifetime Average Dally Dose/Average Daily Dose
Inhalation LADD Intake Rate Factors- outdoor air 5.47E-03 Inhalation ADD Intake Rate Factors- outdoor air 4.26E-02 Soil Ingestion LADD Intake Rate Factors 8.55E-08 Soil Ingestion ADD Intake Rate Factors 6.65E-07 Dermal Contact LADD Intake Rate Factors 3.56E-07 Dermal Contact ADD Intake Rate Factors 2.ne-os
tosalams\B21-hk-a.wk3
References Children
NC IWP.1993 NC IWP.1993 NC EPA.1991 NC EPA 1992 NC Assumed NC IWP 1993 NC IWP 1993 NC IWP 1993
NC Assumed NC Conversion Factor NC EPA 1991 NC 365 davs/vear x 70 years Olfetime) NC 365 davs/vear x ED
NC NC NC NC NC NC
Nov. '94

TABLEI-1 CARCINOGENIC RISKS FROM SOIL INGESTION FUTURE HIKER SCENARIO (ADULTS) PIPE STORAGE YARD, BUILDING 21
RME Adult OraiCSF COPCs EPC (Cs) LAOD (mg/kg/day)- 1
(mg/kg} (mglkg/d~}
Semivolatllea Benzo(a)anthracene 9.76E-01 8.35E-OB Benzo(a)pyrene 1.12E+OO 9.56E-08 Benzo(b)fluoranthene 1.03E+OO B.BOE-08 Benzo(g,h,l)perylene 5.86E-01 5.01E-08 Benzo(k)fluoranthene 1.01E+OO 8.63E-OB Chryaene 1.14E+OO 9.76E-OB Dlbenzo(a,h) anthracene 3.40E-01 2.91E-08 lndeno(1 ,2,3-cd)pyrene 6.37E-01 5.45E-OB
TOTAL RISK
COPCs = Chemicals of potential concem RME EPC = Reasonable Maximum Exposure Exposure Point Concentration in soil LADD = LHetime Avera e Dail Dose = Cs x LADD Factor Soil in estion Intake Rate LADD Factor = 8.55E-08
CSF = Carcinogenic Slope Factor NC = Noncarcinogen NA = Not Applicable
losalams\821 -hk-a.wk3
7.30E-01 7.30E+OO 7.30E-01
NC 7.30E-02 7.30E-03 7.30E+OO 7.30E-01
Adult Cancer
Risk
6.1E-OB 7.0E-07 6.4E-08 NC
6.3E-09 7.1E-10 2.1E-07 4.0E-OB
1.1E-06
Nov. '94
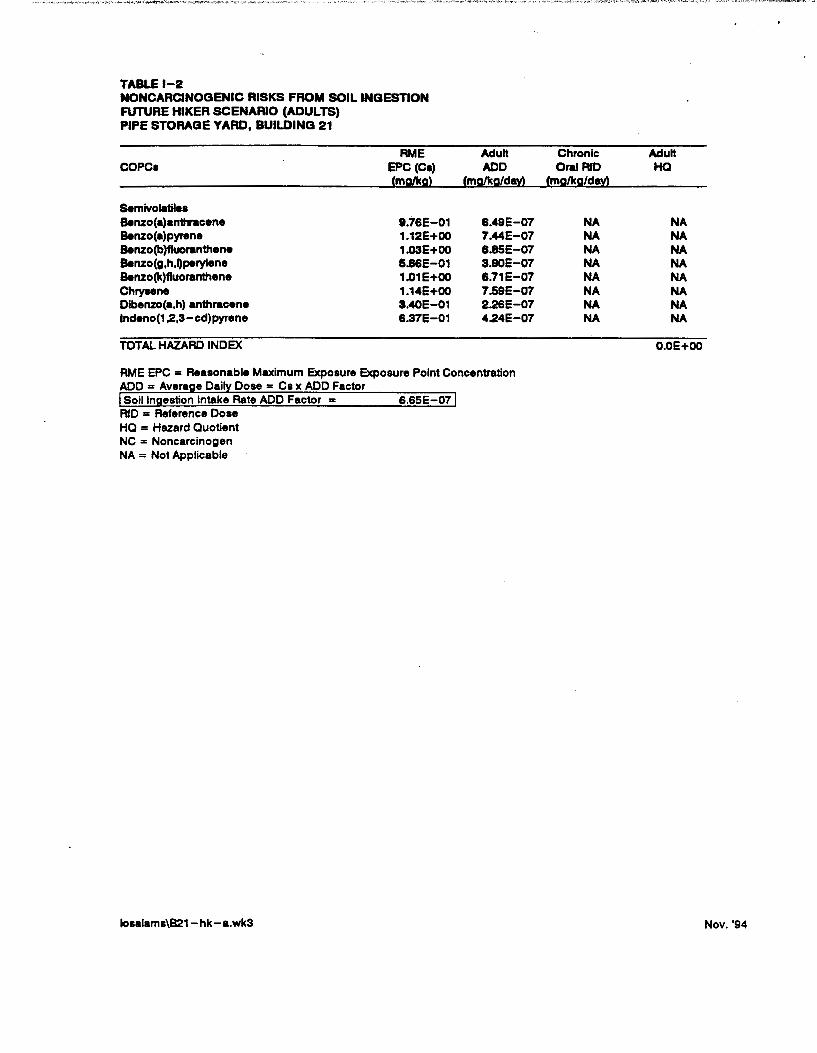
TABLEI-2 NONCARCINOGENIC RISKS FROM SOIL INGESTION FUTURE HIKER SCENARIO (ADULTS) PIPE STORAGE YARD, BUILDING 21
COPCs
Semivolatiles Benzo(a)anttncene Benzo(a)pyrene Benzo(b)fluoranthene Benzo(g,h,Qperylene Benzo(k)fluoranthene Chrysene Dibenzo(a,h) anthracene lndeno(1,2,3-cd)pyrene
TOTAL HAZARD INDEX
NC = Noncarcinogen NA = Not Applicable
losalams\B21-hk-a.wk3
RME EPC (Cs) {mg/kg}
8.76E-01 1.12E+OO 1.03E+OO 15.86E-01 1.01E+OO 1.14E+OO 3.40E-01 8.37E-01
6.65E-07
Adult Chronic Adult ADD Oral RID HQ
{mg/kg/dav\ {mg/kg/dav\
6.49E-07 NA NA 7.44E-07 NA NA e.ese-01 NA NA 3.90E-07 NA NA 8.71E-07 NA NA 7.59E-07 NA NA 2.26E-07 NA NA 4.24E-07 NA NA
O.OE+OO
Nov. '94
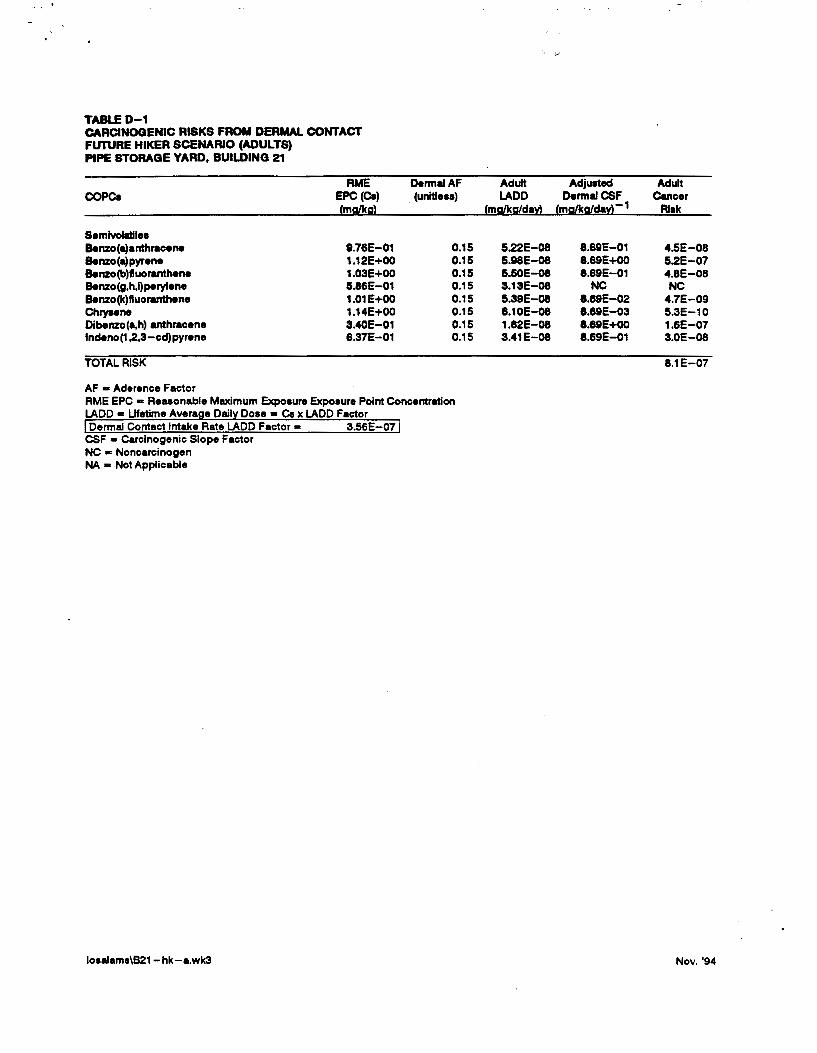
TABLED-1 CARCINOGENIC RISKS FROM DERMAL CONTACT FUTURE HIKER SCENARIO (ADULTS) PIPE STORAGE YARD, BUILDING 21
RME COPCa EPC (Ca)
{mal!!g}
Semivolatiles Benzo(a)anthracene 8.76E-01 Benzo(a)pyrene 1.12E+OO Benzo(b)ftuoranthene 1.03E+OO Benzo(g,h,i)perylene 5.86E-01 Benzo(k)ftuoranthene 1.01E+OO Chryaene 1.14E+OO Dlbenzo(a.h) anthracene 3.40E-01 lndeno(1 ,2,3-cd)pyrene 6.37E-01
TOTAL RISK
AF • Aderence Factor
DermaiAF (unltless)
0.15 0.15 0.15 0.15 0.15 0.15 0.15 0.15
RME EPC • Reasonable Maximum Exposure Exposure Point Concentration LADD • Ufetime Avera e Dail Dose • Ca x LADD Factor Dermal Contact Intake Rate LADD Factor = 3.56E-07
CSF • Carcinogenic Slope Factor NC • Noncarcinogen NA • Not Applicable
losalams\B21-hk-a.wk3
Adult Adju.ted Adult LADD O.rmaiCSF Cancer
{malkglda~ {mg[!!glda~ _, Risk
5.22E-08 8.69E-01 4.5E-08 5.98E-08 8.69E+OO 5.2E-07 5.50E-08 8.69E-01 4.8E-08 3.13E-08 NC NC 5.39E-08 8.89E-02 4.7E-09 6.10E-08 8.69E-03 5.3E-10 1.82E-08 8.69E+OO 1.6E-07 3.41E-08 8.69E-01 3.0E-08
8.1E-07
Nov. '94
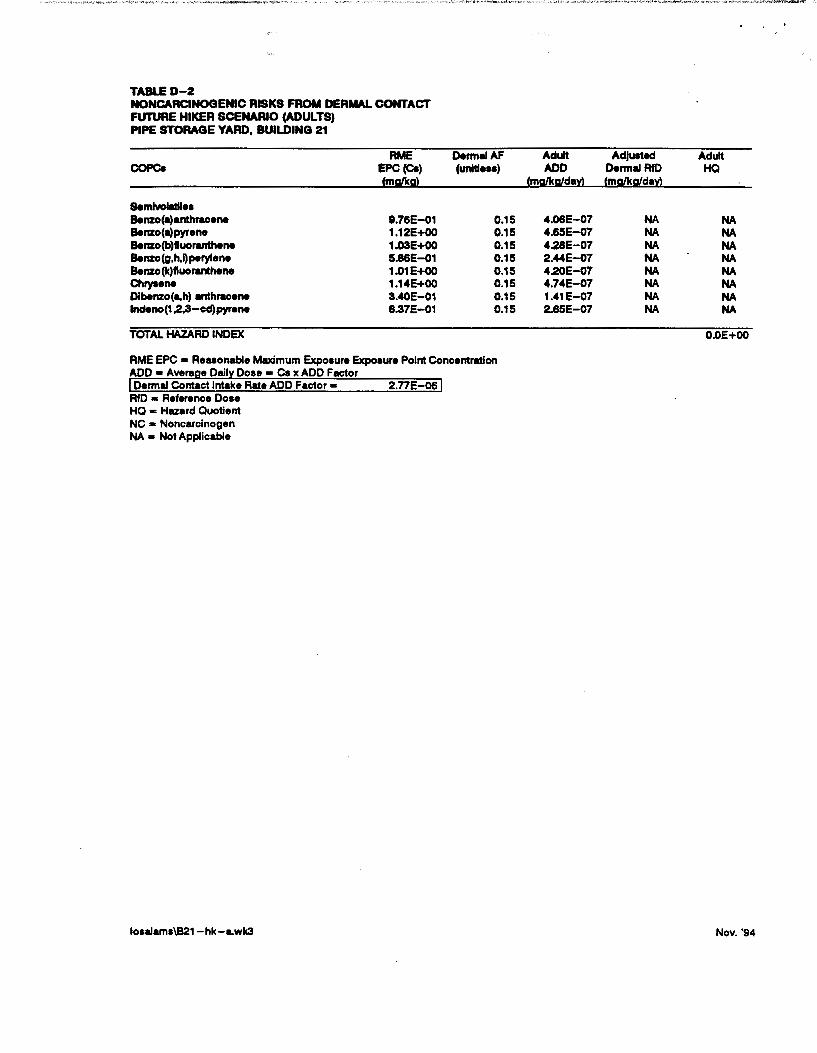
TABLED-2 NONCARCINOGENIC RISKS FROM DERMAL CONTACT FUTURE HIKER SCENARIO (ADULTS) PIPE STORAGE YARD, BUILDING 21
COPCa
S.rnlvolatll•• Benzo(a)anthracene Benzo(a)pyrene Benzo(b)ftuoranthene Benzo(g,h,l)perylene Benzo(k)tluoranthene Chryaene Dlbenzo(a,h) anthracene lndeno(1 ,2,3-cc:l)pyr.ne
TOTAL HAZARD INDEX
NC • Noncarcinogen NA • Not Applicable
loaalama\821-hk-Lwk3
RME EPC (Ca) f!!!~g)
8.76E-01 1.12E+OO 1.G3E+OO 5.86E-01 1.01E+OO 1.14E+OO 3.40E-01 6.37E-01
2.ne-os
DermaiAF Adult Adju.ted Adult (unltle .. ) ADD Dermal RfD HQ
(m~glda~ (m~glda~
0.15 4.06E-07 NA NA 0.15 4.65E-07 NA NA 0.15 4.28E-07 NA NA 0.15 2.44E-07 NA NA 0.15 4.20E-07 NA NA 0.15 4.74E-07 NA NA 0.15 1.41E-07 NA NA 0.15 2.65E-07 NA NA
O.OE+OO
Nov. '94
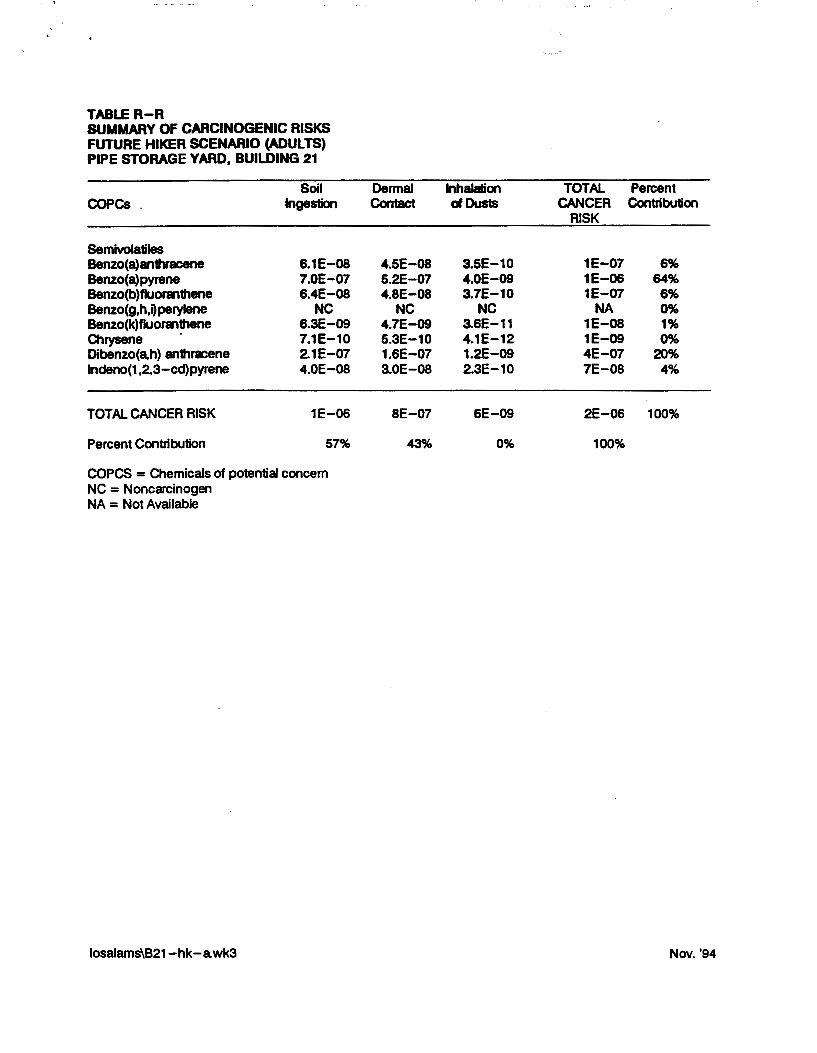
TABLER-A SUMMARY OF CARCINOGENIC RISKS FUTURE HIKER SCENARIO (ADULTS) PIPE STORAGE YARD, BUILDING 21
Soil Dermal lnhalalion TOTAL Percent COPCs . Ingestion Contact of Dusts CANCER Contribution
RISK
Semiwlatiles Benzo(a)an1tvacene 6.1E-08 4.5E-08 3.5E-10 1E-07 6% Benzo(a)pyrene 7.0E-07 6.2E-07 4.0E-09 1E-06 64% Benzo(b)flu011111hene 6.4E-08 4.8E-08 3.7E-10 1E-07 6% Benzo(g,h.~perylene NC NC NC NA 0% Benzo(k)fluor8'11hene 6.3E-09 4.7E-09 asE-11 1E-08 1% Chrysene 7.1E-10 5.3E-10 4.1E-12 1E-09 0% Dibenzo(a,h) an1hnK:ene 2.1E-07 1.6E-07 1.2E-09 4E-07 20% lndeno(1,2,3-cd)pyrene 4.0E-08 3.0E-08 2.3E-10 7E-08 4%
TOTAL CANCER RISK 1E-06 BE-07 6E-09 2E-06 100%
Percent Contribution 57% 43% 0% 100%
COPCS = Chemicals of potential concem NC = Noncarcinogen NA =Not Available
losalams\B21-hk-awk3 Nov. '94

TABLEH-H SUMMARY OF HAZARD INDICES FUTURE HIKER SCENARIO (ADULTS) PIPE STORAGE YARD. BUILDING 21
Soil Dermal Inhalation TOTAL Percent Ingestion Contact of Dusts HAZARD Contribution
COPCs INDEX
Sam !volatiles Benzo(a)anthrecene NA NA NA NA ERR Benzo(a)pyrene NA NA NA NA ERR Benzo(b)ftuoranthene NA NA NA NA ERR Benzo(g,h,ijperylene NA NA NA NA ERR Benzo(k)fluoranthene NA NA NA NA ERR Chrysene NA NA NA NA ERR Dibenzo(a,h) anthracene NA NA NA NA ERR lndeno(1 ,2,3 -cd)pyrene NA NA NA NA ERR
HAZARD INDEX OE+OO OE+OO OE+OO OE+OO ERR
Percent Contribution ERR ERR ERR ERR
COPCs = Chemicals of potential concern NA = Not Available
losalams\B21-hk-awk3 Nov. '94

TABLEC-C STATISTICAL SUMMARY OF SOIL DATA PIPE STORAGE YARD, BUILDING 21 LANL, LOS ALAMOS, NEW MEXICO
COPCs FOD
Semlvolatiles Benzo(a)anthracene 5/26 Benzo(a)pyrene 6/26 Benzo(b)fluoranthene 6/26 Benzo(g,h,Qperylene 4/26 Benzo(k)fluoranthene 6/26 Chrysene 6/26 Dlbenzo(a,h) anthracene 1/26 lndeno(1,2,3-cd)pyrene 5/26
COPCs = Chemicals of potential concern FOD = Frequency of detection Cone. = Concentration UCL = Upper confidence limit Max. = Maximum detected concentration All concentrations are in units of mg/kg.
losalams\B21-cn-w.wk3
Minimum Detected
Cone.
< 0.33 < 0.33 < 0.33 < 0.33 < 0.33 < 0.33 < 0.33 < 0.33
Maximum Arithmetic Lesser of Detected Mean 85% UCL Max. or
Cone. 95% UCL
26.9 0.625 0.976 0.976 28.8 0.708 1.118 1.118 28.4 0.659 1.029 1.029 12.6 0.407 0.586 0.586 21.4 0.651 1.009 1.009 29.2 0.721 1.141 1.141 4.7 0.260 0.340 0.340
14.3 0.438 0.637 0.637
Nov. '94

r TABLEI-1 CARCINOGENIC RISKS FROM SOIL INGESnON CONSTRUCTION WORKER SCENARIO (ADULTS) PIPE STORAGE YARD, BUILDING 21
AME Adult OraiCSF COPCa EPC (Ca) LADD (mg/kg/day) _,
fm~g} fma/kg£d!Y]
Semlvolatilea Benzo(a)anthracene 1.76E-01 2.36E-08 Benzo(a)PYfM'• 1.12E+OO 2.70E-08 Benzo(b)fluoran1hene 1.0SE+OO 2.48E-08 Benzo(g,h.l)parylane 5.86E-01 1.42E-08 Benzo(k)fluoranthene 1.01E+OO 2.44E-08 Chryaene 1.14E+OO 2.76E-08 Dlbenzo(a,h) anthracene 3.40E-01 8.21E-09 lndeno(1 ,2,3-cd)pyrene 6.37E-01 1.54E-08
TOTAL RISK
COPCs = Chemicals of potential concern RME EPC • Reasonable Maximum Exposure Exposure Point Concentration in soil LADD = Lifetime Avera e Dai Dose "' Cs x LADD Factor Soil In estion Intake Rate LADD Factor = 2.42E-08
CSF = Carcinogenic Slope Factor NC = Noncarcinogen NA = Not Applicable
- losalams\B21-cn-w.wk3
7.30E-01 7.30E+OO 7.30E-01
NC 7.30E-02 7.30E-03 7.30E+OO 7.30E-01
Adult Cancer
Risk
1.7E-08 2.0E-07 1.8E-08 NC
1.8E-09 2.0E-10 I.OE-08 1.1E-08
3.1E-07
Nov. '94 -
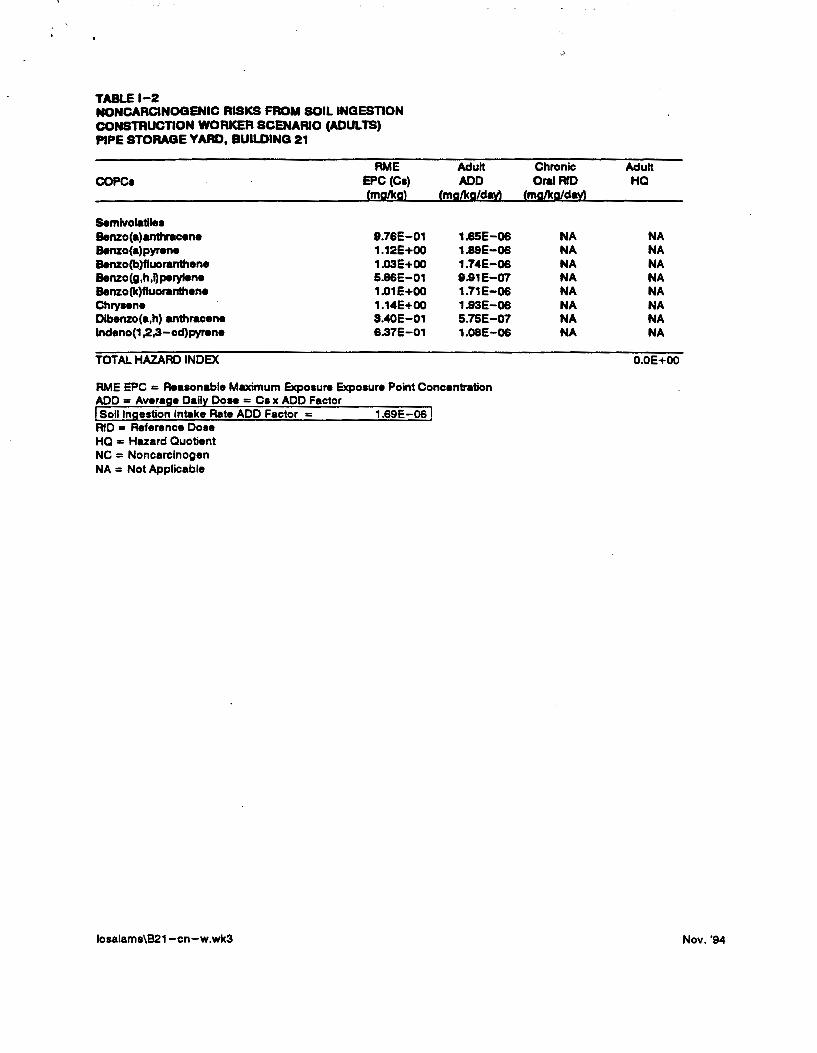
TABLEI-2 NONCARCINOGENIC RISKS FROM SOIL INGESTION CONSTRUCTION WORKER SCENARIO (ADULTS) PIPE STORAGE YARD, BUILDING 21
RME COPCa EPC (Ca)
(mg/kg}
S.mlvolatilea Benzo(a)anthracene 8.76E-01 Benzo(a)pyrene 1.12E+OO Benzo(b)fluoranthene 1.03E+OO Benzo(g,h,l)perylene 5.86E-01 Benzo(k)fluoranthene 1.01E+OO Chrysene 1.14E+OO Olbenzo(a,h) anthracene 3.40E-01 lndeno{1 ,2,3-cd)pyrene 6.37E-01
TOTAL HAZARD INDEX
1.69E-06
losalams\B21-cn-w.wk3
Adult Chronic Adult ADD Oral RfD HQ
(mg{!sg/dav\ (mgl!sa/d!X)
1.65E-06 NA NA 1.89E-06 NA NA 1.74E-06 NA NA 8.91E-07 NA NA 1.71E-06 NA NA 1.93E-06 NA NA 5.75E-07 NA NA 1.08E-06 NA NA
O.OE+OO
Nov. '94
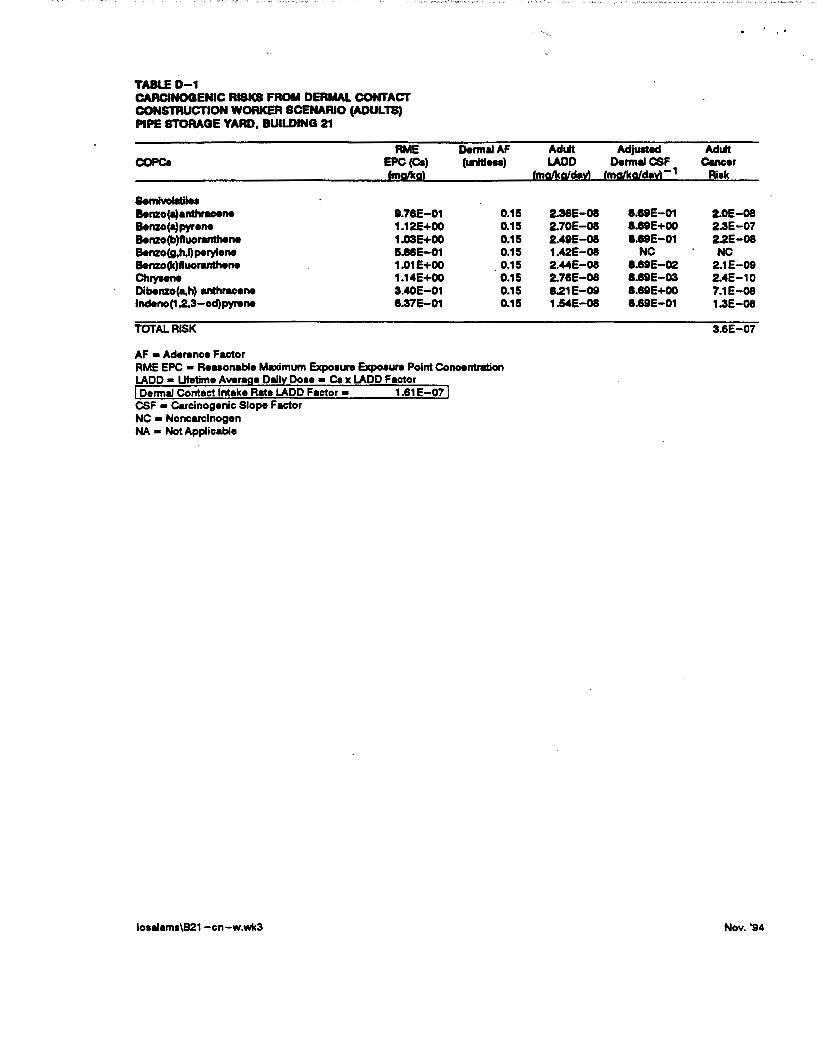
TABLED-1 CARCINOGENIC RISKS FROM DERMAL CONTACT CONSTRUCTION WORKER SCENARIO (ADULTS) PIPE STORAGE YARD, BUILDING 21
RME COPe. EPC (Ca)
(mal!! g)
S.rniw181ilea Banzo(a)anthracane 1.76E-01 Banzo(a)pyrene 1.12E+OO Banzo(b)tluoranthane 1.G3E+OO Banzo(g,h,l)parylena 5.88E-01 Banzo(k)11uoranthane 1.01E+OO Chryune 1.14E+OO Oibanzo(a,h) anthracene 3.40E-01 lndeno(1 ,2,3-cd)pyNna &.37E-01
TOTAL RISK
AF • Aderence Factor
DermaiAF (unltl ... )
0.1!5 0.1!5 0.1!5 0.1!5 0.15 0.15 0.1!5 0.1!5
RME EPC - Reuonable Maximum Expoaure Expoaure Point Concel"'t..tion LADD • Ufetime Avera e Oall Doae • C. x LADD Factor Dermal Contact Intake Rate LADD Factor • 1.61 E-07
CSF • Carcinogenic Slope Factor NC • Noncarcinogen NA • Not Applicable
loaalama\821 -cn-w.wk3
'.
Adult Adjuated Adult LADD DermaiCSF Cencer
fmal!!Silda~ (mal!\glda~ _, Aiak
2.36E-08 e.aE-o1 Z.OE-08 2.70E-08 l.e9E+OO UE-07 2.41E-08 1.89E-01 2.2E-08 1.42E-08 NC NC 2.44E-08 1.69E-02 2.1E.:..09 2.76E-08 1.19E-03 2.4E-10 1.21E-08 1.69E+OO 7.1E-08 1.54E-08 I.UE-01 UE-08
3.6E-07
Nov. '94
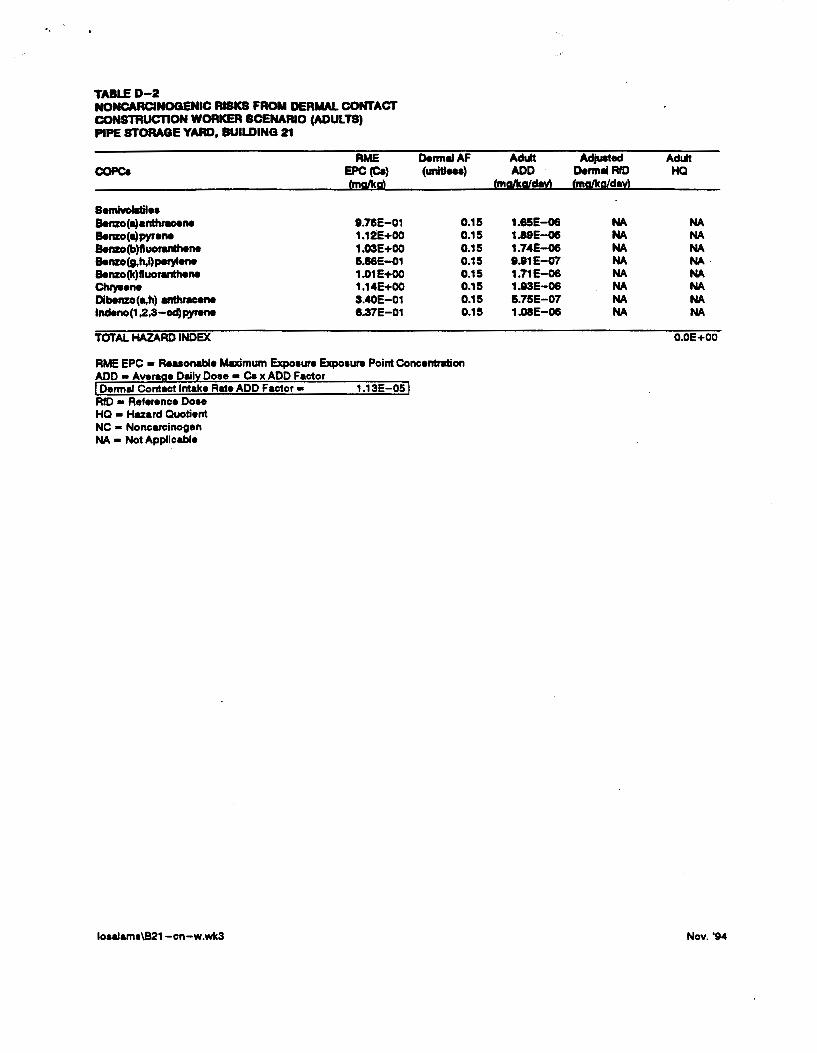
.,
TABLED-2 NONCARCINOGENIC RISKS FROM DERMAL CONTACT CONSTRUCTION WORKER SCENARIO (ADULTS) PIPE STORAGE YARD, BUILDING 21
COPe.
Semhlolatllea Benzo(a)anttnoene Benzo(a)pyrane Benzo(b)fluoranthene Benzo(g,h,l)perylene Benzo(k)fluoranthene Chry.ene Dibenzo(a,h) anthracene lndeno(1 ,2,3-oc:l)pyrene
TOTAl HAZARD INDEX
RID • Reference Doae HQ • Hazard Quotient NC • Noncarcinogen NA • Not Applicable
loa•arna\B21-cn-w.wk3
RME EPC (Ca) (malka>
8.76E-01 1.12E+OO 1.03E+OO 5.86E-01 1.01E+OO 1.14E+OO 3.40E-01 8.37E-01
1.13E-05
Denn•Af Adult Adjuated Adult (unltl ... ) ADD o.rm• RID HQ
(!!!afkA{day) (!!!aJkA{day)
0.15 1.85E-06 NA NA 0.15 1.19E-06 NA NA 0.15 1.74E-06 NA NA 0.15 8.81E-07 NA NA. 0.15 1.71E-06 NA NA 0.15 1.83E-06 NA NA 0.15 5.75E-07 NA NA 0.15 1.08E-06 NA NA
O.OE+OO
Nov. '94

TABLE DUST-1 CARCINOGENIC RISKS FROM DUST INHALAnON CONSTRUCTION WORKER SCENARIO (ADULTS) PIPE STORAGE YARD, BUILDING 21
RME COPCs EPC(Cp)
Cmgtma)
Semivolatlles Benzo(a)anttncene 1.46E-07 Benzo(a)pyrene 1.88E-07 Benzo(b}fluoranthene 1.54E-07 Benzo(g,h,l)perylene 8.79E-08 Benzo(k}fluoran1hene 1.51E-07 Chrysene 1.71E-07 Dlbenzo(a,h} anthracene 5.10E-08 lndeno(1 ,2,3-cd)pyrene 8.56E-08
TOTAL RISK
Adult LADD
CmQikg/day)
2.15E-10 2.46E-10 2.27E-10 1.29E-10 2.22E-10 2.51E-10 7.49E-11 1.40E-10
RME EPC = Reasonable Maximum Exposure Exposure Point Concentration LAOD = Lifetime Avera e Oail Dose = C x LADD Factor Inhalation Intake Rate LADD Factor = 1.47E-03
CSF = carcinogenic Slope Factor NC = Noncarcinogen NA = Not Applicable
losalams\821 -cn-w.wk3
Inhalation Adult CSF cancer
(mg/kgfday) ":"' 1 Risk
7.30E-01 1.6E-10 7.30E+00 1.8E-09 7.30E-01 1.7E-10
NC NC 7.30E-02 1.6E-11 7.30E-03 1.8E-12 7.30E+OO S.SE-10 7.30E-01 1.0E-10
2.8E-09
Nov. '94

TABLE DUST-2 NONCARCINOGENIC HAZARD INDICES FROM DUST INHALAnON CONSTRUCTION WORKER SCENARIO (ADULTS) PIPE STORAGE YARD, BUILDING 21
RME Adult COPCs EPC(Cp) ADD
Cmg/m1) (mg/kgldav>
Semivolatlles Benzo(a)anthracene 1.46E-07 1.51E-08 Benzo(a)pyrene 1.68E-07 1.72E-08 Benzo(b)fluoranthene 1.54E-07 1.59E-08 Benzo(g,h,l)perylene 8.79E-08 9.04E-09 Benzo(k)fluoran1hene 1.51E-07 1.56E-08 Chrysene 1.71E-07 1.76E-08 Dlbenzo(a,h) anthracene 5.10E-08 5.25E-09 lndeno(1 ,2,3-cd)pyrene 8.56E-08 8.83E-09
TOTAL HAZARD INDEX
RME EPC = Reasonable Maximum Exposure Exposure Point Concentration ADD = Avera e Dail Dose = C x ADD Factor Inhalation Intake Rate ADD Factor = 1.03E -01
RfD = Reference Dose HQ = Hazard Quotient NC = Noncarcinogen NA = Not Applicable
losalams\B21-cn-w.wk3
Inhalation Adult RfD HQ
(mg/kg/day)
NA NA NA NA NA NA NA NA NA NA NA NA NA NA NA NA
O.OE+OO
Nov. '94
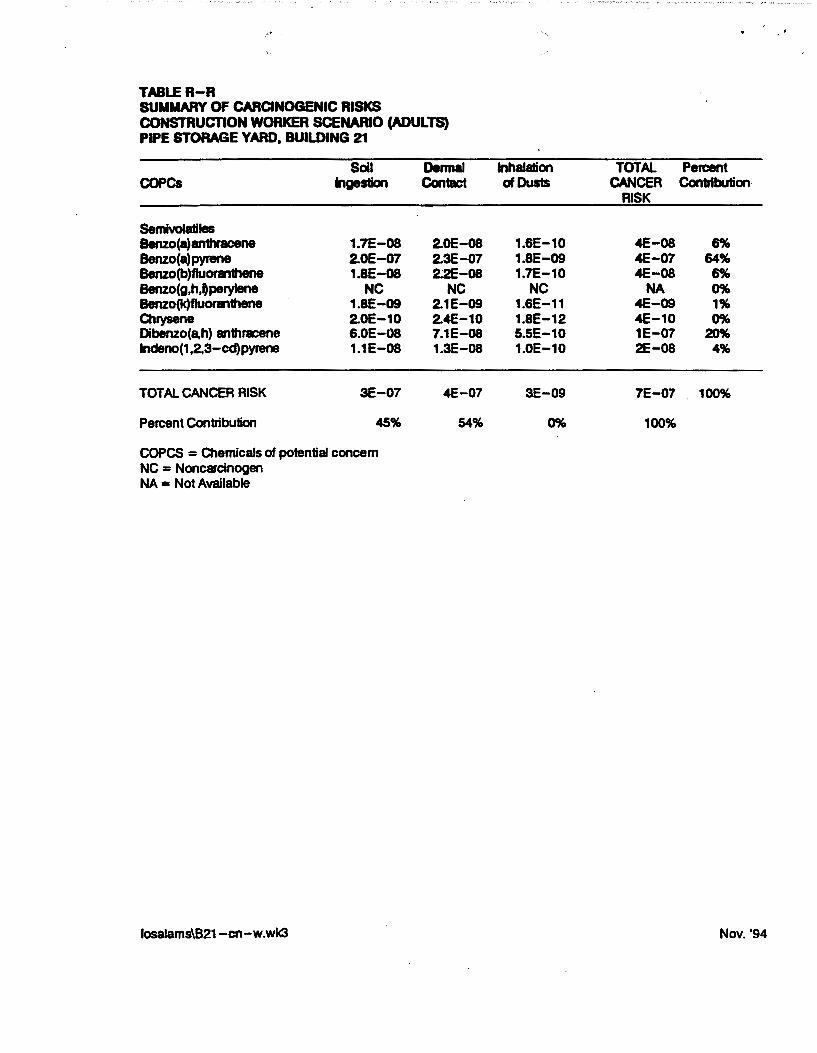
TABLER-R SUMMARY OF CARCINOGENIC RISKS CONSTRUCTION WORKER SCENARIO (ADULTS) PIPE STORAGE YARD, BUILDING 21
Soil Dermal Inhalation TOTAL Percent COPCs Ingestion Contact mDusts CANCER Contribution·
RISK
Semivolatiles Benzo(a)an1hracene 1.7E-08 2.0E-08 1.6E-10 4E-08 6% Benzo(a)pyrene 2.0E-07 2.3E-07 1.8E-09 4E-07 64% Benzo(b)fluora-rthene 1.8E-08 22E-08 1.7E-10 4E-08 6% Benzo(g,h,~~~ NC NC NC NA 0% Benzo(k)fluOI'II'Ithene 1.8E-09 2.1E-09 1.6E-11 4E-09 1% Olrysene 2.0E-10 2.4E-10 1.8E-12 4E-10 0% DibenZo(a,h) a"'thra:ene 6.0E-08 7.1E-08 5.5E-10 1E-07 20% lndeno(1 ,2,3-cd)pyrene 1.1E-08 1.3E-08 1.0E-10 2E-08 4%
TOTAL CANCER RISK 3E-07 4E-07 3E-09 7E-07 100%
Percent Contribution 45% 54% 0% 100%
COPCS = Olemicals of potential concern NC = Nonca-cinogen NA = Not Available
losalams\B21-cn-w.wk3 Nov. '94

TABLEE-E EXPOSURE PARAMETERS PIPE STORAGE YARD, BUILDING 21 LANL. LOS ~OS, NEW MEXICO
ExDosure Parameter Svmbol Inhalation Rate - indoor air IRa Inhalation Rate - outdoor air IRa Soli Ingestion Rate IGs Skin Surface Area ExDosed SA Soli-skin Adherence Factor SAF
:XOOsure Time ET :xoosure Freauencv EF Xpc)sure Duration ED
Fraction Ingested, Inhaled or Contacted from Site FlorFC
Conversion Factor CF BodvWeiaht BW Averaaina Time - Cancer ATe Averaain!l Time - NonCancer ATnc
Not calculated
Construction Worker
Units Adults Children rns/hr 3.65 NC rns/hr 3.65 NC
.mg[day 480 NC Crrt2/day 3200 NC 11'1Q/Crrt2 1 NC hr/day 8 NC da~ 90 NC
vear 1 NC
unltless 1 NC kQ/ma 1E-06 NC
kg 70 NC days 25550 NC days 365 NC
LADD/ADD = Lifetime Average Dally Dose/Average Dally Dose
Inhalation LADD Intake Rate Factors - outdoor air 1.47E-03 NC Inhalation ADD Intake Rate Factors- outdoor air 1.03E-01 NC Soil Ingestion LADD Intake Rate Factors 2.42E-08 NC Soil Ingestion ADD Intake Rate Factors 1.69E-06 NC Dermal Contact LADD Intake Rate Factors 1.61E-07 NC Dermal Contact ADD Intake Rate Factors 1 .13E-05 NC
losalams\821 -cn-w.wk3
References
IWP 1993 IWP 1993 EPA 1991 EPA,1992 Assumed IWP 1993 IWP 1993 IWP 1993
Assumed Conversion Factor
EPA 1991 365 davs/vear x 70 vears (lifetime) 365 davs/vear x ED
Nov. '94

J'·''· ..
TABLEH-H SUMMARY OF HAZARD INDICES CONSTRUCTION WORKER SCENARIO (ADULTS) PIPE STORAGE YARD, BUILDING 21
Sol Dermal Inhalation TOTAL Percent Ingestion Contact of Dusts HAZARD Contribution
COPCs INDEX
Semlvolatiles Benzo(a)anthracene NA NA NA NA ERR Benzo(a)pyrene NA NA NA NA ERR Benzo(b)fluoranthene NA NA NA NA ERR Benzo(g,h,Qperylene NA NA NA NA ERR Benzo(k)fluoranthene NA NA NA NA ERR Chrysene NA NA NA NA. ERR Dibenzo(a,h) anthracene NA NA NA NA ERR lndeno(1,2,3-cd)pyrene NA NA NA NA ERR
HAZARD INDEX OE+OO OE+OO OE+OO OE+OO ERR
Percent Contribution ERR ERR ERR ERR
COPCs = Chemicals of potential concern NA = Not Available
losalams\B21-cn-w.wk3 Nov. '94

TABLE C-C STATISTICAL SUMMARY OF SOIL DATA PIPE STORAGE YARD, BUILDING 21 LANL, LOS ALAMOS, NEW MEXICO
COPCs FOD
Semlvolatlles Benzo(a)anthracene 5/26 Benzo(a)pyrene 6/26 Benzo(b)fluoranthene 6/26 Benzo(g,h,l)perytene 4/26 Benzo(k)fluoranthene 6/26 Chrysene 6/26 Dibenzo(a,h) anthracene 1/26 lndeno(1 ,2,3-cd)pyrene 5/26
COPCs = Chemicals of potential concern FOD = Frequency of detection Cone. = Concentration UCL = Upper confidence limit Max. = Maximum detected concentration All concentrations are in units of mg/kg.
losalams\B21-It-w.wk3
Minimum Detected
Cone.
< 0.33 < 0.33 < 0.33 < 0.33 < 0.33 < 0.33 < 0.33 < 0.33
Maximum Arithmetic Lesser of Detected Mean 95%UCL Max. or
Cone. 95%UCL
26.9 0.625 0.976 0.976 28.8 0.708 1.118 1.118 28.4 0.659 1.029 1.029 12.6 0.407 0.586 0.586 21.4 0.651 1.009 1.009 29.2 0.721 1.141 1.141 4.7 0.260 0.340 0.340
14.3 0.438 0.637 0.637
Nov. '94

TABLEE-E EXPOSURE PARAMETERS PIPE STORAGE YARD, BUILDING 21 LANL. LOS ALAMOS, NEW MEXICO
ExPosure Parameter Svmbol Inhalation Rate - Indoor air IRa Inhalation Rate - outdoor air IRa Soil Ingestion Rate IGs Skin Surface Area Exposed SA SoH-skin Adherence Factor SAF ExPosure Time ET ExPosure Freauencv EF ExPosure Duration ED Fraction Ingested, Inhaled or
Contacted from Site Fl orFC Conversion Factor CF BogyWeiaht BW Averaging Time - Cancer ATe Averaging Time - NonCancer ATnc
Not calculated
LDng-Term Worker
Units Adults Children rf13/hr 0.83 NC rf13/hr 1.70 NC
rna/day 100 NC cfn2/dav NA NC ma/cmz 1 NC hr/dav 8 NC davs/vr 250 NC
vear 25 NC
unltless 1 NC kg[_mg 1E-06 NC
lgJ 70 NC days 25550 NC davs 9125 NC
LADD/ADD = Lifetime Average Dally Dose/Average Dally Dose
Inhalation LADD Intake Rate Factors - outdoor air 4.75E-02 NC Inhalation ADD Intake Rate Factors- outdoor air 1.33E-01 NC Soil Ingestion LADD Intake Rate Factors 3.49E-07 NC Soil Ingestion ADD Intake Rate Factors 9.78E-07 NC Dermal Contact LADD Intake Rate Factors O.OOE+OO NC Dermal Contact ADD Intake Rate Factors O.OOE+OO NC
losalams\B21-It-w.wk3
References
EPA 1991 IWP 1993 EPA 1991 EPA 1992 Assumed EPA 1992 EPA 1992 EPA 1992
Assumed Conversion Factor
EPA 1991 365 davs/vear x 70 vears Oifetime) 365 davs/vear x ED
Nov. '94
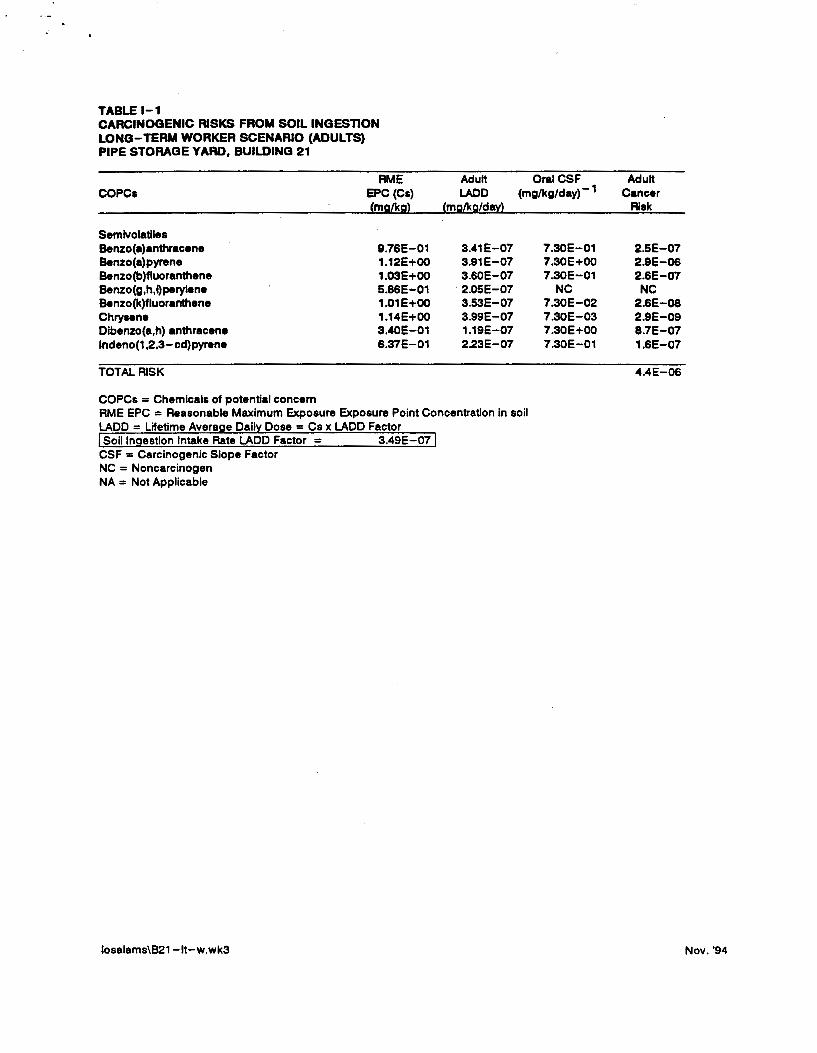
TABLEI-1 CARCINOGENIC RISKS FROM SOIL INGESTION LONG-TERM WORKER SCENARIO (ADULTS) PIPE STORAGE YARD, BUILDING 21
RME Adult Oral CSF COPCs EPC (Cs) LAOD (mg/kg/day) _,
{mg/kg} {mg/kg/davl
Semivolatiles Benzo(a)anthracene 9.76E-01 3.41E-07 Benzo(a)pyrene 1.12E+OO 3.91E-07 Benzo(b)fluoranthene 1.03E+OO 3.60E-07 Benzo(g,h.~perylene 5.86E-01 · 2.05E-07 Benzo(k)fluoranthene 1.01E+OO 3.53E-07 Chryaene 1.14E+OO 3.99E-07 Oibenzo(a,h) anthracene 3.4DE-D1 1.19E-07 lndeno(1 ,2,3-cd)pyrene 6.37E-01 2.23E-07
TOTAL RISK
COPCs = Chemicals of potential concern RME EPC = Reasonable Maximum Exposure Exposure Point Concentration in soil LADD = Lifetime Avera e Dail Dose = Cs x LADD Factor Soil In estion Intake Rate LADD Factor = 3.49E-07
CSF = Carcinogenic Slope Factor NC = Noncarcinogen NA = Not Applicable
losalams\B21-It-w.wk3
7.30E-01 7.30E+OO 7.30E-01
NC 7.30E-02 7.30E-03 7.30E+OO 7.30E-01
Adult Cancer
Risk
2.5E-07 2.9E-06 2.6E-07 NC
2.6E-08 2.9E-09 8.7E-07 1.6E-07
4.4E-06
Nov. '94

TABLEI-2 NONCARCINOGENIC RISKS FROM SOIL INGESTION LONG-TERM WORKER SCENARIO (ADULTS) PIPE STORAGE YARD, BUILDING 21
RME COPCa EPC (Ca)
(mg/kg}
Semlvolatllea Benzo(a)anttvacene 8.76E-01 Benzo(a)pyrene 1.12E+OO Benzo(b)fluoranthene 1.03E+OO Benzo(g,h.Operylene 5.86E-01 Benzo(k)fluoranthene _ 1.01E+OO Chryaene 1.14E+OO Dibenzo(a,h) anttlracene 3.40E-01 lndeno(1 ,2,3-cd)pyrene 6.37E-01
TOTAL HAZARD INDEX
9.7BE-07
losalams\B21-It-w.wk3
..
Adult Chronic Adult ADD Oral RfD HQ
(mg/kg/davl (mg/kg/davl
B.SSE-07 NA NA 1.09E-06 NA NA 1.01E-06 NA NA 5.73E-07 NA NA 8.87E-07 NA NA 1.12E-06 NA NA 3.33E-07 NA NA 6.23E-07 NA NA
O.OE+OO
Nov. '94
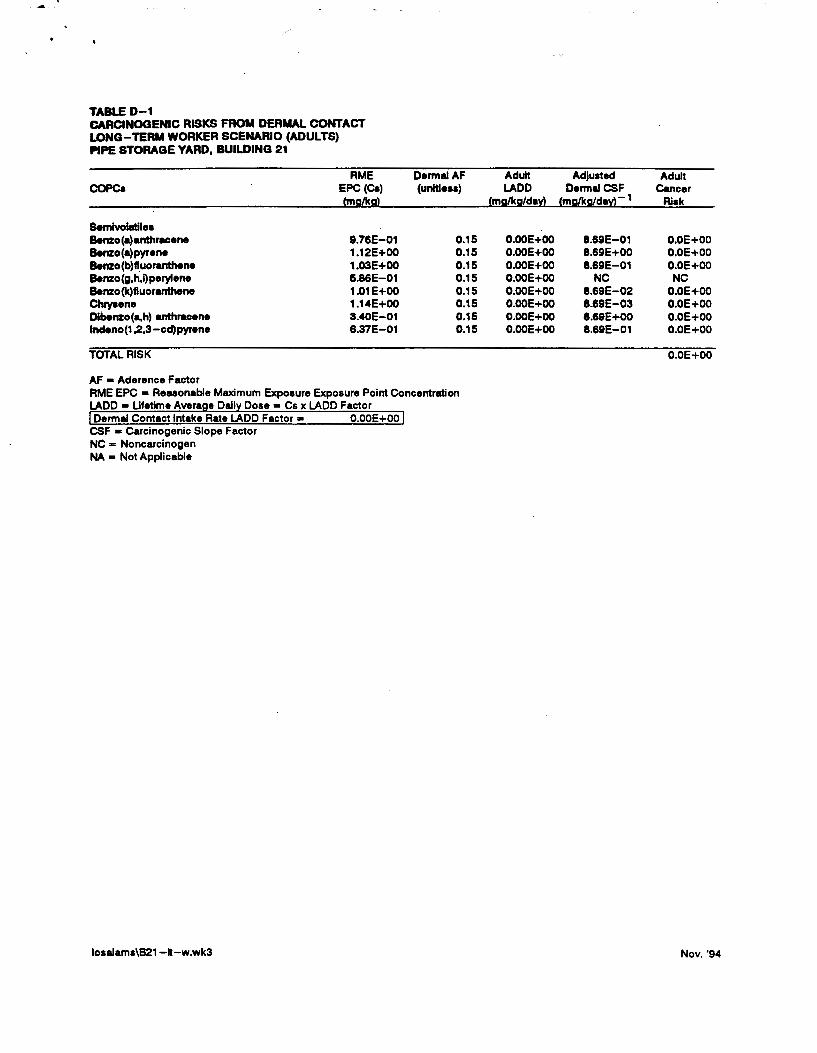
TABLED-1 CARCINOGENIC RISKS FROM DERMAL CONTACT LONG-TERM WORKER SCENARIO (ADULTS) PIPE STORAGE YARD, BUILDING 21
RtJIE COPe. EPC (Ca)
{mg/kg}
S.mivolatlles Benzo(a)anthracene 9.76E-01 Benzo(a)pyrene 1.12E+OO Benzo(b)ftuoranthene 1.03E+OO Benzo(g,h,i)perytene 5.86E-01 Benzo(k)ftuoranthene 1.01E+OO Chryaene 1.14E+OO Dlbenzo(a,h) anthracene 3.40E-01 lndeno(1 ,2,3-cd)pyrene 6.37E-01
TOTAL RISK
AF • Aderence Fac1or
Dermal AF (unitleaa)
0.15 0.15 0.15 0.15 0.15 0.15 0.15 0.15
RtJIE EPC • Reasonable Maximum Exposure Exposure Point Concentration LADD .,. Ufetime Avera e Dail Dose • Cs x LADD Factor Dermal Contac11ntake Rate L.ADD Factor = O.OOE+OO
CSF • Carcinogenic Slope Factor NC "" Noncarcinogen NA • Not Applicable
losalams\B21-ft-w.wk3
Adult Adjusted Adult LADD Dermal CSF Cancer
fmBl!!g/da~ {ma/kg£da~}- 1 Risk
O.OOE+OO 8.69E-01 O.OE+OO O.OOE+OO 8.69E+OO O.OE+OO O.OOE+OO 8.69E-01 O.OE+OO O.OOE+OO NC NC O.OOE+OO 8.69E-02 O.OE+OO O.OOE+OO 8.69E-03 O.OE+OO O.OOE+OO 8.69E+OO O.OE+OO O.OOE+OO 8.69E-01 O.OE+OO
O.OE+OO
Nov. '94

TABLED-2 NONCARCINOGENIC RISKS FROM DERMAL CONTACT LONG-TERM WORKER SCENARIO (ADULTS) PIPE STORAGE YARD, BUILDING 21
COPCa
S.miwlatilea Benzo(a)a~ne Benzo(a)pyrene Benzo(b)luoranthene Benzo(g,h.i)perylene Benzo(k)tluoranthene Chryaene Dlbenzo(a.h) anthracene lndeno(1 ,2.3-cd)pyrene
TOTAL HAZARD INDEX
NC • Noncarcinogen NA • Not Applicable
loaalams\B21-It-w.wk3
RME EPC (Ca) (mal!! a}
1.76E-01 1.12E+OO 1.03E+OO 5.86E-01 1.01E+OO 1.14E+OO a.40E-o1 6.37E-01
O.OOE+OO
O.rm81AF Adult Adjusted Adult (unltle .. ) ADD O.rm81 RfD HQ
(mal!!Silda~ (mal!!Sild•~
0.15 O.OOE+OO NA NA 0.15 O.OOE+OO NA NA 0.15 O.OOE+OO NA NA 0.15 O.OOE+OO NA NA. 0.15 O.OOE+OO NA NA 0.15 O.OOE+OO NA NA 0.15 O.OOE+OO NA NA 0.15 O.OOE+OO NA NA
O.OE+OO
Nov. '94
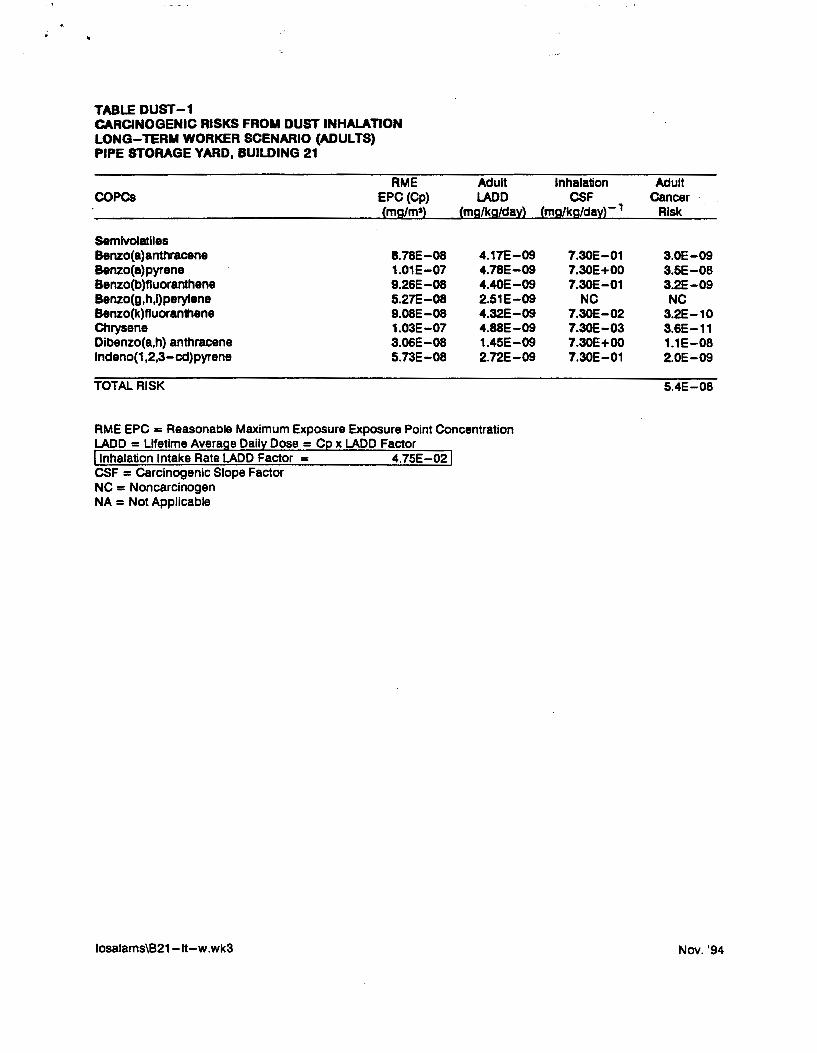
TABLE DUST-1 CARCINOGENIC RISKS FROM DUST INH~TION LONG-TERM WORKER SCENARIO (ADULTS) PIPE STORAGE YARD, BUILDING 21
RME COPCs EPC (Cp)
{mg/m'}
Semivolatiles Benzo(a)anthracene 8.78E-08 Benzo(a)pyrene 1.01E-07 Benzo(b)fluoranthene 9.26E-08 Benzo(g,h,l)perylene 5.27E-08 Benzo(k)fluoran1hene 9.08E-08 Chrysene 1.03E-07 Dibenzo(a,h) anthracene 3.06E-08 tndeno(1 ,2,3-cd)pyrene 5.73E-08
TOTAL RISK
Adult LADD
{mg/kg/da~}
4.17E-09 4.78E-09 4.40E-09 2.51E-09 4.32E-09 4.88E-09 1.45E-09 2.72E-09
RME EPC = Reasonable Maximum Exposure Exposure Point Concentration LADD = Lifetime Avera e Dail Dose = C x LADD Factor Inhalation Intake Rate LADD Factor = 4.75E-02
CSF = carcinogenic Slope Factor NC = Noncarcinogen NA = Not Applicable
losalams\B21-lt-w.wk3
Inhalation Adult CSF Cancer
{mg/kg/da~}-1 Risk
7.30E-01 3.0E-09 7.30E+00 3.5E-08 7.30E-01 3.2E-09
NC NC 7.30E-02 3.2E-10 7.30E-03 3.6E-11 7.30E+OO 1.1E-08 7.30E-01 2.0E-09
5.4E-08
Nov. '94

TABLE DUST -2 NONCARCINOGENIC HAZARD INDICES FROM DUST INHALATION LONG-TERM WORKER SCENARIO (ADULTS) PIPE STORAGE YARD, BUILDING 21
RME Adult COPCs EPC(Cp) ADO
(mgtm') (mgtkgtday)
Semlvolatlles Benzo(a)anthracene 8.78E-08 1.17E-08 Benzo(a)pyrene 1.01E-07 1.34E-08 Benzo(b)fluoranthene 9.26E-08 1.23E-08 Benzo(g,h,Qperylene 5.27E-08 7.02E-09 Benzo(k)fluoran1hene 9.08E-08 1.21E-08 Chrysene 1.03E-07 1.37E-08 Olbenzo(a,h) anthracene 3.06E-08 4.07E-09 lndeno(1 ,2,3-cd)pyrene 5.73E-08 7.63E-09
TOTAL HAZARD INDEX
RME EPC = Reasonable Maximum Exposure Exposure Point Concentration ADO = Avera e Oail Dose = C x ADO Factor Inhalation Intake Rate ADD Factor= 1.33E-01
RfD = Reference Dose HQ = Hazard Quotient NC = Noncarcinogen NA =Not Applicable
losalams\B21-It-w.wk3
Inhalation Adult RfO HQ
(mgtkg/day)
NA NA NA NA NA NA NA NA NA NA NA NA NA NA NA NA
O.OE+OO
Nov. '94

TABLER-R SUMMARY OF CARCINOGENIC RISKS LONG-TERM WORKER SCENARIO (ADULTS) PIPE STORAGE YARD, BUILDING 21
Soil Dermal Inhalation TOTAL Percent COPCs Ingestion Contact. of Dusts CANCER Contribution
RISK
Semivolatiles Benzo(a)anthracene 2.5E-07 O.OE+OO 3.0E-09 3E-07 6% Benzo(a)pyrene 2.9E-06 O.OE+OO 3.5E-08 3E-06 64% Benzo(b)fluorsn1hene 2.6E-07 O.OE+OO 3.2E-09 3E-07 6% Benzo(g,h.~perylene NC NC NC NA 0% Benzo(k)fluor1111hene 2.6E-08 O.OE+OO 3.2E-10 3E-08 1% Chrysene 2.9E-09 O.OE+OO 3.6E-11 3E-09 0% Dibenzo(a,h) an1hracene 8.7E-07 O.OE+OO 1.1E-08 9E-07 20% lndeno(1 ,2,3-cd)pyrene 1.6E-07 O.OE+OO 2.0E-09 2E-07 4%
TOTAL CANCER RISK 4E-06 OE+OO SE-08 4E-06 100%
Percent Contribution 99% 0% 1% 100%
COPCS = Chemicals of potential concern NC = Noncarcinogen NA = Not Available
losalams\B21-It-w.wk3 Nov. '94

.•
TABLE H-H SUMMARY OF HAZARD INDICES LONG-TERM WORKER SCENARIO (ADULTS) PIPE STORAGE YARD, BUILDING 21
SoU Dermal Inhalation TOTAL Percent Ingestion Contact of Dusts HAZARD Contribution
COPCs INDEX
Semivolatiles Benzo(a)anthracene NA NA NA NA ERR Benzo(a)pyrene NA NA NA NA ERR Benzo(b)fluoranthene NA NA NA NA ERR Benzo(g,h,ijperylene NA NA NA NA ERR Benzo(k)fluoranthene NA NA NA NA ERR Chrysene NA NA NA NA ERR Dibenzo(a,h) anthracene NA NA NA NA ERR lndeno(1 ,2,3 -cd) pyrene NA NA NA NA ERR
HAZARD INDEX OE+OO OE+OO OE+OO OE+OO ERR
Percent Contribution ERR ERR ERR ERR
COPCs = Chemicals of potential concern NA = Not Available
losalams\821-lt-w.wk3 Nov. '94
Attachment 6-4
Bradley et al., 1994. Background level of Polycyclic Aromatic Hydrocarbons
(PAH) and Selected Metals In New England Urban Soils
TA-33 May 23,1995

Background Levels of Polycyclic Aromatic Hydrocarbons (PAH) and Selected Metals In New England Urban Soils
L J. N. Bradley,'" B. H. Magee,z and 5. L Allen' 'ENSR Consuldng and~. 35 Nagog Ptlrk, k1Dn. MA 0172D -ogden Em!ltOnmental and Energy SeMt:es. Z39 UtlJ#IDn Road. SUite 7C, Wesrt~ MA 01886
ABS'l'Jl.\CT: Polycyclic :uommc bydroartloas (PAH) IllS byproduc:u of combustion aad an: ubiquitous iD tbe urban cnvDaomcut. Tbcy are also ~ io indUSI:rial c:bemial "WaSU:S. such as coal car. petto1eam refinery sludges. waste ails and fuels. ami wocd·t:n:ating =iducs. Thus. P .4Jis are chemicals of c:oocc:m at many waste sites. Risk as.sessmeat methods will yield riskhued cle:unqJ l~els for P AHs that raage from 0.1 to 0. 7 mg./kg. Given tbcir universal presenc:e in the urban environmenc, it is im:portam to c:ompare rlsk·based c:lCillup levels With typical urban bactg!DUDd levels before utilizing I.IJ'R.alistic: low c:lC311up targets. However.liUle c!ata Clci.st
. 011 P AH levels in a:rban. DOnindu.sttial aoils.ln this smdy, 60 Rmples of sumcw soils from uzbaD loc:adoos in tbrcc New &glaDd cities 'h3 aoal)'2Cd for P AH ·compounds. 1D addition. all amplcs we= aalyzed for mra1 parolcum bydmcalbons ('IPH) and seven meWs. The upper 95'1. coa.Adence in.rerval oa lbe meao was 3 mgtkg . for benzo(a)pyrene tDXic: equivalc:nt.s, 12 mglkg for total poa:ntially carc:inogenic P AH. md 2S mglkg for total P AH. 'Ihc upper 95111 coafideacc iD=vaJ wu m mglkg for TPH. which exceeds me mget level of 100 mglk: used by many swe ~ aseocies. Metal eooceaaatiotJS wa: similar to publisbed bacqroDDd Jevela for an meuls except lead. TbG upp:r 95'1> c:on:fidc:nc:c intl:rYal !or lead was 737 mglkg in .BOSlOD., 463 mg,'tg in Providence. lln4 378 mglkg in Springfield.
KEY WORDS: backg:rouod, PAH, metals, urban. anthropogemc.. soil
I. INTRODUC"nON
Polycyclic aromatic hydrocarbons (P AHs) are byproduc:ts of combustion and are naturally occmrlng chemicals in the environment. Forest fires and volcanoes are major uannl sources of P AHs. but there are anthropogenic somces as well due to burning of fossil fuels, including amomobile and industrial emissions. P AHs are chemicals of concern in many waste site investigations that are tmdertaken pursuant to the Comprehensive Environmental Response, Compensation. oind Liability Ac:t (CERCLA), me Resource Conservation and Recovery Act (R.CRA). and state 1 058·8337 /9415.50 c 1994 by AEHS
349
hazardous waste programs. Risk assessments performed according to federal guidlllce for former mamrfactmed gas plant lites. wood treating faciljri~, petroleum mmcrics. and other sires a=erallY conclude that P AHs pose umcasonahlc risks to human health and that remedial acUODS must be tabu. 10 reclucc risks to acceptable levels. The majority ofthe.risk p:»secl by PAHs is pcrally due to benzo(a)pyrenc and the other P AHs dllt have been shown to cause cancc:r in laboratmy animals afrl:r repeaed closings. The U.S. EPA (1993a) cmreotly Identifies seven P AHs as "probable human (Bl) carcinopns": benzo(a)pyrene, · benzo(a)anthracene, bcmzo(b )tluor.mthe:De, bemo(k)fluaranthe~ c:hrysene. d.ibenz(a.h)anrhracene. and indeno(l~
Because of the very health-protective assumptions used in regolalory risk as-sessments, very lo111 risk-based clean.up levels for PAHs are derived for such sites. In Michigan. residential soil cleannp levels of 0.33 m&IJcg for each carcinogenic PAH have been set (MDNR,1993). In New 1c:rsey, proposed :residential soil cleanup levels are 0.66 mg/kg forbc:azo(tZ)pyr=e (New Jersey R4gister, 1992). The use of standard CERCLA risk assessment guidance (U.S. EP~ 1993b) results in the dmivarion of a risk-based c1camJp level for benzo(a)pyrcne of 0.1 mglkg.
All of these risk-based soil cleanup levels are below the urban. nonindustrial background soil concentrations preseml.y reported in the litera~. However, the availability of such dara is very limited. Blumer (1961) reports that benzo(a)pyrcne concentrations in Cape Cod, MA. soils range from 0.04 to 1.3 mg/kg. Menzie et al. (1992) repon that urban backgrotmd soil levels of total carcinogenic PAH range from 0.06 to 5.8 mg/kg. B~er et al. (1984) repon that tcral PAH levels in soils alongside roadways in England range from 4 to 20 mglkg, and potentially carcinogenic P AH range from 0.8 to 11.5 mg/kg. Bl11mer et al. (1977) report that total P AH levels in soils in a Swiss tovm. range from 6 to 300 mg./kg.
It is very difficult to compare the data from these smdies to the results of site risk assessments due to the limited da!asct and the nonuniformity of the PAH compounds evaluated. Clearly. more data arc required from nonindustrial urban locations to define the urban background level for P AH and to ·critically evaluate the role of risk assessment in setting remedial goals for P AH in soils. Accordingly, we have collected 60 samples of surlicial soils from urban locations in three New England cities and analyzed them for alll7 P AH compounds present on the EPA's Target Compound List, which is used in the· Superfund program. In addition, all samples were analyzed for total petroleum hydrocarbons (TPH) and for seven metals: arsenic, barium, cadmium. chromium. lead, mercury. and selenium.
II. METHODS
A. Sample Collection
Samples of surficial soils from urban locations in three New England cities were collected: Boston. MA; Providence. Rl: and Springfield, MA. Twenty independent
350

• . •
samples and duplicates of two samples were collecwl in each city. The samples were collec"'.ed on July 21, 2l.ancl23.1992. respectively. The samples were taken at a depth of 0 to 6 in. in areas c:cmsid=ed to be not directly affc=d by industrial sires. Genc:tally, lbc localions were alon& toads and sidewalks. and ~ parks and open lots. Each location was characterized in writing, including a soil description, and photographically documented. The samples were collected following standard environmental sampling protocols (U.S. EPA. 1986).
B. Sample Analysis
Chemical analysis of the samples was perfonncd by AnalytiKEM, Inc. (Chmy Hill. NJ). The samples were analyzed by GC-MS for the 17 P AH compounds present on the E.P A ·s Target Compound List using the methods required by EPA Method 8270 for the analysis of semivolatile compounds. In addition. the samples were analyzed for the eight RCRA ~ total petroleum hydzocatbons (TPH; EPA Method 418.1), and total solids. The complete ci.nalyte list is given in Table 1.
C. Data Validation
V alidarlon of the data received from AnalytiKEM was petformed according to U.S. EPA (1991) guidelines. The data were reviewed for completeness, holding times, GC-MS tuning and system petfcmnancc, initial and continuing cah'brations. laboratory method blank analysis, stmogate recoveries, matrix spike and matrix spike duplicate analysis. field duplication precision. and compound quanlitation and detection limits.
D. Data Analysis
The analytical data were summarized in accordance with U.S. EPA (1989) risk assessment guidance. If a compound was der.ected at lc:asr once in surface s~il. one half the sample quantitati.on limit (SQL} was used as a proxy c:onccnttation for all samples reported as "below detection limit" in the estimation of cxposu.rc point concentrations. However, if a compound was not detec:t=d in any sample, that compound was omitted from further consideration. In addition, when a proxy coacentration (i.e., one half the detection limit) was ~r than the highest actual deteCted value for a compound in any sample, th.al concemration was considered to be an aben'ation and was omitted from the database. This is consistent with U.S. EPA (1989) pdancc, which recognizes that high sample qwmtiwion limits can lead to unrcalistic concentration estimates.
351

·.·..-.. ·-
TABLE 1 Chemical Analyses of. Urban SoDs
s.miwlmla Orpoics. EPA Tarzu Compuaad List
Naplvb•Jene A=a:apCdlyl=e keaapbl:heac F1uamle Phcacdnoc ~ 'F1uoraDibe.oe Pyft:De Barzo(e~)lmhncme
Clr)'3SDC Beazo(h)fluanmcbeae Beuo(k)flDoraDtbc:ne BeiiZo(tr)pyl=e IDdeDo(l,2,3<d)pyreue Dibeam(4Z.h)audu¥ene Bcmo(g,h,i)pcylcne 2-Methylnapbthalene
Azsemc, !Dial
Barium, taral Cadmi'IIIJ'I. tDcal Clromiam. toial Lead. r.otal MeraJry' rora1 Selezdnm, foCal Silver, 1:DCal
Total petn~leum bydnx:uboos Solids
. :
A slightly different method of analysis was ·used to evaluaie P AH. Because P AH are genenlly found m·groups, it was conservatively assumed that if one PAH was detected in a sample. other compounds in that class might also be present in that sample:. lhc:refon:, if one P AH was detected in a sample. all undetected P AH wc:rc: assigned a proxy concentration equal to one half the SQL. It a sample had no detected P AH. no P AH were assumed to be: present in the sample:. and a cOIJcentralion of zero was used for all nondctects.
Summary statistics {minimum, maximum, arithmetic mean, upper 95% confidence limit on the arithmetic mean. and frequency of detection) were generated for each compound for each city and for all three cities combined.
352

•
•
The data for PAH were summarized in several different ways. Of the 17 P AH aaalyzed in each sample. seven are considered to be probable human carcinogens (Group B2) by the U.S. EPA (1993a).lbe U.S. EPA bas derived a cancer slope factor, which is a measure of the cardnogenic: potency of a compoDDd, only for beuzo(ll}pyrene (B(a)P) (U.S. EPA, 1993a). R.eview of the 1iteratare indicates that not all P AH are equally potent with respect to tumor induction. Several researchers have proposed toxic equivalency schemes that mate the tumorigenic potency of each PAH to that of B(a)P aCF..cJement Associam, 1988; Woo. 1989). B(a)P toxic equivalency factors (B(a)P-T.EFs) can be used to adjust either the B(a)P dose-response value to provide a compound-specific dose-response value, or the concentration of each P AH in a sample to be expressed in tetms of B(a)P toxic equivalents (B(a)P-TE). The latter method was used here. B(a)P-TE were c:alculan:d using the B(a)P toxic equivalency factors recommended for usc by the U.S. EPA (1993c}, as shown in Table 2. For each sample, P AH concentrations were reported for each of the 17 PAH on the analyte list. for total PAH (tPAH). far total carcinogenic PAH (cP AH). and for B(a)P-TE. and these values were used to generate the summary statistics for each group of samples.
Ill. RESULTS
Analysis of the laboratory results for the P AH indicales that quality control criteria were acceptable. The clara were analyzed to determine if any statistically si&nificam differences existed between the datasets for the tblcc cities. A Hartley test for homogeneity of variances (Mendenhall, 1979) and a one-factor analysis of variance to t=st for equality of the means (Mendenhall. 1979) indica~ no statistically significant differences. The results indicate that the P AH data can be pooled and treated as one dataset for farther statistical analyses.
TABLE 2 Benzo(a)Pyrene Toxic Equivalent Factors (BAP-TEF)
Compound
Beozo(l3)pyxcne Bcuz(411)a:ntbraceae Beazo(b)flucnmhcne Be!lzo(k)fluonmtbca~ CbryseDa Diblmzo(ca.h)aQtbrac:cDe mdeuo(l~
353
EPATEF
1.0 0.1 0.1 0.1 0.001 1.0 0.1
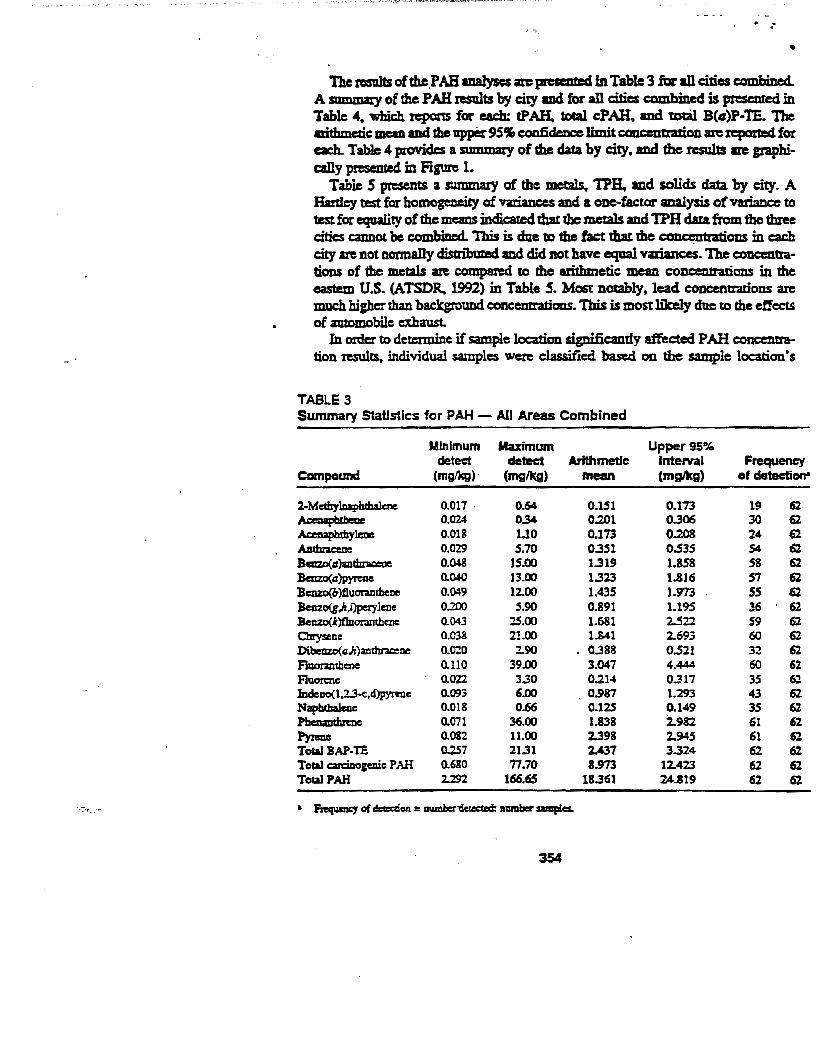
·.· .. ·-
•
The 1'CS1Jlis of tbe.P AH analyses are preseated in Table 3 far an ci1ies combined. A mmmary of the P AH results by city and for an cities combined is presemed in Table 4. which repous for each: tPAH. total cPAH. mel tD13l B(ll)P-IE. The llrithmetic mcan ad the upper 95 .. coo.tideDce limit CCJDCeDD:'ation are n:poite4 for each. Table 4 povid.es a summary of lhc data by city. 8%ld the resul!s are graphicaDy presented in Figure l.
Table 5 presents a summary of the metals. 'IPH, and solids data by city. A Hartley test fer homogeneity of vatianc:es ancl a one-factor analysis of variance to test for equality of the means indicarecl that the metals and TPH clar.a from the three cities cannot be combiDcd. This is due to the fact that the ~om in each city are not normally distribared and ctid not have equal variances. The CODccntrati.ons of the metals ~ comparccl to the arithmetic mean concemratians in the eastern U.S. (ATSDR. 1992) in Table 5. MOSt n01ably. lead concentrations are much higher than background concentrations. Tbis is most likely due to the effects of automobile exhaust.
In order to determine if sample 1oca.tion significantly affec:ted P AH concentration results, individual samples were classified based on the sample location's
TABLE 3 Summary Statistics for PAH- All Areas Combined
Minimum Maximum Upper95% detect de tact Arithmetic Interval Frequency
Cam pound (mglkg)· (mgllcg) mean (mglkg) of de1ection"
2-Mcthy'lrlaphdWcne 0.017 . 0.64 0.151 0.173 19 62 ~ 0.024 0..34 0.201 0.306 30 62 Acet:lapbtbyl=e 0.018 1.10 0.173 0.208 24 62 ADduacene 0.029 5.10 0.351 0.535 S4 62 Beazo(ajau~ 0.048 15.00 1.319 1.858 58 62 Balzo(a)pyteae 0.040 13.00 1.323 1.816 S7 62 Bcnzo(b).fluoraDthelle 0.049 12.00 1.435 1.973 ss 62 Beclzo(g ,}t,J')perylene 0.200 .5.90 0.891 1.19.S 36 62 :Berlzo(k)flnor.unhenc 0.043 25.00 1-681 2..522 59 62 Cbrysene 0.038 21.00 1..841 2.693 60 62 Dibeaz.o(Q,h)anthrao:lle 0.0:0 2..90 0.388 0.521 32 62 flaanlntbene 0.110 39.00 3.047 4.444 60 62 Fluc:m:nc: 0.022 3.30 0.214 0~17 35 62 lndeDO(l.2.3·c,d)pymlc 0.093 6.00 0.987 1.293 43 62 Napbthalcac 0.018 0.66 0.125 0.149 35 62 PhenaDthn:Dc 0.071 36.00 1.838 2.982 61 C!i:Z Pyn= O.OS2 11.00 2.398 2.945 61 62 Total BAP·'IE 0.257 21.31 2.437 3.324 62 62 Tocal arciuogenic P AH 0.680 71.70 8.973 12.423 62 62 TotalPAH 2...292 166.65 18.361 24..819 62 62
• Fftquency of c!=aian = aumber'del&dld: namb!:r samples.
354
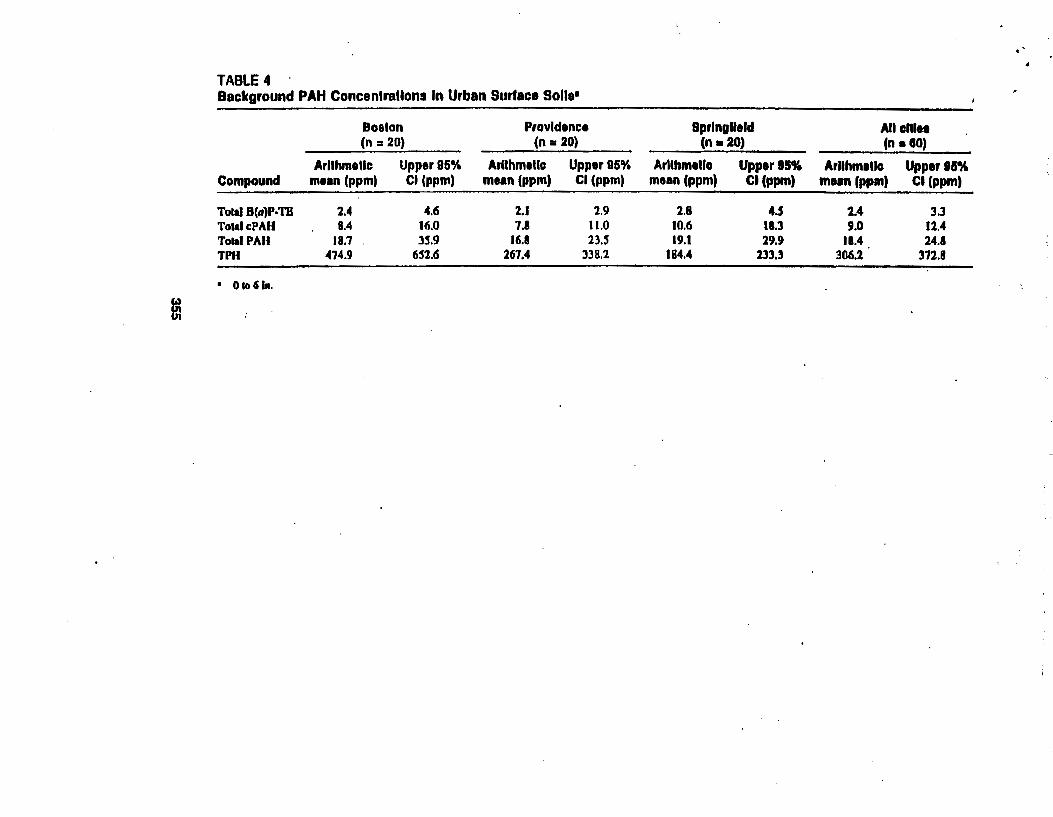
m
TABLE 4 Background PAH Concentrations In Urban Surface Solie•
Compound
Total B(II)P·TB Tolal cPAH Total PAll TPH
• Oto61a.
Boston (n = 20}
Arithmetic Upper 95% mtan (ppm) Cl (ppm)
2.4 4.6 8.4 16.0
18.7 3!5.9 474.9 6S2.6
Providence (n = 20)
Arithmetic Upper 95% mean (ppm) Cl (ppm)
2.1 1.9 7.8 11.0
lfi.B as 267.4 338.1
Springfield (n • 20)
Arithmetic Upper IS% mean (ppm) Cl(ppm)
2.8 4.5 10.6 18.3 19.1 29.9
184.4 133.3
All onr" (n • 80)
Arlthmtllc mun (ppm)
1.4 9.0
18.4 306.1
Upper I&% Cl (ppm)
3.3 11.4 24.8
311.8
4
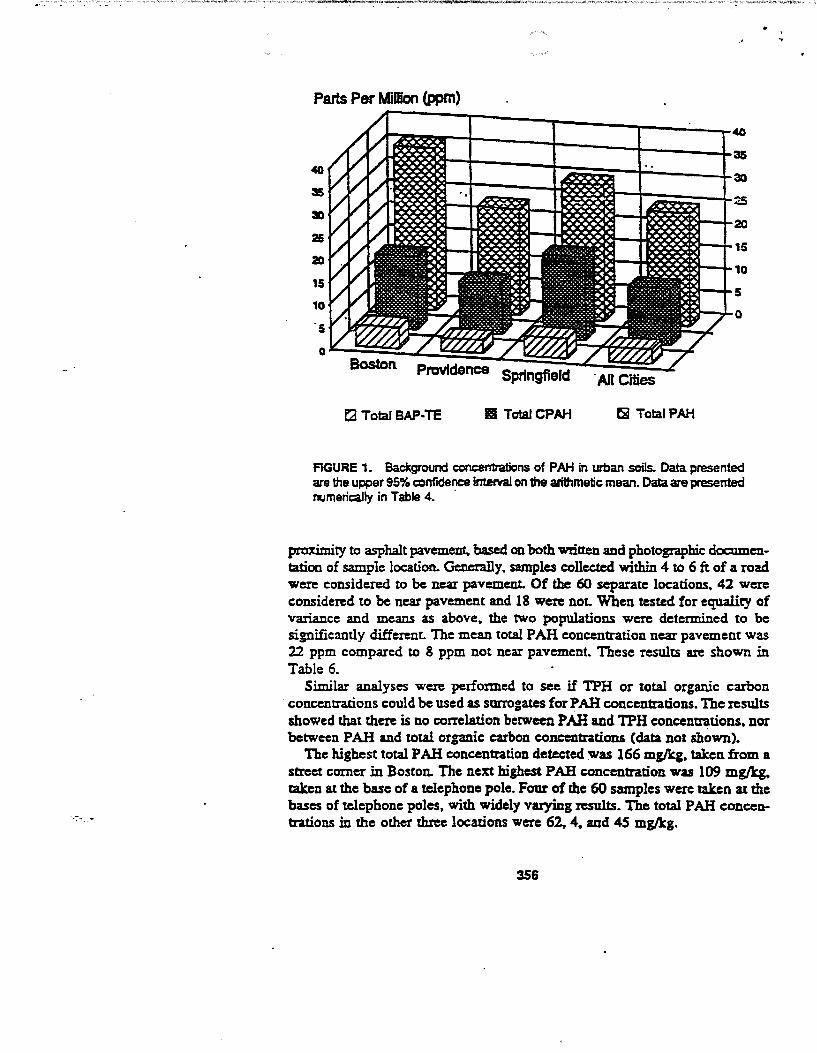
-.· ..... -
Parts Per MiDion (ppm)
40
35
3D
25
20
15
10
·s
II TotaJCPAH
·All Cities
3S
30
~
20
15
10
:xJto-.... 5
~-"-0
~ Tota.IPAH
FIGURE 1. Background eoncentrations of PAH in urban soils. Data presented are the upper 95% c:cnfidence InterVal on the arithmetic mean. Data are presented numerically in Table 4. ·
proximity to asphalt pavement. based on both 'Written and photogtapbic documentation of sample location. Generally. samples collected within 4 to 6 ft of a road were considered to be near pavement. Of the 60 separate locations. 42 were considered to be near pavement and 18 were noL When tested for equality of variance and means as above. the two populations were determined to be significantly different. The mean total PAH concentration near pavement was 22 ppm compared to 8 ppm not near pavement. These results are shown in Table 6.
Similar analyses were performed to see if TPH or total organic carbon concentrations could be used as surrogates for P AH concentrations. The results showed that there is no correlation between P AH and TPH concentrations. nor between PAH and total organic carbon concentrations (data not shown).
The highest total P AH concentration detected was 166 mgJkg, taken from a street comer in Boston. The next highest PAH concentration was 109 mg/kg. taken at the base of a telephone pole. Four of the 60 smnples were taken at the bases of telephone poles, with widely vaeying results. The total P AH concentrations in the other three locations were 62, 4. aod 45 mg./kg.
356

w ~
TABLE 5 Summary Stall sties tor Melats, TPH. a~d Solis .bY City
Boston Providence Sprlnglleld (n = 20) (n = 20) (n • 20)
Arllhmellc Upper 95% Arllhmetlc Upper 95% Arllhmellc Upper as•A. Arithmetic mean mean lnlerval mean Interval mean Interval
Compound (mglkg) (mgtkg) (mgl1tg) (mg/kg) (mglkg) (mgtkg)
Arsenic, tolal 4.20 5.59 l.S3 4.17 5.63 9.23 Barium, lotal 53.95 66.25 45.29 59.43 45.17 51.03 Cadmium, total 1.!15 2.79 ND ND ND ND Chromium, total 23.00 27.69 1'2.08 14.3.5 12.61 14.4.5 Le1d, Iota! 398.70 . 737.44 305.76 461.98 261.69 377.76 Mercury, total 0.19 0.39 0.19 0.24 0.20 0.1.5 Selenium. total 0.51 0.57 0.39 0.48 0.53 0 • .5S Total pckolcum hydrocarbons 474.90 6.52.62 267.43 338.19 184.38 233.27 Total solids 90% 93'J(, 93% 9SCJ. 90'1. !J2'J(,
• ATSDR. 1992. fublic llealll• Asstrsmml G•ldanc• M4111MIII. PB92-147164. U.S. DtpaT1melll of Hultla and ll••an Senbl. " ATSDR. 1991. TaziwloBlcal Profilt f()r CadnUunt. PB91-147164. DnO. U.S. llepaT1ment of flcaltla ud Hamid Servb•.
In U.S. eolia• (mglkg)
1.4 420
0.2S• 51 17 0.11 0.4.5
.. •
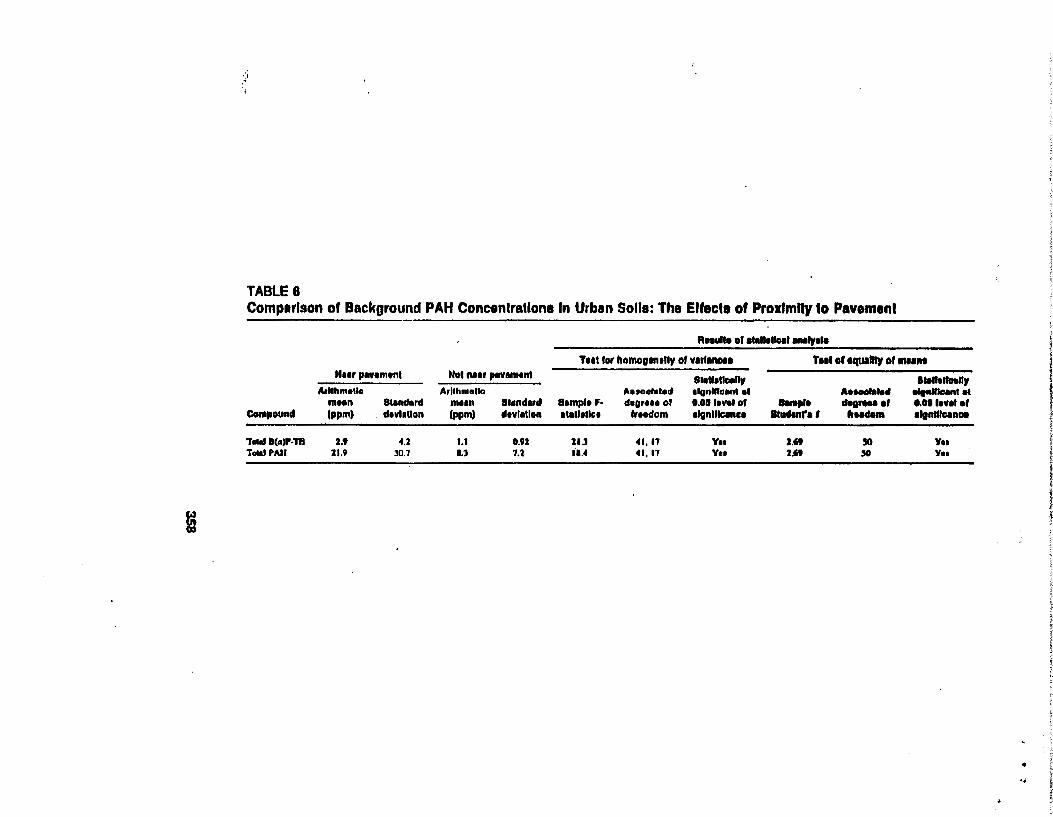
m
.. ; ."
TABLE 6 Comparison of Background PAH Concenlrallona In Urban Solla: The Effecla of Proxlmlly to Pavement
Rnlf .. ol ataiiiOoiiiM~alo
T .. t lor homoaaneuv of VllllnDII T111 of equallly of lftHM
H11r PIWtmtnl Nol Nil pe¥1mtnl •••l•tanv ........... ~llhmallo Arllhmello Auoaf•lecf algrtlllallnl el ......... .. ....,..,. ...
mHn StiiKMrd mtan S11nd1rcl 81mpflf'· d•O, .. • of 0.01 lanl of ....... ctea ..... •• ...... ., ... , Compound (ppm) . dtviiUon (ppm,) deviation ....... lc. freedom algnlllclnce lllldanta I ftt~dom algnlllcanae
T .... B(a)P-18 2.9 u 1.1 0.91 1U 41, 17 Yet Ut ~ v .. T .... PAII 11.9 lD.l 1.1 1.1 ..... ••• ll Yu Ut '0 Yet
• ..
t
' f l I '
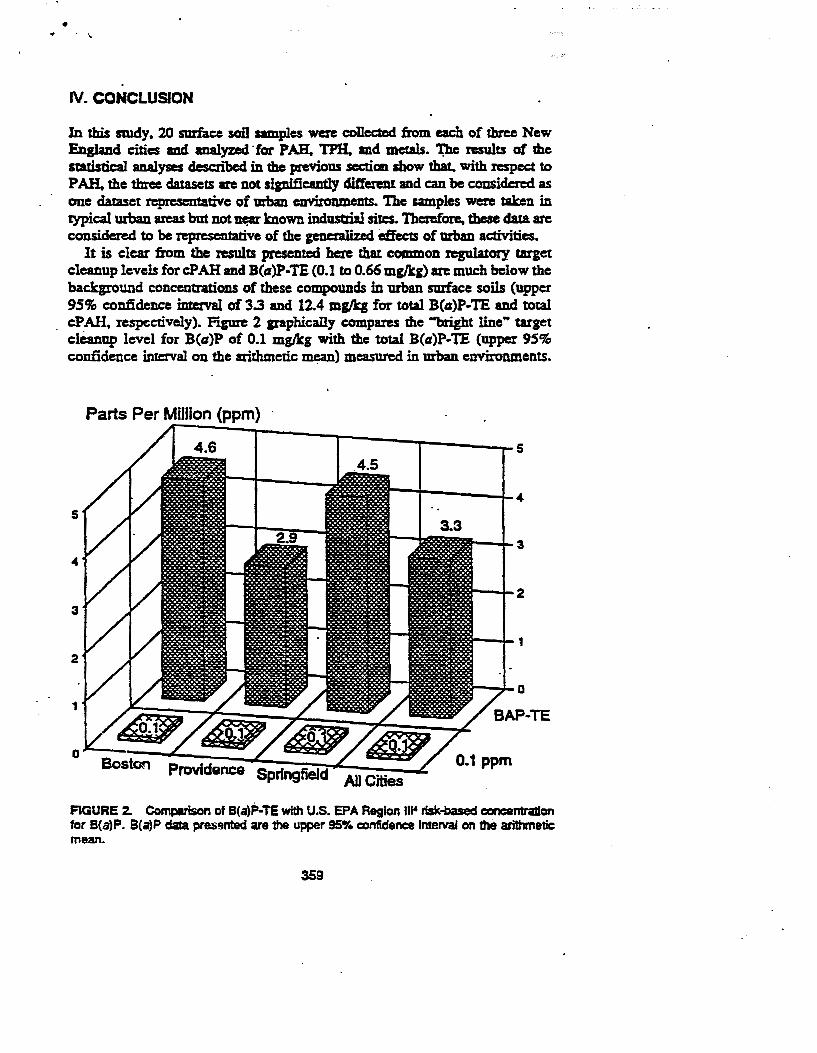
•
IV. CONCLUSION
In tbis smdy. 20 surface soil samples were conec:ted from each of 1hree New England cities and analyzed· for PAH. TP1L md metals. ~ results of the statistical analyses described in the previous secticm lhow that. with n:spec:t to P AH. the three datasets are not significantly different and c:an be considered as one dataset representative of urban euvi:onments. The Bmlples were taken in typical urban areas but not n• known industrial siteS. Therefore, these data arc considCRd to be representative of the genetaJ.izecl eff'ec:IS of urban activities.
It is clear from the results presented here that common regulatory target cleanup levels for eP AH and B(a)P-TE (0.1 to 0.66 mg/kg) arc much below the background concentrations of lhesc compounds in urban smface soils (upper 9590 confidence intava1 of 3.3 and 12.4 mg/kg for total B(a)P-TE and total cP AH, respectively). Fipre 2 araphically compares the "1mght line .. target cleanup level for B(a)P of 0.1 mglkg with the total B(a)P· TE (upper 9SCFD confidence interVal on the arithmetic mean) measured in urban environments.
Parts Per Million (ppm}
4.6 5
---3
FIGURE 2. Comparison of B(a)P-TE with U.S. EPA Region II~ risk-based cancamradon fer B{a)P. B(a)P data presented are the upper 9511Y. confidence lmerval on the arithmetic mean.
359
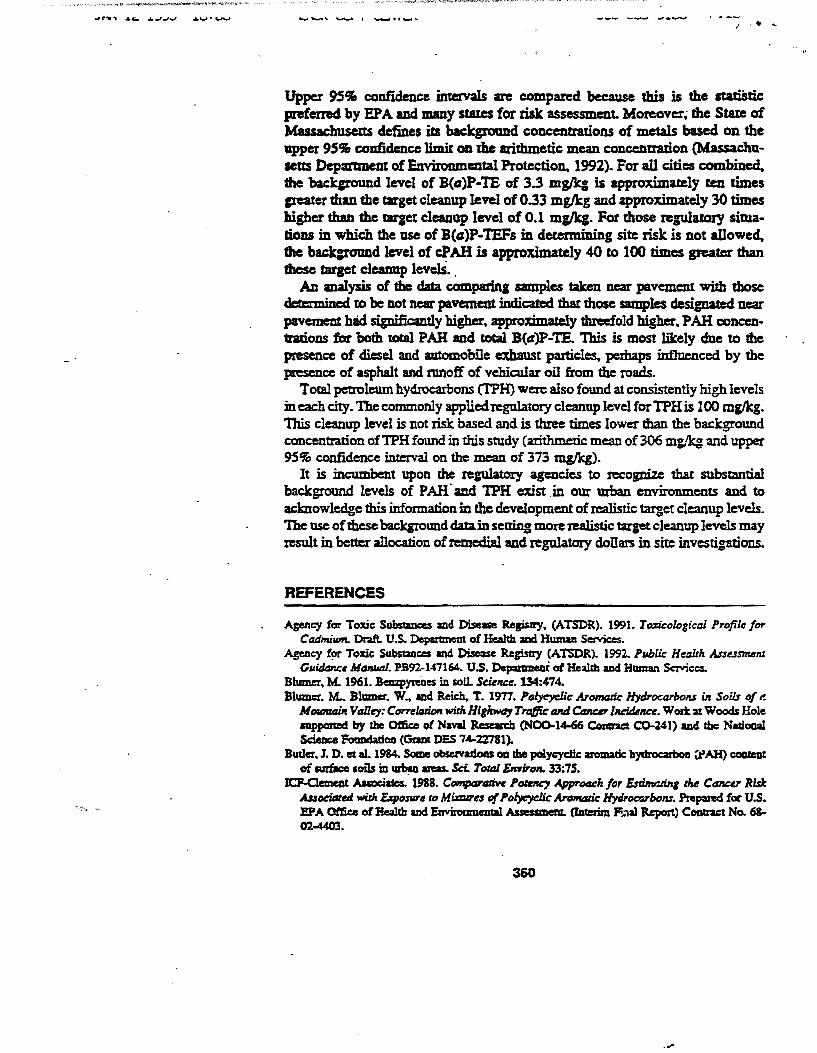
.... '-'' ~ . ~ ........... J ' .....
Upper 9Stf. confidence intervals are compared because this is the statiStic prefenecl by EPA and IIW1Y sbllcS for risk assessment. Moreover~ the Sta.re of )hssachuseas defines irs baclcg:roand concentrations of metals based on the upper 9SCJD coDfidence limit on the arithmetic mean concentration (Massachusetts Department of Environmental Protection. 1992). For all cities combined. the backJround level of B(a)P-TE of 3.3 mglk: is approximarely ten times peater than the target cleanup level of 0.33 mglkg and approximately 30 times higher than the uqet cleanop level of 0.1 mg/kg. For those ~gulacory situations in which the use of B(a)P· TEFs in determining site risk is not allowed, the backJrouud level of cPAH is approximately 40 to 100 times greater than these target cleanup levelS •.
An analysis of the data cam.parina samples 1aken near pavement with those determined to be not near pavement indicated that rhose samples designated near pavement had significantly higher, appro:dmately tbr=fold higher, PAH concen-1ralions for both rotal PAH and rota! B(a)P-TE. This is most likely clue to the presence of diesel and automobile exh~t particles, peihaps in:fluenced by the presence of asphalt and mnoff of vehicular oil from the toads.
Total petroleum hydroeaibons (TPH) were also found at consistently high levels in each city. The commonly applied regulatory cleanup level for TPH is 100 mglkg. nus cleanup level is not risk based and is three times lower 1han the background cancen1ration ofTPH found in this study {arithmetic mean of 306 mg.'kg and upper 95% confidence inteiVal on the mean of 373 mglkg).
It is incumbent upon the ~gulatory agencies to recognize thai substantial background levels of PAif and 'IPH exist .in our urban environments and to acknowledge this information in the development of realistic target cleanup levels. The usc of these ba.ckgzound data in seaing more JUlistic target cleanup levels may result in better allocation of remedial and regulatory dollars in site investigations.
REFERENCES
Agency for Toxic Subs1auc:a md Disease Repll')'. (ATSDR). 1991. Tozicological Profik for Co.dmiiUIL Draft. U.S. Dcpaumcut of Health aDd HllDWl Ser'llic:es.
Agellc'J !~ Toltic: Subszaoces and t>is=sc ReJistey (ATSDR). 199::Z. Pllblic Heallh Assessmelll Guid/Jnu Mt11UIIJ1. PB92-147164. U.S. Dep:mmecr of Healib and Human ScMc=.
Blmner, M. 1961. Benzp~es in soil. Scie~&ee.l34:474. B'bmlcr. M.. Blmnc:r. W., md Reich. T. 1977. Polyeydic Aromtllit: Hyboccubons ill Soils oft!
Mtnllfltlbc Vtzlley: Correladtm with Higla'NIIY Tl'tl/}ic liiUl CtliiUl" lltdMIICe. Wod: :ar Woods Hole aupponed by the Oftice ot Naval Rcxardl (N00-14-66 Comract C0-241) aad tbc National Sc:ieDce Po!mdalioss (Gam DES 7-4-22781).
Budc:r,1. D. et al. 1984. Some obserlasiofts on tbe polyq'Ctic aromatic bydroc::ali)oD (!JAH) c:ao.teDt of IUlfacc soils iD ~ aras. Sd.. Tottll EzrviTD11. 33:75.
ICP-0ement Aaoeilie$. 1988. CDifiPIZ'tlliw PtJkN:1 ApprOGCh /t:Jr Esdmr.linr 1M Ct~~~~:u Risk Assoc:itlted with E.zponue to Mi:awes of Potycydic Anmlatic HyjrDC~:JTboM. Prep¥ed foe U.S. EPA Office ofBealtb an4 Enviroamcncal Assessment. (lntaim F.:ilal Repent) Coau-act No. 6&. 02-MOJ.
360
....

,., ~ )~12-1995 16=07 E~~,,,..., COPY CENTER
~ J:)qMa:twtof!zMtomwaraJ ~ 1992..11.rk~SiwnFtll'fiL BOIIOC, MA. otDce of llellan:h aad SraDdBrdJ me! 1be BalraD of Waste Si~ Cbnp. M•ssacfmse«ts Depaa.11Wil of Eavift.n ........... J Pn:ac:ciaa.
}.4endenbaJl. W. 1!'179. I~ 111 Prtlbtlbility llllll St:rtirtia. Fifth ed. Belmoal. CA. Duxbury Press.
:t.tam.. C. A.. PorDcJd. B. B .. IDd $ia«odnnarn, 1. 1992. Exposure 110 ~ PAHs iD the CD"uQDDJeilt. Envinna. Sci. TelttuX. 2':1218.
Mlchip DeputmeatafNamralRaoarca. 1993.MDIA. ~M~-.RrNIDt~.2. July 16.
NewJ'"'Yhlis:u. 1992. Site R~hofNlllo C1etuuzp ~for Co~ Shu. Pn~ptJUtl Nr# RlllG: NJAC 7:2fJJ. Cl4:373. Maoday, Feblllilty 3.
U.S. EPA. 1986. SWA46. Vol. 2,. 3ld ed. Wasbia&toD, D.C.. OSWEll, U.S. EuviroamenraJ Prolection AactJI:Y.
U.S. EPA. 1919. Rlit Ar.w.s:sment ~for S~ VoZwlw 1: HIIMIII& Hlldllll £'Wilutldo" MIIIUIIIl (PtSrt A). EPA S4011-89,ut2. WasbiDJIDD. D.C.. Of&e of Emerlet:ICY IDd Remedial Rclpomc. U.S. EaYiraaa:l mral Protec:dcm A$pJJ;y.
U.S. EPA. 1991. NdliDNJl Fllltl:dDNZI ~for Orzllllie Dt111Z R~. Draft. Jane. U.S. ~ PtoammAprs;r.
ll.S.EPA.1993&.!111~Riskl~System(lRIS).CincimJui.OH.EftYirDDmemalCrilmia and Assasmem: Ofliclc:. U.S. ~ Prarac:doo A;crrr;y.
U.S. EPA. 1993b. Ruk-BAwl Ct111U1111'aliort TtJble, T1riTd Q~MJrtU. U.S. E.Dvinlmnaual 'Pzot=ction Agency. Region m.
U.S. EPA. 1993c. PI"'VUioNJl Gui.titzna for QIUDlliltZliv~ Risk A.s.se.s.smDU" t1/ Prilycyclic Aronuz:ic HydrOCtll'boJU. EPA/60DIR~93J089. U.S. Euviromnemal Protcctioo Agertey.
Woo, Y. T .. Health aDd Eaviraameatal Review Division. Office of Toxic Su~ U.S. E.ovironmemal Protec:l:ioa Ageoq, Wasbington. D.C. 20460. JUDC 14, 1989. PAH.s Scr~millgfor Carci· Mgemcity. MemCDDdum toP. Tq, Hazardous Site Evaluation Division, Office ofEmergmt;y and R.cmcdial R.l:&poose. U.S. &viroammlll Prou:crion Agency, WashiDgt.OD, D.C. 20460.
361
508 635 9180 P.14
TOTHL P.14