AL MAYNARD ASSOCIATES Pty Ltd Consulting …€¦ · AL MAYNARD & ASSOCIATES Pty Ltd Consulting...
27
AL MAYNARD & ASSOCIATES Pty Ltd Consulting Geologists www.geological.com.au ABN 75 120 492 435 9/280 Hay Street, Tel: (+618) 9388 1000 Mob: 04 0304 9449 SUBIACO, WA, 6008 Fax: (+618) 9388 1768 [email protected] Australia Australian & International Exploration & Evaluation of Mineral Properties INDEPENDENT TECHNICAL VALUATION OF THE LISTING PORTION OF MINERAL ASSETS OF KIN MINING NL FOR HLB MANN JUDD CORPORATE (WA) PTY LTD Author: Allen J Maynard BAppSc(Geol), MAIG, MAusIMM Company; Al Maynard & Associates Pty Ltd Date: 30 th September, 2014
Transcript of AL MAYNARD ASSOCIATES Pty Ltd Consulting …€¦ · AL MAYNARD & ASSOCIATES Pty Ltd Consulting...
AL MAYNARD & ASSOCIATES Pty Ltd
Consulting Geologists www.geological.com.au ABN 75 120 492 435
9/280 Hay Street, Tel: (+618) 9388 1000 Mob: 04 0304 9449 SUBIACO, WA, 6008 Fax: (+618) 9388 1768 [email protected] Australia
Australian & International Exploration & Evaluation of Mineral Properties
INDEPENDENT TECHNICAL VALUATION
OF THE
LISTING PORTION OF MINERAL ASSETS
OF
KIN MINING NL
FOR
HLB MANN JUDD CORPORATE (WA) PTY LTD
Author: Allen J Maynard BAppSc(Geol), MAIG, MAusIMM Company; Al Maynard & Associates Pty Ltd Date: 30th September, 2014
Valuation of the Kin Listing Mineral Assets
Kin Independent Technical Valuation – AM&A Executive Summary 1
EXECUTIVE SUMMARY
This Independent Technical Valuation Report has been prepared by Al Maynard & Associates (“AM&A”) at the request of Mr W.M. Clarke, Director, of HLB Mann Judd Corporate (WA) Pty Ltd (“HLB”) to prepare an Independent Expert’s Report (“IER”) for inclusion in a Notice of General Meeting (“NOM”) for the Board of Kin Mining NL (“Kin” or the “Company”) on the Leonora Projects which it controls in the Leonora District of Western Australia (Fig 1). The NOM regards the proposed transaction for Kin to issue shares to Geolord Resources Pty Ltd or its nominee (“Geolord”). Kin listed on the Australian Securities Exchange (“ASX”) on 2nd October, 2013 and subsequently commenced an intensive exploration program on three of its six project areas. In April 2014 the company embarked on a strategy to become a significant gold producer focusing on Australia’s prolific Leonora region by executing a binding term sheet to acquire the Leonora Gold Project from the Deed Administrator of Navigator Resources Limited (subject to deed of company arrangement) (“Navigator”).
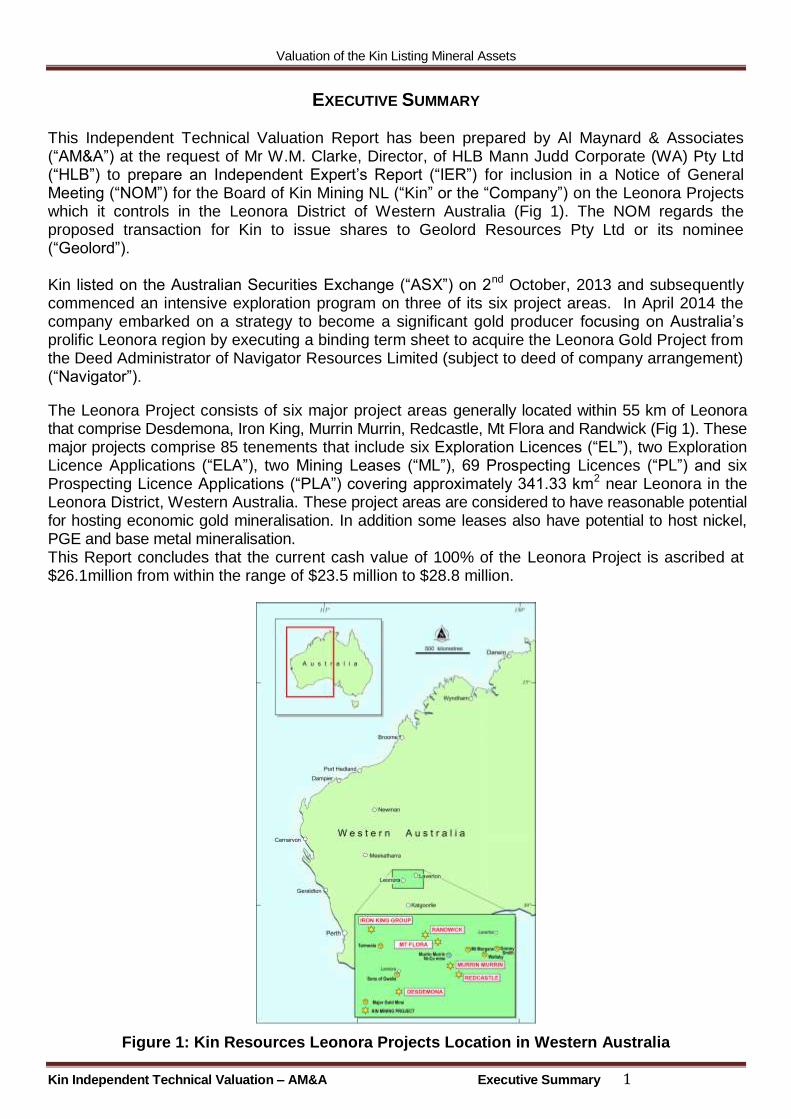
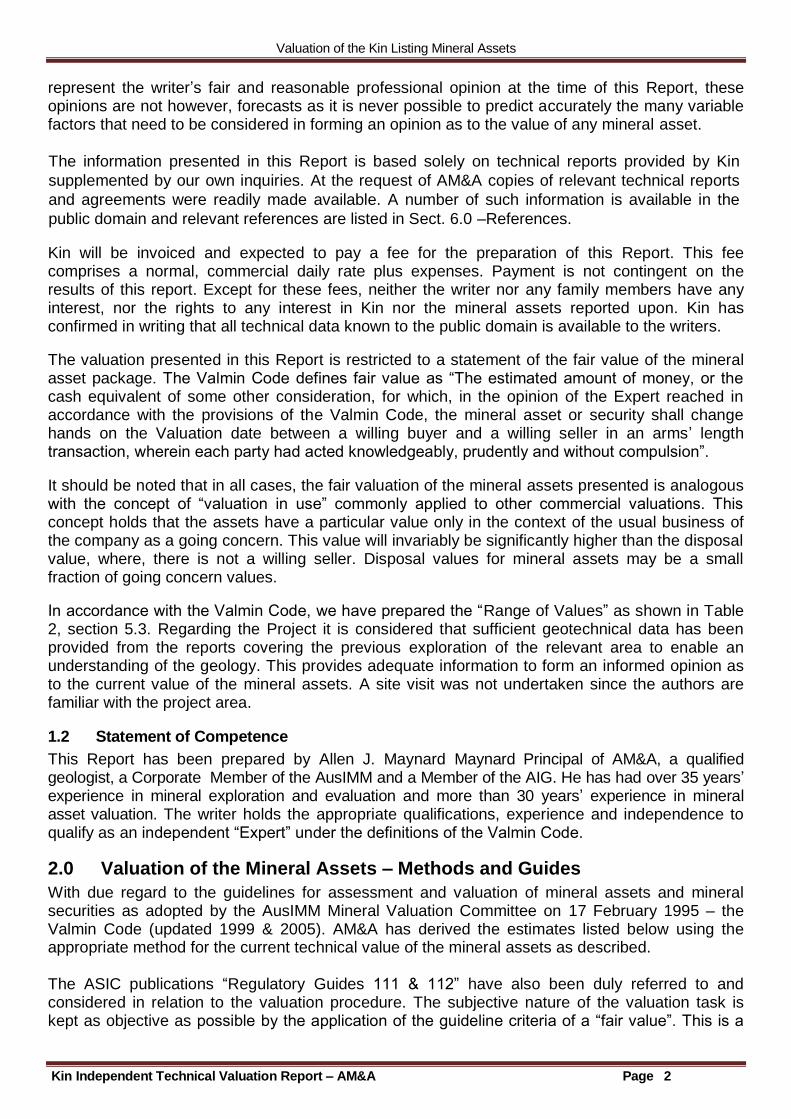
The Leonora Project consists of six major project areas generally located within 55 km of Leonora that comprise Desdemona, Iron King, Murrin Murrin, Redcastle, Mt Flora and Randwick (Fig 1). These major projects comprise 85 tenements that include six Exploration Licences (“EL”), two Exploration Licence Applications (“ELA”), two Mining Leases (“ML”), 69 Prospecting Licences (“PL”) and six Prospecting Licence Applications (“PLA”) covering approximately 341.33 km2 near Leonora in the Leonora District, Western Australia. These project areas are considered to have reasonable potential for hosting economic gold mineralisation. In addition some leases also have potential to host nickel, PGE and base metal mineralisation. This Report concludes that the current cash value of 100% of the Leonora Project is ascribed at $26.1million from within the range of $23.5 million to $28.8 million.
Figure 1: Kin Resources Leonora Projects Location in Western Australia
Valuation of the Kin Listing Mineral Assets
Kin Independent Technical Valuation– AM&A Contents i
TABLE OF CONTENTS 1.0 Introduction 1
1.1 Scope and Limitations ........................................................................................................................................................... 1 1.2 Statement of Competence ...................................................................................................................................................... 2
2.0 Valuation of the Mineral Assets – Methods and Guides 2 2.1 General Valuation Methods .................................................................................................................................................. 3 2.2 Discounted Cash Flow/Net Present Value ........................................................................................................................... 3 2.3 Joint Venture Terms .............................................................................................................................................................. 3 2.4 Similar or Comparable Transactions .................................................................................................................................. 3 2.5 Multiple of Exploration Expenditure ................................................................................................................................... 3 2.6 Ratings System of Prospectivity (Kilburn) .......................................................................................................................... 3 2.7 Empirical Methods (Yardstick – Real Estate) .................................................................................................................... 4 2.8 General Comments ................................................................................................................................................................ 4 2.9 Environmental implications .................................................................................................................................................. 4 2.10 Indigenous Title Claims ......................................................................................................................................................... 4 2.11 Commodities-Metal prices .................................................................................................................................................... 4 2.12 Resource/Reserve Summary ................................................................................................................................................. 4 2.13 Previous Valuations ............................................................................................................................................................... 4 2.14 Encumbrances/Royalty ......................................................................................................................................................... 4
3.0 Background Information 5 3.1 Introduction ............................................................................................................................................................................ 5 3.2 Specific Valuation Methods .................................................................................................................................................. 5
4.0 Leonora IGR original Project areas 5 4.1 Introduction ............................................................................................................................................................................ 5 4.2 Location and Access ................................................................................................................................................................... 5 4.3 Tenure ......................................................................................................................................................................................... 7 4.4 Geological Setting ....................................................................................................................................................................... 8 4.4.1 Regional Geology 8 4.4.2 Mineralisation 9 4.5 Major Projects .......................................................................................................................................................................... 11 4.5.1 Desdemona 11 4.5.2 Iron King Group 11 4.5.3 Murrin Murrin 12 4.5.4 Redcastle 13 4.5.5 Mt Flora 13 4.5.6 Randwick 13 4.6 Exploration Potential ........................................................................................................................................................... 14
5.0 Valuation of the Projects 15 5.1 Selection of Valuation Methods .......................................................................................................................................... 15 5.2 Valuation - MEE Method ................................................................................................................................................... 15 5.3 Valuation Conclusions ........................................................................................................................................................ 16
6.0 References 17
Appendix 1: Kin Valuation Estimate Workings. 18
Appendix 2: Tenement Holding 19
7.0 Glossary of Technical Terms and Abbreviations 23
List of Figures Figure 1: Kin Resources Leonora Projects Location in Western Australia ...................................... 1
Figure 2: Leonora Projects – Location of six key major project areas. ............................................ 6 Figure 3: Tenements over TMI with Structure. .......................................................................... 10
List of Tables Table 1: Leonora Project Tenement Summary Details. ................................................................... 8
Table 2: Summary Range of Current Values. ................................................................................. 16

Valuation of the Kin Listing Mineral Assets
Kin Independent Technical Valuation Report – AM&A Page 1
Mr W.M. Clarke 2nd October, 2014 HLB Mann Judd Corporate (WA) Pty Ltd Level 4, 130 Stirling Street, Perth, WA, 6000 Dear Mr Clarke,
VALUATION OF THE KIN LISTING PROJECTS MINERAL ASSETS NEAR LEONORA, WESTERN AUSTRALIA
1.0 Introduction
This Independent Technical Valuation Report has been prepared by Al Maynard & Associates (“AM&A”) at the request of Mr W.M. Clarke, Director, of HLB Mann Judd Corporate (WA) Pty Ltd (“HLB”) to prepare an Independent Expert’s Report (“IER”) for inclusion in a Notice of General Meeting (“NOM”) for the Board of Kin Resources NL (“Kin” or the “Company”) on the Leonora Projects which it controls in the Leonora District of Western Australia (Fig 1). The NOM regards the proposed transaction for Kin to issue shares to Geolord Resources Pty Ltd or its nominee (“Geolord”).
The general meeting is being called in relation to Australian Securities Exchange Listing Rule 7.1 and Section 611 of the Corporations Act and specifically to seek the approval of shareholders to issue fully paid ordinary shares to Geolord (or its nominee) on the terms and conditions to be set out in an Explanatory Statement, such that the issue of shares will result in Geolord’s voting power in the Company being greater than 20%. The Notice must include a report on the transaction from an independent expert stating whether the transaction is fair and reasonable to holders of the Company’s ordinary securities whose votes are not to be disregarded. Kin listed on the Australian Securities Exchange on 2nd October, 2013 and subsequently commenced an intensive exploration program on three of its six project areas. In April 2014 the company embarked on a strategy to become a significant gold producer focusing on Australia’s prolific Leonora region by executing a binding term sheet to acquire the Leonora Gold Project from the Deed Administrator of Navigator Resources Limited (subject to deed of company arrangement) (“Navigator”).
1.1 Scope and Limitations
This Report has been prepared in accordance with the requirements of the Valuation of Mineral Assets and Mineral Securities for Independent Expert’s Reports (the “Valmin Code”) (2005) as adopted by the Australian Institute of Geoscientists (“AIG”) and the Australasian Institute of Mining and Metallurgy (“AusIMM”). This Report is valid as of 2nd October, 2014 which is the date of the latest review of the data and technical information. The valuation can be expected to change over time having regard to political, economic, market and legal factors. The valuation can also vary due to the success or otherwise of any mineral exploration that is conducted either on the mineral assets concerned or by other explorers on prospects in the near environs. The valuation could also possibly be affected by the consideration of other exploration data from adjacent licences with production history affecting the mineral assets which have not been made available to the writer. In order to form an opinion as to the value of any mineral asset, it is necessary to make assumptions as to certain future events, which might include economic and political factors and the likely exploration success. The writer has taken all reasonable care in formulating these assumptions to ensure that they are appropriate to the case. These assumptions are based on the writers’ technical training and experience in the mining industry. Whilst the opinions expressed
Valuation of the Kin Listing Mineral Assets
Kin Independent Technical Valuation Report – AM&A Page 2
represent the writer’s fair and reasonable professional opinion at the time of this Report, these opinions are not however, forecasts as it is never possible to predict accurately the many variable factors that need to be considered in forming an opinion as to the value of any mineral asset.
The information presented in this Report is based solely on technical reports provided by Kin
supplemented by our own inquiries. At the request of AM&A copies of relevant technical reports
and agreements were readily made available. A number of such information is available in the
public domain and relevant references are listed in Sect. 6.0 –References.
Kin will be invoiced and expected to pay a fee for the preparation of this Report. This fee comprises a normal, commercial daily rate plus expenses. Payment is not contingent on the results of this report. Except for these fees, neither the writer nor any family members have any interest, nor the rights to any interest in Kin nor the mineral assets reported upon. Kin has confirmed in writing that all technical data known to the public domain is available to the writers.
The valuation presented in this Report is restricted to a statement of the fair value of the mineral asset package. The Valmin Code defines fair value as “The estimated amount of money, or the cash equivalent of some other consideration, for which, in the opinion of the Expert reached in accordance with the provisions of the Valmin Code, the mineral asset or security shall change hands on the Valuation date between a willing buyer and a willing seller in an arms’ length transaction, wherein each party had acted knowledgeably, prudently and without compulsion”.
It should be noted that in all cases, the fair valuation of the mineral assets presented is analogous with the concept of “valuation in use” commonly applied to other commercial valuations. This concept holds that the assets have a particular value only in the context of the usual business of the company as a going concern. This value will invariably be significantly higher than the disposal value, where, there is not a willing seller. Disposal values for mineral assets may be a small fraction of going concern values.
In accordance with the Valmin Code, we have prepared the “Range of Values” as shown in Table 2, section 5.3. Regarding the Project it is considered that sufficient geotechnical data has been provided from the reports covering the previous exploration of the relevant area to enable an understanding of the geology. This provides adequate information to form an informed opinion as to the current value of the mineral assets. A site visit was not undertaken since the authors are familiar with the project area.
1.2 Statement of Competence
This Report has been prepared by Allen J. Maynard Maynard Principal of AM&A, a qualified geologist, a Corporate Member of the AusIMM and a Member of the AIG. He has had over 35 years’ experience in mineral exploration and evaluation and more than 30 years’ experience in mineral asset valuation. The writer holds the appropriate qualifications, experience and independence to qualify as an independent “Expert” under the definitions of the Valmin Code.
2.0 Valuation of the Mineral Assets – Methods and Guides
With due regard to the guidelines for assessment and valuation of mineral assets and mineral securities as adopted by the AusIMM Mineral Valuation Committee on 17 February 1995 – the Valmin Code (updated 1999 & 2005). AM&A has derived the estimates listed below using the appropriate method for the current technical value of the mineral assets as described. The ASIC publications “Regulatory Guides 111 & 112” have also been duly referred to and considered in relation to the valuation procedure. The subjective nature of the valuation task is kept as objective as possible by the application of the guideline criteria of a “fair value”. This is a
Valuation of the Kin Listing Mineral Assets
Kin Independent Technical Valuation Report – AM&A Page 3
value that an informed, willing, but not anxious, arms’ length purchaser will pay for a mineral (or other similar) asset in a transaction devoid of “forced sale” circumstances.
2.1 General Valuation Methods
The Valmin Code identifies various methods of valuing mineral assets, including:-
Discounted cash flow,
Joint Venture and farm-in terms for arms’ length transactions,
Precedents from similar asset sales/valuations,
Multiples of exploration expenditure,
Ratings systems related to perceived prospectivity,
Real estate value and Rule of thumb or yardstick approach.
2.2 Discounted Cash Flow/Net Present Value
This method provides an indication of the value of a mineral asset with identified reserves. It utilises an economic model based upon known resources, capital and operating costs, commodity prices and a discount for risk estimated to be inherent in the project.
Net present value (‘NPV’) is determined from discounted cash flow (‘DCF’) analysis where reasonable mining and processing parameters can be applied to an identified ore reserve. It is a process that allows perceived capital costs, operating costs, royalties, taxes and project financing requirements to be analysed in conjunction with a discount rate to reflect the perceived technical and financial risks and the depleting value of the mineral asset over time. The NPV method relies on reasonable estimates of capital requirements, mining and processing costs.
2.3 Joint Venture Terms
The terms of a proposed joint venture agreement may be used to provide a market value based upon the amount an incoming partner is prepared to spend to earn an interest in part or all of the mineral asset. This pre-supposes some form of subjectivity on the part of the incoming party when grass roots mineral assets are involved.
2.4 Similar or Comparable Transactions
When commercial transactions concerning mineral assets in similar circumstances have recently occurred, the market value precedent may be applied in part or in full to the mineral asset under consideration.
2.5 Multiple of Exploration Expenditure
The multiple of exploration expenditure method (‘MEE’) is used whereby a subjective factor (also called the prospectivity enhancement multiplier or ‘PEM’) is based on previous expenditure on a mineral asset with or without future committed exploration expenditure and is used to establish a base value from which the effectiveness of exploration can be assessed. Where exploration has produced documented positive results a MEE multiplier can be selected that take into account the valuer's judgment of the prospectivity of the mineral asset and the value of the database. PEMs can typically range between ‘zero’ to 3.0 and occasionally up to 5.0 where very favourable exploration results have been achieved, applied to previous exploration expenditure to derive a dollar value.
2.6 Ratings System of Prospectivity (Kilburn)
The most readily accepted method of this type is the modified Kilburn Geological Engineering/Geoscience Method and is a rating method based on the basic acquisition cost (‘BAC’) of the mineral asset that applies incremental, fractional or integer ratings to a BAC cost with respect to various prospectivity factors to derive a value. Under the Kilburn method the valuer is required to systematically assess four key technical factors which enhance, downgrade or have no impact on the value of the mineral asset. The factors are then applied serially to the BAC of
Valuation of the Kin Listing Mineral Assets
Kin Independent Technical Valuation Report – AM&A Page 4
each mineral asset in order to derive a value for the mineral asset. The factors used are; off-property attributes on-property attributes, anomalies and geology. A fifth factor that may be applied is the current state of the market.
2.7 Empirical Methods (Yardstick – Real Estate)
The market value determinations may be made according to the independent expert’s knowledge of the particular mineral asset. This can include a discount applied to values arrived at by considering conceptual target models for the area. The market value may also be rated in terms of a dollar value per unit area or dollar value per unit of resource in the ground. This includes the range of values that can be estimated for an exploration mineral asset based on current market prices for equivalent assets, existing or previous joint venture and sale agreements, the geological potential of the mineral assets, regarding possible potential resources, and the probability of present value being derived from individual recognised areas of mineralisation.
This method is termed a “Yardstick” or a “Real Estate” approach. Both methods are inherently subjective according to technical considerations and the informed opinion of the valuer.
2.8 General Comments
The aims of the various methods are to provide an independent opinion of a “fair value” for the mineral asset under consideration and to provide as much detail as possible of the manner in which the value is reached. It is necessarily subjective according to the degree of risk perceived by the mineral asset valuer in addition to all other commercial considerations. Efforts to construct a transparent valuation using sophisticated financial models are still hindered by the nature of the original assumptions where a known resource exists and are not applicable to mineral assets without an identified resource or reserve.
The values derived for this Report have been concluded after taking into account the general geological environment of the mineral asset under consideration with respect to the exploration potential.
2.9 Environmental implications
Information to date is that there are no identified existing material environmental liabilities on the mineral asset. Accordingly, no adjustment was made during this Report for environmental implications.
2.10 Indigenous Title Claims
Neither the Company nor the authors are aware of any indigenous title claims within the project
area. Accordingly, no adjustment was made during this Report for indigenous title implications.
2.11 Commodities-Metal prices
Where appropriate, current metal prices are used sourced from the usual metal market
publications or commodity price reviews (e.g.” Kitco.com”).
2.12 Resource/Reserve Summary
There are no JORC Code compliant resource estimates which could be used for this valuation.
2.13 Previous Valuations
No previous valuations concerning this portion of the total Kin holdings have been declared within
the last two years.
2.14 Encumbrances/Royalty
The Projects may be subject to state royalties as stipulated by the Government where currently
Valuation of the Kin Listing Mineral Assets
Kin Independent Technical Valuation Report – AM&A Page 5
applicable. There is also a potential 2% gross revenue royalty should a mine be developed. No
royalty payments are considered in this valuation.
3.0 Background Information 3.1 Introduction This valuation has been provided by way of a detailed study of existing information and field data provided by Kin. Refer to Sect 6.0.
The area under review comprises an EL that could host base metal or precious metal mineralisation in Western Australia. Based on a DMP “Tengraph” review, by AM&A, of the title the Kin licence is in good standing as described in the Tenure section below.
3.2 Specific Valuation Methods
There are several methods available for the valuation of a mineral prospect ranging from the most favoured DCF analysis of identified Proved & Probable Reserves to the more subjective rule-of-thumb assessment when no Reserves have yet been calculated but Resources may exist. These are discussed above in Section 2.0.
For the Project the MEE and JV Methods has been applied to determine a current value range.
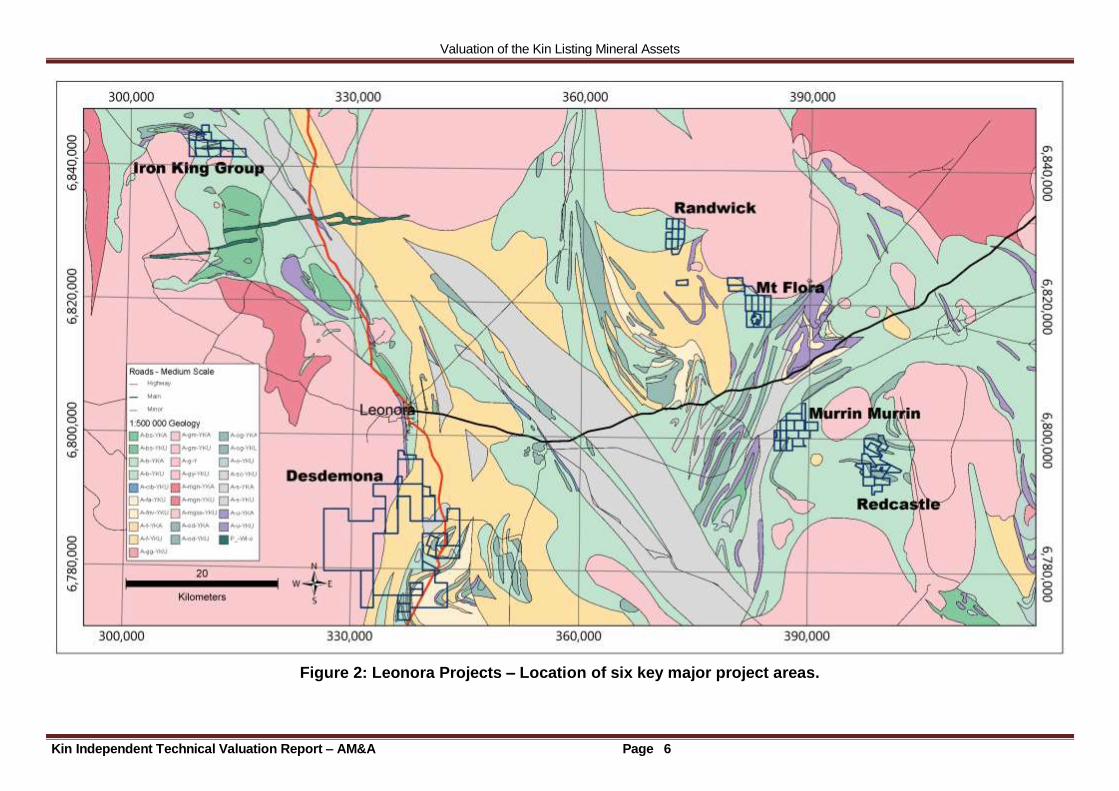
4.0 Leonora IGR original Project areas 4.1 Introduction The Leonora Project consists of six major project areas that comprise Desdemona, Iron King, Murrin Murrin, Mt Flora, Randwick and Redcastle. These projects comprise 85 tenements that include six ELs, two ELAs, two MLs, 69 PLs and six PLAs covering in total approximately 341.33 km2 near Leonora in the Leonora District, Western Australia (Fig 2). These project areas are considered to have reasonable potential for hosting economic gold mineralisation. In addition some leases also have potential to host nickel, PGE and base metal mineralisation.
4.2 Location and Access
All the Kin Mount Margaret Mineral Field project areas are located within a 55 km radius of the towns of either Leonora or Laverton. The project areas are within the Mount Margaret Mineral Field in the Mt Malcolm District of the NE Goldfields of WA. Leonora and Laverton have similar mining histories and are both towns that have benefitted from several mining booms during their lifetime.
The Leonora area has a long and rich gold mining history. It is a well serviced regional centre for the mining, exploration and pastoral industries. The town currently supports a population of around 1,500 and it has a sealed, all weather air-strip with regular flights to Perth.
Leonora is situated 832 km from Perth and 230km north of Kalgoorlie. The sealed Great Eastern and Goldfields Highways provide excellent access into the region for road transport. A standard gauge railway line also services the town and links it with the major mineral export port of Esperance as well as Perth and the eastern States.
Access into the project areas from Leonora is via the sealed Leonora-Laverton Road plus a number of graded gravel roads and tracks north, east and south of the town. Fair weather access using 4WD transport within the leases is reasonable utilising existing station, fence-line and exploration tracks. Some unsealed tracks can become impassable during the infrequent wet weather. The climate is arid to semi-arid, with an average annual rainfall of only 250 mm. However, rainfall can vary widely from year to year, with droughts followed by very wet years, usually as a result of the spin-off from tropical cyclones and lows.
Valuation of the Kin Listing Mineral Assets
Kin Independent Technical Valuation Report – AM&A Page 6
Figure 2: Leonora Projects – Location of six key major project areas.
Valuation of the Kin Listing Mineral Assets
Kin Independent Technical Valuation Report – AM&A Page 7
Five classes of vegetation are recognised in the district, viz: mulga woodlands, acacia and tea-tree scrub, grasslands with scattered trees, succulents and salt-lake communities. Variations in vegetation can generally be attributed to changes in regolith, bedrock and rainfall. Laverton is situated 832 km ENE of Perth. It can be reached by road via the Great Eastern Highway, thence by the Goldfields Highway to Leonora and finally the sealed Leonora-Laverton Road. Laverton lies 124 km ENE of Leonora and approximately 354 km north of Kalgoorlie. Laverton has a population of approximately 440 and has an all-weather, sealed air-strip. Skippers Aviation operates flights to Perth five days a week. Laverton is on the eastern edge of the Great Victoria Desert and is surrounded by numerous old mine workings as well as several major modern mines such as Granny Smith and Sunrise Dam. The area is extremely arid, with a mean annual rainfall of only 230 mm. The very low rainfall cannot support agriculture, but a substantial area of land is used for very low density grazing for sheep and cattle.
4.3 Tenure
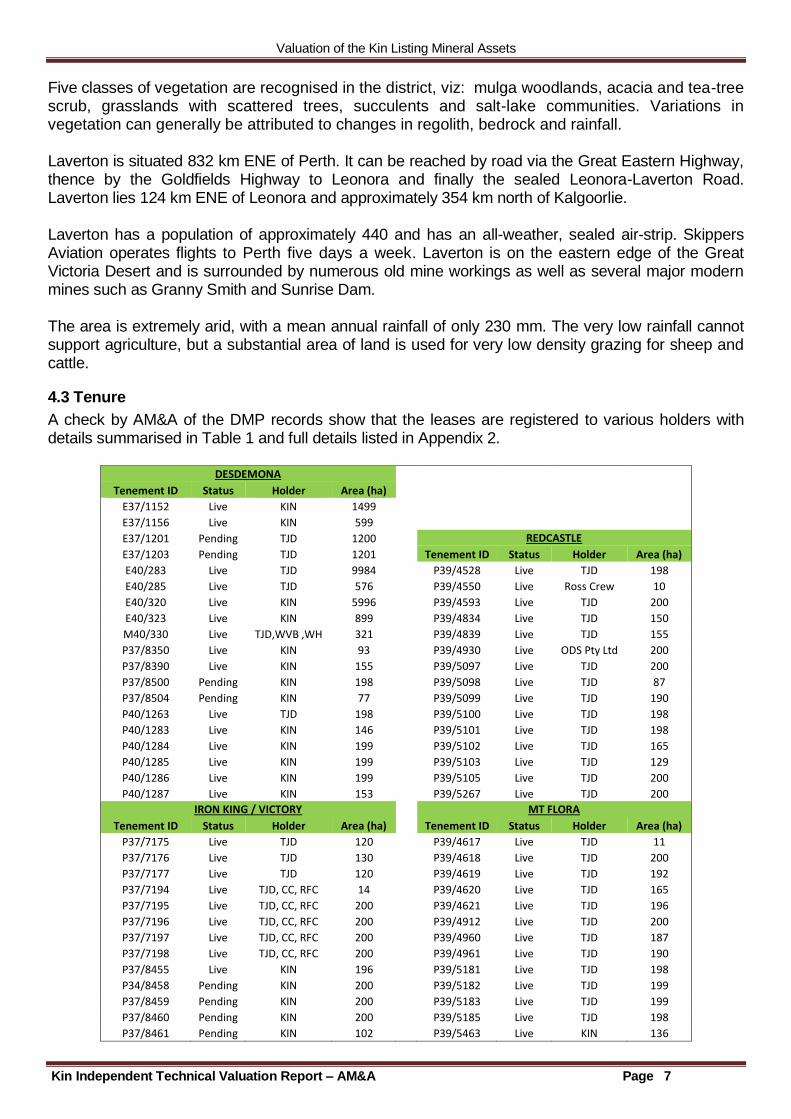
A check by AM&A of the DMP records show that the leases are registered to various holders with details summarised in Table 1 and full details listed in Appendix 2.
DESDEMONA
Tenement ID Status Holder Area (ha) E37/1152 Live KIN 1499 E37/1156 Live KIN 599
E37/1201 Pending TJD 1200
REDCASTLE
E37/1203 Pending TJD 1201
Tenement ID Status Holder Area (ha)
E40/283 Live TJD 9984
P39/4528 Live TJD 198
E40/285 Live TJD 576
P39/4550 Live Ross Crew 10
E40/320 Live KIN 5996
P39/4593 Live TJD 200
E40/323 Live KIN 899
P39/4834 Live TJD 150
M40/330 Live TJD,WVB ,WH 321
P39/4839 Live TJD 155
P37/8350 Live KIN 93
P39/4930 Live ODS Pty Ltd 200
P37/8390 Live KIN 155
P39/5097 Live TJD 200
P37/8500 Pending KIN 198
P39/5098 Live TJD 87
P37/8504 Pending KIN 77
P39/5099 Live TJD 190
P40/1263 Live TJD 198
P39/5100 Live TJD 198
P40/1283 Live KIN 146 P39/5101 Live TJD 198
P40/1284 Live KIN 199
P39/5102 Live TJD 165
P40/1285 Live KIN 199
P39/5103 Live TJD 129
P40/1286 Live KIN 199
P39/5105 Live TJD 200
P40/1287 Live KIN 153
P39/5267 Live TJD 200
IRON KING / VICTORY
MT FLORA
Tenement ID Status Holder Area (ha)
Tenement ID Status Holder Area (ha)
P37/7175 Live TJD 120
P39/4617 Live TJD 11
P37/7176 Live TJD 130
P39/4618 Live TJD 200
P37/7177 Live TJD 120
P39/4619 Live TJD 192
P37/7194 Live TJD, CC, RFC 14
P39/4620 Live TJD 165
P37/7195 Live TJD, CC, RFC 200 P39/4621 Live TJD 196
P37/7196 Live TJD, CC, RFC 200
P39/4912 Live TJD 200
P37/7197 Live TJD, CC, RFC 200
P39/4960 Live TJD 187
P37/7198 Live TJD, CC, RFC 200
P39/4961 Live TJD 190
P37/8455 Live KIN 196
P39/5181 Live TJD 198
P34/8458 Pending KIN 200
P39/5182 Live TJD 199
P37/8459 Pending KIN 200
P39/5183 Live TJD 199
P37/8460 Pending KIN 200
P39/5185 Live TJD 198
P37/8461 Pending KIN 102
P39/5463 Live KIN 136
Valuation of the Kin Listing Mineral Assets
Kin Independent Technical Valuation Report – AM&A Page 8
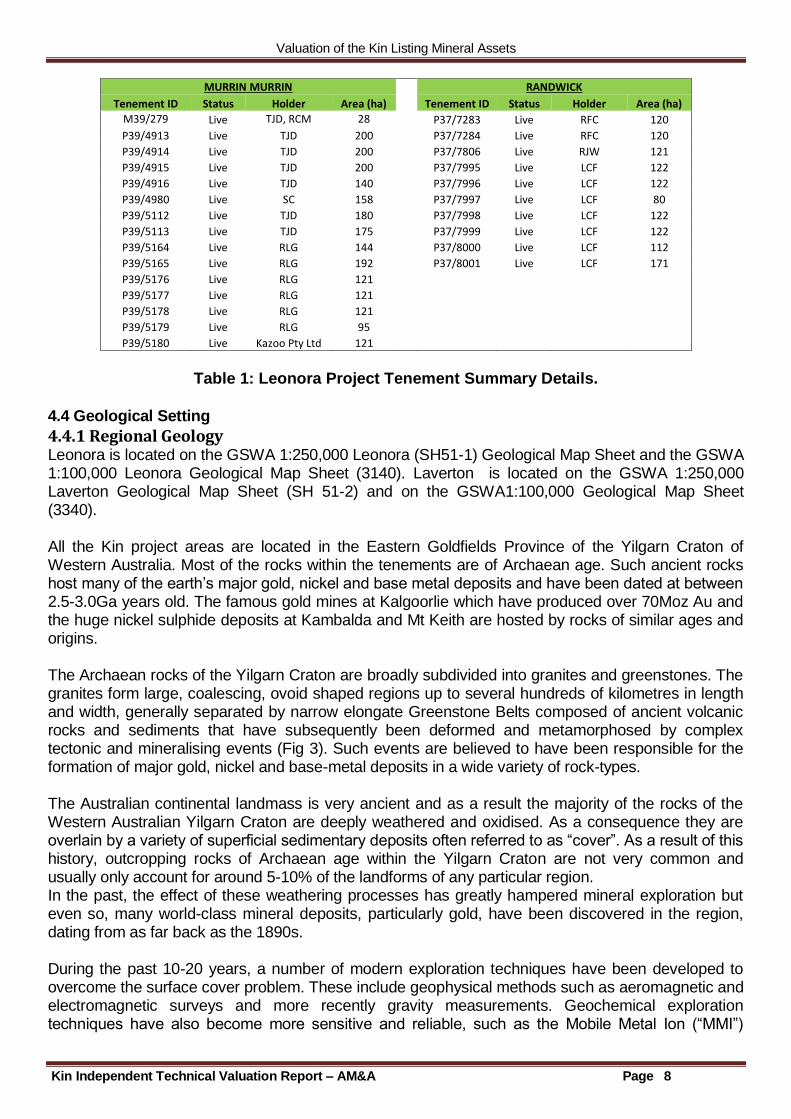
MURRIN MURRIN
RANDWICK
Tenement ID Status Holder Area (ha)
Tenement ID Status Holder Area (ha)
M39/279 Live TJD, RCM 28
P37/7283 Live RFC 120
P39/4913 Live TJD 200
P37/7284 Live RFC 120
P39/4914 Live TJD 200
P37/7806 Live RJW 121
P39/4915 Live TJD 200
P37/7995 Live LCF 122
P39/4916 Live TJD 140
P37/7996 Live LCF 122
P39/4980 Live SC 158
P37/7997 Live LCF 80
P39/5112 Live TJD 180
P37/7998 Live LCF 122
P39/5113 Live TJD 175
P37/7999 Live LCF 122
P39/5164 Live RLG 144
P37/8000 Live LCF 112
P39/5165 Live RLG 192
P37/8001 Live LCF 171
P39/5176 Live RLG 121 P39/5177 Live RLG 121 P39/5178 Live RLG 121
P39/5179 Live RLG 95
P39/5180 Live Kazoo Pty Ltd 121
Table 1: Leonora Project Tenement Summary Details.
4.4 Geological Setting
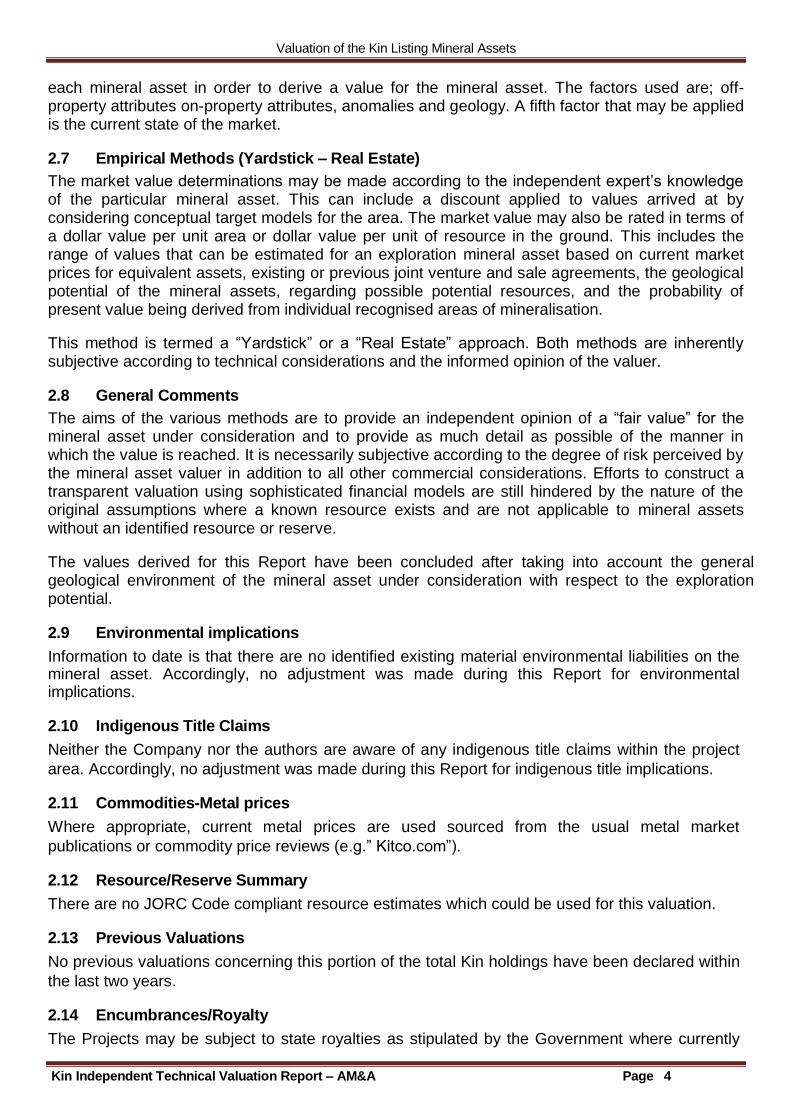
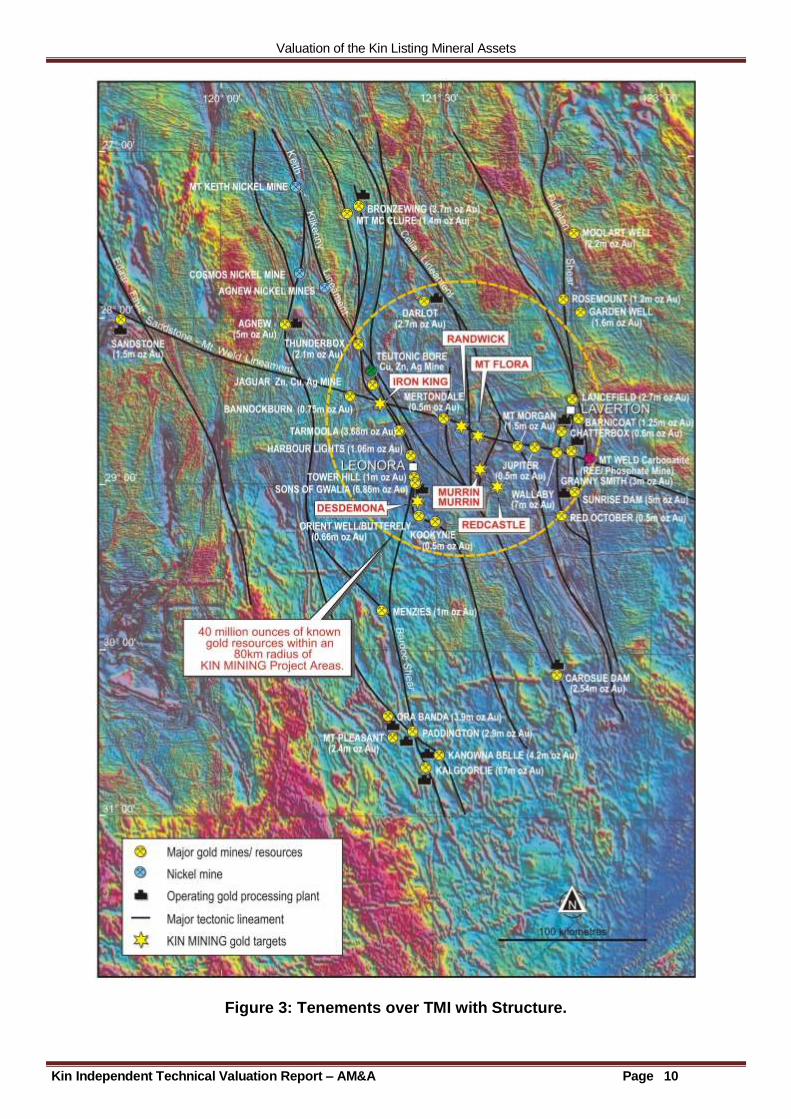
4.4.1 Regional Geology Leonora is located on the GSWA 1:250,000 Leonora (SH51-1) Geological Map Sheet and the GSWA 1:100,000 Leonora Geological Map Sheet (3140). Laverton is located on the GSWA 1:250,000 Laverton Geological Map Sheet (SH 51-2) and on the GSWA1:100,000 Geological Map Sheet (3340). All the Kin project areas are located in the Eastern Goldfields Province of the Yilgarn Craton of Western Australia. Most of the rocks within the tenements are of Archaean age. Such ancient rocks host many of the earth’s major gold, nickel and base metal deposits and have been dated at between 2.5-3.0Ga years old. The famous gold mines at Kalgoorlie which have produced over 70Moz Au and the huge nickel sulphide deposits at Kambalda and Mt Keith are hosted by rocks of similar ages and origins. The Archaean rocks of the Yilgarn Craton are broadly subdivided into granites and greenstones. The granites form large, coalescing, ovoid shaped regions up to several hundreds of kilometres in length and width, generally separated by narrow elongate Greenstone Belts composed of ancient volcanic rocks and sediments that have subsequently been deformed and metamorphosed by complex tectonic and mineralising events (Fig 3). Such events are believed to have been responsible for the formation of major gold, nickel and base-metal deposits in a wide variety of rock-types. The Australian continental landmass is very ancient and as a result the majority of the rocks of the Western Australian Yilgarn Craton are deeply weathered and oxidised. As a consequence they are overlain by a variety of superficial sedimentary deposits often referred to as “cover”. As a result of this history, outcropping rocks of Archaean age within the Yilgarn Craton are not very common and usually only account for around 5-10% of the landforms of any particular region. In the past, the effect of these weathering processes has greatly hampered mineral exploration but even so, many world-class mineral deposits, particularly gold, have been discovered in the region, dating from as far back as the 1890s. During the past 10-20 years, a number of modern exploration techniques have been developed to overcome the surface cover problem. These include geophysical methods such as aeromagnetic and electromagnetic surveys and more recently gravity measurements. Geochemical exploration techniques have also become more sensitive and reliable, such as the Mobile Metal Ion (“MMI”)
Valuation of the Kin Listing Mineral Assets
Kin Independent Technical Valuation Report – AM&A Page 9
technique. In addition, modern drilling methods have allowed areas that are obscured by regolith to be assessed more easily and economically by targeted exploration. In the Leonora-Laverton region, several world-class “blind” ore-bodies have been discovered under alluvial cover during the past decade. These include the Wallaby gold deposit (7.1Moz Au), the Thunderbox gold discovery (2.1Moz Au) and the Cosmos nickel deposit (around 1Mt at 8% Ni). The potential for further such discoveries in the region remains high and the disposition of the tenement package reflects this philosophy.
4.4.2 Mineralisation The Leonora-Laverton region is second only to the Kalgoorlie-Kambalda region in Western Australia for its number and size of economic gold and nickel deposits. Within an 80km radius of the Randwick Project area, known gold endowment (including historic production), totals approximately 40Moz with nine deposits containing in excess of 1Moz Au; including two deposits in excess of 5Moz. There are five operating gold treatment plants within the same area as well as the Glencore International plc (“Glencore”) Ni-Co laterite mine and pressure acid leach processing plant at Murrin Murrin. Gold mineralisation occurs within a variety of rock types and appears to be primarily controlled by tectonic features (faults and shear zones) rather than by lithological considerations. In contrast, both sulphide and lateritic nickel mineralisation are confined specifically to ultramafic rocks. Nickel sulphide deposits may be of the massive type (e.g. Cosmos and Rocky’s Reward) or disseminated (such as Mt Keith and Agnew). The lateritic nickel deposits now being exploited by Glencore at Murrin Murrin are formed by the weathering and near-surface enrichment of ultramafic rocks into nickeliferous clays and silicates. Such deposits commonly grade 0.8 - 1.2% Ni and are usually cobalt-rich (0.06-0.10% Co). Recent deeper drilling has confirmed the existence of nickel and cobalt rich massive sulphides directly beneath these lateritic deposits. Copper, zinc and silver deposits associated with felsic to intermediate volcanics and sediments have been exploited at several locations close to the Murrin Murrin Project during the early 1900s. These were small but rich mines similar to the larger Teutonic Bore deposit, 55km north of Leonora, mined by Seltrust/BP Minerals between 1978-1985 and the high grade Jaguar Zn-Cu-Ag deposit currently being mined underground by the Independence Group (ASX: IGO).
Valuation of the Kin Listing Mineral Assets
Kin Independent Technical Valuation Report – AM&A Page 10
Figure 3: Tenements over TMI with Structure.
Valuation of the Kin Listing Mineral Assets
Kin Independent Technical Valuation Report – AM&A Page 11
4.5 Major Projects
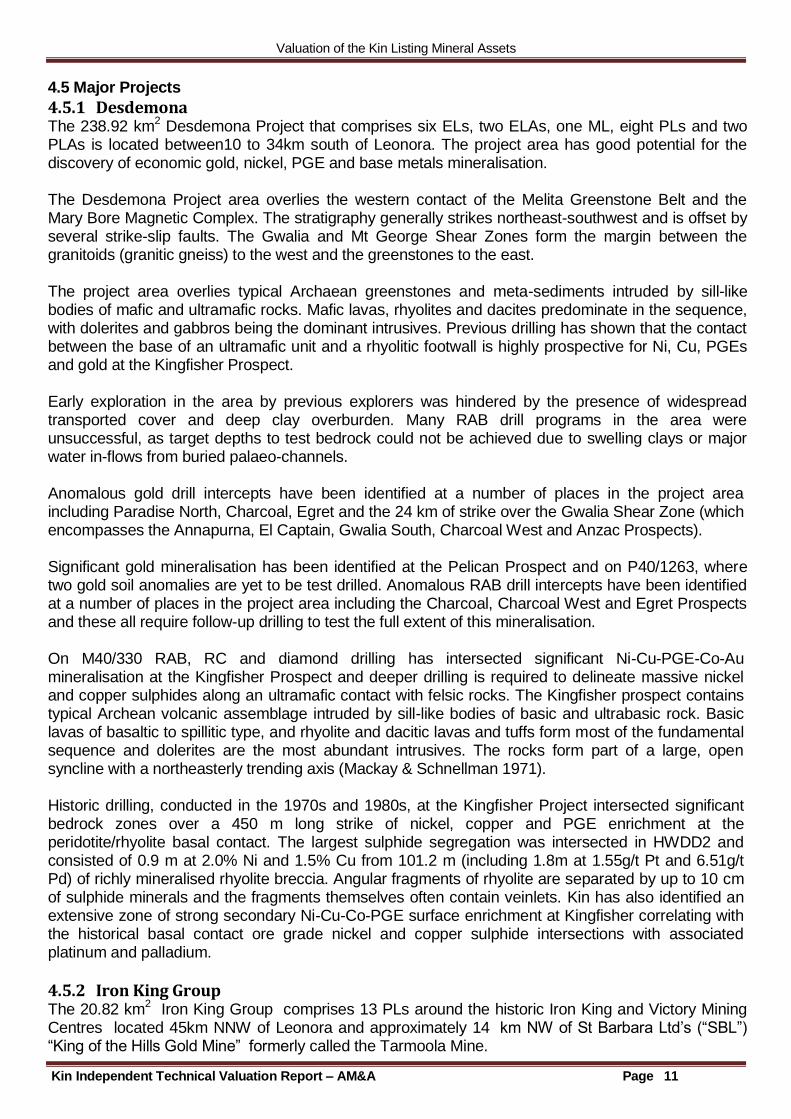
4.5.1 Desdemona The 238.92 km2 Desdemona Project that comprises six ELs, two ELAs, one ML, eight PLs and two PLAs is located between10 to 34km south of Leonora. The project area has good potential for the discovery of economic gold, nickel, PGE and base metals mineralisation. The Desdemona Project area overlies the western contact of the Melita Greenstone Belt and the Mary Bore Magnetic Complex. The stratigraphy generally strikes northeast-southwest and is offset by several strike-slip faults. The Gwalia and Mt George Shear Zones form the margin between the granitoids (granitic gneiss) to the west and the greenstones to the east. The project area overlies typical Archaean greenstones and meta-sediments intruded by sill-like bodies of mafic and ultramafic rocks. Mafic lavas, rhyolites and dacites predominate in the sequence, with dolerites and gabbros being the dominant intrusives. Previous drilling has shown that the contact between the base of an ultramafic unit and a rhyolitic footwall is highly prospective for Ni, Cu, PGEs and gold at the Kingfisher Prospect. Early exploration in the area by previous explorers was hindered by the presence of widespread transported cover and deep clay overburden. Many RAB drill programs in the area were unsuccessful, as target depths to test bedrock could not be achieved due to swelling clays or major water in-flows from buried palaeo-channels. Anomalous gold drill intercepts have been identified at a number of places in the project area including Paradise North, Charcoal, Egret and the 24 km of strike over the Gwalia Shear Zone (which encompasses the Annapurna, El Captain, Gwalia South, Charcoal West and Anzac Prospects). Significant gold mineralisation has been identified at the Pelican Prospect and on P40/1263, where two gold soil anomalies are yet to be test drilled. Anomalous RAB drill intercepts have been identified at a number of places in the project area including the Charcoal, Charcoal West and Egret Prospects and these all require follow-up drilling to test the full extent of this mineralisation. On M40/330 RAB, RC and diamond drilling has intersected significant Ni-Cu-PGE-Co-Au mineralisation at the Kingfisher Prospect and deeper drilling is required to delineate massive nickel and copper sulphides along an ultramafic contact with felsic rocks. The Kingfisher prospect contains typical Archean volcanic assemblage intruded by sill-like bodies of basic and ultrabasic rock. Basic lavas of basaltic to spillitic type, and rhyolite and dacitic lavas and tuffs form most of the fundamental sequence and dolerites are the most abundant intrusives. The rocks form part of a large, open syncline with a northeasterly trending axis (Mackay & Schnellman 1971). Historic drilling, conducted in the 1970s and 1980s, at the Kingfisher Project intersected significant bedrock zones over a 450 m long strike of nickel, copper and PGE enrichment at the peridotite/rhyolite basal contact. The largest sulphide segregation was intersected in HWDD2 and consisted of 0.9 m at 2.0% Ni and 1.5% Cu from 101.2 m (including 1.8m at 1.55g/t Pt and 6.51g/t Pd) of richly mineralised rhyolite breccia. Angular fragments of rhyolite are separated by up to 10 cm of sulphide minerals and the fragments themselves often contain veinlets. Kin has also identified an extensive zone of strong secondary Ni-Cu-Co-PGE surface enrichment at Kingfisher correlating with the historical basal contact ore grade nickel and copper sulphide intersections with associated platinum and palladium.
4.5.2 Iron King Group The 20.82 km2 Iron King Group comprises 13 PLs around the historic Iron King and Victory Mining Centres located 45km NNW of Leonora and approximately 14 km NW of St Barbara Ltd’s (“SBL”) “King of the Hills Gold Mine” formerly called the Tarmoola Mine.
Valuation of the Kin Listing Mineral Assets
Kin Independent Technical Valuation Report – AM&A Page 12
The leases overlie a highly deformed and complex Archaean greenstone sequence intruded by numerous granitic and porphyry intrusions and Proterozoic mafic dykes. The Iron King area lies directly along the NNW trending Gwalia Shear Zone (“GSZ”) that hosts the Sons of Gwalia Mine (6.86Moz Au) and the “King of the Hills” formerly Tarmoola Gold Mine (3.68Moz Au). Gold endowment along the 35km long stretch of the (“GSZ”) linking these two major gold mines has been estimated to total 13.04 Moz Au. A small open-cut gold mine operated at Iron King during 1981-85 produced 253.85oz of gold from 1,161t at 6.8g/t Au. A major gossan occurs on the eastern side of P37/7195 at Iron King. This gossan represents a potential major base metal and/or gold target that has never been effectively drill tested. There are several high grade historic gold mines that represent immediate walk up drill targets. Recent sampling of the Mullock dumps at the Reeds United workings returned up to 25.7g/t Au and the Crystal Ridge Prospect presents a walk up drill target where the best historic drill intercept is 46 m at 1.8g/t Au. In addition there are twelve gold and base metals prospects delineated within the project area.
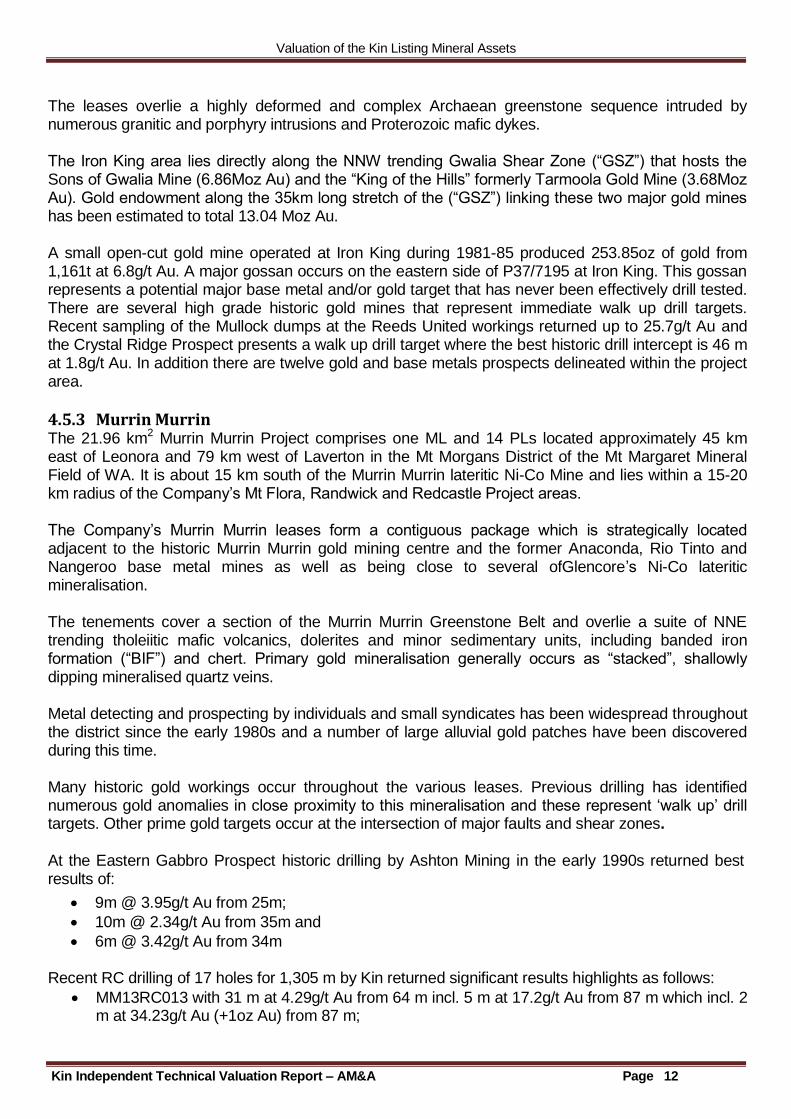
4.5.3 Murrin Murrin The 21.96 km2 Murrin Murrin Project comprises one ML and 14 PLs located approximately 45 km east of Leonora and 79 km west of Laverton in the Mt Morgans District of the Mt Margaret Mineral Field of WA. It is about 15 km south of the Murrin Murrin lateritic Ni-Co Mine and lies within a 15-20 km radius of the Company’s Mt Flora, Randwick and Redcastle Project areas. The Company’s Murrin Murrin leases form a contiguous package which is strategically located adjacent to the historic Murrin Murrin gold mining centre and the former Anaconda, Rio Tinto and Nangeroo base metal mines as well as being close to several ofGlencore’s Ni-Co lateritic mineralisation. The tenements cover a section of the Murrin Murrin Greenstone Belt and overlie a suite of NNE trending tholeiitic mafic volcanics, dolerites and minor sedimentary units, including banded iron formation (“BIF”) and chert. Primary gold mineralisation generally occurs as “stacked”, shallowly dipping mineralised quartz veins. Metal detecting and prospecting by individuals and small syndicates has been widespread throughout the district since the early 1980s and a number of large alluvial gold patches have been discovered during this time. Many historic gold workings occur throughout the various leases. Previous drilling has identified numerous gold anomalies in close proximity to this mineralisation and these represent ‘walk up’ drill targets. Other prime gold targets occur at the intersection of major faults and shear zones. At the Eastern Gabbro Prospect historic drilling by Ashton Mining in the early 1990s returned best results of:
9m @ 3.95g/t Au from 25m;
10m @ 2.34g/t Au from 35m and
6m @ 3.42g/t Au from 34m Recent RC drilling of 17 holes for 1,305 m by Kin returned significant results highlights as follows:
MM13RC013 with 31 m at 4.29g/t Au from 64 m incl. 5 m at 17.2g/t Au from 87 m which incl. 2 m at 34.23g/t Au (+1oz Au) from 87 m;
Valuation of the Kin Listing Mineral Assets
Kin Independent Technical Valuation Report – AM&A Page 13
MM13RC17 with 8 m @ 3.52g/t Au from 28 m (supergene zone) incl. 2 m at 12.94g/t Au from 29 m.
4.5.4 Redcastle The 24.8 km2 Redcastle Project comprises 15 PLs situated immediately northeast of the historic Redcastle Mining Centre located about 64km east of Leonora within the Murrin Murrin District of the Mt Margaret Mineral Field of WA. The project area covers a NW trending sequence of tholeiitic mafic volcanics, dolerites and gabbro which are intruded by porphyry intrusives. Primary gold mineralisation is hosted by quartz vein stockworks within intensely altered quartz-dolerites and controlled by numerous NW trending, generally NE dipping fault zones. Metal detecting and prospecting has been widespread in the district since the early 1980s and has resulted in the discovery of some large and spectacular gold nuggets. There are eight groups of historic hard rock workings including Bellbird, which returned a recent rock chip sample of 5.29g/t Au and 0.62% Cu. The best historic drill intercept in the area is RR205 with 2 m at 15.3g/t Au from 20m. Recent geological interpretation work by Kin has highlighted the high prospectivity of the project area. The Company has identified numerous high priority exploration targets on the basis of strong alteration associated with favourable structural intersections associated with granitic intrusions.
4.5.5 Mt Flora The 22.71 km2 Mt Flora Gold-Nickel Project comprises 13 PLs located 45 km NE of Leonora and 7 km NW of the Glencore Ni-Co laterite Mine and processing plant at Murrin Murrin within the Mt Morgans District of the Mt Margaret Mineral Field of WA. The project area covers a sequence of tightly folded NNE trending greenstones which are comprised of tholeiitic mafic volcanics, high-magnesian basalt, BIF, ultramafic rocks and a variety of mafic intrusives. The greenstones in the south of the project area have been tightly folded into the NNE trending Mt Flora Syncline which is bounded by the similarly trending Federation and Sligo Creek Faults. Lateritised ultramafic units occur just east of United Bore and also near Christmas Well and represent Ni-Co laterite targets. The project area covers numerous historic gold workings associated with the intersection of the NNE trending Federation and Sligo Creek Faults with the WNW trending Randwick Fault. Historic drilling by Terrain Minerals in the vicinity of White Shaft gave a best intersection of 2 m at 15.3 g/t Au which was never followed up. Recent rock chip sampling at Mt Flora returned up to 115.98g/t Au, 50g/t Ag and 0.68% Pb. Approval for reconnaissance drilling has been received from the Department of Mines and Petroleum.
4.5.6 Randwick The 12.1 km2 Randwick Gold Project comprises 10 PLs located just north of the historic Randwick Mining Centre, approximately 45 km NE of Leonora and 75 km west of Laverton within the Malcolm District of the Mt Margaret Mineral Field of WA. The project area overlies the Randwick Fault which forms part of the Sandstone-Mt Weld Lineament (“SMWL”). This lineament constitutes an important structural control for gold mineralisation in the region. The project area covers a sequence of folded and faulted Archaean greenstones close to the contact with granitic rocks of the intrusive Nambi Batholith to the north.
Valuation of the Kin Listing Mineral Assets
Kin Independent Technical Valuation Report – AM&A Page 14
Gold mineralisation in the general Randwick area is mainly hosted by quartz veins which occur within a variety of rock types. The leases cover numerous historic gold workings at the intersection of the north-south trending Pearl Shell Fault (part of the SMWL). The historic high-grade Golden Chain Mine (97.65g/t Au) is in the centre of the project area within P37/7997 and a highly prospective auriferous palaeo-channel has also been identified south of the mine. The Company has identified a number of significant gold targets within the project area.
4.6 Exploration Potential
The Kin exploration philosophy is to initially gain an understanding of the structural controls of the known mineral deposits of the region. The smaller, higher-grade gold and nickel deposits may be developed profitably and possibly quite quickly. A preliminary structural geological appraisal of the district identified a number of high-quality targets that are not associated with historical workings or known mineral occurrences. These targets have been developed over many years by a combination of very detailed geological mapping and geophysical interpretation. Many of the major targets identified occur below cover in areas of deeply buried Archaean bedrock, for example Desdemona. Most of these targets have had very little or no exploration carried out over them to date, although they are often close to areas of previous investigation. From interpretation of aeromagnetic surveys, Kin has identified the major SMWL as a subtle tectonic lineament trending in a WNW direction through the district that is interpreted to have had a major controlling influence on gold mineralisation. The SMWL is a craton-scale aeromagnetic trend which links the rare earths-rich carbonatite at Mt Weld, south of Laverton to the historic high-grade gold deposits at Sandstone. Between Mt Weld and Sandstone, the Wallaby gold deposit (7.1Moz Au) and the historic Mt Morgans Gold Mine (1.5Moz Au) occur along this lineament, as do the smaller abandoned Jupiter and Mertondale open-cut gold mines. The Granny Smith Gold Mine also lies very close to this trend, as does the Bannockburn Gold Mine 60km NW of Leonora. The Iron King Group and Mt Flora Project Areas are associated with magnetic anomalies lying directly on this lineament and the Randwick Project area is adjacent to the northern side of this trend. The Iron King Group is also directly along the NNW trending GSZ that hosts the Sons of Gwalia Mine (6.86Moz Au) and the King of the Hills Gold Mine (3.68Moz Au). The “Little Pete” gold and base-metal target within the Iron King leases is located at the intersection of the Gwalia Shear and the SMWL and is associated with a major untested gossanous zone within felsic volcanics.
At Redcastle, the major gold targets are located within highly altered and sheared mafic rocks intruded by granites at the core of the regional Redcastle Anticline. Previous shallow drilling at Redcastle has identified high-grade gold mineralisation associated with old workings (RR205 with 2 m at 15.3g/t Au from 20 m including 1 m at 23.6g/t Au from 20 m). This mineralisation is open along strike and at depth and will be a priority target for early follow-up and deeper RC drilling. Significant RAB and RC drill intersections have also been returned from previous gold exploration at Murrin Murrin, Iron King and Desdemona project areas. Many of these intersections are open at depth or along strike and present immediate targets for future exploration programs.
Valuation of the Kin Listing Mineral Assets
Kin Independent Technical Valuation Report – AM&A Page 15
At the Desdemona Project two aeromagnetic high targets have both returned encouraging results from previous drilling. There is potential for the discovery of significant gold and possibly Ni-Cu-Co-PGE mineralisation on KIN tenements.
5.0 Valuation of the Projects
When valuing any mineral asset/project it is important to consider as many factors as possible that may either assist or impinge upon the current cash value estimates of the mineral asset/project under consideration. In this Report AM&A considers that the primary features to be taken into account are the Mineral Licence Security; Sovereign Risk; Available Infrastructure; Relevant Expenditure and the general geological setting.
Basically, these “Boxes are Ticked” as described above with regards to mineral licence security, convenient infrastructure, previous mining and favourable geological environment.
5.1 Selection of Valuation Methods
The following valuation methods, as described in section 2, are not considered applicable for the respective reasons provided:
The Discounted Cash Flow method cannot be used for the Project as the lack of resource estimates precludes a DCF;
The Kilburn ‘prospectivity’ method - as the range of values generated is typically too wide to be realistic;
Comparable transactions – with the recent general demise of the exploration industry this has curtailed much activity so no similar relevant transactions could be located.
Real estate value which is usually based on a value ascribed to varying areas of tenement holdings which may consequently become unrealistic and,
Empirical rule of thumb or yardstick approach which relies on resources or reserves with an insitu value assigned; at the Leonora projects no resource estimates have yet have been undertaken.
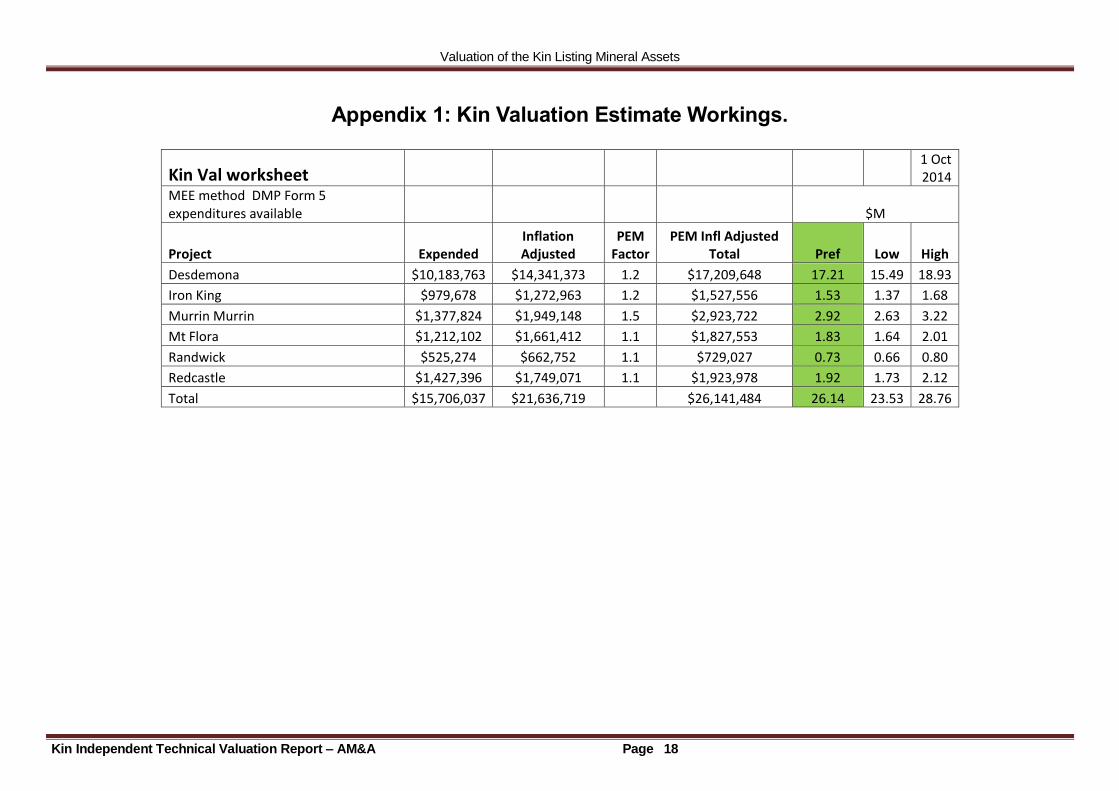
Accordingly the MEE method has been adapted as the basis for the estimation of the value and its ranges at the Leonora listing Project. For the purposes of this report AM&A considers that the MEE method is the most applicable. 5.2 Valuation - MEE Method The MEE Method was selected as the main basis for the valuation. Previous Form 5 expenditures to the DMP were checked on line and accepted; the total was then subjected to PEM factors that range from 1.1 to1.5.These PEM factors was selected to reflect the positive prospectivity of each project area. Finally a range of values was achieved by applying ±10% to the accepted preferred expenditure to produce a low and a high range of value. The results of this determination are summarised in Appendix 1.
Valuation of the Kin Listing Mineral Assets
Kin Independent Technical Valuation Report – AM&A Page 16
5.3 Valuation Conclusions
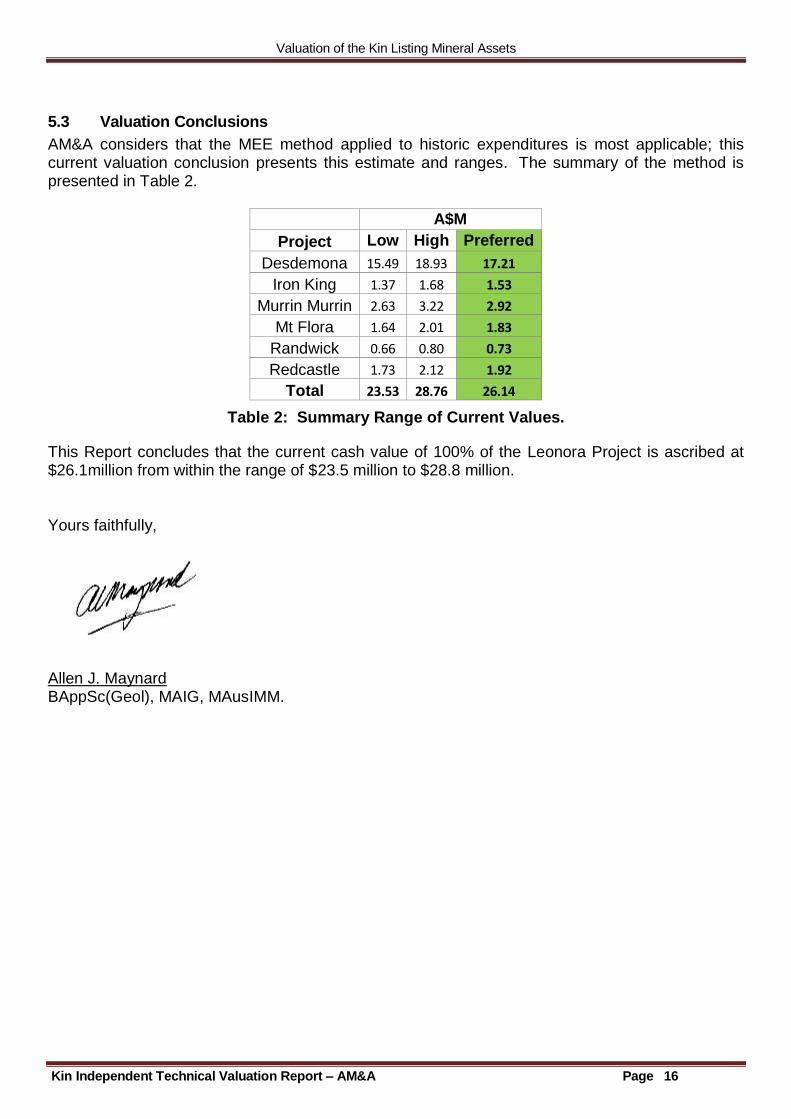
AM&A considers that the MEE method applied to historic expenditures is most applicable; this current valuation conclusion presents this estimate and ranges. The summary of the method is presented in Table 2.
A$M
Project Low High Preferred
Desdemona 15.49 18.93 17.21
Iron King 1.37 1.68 1.53
Murrin Murrin 2.63 3.22 2.92
Mt Flora 1.64 2.01 1.83
Randwick 0.66 0.80 0.73
Redcastle 1.73 2.12 1.92
Total 23.53 28.76 26.14
Table 2: Summary Range of Current Values.
This Report concludes that the current cash value of 100% of the Leonora Project is ascribed at $26.1million from within the range of $23.5 million to $28.8 million. Yours faithfully,
Allen J. Maynard BAppSc(Geol), MAIG, MAusIMM.
Valuation of the Kin Listing Mineral Assets
Kin Independent Technical Valuation Report – AM&A Page 17
6.0 References AusIMM, (2004): "Australasian Code for Reporting of Mineral Resources and Ore Reserves (JORC Code), prepared by the Joint Ore Reserves Committee (JORC) of the AusIMM, the Australian Institute of Geoscientists (AIG) and the Minerals Council of Australia (MCA), effective December 2004. AusIMM. (2005): "Code for the Technical Assessment and Valuation of Mineral and Petroleum Assets and Securities for Independent Expert Reports (the VALMIN Code)" 2005 Edition. ClM, (2003): - "Standards and Guidelines for Valuation of Mineral Properties. Final Version, February 2003". Special Committee of the Canadian Institute of Mining, Metallurgy and Petroleum on Valuation of Mineral Properties (CIMVAL). Kilburn, LC, 1990: "Valuation of Mineral Properties which do not contain Exploitable Reserves" CIM Bulletin, August 1990. Kin Minerals Ltd: Annual Reports 2012 – 2014, Quarterly Reports, 2012-2014 and their website. Phillips, G.N., 1985:- Interpretation of Big Bell / Hemlo-type Gold Deposits Precursors, Metamorphism, Melting and Genetic Constrains. Transactions of the Geological Society of South Africa, 88, p159-173 Oxford Dictionary of Current English; for any terms not covered in the Glossary: Oxford University Press Rudenno, (1998): "The Mining Valuation Handbook". Watkins, K.P., Tyler, I.M. & Hickman, A.H 1983:- Explanatory Notes for the Cue 1:250,000 Geological Sheet SG50-15. Geol Survey WA, Record 1983/6. Watkins, K.P, and. Hickman A.H; 1990:- The geological evolution and mineralisation of the Murchison Province; Geological Survey of Western Australia Bulletin 137. Woodward, H.P, :1914:- A geological reconnaissance of a portion of the Murchison Goldfield, geological Survey of Western Australia bulletin 57 and annual expenditure/reporting schedule.
Valuation of the Kin Listing Mineral Assets
Kin Independent Technical Valuation Report – AM&A Page 18
Appendix 1: Kin Valuation Estimate Workings.
Kin Val worksheet 1 Oct 2014
MEE method DMP Form 5 expenditures available $M
Project Expended Inflation Adjusted
PEM Factor
PEM Infl Adjusted Total Pref Low High
Desdemona $10,183,763 $14,341,373 1.2 $17,209,648 17.21 15.49 18.93
Iron King $979,678 $1,272,963 1.2 $1,527,556 1.53 1.37 1.68
Murrin Murrin $1,377,824 $1,949,148 1.5 $2,923,722 2.92 2.63 3.22
Mt Flora $1,212,102 $1,661,412 1.1 $1,827,553 1.83 1.64 2.01
Randwick $525,274 $662,752 1.1 $729,027 0.73 0.66 0.80
Redcastle $1,427,396 $1,749,071 1.1 $1,923,978 1.92 1.73 2.12
Total $15,706,037 $21,636,719 $26,141,484 26.14 23.53 28.76
Valuation of the Kin Listing Mineral Assets
Kin Independent Technical Valuation Report – AM&A Page 19
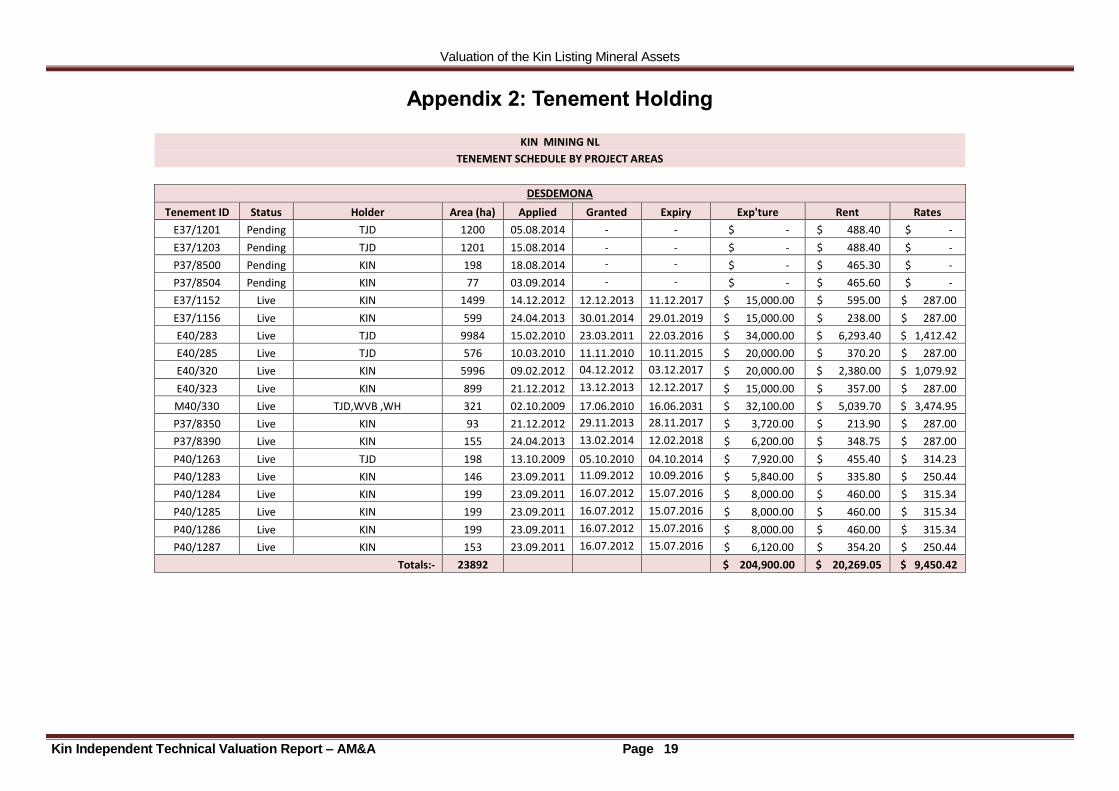
Appendix 2: Tenement Holding
KIN MINING NL
TENEMENT SCHEDULE BY PROJECT AREAS
DESDEMONA
Tenement ID Status Holder Area (ha) Applied Granted Expiry Exp'ture Rent Rates
E37/1201 Pending TJD 1200 05.08.2014 - - $ - $ 488.40 $ -
E37/1203 Pending TJD 1201 15.08.2014 - - $ - $ 488.40 $ -
P37/8500 Pending KIN 198 18.08.2014 - - $ - $ 465.30 $ -
P37/8504 Pending KIN 77 03.09.2014 - - $ - $ 465.60 $ -
E37/1152 Live KIN 1499 14.12.2012 12.12.2013 11.12.2017 $ 15,000.00 $ 595.00 $ 287.00
E37/1156 Live KIN 599 24.04.2013 30.01.2014 29.01.2019 $ 15,000.00 $ 238.00 $ 287.00
E40/283 Live TJD 9984 15.02.2010 23.03.2011 22.03.2016 $ 34,000.00 $ 6,293.40 $ 1,412.42
E40/285 Live TJD 576 10.03.2010 11.11.2010 10.11.2015 $ 20,000.00 $ 370.20 $ 287.00
E40/320 Live KIN 5996 09.02.2012 04.12.2012 03.12.2017 $ 20,000.00 $ 2,380.00 $ 1,079.92
E40/323 Live KIN 899 21.12.2012 13.12.2013 12.12.2017 $ 15,000.00 $ 357.00 $ 287.00
M40/330 Live TJD,WVB ,WH 321 02.10.2009 17.06.2010 16.06.2031 $ 32,100.00 $ 5,039.70 $ 3,474.95
P37/8350 Live KIN 93 21.12.2012 29.11.2013 28.11.2017 $ 3,720.00 $ 213.90 $ 287.00
P37/8390 Live KIN 155 24.04.2013 13.02.2014 12.02.2018 $ 6,200.00 $ 348.75 $ 287.00
P40/1263 Live TJD 198 13.10.2009 05.10.2010 04.10.2014 $ 7,920.00 $ 455.40 $ 314.23
P40/1283 Live KIN 146 23.09.2011 11.09.2012 10.09.2016 $ 5,840.00 $ 335.80 $ 250.44
P40/1284 Live KIN 199 23.09.2011 16.07.2012 15.07.2016 $ 8,000.00 $ 460.00 $ 315.34
P40/1285 Live KIN 199 23.09.2011 16.07.2012 15.07.2016 $ 8,000.00 $ 460.00 $ 315.34
P40/1286 Live KIN 199 23.09.2011 16.07.2012 15.07.2016 $ 8,000.00 $ 460.00 $ 315.34
P40/1287 Live KIN 153 23.09.2011 16.07.2012 15.07.2016 $ 6,120.00 $ 354.20 $ 250.44
Totals:- 23892 $ 204,900.00 $ 20,269.05 $ 9,450.42
Valuation of the Kin Listing Mineral Assets
Kin Independent Technical Valuation Report – AM&A Page 20
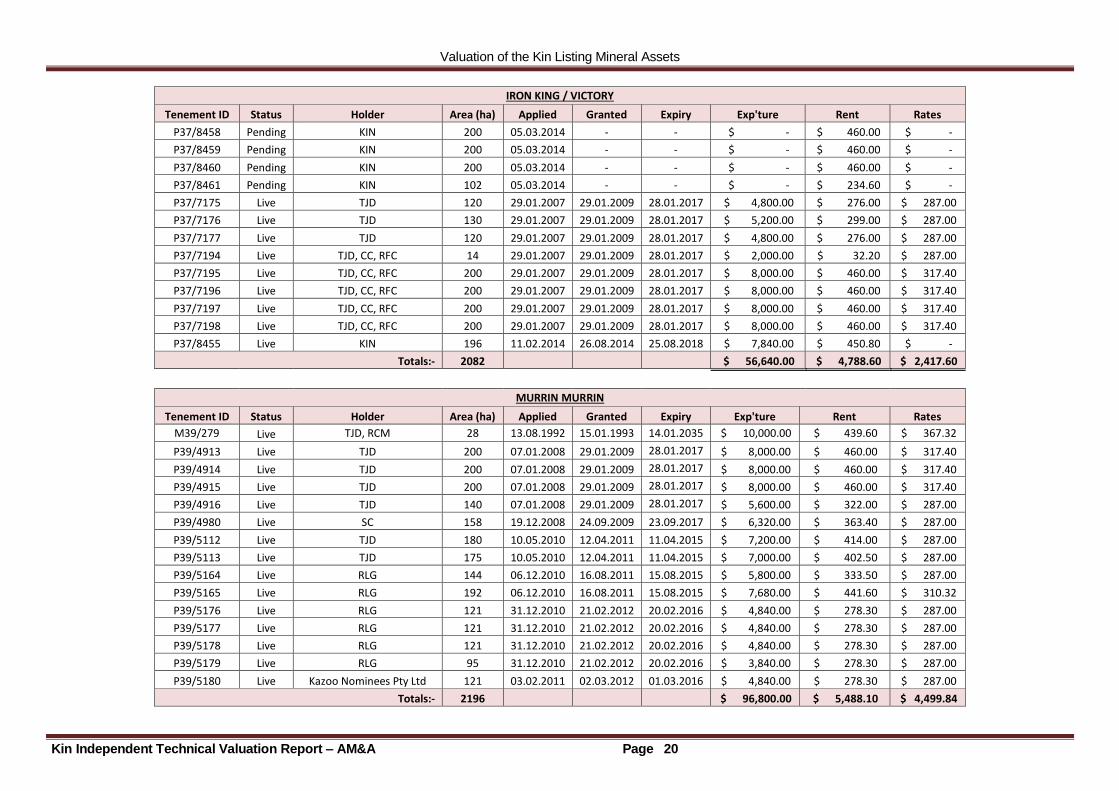
IRON KING / VICTORY
Tenement ID Status Holder Area (ha) Applied Granted Expiry Exp'ture Rent Rates
P37/8458 Pending KIN 200 05.03.2014 - - $ - $ 460.00 $ -
P37/8459 Pending KIN 200 05.03.2014 - - $ - $ 460.00 $ -
P37/8460 Pending KIN 200 05.03.2014 - - $ - $ 460.00 $ -
P37/8461 Pending KIN 102 05.03.2014 - - $ - $ 234.60 $ -
P37/7175 Live TJD 120 29.01.2007 29.01.2009 28.01.2017 $ 4,800.00 $ 276.00 $ 287.00
P37/7176 Live TJD 130 29.01.2007 29.01.2009 28.01.2017 $ 5,200.00 $ 299.00 $ 287.00
P37/7177 Live TJD 120 29.01.2007 29.01.2009 28.01.2017 $ 4,800.00 $ 276.00 $ 287.00
P37/7194 Live TJD, CC, RFC 14 29.01.2007 29.01.2009 28.01.2017 $ 2,000.00 $ 32.20 $ 287.00
P37/7195 Live TJD, CC, RFC 200 29.01.2007 29.01.2009 28.01.2017 $ 8,000.00 $ 460.00 $ 317.40
P37/7196 Live TJD, CC, RFC 200 29.01.2007 29.01.2009 28.01.2017 $ 8,000.00 $ 460.00 $ 317.40
P37/7197 Live TJD, CC, RFC 200 29.01.2007 29.01.2009 28.01.2017 $ 8,000.00 $ 460.00 $ 317.40
P37/7198 Live TJD, CC, RFC 200 29.01.2007 29.01.2009 28.01.2017 $ 8,000.00 $ 460.00 $ 317.40
P37/8455 Live KIN 196 11.02.2014 26.08.2014 25.08.2018 $ 7,840.00 $ 450.80 $ -
Totals:- 2082 $ 56,640.00 $ 4,788.60 $ 2,417.60
MURRIN MURRIN
Tenement ID Status Holder Area (ha) Applied Granted Expiry Exp'ture Rent Rates
M39/279 Live TJD, RCM 28 13.08.1992 15.01.1993 14.01.2035 $ 10,000.00 $ 439.60 $ 367.32
P39/4913 Live TJD 200 07.01.2008 29.01.2009 28.01.2017 $ 8,000.00 $ 460.00 $ 317.40
P39/4914 Live TJD 200 07.01.2008 29.01.2009 28.01.2017 $ 8,000.00 $ 460.00 $ 317.40
P39/4915 Live TJD 200 07.01.2008 29.01.2009 28.01.2017 $ 8,000.00 $ 460.00 $ 317.40
P39/4916 Live TJD 140 07.01.2008 29.01.2009 28.01.2017 $ 5,600.00 $ 322.00 $ 287.00
P39/4980 Live SC 158 19.12.2008 24.09.2009 23.09.2017 $ 6,320.00 $ 363.40 $ 287.00
P39/5112 Live TJD 180 10.05.2010 12.04.2011 11.04.2015 $ 7,200.00 $ 414.00 $ 287.00
P39/5113 Live TJD 175 10.05.2010 12.04.2011 11.04.2015 $ 7,000.00 $ 402.50 $ 287.00
P39/5164 Live RLG 144 06.12.2010 16.08.2011 15.08.2015 $ 5,800.00 $ 333.50 $ 287.00
P39/5165 Live RLG 192 06.12.2010 16.08.2011 15.08.2015 $ 7,680.00 $ 441.60 $ 310.32
P39/5176 Live RLG 121 31.12.2010 21.02.2012 20.02.2016 $ 4,840.00 $ 278.30 $ 287.00
P39/5177 Live RLG 121 31.12.2010 21.02.2012 20.02.2016 $ 4,840.00 $ 278.30 $ 287.00
P39/5178 Live RLG 121 31.12.2010 21.02.2012 20.02.2016 $ 4,840.00 $ 278.30 $ 287.00
P39/5179 Live RLG 95 31.12.2010 21.02.2012 20.02.2016 $ 3,840.00 $ 278.30 $ 287.00
P39/5180 Live Kazoo Nominees Pty Ltd 121 03.02.2011 02.03.2012 01.03.2016 $ 4,840.00 $ 278.30 $ 287.00
Totals:- 2196 $ 96,800.00 $ 5,488.10 $ 4,499.84
Valuation of the Kin Listing Mineral Assets
Kin Independent Technical Valuation Report – AM&A Page 21
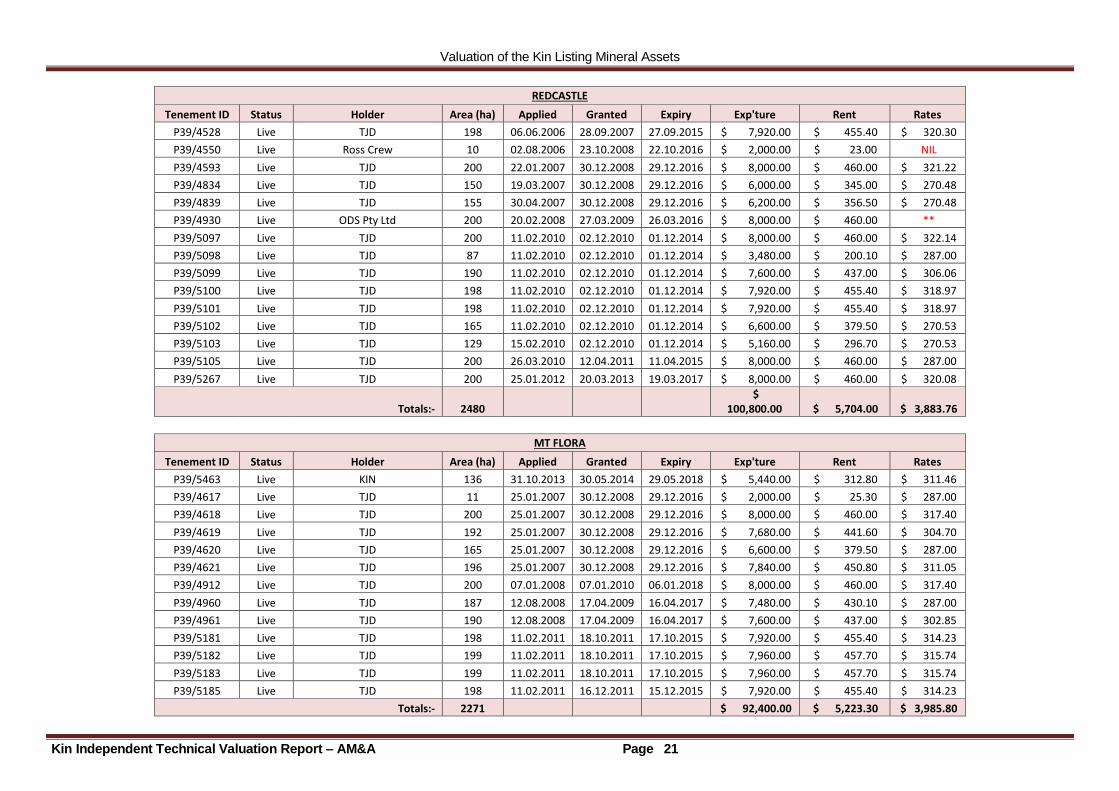
REDCASTLE
Tenement ID Status Holder Area (ha) Applied Granted Expiry Exp'ture Rent Rates
P39/4528 Live TJD 198 06.06.2006 28.09.2007 27.09.2015 $ 7,920.00 $ 455.40 $ 320.30
P39/4550 Live Ross Crew 10 02.08.2006 23.10.2008 22.10.2016 $ 2,000.00 $ 23.00 NIL
P39/4593 Live TJD 200 22.01.2007 30.12.2008 29.12.2016 $ 8,000.00 $ 460.00 $ 321.22
P39/4834 Live TJD 150 19.03.2007 30.12.2008 29.12.2016 $ 6,000.00 $ 345.00 $ 270.48
P39/4839 Live TJD 155 30.04.2007 30.12.2008 29.12.2016 $ 6,200.00 $ 356.50 $ 270.48
P39/4930 Live ODS Pty Ltd 200 20.02.2008 27.03.2009 26.03.2016 $ 8,000.00 $ 460.00 **
P39/5097 Live TJD 200 11.02.2010 02.12.2010 01.12.2014 $ 8,000.00 $ 460.00 $ 322.14
P39/5098 Live TJD 87 11.02.2010 02.12.2010 01.12.2014 $ 3,480.00 $ 200.10 $ 287.00
P39/5099 Live TJD 190 11.02.2010 02.12.2010 01.12.2014 $ 7,600.00 $ 437.00 $ 306.06
P39/5100 Live TJD 198 11.02.2010 02.12.2010 01.12.2014 $ 7,920.00 $ 455.40 $ 318.97
P39/5101 Live TJD 198 11.02.2010 02.12.2010 01.12.2014 $ 7,920.00 $ 455.40 $ 318.97
P39/5102 Live TJD 165 11.02.2010 02.12.2010 01.12.2014 $ 6,600.00 $ 379.50 $ 270.53
P39/5103 Live TJD 129 15.02.2010 02.12.2010 01.12.2014 $ 5,160.00 $ 296.70 $ 270.53
P39/5105 Live TJD 200 26.03.2010 12.04.2011 11.04.2015 $ 8,000.00 $ 460.00 $ 287.00
P39/5267 Live TJD 200 25.01.2012 20.03.2013 19.03.2017 $ 8,000.00 $ 460.00 $ 320.08
Totals:- 2480 $
100,800.00 $ 5,704.00 $ 3,883.76
MT FLORA
Tenement ID Status Holder Area (ha) Applied Granted Expiry Exp'ture Rent Rates
P39/5463 Live KIN 136 31.10.2013 30.05.2014 29.05.2018 $ 5,440.00 $ 312.80 $ 311.46
P39/4617 Live TJD 11 25.01.2007 30.12.2008 29.12.2016 $ 2,000.00 $ 25.30 $ 287.00
P39/4618 Live TJD 200 25.01.2007 30.12.2008 29.12.2016 $ 8,000.00 $ 460.00 $ 317.40
P39/4619 Live TJD 192 25.01.2007 30.12.2008 29.12.2016 $ 7,680.00 $ 441.60 $ 304.70
P39/4620 Live TJD 165 25.01.2007 30.12.2008 29.12.2016 $ 6,600.00 $ 379.50 $ 287.00
P39/4621 Live TJD 196 25.01.2007 30.12.2008 29.12.2016 $ 7,840.00 $ 450.80 $ 311.05
P39/4912 Live TJD 200 07.01.2008 07.01.2010 06.01.2018 $ 8,000.00 $ 460.00 $ 317.40
P39/4960 Live TJD 187 12.08.2008 17.04.2009 16.04.2017 $ 7,480.00 $ 430.10 $ 287.00
P39/4961 Live TJD 190 12.08.2008 17.04.2009 16.04.2017 $ 7,600.00 $ 437.00 $ 302.85
P39/5181 Live TJD 198 11.02.2011 18.10.2011 17.10.2015 $ 7,920.00 $ 455.40 $ 314.23
P39/5182 Live TJD 199 11.02.2011 18.10.2011 17.10.2015 $ 7,960.00 $ 457.70 $ 315.74
P39/5183 Live TJD 199 11.02.2011 18.10.2011 17.10.2015 $ 7,960.00 $ 457.70 $ 315.74
P39/5185 Live TJD 198 11.02.2011 16.12.2011 15.12.2015 $ 7,920.00 $ 455.40 $ 314.23
Totals:- 2271 $ 92,400.00 $ 5,223.30 $ 3,985.80
Valuation of the Kin Listing Mineral Assets
Kin Independent Technical Valuation Report – AM&A Page 22
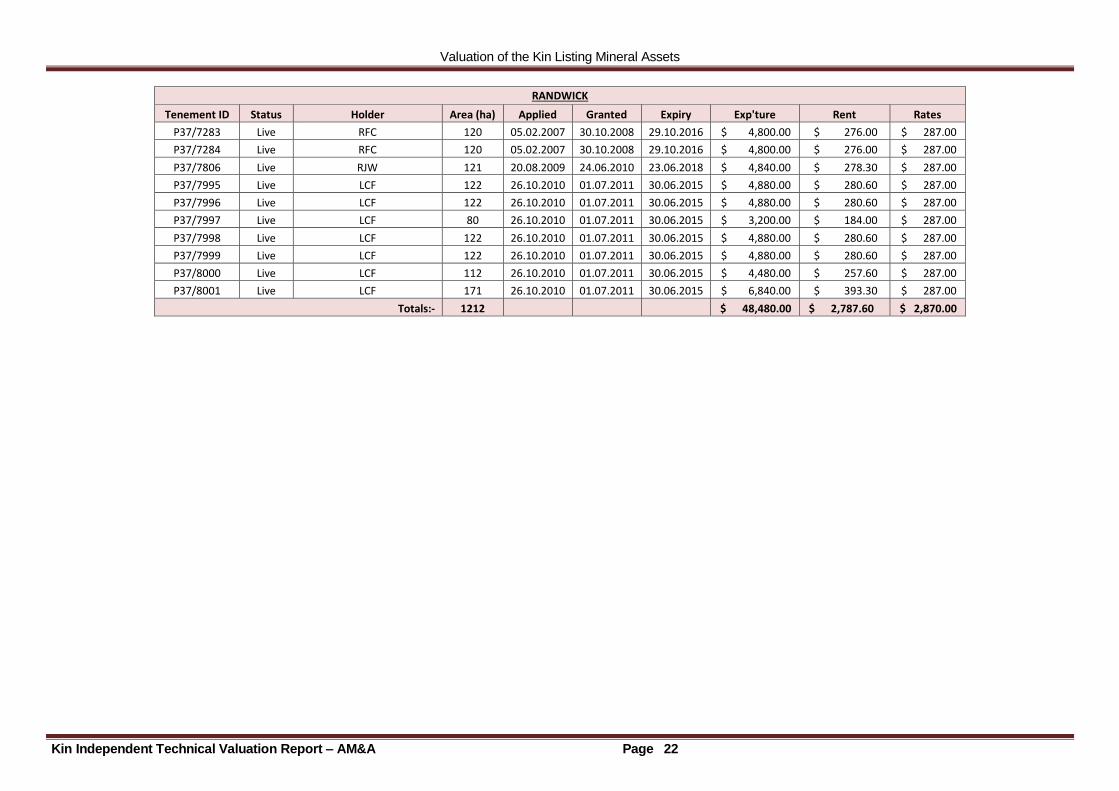
RANDWICK
Tenement ID Status Holder Area (ha) Applied Granted Expiry Exp'ture Rent Rates
P37/7283 Live RFC 120 05.02.2007 30.10.2008 29.10.2016 $ 4,800.00 $ 276.00 $ 287.00
P37/7284 Live RFC 120 05.02.2007 30.10.2008 29.10.2016 $ 4,800.00 $ 276.00 $ 287.00
P37/7806 Live RJW 121 20.08.2009 24.06.2010 23.06.2018 $ 4,840.00 $ 278.30 $ 287.00
P37/7995 Live LCF 122 26.10.2010 01.07.2011 30.06.2015 $ 4,880.00 $ 280.60 $ 287.00
P37/7996 Live LCF 122 26.10.2010 01.07.2011 30.06.2015 $ 4,880.00 $ 280.60 $ 287.00
P37/7997 Live LCF 80 26.10.2010 01.07.2011 30.06.2015 $ 3,200.00 $ 184.00 $ 287.00
P37/7998 Live LCF 122 26.10.2010 01.07.2011 30.06.2015 $ 4,880.00 $ 280.60 $ 287.00
P37/7999 Live LCF 122 26.10.2010 01.07.2011 30.06.2015 $ 4,880.00 $ 280.60 $ 287.00
P37/8000 Live LCF 112 26.10.2010 01.07.2011 30.06.2015 $ 4,480.00 $ 257.60 $ 287.00
P37/8001 Live LCF 171 26.10.2010 01.07.2011 30.06.2015 $ 6,840.00 $ 393.30 $ 287.00
Totals:- 1212 $ 48,480.00 $ 2,787.60 $ 2,870.00
Valuation of the Kin Listing Mineral Assets
Kin Independent Technical Valuation Report – AM&A Page 23
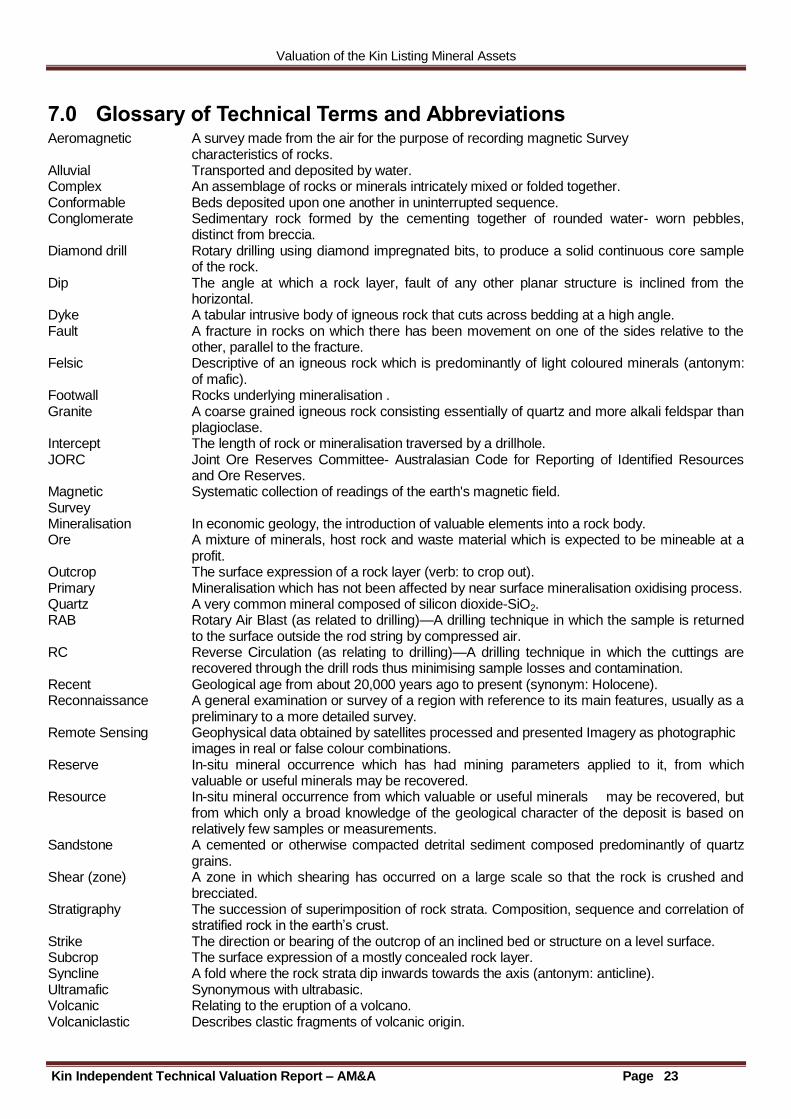
7.0 Glossary of Technical Terms and Abbreviations Aeromagnetic A survey made from the air for the purpose of recording magnetic Survey characteristics of rocks. Alluvial Transported and deposited by water. Complex An assemblage of rocks or minerals intricately mixed or folded together. Conformable Beds deposited upon one another in uninterrupted sequence. Conglomerate Sedimentary rock formed by the cementing together of rounded water- worn pebbles,
distinct from breccia. Diamond drill Rotary drilling using diamond impregnated bits, to produce a solid continuous core sample
of the rock. Dip The angle at which a rock layer, fault of any other planar structure is inclined from the
horizontal. Dyke A tabular intrusive body of igneous rock that cuts across bedding at a high angle. Fault A fracture in rocks on which there has been movement on one of the sides relative to the
other, parallel to the fracture. Felsic Descriptive of an igneous rock which is predominantly of light coloured minerals (antonym:
of mafic). Footwall Rocks underlying mineralisation . Granite A coarse grained igneous rock consisting essentially of quartz and more alkali feldspar than
plagioclase. Intercept The length of rock or mineralisation traversed by a drillhole. JORC Joint Ore Reserves Committee- Australasian Code for Reporting of Identified Resources
and Ore Reserves. Magnetic Systematic collection of readings of the earth's magnetic field. Survey Mineralisation In economic geology, the introduction of valuable elements into a rock body. Ore A mixture of minerals, host rock and waste material which is expected to be mineable at a
profit. Outcrop The surface expression of a rock layer (verb: to crop out). Primary Mineralisation which has not been affected by near surface mineralisation oxidising process. Quartz A very common mineral composed of silicon dioxide-SiO2. RAB Rotary Air Blast (as related to drilling)—A drilling technique in which the sample is returned
to the surface outside the rod string by compressed air. RC Reverse Circulation (as relating to drilling)—A drilling technique in which the cuttings are
recovered through the drill rods thus minimising sample losses and contamination. Recent Geological age from about 20,000 years ago to present (synonym: Holocene). Reconnaissance A general examination or survey of a region with reference to its main features, usually as a
preliminary to a more detailed survey. Remote Sensing Geophysical data obtained by satellites processed and presented Imagery as photographic images in real or false colour combinations. Reserve In-situ mineral occurrence which has had mining parameters applied to it, from which
valuable or useful minerals may be recovered. Resource In-situ mineral occurrence from which valuable or useful minerals may be recovered, but
from which only a broad knowledge of the geological character of the deposit is based on relatively few samples or measurements.
Sandstone A cemented or otherwise compacted detrital sediment composed predominantly of quartz grains.
Shear (zone) A zone in which shearing has occurred on a large scale so that the rock is crushed and brecciated.
Stratigraphy The succession of superimposition of rock strata. Composition, sequence and correlation of stratified rock in the earth’s crust.
Strike The direction or bearing of the outcrop of an inclined bed or structure on a level surface. Subcrop The surface expression of a mostly concealed rock layer. Syncline A fold where the rock strata dip inwards towards the axis (antonym: anticline). Ultramafic Synonymous with ultrabasic. Volcanic Relating to the eruption of a volcano. Volcaniclastic Describes clastic fragments of volcanic origin.
Valuation of the Kin Listing Mineral Assets
Kin Independent Technical Valuation Report – AM&A Page 24
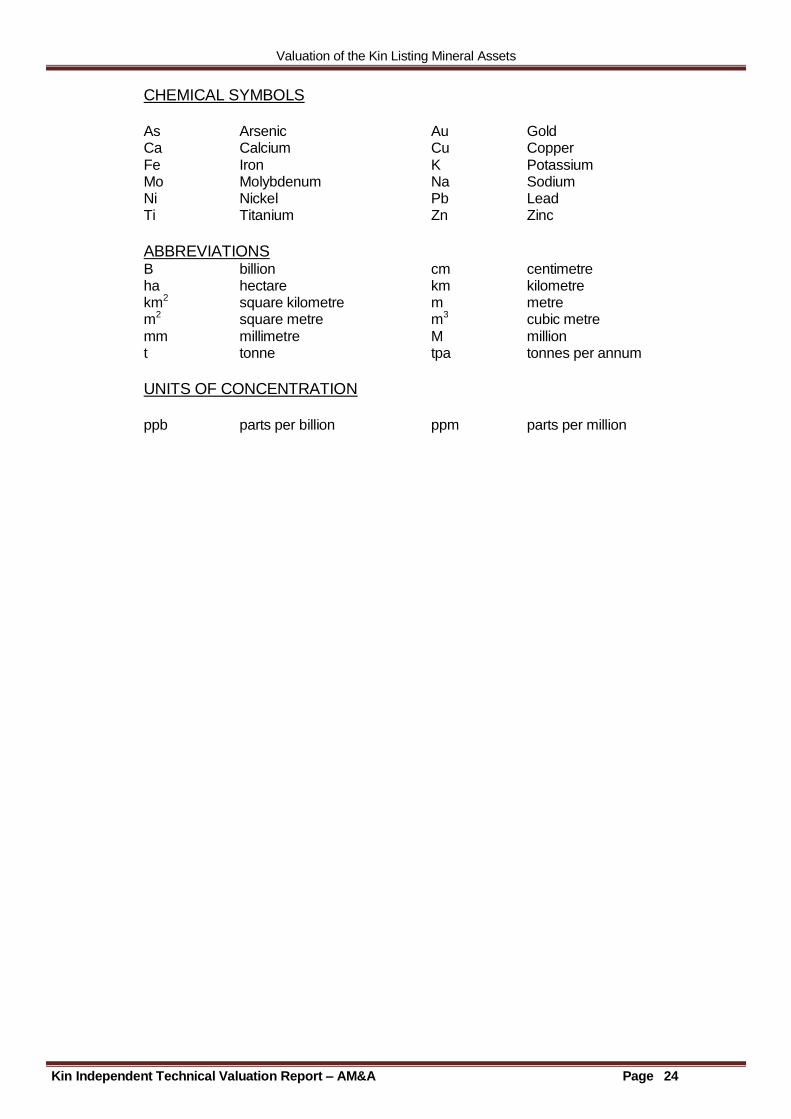
CHEMICAL SYMBOLS As Arsenic Au Gold Ca Calcium Cu Copper Fe Iron K Potassium Mo Molybdenum Na Sodium Ni Nickel Pb Lead Ti Titanium Zn Zinc
ABBREVIATIONS B billion cm centimetre ha hectare km kilometre km2 square kilometre m metre m2 square metre m3 cubic metre mm millimetre M million t tonne tpa tonnes per annum
UNITS OF CONCENTRATION ppb parts per billion ppm parts per million