
AJ LUCAS GROUP LIMITED...2019/08/30 · AJ LUCAS GROUP LIMITED ABN 12 060 309 104For personal use...
83
AJ LUCAS GROUP LIMITED ABN 12 060 309 104 PRELIMINARY FINAL FINANCIAL REPORT YEAR ENDED 30 JUNE 2019 For personal use only
Transcript of AJ LUCAS GROUP LIMITED...2019/08/30 · AJ LUCAS GROUP LIMITED ABN 12 060 309 104For personal use...
AJ LUCAS GROUP LIMITED ABN 12 060 309 104
PRELIMINARY FINAL FINANCIAL REPORT
YEAR ENDED 30 JUNE 2019
For
per
sona
l use
onl
y
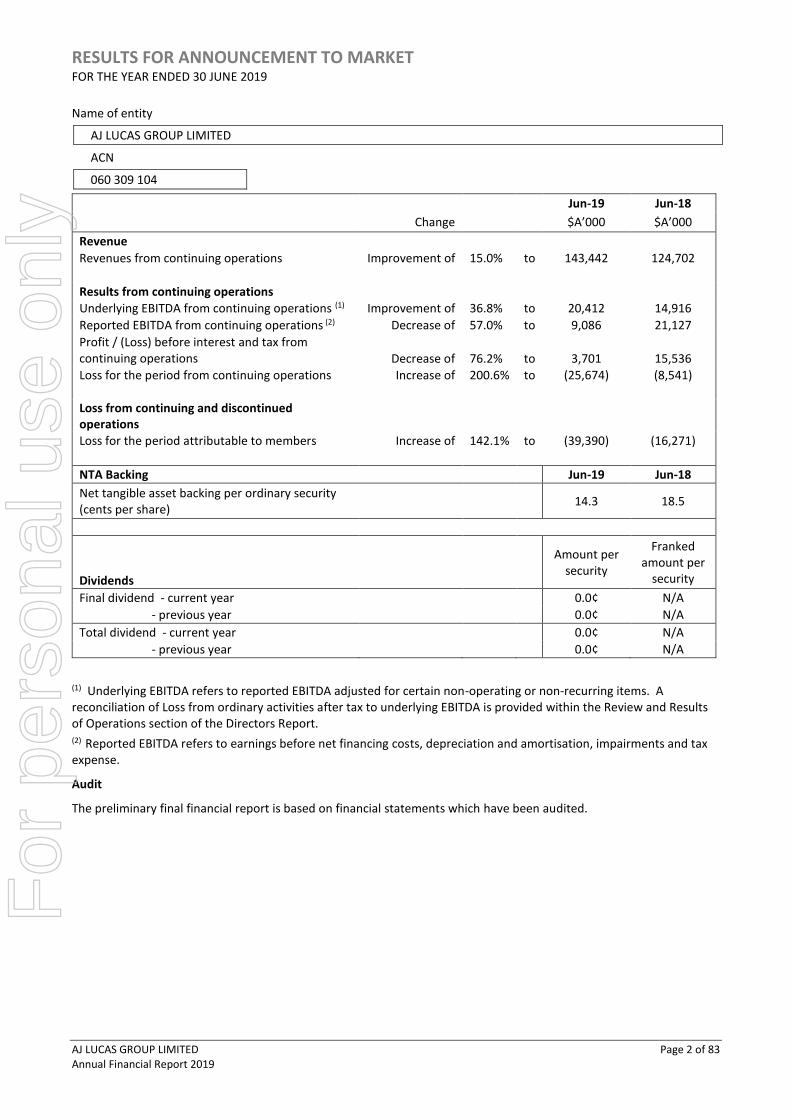
RESULTS FOR ANNOUNCEMENT TO MARKET FOR THE YEAR ENDED 30 JUNE 2019
AJ LUCAS GROUP LIMITED Page 2 of 83 Annual Financial Report 2019
Name of entity
AJ LUCAS GROUP LIMITED
ACN
060 309 104
Jun-19 Jun-18
Change $A’000 $A’000
Revenue
Revenues from continuing operations Improvement of 15.0% to 143,442 124,702
Results from continuing operations
Underlying EBITDA from continuing operations (1) Improvement of 36.8% to 20,412 14,916
Reported EBITDA from continuing operations (2) Decrease of 57.0% to 9,086 21,127
Profit / (Loss) before interest and tax from continuing operations Decrease of 76.2% to 3,701 15,536
Loss for the period from continuing operations Increase of 200.6% to (25,674) (8,541)
Loss from continuing and discontinued operations
Loss for the period attributable to members Increase of 142.1% to (39,390) (16,271)
NTA Backing Jun-19 Jun-18
Net tangible asset backing per ordinary security (cents per share)
14.3 18.5
Dividends
Amount per
security
Franked amount per
security
Final dividend - current year 0.0¢ N/A
- previous year 0.0¢ N/A
Total dividend - current year 0.0¢ N/A
- previous year 0.0¢ N/A
(1) Underlying EBITDA refers to reported EBITDA adjusted for certain non-operating or non-recurring items. A reconciliation of Loss from ordinary activities after tax to underlying EBITDA is provided within the Review and Results of Operations section of the Directors Report. (2) Reported EBITDA refers to earnings before net financing costs, depreciation and amortisation, impairments and tax expense.
Audit
The preliminary final financial report is based on financial statements which have been audited.
For
per
sona
l use
onl
y
DIRECTORS’ REPORT FOR THE YEAR ENDED 30 JUNE 2019
AJ LUCAS GROUP LIMITED Page 3 of 83 Annual Financial Report 2019
DIRECTORS
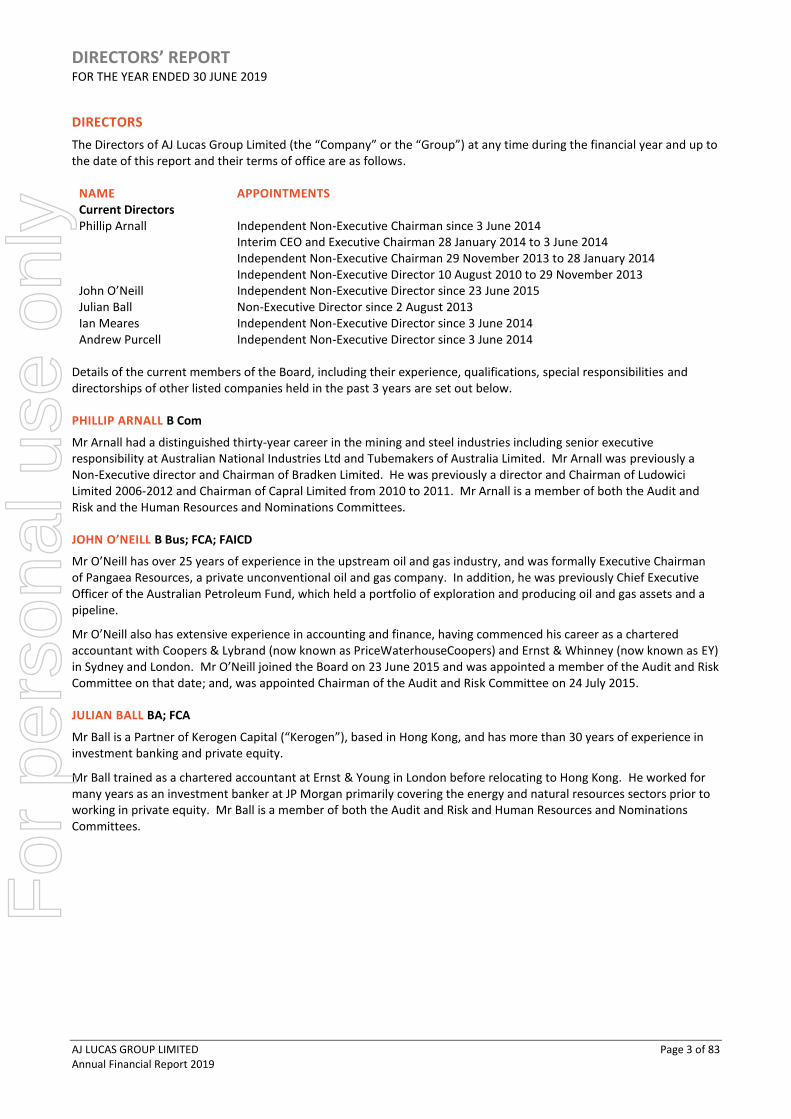
The Directors of AJ Lucas Group Limited (the “Company” or the “Group”) at any time during the financial year and up to the date of this report and their terms of office are as follows.
NAME APPOINTMENTS Current Directors Phillip Arnall Independent Non-Executive Chairman since 3 June 2014
Interim CEO and Executive Chairman 28 January 2014 to 3 June 2014 Independent Non-Executive Chairman 29 November 2013 to 28 January 2014 Independent Non-Executive Director 10 August 2010 to 29 November 2013
John O’Neill Independent Non-Executive Director since 23 June 2015 Julian Ball Non-Executive Director since 2 August 2013 Ian Meares Independent Non-Executive Director since 3 June 2014 Andrew Purcell Independent Non-Executive Director since 3 June 2014
Details of the current members of the Board, including their experience, qualifications, special responsibilities and directorships of other listed companies held in the past 3 years are set out below.
PHILLIP ARNALL B Com
Mr Arnall had a distinguished thirty-year career in the mining and steel industries including senior executive responsibility at Australian National Industries Ltd and Tubemakers of Australia Limited. Mr Arnall was previously a Non-Executive director and Chairman of Bradken Limited. He was previously a director and Chairman of Ludowici Limited 2006-2012 and Chairman of Capral Limited from 2010 to 2011. Mr Arnall is a member of both the Audit and Risk and the Human Resources and Nominations Committees.
JOHN O’NEILL B Bus; FCA; FAICD
Mr O’Neill has over 25 years of experience in the upstream oil and gas industry, and was formally Executive Chairman of Pangaea Resources, a private unconventional oil and gas company. In addition, he was previously Chief Executive Officer of the Australian Petroleum Fund, which held a portfolio of exploration and producing oil and gas assets and a pipeline.
Mr O’Neill also has extensive experience in accounting and finance, having commenced his career as a chartered accountant with Coopers & Lybrand (now known as PriceWaterhouseCoopers) and Ernst & Whinney (now known as EY) in Sydney and London. Mr O’Neill joined the Board on 23 June 2015 and was appointed a member of the Audit and Risk Committee on that date; and, was appointed Chairman of the Audit and Risk Committee on 24 July 2015.
JULIAN BALL BA; FCA
Mr Ball is a Partner of Kerogen Capital (“Kerogen”), based in Hong Kong, and has more than 30 years of experience in investment banking and private equity.
Mr Ball trained as a chartered accountant at Ernst & Young in London before relocating to Hong Kong. He worked for many years as an investment banker at JP Morgan primarily covering the energy and natural resources sectors prior to working in private equity. Mr Ball is a member of both the Audit and Risk and Human Resources and Nominations Committees.
For
per
sona
l use
onl
y
DIRECTORS’ REPORT FOR THE YEAR ENDED 30 JUNE 2019
AJ LUCAS GROUP LIMITED Page 4 of 83 Annual Financial Report 2019
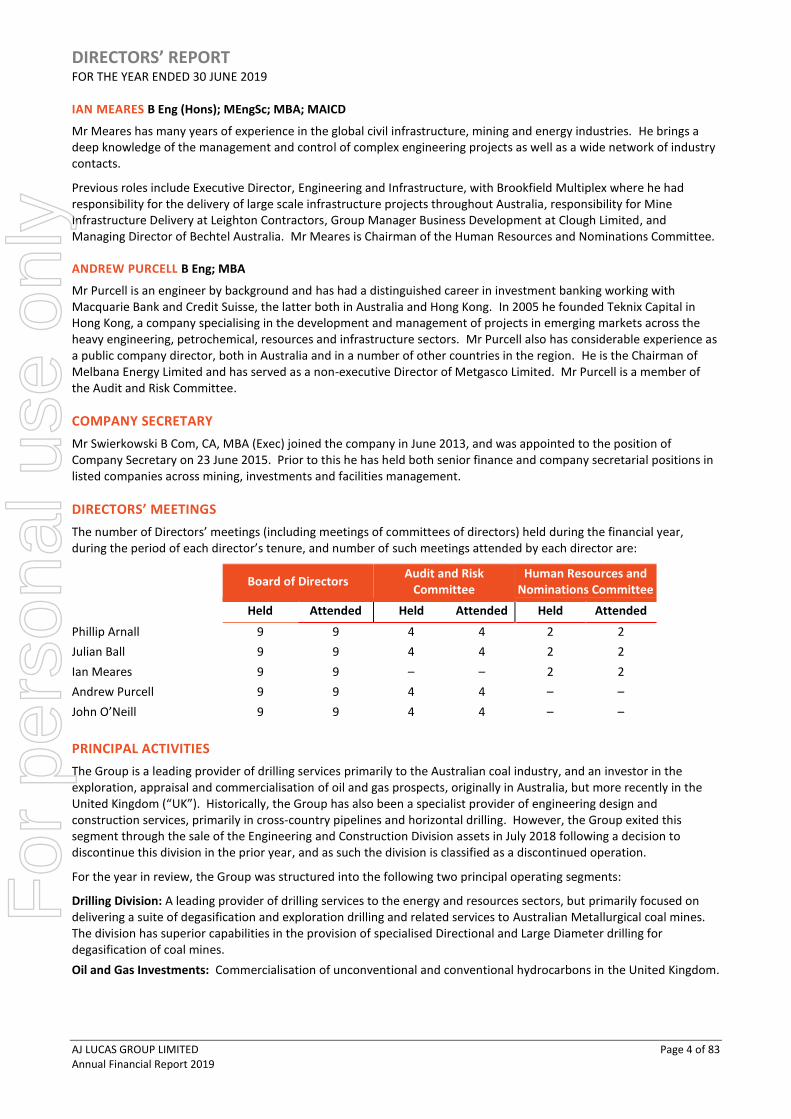
IAN MEARES B Eng (Hons); MEngSc; MBA; MAICD
Mr Meares has many years of experience in the global civil infrastructure, mining and energy industries. He brings a deep knowledge of the management and control of complex engineering projects as well as a wide network of industry contacts.
Previous roles include Executive Director, Engineering and Infrastructure, with Brookfield Multiplex where he had responsibility for the delivery of large scale infrastructure projects throughout Australia, responsibility for Mine Infrastructure Delivery at Leighton Contractors, Group Manager Business Development at Clough Limited, and Managing Director of Bechtel Australia. Mr Meares is Chairman of the Human Resources and Nominations Committee.
ANDREW PURCELL B Eng; MBA
Mr Purcell is an engineer by background and has had a distinguished career in investment banking working with Macquarie Bank and Credit Suisse, the latter both in Australia and Hong Kong. In 2005 he founded Teknix Capital in Hong Kong, a company specialising in the development and management of projects in emerging markets across the heavy engineering, petrochemical, resources and infrastructure sectors. Mr Purcell also has considerable experience as a public company director, both in Australia and in a number of other countries in the region. He is the Chairman of Melbana Energy Limited and has served as a non-executive Director of Metgasco Limited. Mr Purcell is a member of the Audit and Risk Committee.
COMPANY SECRETARY
Mr Swierkowski B Com, CA, MBA (Exec) joined the company in June 2013, and was appointed to the position of Company Secretary on 23 June 2015. Prior to this he has held both senior finance and company secretarial positions in listed companies across mining, investments and facilities management.
DIRECTORS’ MEETINGS
The number of Directors’ meetings (including meetings of committees of directors) held during the financial year, during the period of each director’s tenure, and number of such meetings attended by each director are:
Board of Directors Audit and Risk
Committee Human Resources and
Nominations Committee
Held Attended Held Attended Held Attended
Phillip Arnall 9 9 4 4 2 2
Julian Ball 9 9 4 4 2 2
Ian Meares 9 9 – – 2 2
Andrew Purcell 9 9 4 4 – –
John O’Neill 9 9 4 4 – –
PRINCIPAL ACTIVITIES
The Group is a leading provider of drilling services primarily to the Australian coal industry, and an investor in the exploration, appraisal and commercialisation of oil and gas prospects, originally in Australia, but more recently in the United Kingdom (“UK”). Historically, the Group has also been a specialist provider of engineering design and construction services, primarily in cross-country pipelines and horizontal drilling. However, the Group exited this segment through the sale of the Engineering and Construction Division assets in July 2018 following a decision to discontinue this division in the prior year, and as such the division is classified as a discontinued operation.
For the year in review, the Group was structured into the following two principal operating segments:
Drilling Division: A leading provider of drilling services to the energy and resources sectors, but primarily focused on delivering a suite of degasification and exploration drilling and related services to Australian Metallurgical coal mines. The division has superior capabilities in the provision of specialised Directional and Large Diameter drilling for degasification of coal mines.
Oil and Gas Investments: Commercialisation of unconventional and conventional hydrocarbons in the United Kingdom.
For
per
sona
l use
onl
y

DIRECTORS’ REPORT FOR THE YEAR ENDED 30 JUNE 2019
AJ LUCAS GROUP LIMITED Page 5 of 83 Annual Financial Report 2019
OPERATING & FINANCIAL REVIEW
GROUP PERFORMANCE
2019 Year
$'000
2019 2nd half
$'000
2019 1st half
$'000
2018 Year
$'000
2018/19 Change
%
Total revenue from continuing operations 143,442 67,215 76,227 124,702 15.0%
Underlying EBITDA from continuing operations 20,412 9,273 11,139 14,916 36.8%
Reported EBITDA from continuing operations 9,086 3,515 5,571 21,127 (57.0%)
EBIT from continuing operations 3,701 826 2,875 15,536 (76.2%)
Loss before tax from continuing operations (25,674) (13,581) (12,093) (8,541) (200.6%)
Loss before tax from discontinued operations (13,716) (7,207) (6,509) (7,730) (77.4%)
Net loss for the year (39,390) (20,788) (18,602) (16,271) (142.1%)
Total assets 265,957 265,957 271,077 266,935 (0.4%)
Net assets 107,542 107,542 127,584 139,110 (22.7%)
Basic loss per share from continuing operations (cents) (3.4) (1.8) (1.6) (1.3) (163.3%)
A reconciliation of the profit / (loss) from continuing operations to underlying EBITDA is shown in the following table:
Drilling
$'000
Oil & Gas
$'000 Corporate
$'000 2019
$'000 2018
$'000
Reconciliation: Profit / (loss) for the period from continuing operations 19,238 (7,987) (36,925) (25,674) (8,541)
Depreciation and amortisation 5,166 – 219 5,385 5,591
Finance costs – – 29,507 29,507 24,249
Finance income – – (132) (132) (172)
EBITDA from continuing operations 24,404 (7,987) (7,331) 9,086 21,127
Share of equity accounted investees loss/(profit) – 4,880 – 4,880 (8,201)
Exploration asset revenue – (373) – (373) (2,363)
Share of overhead - UK investments – 3,480 – 3,480 2,430
Strategic review of Drilling division – – 840 840 –
Settlement of legal disputes – – 885 885 1,055
Redundancy costs – – 546 546 749
Net (profit) / loss on sales of assets – – 816 816 159
Other expense – – 252 252 (40)
Underlying EBITDA 24,404 – (3,992) 20,412 14,916
The non-IFRS financial information presented in this document has not been audited or reviewed in accordance with Australian Auditing Standards.
OVERVIEW OF THE GROUP
The Group delivered a strong underlying EBITDA result, driven by the Drilling division which has benefited from a buoyant metallurgical coal market and continued drive for efficiency and operational excellence. The division has a well-established reputation for delivering efficient and innovative solutions to its customers while maintaining superior operational controls and safety performance. This has allowed it to capitalise on recent opportunities to secure a number of existing and new customers under longer term contracts which are expected to underpin the division’s performance in the coming years.
The Board announced on 11 March 2019 that it had concluded a strategic review of the Australian Drilling Division and that it had decided against divesting the division and to support it in the growing Australian East Coast Coal market. The decision has been vindicated by the recent success in longer term contract awards from key market players.
For
per
sona
l use
onl
y

DIRECTORS’ REPORT FOR THE YEAR ENDED 30 JUNE 2019
AJ LUCAS GROUP LIMITED Page 6 of 83 Annual Financial Report 2019
The Engineering and Construction division has been treated for accounting and reporting purposes as a discontinued operation, following a decision taken in 2018 to divest the division’s and the subsequent sale of the divisions plant and equipment in July 2018 and subsequent completion of existing contract obligations. The results of the division have been separately disclosed as discontinued operations.
EBITDA from continuing operations of $9.1 million was lower than the prior year, driven largely by an increase in costs arising from increased activity of drilling and fracturing operations undertaken by Cuadrilla Resources Holdings Limited (“Cuadrilla”) in the UK. The share of equity accounted investees loss was $4.8 million, compared to a gain of $8.2 million in the prior year due to income recognised under an initial farm in arrangement entered in 2013 which was exhausted during the prior year. The share of overhead relating to the UK investments was $3.5 million compared to $2.4 million in prior year.
The loss from continuing operations of $25.7 million was driven by the above, together with interest costs of $29.5 million (2018: $24.2 million).
During the year in review, the Company commenced a review of its debt obligations including the obligation to reduce the principal outstanding from OCP to $US 20 million by 30 September 2019. The Company is in negotiations with parties interested to refinance the Group’s existing Senior loan note facility with a longer term and lower cost facility to strengthen the Group’s balance sheet and meet its obligations to the Senior loan note holders. The refinance is expected to be concluded in September 2019.
DIVISIONAL PERFORMANCE
Drilling
The results of the Drilling Division are summarised as follows:
2019 Year
$'000
2019 2nd half
$'000
2019 1st half
$'000
2018 Year
$'000
2018/19 Change
%
Revenue 143,442 67,215 76,227 124,702 15.0%
Underlying EBITDA 24,404 11,330 13,074 19,705 23.8%
EBITDA margin 17.0% 16.9% 17.2% 15.8%
The Drilling division delivered a very robust financial result in FY19, building on a strong comparative year. The division has benefited from a fundamentally strong metallurgical coal market, with the longer-term outlook remaining very positive. Revenue increased by 15.0% to $143.4 million as a result of high utilisation of its rig fleet, with demand especially strong in the more specialised large diameter and directional drilling service offerings. This demand, together with a consistent focus on efficiency improvements has helped deliver consistently high margins over the last two years.
Importantly, the outlook for the Drilling division remains positive. The Drilling division has an order book stronger than any time in at least the last 5 years, which is expected to deliver over $200 million in revenue over the next 2 years alone.
The order book is supported by 6 contracts that have been executed in the last 12 months, which reinforce the division’s leading position in the Australian Coal Drilling market. These include two contracts previously announced that extend existing long-term relationships with two of the division’s largest customers for a period of at least 3 years with options to extend for up to a further two years by mutual agreement. The remaining 4 new contracts are a combination of new and existing customers for durations up to 5 years.
Against the back drop of a positive metallurgical coal market outlook and underpinned by longer term contractual arrangements with key customers the division is expected to continue to deliver equally strong financial results over the next financial year and beyond. This is expected to be supported by the division’s superior track record in delivering services in a flexible and safe manner and its relentless focus on efficiency.
For
per
sona
l use
onl
y

DIRECTORS’ REPORT FOR THE YEAR ENDED 30 JUNE 2019
AJ LUCAS GROUP LIMITED Page 7 of 83 Annual Financial Report 2019
Oil and Gas
A J Lucas has an effective 48.19% interest in the Bowland licence for Shale Gas exploration in the UK. Cuadrilla, the Operator of the licence, has planning consent to drill, hydraulic fracture (“HF”) and flow-test up to four horizontal shale gas exploration wells at the Preston New Road Exploration site (“PNR”) which it received in 2016. PNR, within the Bowland licence, is located within a 100km2 3D seismic survey in the same structural fairway as the shale gas discovery well Preese Hall-1 and is located approximately 3.9km south of Preese Hall-1.
Cuadrilla drilled a vertical well through the Upper and Lower Bowland shale to a depth of 2,614 metres, from which it collected over 300 metres of core samples in addition to a wide range of wireline logging. Having analysed this core and log data, Cuadrilla identified the top six separate potential productive zones: three in the Upper Bowland Shale and three in the Lower Bowland Shale. Two horizontal wells, being PNR1z and PNR2 were subsequently drilled, targeting two of these six zones, well 1 in the Lower Bowland and well 2 in the Upper Bowland.
In the period from October 2018 to February 2019, Cuadrilla hydraulically fractured and flow tested PNR1z. This horizontal well was designed with 41 mechanically manipulated multi-cycle fracture sleeves. HF operations took place during the period 15th October – 17th December 2018, and were conducted under the seismicity limits of the Traffic Light System (“TLS”). These require that the operator temporarily halt hydraulic fracturing for a period of 18 hours if a seismic event measuring more than 0.5ML on the Richter Scale is registered. As hydraulic fracturing occurs at a depth of 2kms or more, seismic events at this magnitude level, which last for no more than a matter of seconds, are unlikely to be felt at surface and would create no damage at surface.
Under these very conservative thresholds, not all the stages were stimulated with the designed 50 tonnes of sand being injected. Of the planned 41 stages, 2 were embedded with the planned 50 tonnes of sand, 14 stages were fractured with various smaller quantities of sand and a number of stages were tested for fracturing without injecting any sand. In total only 14% of the intended proppant was injected into the formation. Cuadrilla has retained the option of completing the fracturing program for this well, after reworking the well, when the HF of well 2 is complete.
In February 2019, Cuadrilla released results from its flow-testing of PNR1z. This identified a reservoir of high-quality dry natural gas, comprising approximately 96% methane with negligible impurities. The gas contained no traces of
hydrogen-sulphide and very low levels of carbon dioxide (approximately 0.15% of the gas). Flow testing achieved a
peak of 200,000 standard cubic feet per day (“scfd”), with a stable flow of 100,000 scfd. These results indicate that rock properties are highly conducive to fracturing.
Given the flow rates achieved from PNR1z, and taking account of the limited number of stages fractured and the amount of proppant placed, Cuadrilla estimated that an initial flow rate range of 3-8 million standard cubic feet per day (“mmscfd”) could be expected from a fully fractured horizontal Bowland Shale well of 2,500 metres in length. Subject to factors such as capital and operating costs, such rates are likely to be commercially viable and would demonstrate the Bowland shale as a world class natural gas shale resource.
In June 2019, Cuadrilla submitted an updated hydraulic fracture plan for the second well at the Preston New Road Exploration Site (“PNR2”). The plan is to fracture up to 45 stages by the end of November 2019, which will be followed by flow testing. AJ Lucas as shareholder in Cuadrilla and 23.75% joint venture partner in the Bowland licence, supports this program as the next step in determining the commercial value of the resource. The plan builds on information gathered from operations already undertaken on PNR1z and incorporates the use of higher viscosity fracturing fluid. Cuadrilla recommenced hydraulic fracturing on 15 August and, as of 20th August Cuadrilla had fractured 5 stages. 30 tonnes of proppant were placed in the 1st stage and an average of 50 tonnes of proppant were placed in stages 2 through 5.
Following the fracturing of Stage 6 on 21st August and Stage 7 on 23rd August a number of post-pumping seismic events were recorded. The largest of these measured 2.9 on the Richter Scale and was recorded on Monday 26th August. This event was of approximately 3 seconds duration and the associated ground movements were recorded at between 5 and 8 mm/second. These recorded ground motions are below the levels typically allowable in the Construction industry however the event was felt locally. A technical investigation is being undertaken. Following this review fracturing is expected to recommence.
Cuadrilla intends to seek a variation to its current planning permission, which requires drilling and fracturing to be completed by November 2019. It plans to write to Lancashire County Council seeking a scoping opinion under the
For
per
sona
l use
onl
y
DIRECTORS’ REPORT FOR THE YEAR ENDED 30 JUNE 2019
AJ LUCAS GROUP LIMITED Page 8 of 83 Annual Financial Report 2019
Town and Country Planning (Environmental Impact Assessment) Regulations 2017 to seek to allow an additional 18 months for these activities. A formal planning application will then follow.
The UK Committee on Climate Change (CCC) in its May 2019 report clearly forecast a very significant UK gas demand out to 2050 and beyond – approximately 70 per cent of 2019 gas demand still existing in the year 2050. Under the CCC’s recommended pathway to net zero CO2 emissions this gas would be used as both a feedstock for making hydrogen and a backup supply for generating electricity. Carbon Capture and Storage would accompany gas usage to ensure net zero CO2 emissions.
Separately, in February 2019 the UK Secretary of State for Communities and Local Government (“SOS) declined planning consent for four horizontal shale gas wells at the Roseacre Wood (“RW”) exploration site based exclusively on transport issues. While the decision was disappointing Cuadrilla has decided not to appeal against the decision and instead is focused on the PNR operations.
Turning to the Balcombe licence in the South of England, the licence operator Angus Energy completed a seven day horizontal well test of the Balcombe 2z Kimmeridge Layer in October 2018. The well naturally flowed at 853 barrels of oil per day (“bopd”) equivalent, not including 22.5% water. A second flow period was undertaken with the well flowing naturally at 1,587 bopd equivalent, not including 6.6% water. These flows were over a very short interval and whilst encouraging were not considered conclusive.
Post-test analysis of the recovered water demonstrated levels of salinity significantly higher than any regional trend, indicating a strong probability that injected brine rather than formation water was being produced from the site’s Micrite Layers. Given the mandated length of the short testing sequence, Angus Energy was not able to remove what it believes was a limited amount of unrecovered brine from previous activities at the site.
Therefore, Angus Energy believes that continuous oil with a low water ratio can be produced from the Balcombe-2Z well under normal pumped production conditions and it now plans to apply for planning permission and the associated permits for a longer term well test which if successful could demonstrate commercial oil production.
Outside of the Bowland and Balcombe licences, Cuadrilla has interests in various UK onshore exploration licences in Yorkshire in the UK totaling approximately 1,274 km2, many of which target the same Bowland-Hodder shale formations being drilled and tested in Lancashire. Some of these licences are held solely by Cuadrilla, and some in joint venture with INEOS.
REVIEW OF FINANCIAL CONDITION
During the year the Group generated cash from operating activities of $14.8 million (2018: used cash of $13.1 million) after net interest and finance costs paid of $8.0 million (2018: $10.5 million). This was driven by strong underlying EBITDA performance from the drilling division, supported by a focus on working capital management. It also included results of discontinued operations and certain non-operating costs.
During the year the Board agreed with senior note holders to amend certain provisions of its senior loan notes facility (the “OCP facility”) in August 2018 and April 2019. As a result of these amendments the Group was able to draw down an additional US$9 million (A$12.4 million) in September 2018, and extend its repayment obligations. The Group is required to reduce the facility principal to no more than US$20 million and repay a pro rata portion of interest outstanding by 30 September 2019, (previously September 2018), with final maturity of the OCP facility now being March 2020 (previously July 2019). As a result, the total principal and interest outstanding of A$67.2 million to OCP is classified as a current liability at balance date (2018 current liability: $17.2 million). In accordance with the terms of the OCP facility, the maturity of the Kerogen loan facility was also extended to the earlier of 31 July 2020 (previously 31 December 2019) or 6 months from full repayment of the senior loan notes facility.
The Company is in the final stages of discussions with a number of parties regarding refinancing the OCP facility, which subject to final agreement it expects will allow the Company to repay its current obligations to OCP and provide a longer-term facility. The Company also expects to extend the maturity of the Kerogen Loan Facility which will together support a more stable balance sheet.
The $14.8 million cash generated from operating activities, together with US$9 million (A$12.4 million) drawn down in September 2018 under the OCP facility was used to fund investing activities of $27.3 million. $23.7 million represented the Group’s share of UK shale gas exploration activities which compared to $15 million in the prior year. The increase
For
per
sona
l use
onl
y

DIRECTORS’ REPORT FOR THE YEAR ENDED 30 JUNE 2019
AJ LUCAS GROUP LIMITED Page 9 of 83 Annual Financial Report 2019
was driven by the drilling, fracturing and flow testing activities of PNR1z and PNR2 and the exhaustion of the first carry arrangement in FY18 which resulted from the partial sale of the Bowland licence in 2013 to Centrica PLC. A second carry arrangement continues to be in effect, under which Spirit Energy, a subsidiary of Centrica PLC, is required to fund a further GBP£46.7 million of certain Bowland licence costs to maintain its 25% interest subject to certain milestones being met.
OUTLOOK & LIKELY DEVELOPMENTS
The Group has a major focus on onshore UK shale gas exploration and appraisal through its investment in a number of UK licences, both directly and as a shareholder in Cuadrilla. The strategic focus for Cuadrilla for the coming year is to successfully fracture and flow-test the PNR2 well on the Bowland acreage at the PNR and to secure an extension of the current planning consent to drill, fracture and test the flow of gas from 4 wells at PNR beyond the current November 2019 deadline that will enable continuation of exploration on the Preston New Road site.
The Drilling division in Australia will commence the new year with a strong order book and an expectation of repeating the performance of the recent two years. This division will focus on the execution of contracts secured from key industry customers and will review realistic growth opportunities in this segment as they arise. The Australian Metallurgical Coal market is expected to remain strong over the next decade and the Drilling division holds a pre-eminent position to benefit from this strength.
IMPACT OF LEGISLATION AND OTHER EXTERNAL REQUIREMENTS
There were no changes in environmental or other legislative requirements during the year that significantly impacted the results or operations of the Group.
DIVIDENDS
No dividends have been declared by the Company since the end of the previous year (2018: Nil).
ENVIRONMENTAL REGULATIONS & NATIVE TITLE
AJ Lucas is committed to meeting stringent environmental and land use regulations, including native title issues. The Group is committed to identifying environmental risks and engineering solutions to avoid, minimise or mitigate such risks. The Group works closely with all levels of government, landholders, and other bodies to ensure its activities have minimal or no effect on land use and areas of environmental and cultural importance. Group policy requires all operations to be conducted in a manner that will preserve and protect the environment.
The directors are not aware of any significant environmental incidents, or breaches of environmental regulations during or since the end of the financial year.
SIGNIFICANT CHANGES IN THE STATE OF AFFAIRS
The significant changes in the state of affairs of the Group both during the financial year and subsequent to the balance sheet date are as described in this report and the financial statements and notes thereto.
EVENTS SUBSEQUENT TO REPORTING DATE
Subsequent to year end the Group announced it had signed a major drilling services contract with Kestrel Coal Pty Ltd for an initial period of 3 years with options to extend for a further 2 years by agreement. The contract extends an existing long-term working relationship with a key customer to whom the Drilling division currently supplies 6 rigs operated and supported by up to 100 staff.
On 20 August 2019 the Group has announced that hydraulic fracturing operations had resumed at PNR with 4 fracture stages having been successfully completed. These were completed as per design with 30 tonnes of sand injected into the Shale in Stage 1 and 50 tonnes of sand in each of stages 2 through 4 without any breach of the 0.5ML level of seismic activity under the TLS. Following this announcement, Cuadrilla successfully fractured the 5th and 6th stage with a further 55 and 37 tonnes of sand being placed respectivley. However, a number of post-pumping (“trailing”) seismic events greater than the 0.5ML level followed and on 26 August a seismic event of 2.9 ML occurred. This event is under investigation by the operator and the site has been placed on hold pending the outcome of those investigations.
Other than as disclosed above, there has not arisen in the interval between the end of the financial year and the date of this report any item, transaction or event of a material or unusual nature likely, in the opinion of the directors of the
For
per
sona
l use
onl
y
DIRECTORS’ REPORT FOR THE YEAR ENDED 30 JUNE 2019
AJ LUCAS GROUP LIMITED Page 10 of 83 Annual Financial Report 2019
Company, to affect significantly the operations of the Group, the results of those operations, or the state of affairs of the Group, in future financial years.
DIRECTORS’ SHAREHOLDINGS AND OTHER INTERESTS
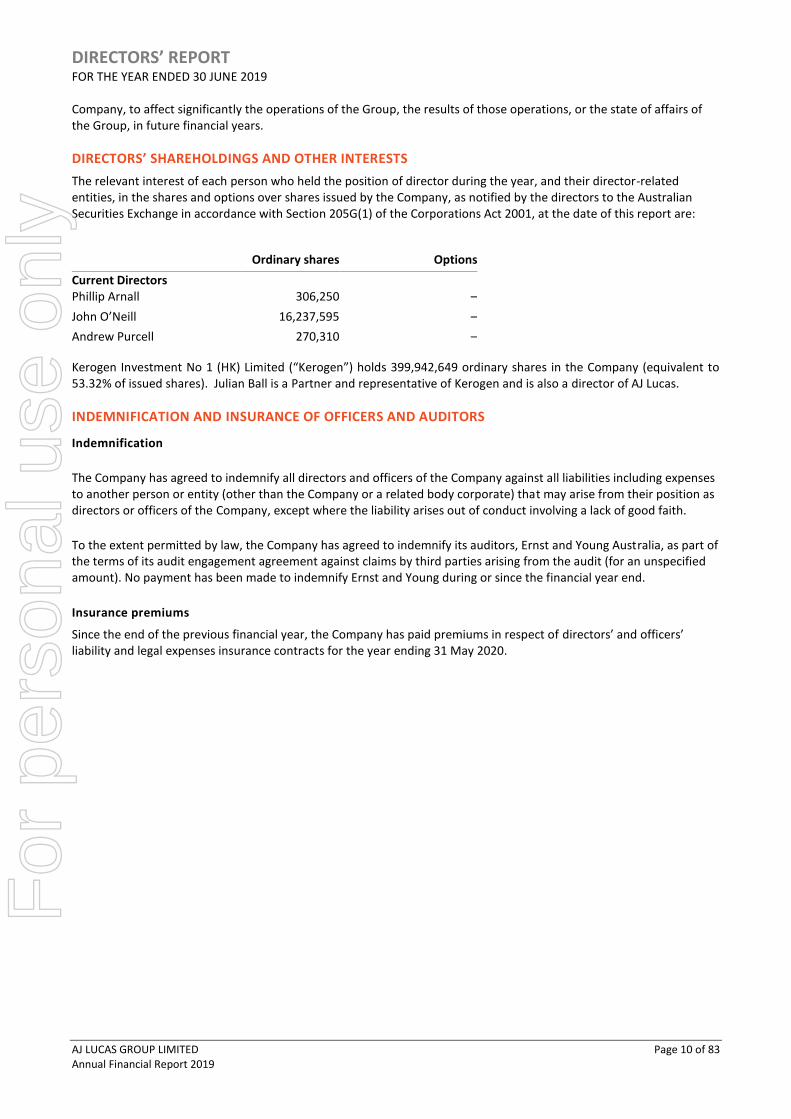
The relevant interest of each person who held the position of director during the year, and their director-related entities, in the shares and options over shares issued by the Company, as notified by the directors to the Australian Securities Exchange in accordance with Section 205G(1) of the Corporations Act 2001, at the date of this report are:
Kerogen Investment No 1 (HK) Limited (“Kerogen”) holds 399,942,649 ordinary shares in the Company (equivalent to 53.32% of issued shares). Julian Ball is a Partner and representative of Kerogen and is also a director of AJ Lucas.
INDEMNIFICATION AND INSURANCE OF OFFICERS AND AUDITORS
Indemnification
The Company has agreed to indemnify all directors and officers of the Company against all liabilities including expenses to another person or entity (other than the Company or a related body corporate) that may arise from their position as directors or officers of the Company, except where the liability arises out of conduct involving a lack of good faith.
To the extent permitted by law, the Company has agreed to indemnify its auditors, Ernst and Young Australia, as part of the terms of its audit engagement agreement against claims by third parties arising from the audit (for an unspecified amount). No payment has been made to indemnify Ernst and Young during or since the financial year end.
Insurance premiums
Since the end of the previous financial year, the Company has paid premiums in respect of directors’ and officers’ liability and legal expenses insurance contracts for the year ending 31 May 2020.
Ordinary shares Options
Current Directors Phillip Arnall 306,250 –
John O’Neill 16,237,595 –
Andrew Purcell 270,310 –
For
per
sona
l use
onl
y

DIRECTORS’ REPORT FOR THE YEAR ENDED 30 JUNE 2019
AJ LUCAS GROUP LIMITED Page 11 of 83 Annual Financial Report 2019
NON-AUDIT SERVICES
During the year, Ernst and Young, the Company’s auditor, has performed certain other services in addition to the audit and review of the financial statements.
The Board has considered the non-audit services provided during the year by the auditor and in accordance with advice of the Audit and Risk Committee, is satisfied that the provision of those non-audit services during the year by the auditor is compatible with, and did not compromise, the auditor independence requirements of the Corporations Act 2001 for the following reasons:
• all non-audit services were subject to the corporate governance procedures adopted by the Company and have been reviewed by the Audit and Risk Committee to ensure they do not impact the integrity and objectivity of the auditor; and
• the non-audit services provided do not undermine the general principles relating to auditor independence as set out in APES 110 ‘Code of Ethics for Professional Accountants’, as they did not involve reviewing or auditing the auditor’s own work, acting in a management or decision-making capacity for the Company, acting as an advocate for the Company or jointly sharing risks and rewards.
Payments due to the auditor of the Company and its related practices for non-audit services provided during the year, as set out in Note 9 of the consolidated financial statements, amounted to $398,650 (2018: $146,700).
LEAD AUDITOR’S INDEPENDENCE DECLARATION
The Lead auditor’s independence declaration is set out on page 23 and forms part of the Directors’ Report for the financial year ended 30 June 2019.
ROUNDING OFF
The Company is of a kind referred to in ASIC Corporations Instrument 2016/191 (Rounding in Financial/Directors’ Reports) issued by the Australian Securities and Investments Commission. Unless otherwise expressly stated, amounts in the financial report and the directors’ report have been rounded off to the nearest thousand dollars in accordance with that Corporate Instrument.
REMUNERATION REPORT – AUDITED
The Directors present the Remuneration Report (“the Report”) for the Company and its controlled entities for the year ended 30 June 2019. The Report forms part of the Directors’ Report and has been audited in accordance with section 300A of the Corporations Act 2001. The Report outlines the remuneration policy for key management personnel comprising
1. The non-executive directors (NEDs)
2. Senior executives (the Executives)
Key management personnel have authority and responsibility for planning, directing and controlling the activities of the Company and the Group.
NON-EXECUTIVE DIRECTORS’ REMUNERATION
The Board’s policy for setting fees for non-executive directors is to position them around the middle of market practice for comparable non-executive director roles in companies listed on the Australian Securities Exchange (ASX). Non-executive directors do not receive performance related remuneration and are not provided with retirement benefits apart from statutory superannuation. Options and other forms of equity are not provided to non-executive directors.
Total remuneration for all non-executive directors, last voted upon at the 2018 Annual General Meeting, is not to exceed $900,000 per annum. The remuneration for each non-executive director during the year was $100,000 per annum, and $275,000 for the Chairman which reflects the ongoing additional commitment required of the Chairman.
In addition, $10,000 per annum was paid to each director serving on each committee of the Board. Where directors perform consulting services to the Group outside of their director duties, additional fees may be paid based on commercial terms and are disclosed as related party transactions in Note 31 of the financial report.
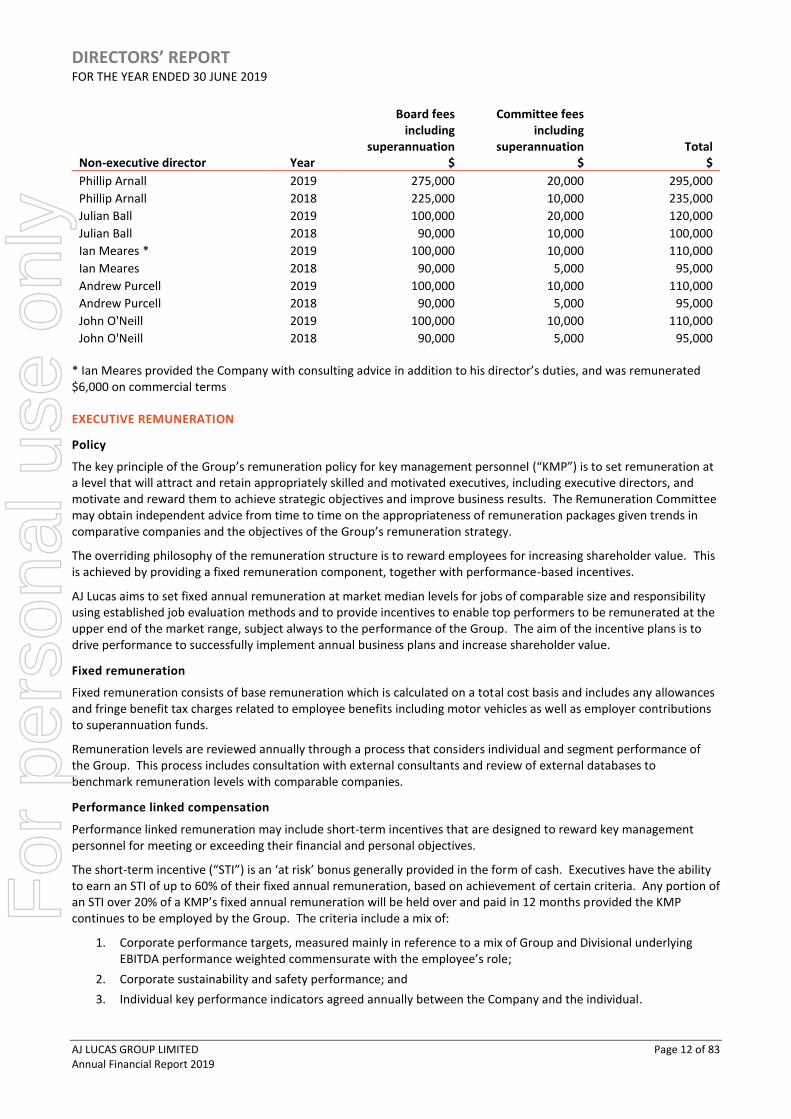
The following table presents details of the remuneration of each non-executive director.
For
per
sona
l use
onl
y
DIRECTORS’ REPORT FOR THE YEAR ENDED 30 JUNE 2019
AJ LUCAS GROUP LIMITED Page 12 of 83 Annual Financial Report 2019
Non-executive director Year
Board fees including
superannuation $
Committee fees including
superannuation $
Total $
Phillip Arnall 2019 275,000 20,000 295,000
Phillip Arnall 2018 225,000 10,000 235,000
Julian Ball 2019 100,000 20,000 120,000
Julian Ball 2018 90,000 10,000 100,000
Ian Meares * 2019 100,000 10,000 110,000
Ian Meares 2018 90,000 5,000 95,000
Andrew Purcell 2019 100,000 10,000 110,000
Andrew Purcell 2018 90,000 5,000 95,000
John O'Neill 2019 100,000 10,000 110,000
John O'Neill 2018 90,000 5,000 95,000
* Ian Meares provided the Company with consulting advice in addition to his director’s duties, and was remunerated $6,000 on commercial terms
EXECUTIVE REMUNERATION
Policy
The key principle of the Group’s remuneration policy for key management personnel (“KMP”) is to set remuneration at a level that will attract and retain appropriately skilled and motivated executives, including executive directors, and motivate and reward them to achieve strategic objectives and improve business results. The Remuneration Committee may obtain independent advice from time to time on the appropriateness of remuneration packages given trends in comparative companies and the objectives of the Group’s remuneration strategy.
The overriding philosophy of the remuneration structure is to reward employees for increasing shareholder value. This is achieved by providing a fixed remuneration component, together with performance-based incentives.
AJ Lucas aims to set fixed annual remuneration at market median levels for jobs of comparable size and responsibility using established job evaluation methods and to provide incentives to enable top performers to be remunerated at the upper end of the market range, subject always to the performance of the Group. The aim of the incentive plans is to drive performance to successfully implement annual business plans and increase shareholder value.
Fixed remuneration
Fixed remuneration consists of base remuneration which is calculated on a total cost basis and includes any allowances and fringe benefit tax charges related to employee benefits including motor vehicles as well as employer contributions to superannuation funds.
Remuneration levels are reviewed annually through a process that considers individual and segment performance of the Group. This process includes consultation with external consultants and review of external databases to benchmark remuneration levels with comparable companies.
Performance linked compensation
Performance linked remuneration may include short-term incentives that are designed to reward key management personnel for meeting or exceeding their financial and personal objectives.
The short-term incentive (“STI”) is an ‘at risk’ bonus generally provided in the form of cash. Executives have the ability to earn an STI of up to 60% of their fixed annual remuneration, based on achievement of certain criteria. Any portion of an STI over 20% of a KMP’s fixed annual remuneration will be held over and paid in 12 months provided the KMP continues to be employed by the Group. The criteria include a mix of:
1. Corporate performance targets, measured mainly in reference to a mix of Group and Divisional underlying EBITDA performance weighted commensurate with the employee’s role;
2. Corporate sustainability and safety performance; and
3. Individual key performance indicators agreed annually between the Company and the individual.
For
per
sona
l use
onl
y

DIRECTORS’ REPORT FOR THE YEAR ENDED 30 JUNE 2019
AJ LUCAS GROUP LIMITED Page 13 of 83 Annual Financial Report 2019
Any STI payment is subject to review by the Board and it may on a case by case basis decide to award additional discretionary incentives to reward exceptional performance.
Relationship of remuneration to Company performance
In considering the Group’s performance and benefits for shareholder value, the Human Resources and Nominations Committee has had regard to the following indices in respect of the current financial year and the previous four financial years.
Year ended 30 June 2019 2018 2017 2016 2015
Total revenue ($'000) (1) 143,442 124,702 73,374 79,633 145,028
Underlying EBITDA (1) 20,412 14,916 (1,952) 14,556 9,405
Net loss after tax attributable to members ($'000) (39,390) (16,271) (39,030) (19,485) (45,216)
Loss per share (cents) (5.3) (2.5) (9.7) (6.7) (16.9)
Dividend per share (cents) – – – – –
Share price at balance date $0.08 $0.33 $0.22 $0.18 $0.39
Share price appreciation/(depreciation) (76%) 50% 22% (54%) (58%) STI to KMP in relation to the year's performance ($'000) 569 331 – 482 54
(1) In 2018 a decision was made to discontinue the Lucas Engineering and Construction division. Total revenue and Underlying EBITDA in the above table includes only results from continuing operations from FY 2017 and onwards. Refer Note 16 to the financial statements for further details in regard to the disposal of the Lucas Engineering and Construction division.
The Group’s underlying EBITDA significantly exceeded the target, having improved over the last two years despite the decision to discontinue the Engineering and Construction business in December 2017 preventing new contracts being sought to replenish work. As such, and noting the achievement of certain individual key performance indicators, bonuses totaling $568,650 for key management personnel were accrued. These will be paid in two tranches, with the first $188,550 payable following the release of the 30 June 2019 audited Annual Financial Statements, with the remainder payable in June 2020 provided the KMP continues to be employed by the Group. A total of $330,500 in cash bonuses was paid in 2019 in two tranches in respects of the 2018 financial year. No loans were made at any time during the year and no loans remain outstanding to any key management personnel (2018 nil).
For
per
sona
l use
onl
y

DIRECTORS’ REPORT FOR THE YEAR ENDED 30 JUNE 2019
AJ LUCAS GROUP LIMITED Page 14 of 83 Annual Financial Report 2019
Executive director’s and officers’ remuneration
Details of the nature and amount of each element of remuneration of each executive director of the Company and other key mana gement personnel (KMP) of the Group are:
SHORT-TERM POST EMPLOYMENT OTHER
LONG TERM
Salary/ fees (1)
$
Incentives accrued (2)
$ Retentions accrued (3)
Total $
Superannuation
benefits $
Termination benefit
$
Long term benefits
(long service leave)
$ Total
$
Proportion of remuneration performance
related %
Executive officers
Austen Perrin 2019 494,169 289,720 160,000 943,889 25,000 – 10,482 979,371 29.58%
Group CFO 2018 456,545 44,900 – 501,445 25,000 – 6,790 533,235 8.42%
Brett Tredinnick 2019 452,737 278,930 – 731,667 20,531 – 8,294 760,492 36.68%
CEO Drilling 2018 420,811 250,000 – 670,811 20,048 – 9,565 700,424 35.69%
John Stuart-Robertson (4) 2019 68,281 – – 68,281 2,720 237,881 2,562 311,444 0.00%
EGM - Pipelines 2018 370,140 35,600 – 405,740 20,048 – 6,177 431,965 8.24%
(1) Salary and wages earned including any allowances and accrued annual leave.
(2) Incentives in respect of the 2018 financial years were accrued in 2018 but paid over two tranches in 2019. The majority was paid following public release of the 2018 annual audited financial statements in August 2018 with $100,000 of the incentive attributable to the CEO of Drilling deferred and paid in June 2019.
Incentives in respect of the 2019 financial year were accrued in 2019, with one third payable following public release of the 2019 annual audited financial statements and the remainder deferred to 30 June 2020.
(3) A retention payment of $200,000 agreed in June 2018 becomes payable to the Group Chief Financial Officer on 30 September 2019 subject to continued employment with the Group. A time-based proportionate amount is included in the table above.
(4) The Executive General Manager Pipelines ceased being an employee and KMP of the Group on 1 August 2018 following the sale of the assets of the Engineering and Construction division. His termination benefit consisted payment in lieu of notice of 6 months and severance in accordance with statutory obligations.
For
per
sona
l use
onl
y

DIRECTORS’ REPORT FOR THE YEAR ENDED 30 JUNE 2019
AJ LUCAS GROUP LIMITED Page 15 of 83 Annual Financial Report 2019
Service agreements
All key management personnel are employed under contract which outlines components of remuneration but does not prescribe how remunerations levels are modified year to year. The Board has the ability to provide discretionary benefits which may fall outside existing incentive programs under the terms of these contracts, for example, in relation to major projects. Remuneration levels are reviewed every year to take into account cost of living changes, any change in the scope of the role performed, any changes required to meet the principles of the remuneration policy and the Group’s performance.
The service contracts are unlimited in term. All contracts with executive officers can be terminated with up to 9 months’ notice by the Company. The Company can choose to forfeit the notice period with an equivalent amount of compensation payable to the employee.
The Chief Financial Officer is entitled to a retention payment of $200,000 payable on 30 September 2019 subject to continued employment with the Group at that date.
External remuneration consultant advice
The Groups policy is for the Groups key management personnel remuneration to be reviewed by a remuneration consultant every 2 years, with the last review taking place in 2018.
Options over equity instruments granted as compensation
No options over ordinary shares in the Company were granted as compensation to key management personnel during the reporting period. There were no outstanding options at the beginning of the financial year.
Analysis of movements in shares
The movement during the reporting period in the number of ordinary shares of the Company held directly, indirectly or beneficially by each key management person, including their related parties, is as follows:
2019 Held at 30 June 2018 Purchased Net other changes
Held at 30 June 2019
Director
Phillip Arnall 306,250 – – 306,250
Andrew Purcell 270,310 – – 270,310
John O'Neill 16,237,595 – – 16,237,595
Executives
Brett Tredinnick 345,722 – – 345,722
John Stuart-Robertson 33,972 – – 33,972
Austen Perrin 187,182 – – 187,182
Signed in accordance with a resolution of the directors pursuant to s.298 (2) of the Corporations Act 2001.
Phillip Arnall,
Chairman
Dated at Sydney, this 30th day of August 2019
For
per
sona
l use
onl
y
Corporate Governance Report FOR THE YEAR ENDED 30 JUNE 2019
AJ LUCAS GROUP LIMITED Page 16 of 83 Annual Financial Report 2019
CORPORATE GOVERNANCE STATEMENT
The Board of directors (“The Board”) is responsible for the corporate governance of the Group. The Board considers strong Corporate Governance to be core to ensuring the creation, the enhancement and protection of shareholder value. Accordingly, the Group adopted the 3rd Edition of the ASX Corporate Governance Principles and Recommendations, in 1 July 2014.
The Board believes that a company’s corporate governance policies should be tailored to account for the size, complexity and structure of the company and the risks associated with the company’s operations. The ASX Corporate Governance Council allows companies to explain deviations from the Council’s recommendations. Areas where the Group has deviated from the Council’s recommendations at any time during the financial year are discussed below, however the Board believes the areas of non-conformance do not impact on the Group’s ability to operate with the highest standards of Corporate Governance.
This statement outlines the main corporate governance practices of the Group. Unless otherwise stated, these practices were in place for the entire year.
FOUNDATIONS FOR MANAGEMENT AND OVERSIGHT
Roles and responsibilities
The directors of the Company are accountable to shareholders for the proper management of the business and affairs of the Company. The key responsibilities of the Board include the following:
• contributing to and approving the corporate strategy for the Group;
• monitoring the organisation’s performance and achievement of its corporate strategy;
• approving and monitoring the progress of significant corporate projects, including acquisitions or divestments;
• reviewing and approving the annual business plan and financial budget;
• monitoring financial performance, including preparation of financial reports and liaison with the auditors;
• appointment and performance assessment of the executive directors;
• ensuring that significant risks have been identified and appropriate controls put in place;
• overseeing legal compliance and reporting requirements of the law; and
• monitoring capital requirements and initiating capital raisings.
The Board’s responsibilities are documented in a written Board Charter which is available in the shareholder information section of the Company’s website. The Board Charter details the functions reserved to the Board, the roles and responsibilities of the Chairman and the responsibilities delegated to management. The Board Charter also gives the Directors the right to seek independent professional advice, at the Group’s expense, on matters relevant to carrying out their duties.
The Company Secretary is appointed by the Board and is accountable directly to the Board, through the Chairman, on all matters to do with the proper functioning of the Board. Each Director is able to communicate directly with the Company Secretary and vice versa.
Appointment and Re-Election of Directors
Through periodic reviews of the Board composition and succession planning, the Board seeks to ensure that the skills, knowledge, experience, independence and diversity of the Board are appropriate for the present and future requirements of the Group. The Human Resources and Nominations Committee actively seeks to identify, and recommends to the Board for appointment, directors whose skills and attributes complement and enhance the effective operation of the Board.
Background checks are conducted prior to appointing any new Director, with each Non-Executive Director being required to specifically acknowledge that they have and will continue to have the time to discharge their responsibilities to the Company.
The constitution requires one third of all directors, to retire from office at each AGM and can present themselves for re-election at which time the Board will provide direction to shareholders of support or otherwise. No Director can hold office for more than 3 years without presenting for re-election, and any Director appointed by the Directors during the year to fill a casual vacancy is required to also present for election at the first Annual General Meeting (“AGM”)
For
per
sona
l use
onl
y
Corporate Governance Report FOR THE YEAR ENDED 30 JUNE 2019
AJ LUCAS GROUP LIMITED Page 17 of 83 Annual Financial Report 2019
following their initial appointment. All information relevant to a decision on whether or not to elect or re-elect a Director is included in the Notice of AGM.
Review of Performance
The Board continually assesses its performance, the performance of its committees and individual Directors through a structured bi-annual review process. The Board may at times engage the assistance of external consultants to facilitate formal Board performance reviews.
The performance of all senior executives is reviewed annually by the Chairman of the Board in consultation with the Human Resources and Nominations Committee.
Diversity
AJ Lucas is committed to a diverse and inclusive workplace which supports business objectives, delivers competitive advantages and benefits shareholders and customers. The Group is committed to ensuring all employees are treated fairly, equally and with respect no matter what their race, ethnicity, gender, sexual orientation, socio-economic status, culture, age, physical ability, education, skill levels, family status, religious, political and other beliefs and work styles. A copy of the Group’s Diversity Policy is available in the shareholder information section of the Company’s website.
While the Board is committed to achieving gender diversity it is of the view that imposed targets, in particular considering the current market conditions, would not be of benefit and could result in hiring decisions that are contrary to the ultimate goal of “best fit” for purpose. As such, the Group’s Diversity Policy does not at this time require the Company to set measurable objectives for achieving gender diversity.
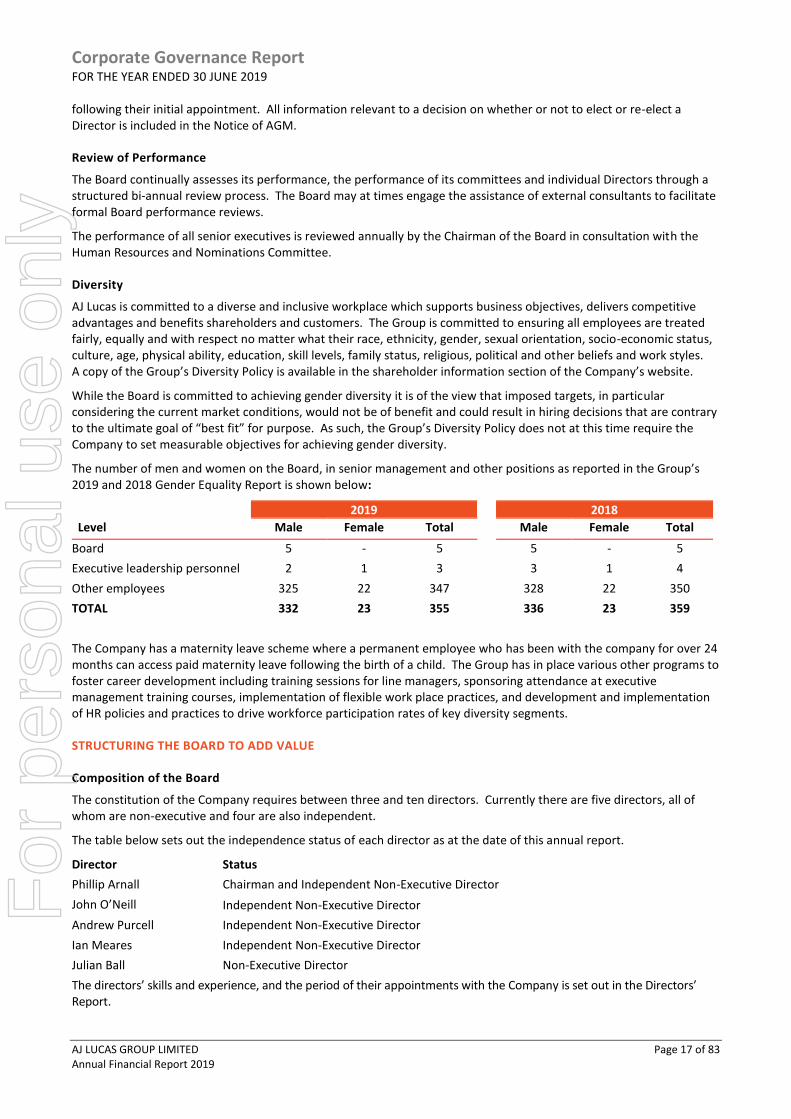
The number of men and women on the Board, in senior management and other positions as reported in the Group’s 2019 and 2018 Gender Equality Report is shown below:
2019 2018
Level Male Female Total Male Female Total
Board 5 - 5 5 - 5
Executive leadership personnel 2 1 3 3 1 4
Other employees 325 22 347 328 22 350
TOTAL 332 23 355 336 23 359
The Company has a maternity leave scheme where a permanent employee who has been with the company for over 24 months can access paid maternity leave following the birth of a child. The Group has in place various other programs to foster career development including training sessions for line managers, sponsoring attendance at executive management training courses, implementation of flexible work place practices, and development and implementation of HR policies and practices to drive workforce participation rates of key diversity segments.
STRUCTURING THE BOARD TO ADD VALUE
Composition of the Board
The constitution of the Company requires between three and ten directors. Currently there are five directors, all of whom are non-executive and four are also independent.
The table below sets out the independence status of each director as at the date of this annual report.
Director Status
Phillip Arnall Chairman and Independent Non-Executive Director
John O’Neill Independent Non-Executive Director
Andrew Purcell Independent Non-Executive Director
Ian Meares Independent Non-Executive Director
Julian Ball Non-Executive Director
The directors’ skills and experience, and the period of their appointments with the Company is set out in the Directors’ Report.
For
per
sona
l use
onl
y
Corporate Governance Report FOR THE YEAR ENDED 30 JUNE 2019
AJ LUCAS GROUP LIMITED Page 18 of 83 Annual Financial Report 2019
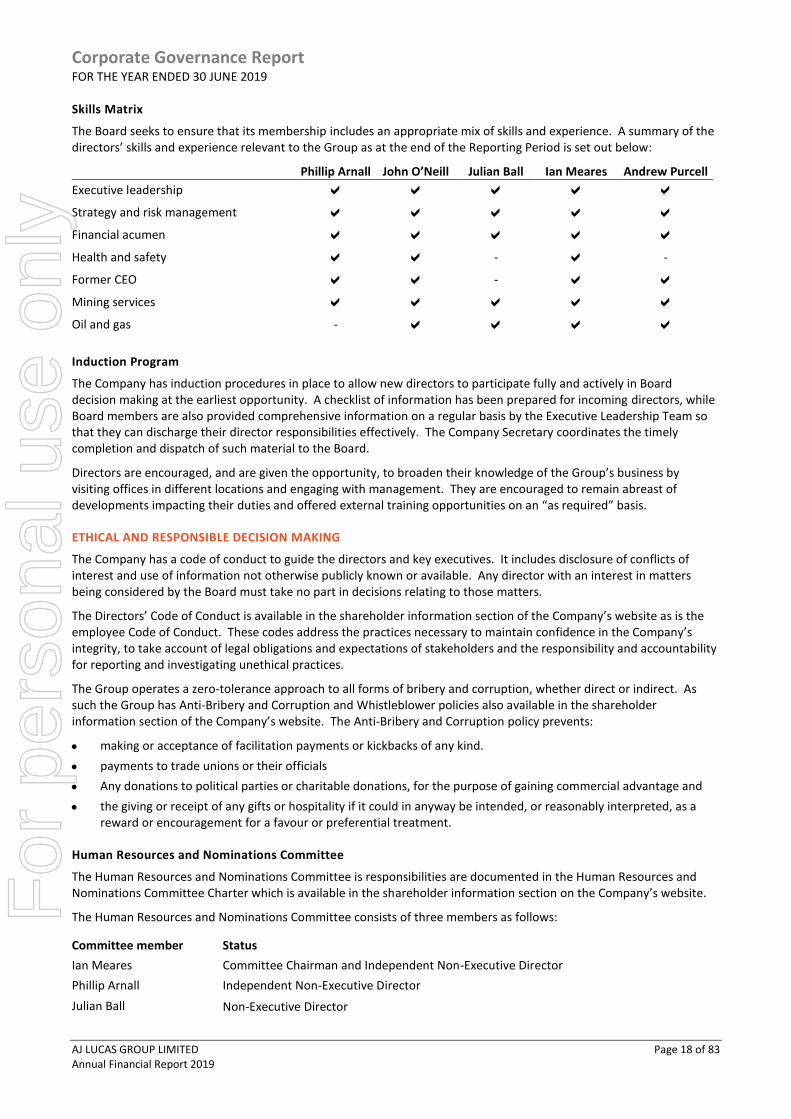
Skills Matrix
The Board seeks to ensure that its membership includes an appropriate mix of skills and experience. A summary of the directors’ skills and experience relevant to the Group as at the end of the Reporting Period is set out below:
Phillip Arnall John O’Neill Julian Ball Ian Meares Andrew Purcell
Executive leadership
Strategy and risk management
Financial acumen
Health and safety - -
Former CEO -
Mining services
Oil and gas -
Induction Program
The Company has induction procedures in place to allow new directors to participate fully and actively in Board decision making at the earliest opportunity. A checklist of information has been prepared for incoming directors, while Board members are also provided comprehensive information on a regular basis by the Executive Leadership Team so that they can discharge their director responsibilities effectively. The Company Secretary coordinates the timely completion and dispatch of such material to the Board.
Directors are encouraged, and are given the opportunity, to broaden their knowledge of the Group’s business by visiting offices in different locations and engaging with management. They are encouraged to remain abreast of developments impacting their duties and offered external training opportunities on an “as required” basis.
ETHICAL AND RESPONSIBLE DECISION MAKING
The Company has a code of conduct to guide the directors and key executives. It includes disclosure of conflicts of interest and use of information not otherwise publicly known or available. Any director with an interest in matters being considered by the Board must take no part in decisions relating to those matters.
The Directors’ Code of Conduct is available in the shareholder information section of the Company’s website as is the employee Code of Conduct. These codes address the practices necessary to maintain confidence in the Company’s integrity, to take account of legal obligations and expectations of stakeholders and the responsibility and accountability for reporting and investigating unethical practices.
The Group operates a zero-tolerance approach to all forms of bribery and corruption, whether direct or indirect. As such the Group has Anti-Bribery and Corruption and Whistleblower policies also available in the shareholder information section of the Company’s website. The Anti-Bribery and Corruption policy prevents:
• making or acceptance of facilitation payments or kickbacks of any kind.
• payments to trade unions or their officials
• Any donations to political parties or charitable donations, for the purpose of gaining commercial advantage and
• the giving or receipt of any gifts or hospitality if it could in anyway be intended, or reasonably interpreted, as a reward or encouragement for a favour or preferential treatment.
Human Resources and Nominations Committee
The Human Resources and Nominations Committee is responsibilities are documented in the Human Resources and Nominations Committee Charter which is available in the shareholder information section on the Company’s website.
The Human Resources and Nominations Committee consists of three members as follows:
Committee member Status
Ian Meares Committee Chairman and Independent Non-Executive Director
Phillip Arnall Independent Non-Executive Director
Julian Ball Non-Executive Director
For
per
sona
l use
onl
y
Corporate Governance Report FOR THE YEAR ENDED 30 JUNE 2019
AJ LUCAS GROUP LIMITED Page 19 of 83 Annual Financial Report 2019
INTEGRITY IN FINANCIAL REPORTING
The Board has established an Audit and Risk Committee which provides assistance to the Board in fulfilling its corporate governance and oversight responsibilities in relation to the Company’s financial reporting, internal control systems, risk management systems, regulatory compliance and external audit. The Audit and Risk Committee is governed by the Audit and Risk Committee Charter which is available in the shareholder information section of the Company’s website.
The Committee must have at least three members, all of whom are non-executive directors and the majority of whom are independent. The Committee must be chaired by an independent chair, who is not chair of the board. At least one member must have financial expertise and some members shall have an understanding of the industry in which the Company operates.
Members of the Audit and Risk Committee as at the date of this report and throughout the financial year are set out in the following table. Their qualifications and experience are set out in the Directors’ Report.
Committee Member Status
John O’Neill Committee Chairman and Independent Non-Executive Director
Phillip Arnall Independent Non-Executive Director
Andrew Purcell Independent Non-Executive Director
Julian Ball Non-Executive Director
The principal roles of the Committee are to:
• assess whether the accounting methods and statutory reporting applied by management are consistent and comply with accounting standards and applicable laws and regulations;
• make recommendations on the appointment of the external auditors, assess their performance and independence and ensure that management responds to audit findings and recommendations;
• discuss the adequacy and effectiveness of the Company’s internal control systems and policies to assess and manage business risks, its legal and regulatory compliance programmes; and
• ensure effective monitoring of the Company’s compliance with its codes of conduct and Board policy statements.
The Audit and Risk Committee meets with the external auditors at least twice a year. The Committee is authorised to seek information from any employee or external party and obtain legal or other professional advice.
The Committee co-operates with its external auditors in the selection, appointment and 5 yearly rotation of external audit engagement partners.
TIMELY AND BALANCED DISCLOSURE
The Company has established policies and procedures designed to ensure compliance with ASX listing rules, continuous disclosure requirements and accountability for compliance at a senior level so that investors have equal and timely access to material information that in the opinion of the Board is likely to have an impact on an investment decision in the Company or impact on the Company’s share price.
The Company has a Continuous Disclosure and Communications Policy, a copy of which is in the shareholder information section of its website.
COMMUNICATION WITH SECURITY HOLDERS
The Board keeps shareholders informed of all material information relating to the Company by communicating to shareholders through:
• continuous disclosure reporting to the ASX;
• its annual reports; and
• media releases and other investor relations publications on the Group’s website.
All company announcements lodged with the ASX are available in the shareholder information section of the Company’s website. Shareholders have the option to receive communications from, and send communications to, the Company’s Share Registry electronically, including the annual report and the notice of annual general meeting. Additionally, shareholders and potential investors are able to post questions to the company through the Company’s
For
per
sona
l use
onl
y

Corporate Governance Report FOR THE YEAR ENDED 30 JUNE 2019
AJ LUCAS GROUP LIMITED Page 20 of 83 Annual Financial Report 2019
website or by telephone. The Board and senior management endeavor to respond to queries from shareholders and analysts for information in relation to the Group provided the information requested is not price sensitive or is already publicly available.
The Company has a website which provides useful and easy to find information about the Company, its directors and management, its operations and investments.
The Company provides the Notice of AGM to all shareholders and makes it available on the Company’s website. The AGM is the key forum for two-way communication between the Company and its shareholders. At the meeting, the Chairman encourages questions and comments from shareholders and seeks to ensure that shareholders are given ample opportunity to participate. Further, the Company’s external auditor attends the annual general meeting and is available to answer shareholder questions about the conduct of the audit and the preparation and content of the auditor’s report.
RISK IDENTIFICATION AND MANAGEMENT
The Board continues to be committed to embedding risk management practices to support the achievement of business objectives. As such the Board has established the Audit and Risk Committee which is responsibility for reviewing and overseeing the risk management strategy of the Group and for ensuring it has an appropriate corporate governance structure. The Audit and Risk Committee discusses with management and the external auditors, at least bi-annually:
• Internal controls systems;
• Policies and procedures to assess, monitor, and manage business, economic, environmental and social sustainability risks;
• Insurance program having regard to the insurable risks and the cost of this cover; and
• Legal and regulatory compliance programs.
A risk register is maintained and reported to the Audit and Risk Committee periodically and at least annually, detailing likelihood and severity of risks occurring. Management undertakes a review of its insurable risks each year in order to fully consider potential impacts and how they are financed in terms of limits and scope under the Group’s insurance program. Both these reviews took place during the year.
Further details of the structure, membership and responsibilities of the Audit and Risk Committee are provided under the “Integrity in Financial Reporting” heading in this Corporate Governance Statement.
Within this framework, management has designed and implemented a risk management and internal control system to manage material business risks. Both the Chairman and Chief Financial Officer provide representation to the Audit and Risk Committee and the Board that the risk management system is operating effectively in all material respects in relation to financial reporting risks.
The Company has, in accordance with the Australian Standard on risk management AS/NZS ISO 31000:2009, developed a risk statement and underlying procedures for the key risk areas of People, Environment, Business and Reputation. The Company has had a number of external audits of particular types of risk during the year. A copy of the risk statement and the risk management policy are available in the shareholder information section of the Company’s website.
The Group does not currently have an independent internal audit function, the Board being of the view that the size and complexity of the Company does not warrant such a function. The Group’s operations and facilities are however subjected to regular audits, performed by a mix of internal safety and auditing experts, and external consultants, under an annual program of Health, Safety, Environment and Quality audits. In addition, the Audit and Risk Committee engages external consultants to review areas of the business as it sees fit, with a number of these performed during the year.
For
per
sona
l use
onl
y

Corporate Governance Report FOR THE YEAR ENDED 30 JUNE 2019
AJ LUCAS GROUP LIMITED Page 21 of 83 Annual Financial Report 2019
The Group’s material exposures to risk, and how the Group responds and manages these risks is detailed below.
Material Risk Risk Management Approach
External Risks
Risks may arise from the flow through of commodity demand or pricing from major markets into our customer base as well as foreign exchange, regulatory and political events that may impact the long-term sustainability of our customers’ business model.
Client focused organisational design, with a focus on regular communication with key clients addressing various matters including safety, contract performance and clients future work programs. Continual repositioning of the business, and a relentless focus on efficiency and cost reduction to meet current client expectations on existing work programs, whilst anticipating upcoming changes in service demand.
Where appropriate the broadening of our portfolio of service offerings, commodity and geographical exposure is considered to reduce the effect of volatility introduced by these external risks where it makes sense to do so.
Business Risks
Risks include the risk of funding the identification and proving reserves relating to our unconventional assets.
The Company has dedicated financial reserves to apply to the shale gas project in the UK and will seeks to raise additional capital to support ongoing needs for the exploration and development of these unconventional assets as needed. Recently, the UK Government made an announcement concerning its position on shale gas exploration noting the potential benefits local UK shale gas could deliver, including its role as an important new domestic energy source reducing the level of gas imported.
Financial Risks
Volatility in commodity markets may adversely impact future cash flows and, as such, our credit rating and ability to source capital from financial markets. In addition, our commercial counterparties may as a result of adverse market conditions fail to meet their commercial obligations.
The Company is currently undertaking a refinancing of its existing senior loan notes facility to provide a longer-term finance facility to provide a more stable balance sheet. The company raises additional capital from equity markets as required to fund exploration and development activities of its unconventional assets in the UK. We seek to continuously improve our credit rating and key financial ratio analysis to monitor potential volatility in this area. Similarly, all customers and key suppliers credit limits are reviewed before services are established.
Operational Risks
Cost pressures and reduced productivity could negatively impact both operating margins and our market competitiveness. Similarly, a significant adverse and unexpected natural or operational event could impact operations in a materially negative manner, as could a breach in IT and other security processes.
We seek to maintain adequate operating margins across our business by monitoring in absolute and relative terms the performance of all assets against both internal and external commercial benchmarks. Our concentrated effort to reduce costs and hence maintain competitiveness and margin has yielded tangible results in reducing our controllable costs. This includes initiatives to standardise processes and control systems across the Group. The Lucas Management System (LMS) is an integrated process by which we manage this standardised approach. Through the regular application of our risk management procedures we identify the potential for significant and or unexpected risks and implement the controls appropriate to remove or mitigate them. Business continuity plans are developed for all our IT systems such that the integrity of our systems allows us to recover from a “disaster event” with little impact on the daily operations. With the sale of the Group’s Engineering and Construction assets and the wind down of associated business activity, operational exposure to the pipeline and construction industry has been eliminated.
Sustainability Risks
Injuring employees, damaging the environment or having material regulatory or governance failures may put at risk our social licence to operate or significantly impact our reputation such that customers and / or capital markets may shun us.
The LMS puts in place a significant set of requirements to ensure the safe work environment of our employees, and the operation of our assets and equipment. Inclusive in this are the control and governance requirements required of good finance and accounting procedures. A broad range of policies and procedures outline both expected and required actions and behaviours of management and staff to achieve these objectives. Maintenance of a safe working environment is a principal accountability of all levels of management. The Board holds itself to account against the standards outlined in the ASX Corporate Governance Principles and Recommendations 3rd edition as an example of good governance and reporting procedures and requirements.
For
per
sona
l use
onl
y

Corporate Governance Report FOR THE YEAR ENDED 30 JUNE 2019
AJ LUCAS GROUP LIMITED Page 22 of 83 Annual Financial Report 2019
Material Risk Risk Management Approach
UK Licence Risk
The risk of loss of Government support for the development of shale gas in the UK.
Cuadrilla, the Operator of the UK shale gas exploration licences works closely with the various Government departments to ensure legal and regulatory compliance and maintains strong working relationships with local and national authorities. The UK Government has recently noted the potential benefits local shale gas could deliver, including its role as an important new domestic energy source reducing the level of gas imported.
REMUNERATION
The Human Resources and Nominations Committee reviews the remuneration of the non-executive directors, and key executives.
Members of the Human Resources and Nominations Committee as at the date of this report and throughout the financial year are set out in the following table. Their qualifications and experience are set out in the Directors’ Report.
Name Position at date of report
Ian Meares (Chairman) Independent non-executive director
Phillip Arnall Independent non-executive director
Julian Ball Non-executive director
The Human Resources and Nominations Committee Charter is available in the shareholder information section of the Company’s website. The number of meetings and who attended those meeting throughout the year is disclosed in the Directors report.
The Human Resources and Nominations Committee benchmarked the non-executive director remuneration levels paid by the company against a selection of comparable peer companies as well as the average and medium remuneration paid by the top 300 ASX listed companies. As a result of this review the level of non-executive director remuneration was altered with effect from 1 July 2018 to be more in line with the average level of ASX 300 companies for the next financial year, having last being set in 2013 in accordance with the recommendations of a remuneration consultants, with the only change since being an increase in the Chairman’s remuneration effective 1 July 2016 to account for additional workload due to the departure and non-replacement of the CEO. Remuneration of Directors is disclosed in the Remuneration Report.
The Company’s non-executive directors receive fees for acting as a director of the Company. Additional fees are payable for being a member of a Board committee or representing the Group in specific matters from time to time. Senior executives are remunerated based on a fixed wage plus incentive payments. The policies and practices for remuneration of Key Management Personnel is disclosed in the Remuneration Report .
Trading in Company securities
The Company has in place a Securities Trading Policy which restricts the times and circumstances in which directors, senior executives and certain employees may buy or sell shares in the Company. These persons are required to seek approval from the Company Secretary prior to trading.
Directors must also advise the Company, which advises the ASX on their behalf, of any transactions conducted by them in the Company’s securities within five business days after the transaction occurs. The Securities Trading Policy is available in the shareholder information section of the Company’s website. F
or p
erso
nal u
se o
nly
For
per
sona
l use
onl
y
FINANCIAL STATEMENTS
AJ LUCAS GROUP LIMITED Page 24 of 83 Annual Financial Report 2019
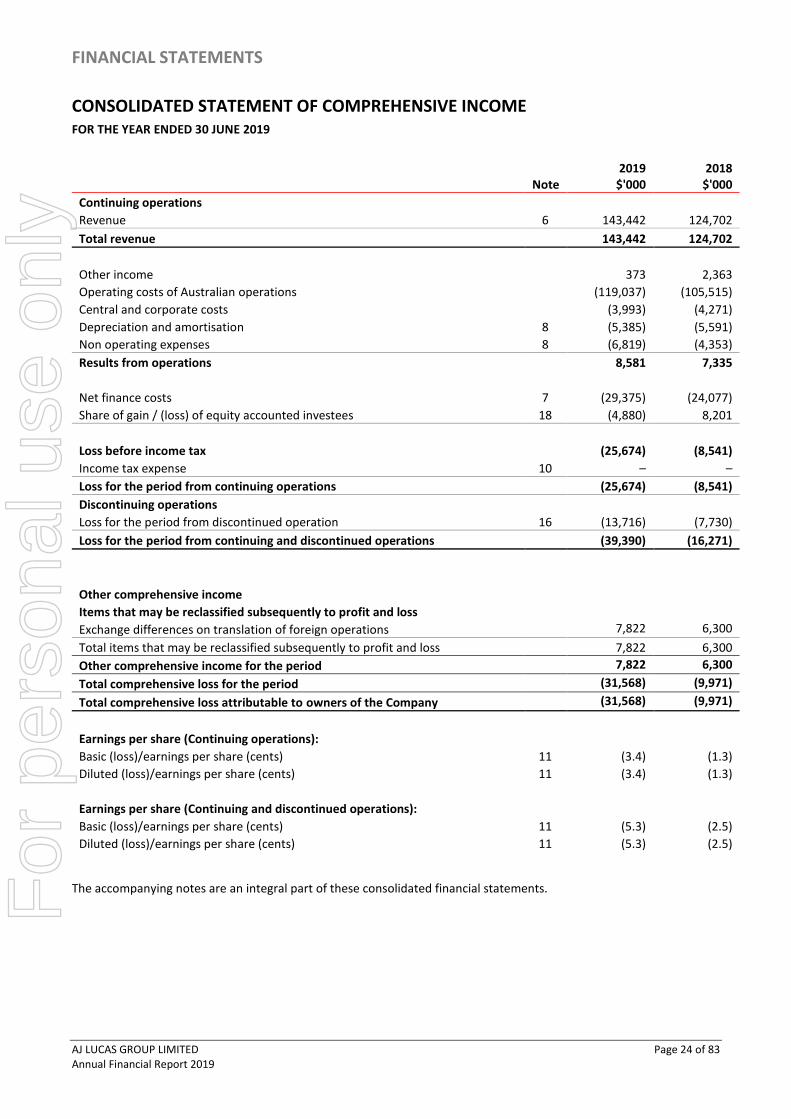
CONSOLIDATED STATEMENT OF COMPREHENSIVE INCOME FOR THE YEAR ENDED 30 JUNE 2019
Note 2019
$'000 2018
$'000
Continuing operations
Revenue 6 143,442 124,702
Total revenue 143,442 124,702
Other income 373 2,363
Operating costs of Australian operations (119,037) (105,515)
Central and corporate costs (3,993) (4,271)
Depreciation and amortisation 8 (5,385) (5,591)
Non operating expenses 8 (6,819) (4,353)
Results from operations 8,581 7,335
Net finance costs 7 (29,375) (24,077)
Share of gain / (loss) of equity accounted investees 18 (4,880) 8,201
Loss before income tax (25,674) (8,541)
Income tax expense 10 – –
Loss for the period from continuing operations (25,674) (8,541)
Discontinuing operations
Loss for the period from discontinued operation 16 (13,716) (7,730)
Loss for the period from continuing and discontinued operations (39,390) (16,271)
Other comprehensive income
Items that may be reclassified subsequently to profit and loss
Exchange differences on translation of foreign operations 7,822 6,300
Total items that may be reclassified subsequently to profit and loss 7,822 6,300
Other comprehensive income for the period 7,822 6,300
Total comprehensive loss for the period (31,568) (9,971)
Total comprehensive loss attributable to owners of the Company (31,568) (9,971)
Earnings per share (Continuing operations):
Basic (loss)/earnings per share (cents) 11 (3.4) (1.3)
Diluted (loss)/earnings per share (cents) 11 (3.4) (1.3)
Earnings per share (Continuing and discontinued operations):
Basic (loss)/earnings per share (cents) 11 (5.3) (2.5)
Diluted (loss)/earnings per share (cents) 11 (5.3) (2.5)
The accompanying notes are an integral part of these consolidated financial statements.
For
per
sona
l use
onl
y
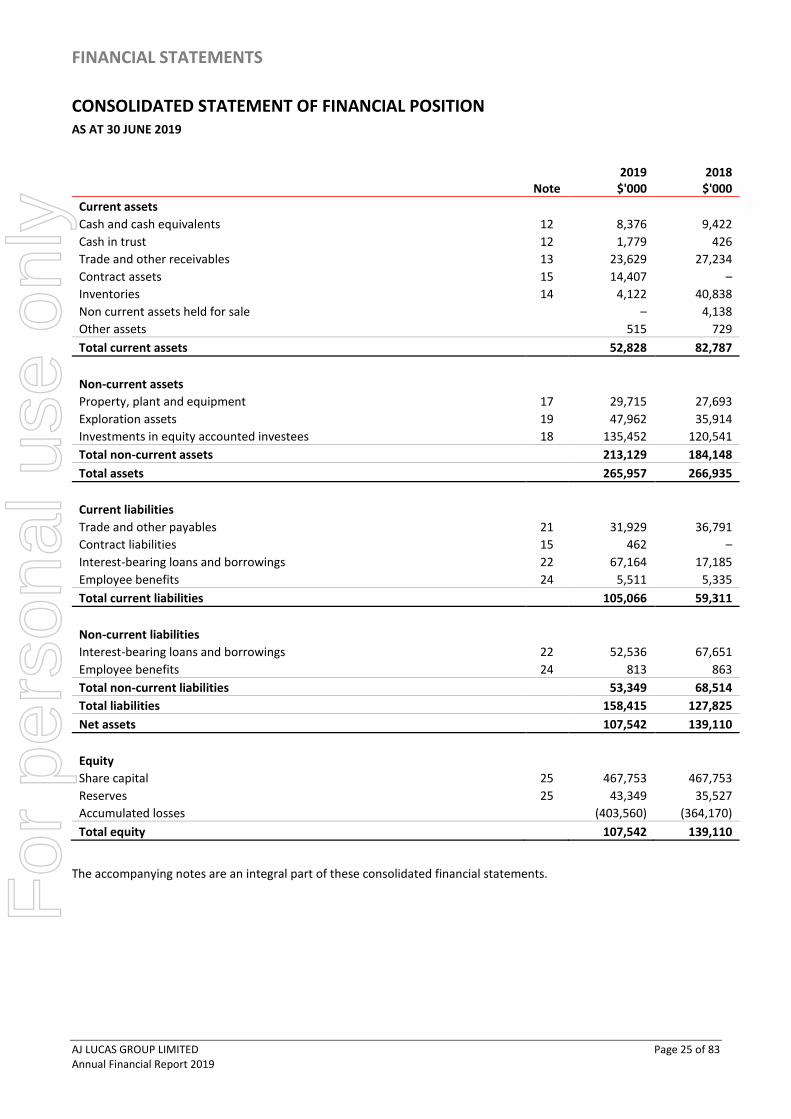
FINANCIAL STATEMENTS
AJ LUCAS GROUP LIMITED Page 25 of 83 Annual Financial Report 2019
CONSOLIDATED STATEMENT OF FINANCIAL POSITION AS AT 30 JUNE 2019
Note 2019
$'000 2018
$'000
Current assets Cash and cash equivalents 12 8,376 9,422
Cash in trust 12 1,779 426
Trade and other receivables 13 23,629 27,234
Contract assets 15 14,407 –
Inventories 14 4,122 40,838
Non current assets held for sale – 4,138
Other assets 515 729
Total current assets 52,828 82,787
Non-current assets Property, plant and equipment 17 29,715 27,693
Exploration assets 19 47,962 35,914
Investments in equity accounted investees 18 135,452 120,541
Total non-current assets 213,129 184,148
Total assets 265,957 266,935
Current liabilities Trade and other payables 21 31,929 36,791
Contract liabilities 15 462 –
Interest-bearing loans and borrowings 22 67,164 17,185
Employee benefits 24 5,511 5,335
Total current liabilities 105,066 59,311
Non-current liabilities Interest-bearing loans and borrowings 22 52,536 67,651
Employee benefits 24 813 863
Total non-current liabilities 53,349 68,514
Total liabilities 158,415 127,825
Net assets 107,542 139,110
Equity Share capital 25 467,753 467,753
Reserves 25 43,349 35,527
Accumulated losses (403,560) (364,170)
Total equity 107,542 139,110
The accompanying notes are an integral part of these consolidated financial statements.
For
per
sona
l use
onl
y
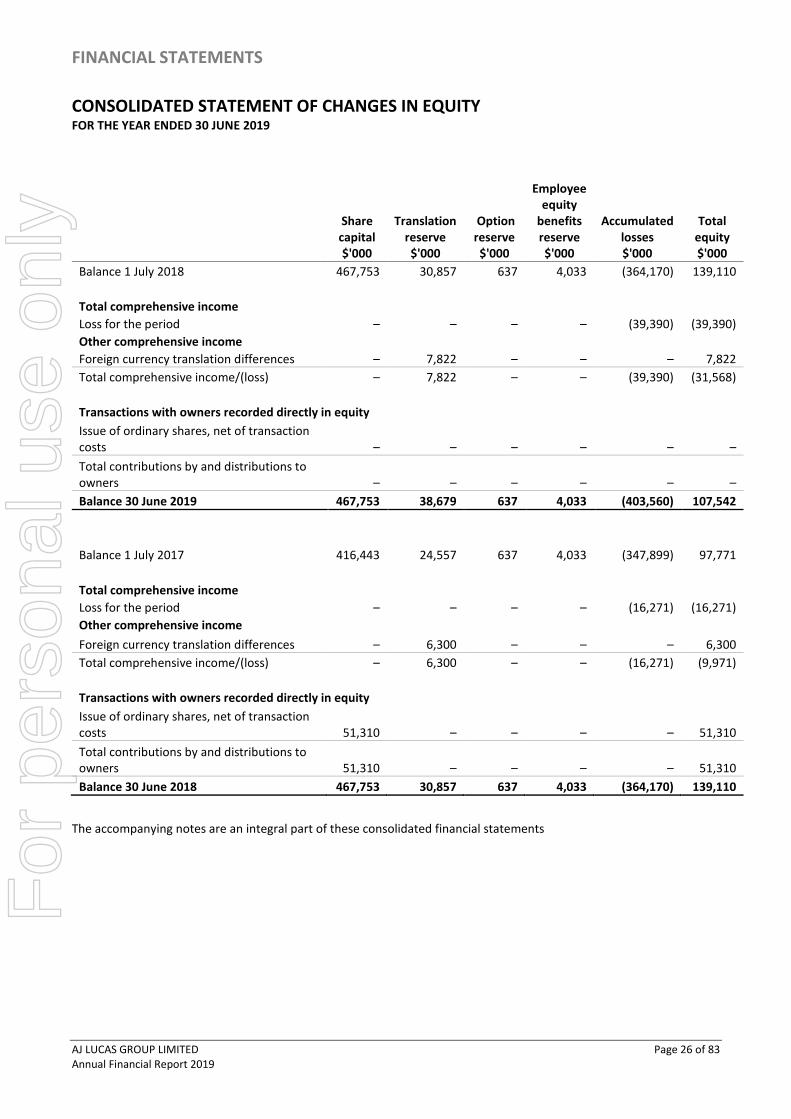
FINANCIAL STATEMENTS
AJ LUCAS GROUP LIMITED Page 26 of 83 Annual Financial Report 2019
CONSOLIDATED STATEMENT OF CHANGES IN EQUITY FOR THE YEAR ENDED 30 JUNE 2019
Share capital $'000
Translation
reserve $'000
Option reserve $'000
Employee
equity benefits reserve $'000
Accumulated losses $'000
Total equity $'000
Balance 1 July 2018 467,753 30,857 637 4,033 (364,170) 139,110
Total comprehensive income
Loss for the period – – – – (39,390) (39,390)
Other comprehensive income Foreign currency translation differences – 7,822 – – – 7,822
Total comprehensive income/(loss) – 7,822 – – (39,390) (31,568)
Transactions with owners recorded directly in equity
Issue of ordinary shares, net of transaction costs – – – – – –
Total contributions by and distributions to owners – – – – – –
Balance 30 June 2019 467,753 38,679 637 4,033 (403,560) 107,542
Balance 1 July 2017 416,443 24,557 637 4,033 (347,899) 97,771
Total comprehensive income Loss for the period – – – – (16,271) (16,271)
Other comprehensive income
Foreign currency translation differences – 6,300 – – – 6,300
Total comprehensive income/(loss) – 6,300 – – (16,271) (9,971)
Transactions with owners recorded directly in equity
Issue of ordinary shares, net of transaction costs 51,310 – – – – 51,310
Total contributions by and distributions to owners 51,310 – – – – 51,310
Balance 30 June 2018 467,753 30,857 637 4,033 (364,170) 139,110
The accompanying notes are an integral part of these consolidated financial statements
For
per
sona
l use
onl
y

FINANCIAL STATEMENTS
AJ LUCAS GROUP LIMITED Page 27 of 83 Annual Financial Report 2019
CONSOLIDATED STATEMENT OF CASH FLOWS FOR THE YEAR ENDED 30 JUNE 2019
Note 2019
$'000 2018
$'000
Cash flows from operating activities Cash receipts from customers 188,712 150,182
Cash paid to suppliers and employees (165,878) (152,792)
Cash generated from / (used in) operations 22,834 (2,610)
Interest received 132 172
Interest and other costs of finance paid (8,123) (10,676)
Net cash generated from / (used in) operating activities 14,843 (13,114)
Cash flows from investing activities Payments for equity accounted investees 18 (13,498) (2,705)
Proceeds from partial sale of interest in exploration licenses – 1,837
Payments for interest in exploration assets (10,249) (12,334)
Acquisition of plant and equipment (7,932) (3,465)
Proceeds from sale of assets held for sale 4,314 –
Proceeds from plant and equipment – 3,160
Net cash used in investing activities (27,365) (13,507)
Cash flows from financing activities Proceeds from borrowings 12,462 –
Repayment of borrowings – (18,215)
Transaction costs on borrowings – (902)
Proceeds from issue of shares – 34,488
Transaction costs on issue of shares – (1,461)
Net cash from financing activities 12,462 13,910
Net decrease in cash and cash equivalents (60) (12,711)
Net foreign exchange difference 367 388
Cash and cash equivalents at beginning of the period 9,848 22,171
Cash and cash equivalents at end of the period 12 10,155 9,848
The accompanying notes are an integral part of these consolidated financial statements.
For
per
sona
l use
onl
y
NOTES TO THE CONSOLIDATED FINANCIAL STATEMENTS 30 JUNE 2019
AJ LUCAS GROUP LIMITED Page 28 of 83 Annual Financial Report 2019
INDEX
1. REPORTING ENTITY .................................................................................................................................................. 29
2. BASIS OF PREPARATION .......................................................................................................................................... 29
3. SIGNIFICANT ACCOUNTING POLICIES ...................................................................................................................... 33
4. NEW STANDARDS AND INTERPRETATIONS NOT YET ADOPTED .............................................................................. 41
5. DETERMINATION OF FAIR VALUES .......................................................................................................................... 41
6. OPERATING SEGMENTS ........................................................................................................................................... 42
7. FINANCE INCOME AND FINANCE COSTS ................................................................................................................. 45
8. OTHER EXPENSES ..................................................................................................................................................... 45
9. AUDITOR’S REMUNERATION ................................................................................................................................... 45
10. INCOME TAX ............................................................................................................................................................ 46
11. EARNINGS PER SHARE ............................................................................................................................................. 47
12. CASH, CASH EQUIVALENTS AND CASH IN TRUST .................................................................................................... 47
13. TRADE AND OTHER RECEIVABLES ............................................................................................................................ 47
14. INVENTORIES ........................................................................................................................................................... 48
15. CONTRACT BALANCES ............................................................................................................................................. 48
16. DISCONTINUED OPERATIONS .................................................................................................................................. 48
17. PROPERTY, PLANT AND EQUIPMENT....................................................................................................................... 49
18. INVESTMENTS IN EQUITY ACCOUNTED INVESTEES ................................................................................................. 49
19. EXPLORATION ASSETS ............................................................................................................................................. 51
20. DEFERRED TAX ASSETS AND LIABILITIES .................................................................................................................. 54
21. TRADE AND OTHER PAYABLES ................................................................................................................................. 55
22. INTEREST-BEARING LOANS AND BORROWINGS ...................................................................................................... 56
23. OPERATING LEASES ................................................................................................................................................. 57
24. EMPLOYEE BENEFITS ............................................................................................................................................... 57
25. CAPITAL AND RESERVES .......................................................................................................................................... 57
26. FINANCIAL INSTRUMENTS ....................................................................................................................................... 59
27. INTERESTS IN JOINT OPERATIONS ........................................................................................................................... 64
28. CONSOLIDATED ENTITIES ........................................................................................................................................ 66
29. CONTINGENCIES AND COMMITMENTS ................................................................................................................... 67
30. PARENT ENTITY DISCLOSURES ................................................................................................................................. 67
31. RECONCILIATION OF CASH FLOWS FROM OPERATING ACTIVITIES ......................................................................... 68
32. RELATED PARTIES .................................................................................................................................................... 69
33. DEED OF CROSS GUARANTEE .................................................................................................................................. 71
34. EVENTS SUBSEQUENT TO THE BALANCE SHEET DATE ............................................................................................ 73
For
per
sona
l use
onl
y
NOTES TO THE CONSOLIDATED FINANCIAL STATEMENTS 30 JUNE 2019
AJ LUCAS GROUP LIMITED Page 29 of 83 Annual Financial Report 2019
1. REPORTING ENTITY
AJ Lucas Group Limited (“AJ Lucas” or “the Company”) is a company domiciled in Australia. The address of the Company’s registered office is 1 Elizabeth Plaza, North Sydney, NSW, 2060. The consolidated financial statements of the Company as at and for the financial year ended 30 June 2019 comprise the Company and its subsidiaries (together referred to as the ”Group” and individually referred to as ‘Group entities’).
AJ Lucas is a for-profit leading drilling services provider, primarily to the Australian coal industry, and an investor in the exploration, appraisal and commercialisation of oil and gas prospects. Historically, the Group has also been a specialist provider of engineering design and construction services, primarily in cross-country pipelines and horizontal drilling, however the Group exited this segment through the sale of the Engineering and Construction Division asset during 2018, with the division having been classified as a discontinued operation.
2. BASIS OF PREPARATION
(A) STATEMENT OF COMPLIANCE
The consolidated financial statements are general purpose financial statements which have been prepared in accordance with Australian Accounting Standards (‘AASBs’) including Australian interpretations adopted by the Australian Accounting Standards Board (‘AASB’) and the Corporations Act 2001. The consolidated financial statements comply with International Financial Reporting Standards (IFRSs) and interpretations adopted by the International Accounting Standards Board (IASB). The consolidated financial statements were authorised for issue by the Board of Directors on 30 August 2019. Comparative information has been reclassified where relevant for consistency with current period presentation.
(B) BASIS OF MEASUREMENT
The consolidated financial statements have been prepared on the historical cost basis.
(C) GOING CONCERN
The consolidated financial statements have been prepared on a going concern basis, which assumes that the Group will be able to continue trading, realise its assets and discharge its liabilities in the ordinary course of business, for a period of at least 12 months from the date that these financial statements are approved.
The directors note the following events and conditions which raise doubt about the entities ability to continue as a going concern:
• The Group generated a loss after tax from continuing operations for the year of $25.7 million primarily as a result of operating profit of $8.6 million offset by net finance costs of $29.4 million, and a share of loss from equity accounted investees of $4.9 million;
• The Group generated $22.8 million in cash flows from operating activities before taking account of $8.0 million in net interest and finance costs paid during the year;
• The Group had a net current asset deficiency at balance date of $52.2 million, primarily as a result of $67.2 million in interest bearing liabilities which falls due in September 2019. The Company is in negotiations with parties interested to refinance the Group’s existing Senior loan note facility with a longer term and lower cost facility to strengthen the Group’s balance sheet and meet its obligations to the Senior loan note;
• The Group’s near-term future financial performance will be driven by demand for its drilling, services, which in turn will be impacted by various factors which are outside its control. Notwithstanding the Drilling division has maintained an increased level of activity over the last 2 years, forecasting business performance carries an inherent degree of uncertainty; and
For
per
sona
l use
onl
y

NOTES TO THE CONSOLIDATED FINANCIAL STATEMENTS 30 JUNE 2019
AJ LUCAS GROUP LIMITED Page 30 of 83 Annual Financial Report 2019
BASIS OF PREPARATION (CONT.)
GOING CONCERN (CONT.)
• The Company has a 47.68% interest in Cuadrilla, which in turn has a 51.25% interest in, and is the operator of, an oil and gas licence (PEDL 165) located in Lancashire, UK and known as the Bowland licence. Additionally, the Company has a direct interest of 23.75% in PEDL 165, thus giving an effective 48.19% interest in PEDL 165 (see Note 19). Two horizontal shale gas wells have been drilled at the Preston New Road exploration site within PEDL 165. The first of these wells was hydraulically fractured between October and December 2018. Initial flow test results from this well, announced to the ASX on 7 February 2019, were encouraging however onerous regulatory thresholds on seismicity prevented the full fracturing and flow testing program being undertaken as planned. The second well is currently being hydraulically fractured. The operator is seeking an increase of the regulatory threshold on seismicity, supported by scientific expert opinions, before commencing further drilling and flow testing. There is no guarantee on the timing or level of the increase to the regulatory threshold, or if in fact there will be any increase to the regulatory threshold at all.
In concluding on the appropriateness of using the going concern assumption, the directors have had regard to the following matters:
• Ongoing discussions with Senior loan note holders regarding the Group’s current obligations to reduce the principal outstanding to US$20 million by 30 September 2019 as disclosed in Note 22, as well as discussions with a number of parties interested to refinance the Senior loan notes that is expected to provide a more stable balance sheet;
• The ability of the Group to raise additional equity;
• The continuing support of Kerogen Investments No. 1 (HK) Limited (“Kerogen”), both as a substantial debtholder and shareholder of the Company as evidenced by its participation in capital raisings for its full pro rata entitlement in Entitlement Offers in 2016, 2017 and 2018 through debt to equity conversion;
• The strong financial performance of the Drilling division, supported by recent multi year extensions of contracts with key customers, and the interest shown in the division by a number of bidders during the Board’s strategic review of the division;
• The implied value of the Group’s investment in both Cuadrilla and also its direct holding in the Bowland, Elswick and Balcombe licences, as evidenced by the partial sale of the Group’s direct and indirect interests in the Bowland and Elswick licences to Centrica in June 2013 and interest in the Balcombe licence to Angus Energy Plc in 2018 and subsequent encouraging flow testing activities;
• The significant increase in the value of the Bowland licence should the regulatory threshold on seismicity be sufficiently increased so that the 2 horizontal wells drilled could be successfully fractured and flow tested for gas;
• Announcements made by the United Kingdom Government in support of the shale gas industry to provide the indigenous security of supply of energy in the United Kingdom; and
• The ability of the Group to determine the extent and timing of its future contributions to Cuadrilla.
However, if the entity is unable to re-finance its senior loan note liabilities or raise additional capital, it may be required to realise its assets and extinguish its liabilities other than in the normal course of business at amounts different from those stated in the statement of financial position.
(D) FUNCTIONAL AND PRESENTATION CURRENCY
The consolidated financial statements are presented in Australian dollars which is the Company’s functional currency. The Company is of a kind referred to in ASIC Corporations Instrument 2016/191 (Rounding in Financial/Directors’ Reports) issued by the Australian Securities and Investments Commission. Unless otherwise expressly stated, amounts in these financial statements have been rounded off to the nearest thousand dollars in accordance with that Corporations Instrument.
For
per
sona
l use
onl
y

NOTES TO THE CONSOLIDATED FINANCIAL STATEMENTS 30 JUNE 2019
AJ LUCAS GROUP LIMITED Page 31 of 83 Annual Financial Report 2019
BASIS OF PREPARATION (CONT.)
(E) USE OF ESTIMATES AND JUDGMENTS
The preparation of the consolidated financial statements in conformity with AASBs requires management to make judgements, estimates and assumptions that affect the application of accounting policies and the reported amount of assets, liabilities, income and expenses. Actual results may differ from these estimates.
Estimates and underlying assumptions are reviewed on an ongoing basis. Revisions to accounting estimates are recognised in the period in which the estimate is revised and in any future periods affected.
Information about significant areas of estimation uncertainty and critical judgements in applying accounting policies that have the most significant effect on the amount recognised in the consolidated financial statements are described in the following notes:
• Note 3(f) – Estimation of percentage completion in relation to revenue recognition;
• Note 14 – Inventories;
• Note 16 – Discontinued operations;
• Note 18 - Carrying value of equity accounted investments;
• Note 19 – Carrying value of exploration assets;
• Note 20 – Recognition of deferred tax asset;
• Note 26 – Valuation of financial instruments; and
• Note 29 – Contingencies.
(F) CHANGES IN ACCOUNTING POLICIES
This note explains the impact of the adoption of AASB 15 Revenue from Contracts with Customers and AASB 9 Financial Instruments on the Group’s consolidated financial statements which came in to effect from 1 July 2018. Other than as noted below all other accounting policies set out in Note 3 have been applied consistently to all periods presented in these consolidated financial statements, and have been applied consistently by all Group entities. Several other amendments and interpretations apply for the first time from 1 July 2018, but do not have a material impact on the consolidated financial statements.
Revenue from Contracts with Customers
The Group has adopted AASB 15 Revenue from Contracts with Customers from 1 July 2018, which supersedes AASB 118 Revenue and AASB 111 Construction Contracts and related Interpretations. The Group has adopted the modified retrospective method of initial application as permitted under AASB 15 and therefore, the new standard has only been applied to contracts that remain in force at 1 July 2018.
The new standard establishes a five-step model to account for revenue arising from contracts with customers. The core principle of AASB 15 is that revenue is recognised when control of a good or service transfers to a customer, and the amount of revenue recognised should reflect the consideration to which an entity expects to be entitled in exchange for transferring those goods or services. Previously the Group recognised revenue on a stage of completion basis, as assessed by survey of work completed.
The Group provides the majority of its drilling services under schedule of rates contracts. These comprise predominantly metre and hourly rates, and in some instances a lump sum component for certain activities of short duration such as movement between sites. The transfer of the risks and rewards coincides with the fulfilment of performance obligations and subsequent transfer of control as defined by AASB 15. As such there was no quantitative change in respect of the timing and amount of revenue the Group currently recognises.
For
per
sona
l use
onl
y
NOTES TO THE CONSOLIDATED FINANCIAL STATEMENTS 30 JUNE 2019
AJ LUCAS GROUP LIMITED Page 32 of 83 Annual Financial Report 2019
BASIS OF PREPARATION (CONT.)
Accounting policy applied from 1 July 2018:
Sales revenue related to the transfer of promised goods or services is recognised when control of the goods or services is transferred to the customer. The amount of revenue recognised reflects the consideration to which the Group is or expects to be entitled in exchange for those goods or services.
Sales revenue for services is recognised on individual sales when control transfers to the customer. In most instances the title, risks and rewards transfer to the customer when the service is provided to the customer, as evidenced by survey of work performed.
The Group provides the majority of its services and associated consumables and materials on an as required basis, where the Group provides drilling services based on a total hourly rate as defined for each project, or on a meter drilled basis, as defined for each drill hole (dependant on the contract terms). Under these methods, services rendered are consistent with performance of those services and confirmed by survey of work performed and agreed with its customer. Under these terms, revenue is recognised over time as the customer simultaneously receives and consumes the benefits provided by the Group as the Group performs.
The Group’s services are sold to customers under contracts which vary in tenure and pricing mechanisms, primarily being hourly or meter rates specific to each contract.
Financial Instruments
The Group has adopted AASB 9 Financial Instruments from 1 July 2018, with retrospective application. AASB 9 replaces AASB 139 Financial Instruments: Recognition and Measurement, bringing together all three aspects of the accounting for financial instruments: classification and measurement, impairment and hedge accounting.
The accounting for the Group’s financial assets, financial liabilities and hedge accounting remains largely the same as under AASB 139 and as a result, there has been no quantitative impact on the Group as a result of adopting AASB 9, and no comparative balances have been restated. A more detailed analysis of the impact on the Group of the main components of AASB 9 is detailed below:
Classification and measurement of financial assets: AASB 9 contains three principal classification categories for financial assets: measured at amortised cost, fair value through other comprehensive income (“FVOCI”) and fair value though profit and loss (“FVTPL”). The classification is based on the business model in which a financial asset is managed and its contractual cash flow characteristics. The Group has reviewed and assessed its existing financial assets as at 1 July 2018 based on the facts and circumstances that existed at that date and concluded that the initial application of AASB 9 has had no material impact on the Group’s financial assets in regard to their classification and measurement.
Impairment: in relation to the impairment of financial assets measured at amortised cost and FVOCI, AASB 9 introduces a new forward-looking expected credit loss approach, replacing AASB 139’s incurred loss approach whereby the Group will need to record an allowance for expected credit loss upon initial recognition of the financial instrument. For trade and other receivables held at amortised cost, the Group has elected to measure the loss allowance using the simplified approach. The Group has assessed the historical credit loss experience, and adjusted it for forward looking factors specific to the debtors and economic environment. Based on this assessment, the initial application of the impairment requirements of AASB 9 has had no material impact on the Group’s financial statements.
Financial Liabilities: The accounting for the Group’s financial liabilities remains largely the same as it was under AASB 139. Similar to the requirements of AASB 139, AASB 9 requires contingent consideration liabilities to be treated as financial instruments measured at fair value, with the changes in fair value recognised in the statement of profit or loss.
The requirements in AASB 9 for adjusting the amortised cost of a financial liability, when a modification (or exchange) does not result in derecognition, are consistent with those applied to the modification of a financial asset that does not result in derecognition.
The gain or loss arising on modification of a financial liability that does not result in derecognition, is calculated by discounting the change in contractual cash flows using the original effective interest rate (EIR), and is immediately recognised in profit or loss. The Group has considered the application of AASB 9 retrospectively, noting that the Group previously treated such modifications as changes to the EIR under AASB 139. There was no material impact of applying AASB 9 retrospectively to financial liabilities and as such no adjustment was made on transition.
The accounting policy applied from 1 July 2018 is detailed below.
For
per
sona
l use
onl
y

NOTES TO THE CONSOLIDATED FINANCIAL STATEMENTS 30 JUNE 2019
AJ LUCAS GROUP LIMITED Page 33 of 83 Annual Financial Report 2019
BASIS OF PREPARATION (CONT.)
Financial assets
At initial recognition, financial assets are measured at fair value. Subsequent to initial recognition, financial assets are classified into one of two categories consistent the business model for managing the financial assets and the contractual terms of the related cash flows. The two categories comprise those subsequently measured at fair value (either through OCI, or profit or loss) and those to be held at amortised cost.
Financial assets are derecognised when the contractual rights to the cash flows from the asset either expire or are transferred in a transaction in which substantially all the risks and rewards of ownership of the financial asset are transferred. Any interest created or retained by the Group in such a transfer, is recognised as a separate asset or liability.
For contract assets and trade and other receivables, the Group has applied the standard’s simplified approach and has calculated Expected Credit Losses (“ECLs”) based on lifetime expected credit losses. The Group has established a provision matrix that is based on the Group’s historical credit loss experience, adjusted for forward-looking factors specific to the debtors and the economic environment.
Financial liabilities
At initial recognition, financial liabilities are measured at fair value and classified as financial liabilities at fair value through profit or loss, loans and borrowings, payables or as derivatives designated as hedging instruments. The Group’s financial liabilities currently include cash and cash equivalents, trade and other payables and interest-bearing loans and borrowings.
The Group derecognises its financial liabilities when its contractual obligations are discharged, cancelled or expire.
3. SIGNIFICANT ACCOUNTING POLICIES
Comparative information has been reclassified where relevant for consistency with current period presentation.
(A) BASIS OF CONSOLIDATION
Business combinations
Business combinations are accounted for using the acquisition method as at the acquisition date, which is the date on which control is transferred to the Group. The consideration transferred in the acquisition is measured at fair value, as are the identifiable net assets acquired. The excess of consideration transferred over the fair value of net assets acquired is recognised as goodwill and is tested annually for impairment. Transaction costs, other than those associated with the issue of debt or equity securities, that the Group incurs in connection with a business combination are expensed as incurred. The consideration transferred does not include amounts related to the settlement of pre-existing relationships. Such amounts are generally recognised in profit or loss.
Any contingent consideration payable is recognised at fair value at the acquisition date. If the contingent consideration is classified as equity, it is not remeasured and settlement is accounted for within equity. Otherwise, subsequent changes to the fair value of the contingent consideration are recognised in profit or loss.
Subsidiaries
Subsidiaries are entities controlled by the Group. The Group controls an entity when it is exposed to, or has rights to, variable returns from its involvement with the entity and has the ability to affect those returns through its power over the entity. Power is determined in relation to rights that give the Group the current ability to direct the activities that significantly affect returns from the Group’s investment. In assessing control, the Group takes into consideration potential voting rights that currently are exercisable.
The financial statements of subsidiaries are included in the consolidated financial statements from the date that control commences until the date that control ceases.
Investments in equity accounted investees
The Group’s interest in equity accounted investees comprise interests in joint ventures and an associate. Associates are those entities in which the Group has significant influence, but not control or joint control, over the financial and operating policies. Jointly ventures are those entities over whose activities the Group has joint control, whereby the Group has rights to the net assets of the arrangement, rather than rights to its assets and obligations for its liabilities.
For
per
sona
l use
onl
y

NOTES TO THE CONSOLIDATED FINANCIAL STATEMENTS 30 JUNE 2019
AJ LUCAS GROUP LIMITED Page 34 of 83 Annual Financial Report 2019
SIGNIFICANT ACCOUNTING POLICIES (CONT.)
Investments in associates and joint ventures are accounted for using the equity method and are initially recognised at cost, which includes transaction costs. Subsequent to initial recognition, the consolidated financial statements include the Group’s share of the profit or loss and other comprehensive income of equity accounted investees, after adjustments to align the accounting policies with those of the Group, from the date that significant influence or joint control commences until the date that significant influence or joint control ceases. A partial redemption of equity interests is accounted for as a reduction in the investment value equal to the cash redemption.
When the Group’s share of losses exceeds its interest in an equity accounted investee, the carrying amount of that interest, including any long-term investments that form part thereof, is reduced to zero, and the recognition of further losses is discontinued except to the extent that the Group has an obligation or has made payments on behalf of the investee.
Joint operations
A joint operation is an arrangement whereby the parties that jointly control the arrangement have rights to the assets, and obligations for the liabilities, relating to the arrangement. The consolidated financial statements include the Group’s share of assets and liabilities held jointly and the Group’s share of expenses incurred and income earned jointly.
Transactions eliminated on consolidation
Intra-group balances and transactions, and any unrealised income and expenses, are eliminated in preparing the consolidated financial statements. Unrealised gains arising from transactions with equity accounted investees are eliminated against the investment to the extent of the Group’s interest in the investee. Unrealised losses are eliminated in the same way as unrealised gains, but only to the extent that there is no evidence of impairment.
(B) FOREIGN CURRENCY
Foreign currency transactions
Transactions in foreign currencies are translated to the respective functional currencies of the Group’s entities at exchange rates at the dates of the transactions.
Monetary assets and liabilities denominated in foreign currencies at the reporting date are translated to the functional currency at the exchange rate at reporting date.
Non-monetary assets and liabilities denominated in foreign currencies that are measured at fair value are retranslated to the functional currency at the exchange rate at the date that the fair value was determined. Non-monetary items in a foreign currency that are measured in terms of historical cost are not retranslated. Foreign currency differences arising on retranslation are recognised in profit or loss, except for differences arising on the retranslation of available-for-sale equity instruments or qualifying cash flow hedges, which are recognised in other comprehensive income.
Foreign operations
The assets and liabilities of foreign operations, including goodwill and fair value adjustments arising on acquisition, are translated to Australian dollars at exchange rates at the reporting date. The income and expenses of foreign operations are translated to Australian dollars at exchange rates at the dates of the transactions.
Foreign currency differences are recognised in other comprehensive income, and presented in the foreign currency translation reserve (translation reserve) in equity. When a foreign operation is disposed of such that control, significant influence or joint control is lost, the cumulative amount in the translation reserve related to that foreign operation is reclassified to profit or loss as part of the gain or loss on disposal. When the Group disposes of only part of its interest in a subsidiary that includes a foreign operation while retaining control, the relevant proportion of the cumulative amount is reattributed to non-controlling interests. When the Group disposes of only part of an associate or joint venture while retaining significant influence or joint control, the relevant proportion of the cumulative amount is reclassified to profit or loss.
When the settlement of a monetary item receivable from or payable to a foreign operation is neither planned nor likely in the foreseeable future, foreign exchange gains and losses arising from such a monetary item are considered to form part of a net investment in a foreign operation and are recognised in other comprehensive income and are presented in the translation reserve in equity.
For
per
sona
l use
onl
y
NOTES TO THE CONSOLIDATED FINANCIAL STATEMENTS 30 JUNE 2019
AJ LUCAS GROUP LIMITED Page 35 of 83 Annual Financial Report 2019
SIGNIFICANT ACCOUNTING POLICIES (CONT.)
(C) SHARE CAPITAL
Ordinary shares are classified as equity. Incremental costs directly attributable to the issue of ordinary shares and share options are recognised as a deduction from equity, net of any tax effects. Dividends are recognised as a liability in the period in which they are declared.
(D) LEASES
At inception of an arrangement, the Group determines whether the arrangement is or contains a lease.
Leased assets
Leases where the Group assumes substantially all the risks and rewards of ownership are classified as finance leases. Upon initial recognition, the leased asset is measured at an amount equal to the lower of its fair value and the present value of the minimum lease payments. Subsequent to initial recognition, the asset is accounted for in accordance with the accounting policy applicable to that asset.
Other leases are operating leases and are not recognised on the Group’s statement of financial position.
Lease payments
Payments made under operating leases are recognised in profit or loss on a straight-line basis over the term of the lease. Lease incentives received are recognised as an integral part of the total lease expense, over the term of the lease.
Minimum lease payments made under finance leases are apportioned between the finance expense and the reduction of the outstanding liability. The finance expense is allocated to each period during the lease term so as to produce a constant periodic rate of interest on the remaining balance of the liability.
(E) REVENUE
Under the Group’s accounting policy in place to 30 June 2018, revenue was recognised on the following basis and is presented only for comparison purposes.
Services rendered
Revenue from services rendered is recognised in profit or loss in proportion to the stage of completion of the transaction at the reporting date. The stage of completion is assessed by reference to surveys of work performed.
Construction contracts
Contract revenue includes the initial amount agreed in the contract plus any variations in contract work, claims and incentive payments to the extent that it is probable that they will result in revenue and can be measured reliably. As soon as the outcome of a construction contract can be estimated reliably, contract revenue is recognised in profit or loss in proportion to the stage of completion of the contract. Contract expenses are recognised as incurred unless they create an asset related to future contract activity.
The stage of completion is assessed by reference to surveys of work performed. When the outcome of a construction contract cannot be estimated reliably, contract revenue is recognised only to the extent of contract costs incurred that are likely to be recoverable. An expected loss on a contract is recognised immediately in the profit or loss.
The accounting policy applicable from 1 July 2018 is disclosed in Note 2 (f) Changes in Accounting Policies.
(F) FINANCE INCOME AND FINANCE COSTS
Finance income comprises interest income on funds invested and gains on hedging instruments that are recognised in profit or loss. Interest income is recognised as it accrues in profit or loss, using the effective interest method.
Finance costs comprise interest expense on borrowings, unwinding of the discount on provisions and deferred consideration, amortisation of pre-paid fees, foreign currency losses and losses on financial instruments. Borrowing costs that are not directly attributable to the acquisition, construction or production of a qualifying asset are recognised in profit or loss using the effective interest method.
Foreign currency gains and losses are reported on a net basis.
For
per
sona
l use
onl
y
NOTES TO THE CONSOLIDATED FINANCIAL STATEMENTS 30 JUNE 2019
AJ LUCAS GROUP LIMITED Page 36 of 83 Annual Financial Report 2019
SIGNIFICANT ACCOUNTING POLICIES (CONT.)
(G) INCOME TAX
Income tax expense comprises current and deferred tax. Income tax is recognised in profit or loss except to the extent that it relates to a business combination, or items recognised directly in equity, or in other comprehensive income.
Current tax
Current tax is the expected tax payable or receivable on the taxable income or loss for the year, using tax rates enacted or substantially enacted at the reporting date, and any adjustment to tax payable in respect of previous years. Current tax unpaid at the end of the year is recognised as an income tax liability. Also included in income tax liability is outstanding current tax liabilities in relation to prior periods where contractually agreed payment plans have been put in place.
Deferred tax
Deferred tax is recognised in respect of deductible temporary differences between the carrying amounts of assets and liabilities for financial reporting purposes and the amounts used for taxation purposes. Deferred tax is not recognised for the following temporary differences:
• the initial recognition of assets or liabilities in a transaction that is not a business combination and that affects neither accounting nor taxable profit or loss;
• relating to investments in subsidiaries and associates and joint arrangements to the extent that it is probable that they will not reverse in the foreseeable future; and
• arising on the initial recognition of goodwill.
Deferred tax is measured at the tax rates that are expected to be applied to temporary differences when they reverse, based on the laws that have been enacted or substantively enacted by the reporting date. Deferred tax assets and liabilities are offset if there is a legally enforceable right to offset current tax liabilities and assets, and they relate to income taxes levied by the same tax authority on the same taxable entity, or on different tax entities, but they intend to settle current tax liabilities and assets on a net basis or their tax assets and liabilities will be realised simultaneously.
A deferred tax asset is recognised only to the extent that it is probable that future taxable profits will be available against which the temporary difference can be utilised. Deferred tax assets are reviewed at each reporting date and are reduced to the extent that it is no longer probable that the related tax benefit will be realised.
Tax consolidation
The Company and its wholly owned Australian resident entities are part of a tax-consolidated group. As a consequence, all members of the tax consolidated group are taxed as a single entity. The head entity within the tax-consolidated group is AJ Lucas Group Limited.
Current tax expense/income, deferred tax liabilities and deferred tax assets arising from temporary differences of the members of the tax-consolidated group are recognised in the separate financial statements of the members of the tax-consolidated group using the group allocation approach.
Any current tax liabilities (or assets) and deferred tax assets arising from unused tax losses of the subsidiaries are assumed by the head entity in the tax-consolidated group and are recognised by the Company as amounts payable (receivable) to/(from) other entities in the tax-consolidated group in conjunction with any tax funding arrangement amounts (refer below). Any difference between these amounts is recognised by the Company as an equity contribution or distribution.
The Company recognises deferred tax assets arising from unused tax losses of the tax-consolidated group to the extent that it is probable that future taxable profits of the tax-consolidated group will be available against which the asset can be utilised.
Any subsequent period adjustments to deferred tax assets arising from unused tax losses as a result of revised assessments of the probability of recoverability is recognised by the head entity only.
For
per
sona
l use
onl
y

NOTES TO THE CONSOLIDATED FINANCIAL STATEMENTS 30 JUNE 2019
AJ LUCAS GROUP LIMITED Page 37 of 83 Annual Financial Report 2019
SIGNIFICANT ACCOUNTING POLICIES (CONT.)
Nature of tax funding arrangements and tax sharing arrangements
The head entity, in conjunction with other members of the tax-consolidated group, has entered into a tax funding arrangement which sets out the funding obligations of members of the tax-consolidated group in respect of tax amounts. The tax funding arrangements require payments to/from the head entity equal to the current tax liability/(asset) assumed by the head entity and any tax-loss deferred tax asset assumed by the head entity, resulting in the head entity recognising an inter-entity receivables/(payables) equal in amount to the tax liability/(asset) assumed. The inter-entity receivables/(payables) are at call.
Contributions to fund the current tax liabilities are payable as per the tax funding arrangement and reflect the timing of the head entity’s obligation to make payments for tax liabilities to the relevant tax authorities.
The head entity in conjunction with other members of the tax-consolidated group, has also entered into a tax sharing agreement. The tax sharing agreement provides for the determination of the allocation of income tax liabilities between the entities should the head entity default on its tax payment obligations.
(H) EARNINGS PER SHARE
The Group presents basic and diluted earnings per share (EPS) data for its ordinary shares. Basic EPS is calculated by dividing the profit or loss attributable to ordinary shareholders of the Company by the weighted average number of ordinary shares outstanding during the period. Diluted EPS is determined by adjusting the profit or loss attributable to ordinary shareholders and the weighted average number of ordinary shares outstanding for the effects of all dilutive potential ordinary shares, which comprise share rights and options granted to employees and the options over the Company’s ordinary shares.
(I) SEGMENT REPORTING
An operating segment is a component of the Group that engages in business activities from which it may earn revenues and incur expenses, including revenues and expenses that relate to transactions with any of the Group’s other components. All operating segment operating results are regularly reviewed by the Board to make decisions about resources to be allocated to the segment and assess its performance, and for which discrete financial information is available. The Group’s Executive Leadership Team (“ELT”) is the primary decision-making body responsible for the day to day management of the business and comprises the Group’s Executive General Managers, the Human Resources Executive, The Chief Financial Officer and is chaired by the Chairman of the Board.
Segment results that are reported to the Board include items directly attributable to a segment as well as those that can be allocated on a reasonable basis. Unallocated items comprise mainly corporate assets and borrowings, head office expenses, and income tax assets and liabilities.
(J) CONSTRUCTION WORK IN PROGRESS
Construction work in progress represents the gross unbilled amount expected to be collected from customers for contract work performed to date. It is measured at cost plus profit recognised to date less progress billings and recognised losses. Cost includes all expenditure related directly to specific projects and an allocation of fixed and variable overheads incurred in the Group’s contract activities based on normal operating capacity.
Construction work in progress is presented as part of inventories in the statement of financial position for all contracts where costs incurred plus recognised profits exceed progress billings. If progress billings exceed costs incurred plus recognised profits, then the difference is presented as deferred income in the statement of financial position.
(K) INVENTORIES
Inventories are valued at the lower of cost and net realisable value. Cost incurred in bringing each product to its present location and condition are included in the cost of inventory. Net realisable value is the estimated selling price in the ordinary course of business.
For
per
sona
l use
onl
y
NOTES TO THE CONSOLIDATED FINANCIAL STATEMENTS 30 JUNE 2019
AJ LUCAS GROUP LIMITED Page 38 of 83 Annual Financial Report 2019
SIGNIFICANT ACCOUNTING POLICIES (CONT.)
(L) PROPERTY, PLANT AND EQUIPMENT
Recognition and measurement
Items of property, plant and equipment are measured at cost less accumulated depreciation and impairment losses.
Cost includes cost of materials and direct labour, the costs of dismantling and removing the items and restoring the site on which they are located and any other costs attributable to bringing the assets to a working condition for their intended use. Cost may also include transfers from other comprehensive income of any gain or loss on qualifying cash flow hedges of foreign currency purchases of property, plant and equipment. In respect of borrowing costs relating to qualifying assets, the Group capitalises borrowing costs directly attributable to the acquisition, construction or production of a qualifying asset as part of the cost of that asset. Purchased software that is integral to the functionality of the related equipment is capitalised as part of that equipment.
When parts of an item of property, plant and equipment have different useful lives, they are accounted for as separate items (major components) of property, plant and equipment.
Sale of non-current assets
The net gain or loss on disposal is included in profit or loss at the date control of the asset passes to the buyer, usually when an unconditional contract for sale is signed. The gain or loss on disposal is calculated as the difference between the carrying amount of the asset at the time of disposal and the net proceeds on disposal (including incidental costs).
Subsequent costs
The cost of replacing part of an item of property, plant and equipment is capitalised in the carrying amount of the item if it is probable that the future economic benefits embodied within the part will flow to the Group and its cost can be measured reliably. The costs of the day-to-day servicing of property, plant and equipment are recognised in profit or loss as incurred.
Depreciation and amortisation
Depreciation and amortisation is calculated to write off the cost of items of property, plant and equipment, less their estimated residual value, using the straight-line method over the estimated useful life from the time the asset is first available for use. Leased assets are depreciated over the shorter of the lease term and their useful lives unless it is reasonably certain that the Group will obtain ownership by the end of the lease term. Depreciation and amortisation is recognised in the profit and loss.
Estimated useful lives for the current and comparative periods are as follows:
Years
Buildings 10-40
Plant and equipment 3-15
Enterprise development 6
The residual value, useful life and depreciation and amortisation method applied to an asset are adjusted if appropriate at least annually.
(M) INTANGIBLE ASSETS
Other intangible assets
Other intangible assets that are acquired by the Group are measured at cost less accumulated amortisation and accumulated impairment losses.
Subsequent expenditure
Subsequent expenditure on capitalised intangible assets is capitalised only when it increases the future economic benefits embodied in the specific asset to which it relates. All other expenditure is recognised in profit or loss as incurred.
For
per
sona
l use
onl
y

NOTES TO THE CONSOLIDATED FINANCIAL STATEMENTS 30 JUNE 2019
AJ LUCAS GROUP LIMITED Page 39 of 83 Annual Financial Report 2019
SIGNIFICANT ACCOUNTING POLICIES (CONT.)
(N) EXPLORATION AND EVALUATION ASSETS
Exploration and evaluation costs, including the costs of acquiring licences, are capitalised as exploration and evaluation assets on an area of interest basis. Costs incurred before the Group has obtained legal rights to explore an area are recognised in profit or loss.
Exploration and evaluation assets are only recognised if the rights of the area of interest are current and either:
• the expenditures are expected to be recouped through successful development and exploitation of the area of interest; or
• activities in the area of interest have not at the reporting date, reached a stage which permits a reasonable assessment of the existence or otherwise of economically recoverable reserves and active and significant operations in, or in relation to, the area of interest are continuing.
Exploration and evaluation assets are assessed for impairment if sufficient data exists to determine technical feasibility and commercial viability, and facts and circumstances suggest that the carrying amount exceeds the recoverable amount. For the purposes of impairment testing, exploration and evaluation assets are allocated to cash-generating units to which the exploration activity relates. The cash generating unit shall not be larger than the area of interest.
In applying the exploration and evaluation asset recognition policy, and in determining recoverable amount management are required to make certain estimates and assumptions as to future events and circumstances, in particular whether an economically viable extraction operation can be established. Any such estimates and assumptions may change as new information becomes available.
Where the Group is party to a farm-in arrangement any proceeds or non-cancellable expenditure funded by the purchaser is recognised as disposal proceeds. The non-cancellable expenditure to be funded by the purchaser is recognised as a receivable carry asset within exploration assets in accordance with the Group’s interest percentage. The assets disposed per the terms of the farm-in arrangement are treated as costs of disposal, alongside any other costs incurred, with the net profit or loss recognised in the income statement as incurred.
The cancellable portion of deferred consideration, and consideration contingent on a future event is disclosed as a contingent asset and is not recognised by the Group until it has actually been incurred or becomes non-cancellable, at which point, additional profit will be recognised in the profit and loss for these amounts.
(O) IMPAIRMENT
Non-financial assets
The carrying amounts of the Group’s non-financial assets (other than inventories, construction work in progress and deferred tax assets) are reviewed at each reporting date to determine whether there is any indication of impairment. If any such indication exists, then the asset’s recoverable amount is estimated.
The recoverable amount of an asset or cash-generating unit is the greater of its value in use and its fair value less costs to sell. In assessing value in use, the estimated future cash flows are discounted to their present value using a post-tax discount rate that reflects current market assessments of the time value of money and the risks specific to the asset.
For the purpose of impairment testing, assets are grouped together into the smallest group of assets that generates cash inflows from continuing use that are largely independent of the cash inflows of other assets or Groups of assets (“the cash generating unit” or “CGU”). The Group’s corporate assets do not generate separate cash inflows. If there is an indication that a corporate asset may be impaired, then the recoverable amount is determined for the CGU to which the corporate asset belongs.
An impairment loss is recognised if the carrying amount of an asset or its CGU exceeds its recoverable amount. Impairment losses are recognised in profit or loss. Impairment losses recognised in respect of CGUs are allocated first to reduce the carrying amount of any goodwill allocated to the units and then to reduce the carrying amount of the other assets in the unit (group of units) on a pro-rata basis.
For
per
sona
l use
onl
y
NOTES TO THE CONSOLIDATED FINANCIAL STATEMENTS 30 JUNE 2019
AJ LUCAS GROUP LIMITED Page 40 of 83 Annual Financial Report 2019
SIGNIFICANT ACCOUNTING POLICIES (CONT.)
An impairment loss in respect of goodwill is not reversed. In respect of other assets, impairment losses recognised in prior periods are assessed at each reporting date for any indications that the loss has decreased or no longer exists. An impairment loss is reversed if there has been a change in the estimates used to determine the recoverable amount. An impairment loss is reversed only to the extent that the asset’s carrying amount does not exceed the carrying amount that would have been determined, net of depreciation or amortisation, if no impairment loss had been recognised.
Goodwill that forms part of the carrying amount of an investment in an associate is not recognised separately, and therefore is not tested for impairment separately. Instead, the entire amount of the investment in an associate is tested for impairment as a single asset when there is objective evidence that the investment in an associate may be impaired.
(P) EMPLOYEE BENEFITS
Superannuation funds
A defined contribution plan is a post-employment benefit plan under which an entity pays fixed contributions into a separate entity and will have no legal or constructive obligation to pay further amounts. Obligations for contributions to defined contribution plans are recognised as an employee benefit expense in profit or loss in the periods during which services are rendered by employees. The Group does not participate in any defined benefit funds.
Other long-term employee benefits
The Group’s net obligation in respect of long-term employee benefits is the amount of future benefit that employees have earned in return for their service in the current and prior periods and related on costs. Benefits are discounted to determine their present value, using the yield at the reporting date on corporate bonds that have maturity dates approximating the terms of the Group’s obligations. The calculation is performed using the projected unit credit method. Any actuarial gains or losses are recognised in the income statement in the period in which they arise.
Termination benefits
Termination benefits are recognised as an expense when the Group is demonstrably committed, without realistic possibility of withdrawal, to a formal detailed plan to either terminate employment before the normal retirement date, or to provide termination benefits as a result of an offer made to encourage voluntary redundancy. Termination benefits for voluntary redundancies are recognised as an expense if the Group has made an offer of voluntary redundancy, it is probable that the offer will be accepted, and the number of acceptances can be estimated reliably. If benefits are payable more than 12 months after the reporting period, then they are discounted to their present value.
Short-term benefits
Short-term employee benefit obligations are measured on an undiscounted basis and are expensed as the related service is provided. A liability is recognised for the amount expected to be paid under short-term cash bonus or profit-sharing plans if the Group has a present legal or constructive obligation to pay this amount as a result of past service provided by the employee and the obligation can be estimated reliably.
Share-based payment transactions
The grant date fair value of share-based payment awards granted to employees is recognised as an employee expense, with a corresponding increase in equity, over the period in which the employees become unconditionally entitled to the awards.
The amount recognised as an expense is adjusted to reflect the number of awards for which the related service and non-market vesting conditions are expected to be met, such that the amount ultimately recognised as an expense is based on the number of awards that meet the related service and non-market performance conditions at the vesting date. For share-based payment awards with non-vesting conditions, the grant date fair value of the share-based payment is measured to reflect such conditions and there is no true-up for differences between expected and actual outcomes.
For
per
sona
l use
onl
y

NOTES TO THE CONSOLIDATED FINANCIAL STATEMENTS 30 JUNE 2019
AJ LUCAS GROUP LIMITED Page 41 of 83 Annual Financial Report 2019
SIGNIFICANT ACCOUNTING POLICIES (CONT.)
(Q) PROVISIONS
A provision is recognised if, as a result of a past event, the Group has a present legal or constructive obligation that can be estimated reliably, and it is probable that an outflow of economic benefits will be required to settle the obligation. Provisions are determined by discounting the expected future cash flows at a pre-tax rate that reflects current market assessments of the time value of money and the risks specific to the liability. The unwinding of the discount is recognised as finance cost.
Onerous contracts
A provision for onerous contracts is measured at the present value of the lower of the expected cost of terminating the contract and the expected net cost of continuing with the contract.
4. NEW STANDARDS AND INTERPRETATIONS NOT YET ADOPTED
The following accounting standards, amendments to accounting standards and interpretations have been identified as those which may impact the Group in the future period of initial adoption.
AASB 16 LEASES
AASB 16 Leases requires the recognition of a right of use asset and a lease liability for all leases with a term of more than 12 months, unless the underlying asset is of low value. The Group has elected to adopt AASB 16 Leases from 1 July 2019 using the modified retrospective method under which the cumulative effect of initially applying the new standard is recognised in opening retained earnings to reflect this change in accounting policy.
The assets and liability will initially be measured on a present value of future cash flows basis. The unwind of the financial charge on the lease liability and the amortisation of the leased asset will be recognised in the statement of comprehensive income based on the incremental borrowing interest rate and contract term respectively. Currently the company only recognises a lease liability and asset in relation to finance leases, while lease payments in relation to operating leases are expensed on a straight-line basis. The nominal amount of future non-cancellable rental payments of operating leases that the group is committed to as at balance date are currently disclosed in Note 23 Operating Leases.
The adoption of AASB16 is expected to result in a right of use asset being recognised, and an increase in lease liability as at 1 July 2019 in the range of $5m to $5.5m.
5. DETERMINATION OF FAIR VALUES
A number of the Group’s accounting policies and disclosures require the determination of fair value, for both financial and non-financial assets and liabilities. Fair values have been determined for measurement and / or disclosure purposes as described below. When applicable, further information about the assumptions made in determining fair values is disclosed in the notes specific to that asset or liability.
PROPERTY, PLANT AND EQUIPMENT
The fair value of property, plant and equipment recognised as a result of a business combination is the estimated amount for which a property could be exchanged on the date of acquisition between a willing buyer and a willing seller in an arm’s length transaction after proper marketing wherein the parties had each acted knowledgeably. The fair value of items of plant, equipment, fixtures and fittings is based on the market approach and cost approaches using quoted market prices for similar items when available and replacement cost when appropriate. Current replacement cost estimates reflect adjustment for physical deterioration as well as functional and economic obsolescence.
INVENTORIES
The fair value of inventories acquired in a business combination is determined based on its estimated selling price in the ordinary course of business less the estimated costs of completion and sale, and a reasonable profit margin based on the effort required to complete and sell the inventories.
For
per
sona
l use
onl
y
NOTES TO THE CONSOLIDATED FINANCIAL STATEMENTS 30 JUNE 2019
AJ LUCAS GROUP LIMITED Page 42 of 83 Annual Financial Report 2019
DETERMINATION OF FAIR VALUES (CONT.)
TRADE AND OTHER RECEIVABLES
The fair value of trade and other receivables, excluding construction work in progress, is estimated as the present value of future cash flows, discounted at the market rate of interest at the reporting date.
NON-DERIVATIVE FINANCIAL LIABILITIES
Fair value, which is determined for disclosure purposes, is calculated based on the present value of future principal and interest cash flows, discounted at the market rate of interest at the reporting date. For finance leases, the market rate of interest is determined by reference to similar lease agreements.
6. OPERATING SEGMENTS
The Group has three reportable segments, as described below, which are the Group’s strategic divisions. The strategic divisions offer different products and services, and are managed separately because they require different technology and marketing strategies. For each of the strategic divisions, the Board reviews internal management reports on a monthly basis. The following summary describes the operations in each of the Group’s reportable segments:
Drilling Drilling services to the coal industries for degasification of coal mines and associated services and commercial extraction of gas.
Engineering & construction (E&C) Pipelines and associated construction and civil services. The division was also the market leader in the installation of pipes including using horizontal directional drilling techniques.
Oil & gas Commercialisation of unconventional and conventional hydrocarbons in the United Kingdom.
While the Board continues to monitor and review financial information for the E&C division separately the division has been classified as a discontinued operation and accordingly the results from this segment have been separately reported in the comprehensive income statement as results from discontinued operations. As such reconciling items exist between reportable segment results and results disclosed from continuing operations, which are reflected in the table below as reclassified. See Note 16 Discontinued Operations.
There are varying levels of integration between the Drilling and Engineering & Construction reportable segments. The accounting policies of the reportable segments are the same as described in Note 3(i).
Information regarding the results of each reportable segment is included below. Performance is assessed based on segment earnings before interest, income tax, depreciation and amortisation (EBITDA) and segment profit before interest and income tax. Inter-segment pricing is determined on an arm’s length basis.
For
per
sona
l use
onl
y
NOTES TO THE CONSOLIDATED FINANCIAL STATEMENTS 30 JUNE 2019
AJ LUCAS GROUP LIMITED Page 43 of 83 Annual Financial Report 2019
OPERATING SEGMENTS (CONT.)
Drilling
$'000 E&C (1) $'000
Oil & Gas
$'000
Reportable Segments
$'000
Corporate/ unallocated
$'000
Reclassified (1)
$'000 Total $'000
2019 Reportable segment revenue Revenue - services rendered 143,442 – – 143,442 – – 143,442
Revenue - construction contracts – 6,021 – 6,021 – (6,021) –
Total consolidated revenue 143,442 6,021 – 149,463 – (6,021) 143,442
EBITDA from continuing operations 24,404 (13,716) (7,987) 2,701 (7,331) 13,716 9,086
Depreciation, amortisation and impairment (5,166) – – (5,166) (219) – (5,385) Finance income – – – – 132 – 132
Finance cost – – – – (29,507) – (29,507)
Reportable segment profit / (loss) 19,238 (13,716) (7,987) (2,465) (36,925) 13,716 (25,674)
Drilling
$'000 E&C (1) $'000
Oil & Gas
$'000
Reportable Segments
$'000
Corporate/ unallocated
$'000
Reclassified (1)
$'000 Total $'000
2018 Reportable segment revenue Revenue - services rendered 124,702 – – 124,702 – – 124,702
Revenue - construction contracts – 25,997 – 25,997 – (25,997) –
Total consolidated revenue 124,702 25,997 – 150,699 – (25,997) 124,702
EBITDA from continuing operations 19,705 (6,936) 8,134 20,903 (6,712) 6,936 21,127
Depreciation, amortisation and impairment (5,466) (794) – (6,260) (125) 794 (5,591) Finance income – – – – 172 – 172
Finance cost – – – – (24,249) – (24,249)
Reportable segment profit / (loss) 14,239 (7,730) 8,134 14,643 (30,914) 7,730 (8,541)
(1) Revenue from construction contracts related to the E&C division which has been divested during the year. The
division’s final operating results have been disclosed separately as discontinued operations, as disclosed in Note 16
Discontinued Operations. For
per
sona
l use
onl
y

NOTES TO THE CONSOLIDATED FINANCIAL STATEMENTS 30 JUNE 2019
AJ LUCAS GROUP LIMITED Page 44 of 83 Annual Financial Report 2019
OPERATING SEGMENTS (CONT.)
Drilling
$'000 Oil & Gas
$'000
Reportable Segments
$'000
Corporate/ unallocated
$'000
Discontinued E&C
$'000 Total $'000
June 2019
Segment assets 67,953 184,004 251,957 3,117 10,883 265,957
Segment liabilities (27,264) (5,536) (32,800) (122,285) (3,330) (158,415)
Share of loss of equity accounted investees – (4,880) (4,880) – – (4,880)
Equity accounted investments – 135,452 135,452 – – 135,452
Capital expenditure 7,903 – 7, 903 29 – 7,932
June 2018
Segment assets 73,527 157,500 231,027 1,987 33,921 266,935
Segment liabilities (20,742) (8,687) (29,429) (86,791) (11,605) (127,825)
Share of profit of equity accounted investees – 8,201 8,201 – – 8,201
Equity accounted investments – 120,541 120,541 – – 120,541
Capital expenditure 2,895 – 2,895 570 – 3,465
GEOGRAPHICAL INFORMATION
Revenues Non-current assets
2019
$'000 2018
$'000 2019
$'000 2018
$'000
Australia 143,442 124,702 29,715 27,693
Europe – – 183,414 156,455
143,442 124,702 213,129 184,148
For
per
sona
l use
onl
y
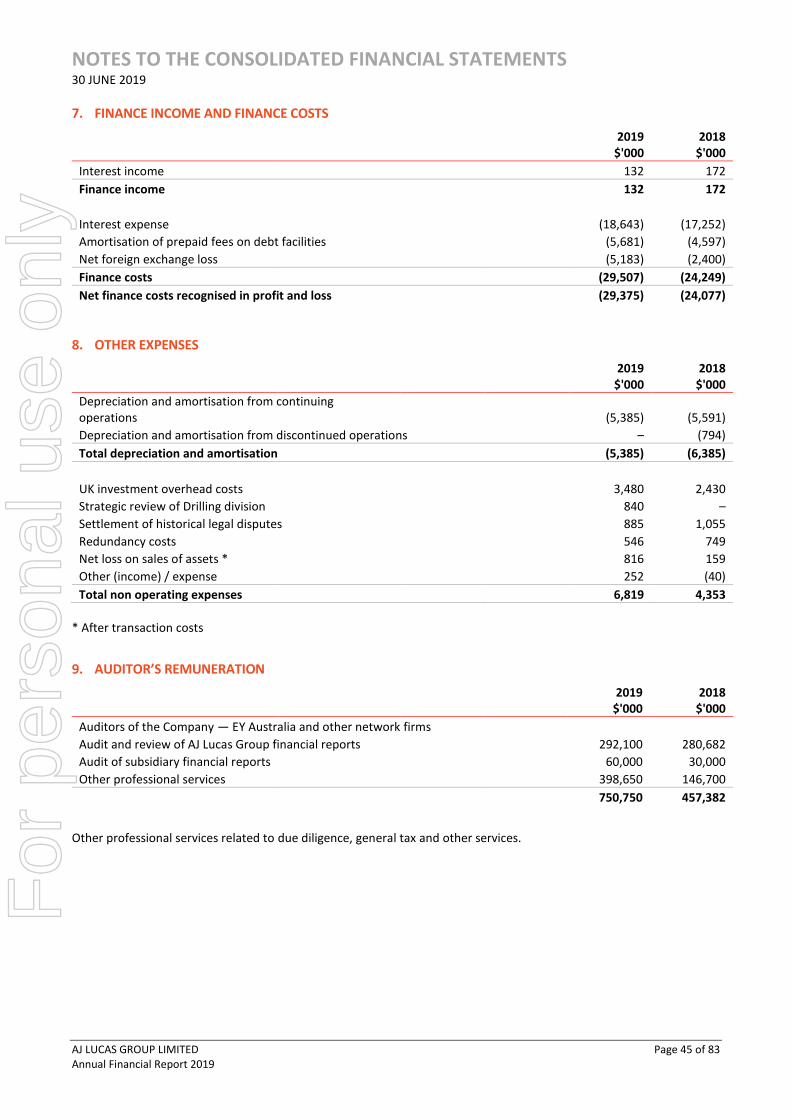
NOTES TO THE CONSOLIDATED FINANCIAL STATEMENTS 30 JUNE 2019
AJ LUCAS GROUP LIMITED Page 45 of 83 Annual Financial Report 2019
7. FINANCE INCOME AND FINANCE COSTS
2019
$'000 2018
$'000
Interest income 132 172
Finance income 132 172
Interest expense (18,643) (17,252)
Amortisation of prepaid fees on debt facilities (5,681) (4,597)
Net foreign exchange loss (5,183) (2,400)
Finance costs (29,507) (24,249)
Net finance costs recognised in profit and loss (29,375) (24,077)
8. OTHER EXPENSES
2019
$'000 2018
$'000
Depreciation and amortisation from continuing operations
(5,385) (5,591)
Depreciation and amortisation from discontinued operations – (794)
Total depreciation and amortisation (5,385) (6,385)
UK investment overhead costs 3,480 2,430
Strategic review of Drilling division 840 –
Settlement of historical legal disputes 885 1,055
Redundancy costs 546 749
Net loss on sales of assets * 816 159
Other (income) / expense 252 (40)
Total non operating expenses 6,819 4,353
* After transaction costs
9. AUDITOR’S REMUNERATION
2019 $'000
2018 $'000
Auditors of the Company — EY Australia and other network firms
Audit and review of AJ Lucas Group financial reports 292,100 280,682
Audit of subsidiary financial reports 60,000 30,000
Other professional services 398,650 146,700
750,750 457,382
Other professional services related to due diligence, general tax and other services.
For
per
sona
l use
onl
y
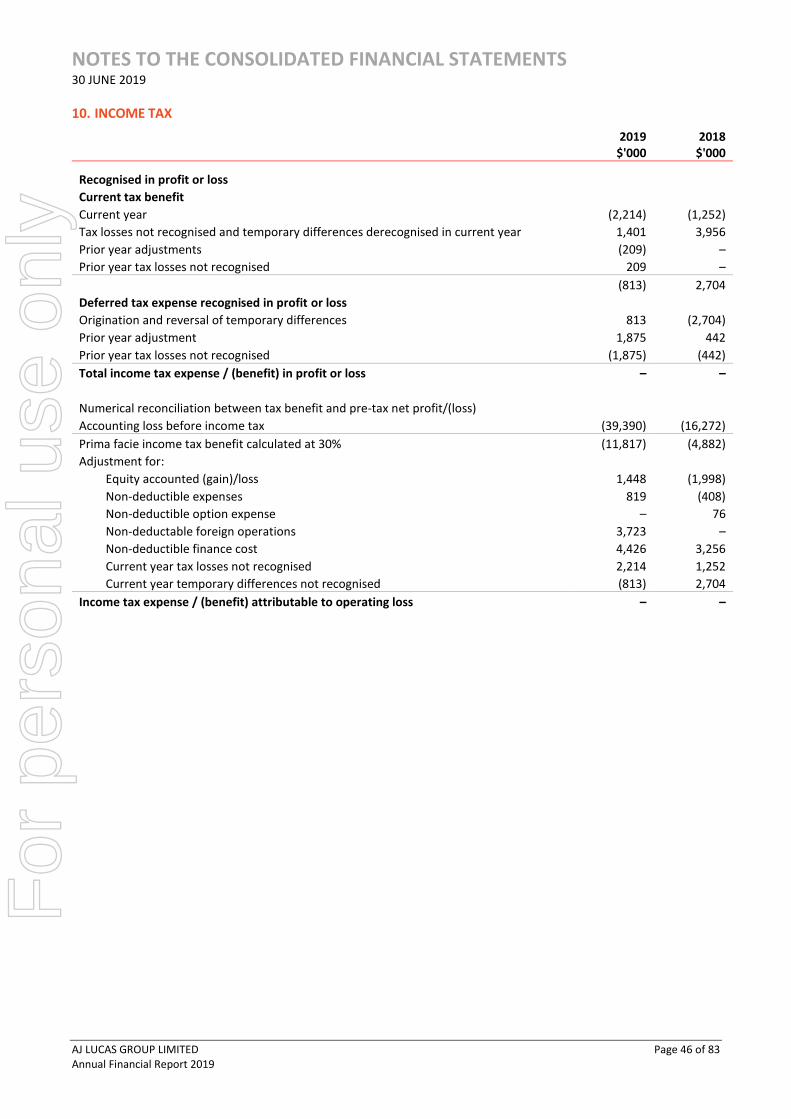
NOTES TO THE CONSOLIDATED FINANCIAL STATEMENTS 30 JUNE 2019
AJ LUCAS GROUP LIMITED Page 46 of 83 Annual Financial Report 2019
10. INCOME TAX
2019
$'000 2018
$'000
Recognised in profit or loss
Current tax benefit
Current year (2,214) (1,252)
Tax losses not recognised and temporary differences derecognised in current year 1,401 3,956
Prior year adjustments (209) –
Prior year tax losses not recognised 209 –
(813) 2,704
Deferred tax expense recognised in profit or loss
Origination and reversal of temporary differences 813 (2,704)
Prior year adjustment 1,875 442
Prior year tax losses not recognised (1,875) (442)
Total income tax expense / (benefit) in profit or loss – –
Numerical reconciliation between tax benefit and pre-tax net profit/(loss)
Accounting loss before income tax (39,390) (16,272)
Prima facie income tax benefit calculated at 30% (11,817) (4,882)
Adjustment for:
Equity accounted (gain)/loss 1,448 (1,998)
Non-deductible expenses 819 (408)
Non-deductible option expense – 76
Non-deductable foreign operations 3,723 –
Non-deductible finance cost 4,426 3,256
Current year tax losses not recognised 2,214 1,252
Current year temporary differences not recognised (813) 2,704
Income tax expense / (benefit) attributable to operating loss – –
For
per
sona
l use
onl
y
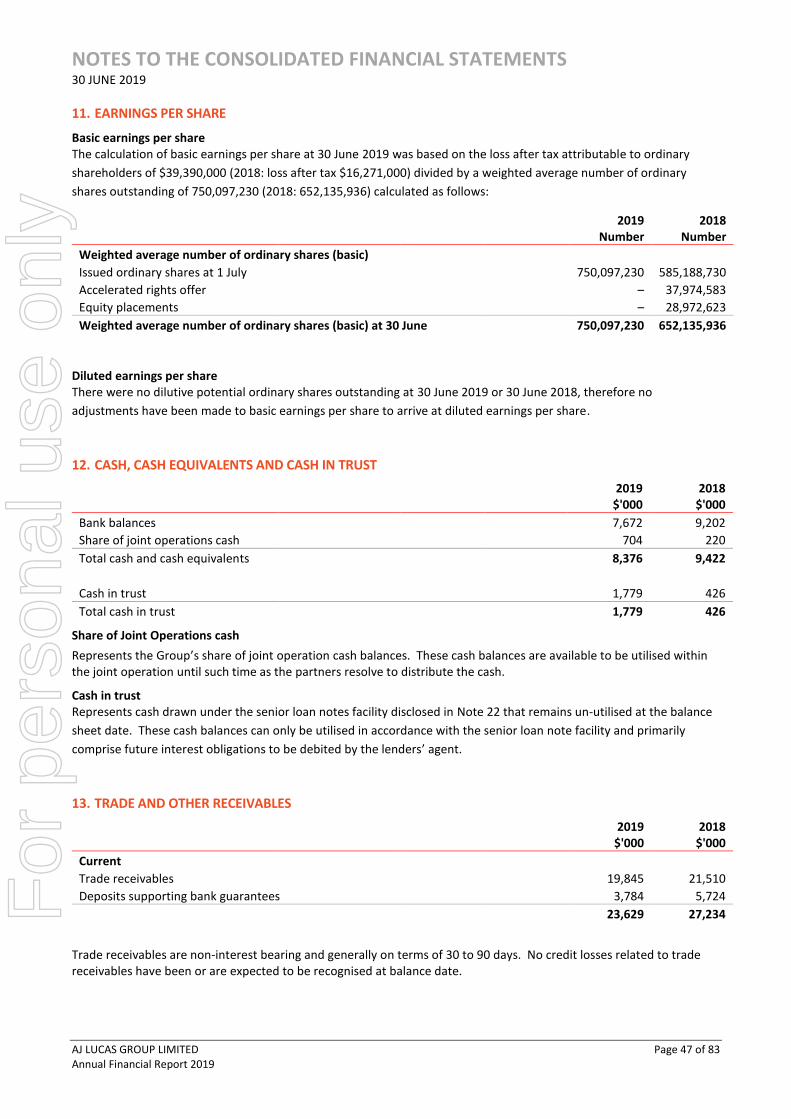
NOTES TO THE CONSOLIDATED FINANCIAL STATEMENTS 30 JUNE 2019
AJ LUCAS GROUP LIMITED Page 47 of 83 Annual Financial Report 2019
11. EARNINGS PER SHARE
Basic earnings per share The calculation of basic earnings per share at 30 June 2019 was based on the loss after tax attributable to ordinary
shareholders of $39,390,000 (2018: loss after tax $16,271,000) divided by a weighted average number of ordinary
shares outstanding of 750,097,230 (2018: 652,135,936) calculated as follows:
2019
Number 2018
Number
Weighted average number of ordinary shares (basic)
Issued ordinary shares at 1 July 750,097,230 585,188,730
Accelerated rights offer – 37,974,583
Equity placements – 28,972,623
Weighted average number of ordinary shares (basic) at 30 June 750,097,230 652,135,936
Diluted earnings per share There were no dilutive potential ordinary shares outstanding at 30 June 2019 or 30 June 2018, therefore no
adjustments have been made to basic earnings per share to arrive at diluted earnings per share.
12. CASH, CASH EQUIVALENTS AND CASH IN TRUST
2019
$'000 2018
$'000
Bank balances 7,672 9,202
Share of joint operations cash 704 220
Total cash and cash equivalents 8,376 9,422
Cash in trust 1,779 426
Total cash in trust 1,779 426
Share of Joint Operations cash
Represents the Group’s share of joint operation cash balances. These cash balances are available to be utilised within the joint operation until such time as the partners resolve to distribute the cash.
Cash in trust Represents cash drawn under the senior loan notes facility disclosed in Note 22 that remains un-utilised at the balance
sheet date. These cash balances can only be utilised in accordance with the senior loan note facility and primarily
comprise future interest obligations to be debited by the lenders’ agent.
13. TRADE AND OTHER RECEIVABLES
2019
$'000 2018
$'000
Current
Trade receivables 19,845 21,510
Deposits supporting bank guarantees 3,784 5,724
23,629 27,234
Trade receivables are non-interest bearing and generally on terms of 30 to 90 days. No credit losses related to trade receivables have been or are expected to be recognised at balance date.
For
per
sona
l use
onl
y
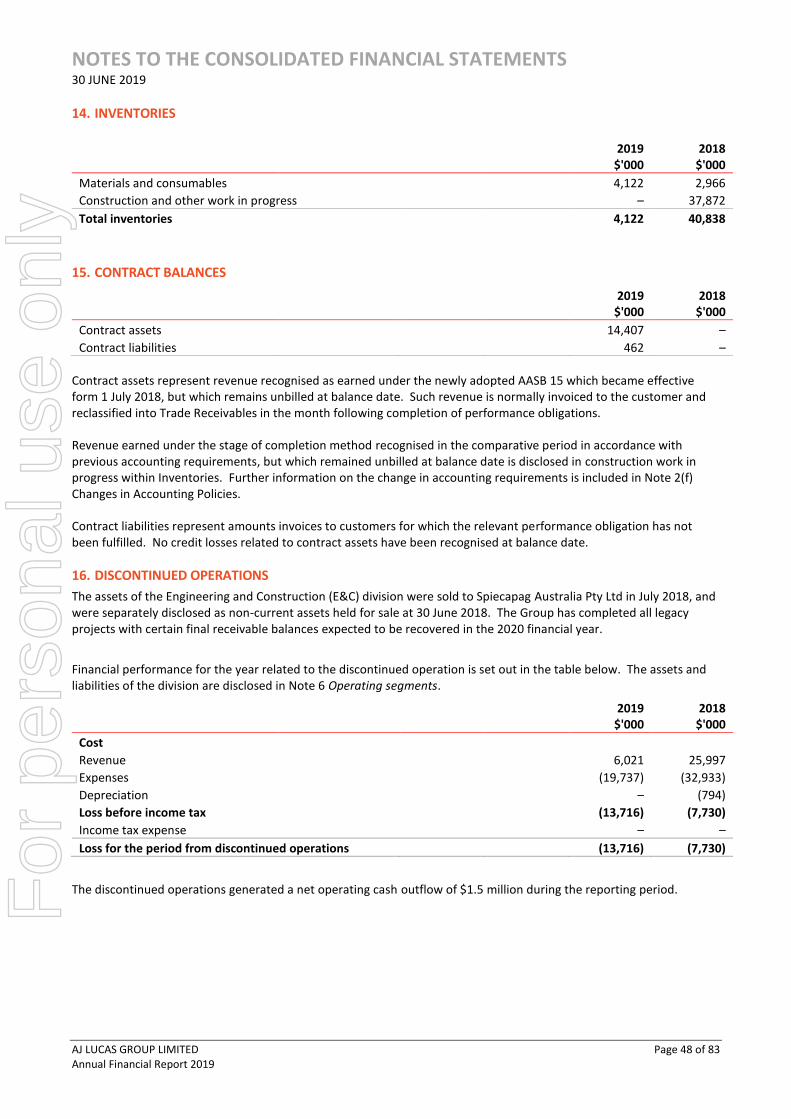
NOTES TO THE CONSOLIDATED FINANCIAL STATEMENTS 30 JUNE 2019
AJ LUCAS GROUP LIMITED Page 48 of 83 Annual Financial Report 2019
14. INVENTORIES
2019
$'000 2018
$'000
Materials and consumables 4,122 2,966
Construction and other work in progress – 37,872
Total inventories 4,122 40,838
15. CONTRACT BALANCES
2019
$'000 2018
$'000
Contract assets 14,407 –
Contract liabilities 462 –
Contract assets represent revenue recognised as earned under the newly adopted AASB 15 which became effective form 1 July 2018, but which remains unbilled at balance date. Such revenue is normally invoiced to the customer and reclassified into Trade Receivables in the month following completion of performance obligations.
Revenue earned under the stage of completion method recognised in the comparative period in accordance with previous accounting requirements, but which remained unbilled at balance date is disclosed in construction work in progress within Inventories. Further information on the change in accounting requirements is included in Note 2(f) Changes in Accounting Policies.
Contract liabilities represent amounts invoices to customers for which the relevant performance obligation has not been fulfilled. No credit losses related to contract assets have been recognised at balance date.
16. DISCONTINUED OPERATIONS
The assets of the Engineering and Construction (E&C) division were sold to Spiecapag Australia Pty Ltd in July 2018, and were separately disclosed as non-current assets held for sale at 30 June 2018. The Group has completed all legacy projects with certain final receivable balances expected to be recovered in the 2020 financial year.
Financial performance for the year related to the discontinued operation is set out in the table below. The assets and liabilities of the division are disclosed in Note 6 Operating segments.
2019
$'000 2018
$'000
Cost
Revenue 6,021 25,997
Expenses (19,737) (32,933)
Depreciation – (794)
Loss before income tax (13,716) (7,730)
Income tax expense – –
Loss for the period from discontinued operations (13,716) (7,730)
The discontinued operations generated a net operating cash outflow of $1.5 million during the reporting period.
For
per
sona
l use
onl
y

NOTES TO THE CONSOLIDATED FINANCIAL STATEMENTS 30 JUNE 2019
AJ LUCAS GROUP LIMITED Page 49 of 83 Annual Financial Report 2019
17. PROPERTY, PLANT AND EQUIPMENT
Land & buildings
$'000
Plant & equipment
$'000
Enterprise development
$'000 Total $'000
30 June 2019 At cost – 104,092 12,578 116,670
Accumulated depreciation/amortisation/impairment – (75,303) (11,652) (86,955)
Carrying amount at 30 Jun 2019 – 28,789 926 29,715
30 June 2018 At cost – 131,415 12,549 143,964
Accumulated depreciation/amortisation/impairment – (104,838) (11,433) (116,271)
Carrying amount at 30 Jun 2018 – 26,577 1,116 27,693
RECONCILIATIONS
Reconciliations of the carrying amounts for each class of property, plant and equipment are set out below:
Land & buildings
$'000
Plant & equipment
$'000
Enterprise development
$'000 Total $'000
Carrying amount at 1 July 2018 – 26,577 1,116 27,693
Additions – 7,903 29 7,932
Disposals – (525) – (525)
Depreciation and amortisation – (5,166) (219) (5,385)
Carrying amount at 30 June 2019 – 28,789 926 29,715
Land & buildings
$'000
Plant & equipment
$'000
Enterprise development
$'000 Total $'000
Carrying amount at 1 July 2017 3,024 34,171 655 37,850
Additions – 2,855 610 3,465
Disposals (2,975) (124) – (3,099)
Reclassified as held for sale – (4,138) – (4,138)
Depreciation and amortisation (49) (6,187) (149) (6,385)
Carrying amount at 30 June 2018 – 26,577 1,116 27,693
An independent expert was engaged to perform an independent valuation of the Group’s rig fleet and ancillary equipment in November 2018. No impairment charge was recognised as a result of this process.
18. INVESTMENTS IN EQUITY ACCOUNTED INVESTEES
2019
$'000 2018
$'000
Balance at 1 July 120,541 104,775
Purchase of additional ownership interest 13,498 2,705
Movement of foreign currency translation recognised in equity 6,293 4,860
Share of profit / (loss) of equity accounted investees (4,880) 8,201
Balance at 30 June 2018 135,452 120,541
The Group’s share of losses of equity accounted investees is $4,880,000 (2018 share of profits: $8,201,000). This is due to the full utilisation of the initial carry arrangement with Spirit Energy in the prior year. In June 2013 the existing owners, Cuadrilla and the Group, each sold 25% of their interest in the Bowland and Elswick Lancashire exploration
For
per
sona
l use
onl
y
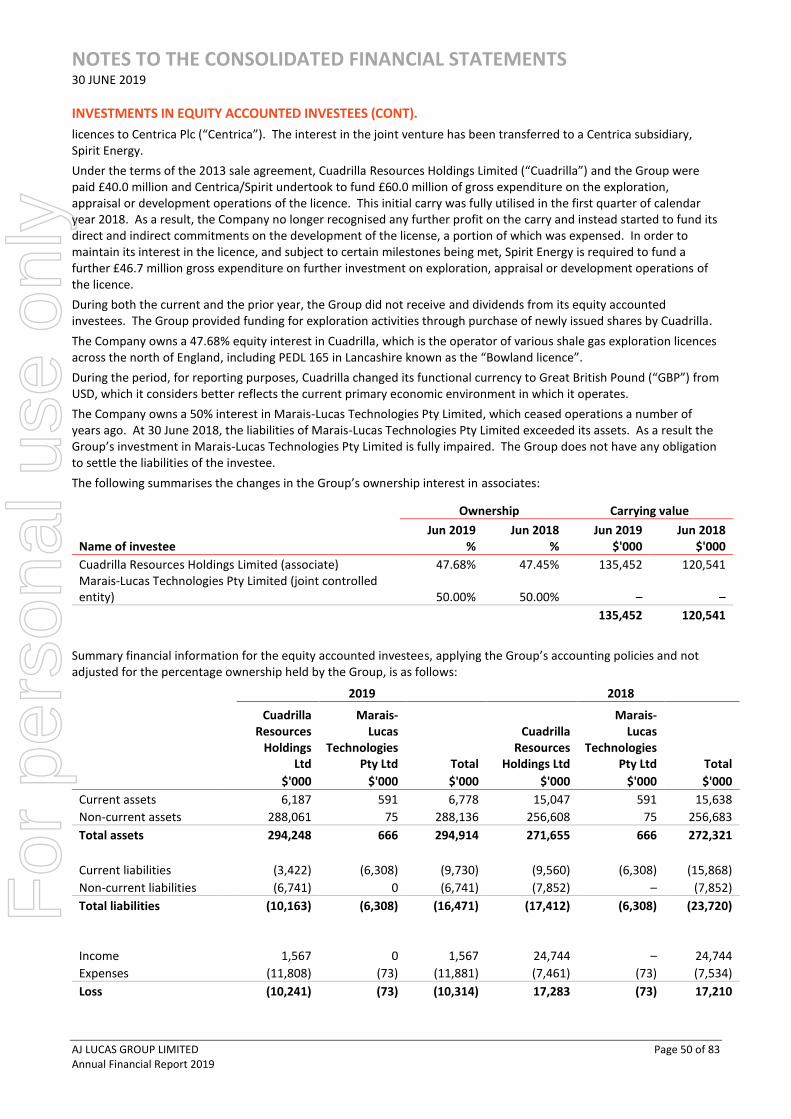
NOTES TO THE CONSOLIDATED FINANCIAL STATEMENTS 30 JUNE 2019
AJ LUCAS GROUP LIMITED Page 50 of 83 Annual Financial Report 2019
INVESTMENTS IN EQUITY ACCOUNTED INVESTEES (CONT).
licences to Centrica Plc (“Centrica”). The interest in the joint venture has been transferred to a Centrica subsidiary, Spirit Energy.
Under the terms of the 2013 sale agreement, Cuadrilla Resources Holdings Limited (“Cuadrilla”) and the Group were paid £40.0 million and Centrica/Spirit undertook to fund £60.0 million of gross expenditure on the exploration, appraisal or development operations of the licence. This initial carry was fully utilised in the first quarter of calendar year 2018. As a result, the Company no longer recognised any further profit on the carry and instead started to fund its direct and indirect commitments on the development of the license, a portion of which was expensed. In order to maintain its interest in the licence, and subject to certain milestones being met, Spirit Energy is required to fund a further £46.7 million gross expenditure on further investment on exploration, appraisal or development operations of the licence.
During both the current and the prior year, the Group did not receive and dividends from its equity accounted investees. The Group provided funding for exploration activities through purchase of newly issued shares by Cuadrilla.
The Company owns a 47.68% equity interest in Cuadrilla, which is the operator of various shale gas exploration licences across the north of England, including PEDL 165 in Lancashire known as the “Bowland licence”.
During the period, for reporting purposes, Cuadrilla changed its functional currency to Great British Pound (“GBP”) from USD, which it considers better reflects the current primary economic environment in which it operates.
The Company owns a 50% interest in Marais-Lucas Technologies Pty Limited, which ceased operations a number of years ago. At 30 June 2018, the liabilities of Marais-Lucas Technologies Pty Limited exceeded its assets. As a result the Group’s investment in Marais-Lucas Technologies Pty Limited is fully impaired. The Group does not have any obligation to settle the liabilities of the investee.
The following summarises the changes in the Group’s ownership interest in associates:
Ownership Carrying value
Name of investee Jun 2019
% Jun 2018
% Jun 2019
$'000 Jun 2018
$'000
Cuadrilla Resources Holdings Limited (associate) 47.68% 47.45% 135,452 120,541 Marais-Lucas Technologies Pty Limited (joint controlled entity) 50.00% 50.00% – –
135,452 120,541
Summary financial information for the equity accounted investees, applying the Group’s accounting policies and not adjusted for the percentage ownership held by the Group, is as follows:
2019 2018
Cuadrilla Resources
Holdings Ltd
Marais-Lucas
Technologies Pty Ltd Total
Cuadrilla Resources
Holdings Ltd
Marais-Lucas
Technologies Pty Ltd Total
$'000 $'000 $'000 $'000 $'000 $'000
Current assets 6,187 591 6,778 15,047 591 15,638
Non-current assets 288,061 75 288,136 256,608 75 256,683
Total assets 294,248 666 294,914 271,655 666 272,321
Current liabilities (3,422) (6,308) (9,730) (9,560) (6,308) (15,868)
Non-current liabilities (6,741) 0 (6,741) (7,852) – (7,852)
Total liabilities (10,163) (6,308) (16,471) (17,412) (6,308) (23,720)
Income 1,567 0 1,567
24,744 – 24,744
Expenses (11,808) (73) (11,881) (7,461) (73) (7,534)
Loss (10,241) (73) (10,314) 17,283 (73) 17,210
For
per
sona
l use
onl
y

NOTES TO THE CONSOLIDATED FINANCIAL STATEMENTS 30 JUNE 2019
AJ LUCAS GROUP LIMITED Page 51 of 83 Annual Financial Report 2019
19. EXPLORATION ASSETS
2019
$'000 2018
$'000
Cost Bowland exploration asset 38,794 27,837
Elswick exploration asset 6,181 5,601
Bolney exploration asset 2,987 2,476
47,962 35,914 The exploration assets comprise the Group’s equity interest (“direct interest”) in the above licences and represents
exploration expenditure incurred. The Group is beneficially entitled to an additional interest (“indirect interest”) in
these licences through its shareholding in the equity accounted associate, Cuadrilla Resources Holding Limited
(“Cuadrilla”) as shown below:
Indirect
Interest % Direct
Interest % 2019
% 2018
%
Beneficial interest Bowland tenement/licence 24.44 23.75 48.19 48.07
Elswick tenement/licence 25.51 23.75 49.26 45.88
Balcombe (Bolney) tenement/licence 26.82 18.75 45.57 45.44
The indirect interest comprises Cuadrilla’s equity interest in the respective licence multiplied by the Group’s equity interest in Cuadrilla as shown in Note 18.
Licence requirements
Exploration licences contain conditions relating to achieving certain milestones on agreed deadlines. Where milestones are not achieved within agreed deadlines, the terms of the licence may require partial relinquishment of the licence area or be withdrawn. Applications can be made to alter or extend exploration licence conditions. Cuadrilla has to date met all its milestones in respect of UK licences.
Current operations at Preston New Road
Cuadrilla, with its 51.25% interest, is the operator of PEDL 165, the “Bowland licence”; the Company also owns a 23.75% interest in the licence and, Spirit Energy owns the remaining 25% interest in the licence. As a result of both its direct and indirect interest, the Group has an effective 48.19% interest in the licence.
Cuadrilla, the Operator of the licence, has planning consent to drill, hydraulic fracture (“HF”) and flow-test up to four horizontal shale gas exploration wells at the Preston New Road Exploration site (“PNR”) which it received in 2016. PNR, within the Bowland licence, is located within a 100km2 3D seismic survey in the same structural fairway as the shale gas discovery well Preese Hall-1 and is located approximately 3.9km south of Preese Hall-1.
Cuadrilla drilled a vertical well through the Upper and Lower Bowland shale to a depth of 2,614 metres, from which it collected over 300 metres of core samples in addition to a wide range of wireline logging. Having analysed this core and log data, Cuadrilla identified the top six separate potential productive zones: three in the Upper Bowland Shale and three in the Lower Bowland Shale. Two horizontal wells, being PNR1z and PNR2 were subsequently drilled, targeting two of these six zones, well 1 in the Lower Bowland and well 2 in the upper Bowland.
In the period from October 2018 to February 2019, Cuadrilla hydraulically fractured and flow tested PNR1z. This horizontal well was designed with 41 mechanically manipulated multi-cycle fracture sleeves. HF operations took place during the period 15th October – 17th December 2018, and were conducted under the seismicity limits of the Traffic Light System (“TLS”). These require that the operator temporarily halt hydraulic fracturing for a period of 18 hours if a seismic event measuring more than 0.5ML on the Richter Scale is registered. As hydraulic fracturing occurs at a depth of 2kms or more, seismic events at this magnitude level, which last for no more than a matter of seconds, are unlikely to be felt at surface and would create no damage at surface.
For
per
sona
l use
onl
y

NOTES TO THE CONSOLIDATED FINANCIAL STATEMENTS 30 JUNE 2019
AJ LUCAS GROUP LIMITED Page 52 of 83 Annual Financial Report 2019
EXPLORATION ASSETS (CONT)
Under these very conservative thresholds, not all the stages were stimulated with the designed 50 tonnes of sand being injected. Of the planned 41 stages, 2 were embedded with the planned 50 tonnes of sand, 14 stages were fractured with various smaller quantities of sand and a number of stages were tested for fracturing without injecting any sand. In total only 14% of the intended proppant was injected into the formation. Cuadrilla has retained the option of completing the fracturing program for this well, after reworking the well, when the HF of well 2 is complete.
In February 2019, Cuadrilla released results from its flow-testing of PNR1z. This identified a reservoir of high-quality dry natural gas, comprising approximately 96% methane with negligible impurities. The gas contained no traces of
hydrogen-sulphide and very low levels of carbon dioxide (approximately 0.15% of the gas). Flow testing achieved a
peak of 200,000 standard cubic feet per day (“scfd”), with a stable flow of 100,000 scfd. These results indicate that rock properties are highly conducive to fracturing.
Given the flow rates achieved from PNR1z, and taking account of the limited number of stages fractured and the amount of proppant placed, Cuadrilla estimated that an initial flow rate range of 3-8 million standard cubic feet per day (“mmscfd”) could be expected from a fully fractured horizontal Bowland Shale well of 2,500 metres in length. Subject to factors such as capital and operating costs, such rates are likely to be commercially viable and would demonstrate the Bowland shale as a world class natural gas shale resource.
In June 2019, Cuadrilla submitted an updated hydraulic fracture plan for the second well at the Preston New Road Exploration Site (“PNR2”). The plan is to fracture up to 45 stages by the end of November 2019, which will be followed by flow testing. AJ Lucas as shareholder in Cuadrilla and 23.75% joint venture partner in the Bowland licence, supports this program as the next step in determining the commercial value of the resource. The plan builds on information gathered from operations already undertaken on PNR1z and incorporates the use of higher viscosity fracturing fluid. Cuadrilla recommenced hydraulic fracturing on 15 August and, as of 20th August Cuadrilla had fractured 5 stages. 30 tonnes of proppant were placed in the 1st stage and an average of 50 tonnes of proppant were placed in stages 2 through 5.
Following the fracturing of Stage 6 on 21st August and Stage 7 on 23rd August, a number of post-pumping seismic events were recorded. The largest of these measured 2.9 on the Richter Scale and was recorded on Monday 26th August. This event was of approximately 3 seconds duration and the associated ground movements were recorded at between 5 and 8 mm/second. These recorded ground motions are below the levels typically allowable in the Construction industry however the event was felt locally. A technical investigation is being undertaken. Following this review fracturing is expected to recommence.
Cuadrilla intends to seek a variation to its current planning permission, which requires drilling and fracturing to be completed by November 2019. It plans to write to Lancashire County Council seeking a scoping opinion under the Town and Country Planning (Environmental Impact Assessment) Regulations 2017 to seek to allow an additional 18 months for these activities. A formal planning application will then follow.
The UK Committee on Climate Change (CCC) in its May 2019 report clearly forecast a very significant UK gas demand out to 2050 and beyond – approximately 70 per cent of 2019 gas demand still existing in the year 2050. Under the CCC’s recommended pathway to net zero CO2 emissions this gas would be used as both a feedstock for making hydrogen and a backup supply for generating electricity. Carbon Capture and Storage would accompany gas usage to ensure net zero CO2 emissions.
Separately, in February 2019 the UK Secretary of State for Communities and Local Government (“SOS) declined planning consent for four horizontal shale gas wells at the Roseacre Wood (“RW”) exploration site based exclusively on transport issues. While the decision was disappointing Cuadrilla has decided not to appeal against the decision and instead is focused on the PNR operations.
For
per
sona
l use
onl
y

NOTES TO THE CONSOLIDATED FINANCIAL STATEMENTS 30 JUNE 2019
AJ LUCAS GROUP LIMITED Page 53 of 83 Annual Financial Report 2019
EXPLORATION ASSETS (CONT)
Balcombe Licence (PEDL 244)
Licence operator Angus Energy completed a seven day horizontal well test of the Balcombe 2z Kimmeridge Layer in October 2018. The well naturally flowed at 853 barrels of oil per day (“bopd”) equivalent, not including 22.5% water. A second flow period was undertaken with the well flowing naturally at 1,587 bopd equivalent, not including 6.6% water. These flows were over a very short interval and whilst encouraging were not considered conclusive.
Post-test analysis of the recovered water demonstrated levels of salinity significantly higher than any regional trend, indicating a strong probability that injected brine rather than formation water was being produced from the site’s Micrite Layers. Given the mandated length of the short testing sequence, Angus Energy was not able to remove what it believes was a limited amount of unrecovered brine from previous activities at the site.
Angus Energy believes that continuous oil with a low water ratio can be produced from the Balcombe-2Z well under normal pumped production conditions and it now plans to apply for planning permission and the associated permits for a longer term well test which if successful could demonstrate commercial oil production.
14th Round Licences in the Gainsborough Trough and Cleveland Basin
Outside of the Bowland and Balcombe licences, Cuadrilla has interests in various UK onshore exploration licences in Yorkshire in the UK totaling approximately 1,274 km2, many of which target the same Bowland-Hodder shale formations being drilled and tested in Lancashire. Some of these licences are held solely by Cuadrilla, and some in joint venture with INEOS.
For
per
sona
l use
onl
y

NOTES TO THE CONSOLIDATED FINANCIAL STATEMENTS 30 JUNE 2019
AJ LUCAS GROUP LIMITED Page 54 of 83 Annual Financial Report 2019
20. DEFERRED TAX ASSETS AND LIABILITIES
Recognised deferred tax assets and liabilities
Deferred tax assets and liabilities are attributable to the following:
Tax Assets Tax Liabilities Net
2019
$'000 2018
$'000 2019
$'000 2018
$'000 2019
$'000 2018
$'000
Consolidated Inventories – – (1,237) (890) (1,237) (890)
Equity accounted investments – – (2,613) (2,613) (2,613) (2,613)
Property, plant and equipment 6,922 8,708 – – 6,922 8,708
Provisions for employee benefits 2,014 1,892 – – 2,014 1,892
Trade creditors 13 86 – – 13 86
Share raising costs 24 366 – – 24 366
Blackhole expenditure 202 – – – 202 –
Borrowing costs 53 – – – 53 –
Other creditors and accruals 2,684 4,757 – – 2,684 4,757 Unrealised foreign exchange differences 826 (730) – – 826 (730)
Deferred tax asset not recognised (8,888) (11,576) – – (8,888) (11,576)
Tax assets/(liabilities) 3,850 3,503 (3,850) (3,503) – –
Set off of tax (3,850) (3,503) 3,850 3,503 – –
Net assets/(liabilities) – – – – – –
For
per
sona
l use
onl
y

NOTES TO THE CONSOLIDATED FINANCIAL STATEMENTS 30 JUNE 2019
AJ LUCAS GROUP LIMITED Page 55 of 83 Annual Financial Report 2019
DEFERRED TAX ASSETS AND LIABILITIES (CONT.)
Movement in temporary differences during the year:
Balance 01 Jul 18
$'000
Recognised directly in
equity $'000
Recognised in profit
and loss $'000
Balance 30 Jun 19
$'000
2019 Inventories (890) – (347) (1,237)
Equity accounted investments (2,613) – – (2,613)
Property, plant and equipment 8,708 – (1,786) 6,922
Provisions for employee benefits 1,892 – 122 2,014
Trade creditors 86 – (73) 13
Share raising costs 366 – (342) 24
Blackhole expenditure – – 202 202
Borrowing costs – – 53 53
Other creditors and accruals 4,757 – (2,073) 2,684
Unrealised foreign exchange differences (730) – 1,556 826
Deferred tax asset not recognised (11,576) – 2,688 (8,888)
– – – –
Balance 01 Jul 17
$'000
Recognised directly in
equity $'000
Recognised in profit
and loss $'000
Balance 30 Jun 18
$'000
2018 Inventories (1,177) – 287 (890)
Equity accounted investments (2,613) – – (2,613)
Property, plant and equipment 11,086 – (2,378) 8,708
Provisions for employee benefits 1,815 – 77 1,892
Trade creditors 205 – (119) 86
Share raising costs 710 – (344) 366
Other creditors and accruals 738 – 4,019 4,757
Unrealised foreign exchange differences (1,451) – 721 (730)
Deferred tax asset not recognised (9,313) – (2,263) (11,576)
– – – –
Unrecognised deferred tax assets
As at 30 June 2019, the Group had not recognised deferred tax assets of $43,356,050 (2018: $54,149,271) in relation to income tax losses.
21. TRADE AND OTHER PAYABLES
2019
$'000 2018
$'000
Current
Trade payables 12,872 11,502
Other payables and accruals 14,736 20,702
Provisions 4,321 4,587
31,929 36,791
Other payables and accruals represent costs incurred but not yet invoiced from suppliers, accrued payroll and taxation expenses and certain rehabilitation costs on exploration tenements.
For
per
sona
l use
onl
y

NOTES TO THE CONSOLIDATED FINANCIAL STATEMENTS 30 JUNE 2019
AJ LUCAS GROUP LIMITED Page 56 of 83 Annual Financial Report 2019
22. INTEREST-BEARING LOANS AND BORROWINGS
2019
$'000 2018
$'000
Current
Senior loan notes 67,164 17,185
67,164 17,185
Non-current
Senior loan notes – 27,399
Loans from related party 52,536 40,252
52,536 67,651 (a) Loans and borrowing terms and maturities
Senior loan notes
Senior loan notes are denominated in US dollars and are fully drawn and secured by a first ranking fixed and floating security interest over the Company and each of its operating and investment subsidiaries. Interest on these notes is charged at 18% of the drawn amount, with 12% payable quarterly in arrears and 6% permitted to accrue until termination, repayment or part repayment of the principal facility. The principal outstanding along with a pro-rata portion of interest outstanding, must be reduced to US$20 million by 30 September 2019, with the balance repayable by 31 March 2020. The total amount of principal and interest accrued as at 30 June 2019 has been classified as a current liability.
As part consideration of the facility, the Company agreed to issue a total of 20 million ordinary shares to note holders in two tranches coinciding with initial draw downs in 2016 and 2017. The costs of the shares, together with other prepaid transaction costs incurred are being amortised over the life of the loan notes using the effective interest method.
Loans from related party
Kerogen Investments No 1 (HK) Limited (Kerogen), which hold 53.32% of the issued shares of the Company has provided the Company $52.5 million as loans. These loans terminate six months after the Senior loan notes are repaid in full or in September 2020, whichever is earlier. Interest on these loans is charged at 18% of the outstanding balance which is due quarterly but which the Company may, at its discretion, defer until maturity. Interest compounds quarterly if unpaid. In addition, Kerogen has a fixed and floating security ranking behind the senior term loan notes.
During 2018 the Company completed a capital raising with total proceeds of $52.6 million. The capital raising consisted of a 1 for 6 entitlement offer and a placement. Kerogen participated for its full pro rata entitlement in the Entitlement offer of $18.3 million which was satisfied by part conversion of the loans provided by Kerogen, including accrued interest.
Additional transaction costs, including restructure fees payable to Kerogen, are amortised over the expected term of the loan facility using the effective interest method..
(b) Available finance facilities
2019
$'000 2018
$'000
(i) The Group has access to the following lines of credit
Senior loan notes 67,164 44,584
Loans from related party 52,536 40,252
119,700 84,836
Total facilities utilised at balance date:
Senior loan notes 67,164 44,584
Loans from related party 52,536 40,252
119,700 84,836
Total facilities not utilised at balance date:
Senior term loan notes – –
– –
For
per
sona
l use
onl
y
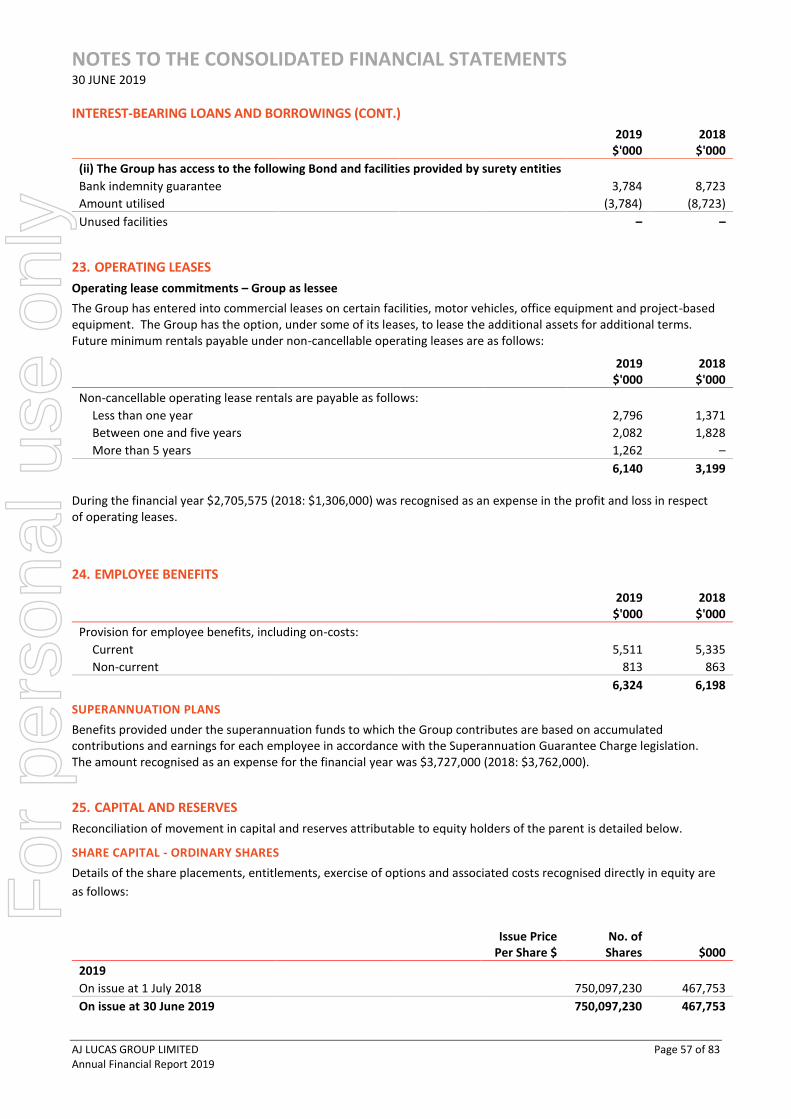
NOTES TO THE CONSOLIDATED FINANCIAL STATEMENTS 30 JUNE 2019
AJ LUCAS GROUP LIMITED Page 57 of 83 Annual Financial Report 2019
INTEREST-BEARING LOANS AND BORROWINGS (CONT.)
2019
$'000 2018
$'000
(ii) The Group has access to the following Bond and facilities provided by surety entities
Bank indemnity guarantee 3,784 8,723
Amount utilised (3,784) (8,723)
Unused facilities – –
23. OPERATING LEASES
Operating lease commitments – Group as lessee
The Group has entered into commercial leases on certain facilities, motor vehicles, office equipment and project-based equipment. The Group has the option, under some of its leases, to lease the additional assets for additional terms. Future minimum rentals payable under non-cancellable operating leases are as follows:
2019
$'000 2018
$'000
Non-cancellable operating lease rentals are payable as follows:
Less than one year 2,796 1,371
Between one and five years 2,082 1,828
More than 5 years 1,262 –
6,140 3,199
During the financial year $2,705,575 (2018: $1,306,000) was recognised as an expense in the profit and loss in respect of operating leases.
24. EMPLOYEE BENEFITS
2019
$'000 2018
$'000
Provision for employee benefits, including on-costs:
Current 5,511 5,335
Non-current 813 863
6,324 6,198
SUPERANNUATION PLANS
Benefits provided under the superannuation funds to which the Group contributes are based on accumulated contributions and earnings for each employee in accordance with the Superannuation Guarantee Charge legislation. The amount recognised as an expense for the financial year was $3,727,000 (2018: $3,762,000).
25. CAPITAL AND RESERVES
Reconciliation of movement in capital and reserves attributable to equity holders of the parent is detailed below.
SHARE CAPITAL - ORDINARY SHARES
Details of the share placements, entitlements, exercise of options and associated costs recognised directly in equity are
as follows:
Issue Price Per Share $
No. of Shares $000
2019
On issue at 1 July 2018 750,097,230 467,753
On issue at 30 June 2019 750,097,230 467,753
For
per
sona
l use
onl
y

NOTES TO THE CONSOLIDATED FINANCIAL STATEMENTS 30 JUNE 2019
AJ LUCAS GROUP LIMITED Page 58 of 83 Annual Financial Report 2019
CAPITAL AND RESERVES (CONT)
No. of Shares $000
2018
On issue at 1 July 2017 585,188,730 416,443
Placement 0.32 70,500,050 22,560
Entitlement offer 0.32 94,408,450 30,211
Transaction costs incurred N/A (1,461)
On issue at 30 June 2018 750,097,230 467,753
In January 2018 the Company launched a placement and a 1 for 6 accelerated non-renounceable entitlement offer which completed in February 2018. A total of 164,908,500 ordinary shares were issued at $0.32 per share raising approximately $52.8 million of which $29.6 million was applied to repay interest bearing liabilities in accordance with the Senior Loan note and Kerogen Loan facilities. Kerogen participated for its full pro rata entitlement raising $18.2 million which was satisfied by the conversion of the related party loans owned to Kerogen, including accrued interest.
Holders of ordinary shares are entitled to receive dividends and, in the event of a winding up of the Company, to any proceeds of liquidation after all creditors and other stockholders have been paid in full.
On a show of hands, every holder of ordinary shares present at a shareholder meeting in person or by proxy is entitled to one vote and upon a poll, each share is entitled to one vote.
NATURE AND PURPOSE OF RESERVES
Employee equity benefits reserve
The employee equity benefits reserve represents the expense associated with equity-settled compensation under historic employee management rights incentive plans. There are no equity-settled compensation plans currently in operation, and not rights outstanding under previous plans.
Translation reserve
The translation reserve comprises all foreign currency differences arising from the translation of the financial statements of foreign operations into Australian dollars.
OPTIONS
There are no options over ordinary shares outstanding at the balance sheet date.
DIVIDENDS
No dividends in respect of the 2019 or 2018 financial years have been declared or paid.
DIVIDEND FRANKING ACCOUNT
The balance of franking credits available to shareholders of the Company as at 30 June 2019 $60,852,374 (2018: $60,852,374).
For
per
sona
l use
onl
y
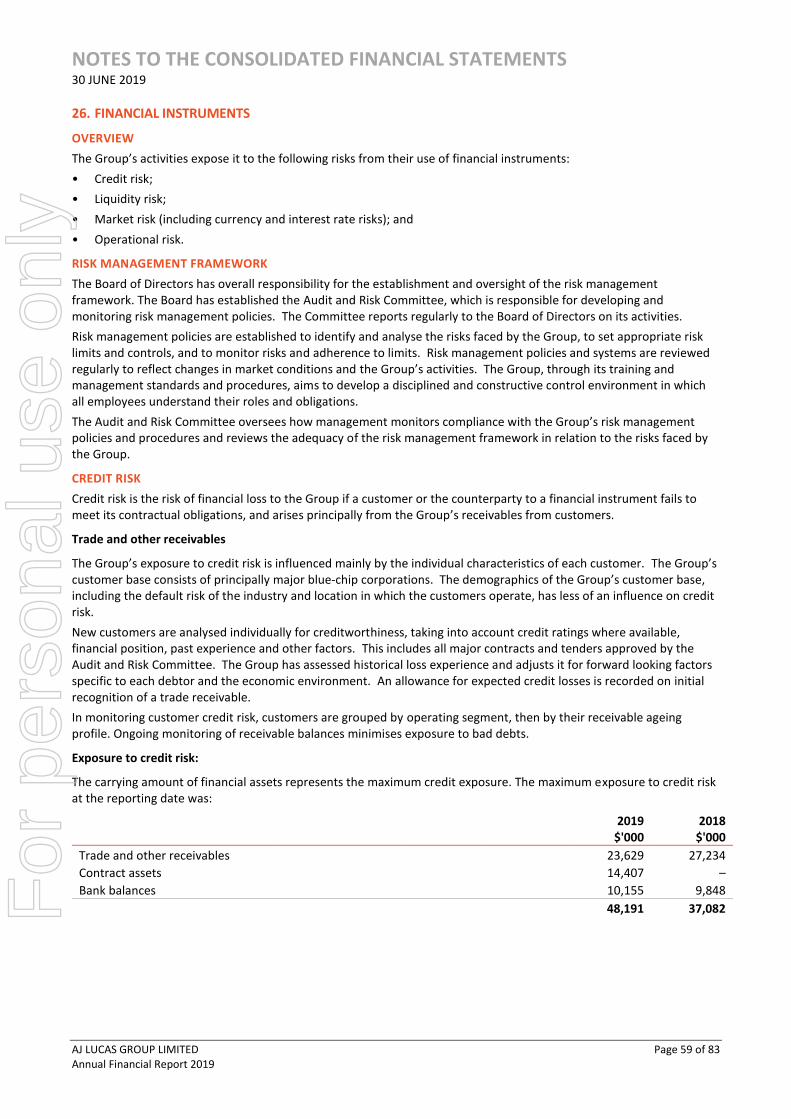
NOTES TO THE CONSOLIDATED FINANCIAL STATEMENTS 30 JUNE 2019
AJ LUCAS GROUP LIMITED Page 59 of 83 Annual Financial Report 2019
26. FINANCIAL INSTRUMENTS
OVERVIEW
The Group’s activities expose it to the following risks from their use of financial instruments:
• Credit risk;
• Liquidity risk;
• Market risk (including currency and interest rate risks); and
• Operational risk.
RISK MANAGEMENT FRAMEWORK
The Board of Directors has overall responsibility for the establishment and oversight of the risk management framework. The Board has established the Audit and Risk Committee, which is responsible for developing and monitoring risk management policies. The Committee reports regularly to the Board of Directors on its activities.
Risk management policies are established to identify and analyse the risks faced by the Group, to set appropriate risk limits and controls, and to monitor risks and adherence to limits. Risk management policies and systems are reviewed regularly to reflect changes in market conditions and the Group’s activities. The Group, through its training and management standards and procedures, aims to develop a disciplined and constructive control environment in which all employees understand their roles and obligations.
The Audit and Risk Committee oversees how management monitors compliance with the Group’s risk management policies and procedures and reviews the adequacy of the risk management framework in relation to the risks faced by the Group.
CREDIT RISK
Credit risk is the risk of financial loss to the Group if a customer or the counterparty to a financial instrument fails to meet its contractual obligations, and arises principally from the Group’s receivables from customers.
Trade and other receivables
The Group’s exposure to credit risk is influenced mainly by the individual characteristics of each customer. The Group’s customer base consists of principally major blue-chip corporations. The demographics of the Group’s customer base, including the default risk of the industry and location in which the customers operate, has less of an influence on credit risk.
New customers are analysed individually for creditworthiness, taking into account credit ratings where available, financial position, past experience and other factors. This includes all major contracts and tenders approved by the Audit and Risk Committee. The Group has assessed historical loss experience and adjusts it for forward looking factors specific to each debtor and the economic environment. An allowance for expected credit losses is recorded on initial recognition of a trade receivable.
In monitoring customer credit risk, customers are grouped by operating segment, then by their receivable ageing profile. Ongoing monitoring of receivable balances minimises exposure to bad debts.
Exposure to credit risk:
The carrying amount of financial assets represents the maximum credit exposure. The maximum exposure to credit risk at the reporting date was:
2019
$'000 2018
$'000
Trade and other receivables 23,629 27,234
Contract assets 14,407 –
Bank balances 10,155 9,848
48,191 37,082
For
per
sona
l use
onl
y

NOTES TO THE CONSOLIDATED FINANCIAL STATEMENTS 30 JUNE 2019
AJ LUCAS GROUP LIMITED Page 60 of 83 Annual Financial Report 2019
FINANCIAL INSTRUMENTS (CONT.)
Impairment
Maximum exposure to credit risk for receivables at the reporting date by business segment was:
2019
$'000 2018
$'000
Drilling 13,899 18,667
Engineering and construction 9,423 7,664
Oil and gas – 632
Corporate / unallocated 307 271
23,629 27,234
The ageing of the Group’s trade and other receivables at the reporting date was:
Gross 2019
$'000
Impairment 2019
$'000
Gross 2018
$'000
Impairment 2018
$'000
Not past due 19,621 – 22,542 –
Past due up to 30 days 3,934 – 1,786 –
Past due 31 to 120 days 74 – 29 –
Past due 121 days to one year – – 398 –
Past due more than one year – – 2,479 –
23,629 – 27,234 –
An allowance for expected credit losses (“ECL”) is recognised after considering historic experience adjusted for forward looking factors specific to each counterparty and the economic environment. The allowance does not include debts past due relating to customers with a good credit history where future credit losses are not expected to eventuate. When the Group is satisfied that no recovery of the amount owing is possible, the amounts considered irrecoverable are written off directly against the financial asset.
LIQUIDITY RISK
Liquidity risk is the risk that the Group will not be able to meet its financial obligations as they fall due. Liquidity is managed to ensure, that sufficient funds are available to meet liabilities when they fall due, under both normal and stressed conditions, without incurring unacceptable losses or risking damage to the Group’s reputation.
The following are the contractual maturities of financial liabilities, including estimated interest payments and excluding the impact of netting arrangements:
Carrying amount
$'000 Total $'000
6 months or less $'000
6-12 months
$'000
1-2 years $'000
2-5 years $'000
More than
5 years $'000
2019
Non-derivative financial liabilities
Trade and other payables 31,929 (33,134) (29,220) – – (2,709) (1,205)
Senior term loan notes 67,164 (74,887) (40,446) (34,441) – – –
Loans from related party 52,536 (66,304) – (628) (65,676) – –
151,629 (174,325) (69,666) (35,069) (65,676) (2,709) (1,205)
For
per
sona
l use
onl
y
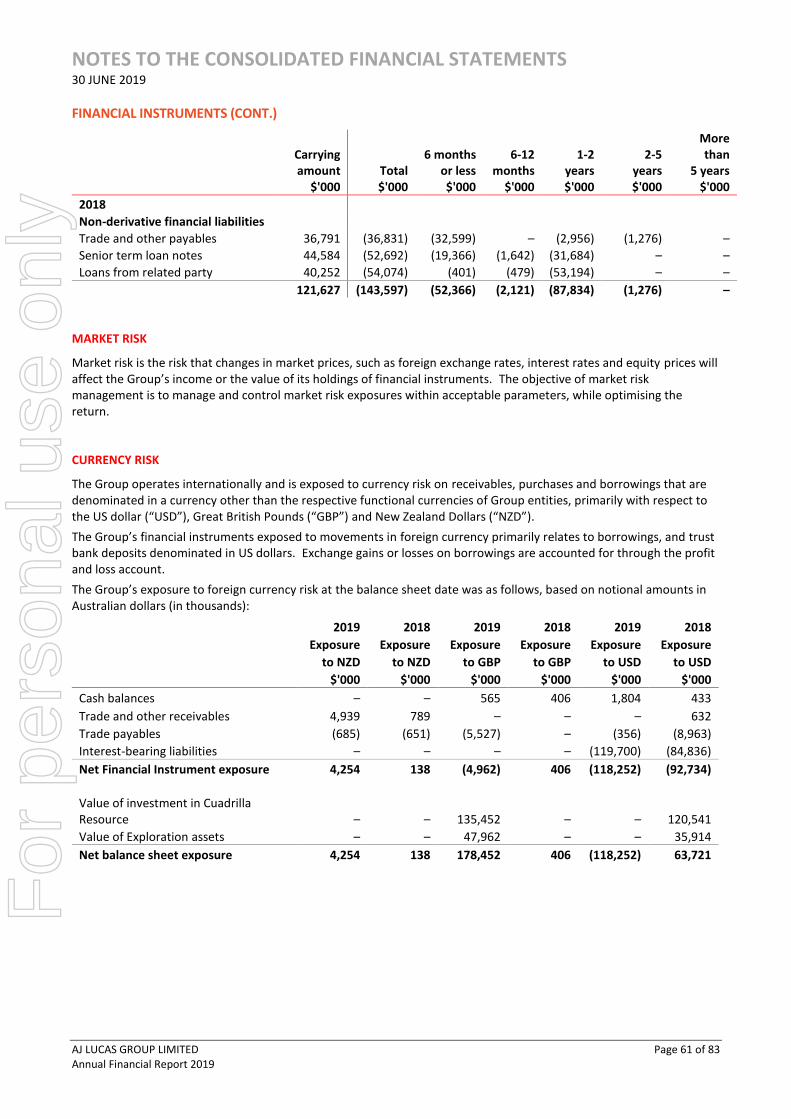
NOTES TO THE CONSOLIDATED FINANCIAL STATEMENTS 30 JUNE 2019
AJ LUCAS GROUP LIMITED Page 61 of 83 Annual Financial Report 2019
FINANCIAL INSTRUMENTS (CONT.)
Carrying amount
$'000 Total $'000
6 months or less $'000
6-12 months
$'000
1-2 years $'000
2-5 years $'000
More than
5 years $'000
2018
Non-derivative financial liabilities
Trade and other payables 36,791 (36,831) (32,599) – (2,956) (1,276) –
Senior term loan notes 44,584 (52,692) (19,366) (1,642) (31,684) – –
Loans from related party 40,252 (54,074) (401) (479) (53,194) – –
121,627 (143,597) (52,366) (2,121) (87,834) (1,276) –
MARKET RISK
Market risk is the risk that changes in market prices, such as foreign exchange rates, interest rates and equity prices will affect the Group’s income or the value of its holdings of financial instruments. The objective of market risk management is to manage and control market risk exposures within acceptable parameters, while optimising the return.
CURRENCY RISK
The Group operates internationally and is exposed to currency risk on receivables, purchases and borrowings that are denominated in a currency other than the respective functional currencies of Group entities, primarily with respect to the US dollar (“USD”), Great British Pounds (“GBP”) and New Zealand Dollars (“NZD”).
The Group’s financial instruments exposed to movements in foreign currency primarily relates to borrowings, and trust bank deposits denominated in US dollars. Exchange gains or losses on borrowings are accounted for through the profit and loss account.
The Group’s exposure to foreign currency risk at the balance sheet date was as follows, based on notional amounts in Australian dollars (in thousands):
2019 2018 2019 2018 2019 2018
Exposure Exposure Exposure Exposure Exposure Exposure
to NZD to NZD to GBP to GBP to USD to USD
$'000 $'000 $'000 $'000 $'000 $'000
Cash balances – – 565 406 1,804 433
Trade and other receivables 4,939 789 – – – 632
Trade payables (685) (651) (5,527) – (356) (8,963)
Interest-bearing liabilities – – – – (119,700) (84,836)
Net Financial Instrument exposure 4,254 138 (4,962) 406 (118,252) (92,734)
Value of investment in Cuadrilla Resource – – 135,452 – – 120,541
Value of Exploration assets – – 47,962 – – 35,914
Net balance sheet exposure 4,254 138 178,452 406 (118,252) 63,721
For
per
sona
l use
onl
y

NOTES TO THE CONSOLIDATED FINANCIAL STATEMENTS 30 JUNE 2019
AJ LUCAS GROUP LIMITED Page 62 of 83 Annual Financial Report 2019
FINANCIAL INSTRUMENTS (CONT.)
At 30 June, had the Australian dollar weakened/strengthened by 10% against the respective foreign currencies with all other variables held constant, the impact on Group post-tax loss and equity would have been:
10% strengthened 10% weakened
2019 2018 2019 2018
AUD/USD 0.7714 0.8130 0.6312 0.6652
AUD/GBP 0.6089 0.6197 0.4982 0.5071
AUD/NZD 1.1508 1.1993 0.9416 0.9813
Post-tax loss (higher) / lower 10,815 8,381 (10,243) (10,243)
Net equity higher / (lower) (5,859) (5,842) 7,141 7,141
The following significant exchange rates applied during the year:
Average Rate Reporting date
spot rate
2019 2018 2019 2018
USD 0.7154 0.7753 0.7013 0.7391
GBP 0.5527 0.5758 0.5535 0.5634
NZD 1.0664 1.0852 1.0462 1.0903
INTEREST RATE RISK
The Group’s main interest rate risk arises from borrowings. Borrowings issued at variable rates expose the Group to
cash flow interest rate risk. Borrowings at fixed rates expose the Group to fair value interest rate risk. The majority of
the Group’s borrowings are at fixed rates. The Group does not account for any fixed rate financial assets and liabilities
at fair value through profit or loss, therefore a change in interest rates at the reporting date would not affect profit or
loss for the Group.
For
per
sona
l use
onl
y

NOTES TO THE CONSOLIDATED FINANCIAL STATEMENTS 30 JUNE 2019
AJ LUCAS GROUP LIMITED Page 63 of 83 Annual Financial Report 2019
FINANCIAL INSTRUMENTS (CONT.)
Interest rate exposure is detailed as follows:
At reporting date, the Group did not have any variable interest rate borrowings.
2019
$'000 2018
$'000
Fixed rate instruments
Financial assets 3,784 5,724
Financial liabilities (119,700) (84,836)
(115,916) (79,112)
Variable rate instruments
Financial assets 10,155 9,848
10,155 9,848
FAIR VALUES
Fair values versus carrying amounts
The fair values of financial assets and liabilities, together with the carrying amounts shown in the consolidated statement of financial position, are as follows:
Carrying
Amount Fair value
2019 $’000 $’000
Bank balances
10,155 10,155
Trade and other receivables
23,629 23,629
Trade and other payables
(31,929) (31,929)
Senior term loan notes (1)
(67,164) (69,513)
Loans from related party (1)
(52,536) (52,536)
(117,845) (120,194)
2018
Bank balances
9,848 9,848
Trade and other receivables
27,234 27,234
Trade and other payables
(36,791) (36,791)
Senior term loan notes (1)
(44,584) (46,983)
Loans from related party (1)
(40,252) (40,670)
(84,545) (87,362)
(1) The terms and conditions of the Senior term loan notes and loans from related party were negotiated in June 2016 following a competitive process in which a number of term sheets were received from various parties. However, in accordance with accounting standards the loans are accounted for using the amortised costs basis under which certain prepaid transactions costs are recognised as an offset to the carrying amount of the liability and are amortised over the life of the loan. As such the carrying value differs from the fair value.
Management have assessed that the fair values of cash and short-term deposits, trade receivables, trade payables and other current liabilities approximate their carrying amounts largely due to the short-term maturities of these assets and liabilities.
The fair value of the financial assets and liabilities is included at the amount which could be exchanged in a current transaction between willing parties, other than in a forced or liquidation sale. The fair value of assets and liabilities are derived with reference to Note 5.
For
per
sona
l use
onl
y
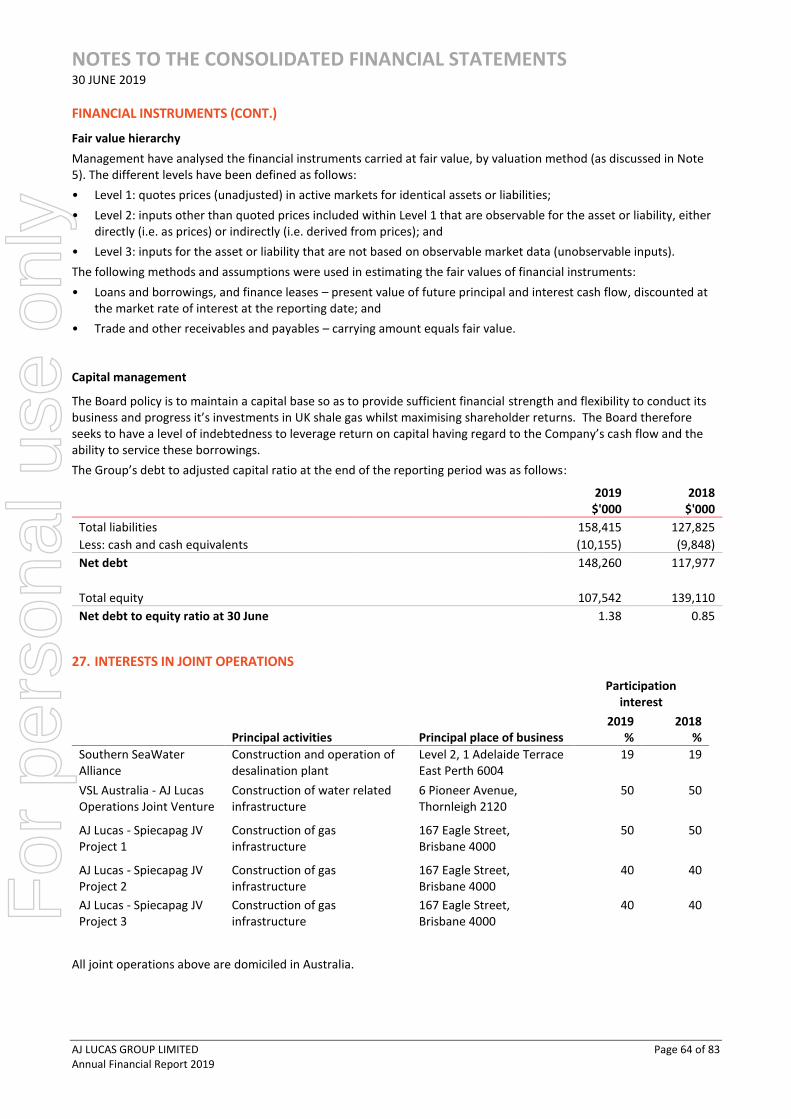
NOTES TO THE CONSOLIDATED FINANCIAL STATEMENTS 30 JUNE 2019
AJ LUCAS GROUP LIMITED Page 64 of 83 Annual Financial Report 2019
FINANCIAL INSTRUMENTS (CONT.)
Fair value hierarchy
Management have analysed the financial instruments carried at fair value, by valuation method (as discussed in Note 5). The different levels have been defined as follows:
• Level 1: quotes prices (unadjusted) in active markets for identical assets or liabilities;
• Level 2: inputs other than quoted prices included within Level 1 that are observable for the asset or liability, either directly (i.e. as prices) or indirectly (i.e. derived from prices); and
• Level 3: inputs for the asset or liability that are not based on observable market data (unobservable inputs).
The following methods and assumptions were used in estimating the fair values of financial instruments:
• Loans and borrowings, and finance leases – present value of future principal and interest cash flow, discounted at the market rate of interest at the reporting date; and
• Trade and other receivables and payables – carrying amount equals fair value.
Capital management
The Board policy is to maintain a capital base so as to provide sufficient financial strength and flexibility to conduct its business and progress it’s investments in UK shale gas whilst maximising shareholder returns. The Board therefore seeks to have a level of indebtedness to leverage return on capital having regard to the Company’s cash flow and the ability to service these borrowings.
The Group’s debt to adjusted capital ratio at the end of the reporting period was as follows:
2019
$'000 2018
$'000
Total liabilities 158,415 127,825
Less: cash and cash equivalents (10,155) (9,848)
Net debt 148,260 117,977
Total equity 107,542 139,110
Net debt to equity ratio at 30 June 1.38 0.85
27. INTERESTS IN JOINT OPERATIONS
Principal activities Principal place of business
Participation interest
2019
% 2018
%
Southern SeaWater Alliance
Construction and operation of desalination plant
Level 2, 1 Adelaide Terrace East Perth 6004
19 19
VSL Australia - AJ Lucas Operations Joint Venture
Construction of water related infrastructure
6 Pioneer Avenue, Thornleigh 2120
50 50
AJ Lucas - Spiecapag JV Project 1
Construction of gas infrastructure
167 Eagle Street, Brisbane 4000
50 50
AJ Lucas - Spiecapag JV Project 2
Construction of gas infrastructure
167 Eagle Street, Brisbane 4000
40 40
AJ Lucas - Spiecapag JV Project 3
Construction of gas infrastructure
167 Eagle Street, Brisbane 4000
40 40
All joint operations above are domiciled in Australia.
For
per
sona
l use
onl
y
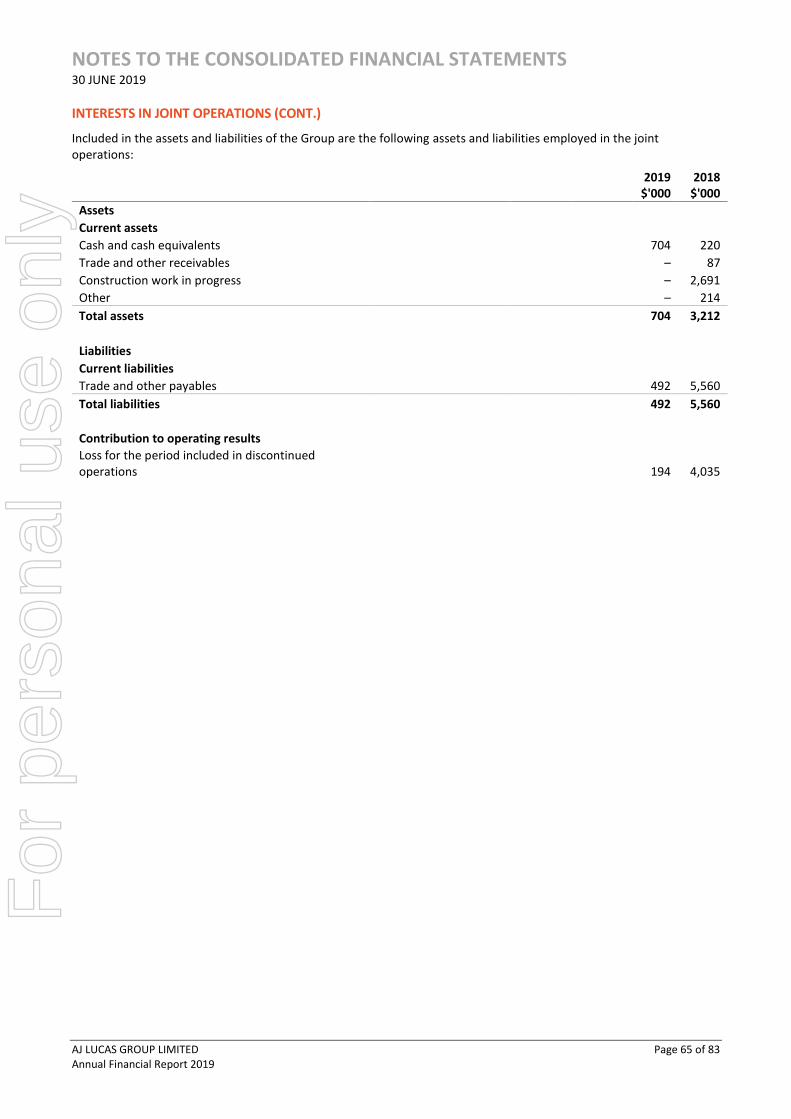
NOTES TO THE CONSOLIDATED FINANCIAL STATEMENTS 30 JUNE 2019
AJ LUCAS GROUP LIMITED Page 65 of 83 Annual Financial Report 2019
INTERESTS IN JOINT OPERATIONS (CONT.)
Included in the assets and liabilities of the Group are the following assets and liabilities employed in the joint operations:
2019
$'000 2018
$'000
Assets
Current assets
Cash and cash equivalents 704 220
Trade and other receivables – 87
Construction work in progress – 2,691
Other – 214
Total assets 704 3,212
Liabilities
Current liabilities
Trade and other payables 492 5,560
Total liabilities 492 5,560
Contribution to operating results Loss for the period included in discontinued operations 194 4,035
For
per
sona
l use
onl
y

NOTES TO THE CONSOLIDATED FINANCIAL STATEMENTS 30 JUNE 2019
AJ LUCAS GROUP LIMITED Page 66 of 83 Annual Financial Report 2019
28. CONSOLIDATED ENTITIES
The financial statements at 30 June 2019 include the following controlled entities. The financial years of all the controlled entities are the same as that of the parent entity.
Ownership interest
Name of entity
Country of incorporation
2019 %
2018 %
Parent entity AJ Lucas Group Limited Controlled entities Australian Water Engineering Pty Limited Australia 100 100
AJ Lucas Operations Pty Limited Australia 100 100
AJ Lucas Plant & Equipment Pty Limited Australia 100 100
AJ Lucas Drilling Pty Limited Australia 100 100
Lucas Shared Services Pty Limited Australia 100 100
AJ Lucas Testing Pty Limited Australia 100 100
Lucas Operations (WA) Pty Limited Australia 100 100
Lucas Engineering and Construction Pty Limited Australia 100 100
AJ Lucas Joint Ventures Pty Limited Australia 100 100
AJ Lucas (Hong Kong) Limited Hong Kong 100 100
Lucas Drilling Pty Limited Australia 100 100
Subsidiaries of Lucas Drilling Pty Limited Mitchell Drilling Corporation Pty Limited Australia 100 100
Lucas Contract Drilling Pty Limited Australia 100 100
Subsidiary of Lucas Contract Drilling Pty Limited McDermott Drilling Pty Limited Australia 100 100
Jaceco Drilling Pty Limited Australia 100 100
Geosearch Drilling Service Pty Limited Australia 100 100
257 Clarence Street Pty Limited Australia 100 100
Lucas SARL
New Caledonia 100 100
Lucas Energy (Holdings) Pty Limited Australia 100 100
Subsidiaries of Lucas Energy (Holdings) Pty Limited Lucas (Arawn) Pty Limited Australia 100 100
Lucas Energy (WA) Pty Limited Australia 100 100
Lucas Power Holdings Pty Limited Australia 100 100
Lucas Cuadrilla Pty Limited Australia 100 100
Lucas Holdings (Bowland) Limited England 100 100
Subsidiaries of Lucas Holdings (Bowland) Limited Lucas Bowland (UK) Limited England 100 100
Lucas Bowland (No. 2) Limited England 100 100
Elswick Power Limited England 100 100
Lucas Holdings (Bolney) Limited England 100 100
Subsidiaries of Lucas Holdings (Bolney) Limited Lucas Bolney Limited England 100 100
For
per
sona
l use
onl
y
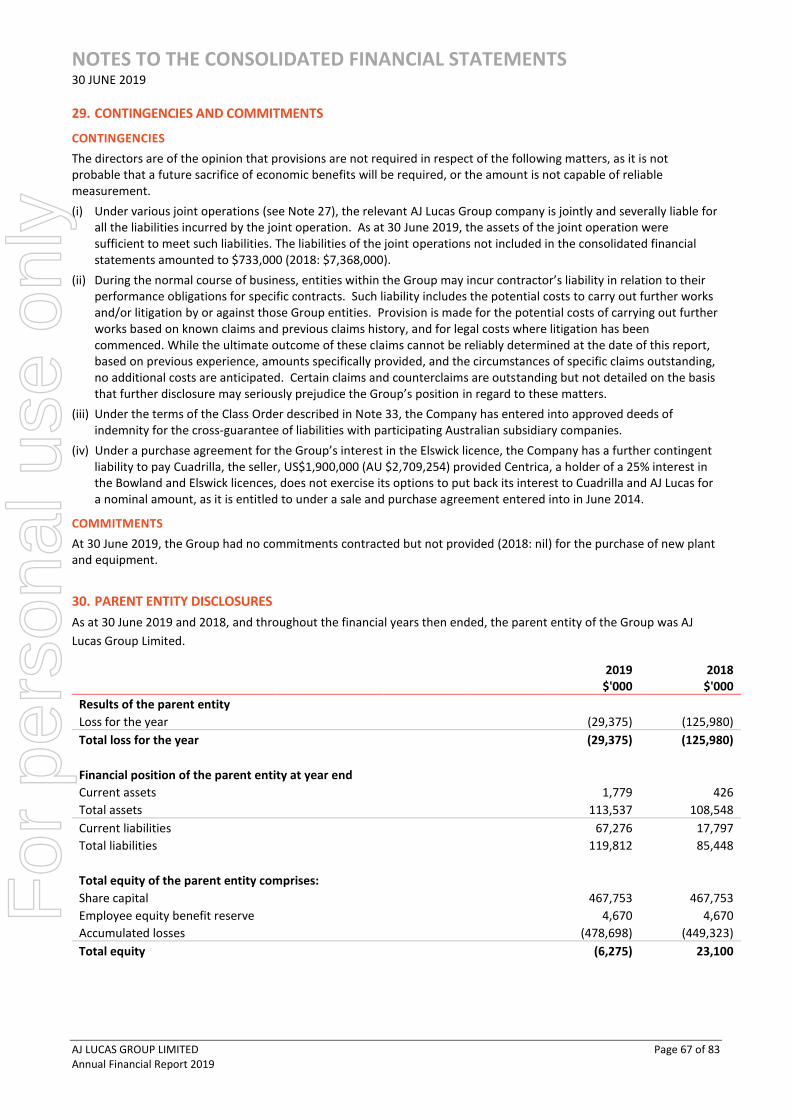
NOTES TO THE CONSOLIDATED FINANCIAL STATEMENTS 30 JUNE 2019
AJ LUCAS GROUP LIMITED Page 67 of 83 Annual Financial Report 2019
29. CONTINGENCIES AND COMMITMENTS
CONTINGENCIES
The directors are of the opinion that provisions are not required in respect of the following matters, as it is not probable that a future sacrifice of economic benefits will be required, or the amount is not capable of reliable measurement.
(i) Under various joint operations (see Note 27), the relevant AJ Lucas Group company is jointly and severally liable for all the liabilities incurred by the joint operation. As at 30 June 2019, the assets of the joint operation were sufficient to meet such liabilities. The liabilities of the joint operations not included in the consolidated financial statements amounted to $733,000 (2018: $7,368,000).
(ii) During the normal course of business, entities within the Group may incur contractor’s liability in relation to their performance obligations for specific contracts. Such liability includes the potential costs to carry out further works and/or litigation by or against those Group entities. Provision is made for the potential costs of carrying out further works based on known claims and previous claims history, and for legal costs where litigation has been commenced. While the ultimate outcome of these claims cannot be reliably determined at the date of this report, based on previous experience, amounts specifically provided, and the circumstances of specific claims outstanding, no additional costs are anticipated. Certain claims and counterclaims are outstanding but not detailed on the basis that further disclosure may seriously prejudice the Group’s position in regard to these matters.
(iii) Under the terms of the Class Order described in Note 33, the Company has entered into approved deeds of indemnity for the cross-guarantee of liabilities with participating Australian subsidiary companies.
(iv) Under a purchase agreement for the Group’s interest in the Elswick licence, the Company has a further contingent liability to pay Cuadrilla, the seller, US$1,900,000 (AU $2,709,254) provided Centrica, a holder of a 25% interest in the Bowland and Elswick licences, does not exercise its options to put back its interest to Cuadrilla and AJ Lucas for a nominal amount, as it is entitled to under a sale and purchase agreement entered into in June 2014.
COMMITMENTS
At 30 June 2019, the Group had no commitments contracted but not provided (2018: nil) for the purchase of new plant and equipment.
30. PARENT ENTITY DISCLOSURES
As at 30 June 2019 and 2018, and throughout the financial years then ended, the parent entity of the Group was AJ
Lucas Group Limited.
2019
$'000 2018
$'000
Results of the parent entity
Loss for the year (29,375) (125,980)
Total loss for the year (29,375) (125,980)
Financial position of the parent entity at year end
Current assets 1,779 426
Total assets 113,537 108,548
Current liabilities 67,276 17,797
Total liabilities 119,812 85,448
Total equity of the parent entity comprises:
Share capital 467,753 467,753
Employee equity benefit reserve 4,670 4,670
Accumulated losses (478,698) (449,323)
Total equity (6,275) 23,100
For
per
sona
l use
onl
y

NOTES TO THE CONSOLIDATED FINANCIAL STATEMENTS 30 JUNE 2019
AJ LUCAS GROUP LIMITED Page 68 of 83 Annual Financial Report 2019
PARENT ENTITY DISCLOSURES (CONT.)
Parent entity commitments and contingencies
The parent entity has guaranteed, to various unrelated parties, the performance of various subsidiaries in relation to various contracts. In the event of default, the parent entity undertakes to meet the contractual obligations of the relevant subsidiary.
PARENT ENTITY GUARANTEES IN RESPECT OF DEBTS OF ITS SUBSIDIARIES
The Company has entered into a Deed of Cross Guarantee, as disclosed in Note 33, with the effect that the Company guarantees debts in respect of its subsidiaries, and the subsidiaries may provide financial assistance to the Company.
31. RECONCILIATION OF CASH FLOWS FROM OPERATING ACTIVITIES
2019
$'000 2018
$'000
(a) Reconciliation of cash For the purposes of the consolidated statement of cash flows, cash includes cash at bank, cash on hand and bank overdrafts.
Cash and cash equivalents 8,376 9,422
Cash in trust 1,779 426
Total cash 10,155 9,848
(b) Reconciliation of cash flows from operating activities Loss for the year (39,390) (16,271)
Adjustments for: Interest on capitalised leases – 2
Interest payable settled through equity raising – 1,436
Amortisation of borrowing costs (included in interest-bearing liabilities) 5,681 4,597
Borrowing costs paid – (902)
Increase in accrued interest 11,174 7,021
Loss on sale of non-current assets 816 159
Loss on foreign currency loans 5,183 2,400
Exchange rate changes on the balance of cash held in foreign currencies (367) (388)
Share of profit of equity accounted investees 4,880 (8,201)
Revenue recognised on farm-in (373) (2,363)
Decommissioning liability on exploration assets – (445)
Depreciation and amortisation 5,385 6,385
Operating loss before changes in working capital and provisions (7,011) (6,570)
Change in receivables 3,605 (4,740)
Change in other current assets 214 369
Change in inventories 36,716 (9,985)
Change in contract assets and liabilities (13,945) –
Change in payables related to operating activities (4,862) 7,334
Change in provisions for employee benefits 126 478
Net cash used in operating activities 14,843 (13,114)
For
per
sona
l use
onl
y
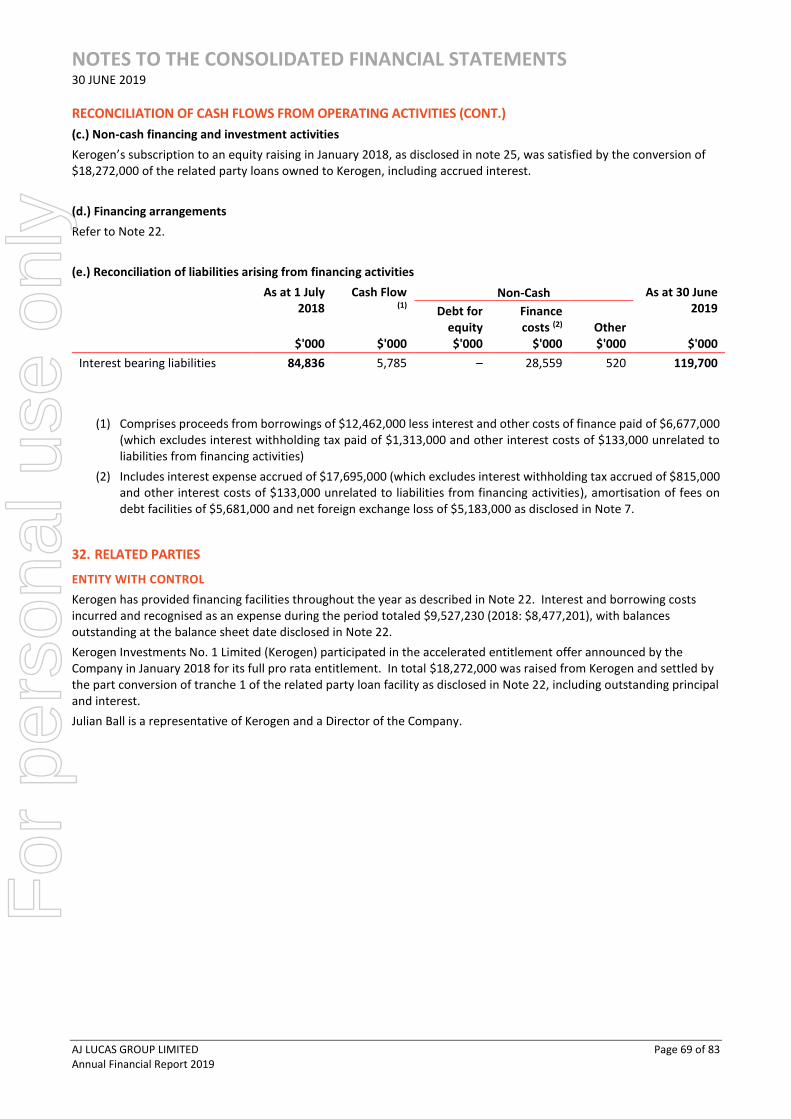
NOTES TO THE CONSOLIDATED FINANCIAL STATEMENTS 30 JUNE 2019
AJ LUCAS GROUP LIMITED Page 69 of 83 Annual Financial Report 2019
RECONCILIATION OF CASH FLOWS FROM OPERATING ACTIVITIES (CONT.)
(c.) Non-cash financing and investment activities
Kerogen’s subscription to an equity raising in January 2018, as disclosed in note 25, was satisfied by the conversion of $18,272,000 of the related party loans owned to Kerogen, including accrued interest.
(d.) Financing arrangements
Refer to Note 22.
(e.) Reconciliation of liabilities arising from financing activities
As at 1 July 2018
Cash Flow (1)
Non-Cash As at 30 June 2019
Debt for
equity Finance costs (2) Other
$'000 $'000 $'000 $'000 $'000 $'000
Interest bearing liabilities 84,836 5,785 – 28,559 520 119,700
(1) Comprises proceeds from borrowings of $12,462,000 less interest and other costs of finance paid of $6,677,000 (which excludes interest withholding tax paid of $1,313,000 and other interest costs of $133,000 unrelated to liabilities from financing activities)
(2) Includes interest expense accrued of $17,695,000 (which excludes interest withholding tax accrued of $815,000 and other interest costs of $133,000 unrelated to liabilities from financing activities), amortisation of fees on debt facilities of $5,681,000 and net foreign exchange loss of $5,183,000 as disclosed in Note 7.
32. RELATED PARTIES
ENTITY WITH CONTROL
Kerogen has provided financing facilities throughout the year as described in Note 22. Interest and borrowing costs incurred and recognised as an expense during the period totaled $9,527,230 (2018: $8,477,201), with balances outstanding at the balance sheet date disclosed in Note 22.
Kerogen Investments No. 1 Limited (Kerogen) participated in the accelerated entitlement offer announced by the Company in January 2018 for its full pro rata entitlement. In total $18,272,000 was raised from Kerogen and settled by the part conversion of tranche 1 of the related party loan facility as disclosed in Note 22, including outstanding principal and interest.
Julian Ball is a representative of Kerogen and a Director of the Company.
For
per
sona
l use
onl
y
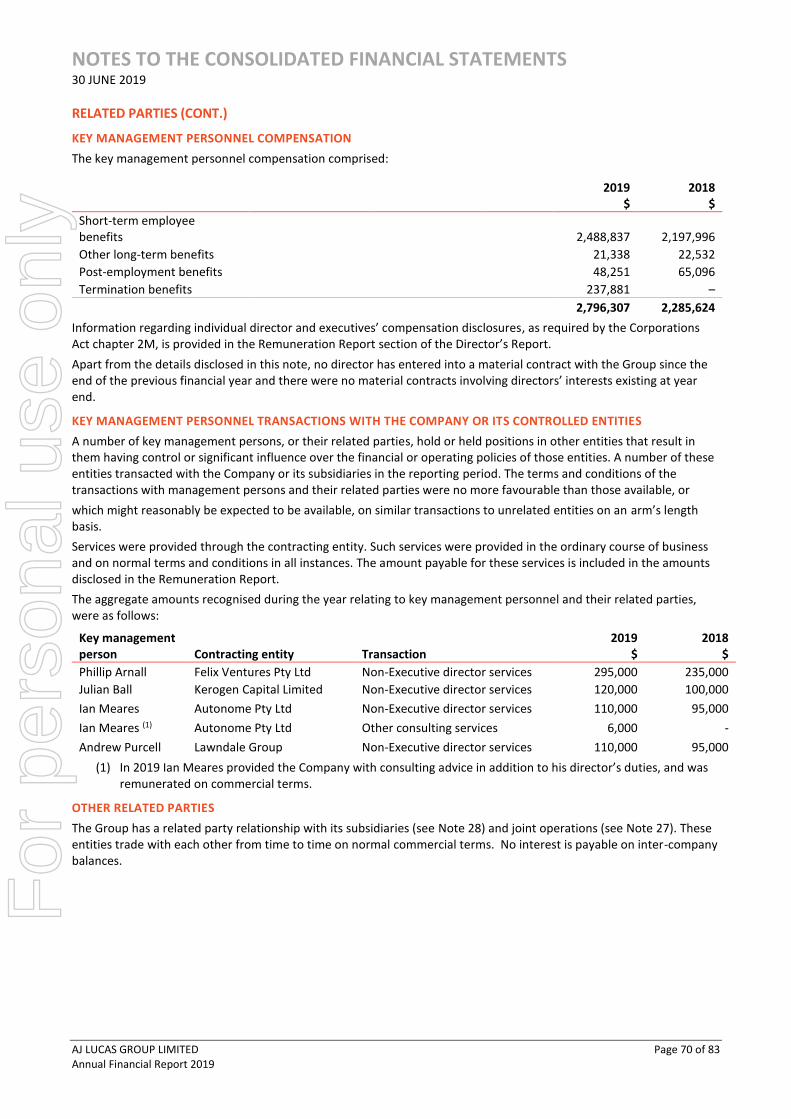
NOTES TO THE CONSOLIDATED FINANCIAL STATEMENTS 30 JUNE 2019
AJ LUCAS GROUP LIMITED Page 70 of 83 Annual Financial Report 2019
RELATED PARTIES (CONT.)
KEY MANAGEMENT PERSONNEL COMPENSATION
The key management personnel compensation comprised:
2019
$ 2018
$
Short-term employee benefits 2,488,837 2,197,996
Other long-term benefits 21,338 22,532
Post-employment benefits 48,251 65,096
Termination benefits 237,881 –
2,796,307 2,285,624
Information regarding individual director and executives’ compensation disclosures, as required by the Corporations Act chapter 2M, is provided in the Remuneration Report section of the Director’s Report.
Apart from the details disclosed in this note, no director has entered into a material contract with the Group since the end of the previous financial year and there were no material contracts involving directors’ interests existing at year end.
KEY MANAGEMENT PERSONNEL TRANSACTIONS WITH THE COMPANY OR ITS CONTROLLED ENTITIES
A number of key management persons, or their related parties, hold or held positions in other entities that result in them having control or significant influence over the financial or operating policies of those entities. A number of these entities transacted with the Company or its subsidiaries in the reporting period. The terms and conditions of the transactions with management persons and their related parties were no more favourable than those available, or
which might reasonably be expected to be available, on similar transactions to unrelated entities on an arm’s length basis.
Services were provided through the contracting entity. Such services were provided in the ordinary course of business and on normal terms and conditions in all instances. The amount payable for these services is included in the amounts disclosed in the Remuneration Report.
The aggregate amounts recognised during the year relating to key management personnel and their related parties, were as follows:
Key management person Contracting entity Transaction
2019 $
2018 $
Phillip Arnall Felix Ventures Pty Ltd Non-Executive director services 295,000 235,000
Julian Ball Kerogen Capital Limited Non-Executive director services 120,000 100,000
Ian Meares Autonome Pty Ltd Non-Executive director services 110,000 95,000
Ian Meares (1) Autonome Pty Ltd Other consulting services 6,000 -
Andrew Purcell Lawndale Group Non-Executive director services 110,000 95,000
(1) In 2019 Ian Meares provided the Company with consulting advice in addition to his director’s duties, and was remunerated on commercial terms.
OTHER RELATED PARTIES
The Group has a related party relationship with its subsidiaries (see Note 28) and joint operations (see Note 27). These entities trade with each other from time to time on normal commercial terms. No interest is payable on inter-company balances.
For
per
sona
l use
onl
y

NOTES TO THE CONSOLIDATED FINANCIAL STATEMENTS 30 JUNE 2019
AJ LUCAS GROUP LIMITED Page 71 of 83 Annual Financial Report 2019
33. DEED OF CROSS GUARANTEE
On 16 June 2008, several of the entities in the Group entered into a Deed of Cross Guarantee. Pursuant to ASIC Corporations (Wholly-owned Companies) Instrument 2016/785, the Group’s wholly owned subsidiaries entering into the Deed are relieved from the Corporations Act 2001 requirements to prepare, have audited and lodge financial reports, and directors’ reports.
The effect of the Deed is that the Company guarantees to each creditor payment in full of any debt in the event of winding up of any of the subsidiaries under certain provisions of the Corporations Act 2001. If a winding up occurs under other provisions of the Act, the Company will only be liable in the event that after six months any creditor has not been paid in full. The subsidiaries have also given similar guarantees in the event that the Company is wound up.
The subsidiaries subject to the Deed are:
Name of entity
AJ Lucas Operations Pty Limited Jaceco Drilling Pty Limited
Lucas Engineering & Construction Pty Limited Geosearch Drilling Service Pty Limited
AJ Lucas Plant & Equipment Pty Limited Lucas Energy Holdings Pty Limited
AJ Lucas Drilling Pty Limited Lucas Energy (WA) Pty Limited
Lucas Shared Services Pty Limited Lucas (Arawn) Pty Limited
AJ Lucas Testing Pty Limited Lucas Power Holdings Pty Limited
Lucas Operations (WA) Pty Limited Mitchell Drilling Corporation Pty Limited
AJ Lucas Joint Ventures Pty Limited McDermott Drilling Pty Limited
Lucas Drilling Pty Limited Lucas Contract Drilling Pty Limited
A consolidated summarised statement of comprehensive income and consolidated statement of financial position, comprising the Company and controlled entities which are a party to the Deed, after eliminating all transactions between parties to the Deed of Cross Guarantee, at 30 June 2019 are set out below:
For
per
sona
l use
onl
y
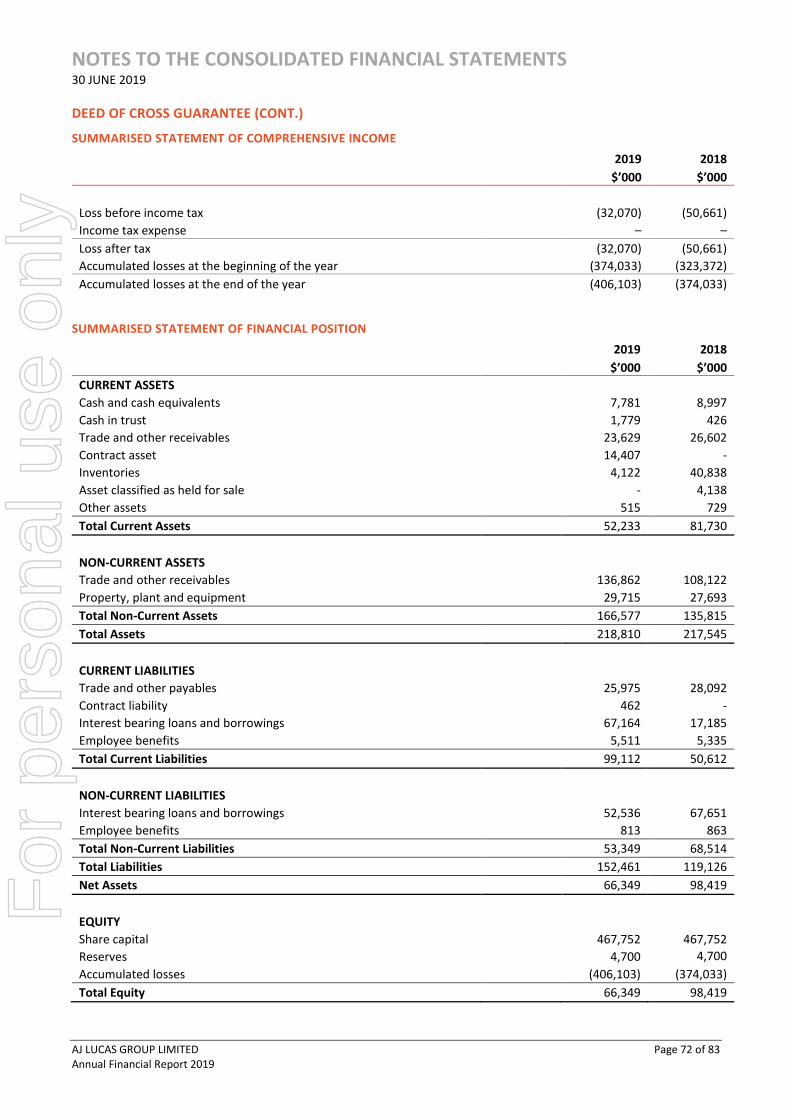
NOTES TO THE CONSOLIDATED FINANCIAL STATEMENTS 30 JUNE 2019
AJ LUCAS GROUP LIMITED Page 72 of 83 Annual Financial Report 2019
DEED OF CROSS GUARANTEE (CONT.)
SUMMARISED STATEMENT OF COMPREHENSIVE INCOME
2019 2018
$’000 $’000
Loss before income tax (32,070) (50,661)
Income tax expense – –
Loss after tax (32,070) (50,661)
Accumulated losses at the beginning of the year (374,033) (323,372)
Accumulated losses at the end of the year (406,103) (374,033)
SUMMARISED STATEMENT OF FINANCIAL POSITION
2019 2018
$’000 $’000
CURRENT ASSETS
Cash and cash equivalents 7,781 8,997
Cash in trust 1,779 426
Trade and other receivables 23,629 26,602
Contract asset 14,407 -
Inventories 4,122 40,838
Asset classified as held for sale - 4,138
Other assets 515 729
Total Current Assets 52,233 81,730
NON-CURRENT ASSETS
Trade and other receivables 136,862 108,122
Property, plant and equipment 29,715 27,693
Total Non-Current Assets 166,577 135,815
Total Assets 218,810 217,545
CURRENT LIABILITIES
Trade and other payables 25,975 28,092
Contract liability 462 -
Interest bearing loans and borrowings 67,164 17,185
Employee benefits 5,511 5,335
Total Current Liabilities 99,112 50,612
NON-CURRENT LIABILITIES
Interest bearing loans and borrowings 52,536 67,651
Employee benefits 813 863
Total Non-Current Liabilities 53,349 68,514
Total Liabilities 152,461 119,126
Net Assets 66,349 98,419
EQUITY
Share capital 467,752 467,752
Reserves 4,700 4,700
Accumulated losses (406,103) (374,033)
Total Equity 66,349 98,419
For
per
sona
l use
onl
y

NOTES TO THE CONSOLIDATED FINANCIAL STATEMENTS 30 JUNE 2019
AJ LUCAS GROUP LIMITED Page 73 of 83 Annual Financial Report 2019
34. EVENTS SUBSEQUENT TO THE BALANCE SHEET DATE
Subsequent to year end the Group announced it had signed a major drilling services contract with Kestrel Coal Pty Ltd for an initial period of 3 years with options to extend for a further 2 years by agreement. The contract extends an existing long-term working relationship with a key customer to whom the Drilling division currently supplies 6 rigs operated and supported by up to 100 staff.
On 20 August 2019 the Group has announced that hydraulic fracturing operations had resumed at PNR with 4 fracture stages having been successfully completed. These were completed as per design with 30 tonnes of sand injected into the Shale in Stage 1 and 50 tonnes of sand in each of stages 2 through 4 without any breach of the 0.5ML level of seismic activity under the TLS. Following this announcement, Cuadrilla successfully fractured the 5th and 6th stage with a further 55 and 37 tonnes of sand being placed respectivley. However, a number of post-pumping (“Trailing”) events greater that the 0.5ML level followed and on 26 August a seismic event of 2.9 ML occurred. This event is under investigation by the Operator and the UK Government regulator and hydraulic fracturing at the site has been placed on hold pending the outcome of those investigations.
Other than as disclosed above, there has not arisen in the interval between the end of the financial year and the date of this report any item, transaction or event of a material or unusual nature likely, in the opinion of the directors of the Company, to affect significantly the operations of the Group, the results of those operations, or the state of affairs of the Group, in future financial years.
For
per
sona
l use
onl
y
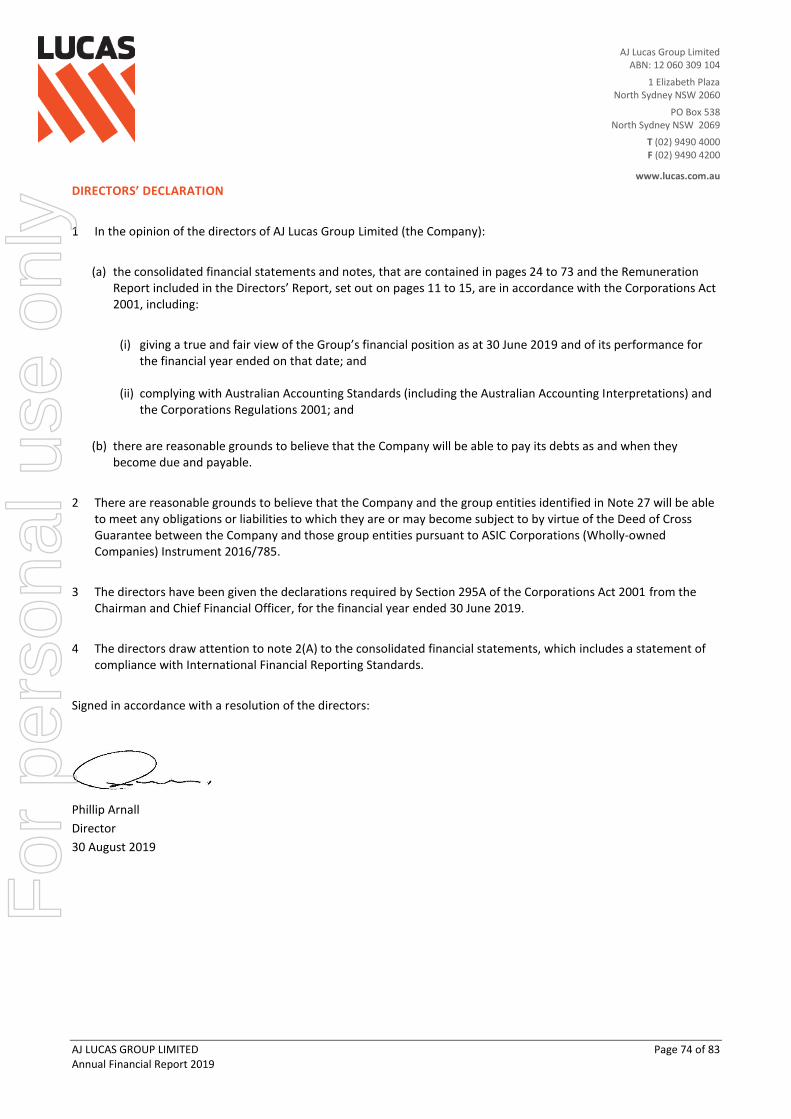
AJ Lucas Group Limited ABN: 12 060 309 104
1 Elizabeth Plaza North Sydney NSW 2060
PO Box 538 North Sydney NSW 2069
T (02) 9490 4000 F (02) 9490 4200
www.lucas.com.au
AJ LUCAS GROUP LIMITED Page 74 of 83 Annual Financial Report 2019
DIRECTORS’ DECLARATION
1 In the opinion of the directors of AJ Lucas Group Limited (the Company):
(a) the consolidated financial statements and notes, that are contained in pages 24 to 73 and the Remuneration Report included in the Directors’ Report, set out on pages 11 to 15, are in accordance with the Corporations Act 2001, including:
(i) giving a true and fair view of the Group’s financial position as at 30 June 2019 and of its performance for the financial year ended on that date; and
(ii) complying with Australian Accounting Standards (including the Australian Accounting Interpretations) and
the Corporations Regulations 2001; and
(b) there are reasonable grounds to believe that the Company will be able to pay its debts as and when they become due and payable.
2 There are reasonable grounds to believe that the Company and the group entities identified in Note 27 will be able to meet any obligations or liabilities to which they are or may become subject to by virtue of the Deed of Cross Guarantee between the Company and those group entities pursuant to ASIC Corporations (Wholly-owned Companies) Instrument 2016/785.
3 The directors have been given the declarations required by Section 295A of the Corporations Act 2001 from the Chairman and Chief Financial Officer, for the financial year ended 30 June 2019.
4 The directors draw attention to note 2(A) to the consolidated financial statements, which includes a statement of compliance with International Financial Reporting Standards.
Signed in accordance with a resolution of the directors:
Phillip Arnall
Director
30 August 2019
For
per
sona
l use
onl
y
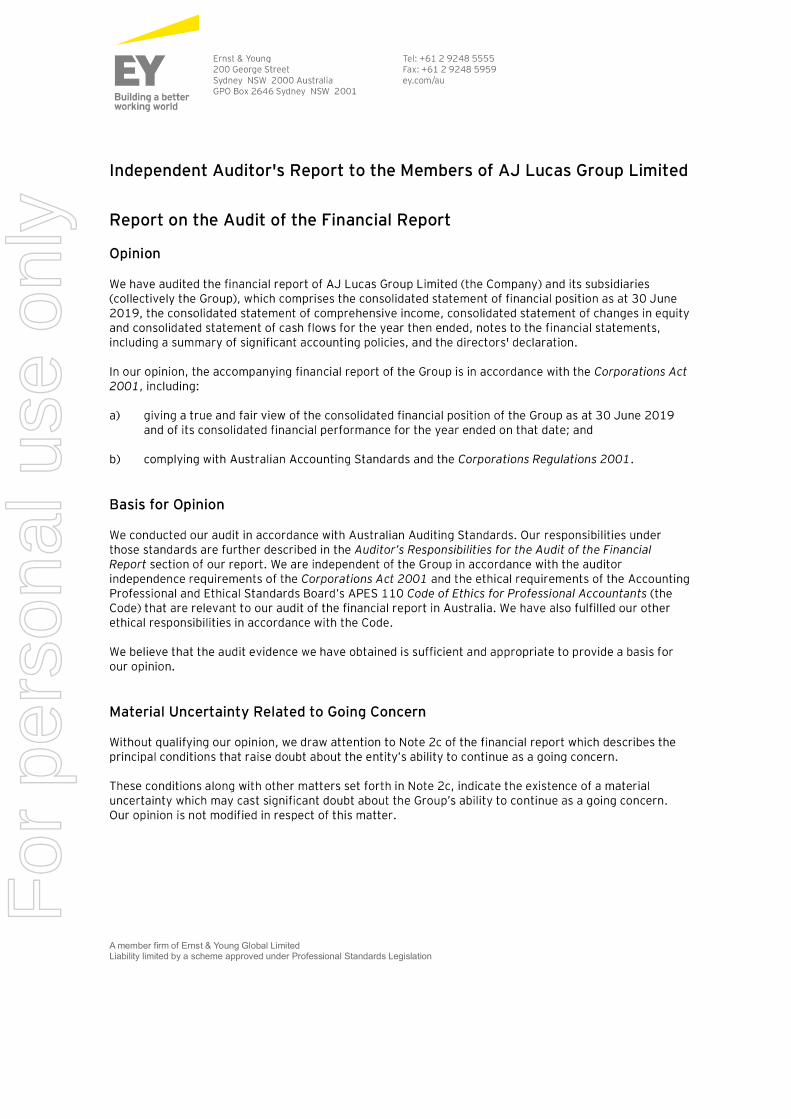
For
per
sona
l use
onl
y

For
per
sona
l use
onl
y
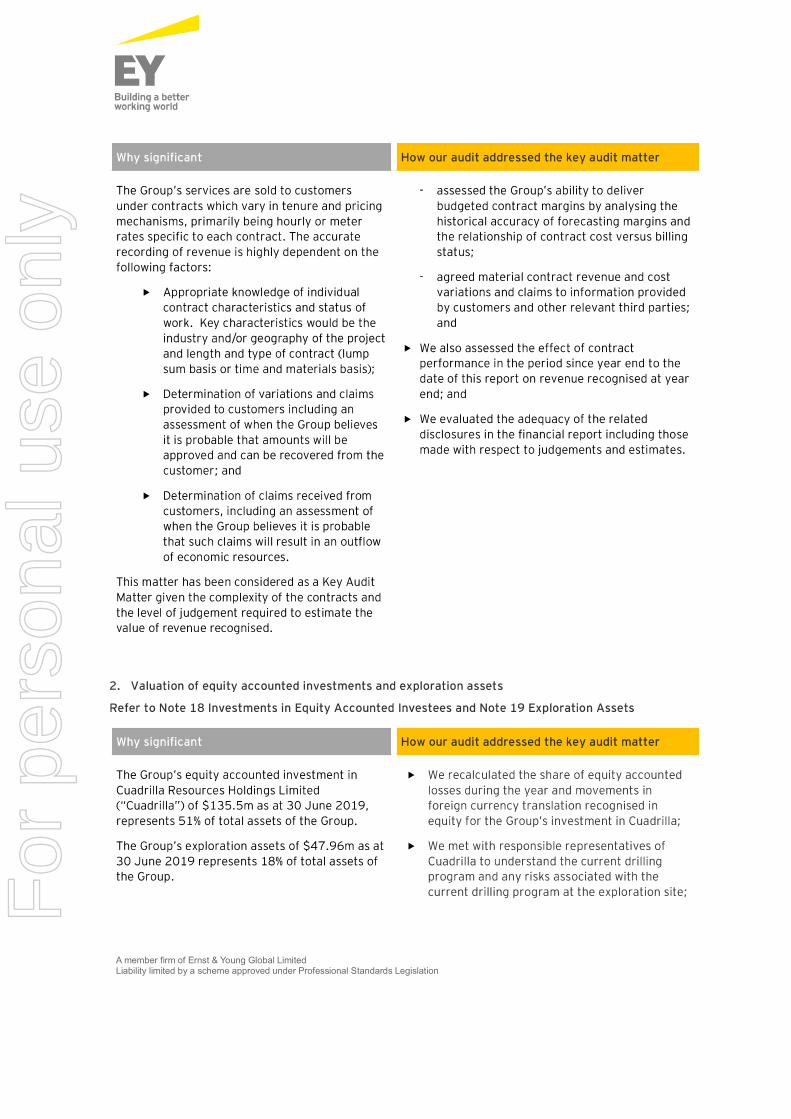
For
per
sona
l use
onl
y
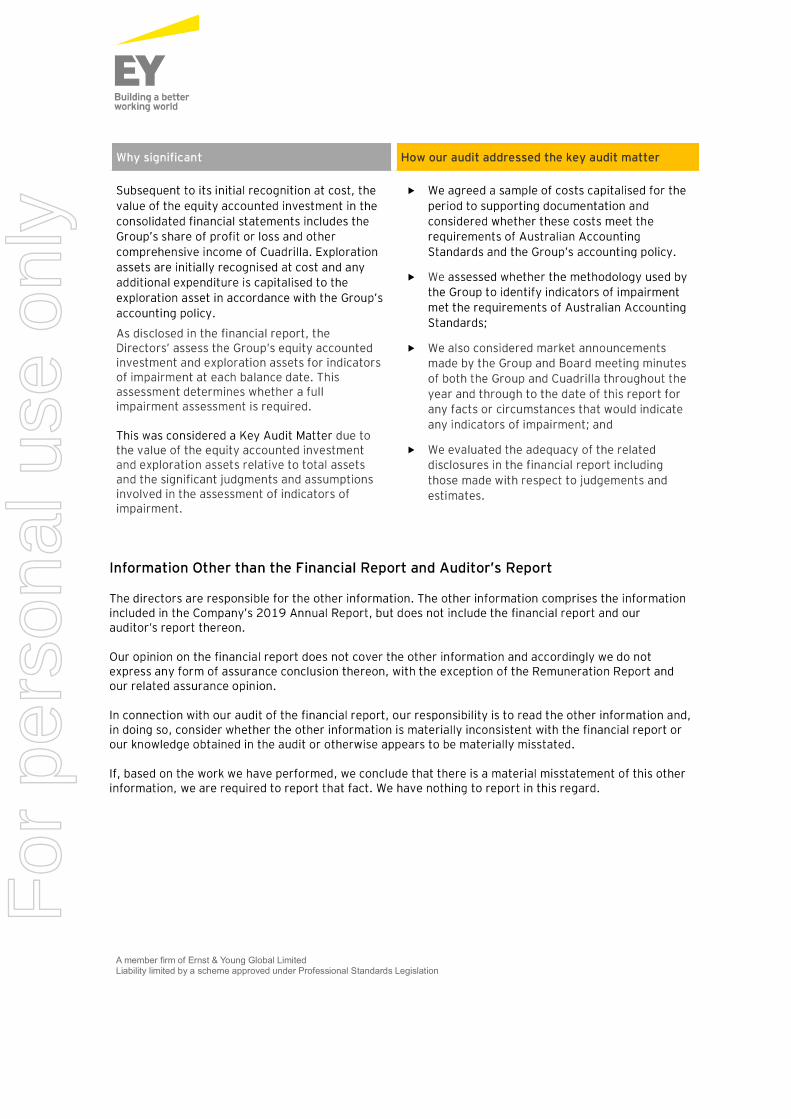
For
per
sona
l use
onl
y

For
per
sona
l use
onl
y
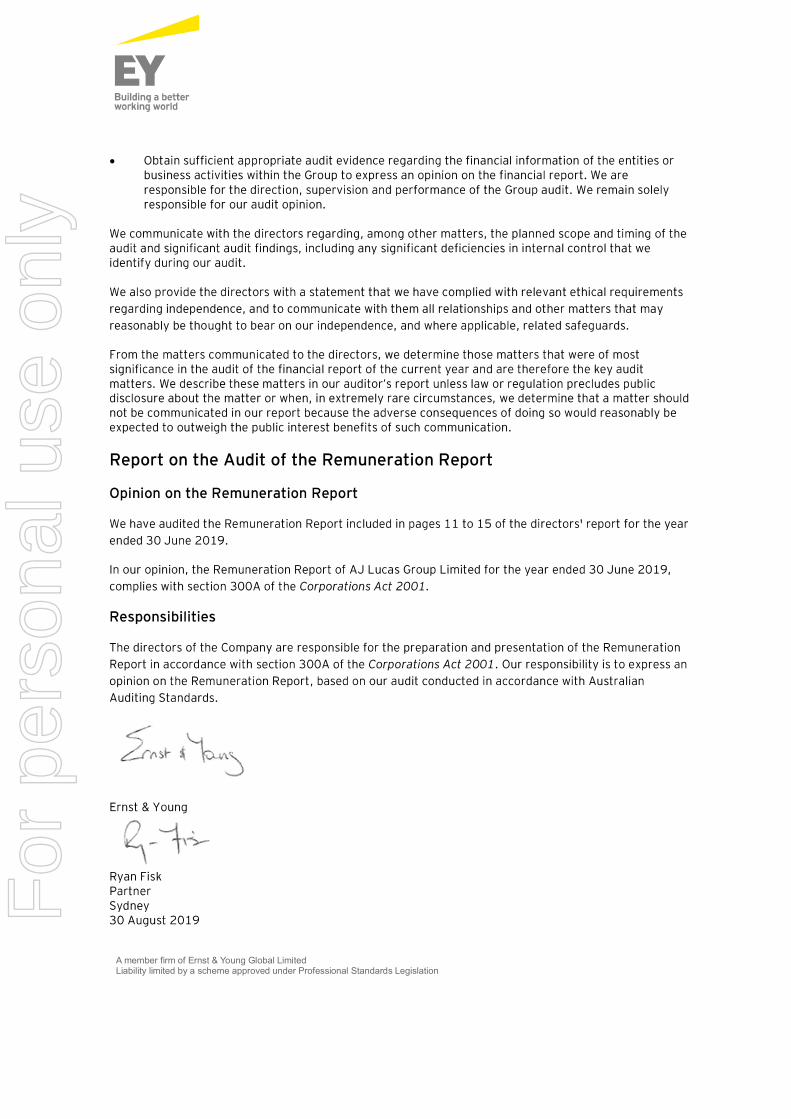
For
per
sona
l use
onl
y

AUSTRALIAN SECURITIES EXCHANGE ADDITIONAL INFORMATION
AJ LUCAS GROUP LIMITED Page 81 of 83 Annual Financial Report 2019
DISTRIBUTION OF ORDINARY SHAREHOLDERS (AS AT 31 JULY 2019)
Securities held
Number of Number of
shareholders shares
1 - 1,000 574 275,041
1,001 - 5,000 690 1,922,915
5,001 - 10,000 283 2,208,911
10,001 - 100,000 595 20,887,223
100,001 and over 195 724,803,140
Total 2,337 750,097,230
1,348 shareholders held less than a marketable parcel of shares at 31 July 2019.
TOP 20 SHAREHOLDERS (AS AT 31 JULY 2019)
Number of ordinary
shares held
% of Issued shares
Name
Kerogen Investments No. 1 (HK) Limited 399,942,649 53.32
CS Third Nominees Pty Limited <HSBC CUST NOM AU LTD 13 A/C> 59,157,448 7.89
Mr Paul Fudge 54,101,840 7.21
RodDCO Property Holdings Limited 40,500,050 5.40
HSBC Custody Nominees (Australia) Limited 23,441,061 3.13
Amalgamated Dairies Limited 21,351,906 2.85
Citicorp Nominees PTY Limited 20,702,364 2.76
HSBC Custody Nominees (Australia) Limited - A/C 2 8,538,766 1.14
National Nominees Limited 7,241,089 0.97
Milson Investments PTY Limited 6,443,789 0.86
Between The Lines Pty Limited 4,904,791 0.65
Toolebuc Investments PTY LTD 4,889,015 0.65
ADEMSA PTY LTD 4,092,536 0.55
J P Morgan Nominees Australia Limited 2,660,280 0.35
Inkese Pty Ltd 2,100,000 0.28
Ingrid Miriam Seton 2,002,222 0.27
Mr Paul Sze Yuen Sheung + Mrs Pauline Kwok Sim CHeung 1,882,733 0.25
Mr Ross Alexander MacPherson 1,801,629 0.24
Mr Robert Alexander Hoad + Ms Jacquelyn Maria Hoad <Sunshine Investments A/C> 1,600,000 0.21
LA & SJ Roach Holdings Pty Ltd 1,600,000 0.21
668,954,168 89.18
For
per
sona
l use
onl
y
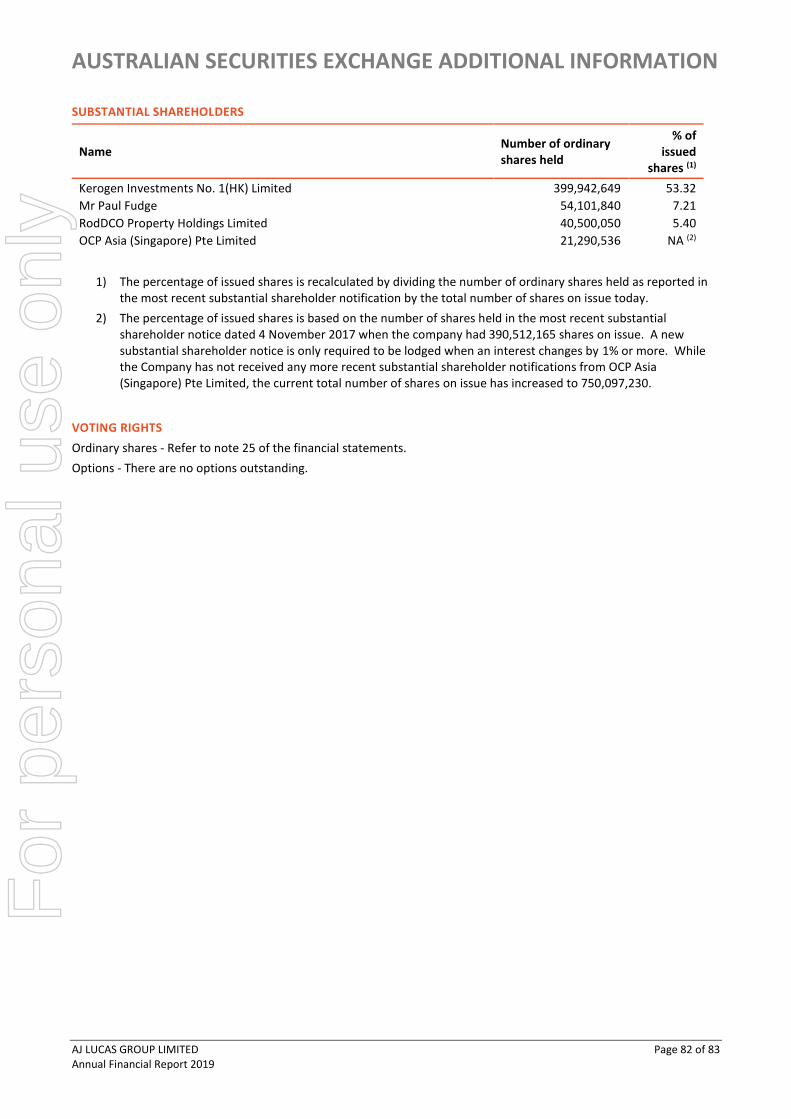
AUSTRALIAN SECURITIES EXCHANGE ADDITIONAL INFORMATION
AJ LUCAS GROUP LIMITED Page 82 of 83 Annual Financial Report 2019
SUBSTANTIAL SHAREHOLDERS
Name Number of ordinary shares held
% of issued
shares (1)
Kerogen Investments No. 1(HK) Limited 399,942,649 53.32
Mr Paul Fudge 54,101,840 7.21
RodDCO Property Holdings Limited 40,500,050 5.40
OCP Asia (Singapore) Pte Limited 21,290,536 NA (2)
1) The percentage of issued shares is recalculated by dividing the number of ordinary shares held as reported in the most recent substantial shareholder notification by the total number of shares on issue today.
2) The percentage of issued shares is based on the number of shares held in the most recent substantial shareholder notice dated 4 November 2017 when the company had 390,512,165 shares on issue. A new substantial shareholder notice is only required to be lodged when an interest changes by 1% or more. While the Company has not received any more recent substantial shareholder notifications from OCP Asia (Singapore) Pte Limited, the current total number of shares on issue has increased to 750,097,230.
VOTING RIGHTS
Ordinary shares - Refer to note 25 of the financial statements.
Options - There are no options outstanding.
For
per
sona
l use
onl
y

DIRECTORY
AJ LUCAS GROUP LIMITED Page 83 of 83 Annual Financial Report 2019
COMPANY SECRETARY
Marcin Swierkowski - BA Com, CA, MBA (exec)
Registered office
1 Elizabeth Plaza
NORTH SYDNEY NSW 2060
Tel +61 2 9490 4000 Fax +61 2 9490 4200
SHARE REGISTRY
Computershare Investor Services Pty Limited Level 5, 115 Grenfell Street ADELAIDE SA 5000 GPO Box 1903 ADELAIDE SA 5001
Enquiries within Australia: 1300 556 161
Enquiries outside Australia: +61 3 9615 5970
Email: [email protected]
Website: www.computershare.com
STOCK EXCHANGE
The Company is listed on the Australian Securities Exchange with the code ‘AJL’. The Home Exchange is Sydney.
AUDITORS
Ernst & Young
200 George Street
SYDNEY NSW 2000
QUALITY CERTIFIERS (AS/NZS ISO 9001:2015)
Compass Assurance Services
AUSTRALIAN BUSINESS NUMBER
12 060 309 104
OTHER INFORMATION
AJ Lucas Group Limited, incorporated and domiciled in Australia, is a publicly listed company limited by shares.
For
per
sona
l use
onl
y


![[lo kaze aj-aj-aj]. Haplology in Modern Hebrew plural marking](https://static.fdocuments.us/doc/165x107/618a1aee2858670919149814/lo-kaze-aj-aj-aj-haplology-in-modern-hebrew-plural-marking.jpg)
