Airflow Dynamics of Human Jets: Sneezing and … Dynamics of Human Jets: Sneezing and Breathing -...
7
Airflow Dynamics of Human Jets: Sneezing and Breathing - Potential Sources of Infectious Aerosols Julian W. Tang 1,2 *, Andre D. Nicolle 3 , Christian A. Klettner 3 , Jovan Pantelic 4 , Liangde Wang 3 , Amin Bin Suhaimi 3 , Ashlynn Y. L. Tan 3 , Garrett W. X. Ong 3 , Ruikun Su 3 , Chandra Sekhar 4 , David D. W. Cheong 4 , Kwok Wai Tham 4 1 Alberta Provincial Laboratory for Public Health, University of Alberta Hospital, Edmonton, Canada, 2 Department of Medical Microbiology and Immunology, University of Alberta, Edmonton, Canada, 3 Department of Laboratory Medicine, National University Hospital, Singapore, Singapore, 4 Department of Building, School of Design and Environment, National University of Singapore, Singapore, Singapore Abstract Natural human exhalation flows such as coughing, sneezing and breathing can be considered as ‘jet-like’ airflows in the sense that they are produced from a single source in a single exhalation effort, with a relatively symmetrical, conical geometry. Although coughing and sneezing have garnered much attention as potential, explosive sources of infectious aerosols, these are relatively rare events during daily life, whereas breathing is necessary for life and is performed continuously. Real-time shadowgraph imaging was used to visualise and capture high-speed images of healthy volunteers sneezing and breathing (through the nose – nasally, and through the mouth - orally). Six volunteers, who were able to respond to the pepper sneeze stimulus, were recruited for the sneezing experiments (2 women: 27.566.36 years; 4 men: 29.25610.53 years). The maximum visible distance over which the sneeze plumes (or puffs) travelled was 0.6 m, the maximum sneeze velocity derived from these measured distances was 4.5 m/s. The maximum 2-dimensional (2-D) area of dissemination of these sneezes was 0.2 m 2 . The corresponding derived parameter, the maximum 2-D area expansion rate of these sneezes was 2 m 2 /s. For nasal breathing, the maximum propagation distance and derived velocity were 0.6 m and 1.4 m/s, respectively. The maximum 2-D area of dissemination and derived expansion rate were 0.11 m 2 and 0.16 m 2 /s, respectively. Similarly, for mouth breathing, the maximum propagation distance and derived velocity were 0.8 m and 1.3 m/ s, respectively. The maximum 2-D area of dissemination and derived expansion rate were 0.18 m 2 and 0.17 m 2 /s, respectively. Surprisingly, a comparison of the maximum exit velocities of sneezing reported here with those obtained from coughing (published previously) demonstrated that they are relatively similar, and not extremely high. This is in contrast with some earlier estimates of sneeze velocities, and some reasons for this difference are discussed. Citation: Tang JW, Nicolle AD, Klettner CA, Pantelic J, Wang L, et al. (2013) Airflow Dynamics of Human Jets: Sneezing and Breathing - Potential Sources of Infectious Aerosols. PLoS ONE 8(4): e59970. doi:10.1371/journal.pone.0059970 Editor: Elankumaran Subbiah, Virginia Polytechnic Institute and State University, United States of America Received October 20, 2012; Accepted February 19, 2013; Published April 1, 2013 Copyright: ß 2013 Tang et al. This is an open-access article distributed under the terms of the Creative Commons Attribution License, which permits unrestricted use, distribution, and reproduction in any medium, provided the original author and source are credited. Funding: This study was funded by the National Medical Research Council (NMRC) of Singapore by a grant awarded to JW Tang (the Principal Investigator) Ref: NMRC/1208/2009. The funders had no role in study design, data collection and analysis, decision to publish, or preparation of the manuscript. Competing Interests: The authors have declared that no competing interests exist. * E-mail: [email protected] Introduction Natural human exhalation flows such as coughing, sneezing and breathing can be considered as ‘jet-like’ airflows in the sense that they are produced from a single source in a single exhalation effort, with a relatively symmetrical, conical geometry. Although coughing and sneezing have garnered much attention as potential, explosive sources of infectious aerosols, these are relatively rare events during daily life, whereas breathing is necessary for life and is performed continuously. In the aftermath of the severe acute respiratory syndrome (SARS) outbreaks, the ongoing concerns about avian A/H5N1 influenza, and the recent 2009 influenza A/ H1N1 pandemic, more attention has been focused on these respiratory activities as potential sources of infectious aerosols [1– 7]. Several previous studies have examined various aspects of the airflow dynamics of coughing with human subjects using particle image velocimetry (PIV) [8–12], or alternative methods [13,14], but all of these techniques require some postural and/or physical constraint on the volunteers, e.g. by making them cough into a box or tube or some other specified space, which would not be the case in everyday coughing activities. Most recently, Tang et al. [15] reported horizontal (i.e. x-component resolved) cough propagation distances and velocities using a real-time, non-invasive shadow- graph method. The reported velocities using this technique were in the same range as those reported in these earlier studies. Sneezing has been much more difficult to investigate, probably because the sneezing reflex is much more difficult to induce on demand for experimental purposes. Two recent studies examined the qualitative effects of sneezing in humans with and without wearing surgical and N95 masks [16,17], without any quantitative measurements of the sneeze airflows being attempted. One earlier, more physiological study on sneezing in premature newborns suggested that the peak expiratory airflow during sneezing was only 6–7 times higher than that during quiet breathing [18]. This ratio suggests that there may be a discrepancy with the much higher estimates of sneeze velocities reported by Wells [19] of up PLOS ONE | www.plosone.org 1 April 2013 | Volume 8 | Issue 4 | e59970
Transcript of Airflow Dynamics of Human Jets: Sneezing and … Dynamics of Human Jets: Sneezing and Breathing -...
Airflow Dynamics of Human Jets: Sneezing andBreathing - Potential Sources of Infectious AerosolsJulian W. Tang1,2*, Andre D. Nicolle3, Christian A. Klettner3, Jovan Pantelic4, Liangde Wang3, Amin
Bin Suhaimi3, Ashlynn Y. L. Tan3, Garrett W. X. Ong3, Ruikun Su3, Chandra Sekhar4, David D. W. Cheong4,
Kwok Wai Tham4
1 Alberta Provincial Laboratory for Public Health, University of Alberta Hospital, Edmonton, Canada, 2 Department of Medical Microbiology and Immunology, University of
Alberta, Edmonton, Canada, 3 Department of Laboratory Medicine, National University Hospital, Singapore, Singapore, 4 Department of Building, School of Design and
Environment, National University of Singapore, Singapore, Singapore
Abstract
Natural human exhalation flows such as coughing, sneezing and breathing can be considered as ‘jet-like’ airflows in thesense that they are produced from a single source in a single exhalation effort, with a relatively symmetrical, conicalgeometry. Although coughing and sneezing have garnered much attention as potential, explosive sources of infectiousaerosols, these are relatively rare events during daily life, whereas breathing is necessary for life and is performedcontinuously. Real-time shadowgraph imaging was used to visualise and capture high-speed images of healthy volunteerssneezing and breathing (through the nose – nasally, and through the mouth - orally). Six volunteers, who were able torespond to the pepper sneeze stimulus, were recruited for the sneezing experiments (2 women: 27.566.36 years; 4 men:29.25610.53 years). The maximum visible distance over which the sneeze plumes (or puffs) travelled was 0.6 m, themaximum sneeze velocity derived from these measured distances was 4.5 m/s. The maximum 2-dimensional (2-D) area ofdissemination of these sneezes was 0.2 m2. The corresponding derived parameter, the maximum 2-D area expansion rate ofthese sneezes was 2 m2/s. For nasal breathing, the maximum propagation distance and derived velocity were 0.6 m and1.4 m/s, respectively. The maximum 2-D area of dissemination and derived expansion rate were 0.11 m2 and 0.16 m2/s,respectively. Similarly, for mouth breathing, the maximum propagation distance and derived velocity were 0.8 m and 1.3 m/s, respectively. The maximum 2-D area of dissemination and derived expansion rate were 0.18 m2 and 0.17 m2/s,respectively. Surprisingly, a comparison of the maximum exit velocities of sneezing reported here with those obtained fromcoughing (published previously) demonstrated that they are relatively similar, and not extremely high. This is in contrastwith some earlier estimates of sneeze velocities, and some reasons for this difference are discussed.
Citation: Tang JW, Nicolle AD, Klettner CA, Pantelic J, Wang L, et al. (2013) Airflow Dynamics of Human Jets: Sneezing and Breathing - Potential Sources ofInfectious Aerosols. PLoS ONE 8(4): e59970. doi:10.1371/journal.pone.0059970
Editor: Elankumaran Subbiah, Virginia Polytechnic Institute and State University, United States of America
Received October 20, 2012; Accepted February 19, 2013; Published April 1, 2013
Copyright: � 2013 Tang et al. This is an open-access article distributed under the terms of the Creative Commons Attribution License, which permitsunrestricted use, distribution, and reproduction in any medium, provided the original author and source are credited.
Funding: This study was funded by the National Medical Research Council (NMRC) of Singapore by a grant awarded to JW Tang (the Principal Investigator) Ref:NMRC/1208/2009. The funders had no role in study design, data collection and analysis, decision to publish, or preparation of the manuscript.
Competing Interests: The authors have declared that no competing interests exist.
* E-mail: [email protected]
Introduction
Natural human exhalation flows such as coughing, sneezing and
breathing can be considered as ‘jet-like’ airflows in the sense that
they are produced from a single source in a single exhalation
effort, with a relatively symmetrical, conical geometry. Although
coughing and sneezing have garnered much attention as potential,
explosive sources of infectious aerosols, these are relatively rare
events during daily life, whereas breathing is necessary for life and
is performed continuously. In the aftermath of the severe acute
respiratory syndrome (SARS) outbreaks, the ongoing concerns
about avian A/H5N1 influenza, and the recent 2009 influenza A/
H1N1 pandemic, more attention has been focused on these
respiratory activities as potential sources of infectious aerosols [1–
7].
Several previous studies have examined various aspects of the
airflow dynamics of coughing with human subjects using particle
image velocimetry (PIV) [8–12], or alternative methods [13,14],
but all of these techniques require some postural and/or physical
constraint on the volunteers, e.g. by making them cough into a box
or tube or some other specified space, which would not be the case
in everyday coughing activities. Most recently, Tang et al. [15]
reported horizontal (i.e. x-component resolved) cough propagation
distances and velocities using a real-time, non-invasive shadow-
graph method. The reported velocities using this technique were
in the same range as those reported in these earlier studies.
Sneezing has been much more difficult to investigate, probably
because the sneezing reflex is much more difficult to induce on
demand for experimental purposes. Two recent studies examined
the qualitative effects of sneezing in humans with and without
wearing surgical and N95 masks [16,17], without any quantitative
measurements of the sneeze airflows being attempted. One earlier,
more physiological study on sneezing in premature newborns
suggested that the peak expiratory airflow during sneezing was
only 6–7 times higher than that during quiet breathing [18]. This
ratio suggests that there may be a discrepancy with the much
higher estimates of sneeze velocities reported by Wells [19] of up
PLOS ONE | www.plosone.org 1 April 2013 | Volume 8 | Issue 4 | e59970

to 100 m/s, and 50 m/s as has been assumed in some modeling
studies [20], though these were described for much older adults.
Breathing generally produces much slower moving exhalation
flows than coughing or sneezing, but because we spend more time
breathing than coughing or sneezing, it is important to examine
and characterize this other human respiratory jet-like exhalation
flow as a, perhaps, even more important potential source of
infectious aerosols. Relatively few studies have focused on
breathing airflow dynamics. Gupta and colleagues performed a
series of experiments to characterise the morphology and flow
dynamics of nasal and mouth breathing [21], and followed this by
computer simulations of how such breath plumes might dissem-
inate and be inhaled in a fully occupied aircraft cabin [22,23].
Tang et al. [17] used a real-time, non-invasive, shadowgraph
method to visualise the airflows produced during nasal and mouth
breathing, talking (counting), coughing, laughing and sneezing
healthy volunteers, though this was only a qualitative visualisation
study without any quantitative assessment being attempted.
The airflow dynamics of coughing were investigated in a
previous study using real-time, non-invasive, shadowgraph visual-
isation [15]. This study applies the same technique to human
sneezing and breathing to determine their airflow dynamic
parameters. This data may be of use to infection control teams,
when planning various interventions to limit the dissemination of
airborne infection from human sources.
Methods
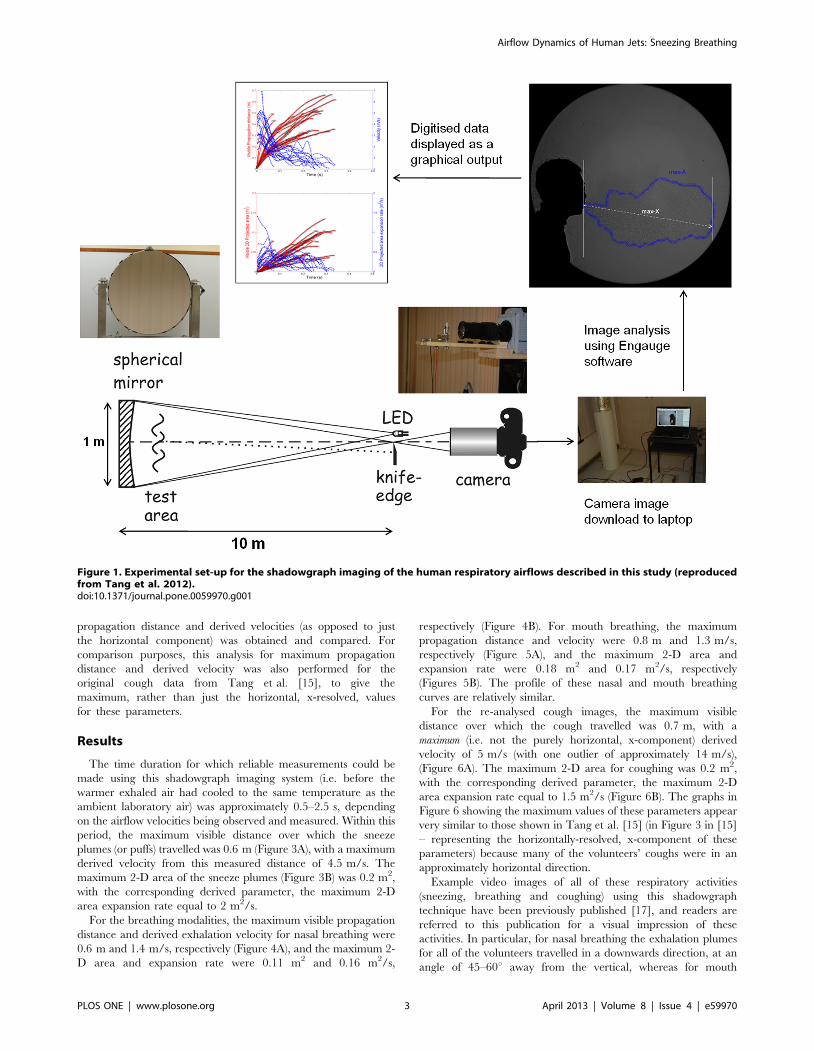
Imaging Set-upThe shadowgraph imaging technique used in this study has
been described and illustrated in detail elsewhere [15,17]. Briefly,
the principle underlying shadowgraph imaging relies on light
passing through air of different temperatures, which have differing
refractive indices. A large, finely ground, 1-m diameter, spherical,
concave, f/5 mirror of astronomical reflector telescope quality
(Cosmo Optics Inc., Middletown, NY) was used to reflect a light
beam produced by an LED light source placed at the mirror’s
centre of curvature (i.e. 10 m from the mirror) through the cooler
air (18uC) of the laboratory and the warmer (30–33uC) exhaled air
produced by healthy volunteers, to produce the real-time
shadowgraph images of their sneezing and breathing airflows for
this study. These volunteers were asked to stand approximately
1 m in front of, and just to one side of the mirror in order to
maximise the extent of their exhaled flows that would be visible in
the mirror (Figure 1).
A high-speed camera (Photron SA1.1, Dynamic Analysis
System, Pte Ltd, Singapore) situated just behind the LED light
source was used to capture these reflected shadowgraph images at
high frame-rates: at 500 frames-per-second (fps) for breathing, and
2000 fps for sneezing. Proprietary, but freely available, software
(Photron Fastcam Viewer, PFV Ver.325: http://www.
techimaging.com/downloads/) was used to control the high-speed
camera remotely from a laptop, which also served to download the
image files (in Tagged Image File Format - TIFF) from the camera
after every experimental imaging run. The maximum size of the
image file recordable by the high-speed camera at any one time
was limited to 32 GB (compressed) size, allowing approximately
40 s of filming at 500 fps and 10 s at 2000 fps.
Human VolunteersEthics statement. All experiments in this study involving
human volunteers were approved by the Domain Specific Review
Board of the National University Hospital/National University
Health System (DSRB ref no. E/09/024), and all participating
volunteers gave both their written and verbal consent.
Twenty healthy volunteers (10 women: mean age 32.2612.9
years, mean height 1.6060.07 m, mean weight 53.2867.23 kg,
mean BMI 21.0463.63; 10 men: mean age 25.362.5 years, mean
height 1.6960.06 m, mean weight 63.367.00 kg, mean BMI
22.1761.92) were recruited. These were the same volunteers who
performed the coughing experiments as described in Tang et al.
[15]. The volunteers were asked to breathe through their nose
then through their mouth in front of the mirror. Three cycles of
nasal (15–20 seconds) then 3 cycles of mouth breathing (15–20
seconds), were recorded.
For sneezing, none of these initial 20 volunteers were able to
sneeze with the approved pepper stimulus. Therefore, another
group of 6 volunteers (2 women: mean age 27.566.36 years, mean
height 1.5860.04 m, mean weight 47.566.36 kg, mean BMI
19.1061.71; 4 men: mean age 29.25610.53 years, mean height
1.7960.06 m, mean weight 76.5612.18 kg, mean BMI
23.9663.33) were recruited based on their ability to sneeze in
response to the approved pepper stimulus. In addition, several
bouts of sneezing from each volunteer were also recorded, until
they became tolerant to the pepper stimulus.
Apart from their positioning in front of the mirror, no other
constraint was imposed on their body posture or head position.
Image AnalysisTo analyze these images, the digitizing of each volunteer’s
breathing or sneezing airflow images was performed by two
independent observers, using large (17–19’’), flat-screen LCD
monitors, at up to 200% magnification, with the observers
stepping backwards and forwards between each frame to ensure
the continuity of the airflow images, to digitize its airflow
boundaries as accurately as possible. By digitising the expanding
visible boundary of the exhalation flows generated by sneezing and
breathing, frame-by-frame, it was possible to obtain estimates of
the evolving propagation distance and area of these airflows over
time. From these measurements, additional kinematic parameters,
such as the propagation velocity and the two-dimensional (2-D)
area expansion rate, were derived.
A software tool, Engauge Digitizer (freely available from:
http://sourceforge.net/projects/digitizer/) was used to convert
the visible boundaries of the exhaled airflows to x-y coordinates
when manually selected (e.g. by using a computer mouse). An
example of the digitising process applied to these images is shown
in Figure 2. As these derived velocities were very sensitive to small
variations arising from the slight differences in airflow boundary
positions as perceived by the different observers, using the raw
distance data was thought to be unrepresentative of the true nature
of the airflow. To compensate for this, a smoothing algorithm
based on weighted moving averages of the distance data was
applied to obtain more representative velocity estimates as derived
from this raw digitized distance data.
The sneezing or breathing x-y coordinate data was analysed,
where the maximum distance (max-X) and 2-D area (max-A) in
each frame area of the cough plume was calculated and plotted
using custom-written algorithms in C++ and Matlab codes (Matlab
v.6.5, MathWorks, Natick, MA http://www.mathworks.com/
products/matlab/index.html).
Note that in this analysis, the algorithm to calculate the
propagation distance and derived velocities from these images
differs slightly from that used to calculate the horizontal (i.e. the
x-direction resolved component) propagation distance and
derived velocities reported in Tang et al. [15]. In this present
analysis of the sneezing and breathing, the maximum total
Airflow Dynamics of Human Jets: Sneezing Breathing
PLOS ONE | www.plosone.org 2 April 2013 | Volume 8 | Issue 4 | e59970
propagation distance and derived velocities (as opposed to just
the horizontal component) was obtained and compared. For
comparison purposes, this analysis for maximum propagation
distance and derived velocity was also performed for the
original cough data from Tang et al. [15], to give the
maximum, rather than just the horizontal, x-resolved, values
for these parameters.
Results
The time duration for which reliable measurements could be
made using this shadowgraph imaging system (i.e. before the
warmer exhaled air had cooled to the same temperature as the
ambient laboratory air) was approximately 0.5–2.5 s, depending
on the airflow velocities being observed and measured. Within this
period, the maximum visible distance over which the sneeze
plumes (or puffs) travelled was 0.6 m (Figure 3A), with a maximum
derived velocity from this measured distance of 4.5 m/s. The
maximum 2-D area of the sneeze plumes (Figure 3B) was 0.2 m2,
with the corresponding derived parameter, the maximum 2-D
area expansion rate equal to 2 m2/s.
For the breathing modalities, the maximum visible propagation
distance and derived exhalation velocity for nasal breathing were
0.6 m and 1.4 m/s, respectively (Figure 4A), and the maximum 2-
D area and expansion rate were 0.11 m2 and 0.16 m2/s,
respectively (Figure 4B). For mouth breathing, the maximum
propagation distance and velocity were 0.8 m and 1.3 m/s,
respectively (Figure 5A), and the maximum 2-D area and
expansion rate were 0.18 m2 and 0.17 m2/s, respectively
(Figures 5B). The profile of these nasal and mouth breathing
curves are relatively similar.
For the re-analysed cough images, the maximum visible
distance over which the cough travelled was 0.7 m, with a
maximum (i.e. not the purely horizontal, x-component) derived
velocity of 5 m/s (with one outlier of approximately 14 m/s),
(Figure 6A). The maximum 2-D area for coughing was 0.2 m2,
with the corresponding derived parameter, the maximum 2-D
area expansion rate equal to 1.5 m2/s (Figure 6B). The graphs in
Figure 6 showing the maximum values of these parameters appear
very similar to those shown in Tang et al. [15] (in Figure 3 in [15]
– representing the horizontally-resolved, x-component of these
parameters) because many of the volunteers’ coughs were in an
approximately horizontal direction.
Example video images of all of these respiratory activities
(sneezing, breathing and coughing) using this shadowgraph
technique have been previously published [17], and readers are
referred to this publication for a visual impression of these
activities. In particular, for nasal breathing the exhalation plumes
for all of the volunteers travelled in a downwards direction, at an
angle of 45–60u away from the vertical, whereas for mouth
Figure 1. Experimental set-up for the shadowgraph imaging of the human respiratory airflows described in this study (reproducedfrom Tang et al. 2012).doi:10.1371/journal.pone.0059970.g001
Airflow Dynamics of Human Jets: Sneezing Breathing
PLOS ONE | www.plosone.org 3 April 2013 | Volume 8 | Issue 4 | e59970

breathing, the exhalation plumes were mainly directed horizon-
tally. From these example video images, surprisingly, neither the
nasal nor mouth breathing plumes appeared to be affected by any
thermal plume or buoyancy effects within their visible trajectory –
indeed, their flows appeared to be driven almost entirely by the
exhalation flows from the nose or mouth, with very undisturbed,
unidirectional paths.
Figure 2. Illustration of the parameters digitised frame-by-frame from the high-speed airflow images captured from eachvolunteer: the maximum visible propagation distance (max-X) and the maximum visible 2-dimensional (2-D) area (max-A).doi:10.1371/journal.pone.0059970.g002
Figure 3. Sneezing airflow parameters. A: Measured visible propagation distances and derived velocities; B: Measured 2-dimensional (2D) areasand derived expansion rates.doi:10.1371/journal.pone.0059970.g003
Airflow Dynamics of Human Jets: Sneezing Breathing
PLOS ONE | www.plosone.org 4 April 2013 | Volume 8 | Issue 4 | e59970

Discussion
Perhaps the most striking findings from this study are firstly, that
the maximum cough and sneeze velocities are very similar, and
secondly, that they are not extremely high - at least in this cohort
of human volunteers. As previously discussed in Tang et al. [15],
the range of cough velocities reported here are within the range of
1.5–28.8 m/s, as reported elsewhere by several other teams using
different techniques [2,9,10,12].
Whilst there are multiple published studies on coughing, there
are relatively few estimates of sneeze velocities reported in the
literature. Exactly why there is so little comparative data available
for sneezing is unclear, though it may be due to the difficulty with
inducing the sneeze, which, unlike coughing, is a true reflex [24].
Notably, the few existing estimates are considerably higher than
those found in this study. For example, Xie et al. [20] cited a
velocity of up to 100 m/s based on earlier estimates by Wells [19],
then go on to use estimates of 20–50 m/s for sneeze velocities in a
simple physical model of how droplets evaporate and move during
various respiratory activities. However, a closer look at Wells’ [19]
original estimate reveals that this 100 m/s figure is actually an
inference based on ‘‘Castleman’s adaptation of Rayleigh’s
formulation for droplet formation’’, which infers that the velocity
required for a moving air stream ‘‘sweeping over a liquid surface’’
to generate droplets of 10 mm diameter is 100 m/s. So this oft-
cited figure was only an inference drawn from some basic physical
principles applied to a very simplified setting, but not obtained
from any direct measurements of airflows generated by actual
human sneezes in a much more complex biological environment.
It is clear that more data is still needed as the range of velocities
cited for sneezing still varies widely, even in this modern era. It
should be borne in mind that such values may vary with different
measurement methods, as well as the physical attributes, lung
capacities and any constrained postures imposed on the human
volunteers.
In addition, reported sneeze velocities may vary depending on
whether the velocities of the airflows themselves, or droplets that
are expelled with them, are measured as an indicator of that
sneeze velocity. Early experiments by Jennison and colleagues
using strobe lighting and high-speed photography [25,26] reported
Figure 4. Nasal breathing airflow parameters. A: Measured visible propagation distances and derived velocities; B: Measured 2-dimensional(2D) areas and derived expansion rates.doi:10.1371/journal.pone.0059970.g004
Figure 5. Mouth breathing airflow parameters. A: Measured visible propagation distances and derived velocities; B: Measured 2-dimensional(2D) areas and derived expansion rates.doi:10.1371/journal.pone.0059970.g005
Airflow Dynamics of Human Jets: Sneezing Breathing
PLOS ONE | www.plosone.org 5 April 2013 | Volume 8 | Issue 4 | e59970

sneeze velocities as high as 46 m/s, as measured by the speed with
which droplets were expelled by the sneeze. Yet, Jennison [26]
acknowledged this distinction by stating: ‘‘Depending upon their
size and momentum, droplets may move faster, slower, or at the
same speed as the air stream in which they are carried.’’
Therefore, it may well be this distinction that has led to such
wide variability in the reported sneeze velocities. Using the speed
of the expelled droplets as a measure of the sneeze velocity then
begs the natural follow-up question of which droplet size should
then be used as a measure of sneeze velocity? Wells’ [19] inferred
estimate of 100 m/s for the sneeze velocity seems to assume that
this droplet size is 10 mm in diameter. Again, more experimental
studies (as opposed to theoretical inferences) are clearly needed,
particularly into the distribution of droplet sizes and their velocities
as produced by human sneezes, to answer these questions more
accurately.
With this shadowgraph method, the fact that the maximum
cough velocities obtained using this approach are comparable with
other published experimental methods, does indicate that the same
approach used for the measurement of sneeze velocities should
also produce fairly accurate estimates of the true values. The
greater apparent variation and difference in overall curve profiles
in the propagation distances and derived velocities with the
sneezes, as compared to the coughs (compare Figures 3 and 6), is
most likely due to the fewer images that were available for analysis
as there were fewer volunteers in the sneeze cohort. It is
acknowledged that higher sneeze velocities may well be possible
with other volunteers, and that further studies are encouraged to
explore and better characterize this variable.
Note that for most of the volunteers, the maximum sneeze
velocities are generally not reached until some short time after the
airflow leaves the mouth (see Figure 3). This probably represents
the acceleration of the expelled air in the early expiration phase of
the sneeze, after the initial inspiration stage of the sneeze reflex,
which is well recognized [24]. This initial inspiration stage was also
recognized much earlier by Jennison [26], as he stated: ‘‘A sneeze
consists of two stages – a sudden inspiration, followed by a forcible
expiration.’’ In addition, the changing shape of the mouth and
position of the tongue may well affect the exit velocity of the air
during the sneeze. A similar explanation to this was suggested by
Tang et al. [15] for very similar appearances of the cough
distance-velocity curves in that study. The shape of these curves
remains similar, as seen in Figure 6, which shows the same cough
dataset re-analyzed to give the maximum (not just the x-resolved)
cough velocities. The results in Figures 3 and 6 demonstrate that
the maximum exit velocities of 4–5 m/s for coughing and
sneezing, at least in this cohort of healthy young volunteers, were
not very different, and far less than idealized 100 m/s inferred
velocity for sneezing by Wells [19].
For the nasal and mouth breathing, relatively little data has
been published so the results from this study will contribute to this.
The exhalation airflow profiles for both nasal and mouth
breathing are quite similar, being mainly conical and differing
only in their relative direction, with similar propagation distances
and airflow velocities. The variations in the airflow velocities of the
nasal and mouth breathing exhalation flows can be related to the
variation of airflow rates during expiration, which are due to a
combination of lung tissue and diaphragmatic elasticity and recoil
and elasticity that have been well-documented [27]. A study on the
airflow dynamics of breathing by Gupta et al. [21] in human
volunteers was performed on smokers, which may not be
necessarily representative of healthy volunteers. Unfortunately,
they used units of airflow rate (litres per second) which are difficult
to convert to comparable airflow velocities (in m/s). Finally, the
ratios of the velocities of the sneeze to those of the nasal and mouth
breathing in this cohort of healthy, young volunteers is 3–4, which
is not so dissimilar to that described by Javorka et al. [18] in
premature newborns with a ratio of 6–7, and also suggests that this
sneezing:breathing ratio may well be decreased in older, larger
adult bodies.
This shadowgraph technique has some limitations in that the
maximum propagation distances can only be observed whilst there
remains a temperature difference between the exhaled and
ambient laboratory air. This may result in some underestimation
of the maximum dissemination distances for some of these human
respiratory activities. However, a minimum ‘observable’ dissem-
ination distance has been given here, which is still of use to
infection control teams. The maximum exit velocities for sneezing,
breathing and coughing all occur within a time-frame for which
the airflows are clearly visible, so these real-time velocity estimates
should be relatively accurate. Ideally, these human voluntary ‘jet-
like’ airflows, as imaged by this shadowgraph technique, should be
compared to more controlled, idealized jet airflows to better
understand and characterize this experimental method for
Figure 6. Reanalysed coughing airflow parameters for comparison. A: Measured visible propagation distances and derived velocities; B:Measured 2-dimensional (2D) areas and derived expansion rates.doi:10.1371/journal.pone.0059970.g006
Airflow Dynamics of Human Jets: Sneezing Breathing
PLOS ONE | www.plosone.org 6 April 2013 | Volume 8 | Issue 4 | e59970

visualizing such phenomena. However, within the more practical
context of everyday, clinical patient infection control situations,
these measurements from these human volunteers should still be
useful.
In summary, this study adds new data using a new, non-
invasive, visualization approach to the airflow dynamics of
sneezing and breathing in healthy human volunteers. It also
makes a direct comparison between maximum cough and sneeze
velocities using this shadowgraph method, which, surprisingly,
shows them to be firstly, quite similar in speed, and secondly, that
this speed is not extremely high, as has been inferred in some older
estimates of sneeze velocity.
Acknowledgments
The authors would like to thank Professor Gary S Settles (Gas Dynamics
Laboratory, Department of Mechanical and Nuclear Engineering,
Pennsylvania State University, USA) for his advice in helping us set up
this schlieren/shadowgraph imaging system.
Author Contributions
Designed the analytical software algorithms and the final graphical
illustrations: ADG CAK. Conceived and designed the experiments: JWT
ADN CAK. Performed the experiments: JWT JP LW ABS AYLT GO RS.
Analyzed the data: JWT ADN CAK. Contributed reagents/materials/
analysis tools: JWT JP CS DKWC KWT. Wrote the paper: JWT ADN
CAK.
References
1. Somogyi R, Vesely AE, Azami T, Preiss D, Fisher J, et al. (2004) Dispersal of
respiratory droplets with open vs closed oxygen delivery masks: implications for
the transmission of severe acute respiratory syndrome. Chest 125: 1155–1157.
2. Tang JW, Settles GS (2008) Images in clinical medicine. Coughing and aerosols.
N Engl J Med 359: e19.
3. Tang JW, Settles G (2009). Images in clinical medicine. Coughing and masks.
N Engl J Med 361: e62.
4. Loeb M, McGeer A, Henry B, Ofner M, Rose D, et al. (2004) SARS among
critical care nurses, Toronto. Emerg Infect Dis 10: 251–255.
5. Hui DS, Ip M, Tang JW, Wong AL, Chan MT, et al. (2006) Airflows around
oxygen masks: A potential source of infection? Chest 130: 822–826.
6. Hui DS, Hall SD, Chan MT, Chow BK, Ng SS, et al. (2007) Exhaled air
dispersion during oxygen delivery via a simple oxygen mask. Chest 132: 540–
546.
7. Ip M, Tang JW, Hui DS, Wong AL, Chan MT, et al. (2007) Airflow and droplet
spreading around oxygen masks: a simulation model for infection control
research. Am J Infect Control 35: 684–689.
8. Mahajan RP, Singh P, Murty GE, Aitkenhead AR (1994) Relationship between
expired lung volume, peak flow rate and peak velocity time during a voluntary
cough manoeuvre. Br J Anaesth 72: 298–301.
9. Zhu S, Kato S, Yang J (2006) Study on transport characteristics of saliva droplets
produced by coughing in a calm indoor environment. Build Environ 41: 1691–
1702.
10. Chao CYH, Wan MP, Morawska L, Johnson GR, Ristovski ZD, et al. (2009)
Characterization of expiration air jets and droplet size distributions immediately
at the mouth opening. Aerosol Sci 40: 122–133.
11. Xie X, Li Y, Sun H, Liu L (2009) Exhaled droplets due to talking and coughing.
J R Soc Interface (Suppl 6): S703–714.
12. VanSciver M, Miller S, Hertzberg J (2011) Particle Image Velocimetry of
Human Cough. Aerosol Sci Tech 45: 415–422.
13. Inouye S, Matsudaira Y, Sugihara Y (2006) Masks for influenza patients:
measurement of airflow from the mouth. Jpn J Infect Dis 59: 179–181.
14. Gupta JK, Lin CH, Chen Q (2009) Flow dynamics and characterization of a
cough. Indoor Air 19: 517–525.
15. Tang JW, Nicolle A, Pantelic J, Koh GC, Wang LD, et al. (2012) Airflowdynamics of coughing in healthy human volunteers by shadowgraph imaging: an
aid to aerosol infection control. PLoS One 7: e34818.16. Granville-Chapman J, Dunne RL (2007) Excuse me! BMJ 335: 1293.
17. Tang JW, Nicolle AD, Pantelic J, Jiang M, Sekhr C, et al. (2011) Qualitativereal-time schlieren and shadowgraph imaging of human exhaled airflows: an aid
to aerosol infection control. PLoS One 6: e21392.
18. Javorka K, Tomori Z, Zavarska L (1982) Mechanics of breathing duringsneezing and crying in premature newborns. Eur J Respir Dis 63: 442–448.
19. Wells WF (1955) Airborne Contagion and Air Hygiene: an Ecological Study ofDroplet Infection. Cambridge, MA: Harvard University Press. 423 p.
20. Xie X, Li Y, Chwang AT, Ho PL, Seto WH (2007) How far droplets can move
in indoor environments–revisiting the Wells evaporation-falling curve. IndoorAir 17: 211–225.
21. Gupta JK, Lin CH, Chen Q (2010) Characterizing exhaled airflow frombreathing and talking. Indoor Air 20: 31–39.
22. Gupta JK, Lin CH, Chen Q (2011) Transport of expiratory droplets in anaircraft cabin. Indoor Air 21: 3–11.
23. Gupta JK, Lin CH, Chen Q (2011) Inhalation of expiratory droplets in aircraft
cabins. Indoor Air 21: 341–50.24. Songu M, Cingi C (2009) Sneeze reflex: facts and fiction. Ther Adv Respir Dis 3:
131–141.25. Jennison MW, Edgerton HE (1940) Droplet infection of air; high-speed
photography of droplet production by sneezing. Proc Roy Soc Exp Biol & Med
43: 455–458.26. Jennison MW (1942) Atomising of mouth and nose secretions into the air as
revealed by high-speed photography. In: Aerobiology. Washington: AmericanAssociation for the Advancement of Science. 17: 106–128.
27. Veiga J, Lopes AJ, Jansen JM, de Melo PL (2009) Within-Breath analysis ofrespiratory mechanics in asthmatic patients by forced oscillation. Clinics 64:
649–656.
Airflow Dynamics of Human Jets: Sneezing Breathing
PLOS ONE | www.plosone.org 7 April 2013 | Volume 8 | Issue 4 | e59970