Aircraft Ground De/Anti-icing Fluid Holdover Time ... · Aircraft Ground De/Anti-icing Fluid...
278
TP 13826E Aircraft Ground De/Anti-icing Fluid Holdover Time Development Program for the 2000-01 Winter Prepared for Transportation Development Centre On behalf of Civil Aviation Transport Canada and The Federal Aviation Administration William J. Hughes Technical Center December 2001 Final Version 1.0
Transcript of Aircraft Ground De/Anti-icing Fluid Holdover Time ... · Aircraft Ground De/Anti-icing Fluid...
TP 13826E
Aircraft Ground De/Anti-icing Fluid Holdover Time
Development Program for the 2000-01 Winter
Prepared for
Transportation Development Centre On behalf of Civil Aviation
Transport Canada
and
The Federal Aviation Administration William J. Hughes Technical Center
December 2001
Final Version 1.0


TP 13826E
Aircraft Ground De/Anti-icing Fluid Holdover Time Development Program for the 2000-01 Winter
by
Michael Chaput
and
Richard Campbell
December 2001
Final Version 1.0
PREFACE
X:\@APS ARCHIVE\CM1680 (exBM3833) TC-Deicing 00-01 (REPORTS ONLY)\Reports\HOT\Final Version 1.0\Final Version 1.0.doc Final Version 1.0
August 05 APS AVIATION INC.
iii
PREFACE Under contract to the Transportation Development Centre of Transport Canada and co-sponsored by the U.S. Federal Aviation Administration, APS Aviation Inc. (APS) has undertaken a research program to advance aircraft ground de/anti-icing technology. The specific objectives of the APS test program are the following: • To develop holdover time data for all newly qualified de/anti-icing fluids; • To conduct endurance time frost tests for each temperature to substantiate the values in the
current SAE holdover time guidelines for Type IV, Type II, and Type I fluids; • To evaluate weather data from previous winters to establish a range of snow precipitation
suitable for the evaluation of holdover time limits; • To develop a protocol for Type I fluid testing; • To examine the change in viscosity during the application of Type IV fluids; • To compare holdover times in natural snow with those in NCAR’s artificial snow; • To prepare the JetStar and Canadair RJ wing for thermodynamic tests; • To further evaluate the flow of contaminated fluid from the wing of a Falcon 20D aircraft
during simulated take-off runs; • To further evaluate hot water deicing; • To provide support for tactile tests at Toronto Central Deicing Facility; and • To investigate the use of ice sensors in the pre-take-off contamination check. The research activities during the winter of 2000-01 are documented in six reports. The last four objectives listed above have not yet been finalized and are not included in this series of reports. Results will be reported upon study completion. The titles of the documented reports are as follows: • TP 13826E Aircraft Ground De/Anti-icing Fluid Holdover Time Development Program for
the 2000-01 Winter; • TP 13827E SAE Type I Fluid Endurance Time Test Protocol; • TP 13828E Endurance Time Testing in Snow: Reconciliation of Indoor and Outdoor Data; • TP 13829E Modification of Test Wing to Accommodate Fuel Load Effects for Deicing
Research: 2001; • TP 13830E Winter Weather Data Evaluation: (1995-2001); and • TP 13831E Endurance Time Tests in Simulated Frost Conditions: 2001.

PREFACE
X:\@APS ARCHIVE\CM1680 (exBM3833) TC-Deicing 00-01 (REPORTS ONLY)\Reports\HOT\Final Version 1.0\Final Version 1.0.doc Final Version 1.0
August 05 APS AVIATION INC.
iv
In addition, an interim report entitled Viscosity Measurement of Type IV Fluids on Wing Surfaces will be written. This report, TP 13826E, documents the project with the following objective: • To develop holdover time data for all newly qualified de/anti-icing fluids. This objective was met by conducting holdover time tests on different fluids in simulated freezing precipitation at the NRC Climatic Engineering Facility in Ottawa, and by carrying out tests in natural snow conditions at a test facility operated by APS at Dorval Airport in Montreal. ACKNOWLEDGEMENTS This research has been funded by the Civil Aviation Group, Transport Canada, with support from the U.S. Federal Aviation Administration. This program could not have been accomplished without the participation of many organizations. APS would therefore like to thank the Transportation Development Centre of Transport Canada, the Federal Aviation Administration, National Research Council Canada, the Meteorological Service of Canada, and several fluid manufacturers. Special thanks are extended to US Airways Inc., Air Canada, the National Center for Atmospheric Research, AéroMag 2000, Aéroports de Montreal, G. Vestergaard A/S, Hudson General Aviation Services Inc., Union Carbide/Dow, Cryotech, BFGoodrich, Cox and Company Inc., Fortier Transfert Ltée, and MTN Snow Equipment Inc. for provision of personnel and facilities, and for their cooperation with the test program. APS would also like to acknowledge the dedication of the research team, whose performance was crucial to the acquisition of hard data. The authors gratefully acknowledge the contribution of the APS Aviation Inc. data collection and research team: Nicolas Blais, Tara Newman, Bassem Ghobrial, Derek Flis, Elio Ruggi, Nicoara Moc, Kerri Henry, Philip LeBlanc, Tommy Furino, Marc Mayodon, Jeff Mayhew, Alexander Butler, Dominic Werugia, James Kollmar, Marc Antoni Goulet, Sami Chebil, Shawn Kearns, Alia Alwaid and Yagusha Bodnar. Special thanks are extended to Frank Eyre and Barry Myers of the Transportation Development Centre for their participation, contribution, and guidance in the preparation of this document.
Transport Canada
Transports Canada PUBLICATION DATA FORM
1. Transport Canada Publication No.
TP 13826E 2. Project No.
5031-34 3. Recipient’s Catalogue No.
4. Title and Subtitle
5. Publication Date
December 2001
6. Performing Organization Document No.
CM1680.001
7. Author(s)
Michael Chaput and Richard Campbell 8. Transport Canada File No.
ZCD2450-B-14
9. Performing Organization Name and Address 10. PWGSC File No.
MTB-0-02254
11. PWGSC or Transport Canada Contract No.
T8200-000556/001/MTB
12. Sponsoring Agency Name and Address 13. Type of Publication and Period Covered
Final
14. Project Officer
Barry B. Myers
15. Supplementary Notes (Funding programs, titles of related publications, etc.)
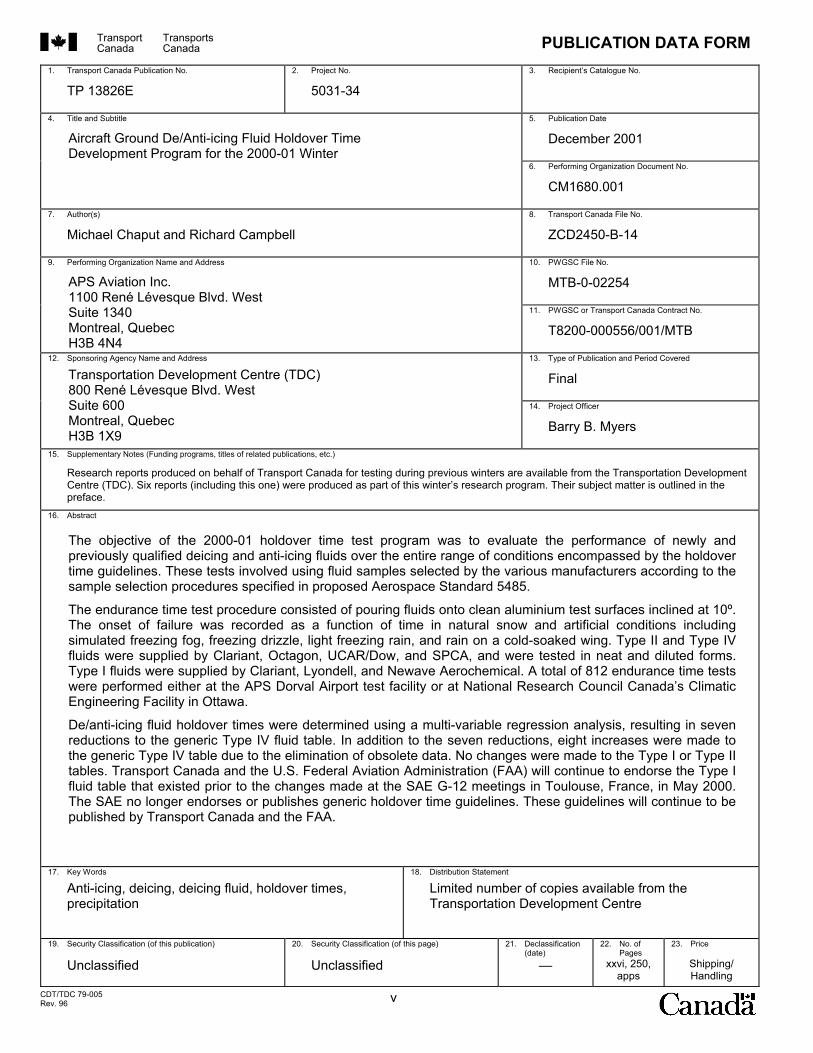
Research reports produced on behalf of Transport Canada for testing during previous winters are available from the Transportation Development Centre (TDC). Six reports (including this one) were produced as part of this winter’s research program. Their subject matter is outlined in the preface.
16. Abstract
17. Key Words
Anti-icing, deicing, deicing fluid, holdover times, precipitation
18. Distribution Statement
Limited number of copies available from the Transportation Development Centre
19. Security Classification (of this publication)
Unclassified
20. Security Classification (of this page)
Unclassified
21. Declassification (date)
—
22. No. of Pages
xxvi, 250, apps
23. Price
Shipping/ Handling
CDT/TDC 79-005 Rev. 96 v
Aircraft Ground De/Anti-icing Fluid Holdover Time Development Program for the 2000-01 Winter
APS Aviation Inc. 1100 René Lévesque Blvd. West Suite 1340 Montreal, Quebec H3B 4N4
Transportation Development Centre (TDC) 800 René Lévesque Blvd. West Suite 600 Montreal, Quebec H3B 1X9
The objective of the 2000-01 holdover time test program was to evaluate the performance of newly andpreviously qualified deicing and anti-icing fluids over the entire range of conditions encompassed by the holdover time guidelines. These tests involved using fluid samples selected by the various manufacturers according to thesample selection procedures specified in proposed Aerospace Standard 5485.
The endurance time test procedure consisted of pouring fluids onto clean aluminium test surfaces inclined at 10º.The onset of failure was recorded as a function of time in natural snow and artificial conditions includingsimulated freezing fog, freezing drizzle, light freezing rain, and rain on a cold-soaked wing. Type II and Type IV fluids were supplied by Clariant, Octagon, UCAR/Dow, and SPCA, and were tested in neat and diluted forms.Type I fluids were supplied by Clariant, Lyondell, and Newave Aerochemical. A total of 812 endurance time tests were performed either at the APS Dorval Airport test facility or at National Research Council Canada’s ClimaticEngineering Facility in Ottawa.
De/anti-icing fluid holdover times were determined using a multi-variable regression analysis, resulting in seven reductions to the generic Type IV fluid table. In addition to the seven reductions, eight increases were made tothe generic Type IV table due to the elimination of obsolete data. No changes were made to the Type I or Type IItables. Transport Canada and the U.S. Federal Aviation Administration (FAA) will continue to endorse the Type Ifluid table that existed prior to the changes made at the SAE G-12 meetings in Toulouse, France, in May 2000. The SAE no longer endorses or publishes generic holdover time guidelines. These guidelines will continue to bepublished by Transport Canada and the FAA.

Transports Canada
Transport Canada FORMULE DE DONNÉES POUR PUBLICATION
1. No de la publication de Transports Canada
TP 13826E 2. No de l’étude
5031-34 3. No de catalogue du destinataire
4. Titre et sous-titre
5. Date de la publication
Décembre 2001
6. No de document de l’organisme exécutant
CM1680.001
7. Auteur(s)
Michael Chaput et Richard Campbell 8. No de dossier - Transports Canada
ZCD2450-B-14
9. Nom et adresse de l’organisme exécutant 10. No de dossier - TPSGC
MTB-0-02254
11. No de contrat - TPSGC ou Transports Canada
T8200-000556/001/MTB
12. Nom et adresse de l’organisme parrain 13. Genre de publication et période visée
Final
14. Agent de projet
Barry B. Myers
15. Remarques additionnelles (programmes de financement, titres de publications connexes, etc.)
Les rapports de recherche produits au nom de Transports Canada sur les essais réalisés au cours des hivers antérieurs peuvent être obtenus auprès du Centre de développement des transports (CDT). Le programme de la saison hivernale a donné lieu à six rapports (dont celui-ci). On trouvera dans la préface l’objet de ces rapports.
16. Résumé
17. Mots clés
Antigivrage, dégivrage, liquide de dégivrage, durées d’efficacité, précipitation
18. Diffusion
Le Centre de développement des transports dispose d’un nombre limité d’exemplaires.
19. Classification de sécurité (de cette publication)
Non classifiée
20. Classification de sécurité (de cette page)
Non classifiée
21. Déclassification (date)
—
22. Nombre de pages
xxvi, 250, ann.
23. Prix
Port et manutention
CDT/TDC 79-005 Rev. 96 vi
Aircraft Ground De/Anti-icing Fluid Holdover Time Development Program for the 2000-01 Winter
APS Aviation Inc. 1100, boul. René-Lévesque Ouest Bureau 1340 Montréal (Québec) H3B 4N4
Centre de développement des transports (CDT) 800, boul. René-Lévesque Ouest Bureau 600 Montréal (Québec) H3B 1X9
L’objectif du programme d’essais de durée d’efficacité de l’hiver 2000-2001 était d’évaluer la performance de liquides de dégivrage/antigivre déjà ou nouvellement homologués, dans toute la gamme des conditions météorologiques couvertes par leguide sur les durées d’efficacité. Les essais ont été réalisés à l’aide d’échantillons de liquides sélectionnés par les divers fabricants conformément à la procédure d’échantillonnage indiquée dans le projet de norme Aerospace Standard 5485.
Les essais d’endurance consistaient à verser les liquides sur des surfaces en aluminium propres, inclinées à 10°. On notait ensuite l’amorce de la perte d’efficacité en fonction du temps, sous la neige naturelle et dans des conditions artificiellessimulant de la bruine verglaçante, du brouillard verglaçant, de la pluie légère verglaçante et de la pluie sur une aile imprégnéede froid. Les liquides de type II et de type IV, fournis par Clariant, Octagon, UCAR/Dow et SPCA, ont été essayés purs etdilués. Les liquides de type I provenaient de Clariant, Lyondell et Newave Aerochemical. Un total de 812 essais ont été réalisés au site d’essai d’APS à l’Aéroport de Dorval et à l’Installation de génie climatique du Conseil national de recherchesdu Canada (CNRC) à Ottawa.
Les durées d’efficacité, déterminées par une analyse de régression multi-dimensionnelle, ont mené à la diminution de sept valeurs du tableau générique des durées d’efficacité des liquides de type IV. De plus, huit valeurs de ce même tableau ont étéaugmentées, par suite de l’élimination de données périmées. Par contre, aucun changement n’a été apporté aux tableauxconcernant les liquides de type I ou de type II. Transports Canada et la Federal Aviation Administration (FAA) des États-Unis entendent continuer de reconnaître le tableau des durées d’efficacité des liquides de type I tel qu’il existait avant que deschangements y soient apportés lors des réunions des sous-comités G-12 de la SAE tenues en mai 2000 à Toulouse, en France. La SAE ne reconnaît plus les guides génériques sur les durées d’efficacité et n’en publie plus. Mais TransportsCanada et la FAA continueront de publier ces guides.

EXECUTIVE SUMMARY
X:\@APS ARCHIVE\CM1680 (exBM3833) TC-Deicing 00-01 (REPORTS ONLY)\Reports\HOT\Final Version 1.0\Final Version 1.0.doc Final Version 1.0
August 05 APS AVIATION INC.
vii
EXECUTIVE SUMMARY Under contract to the Transportation Development Centre of Transport Canada and co-sponsored by the Federal Aviation Administration, APS Aviation Inc. (APS) has undertaken a test and evaluation program to further advance aircraft pre-flight de/anti-icing technology. While a number of objectives of the test program are documented in a series of related reports, the primary objectives specifically addressed in this document were to develop holdover time tables for new de/anti-icing fluids and to validate generic tables. The project involved the participation of several de/anti-icing fluid manufacturers, the Transportation Development Centre of Transport Canada, National Research Council Canada (NRC), the U.S. Federal Aviation Administration (FAA), and the Meteorological Service of Canada (MSC). Holdover time tests consisted of pouring freezing point depressant fluids onto clean, inclined (10°), standard flat aluminum plates. The plates were mounted on a test stand and systematically exposed to an array of natural or artificially produced icing conditions. For every plate, the elapsed time required to reach a predefined end condition was recorded. Test conditions, test parameters, and test bed specifications were determined based on the Society of Automotive Engineers (SAE) G-12 Holdover Time Subcommittee guidelines. The variables measured included failure time, type of precipitation, rate of precipitation, total precipitation, visibility, wind speed, wind direction, ambient temperature, test surface temperature, fluid brand, fluid type, and fluid concentration. Data Collection During the 2000-01 test season, data were collected for tests conducted during natural precipitation events at the APS Dorval airport test site. Data were also collected for artificial precipitation tests in the following simulated conditions: freezing drizzle, light freezing rain, freezing fog, snow, and rain on cold-soaked surfaces. The artificial precipitation tests were performed indoors at NRC’s Climatic Engineering Facility in Ottawa. Tests in frost conditions had not been conducted in the past. In 2000-01, a series of frost tests were conducted by APS in an attempt to substantiate the holdover time values of SAE fluids (see Transport Canada report TP 13831E, Endurance Time Tests in Simulated Frost Conditions).
EXECUTIVE SUMMARY
X:\@APS ARCHIVE\CM1680 (exBM3833) TC-Deicing 00-01 (REPORTS ONLY)\Reports\HOT\Final Version 1.0\Final Version 1.0.doc Final Version 1.0
August 05 APS AVIATION INC.
viii
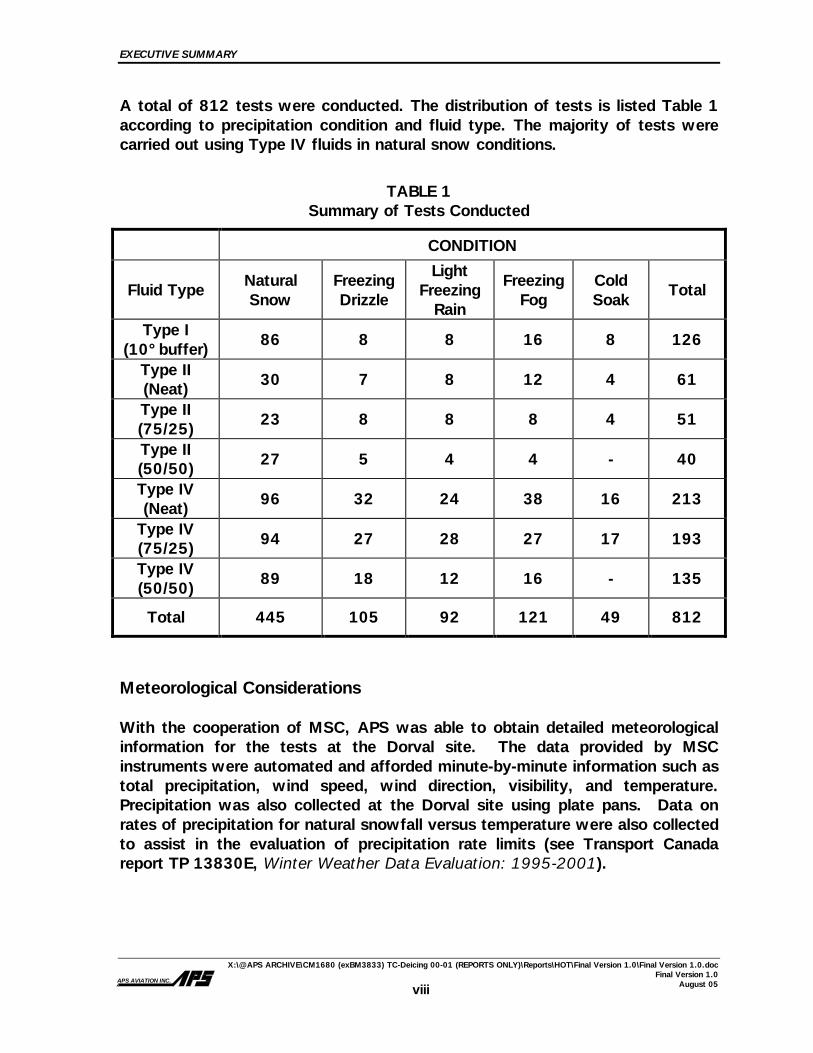
A total of 812 tests were conducted. The distribution of tests is listed Table 1 according to precipitation condition and fluid type. The majority of tests were carried out using Type IV fluids in natural snow conditions.
TABLE 1 Summary of Tests Conducted
CONDITION
Fluid Type Natural Snow
Freezing Drizzle
Light Freezing
Rain
Freezing Fog
Cold Soak
Total
Type I (10°buffer) 86 8 8 16 8 126
Type II (Neat) 30 7 8 12 4 61
Type II (75/25) 23 8 8 8 4 51
Type II (50/50) 27 5 4 4 - 40
Type IV (Neat) 96 32 24 38 16 213
Type IV (75/25) 94 27 28 27 17 193
Type IV (50/50) 89 18 12 16 - 135
Total 445 105 92 121 49 812
Meteorological Considerations With the cooperation of MSC, APS was able to obtain detailed meteorological information for the tests at the Dorval site. The data provided by MSC instruments were automated and afforded minute-by-minute information such as total precipitation, wind speed, wind direction, visibility, and temperature. Precipitation was also collected at the Dorval site using plate pans. Data on rates of precipitation for natural snowfall versus temperature were also collected to assist in the evaluation of precipitation rate limits (see Transport Canada report TP 13830E, Winter Weather Data Evaluation: 1995-2001).
EXECUTIVE SUMMARY
X:\@APS ARCHIVE\CM1680 (exBM3833) TC-Deicing 00-01 (REPORTS ONLY)\Reports\HOT\Final Version 1.0\Final Version 1.0.doc Final Version 1.0
August 05 APS AVIATION INC.
ix
Holdover Time Tests Five Type I fluids, one Type II fluid, and four Type IV fluids were tested by APS in 2000-01. A holdover time table was developed for one new SAE-qualified Type IV fluid. In addition, one previously certified Type IV fluid was retested. From the tests conducted in 2000-01, one generic holdover time guideline was assembled to reflect the holdover times of the worst performing fluid. In the fluid-specific holdover time tables, holdover times were determined using the regression analysis of the data collected for each specific fluid and for all categories of precipitation and temperature ranges. Seven reductions were made to the generic Type IV table based on the results of Type IV fluid tests in 2000-01: five in the Freezing Drizzle column, and two in the category of Light Freezing Rain.
In addition to the seven reductions, eight generic holdover time values – four in each of the Snow and Freezing Drizzle columns of the generic Type IV table – were increased due to the elimination of data from obsolete fluids tested in 1996-97.
One change was made to the generic Type II table for use in 2001-02 winter operations. In the Light Freezing Rain column for Neat Type II fluid between -3 and -10°C, the upper generic value was reduced by five minutes based on the results of Type IV fluid tests from 2000-01. No changes to the Type II table were made as a result of the most recent Type II fluid tests.
No Type III fluids were available during the past season; therefore, no Type III tests were performed. A Type III holdover time table exists; however, the values need to be substantiated since the table was generated using a fluid that is no longer commercially available. In general, the Type I holdover time results from tests conducted in 2000-01 agreed with the reduced generic Type I holdover time guidelines agreed upon at the SAE G-12 meetings in Toulouse, France, and no changes were made to the generic Type I table. In addition to the endurance time testing of new fluids, APS evaluated the endurance time performance of a degraded viscosity sample of a certified Type IV fluid. The research team also conducted tests using certified Type IV fluids to determine differences between the results obtained at NRC and other facilities in conditions of light freezing rain and freezing drizzle.
EXECUTIVE SUMMARY
X:\@APS ARCHIVE\CM1680 (exBM3833) TC-Deicing 00-01 (REPORTS ONLY)\Reports\HOT\Final Version 1.0\Final Version 1.0.doc Final Version 1.0
August 05 APS AVIATION INC.
x
Recommendations It is recommended that:
• Any new Type I, Type II or Type IV fluids be evaluated over the entire
range of conditions of the holdover time tables; • The holdover time table for Type III fluids be re-evaluated if new Type III
fluids become available for testing in the 2001-02 test season;
• Type II fluid-specific tables be generated for previously certified Type II fluids; and
• A new endurance time test procedure aimed at simulating a real-world
Type I application to a wing be developed for Type I fluids.

SOMMAIRE
X:\@APS ARCHIVE\CM1680 (exBM3833) TC-Deicing 00-01 (REPORTS ONLY)\Reports\HOT\Final Version 1.0\Final Version 1.0.doc Final Version 1.0
August 05 APS AVIATION INC.
xi
SOMMAIRE En vertu d’un contrat avec le Centre de développement des transports de Transports Canada, et avec le coparrainage de la Federal Aviation Administration, APS Aviation Inc. a entrepris un programme d’essai et d’évaluation qui vise à faire progresser la technologie de dégivrage/antigivrage des avions au sol. Plusieurs des objectifs assignés à ce programme sont traités dans une série de rapports déjà publiés. Les grands objectifs de la présente recherche étaient de mettre au point des tableaux de durées d’efficacité pour de nouveaux liquides de dégivrage/antigivre et de valider les tableaux génériques. Ont participé au programme plusieurs fabricants de liquides dégivrants/antigivre, le Centre de développement des transports de Transports Canada, le Conseil national de recherches du Canada (CNRC), la Federal Aviation Administration des États-Unis et le Service météorologique du Canada (SMC). Les essais de durée d’efficacité consistaient à verser des liquides abaisseurs du point de congélation sur des plaques standard en aluminium propres, inclinées (à 10°). Les plaques étaient montées sur un support et systématiquement exposées à une gamme de conditions verglaçantes, naturelles et simulées. Pour chaque plaque, on notait le temps nécessaire pour qu’une condition prédéterminée, indicatrice de la «perte d’efficacité» du liquide, soit remplie. Les conditions d’essai, les paramètres d’essai et les spécifications relatives au banc d’essai ont été déterminés en fonction des lignes directrices du sous-comité sur les durées d’efficacité G-12 de la SAE (Society of Automotive Engineers). Les variables mesurées comprenaient le temps couru jusqu’à la perte d’efficacité, le type de précipitation, le taux de précipitation, la quantité totale de précipitation, la visibilité, la vitesse du vent, la direction du vent, la température ambiante, la température des surfaces d’essai, la marque du liquide, le type de liquide et la concentration du liquide. Collecte des données Pendant la campagne 2000-2001, des données ont été colligées au cours d’essais menés sous des précipitations naturelles au site d’essai de APS à l’Aéroport de Dorval. Des données ont aussi été colligées sous des précipitations artificielles de bruine verglaçante, de pluie légère verglaçante, de brouillard verglaçant, de neige et de pluie sur des surfaces imprégnées de froid. Ces derniers essais ont eu lieu à l’intérieur, à l’Installation de génie climatique du CNRC, à Ottawa. C’était la première fois qu’étaient menés des essais dans des conditions de givre. Ceux-ci avaient pour but d’étayer les valeurs de durée
SOMMAIRE
X:\@APS ARCHIVE\CM1680 (exBM3833) TC-Deicing 00-01 (REPORTS ONLY)\Reports\HOT\Final Version 1.0\Final Version 1.0.doc Final Version 1.0
August 05 APS AVIATION INC.
xii
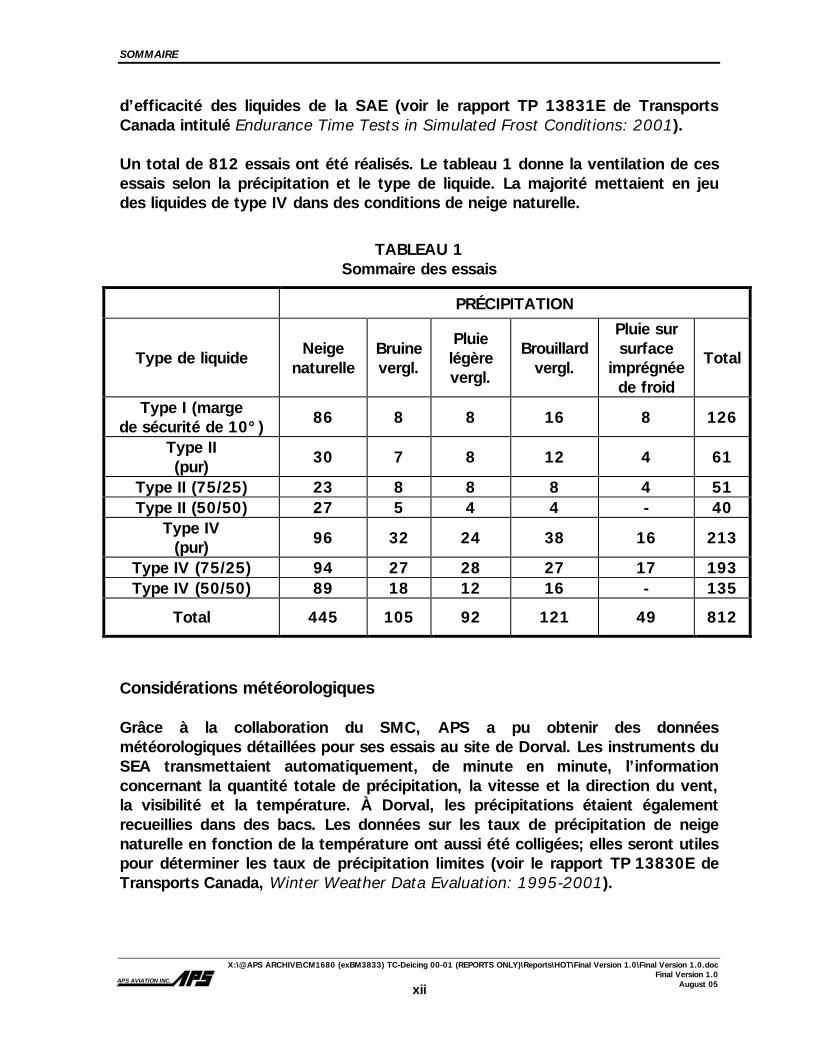
d’efficacité des liquides de la SAE (voir le rapport TP 13831E de Transports Canada intitulé Endurance Time Tests in Simulated Frost Conditions: 2001). Un total de 812 essais ont été réalisés. Le tableau 1 donne la ventilation de ces essais selon la précipitation et le type de liquide. La majorité mettaient en jeu des liquides de type IV dans des conditions de neige naturelle.
TABLEAU 1 Sommaire des essais
PRÉCIPITATION
Type de liquide Neige naturelle
Bruine vergl.
Pluie légère vergl.
Brouillard vergl.
Pluie sur surface
imprégnée de froid
Total
Type I (marge de sécurité de 10°) 86 8 8 16 8 126
Type II (pur) 30 7 8 12 4 61
Type II (75/25) 23 8 8 8 4 51 Type II (50/50) 27 5 4 4 - 40
Type IV (pur) 96 32 24 38 16 213
Type IV (75/25) 94 27 28 27 17 193 Type IV (50/50) 89 18 12 16 - 135
Total 445 105 92 121 49 812
Considérations météorologiques Grâce à la collaboration du SMC, APS a pu obtenir des données météorologiques détaillées pour ses essais au site de Dorval. Les instruments du SEA transmettaient automatiquement, de minute en minute, l’information concernant la quantité totale de précipitation, la vitesse et la direction du vent, la visibilité et la température. À Dorval, les précipitations étaient également recueillies dans des bacs. Les données sur les taux de précipitation de neige naturelle en fonction de la température ont aussi été colligées; elles seront utiles pour déterminer les taux de précipitation limites (voir le rapport TP 13830E de Transports Canada, Winter Weather Data Evaluation: 1995-2001).
SOMMAIRE
X:\@APS ARCHIVE\CM1680 (exBM3833) TC-Deicing 00-01 (REPORTS ONLY)\Reports\HOT\Final Version 1.0\Final Version 1.0.doc Final Version 1.0
August 05 APS AVIATION INC.
xiii
Essais de durée d’efficacité Cinq liquides de type I, un liquide de type II et quatre liquides de type IV ont été testés par APS en 2000-2001. Un tableau des durées d’efficacité a été élaboré pour un nouveau liquide de type IV homologué par la SAE. De plus, un liquide de type IV certifié précédemment a été remis à l’essai. Les essais de 2000-2001 ont mené à la constitution d’un tableau générique des durées d’efficacité, dans lequel figurent les durées d’efficacité du liquide le moins performant. Quant aux durées d’efficacité qui figurent sur les tableaux dits spécifiques, elles ont été établies au terme de l’analyse de régression des résultats d’essai de chacun des liquides, pour toutes les catégories de précipitations et plages de températures. Sept valeurs du tableau générique des liquides de type IV ont été réduites, à la lumière des résultats des essais des liquides de type IV menés en 2000-2001 : cinq dans la colonne Brouillard verglaçant, et deux dans la colonne Pluie légère verglaçante. Outre ces sept réductions, huit valeurs de durée d’efficacité – quatre dans chacune des colonnes Neige naturelle et Brouillard verglaçant du tableau générique des liquides de type IV – ont été augmentées, par suite de l’élimination de données concernant des liquides essayés en 1996-1997 et retirés du marché depuis. Un seul changement a été apporté au tableau générique des liquides de type II devant être publié pour la saison hivernale 2001-2002. À la colonne Pluie légère verglaçante correspondant au liquide de type II pur appliqué à une plage de températures allant de -3 °C à -10 °C, la valeur générique maximale a été réduite de cinq minutes, d’après les résultats des essais de liquides de type IV menés en 2000-2001. Aucun changement n’a été apporté au tableau des liquides de type II par suite des derniers essais portant sur ces liquides. Il n’existait sur le marché aucun liquide de type III cette dernière saison; aucun liquide de ce type n’a donc été essayé. Il existe bien un tableau des durées d’efficacité des liquides de type III; mais ces valeurs doivent être validées car le tableau a été produit à l’aide d’un liquide disparu du marché. De façon générale, les résultats des essais de durée d’efficacité des liquides de type I menés en 2000-2001 concordaient avec les valeurs réduites du tableau générique concernant les liquides de type I, accepté aux réunions des sous-comités G-12 de la SAE tenues à Toulouse, en France. Aucun changement n’a donc été apporté à ce tableau. Outre l’endurance de nouveaux liquides, APS a évalué celle d’un échantillon de liquide de type IV déjà homologué, à viscosité réduite. L’équipe de recherche a

SOMMAIRE
X:\@APS ARCHIVE\CM1680 (exBM3833) TC-Deicing 00-01 (REPORTS ONLY)\Reports\HOT\Final Version 1.0\Final Version 1.0.doc Final Version 1.0
August 05 APS AVIATION INC.
xiv
également mené des essais à l’aide de liquides de type IV homologués afin de mettre en lumière les différences entre les résultats obtenus au CNRC et à d’autres installations, dans des conditions de pluie légère verglaçante et de brouillard verglaçant. Recommandations Il est recommandé ce qui suit :
• que tout nouveau liquide de type I, de type II ou de type IV soit évalué dans toute la gamme des conditions couvertes par les tableaux de durées d’efficacité;
• que le tableau des durées d’efficacité des liquides de type III soit revu si
de nouveaux liquides de type III deviennent disponibles pour des essais au cours de la saison 2001-2002;
• que des tableaux spécifiques soient produits pour les liquides de type II
déjà homologués;
• qu’une nouvelle procédure d’essai d’endurance simulant les conditions réelles d’application d’un liquide de type I sur une aile soit mise au point.

TABLE OF CONTENTS
X:\@APS ARCHIVE\CM1680 (exBM3833) TC-Deicing 00-01 (REPORTS ONLY)\Reports\HOT\Final Version 1.0\Final Version 1.0.doc Final Version 1.0
August 05 APS AVIATION INC.
xv
CONTENTS Page
1. INTRODUCTION ....................................................................................................... 1 1.1 Holdover Time Tables ...................................................................................... 2 1.2 Objectives ...................................................................................................... 8 1.3 Report Format................................................................................................. 8
2. METHODOLOGY..................................................................................................... 19 2.1 Weather Conditions ....................................................................................... 19
2.1.1 Snow .............................................................................................. 19 2.1.2 Freezing Drizzle................................................................................. 21 2.1.3 Freezing Rain .................................................................................... 21 2.1.4 Freezing Fog..................................................................................... 23
2.2 Test Sites .................................................................................................... 23 2.3 Test Conditions............................................................................................. 25
2.3.1 Droplet Size and Rate of Precipitation................................................... 25 2.3.2 Median Volume Diameter of Raindrops ................................................. 27 2.3.3 Characteristics of Precipitation Produced .............................................. 27
2.4 Equipment.................................................................................................... 28 2.5 Test Procedures ............................................................................................ 33
2.5.1 Test Protocol .................................................................................... 33 2.5.2 End Condition Definitions ................................................................... 34 2.5.3 Precipitation Rate Measurement Procedures .......................................... 35
2.6 Data Forms .................................................................................................. 39 2.7 Fluids .......................................................................................................... 39
2.7.1 General ............................................................................................ 39 2.7.2 Fluids Tested .................................................................................... 43 2.7.3 Evolution of Type IV Fluids ................................................................. 44
2.8 Personnel ..................................................................................................... 47 2.9 Analysis Methodology.................................................................................... 48
2.9.1 Descriptions of Data Ranges and Precipitation Definitions ....................... 48 2.9.2 Protocol for the Determination of Holdover Times .................................. 52 2.9.3 Determination of Generic and Fluid-Specific Holdover Times .................... 56
3. DESCRIPTION OF DATA .......................................................................................... 75 3.1 Dorval Natural Snow Tests ............................................................................. 75
3.1.1 Data Acquisition................................................................................ 75 3.1.2 Test Location and Fluids Tested .......................................................... 75 3.1.3 Distribution of Average Precipitation Rates............................................ 78 3.1.4 Distribution of Other Meteorological Conditions ..................................... 78
3.2 Freezing Drizzle and Light Freezing Rain Tests ................................................... 78 3.2.1 Data Acquisition................................................................................ 78 3.2.2 Test Location and Fluids Tested .......................................................... 89 3.2.3 Distribution of Average Precipitation Rates............................................ 89 3.2.4 Distribution of Other Meteorological Conditions ..................................... 89
3.3 Simulated Freezing Fog Tests.......................................................................... 89 3.3.1 Data Acquisition................................................................................ 89 3.3.2 Test Location and Fluids Tested .......................................................... 89 3.3.3 Distribution of Average Precipitation Rates............................................ 92

TABLE OF CONTENTS
X:\@APS ARCHIVE\CM1680 (exBM3833) TC-Deicing 00-01 (REPORTS ONLY)\Reports\HOT\Final Version 1.0\Final Version 1.0.doc Final Version 1.0
August 05 APS AVIATION INC.
xvi
3.3.4 Distribution of Tests by Air Temperature .............................................. 92 3.4 Simulated Rain on Cold-Soaked Surface Tests ................................................... 92
3.4.1 Data Acquisition................................................................................ 92 3.4.2 Test Location and Fluids Tested .......................................................... 92 3.4.3 Distribution of Average Precipitation Rates............................................ 92
4. HOLDOVER TIME TABLES, RESULTS, AND DISCUSSIONS........................................... 97 4.1 Background .................................................................................................. 97
4.1.1 Viscosity of Anti-icing Fluid Tested in 1996-97 ..................................... 97 4.1.2 Viscosity of Anti-icing Fluids Tested in 1997-98 .................................... 97 4.1.3 Viscosity of Anti-icing Fluids Tested in 1998-99 .................................... 98 4.1.4 Viscosity of Anti-icing Fluids Tested in 2000-01 .................................... 99
4.2 Type IV Fluids............................................................................................. 100 4.2.1 Methodology Used in the Determination of Fluid-Specific Holdover Times 102 4.2.2 Natural Snow ................................................................................. 104 4.2.3 Freezing Drizzle............................................................................... 126 4.2.4 Light Freezing Rain .......................................................................... 137 4.2.5 Freezing Fog................................................................................... 148 4.2.6 Rain on a Cold-Soaked Wing ............................................................. 162 4.2.7 Frost Testing .................................................................................. 167 4.2.8 Changes to the Generic Type IV Table................................................ 167 4.2.9 Worst Case Fluids ........................................................................... 167
4.3 Type II Fluid Holdover Time Tests .................................................................. 169 4.3.1 Natural Snow ................................................................................. 170 4.3.2 Freezing Drizzle............................................................................... 181 4.3.3 Light Freezing Rain .......................................................................... 189 4.3.4 Freezing Fog................................................................................... 196 4.3.5 Rain on a Cold-Soaked Wing ............................................................. 207 4.3.6 Changes to the Generic Type II Table ................................................. 210
4.4 Type I Fluid Holdover Time Tests................................................................... 210 4.4.1 Freezing Drizzle............................................................................... 212 4.4.2 Light Freezing Rain .......................................................................... 214 4.4.3 Freezing Fog................................................................................... 214 4.4.4 Rain on a Cold-Soaked Wing ............................................................. 216 4.4.5 Natural Snow ................................................................................. 216 4.4.6 Overall Perspective on Type I Results ................................................. 219
4.5 Type III Fluid............................................................................................... 219 4.6 Official Holdover Time Tables for 2001-02...................................................... 220
4.6.1 Methodology to Re-Categorize Fluid Holdover Time Tables .................... 221
5. SUPPLEMENTARY TESTS ...................................................................................... 237 5.1 Evaluation of the Holdover Time Performance of a Degraded Viscosity Sample of
Kilfrost Type IV ABC-S................................................................................. 237 5.2 Results of Round-Robin Testing Using Certified Type IV Fluids in Freezing Drizzle and
Light Freezing Rain ...................................................................................... 239
6. CONCLUSIONS .................................................................................................... 243 6.1 Type IV Fluids............................................................................................. 243
6.1.1 Snow ............................................................................................ 243 6.1.2 Freezing Drizzle............................................................................... 244 6.1.3 Light Freezing Rain .......................................................................... 244 6.1.4 Freezing Fog................................................................................... 244
TABLE OF CONTENTS
X:\@APS ARCHIVE\CM1680 (exBM3833) TC-Deicing 00-01 (REPORTS ONLY)\Reports\HOT\Final Version 1.0\Final Version 1.0.doc Final Version 1.0
August 05 APS AVIATION INC.
xvii
6.1.5 Rain on a Cold-Soaked Wing ............................................................. 244 6.2 Type II Fluids .............................................................................................. 244
6.2.1 Natural Snow ................................................................................. 244 6.2.2 Freezing Drizzle............................................................................... 245 6.2.3 Light Freezing Rain .......................................................................... 245 6.2.4 Freezing Fog................................................................................... 245 6.2.5 Rain on a Cold-Soaked Wing ............................................................. 245
6.3 Type I Fluids............................................................................................... 245 6.4 Type III Fluids ............................................................................................. 245 6.5 Supplementary Tests ................................................................................... 246
7. RECOMMENDATIONS ........................................................................................... 247
REFERENCES............................................................................................................. 249
LIST OF APPENDICES A Excerpt from the Transportation Development Centre Work Statement – 2000-01
B Experimental Program – For Dorval Natural Precipitation Flat Plate Testing, Winter 2000-01
C Detailed Plan of NRC Cold Chamber Testing, Winter 2000-01
D NRC Test Procedure Octagon Max flight, June 2001
E Dilutions for Type I Fluids
F Regression Analysis Performed for all Fluids
G Effect of temperature and Rate of Precipitation on Holdover Time, Winter 2000-01
H Rate program Spreadsheet Guide
I Official Transport Canada Holdover Time Tables
J Official Federal Aviation Administration Holdover Time Tables
K Log of Endurance Time Tests, 2000-01
L Preliminary Report Methodology to Re-Categorize Fluid Holdover Time Tables

xviii
This page intentionally left blank.
LIST OF FIGURES, TABLES, AND PHOTOS
X:\@APS ARCHIVE\CM1680 (exBM3833) TC-Deicing 00-01 (REPORTS ONLY)\Reports\HOT\Final Version 1.0\Final Version 1.0.doc Final Version 1.0
August 05 APS AVIATION INC.
xix
LIST OF FIGURES
Page 2.1 APS Test Site Location at Dorval Airport .............................................................. 24 2.2 Flat Plate Test Set-Up ........................................................................................ 30 2.3 Schematics of Plate Pan and Sealed Boxes............................................................ 31 2.4 Calculation of Outdoor Precipitation Rate .............................................................. 40 2.5 Precipitation Rate Ranges Used for Evaluation of HOT Limits ................................... 50 2.6 Example of Regression Method on Log-Log Chart................................................... 54 2.7 Example of Regression Method on Standard Chart ................................................. 54 3.1 Number of Natural Snow Tests Conducted............................................................ 76 3.2 Distribution of Precipitation Rate – Type IV Fluids .................................................. 79 3.3 Distribution of Precipitation Rate – Type II Fluids ................................................... 80 3.4 Distribution of Precipitation Rate – Diluted Type I Fluids ......................................... 81 3.5 Distribution of Air Temperature – Type IV Fluids.................................................... 82 3.6 Distribution of Air Temperature – Type II Fluids ..................................................... 83 3.7 Distribution of Air Temperature – Diluted Type I Fluids ........................................... 84 3.8 Distribution of Wind Speed – Type IV Fluids.......................................................... 85 3.9 Distribution of Wind Speed – Type II Fluids ........................................................... 86 3.10 Distribution of Wind Speed – Diluted Type I Fluids ................................................. 87 3.11 Number of Simulated Freezing Drizzle and Light Freezing Rain Tests ......................... 88 3.12 Number of Simulated Freezing Fog Tests .............................................................. 91 3.13 Number of Cold-Soak Box Tests .......................................................................... 94 4.1 Effect of Temperature and Rate of Precipitation on Endurance Time – Sample
Type IV Neat .................................................................................................. 105 4.2 Process for Evaluating Holdover Times – Natural Snow......................................... 106 4.3 Effect of Fluid Brand and Rate of Precipitation on Endurance Time – Type IV
Neat (Above 0ºC) ............................................................................................ 109 4.4 Effect of Fluid Brand and Rate of Precipitation on Endurance Time – Type IV
75/25 (Above 0ºC) .......................................................................................... 111 4.5 Effect of Fluid Brand and Rate of Precipitation on Endurance Time – Type IV
50/50 (Above 0ºC) .......................................................................................... 113 4.6 Effect of Fluid Brand and Rate of Precipitation on Endurance Time – Type IV
Neat (0 to -3ºC) .............................................................................................. 115 4.7 Effect of Fluid Brand and Rate of Precipitation on Endurance Time – Type IV
75/25 (0 to -3ºC) ............................................................................................ 117 4.8 Effect of Fluid Brand and Rate of Precipitation on Endurance Time – Type IV
50/50 (0 to -3ºC) ............................................................................................ 119 4.9 Effect of Fluid Brand and Rate of Precipitation on Endurance Time – Type IV
Neat (-3 to -14ºC) ........................................................................................... 121 4.10 Effect of Fluid Brand and Rate of Precipitation on Endurance Time – Type IV
75/25 (-3 to -14ºC) ......................................................................................... 123 4.11 Effect of Fluid Brand and Rate of Precipitation on Endurance Time – Type IV
Neat (-14 to -25ºC) ......................................................................................... 125 4.12 Effect of Fluid Brand and Rate of Precipitation on Endurance Time – Type IV
Neat – Freezing Drizzle at -3ºC.......................................................................... 128 4.13 Effect of Fluid Brand and Rate of Precipitation on Endurance Time – Type IV
75/25 – Freezing Drizzle at -3ºC........................................................................ 130 4.14 Effect of Fluid Brand and Rate of Precipitation on Endurance Time – Type IV
50/50 – Freezing Drizzle at -3ºC........................................................................ 132 4.15 Effect of Fluid Brand and Rate of Precipitation on Endurance Time – Type IV
Neat – Freezing Drizzle at -10ºC........................................................................ 134

LIST OF FIGURES, TABLES, AND PHOTOS
X:\@APS ARCHIVE\CM1680 (exBM3833) TC-Deicing 00-01 (REPORTS ONLY)\Reports\HOT\Final Version 1.0\Final Version 1.0.doc Final Version 1.0
August 05 APS AVIATION INC.
xx
4.16 Effect of Fluid Brand and Rate of Precipitation on Endurance Time – Type IV 75/25 – Freezing Drizzle at -10ºC...................................................................... 136
4.17 Effect of Fluid Brand and Rate of Precipitation on Endurance Time – Type IV Neat – Light Freezing Rain at -3ºC ..................................................................... 139
4.18 Effect of Fluid Brand and Rate of Precipitation on Endurance Time – Type IV 75/25 – Light Freezing Rain at -3ºC ................................................................... 141
4.19 Effect of Fluid Brand and Rate of Precipitation on Endurance Time – Type IV 50/50 – Light Freezing Rain at -3º C .................................................................. 143
4.20 Effect of Fluid Brand and Rate of Precipitation on Endurance Time – Type IV Neat – Light Freezing Rain at -10ºC ................................................................... 145
4.21 Effect of Fluid Brand and Rate of Precipitation on Endurance Time – Type IV 75/25 – Light Freezing Rain at -10ºC ................................................................. 147
4.22 Effect of Fluid Brand and Rate of Precipitation on Endurance Time – Type IV Neat – Freezing Fog at -3ºC.............................................................................. 151
4.23 Effect of Fluid Brand and Rate of Precipitation on Endurance Time – Type IV 75/25 – Freezing Fog at -3ºC............................................................................ 153
4.24 Effect of Fluid Brand and Rate of Precipitation on Endurance Time – Type IV 50/50 – Freezing Fog at -3ºC............................................................................ 155
4.25 Effect of Fluid Brand and Rate of Precipitation on Endurance Time – Type IV Neat – Freezing Fog at -14ºC............................................................................ 157
4.26 Effect of Fluid Brand and Rate of Precipitation on Endurance Time – Type IV 75/25 – Freezing Fog at -14ºC.......................................................................... 159
4.27 Effect of Fluid Brand and Rate of Precipitation on Endurance Time – Type IV Neat – Freezing Fog at -25ºC............................................................................ 161
4.28 Effect of Fluid Brand and Rate of Precipitation on Endurance Time – Type IV Neat – Rain on Cold-Soaked Surface .................................................................. 164
4.29 Effect of Fluid Brand and Rate of Precipitation on Endurance Time – Type IV 75/25 – Rain on Cold-Soaked Surface ................................................................ 166
4.30 Effect of Fluid Brand and Rate of Precipitation on Endurance Time – Type II Neat (Above 0ºC) – Natural Snow............................................................................. 172
4.31 Effect of Fluid Brand and Rate of Precipitation on Endurance Time – Type II 75/25 (Above 0ºC) – Natural Snow ................................................................... 172
4.32 Effect of Fluid Brand and Rate of Precipitation on Endurance Time – Type II 50/50 (Above 0ºC) – Natural Snow ................................................................... 174
4.33 Effect of Fluid Brand and Rate of Precipitation on Endurance Time – Type II Neat (0 to -3ºC) – Natural Snow............................................................................... 174
4.34 4.34 Effect of Fluid Brand and Rate of Precipitation on Endurance Time – Type II 75/25 (0 to -3ºC) – Natural Snow ..................................................................... 176
4.35 Effect of Fluid Brand and Rate of Precipitation on Endurance Time – Type II 50/50 (0 to -3ºC) – Natural Snow ..................................................................... 176
4.36 Effect of Fluid Brand and Rate of Precipitation on Endurance Time – Type II Neat (-3 to -14ºC) – Natural Snow ............................................................................ 178
4.37 Effect of Fluid Brand and Rate of Precipitation on Endurance Time – Type II 75/25 (-3 to -14ºC) – Natural Snow................................................................... 178
4.38 Effect of Temperature and Rate of Precipitation on Endurance Time –Type II Neat (-14 to -25ºC) – Natural Snow .......................................................................... 180
4.39 Effect of Temperature and Rate of Precipitation on Endurance Time – Type II Neat – Freezing Drizzle at -3ºC.......................................................................... 183
4.40 Effect of Temperature and Rate of Precipitation on Endurance Time – Type II 75/25 – Freezing Drizzle at -3ºC........................................................................ 183
4.41 Effect of Temperature and Rate of Precipitation on Endurance Time – Type II 50/50 – Freezing Drizzle at -3ºC........................................................................ 185

LIST OF FIGURES, TABLES, AND PHOTOS
X:\@APS ARCHIVE\CM1680 (exBM3833) TC-Deicing 00-01 (REPORTS ONLY)\Reports\HOT\Final Version 1.0\Final Version 1.0.doc Final Version 1.0
August 05 APS AVIATION INC.
xxi
4.42 Effect of Temperature and Rate of Precipitation on Endurance Time – Type II Neat – Freezing Drizzle at -10ºC........................................................................ 185
4.43 Effect of Temperature and Rate of Precipitation on Endurance Time – Type II 75/25 – Freezing Drizzle at -10ºC...................................................................... 187
4.44 Effect of Fluid Brand and Rate of Precipitation on Endurance Time – Type II Neat – Light Freezing Rain at -3ºC............................................................................. 191
4.45 Effect of Fluid Brand and Rate of Precipitation on Endurance Time – Type II 75/25 – Light Freezing Rain at -3ºC ................................................................... 191
4.46 Effect of Fluid Brand and Rate of Precipitation on Endurance Time – Type II 50/50 – Light Freezing Rain at -3ºC ................................................................... 193
4.47 Effect of Fluid Brand and Rate of Precipitation on Endurance Time – Type II Neat – Light Freezing Rain at -10ºC........................................................................... 193
4.48 Effect of Fluid Brand and Rate of Precipitation on Endurance Time – Type II 75/25 – Light Freezing Rain at -10ºC ................................................................. 195
4.49 Effect of Fluid Brand and Rate of Precipitation on Endurance Time – Type II Neat – Freezing Fog at -3ºC ..................................................................................... 199
4.50 Effect of Fluid Brand and Rate of Precipitation on Endurance Time – Type II 75/25 – Freezing Fog at -3ºC............................................................................ 201
4.51 Effect of Fluid Brand and Rate of Precipitation on Endurance Time – Type II 50/50 – Freezing Fog at -3ºC............................................................................ 201
4.52 Effect of Fluid Brand and Rate of Precipitation on Endurance Time – Type II Neat – Freezing Fog at -14ºC ................................................................................... 203
4.53 Effect of Fluid Brand and Rate of Precipitation on Endurance Time – Type II 75/25 – Freezing Fog at -14ºC.......................................................................... 203
4.54 Effect of Fluid Brand and Rate of Precipitation on Endurance Time – Type II Neat – Freezing Fog at -25ºC ................................................................................... 205
4.55 Effect of Fluid Brand and Rate of Precipitation on Endurance Time – Type II Neat – Rain on Cold-Soaked Surface ......................................................................... 209
4.56 Effect of Fluid Brand and Rate of Precipitation on Endurance Time – Type II 75/25 – Rain on Cold-Soaked Surface ................................................................ 209
4.57 Effect of Fluid Brand and Rate of Precipitation on Endurance Time – Type I Diluted (10º Buffer) – Freezing Drizzle at -10ºC ................................................... 213
4.58 Effect of Fluid Brand and Rate of Precipitation on Endurance Time – Type I Diluted (10º Buffer) – Light Freezing Rain at -10ºC............................................... 215
4.59 Effect of Rate of Precipitation on Endurance Time – Type I Diluted (10º Buffer) – Freezing Fog at -10ºC ...................................................................................... 215
4.60 Effect of Fluid Brand and Rate of Precipitation on Endurance Time – Type I Diluted (10º Buffer) – Freezing Fog at -25ºC ....................................................... 217
4.61 Effect of Fluid Brand and Rate of Precipitation on Endurance Time – Type I Diluted (10° Buffer) – Rain on Cold-Soaked Surface at +1°C ............................... 217
4.62 Effect of Temperature and Rate of Precipitation on Endurance Time – Type I Diluted – Natural Snow Conditions .................................................................... 218
5.1 Effect of Fluid Brand and Rate of Precipitation on Endurance Time – Kilfrost ABC-S Degrated (Neat), Natural Snow................................................................ 238
LIST OF TABLES 1.1 Summary of APS Holdover Time Testing Activities .......................................................... 3 1.2 SAE Type I Fluid Holdover Time Guidelines for Use in 2000-01......................................... 4 1.3 SAE Type II Fluid Holdover Time Guidelines for Use in 2000-01 ........................................ 5 1.4 SAE Type IV Fluid Holdover Time Guidelines for Use in 2000-01....................................... 6 1.5 Kilfrost ABC-II Plus – Viscosity of Neat 100% Fluid Tested: 3 600 cP ............................... 9
LIST OF FIGURES, TABLES, AND PHOTOS
X:\@APS ARCHIVE\CM1680 (exBM3833) TC-Deicing 00-01 (REPORTS ONLY)\Reports\HOT\Final Version 1.0\Final Version 1.0.doc Final Version 1.0
August 05 APS AVIATION INC.
xxii
1.6 Clariant Safewing MPII 1951 – Viscosity of Neat 100% Fluid Tested: 8 700 cP ............... 10 1.7 Clariant Safewing MPIV 1957 – Viscosity of Neat 100% Fluid Tested: 16 200 cP ............ 11 1.8 Clariant Safewing MPIV 2001 – Viscosity of Neat 100% Fluid Tested: 18 000 cP ............ 12 1.9 Clariant Safewing Four – Viscosity of Neat 100% Fluid Tested: 6 400 cP ........................ 13 1.10 Kilfrost ABC-S – Viscosity of Fluid Tested: 17 000 cP ................................................... 14 1.11 Octagon Max-Flight – Viscosity of Neat 100% Fluid Tested: 2 920 cP ............................ 15 1.12 SPCA AD-480 – Viscosity of Neat 100% Fluid Tested: 15 200 cP.................................. 16 1.13 UCAR Ultra+ – Viscosity of Neat 100% Fluid Tested: 36 000 cP ................................... 17 2.1 Definition of Weather Phenomena ................................................................................ 20 2.2 Snow Visibility Chart.................................................................................................. 22 2.3 Detailed Rate Distribution............................................................................................ 38 2.4 End Condition Data Form ............................................................................................ 41 2.5 Meteo/Plate Pan Data Form......................................................................................... 42 2.6 Fluid Request/Receipt ................................................................................................. 45 3.1 Dorval Natural Snow Data........................................................................................... 77 3.2 Distribution of Holdover Time Tests Conducted by Temperature and Precipitation
Rate – Simulated Freezing Drizzle, Light Freezing Rain Tests........................................... 90 3.3 Distribution of Holdover Time Tests Conducted by Temperature and Precipitation
Rate – Simulated Freezing Fog Tests............................................................................ 93 3.4 Distribution of Holdover Time Tests Conducted by Temperature and Precipitation
Rate – Cold-Soak Box Tests........................................................................................ 95 4.1 Fluid Viscosity – Fluids Tested in 2000-01 ................................................................. 101 4.2 WSET Values of Samples Tested – Fluids Tested in 2000-01 ....................................... 101 4.3 Holdover Time Guidelines for Neat Fluid, Above 0°C, Snow ......................................... 108 4.4 Holdover Time Guidelines for 75/25 Fluid, Above 0°C, Snow ....................................... 110 4.5 Holdover Time Guidelines for 50/50 Fluid, Above 0°C, Snow ....................................... 112 4.6 Holdover Time Guidelines for Neat Fluid, 0°C to -3°C, Snow ....................................... 114 4.7 Holdover Time Guidelines for 75/25 Fluid, 0°C to -3°C, Snow ..................................... 116 4.8 Holdover Time Guidelines for 50/50 Fluid, 0°C to -3°C, Snow ..................................... 118 4.9 Holdover Time Guidelines for Neat Fluid, -3°C to -14°C, Snow..................................... 120 4.10 Holdover Time Guidelines for 75/25 Fluid, -3°C to -14°C, Snow .................................. 122 4.11 Holdover Time Guidelines for Neat Fluid, -14°C to -25°C, Snow................................... 124 4.12 Holdover Time Guidelines for Neat Fluid, Above 0°C and 0ºC to -3°C, Freezing
Drizzle ........................................................................................................... 127 4.13 Holdover Time Guidelines for 75/25 Fluid, Above 0°C and 0°C to -3°C, Freezing
Drizzle ........................................................................................................... 129 4.14 Holdover Time Guidelines for 50/50 Fluid, Above 0°C and 0°C to -3°C, Freezing
Drizzle ........................................................................................................... 131 4.15 Holdover Time Guidelines for Neat Fluid, -3°C to -10°C, Freezing Drizzle....................... 133 4.16 Holdover Time Guidelines for 75/25 Fluid, -3°C to -10°C, Freezing Drizzle..................... 135 4.17 Holdover Time Guidelines for Neat Fluid, Above 0°C and 0°C to -3°C, Light
Freezing Rain........................................................................................................... 138 4.18 Holdover Time Guidelines for 75/25 Fluid, Above 0°C and 0°C to -3°C, Light
Freezing Rain........................................................................................................... 140 4.19 Holdover Time Guidelines for 50/50 Fluid, Above 0°C and 0°C to -3°C, Light
Freezing Rain........................................................................................................... 142 4.20 Holdover Time Guidelines for Neat Fluid, -3°C to -10°C, Light Freezing Rain .................. 144 4.21 Holdover Time Guidelines for 75/25 Fluid, -3°C to -10°C, Light Freezing Rain................ 146 4.22 Holdover Time Guidelines for Neat Fluid, Above 0°C and 0°C to -3°C, Freezing Fog...... 150 4.23 Holdover Time Guidelines for 75/25 Fluid, Above 0°C and 0°C to -3°C, Freezing Fog .... 152 4.24 Holdover Time Guidelines for 50/50 Fluid, Above 0°C and 0°C to -3°C, Freezing Fog .... 154 4.25 Holdover Time Guidelines for Neat Fluid, -3°C to -14°C, Freezing Fog........................... 156 4.26 Holdover Time Guidelines for 75/25 Fluid, -3°C to -14°C, Freezing Fog......................... 158 4.27 Holdover Time Guidelines for Neat Fluid, -14°C to -25°C, Freezing Fog......................... 160 4.28 Holdover Time Guidelines for Neat Fluid, Above 0°C, Rain on a Cold-Soaked Wing
(ROCSW) ................................................................................................................ 163
LIST OF FIGURES, TABLES, AND PHOTOS
X:\@APS ARCHIVE\CM1680 (exBM3833) TC-Deicing 00-01 (REPORTS ONLY)\Reports\HOT\Final Version 1.0\Final Version 1.0.doc Final Version 1.0
August 05 APS AVIATION INC.
xxiii
4.29 Holdover Time Guidelines for 75/25 Fluid, Above 0°C, ROCSW.................................... 165 4.30 Fluids Responsible for the SAE Type IV Fluid Holdover Time Table Values ...................... 168 4.31 Holdover Time Guidelines for Neat Fluid, Above 0°C, Snow ......................................... 171 4.32 Holdover Time Guidelines for 75/25 Fluid, Above 0°C, Snow ....................................... 171 4.33 Holdover Time Guidelines for 50/50 Fluid, Above 0°C, Snow ....................................... 173 4.34 Holdover Time Guidelines for Neat Fluid, 0°C to -3°C, Snow ....................................... 173 4.35 Holdover Time Guidelines for 75/25 Fluid, 0°C to -3°C, Snow ..................................... 175 4.36 Holdover Time Guidelines for 50/50 Fluid, 0°C to -3°C, Snow ..................................... 175 4.37 Holdover Time Guidelines for Neat Fluid, -3°C to -14°C, Snow..................................... 177 4.38 Holdover Time Guidelines for 75/25 Fluid, -3°C to -14°C, Snow .................................. 177 4.39 Holdover Time Guidelines for Neat Fluid, -14°C to -25°C, Snow................................... 179 4.40 Holdover Time Guidelines for Neat Fluid, Above 0°C and 0°C to -3°C, Freezing
Drizzle ........................................................................................................... 182 4.41 Holdover Time Guidelines for 75/25 Fluid, Above 0°C and 0°C to -3°C, Freezing
Drizzle ........................................................................................................... 182 4.42 Holdover Time Guidelines for 50/50 Fluid, Above 0°C and 0°C to -3°C, Freezing
Drizzle ........................................................................................................... 184 4.43 Holdover Time Guidelines for Neat Fluid, -3°C to -10°C, Freezing Drizzle....................... 184 4.44 Holdover Time Guidelines for 75/25 Fluid, -3°C to -10°C, Freezing Drizzle..................... 186 4.45 Holdover Time Guidelines for Neat Fluid, Above 0°C and 0ºC to -3°C, Light Freezing
Rain ....................................................................................................................... 190 4.46 Holdover Time Guidelines for 75/25 Fluid, Above 0°C and 0ºC to -3°C, Light
Freezing Rain........................................................................................................... 190 4.47 Holdover Time Guidelines for 50/50 Fluid, Above 0°C and 0ºC to -3°C, Light
Freezing Rain........................................................................................................... 192 4.48 Holdover Time Guidelines for Neat Fluid, -3°C to -10°C, Light Freezing Rain .................. 192 4.49 Holdover Time Guidelines for 75/25 Fluid, -3°C to -10°C, Light Freezing Rain................ 194 4.50 Holdover Time Guidelines for Neat Fluid, Above 0°C, Freezing Fog ............................... 197 4.51 Holdover Time Guidelines for 75/25 Fluid, Above 0°C, Freezing Fog ............................. 197 4.52 Holdover Time Guidelines for 50/50 Fluid, Above 0°C, Freezing Fog ............................. 198 4.53 Holdover Time Guidelines for Neat Fluid, 0°C to -3°C, Freezing Fog.............................. 198 4.54 Holdover Time Guidelines for 75/25 Fluid, 0°C to -3°C, Freezing Fog............................ 200 4.55 Holdover Time Guidelines for 50/50 Fluid, 0°C to -3°C, Freezing Fog............................ 200 4.56 Holdover Time Guidelines for Neat Fluid, -3°C to -14°C, Freezing Fog........................... 202 4.57 Holdover Time Guidelines for 75/25 Fluid, -3°C to -14°C, Freezing Fog......................... 202 4.58 Holdover Time Guidelines for Neat Fluid, -14°C to -25°C, Freezing Fog......................... 204 4.59 Holdover Time Guidelines for Neat Fluid, Above 0°C, ROCSW...................................... 208 4.60 Holdover Time Guidelines for 75/25 Fluid, Above 0°C, ROCSW.................................... 208 4.61 WSET Values of the Type I Samples Tested................................................................ 211 4.62 Generic Type I Fluid Holdover time Guidelines for Use in 2001-02................................. 222 4.63 SAE Type I Holdover Time Guidelines for Winter 2001-2002 ........................................ 223 4.64 Generic Type II Fluid Holdover Time Guidelines for Use in 2001-02 ............................... 224 4.65 Fluid-Specific Type II Fluid Holdover Time Guidelines for 2001-02 – Kilfrost ABC-II
Plus ........................................................................................................... 225 4.66 Fluid-Specific Type II Fluid Holdover Time Guidelines for 2001-02 – Clariant
Safewing MPII 1951 ................................................................................................ 226 4.67 Fluid-Specific Type II Fluid Holdover Time Guidelines for 2001-02 – SPCA
Ecowing 26 ........................................................................................................... 227 4.68 Generic Type IV Fluid Holdover Time Guidelines for Use in 2001-02 .............................. 228 4.69 Fluid-Specific Type IV Fluid Holdover Time Guidelines for 2001-02 – Clariant
Safewing MPIV 1957 ............................................................................................... 229 4.70 Fluid-Specific Type IV Fluid Holdover Time Guidelines for 2001-02 – Clariant
Safewing MPIV 2001 ............................................................................................... 230 4.71 Fluid-Specific Type IV Fluid Holdover Time Guidelines for 2001-02 – Clariant
Safewing Four ......................................................................................................... 231

LIST OF FIGURES, TABLES, AND PHOTOS
X:\@APS ARCHIVE\CM1680 (exBM3833) TC-Deicing 00-01 (REPORTS ONLY)\Reports\HOT\Final Version 1.0\Final Version 1.0.doc Final Version 1.0
August 05 APS AVIATION INC.
xxiv
4.72 Fluid-Specific Type IV Fluid Holdover Time Guidelines for 2001-02 – Clariant MP IV Protect 2012........................................................................................................... 232
4.73 Fluid-Specific Type IV Fluid Holdover Time Guidelines for 2001-02 – Kilfrost ABC-S ....... 233 4.74 Fluid-Specific Type IV Fluid Holdover Time Guidelines for 2001-02 – Octagon Max-
Flight...................................................................................................................... 234 4.75 Fluid-Specific Type IV Fluid Holdover Time Guidelines for 2001-02 – SPCA AD-480 ....... 235 4.76 Fluid-Specific Type IV Fluid Holdover Time Guidelines for 2001-02 – Dow UCAR
Ultra+.................................................................................................................... 236 5.1 Round-Robin Testing – Simulated Freezing Precipitation at NRC-CEF (2000-01) .............. 240 LIST OF PHOTOS
Page 2.1 View of Dorval Test Site and Associated Equipment............................................... 59 2.2 Environment Canada’s Weather Observation Station at Dorval Airport....................... 59 2.3 Outdoor View of National Research Council Canada’s Climatic Engineering
Facility............................................................................................................. 61 2.4 Inside View of Small End of Climatic Engineering Facility ........................................ 61 2.5 Inside View of Large End of Climatic Engineering Facility ........................................ 63 2.6 Sprayer Assembly Used at National Research Council Canada.................................. 63 2.7 Sprayer Nozzle.................................................................................................. 65 2.8 Optical Gauge Manufactured by HSS To Measure Droplet Size................................. 65 2.9 Examples of Droplet Sizes Produced by National Research Council Canada’s
Spray System ................................................................................................... 67 2.10 Test Plates Mounted on a Stand .......................................................................... 67 2.11 Collection Pans Used Indoors at National Research Council Canada .......................... 69 2.12 Digital Clock Used in Holdover Time Testing.......................................................... 69 2.13 Misco Refractometer Used to Measure Fluid Freeze Point ........................................ 71 2.14 Meteorological Services Canada’s Automated Weather Station Instruments ............... 71 2.15 Snow Fence Used in Freezing Fog Tests to Reduce Air Currents .............................. 73

GLOSSARY
X:\@APS ARCHIVE\CM1680 (exBM3833) TC-Deicing 00-01 (REPORTS ONLY)\Reports\HOT\Final Version 1.0\Final Version 1.0.doc Final Version 1.0
August 05 APS AVIATION INC.
xxv
GLOSSARY AMIL Anti-icing Materials International Laboratory APS APS Aviation Inc. AS Aerospace Standard (Proposed) C/FIMS Contaminant/Fluid Integrity Monitoring System CEF Climatic Engineering Facility cP Centipoise DEG Diethylene Glycol EG Ethylene Glycol FAA Federal Aviation Administration GPM Gallons Per Minute HHET High Humidity Endurance Time HSS Biral UK (acquired the HSS technology) IREQ Institut de Recherche d’Hydro-Québec ISO International Organization for Standardization LOUT Lowest Operational Use Temperature LWC Liquid Water Content MSC Meteorological Service of Canada (as of 2000), formerly
known as Atmospheric Environmental Services (AES). MVD Median Volume Diameter NCAR National Center for Atmospheric Research NRC Canada National Research Council Canada OAT Outside Air Temperature PG Propylene Glycol POSS Precipitation Occurrence Sensing System READAC Remote Environmental Automatic Data Acquisition Concept ROCSW Rain on a Cold-Soaked Wing RPM Revolutions Per Minute SAE Society of Automotive Engineers TDC Transportation Development Centre UCAR Union Carbide Corporation WSET Water Spray Endurance Time

xxvi
This page intentionally left blank.

1. INTRODUCTION
X:\@APS ARCHIVE\CM1680 (exBM3833) TC-Deicing 00-01 (REPORTS ONLY)\Reports\HOT\Final Version 1.0\Final Version 1.0.doc Final Version 1.0
August 05APS AVIATION INC.
1
1. INTRODUCTION Under contract to the Transportation Development Centre (TDC) of Transport Canada and co-sponsored by the U.S. Federal Aviation Administration (FAA), APS Aviation Inc. (APS) has undertaken a research project to further advance ground aircraft de/anti-icing technology. This project involved the participation of TDC, Transport Canada, National Research Council Canada (NRC), the FAA, the Meteorological Service of Canada (MSC), and several de/anti-icing fluid manufacturers. Aircraft ground de/anti-icing has been the subject of concentrated industry attention over the past decade due the occurrence of several fatal icing-related aircraft accidents. Recent attention has been focused on the enhancement of anti-icing fluids to provide an extended period of protection against further contamination following initial deicing. This emphasis has led to the development of de/anti-icing fluid holdover time guidelines for use by aircraft operators and accepted by regulatory authorities. New anti-icing formulations continue to be developed by leading manufacturers, with the specific objective of prolonging fluid holdover times without compromising the aerodynamic features of the airfoil. More recently, fluid manufacturers have reformulated fluids in an effort to reduce environmental concerns and to improve characteristics such as fluid stability. Flat plate tests, conducted in natural and simulated precipitation, are used to develop and substantiate fluid holdover time guidelines for current fluids and new formulations. Test procedures to measure the duration of fluid protection against ice formation have evolved into a refined standard approach that has been followed by APS and others at a number of locations in previous years. The tests provide endurance times using a visual fluid failure criterion and are then converted to holdover times based on correlations between the visual fluid failures on flat plates and similar fluid failures on wing surfaces. Aircraft are deiced using heated Type I fluids. These fluids are excellent for the removal of existing contamination on aircraft wings; however, they provide limited protection against further ice accumulation. Anti-icing fluids are applied following aircraft deicing. Type II fluids are thicker and more viscous than Type I deicing fluids. They form a thicker layer on application and provide a longer duration of protection against further contamination. Type III is an anti-icing fluid developed with shear and flow properties designed for aircraft with slower rotation speeds. Type IV fluids are the latest generation of anti-icing fluids and are designed to provide the best holdover time protection. The results of tests conducted during the 2000-01 winter season with Type I, Type II, and Type IV fluids constitute the major focus of this report. No Type III fluids were tested. All Type II and Type IV anti-icing fluid tests were conducted using pre-sheared

1. INTRODUCTION
X:\@APS ARCHIVE\CM1680 (exBM3833) TC-Deicing 00-01 (REPORTS ONLY)\Reports\HOT\Final Version 1.0\Final Version 1.0.doc Final Version 1.0
August 05APS AVIATION INC.
2
fluid samples selected by the manufacturers according to new sample selection procedures, which are outlined in Proposed SAE Aerospace Standard 5485 [1]. Type I fluids were diluted to a 10°C buffer prior to testing. Testing of these fluids has resulted in the generation of holdover time tables. These tables provide guidelines for use in departure planning in adverse winter weather conditions. They provide the holdover time ranges for aircraft treated with any particular qualified deicing or anti-icing fluid. A new data analysis protocol was developed in 1996-97. In each cell of the holdover time tables, the failure data for each fluid brand were subjected to a multi-variable regression analysis. The new Type II and Type IV fluid holdover times, obtained during the 2000-01 test season, were determined using this method, resulting in the generation of one generic fluid table for Type II and Type IV, three fluid-specific Type II tables, and eight fluid-specific Type IV tables. These tables are presented in Section 4. The generic holdover time guidelines for Type I, Type II, and Type IV fluids have traditionally been published by the Society of Automotive Engineers (SAE). Prior to the SAE G-12 meetings in New Orleans in May 2001, SAE informed the industry that it would no longer publish this information. The generic and fluid-specific guidelines are now published by the regulatory agencies. Over the past few years, APS has completed considerable testing on behalf of Transport Canada. These tests have related to the determination of fluid holdover times and the substantiation of holdover time tables, as well as general research and development of deicing technology. A summary of the research related to fluid holdover times is provided in Table 1.1. 1.1 Holdover Time Tables The holdover time guidelines provided to operators for use during the 2000-01 winter season are shown in Tables 1.2 to 1.4. Table 1.2 gives the holdover times for Type I fluids, Table 1.3 provides the generic or SAE table for Type II fluids, and Table 1.4 displays the generic or SAE table for Type IV fluids. These generic tables were also the last published by SAE for the industry. All holdover time tables are composed of cells. Each cell contains a holdover time range for a specific fluid type and dilution, temperature range, and category of precipitation. The time range in each cell is defined by a "lower" time and an "upper" time; these values represent the average failure time of the fluid at upper and lower precipitation rate limits, respectively. These limits are defined in Subsection 2.9 for all categories of precipitation.

TABLE 1.1SUMMARY OF APS HOLDOVER TIME TESTING ACTIVITIES
Year Transport CanadaPublication # Conditions Tested Primary Fluids Tested Location of Testing
1990-91 TP 11206E • Natural Precipitation (mostly snow) Type II (100%) Mostly Dorval, worldwide
1991-92 TP 11454E • Natural Precipitation (mostly snow) Type III Mostly Dorval, St. John's
1992-93 TP 11836E • Natural Precipitation (snow) • Simulated Freezing Drizzle (preliminary) • Simulated Freezing Fog (outdoor)
Type I (Standard) Dorval and Ottawa (NRC)
1993-94 TP 12915EWill soon be published
• Natural Precipitation • Simulated Freezing Drizzle • Simulated Light Freezing Rain • Simulated Freezing Fog (outdoor)
Type II (75/25, 50/50) Dorval and Ottawa (NRC)
1994-95 TP 12654E
• Natural Precipitation • Simulated Freezing Drizzle • Simulated Light Freezing Rain • Simulated Freezing Fog (indoor) • Rain on a Cold-Soaked Surface (preliminary)
• Type I (Diluted for 10ºC buffer) • Type IV (Preliminary) Dorval and Ottawa (NRC)
1995-96 TP 12896E
• Natural Precipitation • Simulated Freezing Drizzle • Simulated Light Freezing Rain • Simulated Freezing Fog (indoor) • Rain on a Cold-Soaked Surface
Type IV Dorval and Ottawa (NRC)
1996/97 TP 13131E
• Natural Precipitation • Simulated Freezing Drizzle • Simulated Light Freezing Rain • Simulated Freezing Fog (indoor) • Rain on a Cold-Soaked Surface
• New Type IVs • Type III Dorval and Ottawa (NRC)
1997-98 TP 13318E
• Natural Precipitation • Simulated Freezing Drizzle • Simulated Light Freezing Rain • Simulated Freezing Fog (indoor) • Rain on a Cold-Soaked Surface
• New Type IVs Dorval and Ottawa (NRC)
1998-99 TP 13477E
• Natural Precipitation • Simulated Freezing Drizzle • Simulated Light Freezing Rain • Simulated Freezing Fog (indoor) • Rain on a Cold-Soaked Surface • Simulated Snow
• Low Viscosity Type IVs• Type II• Type I
Dorval and Ottawa (NRC)
1999-2000 TP 13659E
• Natural Precipitation • Simulated Freezing Drizzle • Simulated Light Freezing Rain • Simulated Freezing Fog (indoor) • Rain on a Cold-Soaked Surface • Simulated Snow • Preliminary Frost
• Type IV• Type II• Type I
Dorval and Ottawa (NRC)Varennes (IREQ)
2000-01 TP 13826E
• Natural Precipitation • Simulated Freezing Drizzle • Simulated Light Freezing Rain • Simulated Freezing Fog (indoor) • Rain on a Cold-Soaked Surface • Simulated Snow • Preliminary Frost
• Type IV• Type II• Type I
Dorval and Ottawa (NRC)Varennes (IREQ)
3 M:\cm1680\report\holdover time\APS_SUMM
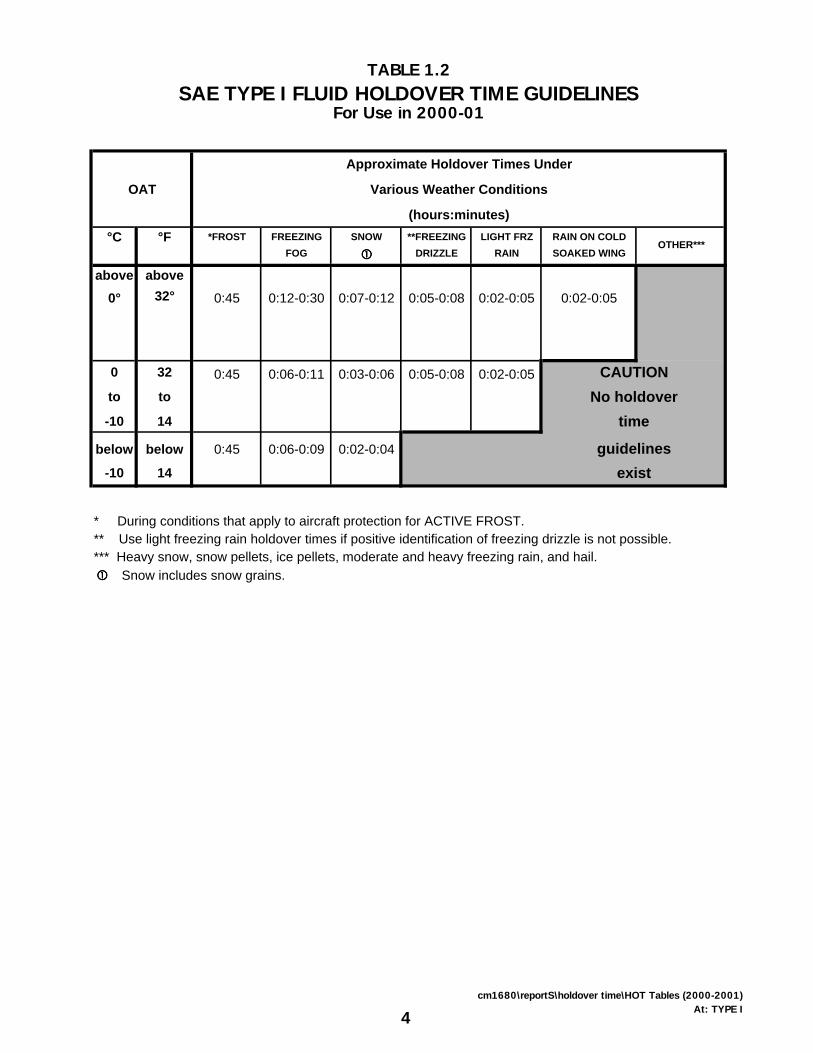
TABLE 1.2SAE TYPE I FLUID HOLDOVER TIME GUIDELINES
For Use in 2000-01
Approximate Holdover Times Under
OAT Various Weather Conditions
(hours:minutes)°C °F *FROST FREEZING SNOW **FREEZING LIGHT FRZ RAIN ON COLD
FOG ���� DRIZZLE RAIN SOAKED WING
above above0° 32° 0:45 0:12-0:30 0:07-0:12 0:05-0:08 0:02-0:05 0:02-0:05
0 32 0:45 0:06-0:11 0:03-0:06 0:05-0:08 0:02-0:05 CAUTIONto to No holdover-10 14 time
below below 0:45 0:06-0:09 0:02-0:04 guidelines-10 14 exist
* During conditions that apply to aircraft protection for ACTIVE FROST.** Use light freezing rain holdover times if positive identification of freezing drizzle is not possible.*** Heavy snow, snow pellets, ice pellets, moderate and heavy freezing rain, and hail.� � � � Snow includes snow grains.
OTHER***
4cm1680\reportS\holdover time\HOT Tables (2000-2001)
At: TYPE I

TABLE 1.3SAE TYPE II FLUID HOLDOVER TIME GUIDELINES
For Use in 2000-01
Approximate Holdover Times Under
OAT SAE Type II Fluid Various Weather Conditions
Concentration (hours:minutes)°C °F Neat Fluid/Water *FROST FREEZING SNOW ***FREEZING LIGHT FRZ RAIN ON COLD OTHER****
(Vol%/Vol%) FOG ���� DRIZZLE RAIN SOAKED WING
100/0 12:00 0:35-1:30 0:20-0:55 0:30-0:55 0:15-0:30 0:05-0:40
above above 75/25 6:00 0:25-1:00 0:15-0:40 0:20-0:45 0:10-0:25 0:05-0:25
0° 32° 50/50 4:00 0:15-0:30 0:05-0:15 0:05-0:15 0:05-0:10
100/0 8:00 0:35-1:30 0:20-0:45 0:30-0:55 0:15-0:30
CAUTION0 32 75/25 5:00 0:25-1:00 0:15-0:30 0:20-0:45 0:10-0:25to to No holdover-3 27 50/50 3:00 0:15-0:30 0:05-0:15 0:05-0:15 0:05-0:10
timebelow below 100/0 8:00 0:20-1:05 0:15-0:35 **0:15-0:45 **0:10-0:30
-3 27 guidelinesto to 75/25 5:00 0:20-0:55 0:15-0:25 **0:15-0:30 **0:10-0:20-14 7 exist
below below
-14 7 100/0 8:00 0:15-0:20 0:15-0:30
to to-25 -13
below below SAE TYPE II fluid may be used below -25ºC (-13ºF) provided the freezing point of the
-25 -13 100/0 fluid is at least 7ºC (13ºF) below the OAT and the aerodynamic acceptance criteria are
met. Consider use of SAE Type I when SAE Type II fluid cannot be used.
* During conditions that apply to aircraft protection for ACTIVE FROST.** The lowest use temperature is limited to -10ºC (14ºF).*** Use light freezing rain holdover times if positive identification of freezing drizzle is not possible.**** Heavy snow, snow pellets, ice pellets, moderate and heavy freezing rain, and hail.� � � � Snow includes snow grains.
5CM1680/reports/holdover time/HOT Tables (2000-2001)
At: SAE TYPE II

TABLE 1.4SAE TYPE IV FLUID HOLDOVER TIME GUIDELINES
For Use in 2000-01
Approximate Holdover Times Anticipated Under
OAT Type IV Fluid Various Weather ConditionsConcentration (hours:minutes)
°C °F Neat Fluid/Water *FROST FREEZING SNOW ***FREEZING LIGHT FRZ RAIN ON COLD OTHER****
(% by volume) FOG ���� DRIZZLE RAIN SOAKED WING
100/0 18:00 1:05-2:15 0:35-1:05 0:40-1:00 0:25-0:40 0:10-0:50
above above 75/25 6:00 1:05-1:45 0:20-0:40 0:30-1:00 0:15-0:30 0:05-0:35
0º 32º
50/50 4:00 0:15-0:35 0:05-0:20 0:10-0:20 0:05-0:10
100/0 12:00 1:05-2:15 0:30-0:55 0:40-1:00 0:25-0:40
CAUTION0 32 75/25 5:00 1:05-1:45 0:20-0:35 0:30-1:00 0:15-0:30
to to No holdover-3 27 50/50 3:00 0:15-0:35 0:05-0:15 0:10-0:20 0:05-0:10
timebelow below 100/0 12:00 0:20-1:20 0:20-0:40 **0:20-0:55 **0:10-0:30
-3 27 guidelinesto to 75/25 5:00 0:25-0:50 0:15-0:25 **0:20-0:50 **0:10-0:25-14 7 exist
below below-14 7 100/0 12:00 0:15-0:40 0:15-0:30
to to-25 -13
below below SAE TYPE IV fluid may be used below -25ºC (-13ºF) provided the freezing point-25 -13 100/0 of the fluid is at least 7ºC (13ºF) below the OAT and the aerodynamic acceptance
criteria are met. Consider use of SAE Type I when SAE Type IV fluid cannot be used.
* During conditions that apply to aircraft protection for ACTIVE FROST.** The lowest use temperature is limited to -10ºC (14ºF).*** Use light freezing rain holdover times if positive identification of freezing drizzle is not possible.**** Heavy snow, snow pellets, ice pellets, moderate and heavy freezing rain, and hail� � � � Snow includes snow grains.
6cm1680\reports\holdover time\HOT Tables (2000-2001)
At:SAE Type IV

1. INTRODUCTION
X:\@APS ARCHIVE\CM1680 (exBM3833) TC-Deicing 00-01 (REPORTS ONLY)\Reports\HOT\Final Version 1.0\Final Version 1.0.doc Final Version 1.0
August 05APS AVIATION INC.
7
The holdover time guidelines shown in this section are shown in the 1999-2000 Transport Canada report, TP 13659E (2). Analysis of the Type IV data from the 1996-97 test season revealed a need to develop fluid-specific holdover time tables in addition to a generic or worst-case SAE fluid holdover time table, due to wide variations in the performance of the different Type IV fluids tested. Results of subsequent testing with Type II and Type IV fluids also indicated a requirement for generic and fluid-specific holdover time tables. The generic table encompasses the performance behaviour of all qualified fluids. The fluid-specific holdover time tables were generated for two Type II fluids, Kilfrost ABC-II Plus and Clariant MPII 1951, and seven Type IV fluids, Clariant MPIV 1957, Clariant MPIV 2001, Clariant Safewing Four, Kilfrost ABC-S, Octagon Max-Flight, SPCA AD-480, and Union Carbide Ultra+. These for fluid-specific holdover times are given in Tables 1.5 to 1.13 at the end of this section.
The primary effort of the 2000-01 winter study was directed toward the comprehensive testing of new Type I, Type II, and Type IV fluids in various natural and artificial conditions and locations. Extensive testing in natural snow was conducted by APS Aviation at the Dorval Airport test site. Tests in conditions of simulated freezing drizzle, light freezing rain, freezing fog, and rain on a cold-soaked surface were conducted at NRC’s Climatic Engineering Facility (CEF) in Ottawa.
The holdover time values in the frost columns of the various holdover time tables have been determined by the SAE G-12 Holdover Time Subcommittee using the results of high humidity endurance time (HHET) tests conducted as part of the fluid certification process. APS had not conducted holdover time tests in simulated frost conditions prior to the 1999-2000 test season. Preliminary tests in simulated frost conditions were conducted by APS at the Institut de Recherche d’Hydro-Québec (IREQ) high humidity chamber in Varennes to determine the capabilities of this chamber for future tests in conditions of simulated frost. The results of these tests are presented in Transport Canada report TP 13659E [2]. Additional testing in frost conditions was performed by APS during 2000-01. The results of these tests appear in an associated report, TP 13831E [3].
In total, 812 holdover time tests were conducted during the 2000-01 test season. The results of flat plate and cold-soak box endurance time tests were presented to the SAE G-12 Holdover Time Subcommittee in New Orleans, where they were reviewed and discussed. New holdover time guidelines, based largely on this work, were proposed and accepted by the SAE G-12 Committee. These tables were implemented worldwide for the 2001-02 winter season. The tables are presented in Subsection 4.6.

1. INTRODUCTION
X:\@APS ARCHIVE\CM1680 (exBM3833) TC-Deicing 00-01 (REPORTS ONLY)\Reports\HOT\Final Version 1.0\Final Version 1.0.doc Final Version 1.0
August 05APS AVIATION INC.
8
1.2 Objectives The detailed objectives of the holdover time test program for the 2000-01 winter season are provided in the work statement given in Appendix A. The primary objective of the test program was to conduct flat plate tests under conditions of natural and simulated precipitation to record the endurance times, and to develop individual holdover time tables based on samples of newly and previously qualified deicing and anti-icing fluids. 1.3 Report Format The following list provides short descriptions of subsequent sections of this report:
• Section 2 describes the test conditions and methodologies used, as well as equipment and personnel requirements necessary to carry out testing;
• Section 3 describes the different conditions in which data were collected; • Section 4 discusses endurance time testing data and results. The most
recently generated, proposed, and accepted generic and fluid-specific holdover time tables designed for use during the 2001-02 winter season are also presented;
• Section 5 presents results and general information related to
supplementary tests performed during the 2000-01 winter test season; • Section 6 presents conclusions derived from the complete test program;
and • Section 7 lists recommendations for future testing.
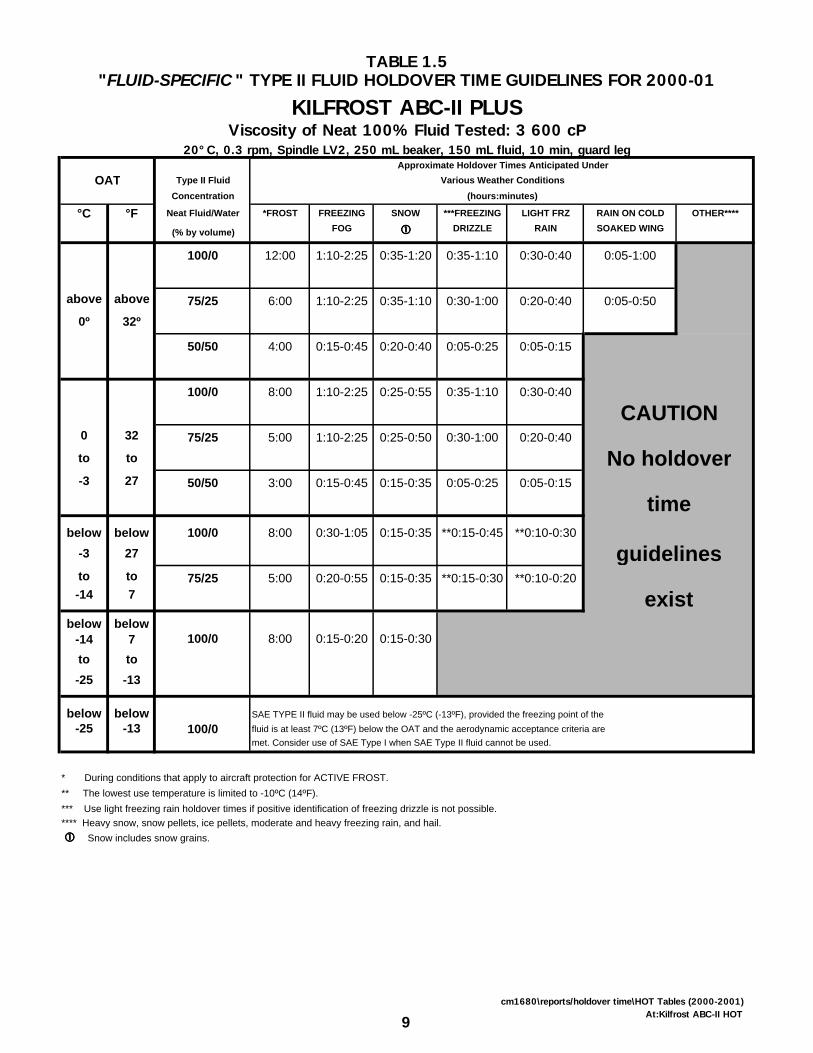
TABLE 1.5"FLUID-SPECIFIC " TYPE II FLUID HOLDOVER TIME GUIDELINES FOR 2000-01
KILFROST ABC-II PLUSViscosity of Neat 100% Fluid Tested: 3 600 cP
20°C, 0.3 rpm, Spindle LV2, 250 mL beaker, 150 mL fluid, 10 min, guard legApproximate Holdover Times Anticipated Under
OAT Type II Fluid Various Weather ConditionsConcentration (hours:minutes)
°C °F Neat Fluid/Water *FROST FREEZING SNOW ***FREEZING LIGHT FRZ RAIN ON COLD OTHER****
(% by volume) FOG ���� DRIZZLE RAIN SOAKED WING
100/0 12:00 1:10-2:25 0:35-1:20 0:35-1:10 0:30-0:40 0:05-1:00
above above 75/25 6:00 1:10-2:25 0:35-1:10 0:30-1:00 0:20-0:40 0:05-0:50
0º 32º
50/50 4:00 0:15-0:45 0:20-0:40 0:05-0:25 0:05-0:15
100/0 8:00 1:10-2:25 0:25-0:55 0:35-1:10 0:30-0:40
CAUTION0 32 75/25 5:00 1:10-2:25 0:25-0:50 0:30-1:00 0:20-0:40
to to No holdover-3 27 50/50 3:00 0:15-0:45 0:15-0:35 0:05-0:25 0:05-0:15
timebelow below 100/0 8:00 0:30-1:05 0:15-0:35 **0:15-0:45 **0:10-0:30
-3 27 guidelinesto to 75/25 5:00 0:20-0:55 0:15-0:35 **0:15-0:30 **0:10-0:20-14 7 exist
below below-14 7 100/0 8:00 0:15-0:20 0:15-0:30
to to-25 -13
below below SAE TYPE II fluid may be used below -25ºC (-13ºF), provided the freezing point of the-25 -13 100/0 fluid is at least 7ºC (13ºF) below the OAT and the aerodynamic acceptance criteria are
met. Consider use of SAE Type I when SAE Type II fluid cannot be used.
* During conditions that apply to aircraft protection for ACTIVE FROST.** The lowest use temperature is limited to -10ºC (14ºF).*** Use light freezing rain holdover times if positive identification of freezing drizzle is not possible.**** Heavy snow, snow pellets, ice pellets, moderate and heavy freezing rain, and hail.� � � � Snow includes snow grains.
9cm1680\reports/holdover time\HOT Tables (2000-2001)
At:Kilfrost ABC-II HOT

TABLE 1.6"FLUID-SPECIFIC " TYPE II FLUID HOLDOVER TIME GUIDELINES FOR 2000-01
CLARIANT SAFEWING MPII 1951Viscosity of Neat 100% Fluid Tested: 8 700 cP
20°C, 0.3 rpm, Spindle SC4-34/13R, 10 mL fluid, 15 minApproximate Holdover Times Anticipated Under
OAT Type IV Fluid Various Weather ConditionsConcentration (hours:minutes)
°C °F Neat Fluid/Water *FROST FREEZING SNOW ***FREEZING LIGHT FRZ RAIN ON COLD OTHER****
(% by volume) FOG ���� DRIZZLE RAIN SOAKED WING
100/0 12:00 0:55-1:40 0:30-0:55 0:35-0:55 0:20-0:30 0:10-0:50
above above 75/25 6:00 0:45-1:15 0:20-0:40 0:25-0:45 0:15-0:25 0:05-0:40
0º 32º
50/50 4:00 0:20-0:30 0:05-0:20 0:05-0:15 0:05-0:10
100/0 8:00 0:55-1:40 0:25-0:45 0:35-0:55 0:20-0:30
CAUTION0 32 75/25 5:00 0:45-1:15 0:15-0:35 0:25-0:45 0:15-0:25
to to No holdover-3 27 50/50 3:00 0:20-0:30 0:05-0:15 0:05-0:15 0:05-0:10
timebelow below 100/0 8:00 0:45-1:25 0:20-0:40 **0:25-0:50 **0:15-0:30
-3 27 guidelinesto to 75/25 5:00 0:35-1:00 0:15-0:25 **0:20-0:35 **0:15-0:20-14 7 exist
below below-14 7 100/0 8:00 0:20-0:40 0:20-0:35
to to-25 -13
below below SAE TYPE II fluid may be used below -25ºC (-13ºF), provided the freezing point of the
-25 -13 100/0 fluid is at least 7ºC (13ºF) below the OAT and the aerodynamic acceptance criteria are
met. Consider use of SAE Type I when SAE Type II fluid cannot be used.
* During conditions that apply to aircraft protection for ACTIVE FROST.** The lowest use temperature is limited to -10ºC (14ºF).*** Use light freezing rain holdover times if positive identification of freezing drizzle is not possible.**** Heavy snow, snow pellets, ice pellets, moderate and heavy freezing rain, and hail.� � � � Snow includes snow grains.
10cm1680/reports/holdover time/HOT Tables (2000-2001)
At: Clariant 1951

TABLE 1.7"FLUID-SPECIFIC " TYPE IV FLUID HOLDOVER TIME GUIDELINES FOR 2000-01
CLARIANT SAFEWING MPIV 1957Viscosity of Neat 100% Fluid Tested: 16 200 cP
20°C, 0.3 rpm, Spindle SC4-34/13R, 10 mL fluid, 15 minApproximate Holdover Times Anticipated Under
OAT Type IV Fluid Various Weather ConditionsConcentration (hours:minutes)
°C °F Neat Fluid/Water *FROST FREEZING SNOW ***FREEZING LIGHT FRZ RAIN ON COLD OTHER****
(% by volume) FOG ���� DRIZZLE RAIN SOAKED WING
100/0 18:00 1:05-2:15 0:35-1:05 0:40-1:10 0:30-0:45 0:15-1:10
above above 75/25 6:00 1:10-2:10 0:35-1:05 0:35-1:05 0:25-0:40 0:10-1:00
0º 32º
50/50 4:00 0:25-0:50 0:15-0:30 0:15-0:25 0:05-0:15
100/0 12:00 1:05-2:15 0:30-0:55 0:40-1:10 0:30-0:45
CAUTION0 32 75/25 5:00 1:10-2:10 0:30-0:50 0:35-1:05 0:25-0:40
to to No holdover-3 27 50/50 3:00 0:25-0:50 0:10-0:20 0:15-0:25 0:05-0:15
timebelow below 100/0 12:00 0:45-1:30 0:30-0:50 **0:35-0:55 **0:20-0:35
-3 27 guidelinesto to 75/25 5:00 0:25-1:10 0:20-0:40 **0:25-0:55 **0:15-0:30-14 7 exist
below below-14 7 100/0 12:00 0:25-0:40 0:25-0:45
to to-25 -13
below below SAE TYPE IV fluid may be used below -25ºC (-13ºF), provided the freezing point-25 -13 100/0 of the fluid is at least 7ºC (13ºF) below the OAT and the aerodynamic acceptance
criteria are met. Consider use of SAE Type I when SAE Type IV fluid cannot be used.
* During conditions that apply to aircraft protection for ACTIVE FROST.** The lowest use temperature is limited to -10ºC (14ºF).*** Use light freezing rain holdover times if positive identification of freezing drizzle is not possible.**** Heavy snow, snow pellets, ice pellets, moderate and heavy freezing rain, and hail.� � � � Snow includes snow grains.
11cm1680\reports\holdover time\HOT Tables (2000-2001)
At:Clariant 1957

TABLE 1.8"FLUID-SPECIFIC " TYPE IV FLUID HOLDOVER TIME GUIDELINES FOR 2000-01
CLARIANT SAFEWING MPIV 2001Viscosity of Neat 100% Fluid Tested: 18 000 cP
20°C, 0.3 rpm, Spindle SC4-34/13R, 10 mL fluid, 15 minApproximate Holdover Times Anticipated Under
OAT Type IV Fluid Various Weather ConditionsConcentration (hours:minutes)
°C °F NeatFluid/Water *FROST FREEZING SNOW ***FREEZING LIGHT FRZ RAIN ON COLD OTHER****
(% by volume) FOG ���� DRIZZLE RAIN SOAKED WING
100/0 18:00 1:20-3:20 1:55-2:00 0:55-1:55 0:40-1:00 0:15-2:00
above above 75/25 6:00 1:20-2:00 0:50-1:25 0:35-1:10 0:25-0:35 0:10-1:250º 32º
50/50 4:00 0:15-0:40 0:10-0:20 0:10-0:20 0:05-0:15
100/0 12:00 1:20-3:20 1:00-1:55 0:55-1:55 0:40-1:00
CAUTION0 32 75/25 5:00 1:20-2:00 0:35-1:00 0:35-1:10 0:25-0:35to to No holdover-3 27 50/50 3:00 0:15-0:40 0:10-0:20 0:10-0:20 0:05-0:15
timebelow below 100/0 12:00 0:45-1:35 0:30-0:50 **0:55-1:35 **0:30-0:45
-3 27 guidelinesto to 75/25 5:00 0:30-1:00 0:20-0:35 **0:40-1:10 **0:20-0:30-14 7 exist
below below-14 7 100/0 12:00 0:20-0:45 0:20-0:35
to to-25 -13
below below SAE TYPE IV fluid may be used below -25ºC (-13ºF), provided the freezing point-25 -13 100/0 of the fluid is at least 7ºC (13ºF) below the OAT and the aerodynamic acceptance
criteria are met. Consider use of SAE Type I when SAE Type IV fluid cannot be used.
* During conditions that apply to aircraft protection for ACTIVE FROST.** The lowest use temperature is limited to -10ºC (14ºF).*** Use light freezing rain holdover times if positive identification of freezing drizzle is not possible.**** Heavy snow, snow pellets, ice pellets, moderate and heavy freezing rain, and hail.
� � � � Snow includes snow grains.
12cm1680\reports\holdover time\HOT Tables (2000-2001)
At:Clariant 2001

TABLE 1.9"FLUID-SPECIFIC " TYPE IV FLUID HOLDOVER TIME GUIDELINES FOR 2000-01
CLARIANT SAFEWING FOURViscosity of Neat 100% Fluid Tested: 6 400 cP
20°C, 0.3 rpm, Spindle SC4-34/13R, 10 mL fluid, 15 minApproximate Holdover Times Anticipated Under
OAT Type IV Fluid Various Weather ConditionsConcentration (hours:minutes)
°C °F Neat Fluid/Water *FROST FREEZING SNOW ***FREEZING LIGHT FRZ RAIN ON COLD OTHER****
(% by volume) FOG ���� DRIZZLE RAIN SOAKED WING
100/0 18:00 1:50-2:45 0:45-1:45 1:05-1:45 0:50-1:05 0:10-1:20
above above 75/25 6:00 1:45-2:25 0:40-1:25 0:50-1:30 0:30-0:45 0:15-1:25
0º 32º
50/50 4:00 0:30-0:45 0:15-0:25 0:15-0:25 0:10-0:15
100/0 12:00 1:50-2:45 0:35-1:20 1:05-1:45 0:50-1:05
CAUTION0 32 75/25 5:00 1:45-2:25 0:30-1:05 0:50-1:30 0:30-0:45
to to No holdover-3 27 50/50 3:00 0:30-0:45 0:10-0:20 0:15-0:25 0:10-0:15
timebelow below 100/0 12:00 0:30-1:30 0:25-0:55 **0:25-1:05 **0:15-0:30
-3 27 guidelinesto to 75/25 5:00 0:30-1:05 0:20-0:45 **0:20-0:50 **0:15-0:25-14 7 exist
below below-14 7 100/0 12:00 0:20-0:45 0:20-0:45
to to-25 -13
below below SAE TYPE IV fluid may be used below -25ºC (-13ºF), provided the freezing point-25 -13 100/0 of the fluid is at least 7ºC (13ºF) below the OAT and the aerodynamic acceptance
criteria are met. Consider use of SAE Type I when SAE Type IV fluid cannot be used.
* During conditions that apply to aircraft protection for ACTIVE FROST.** The lowest use temperature is limited to -10ºC (14ºF).*** Use light freezing rain holdover times if positive identification of freezing drizzle is not possible.**** Heavy snow, snow pellets, ice pellets, moderate and heavy freezing rain, and hail.� � � � Snow includes snow grains.
13cm1680\reports\holdover time\HOT Tables (2000-2001)
At:Clariant FOUR
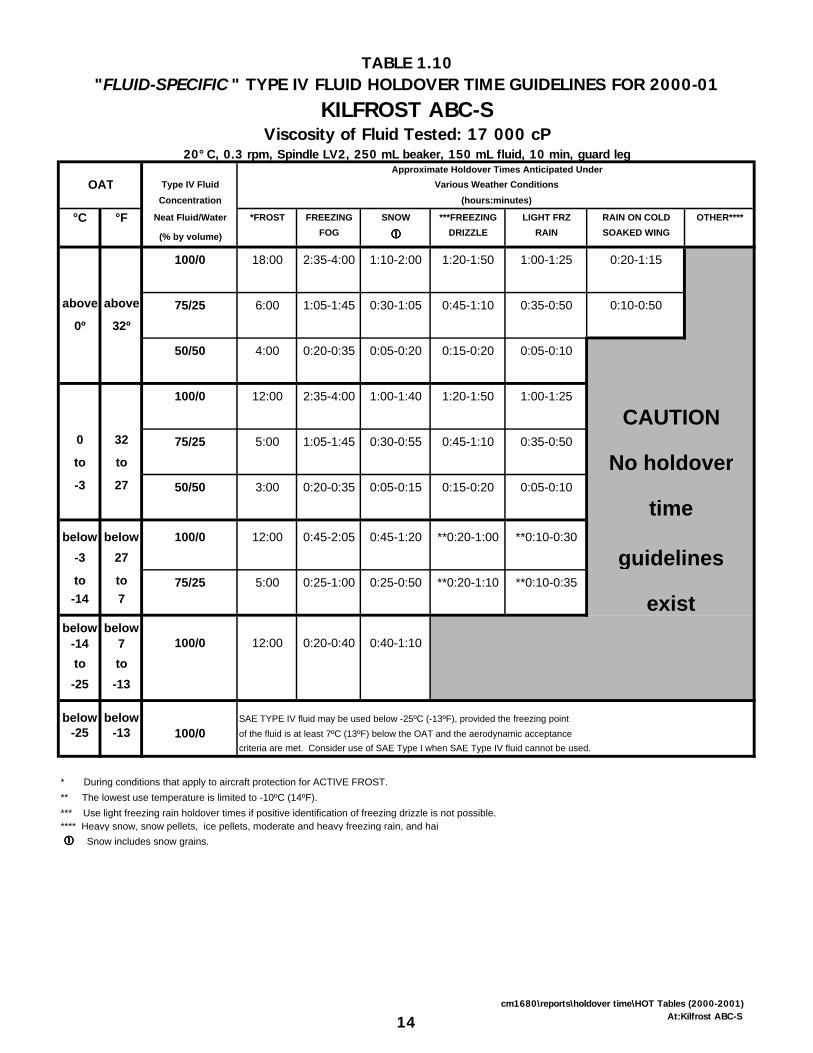
TABLE 1.10"FLUID-SPECIFIC " TYPE IV FLUID HOLDOVER TIME GUIDELINES FOR 2000-01
KILFROST ABC-SViscosity of Fluid Tested: 17 000 cP
20°C, 0.3 rpm, Spindle LV2, 250 mL beaker, 150 mL fluid, 10 min, guard legApproximate Holdover Times Anticipated Under
OAT Type IV Fluid Various Weather ConditionsConcentration (hours:minutes)
°C °F Neat Fluid/Water *FROST FREEZING SNOW ***FREEZING LIGHT FRZ RAIN ON COLD OTHER****
(% by volume) FOG ���� DRIZZLE RAIN SOAKED WING
100/0 18:00 2:35-4:00 1:10-2:00 1:20-1:50 1:00-1:25 0:20-1:15
above above 75/25 6:00 1:05-1:45 0:30-1:05 0:45-1:10 0:35-0:50 0:10-0:50
0º 32º
50/50 4:00 0:20-0:35 0:05-0:20 0:15-0:20 0:05-0:10
100/0 12:00 2:35-4:00 1:00-1:40 1:20-1:50 1:00-1:25
CAUTION0 32 75/25 5:00 1:05-1:45 0:30-0:55 0:45-1:10 0:35-0:50
to to No holdover-3 27 50/50 3:00 0:20-0:35 0:05-0:15 0:15-0:20 0:05-0:10
timebelow below 100/0 12:00 0:45-2:05 0:45-1:20 **0:20-1:00 **0:10-0:30
-3 27 guidelinesto to 75/25 5:00 0:25-1:00 0:25-0:50 **0:20-1:10 **0:10-0:35-14 7 exist
below below-14 7 100/0 12:00 0:20-0:40 0:40-1:10
to to-25 -13
below below SAE TYPE IV fluid may be used below -25ºC (-13ºF), provided the freezing point-25 -13 100/0 of the fluid is at least 7ºC (13ºF) below the OAT and the aerodynamic acceptance
criteria are met. Consider use of SAE Type I when SAE Type IV fluid cannot be used.
* During conditions that apply to aircraft protection for ACTIVE FROST.** The lowest use temperature is limited to -10ºC (14ºF).*** Use light freezing rain holdover times if positive identification of freezing drizzle is not possible.**** Heavy snow, snow pellets, ice pellets, moderate and heavy freezing rain, and hail� � � � Snow includes snow grains.
14cm1680\reports\holdover time\HOT Tables (2000-2001)
At:Kilfrost ABC-S
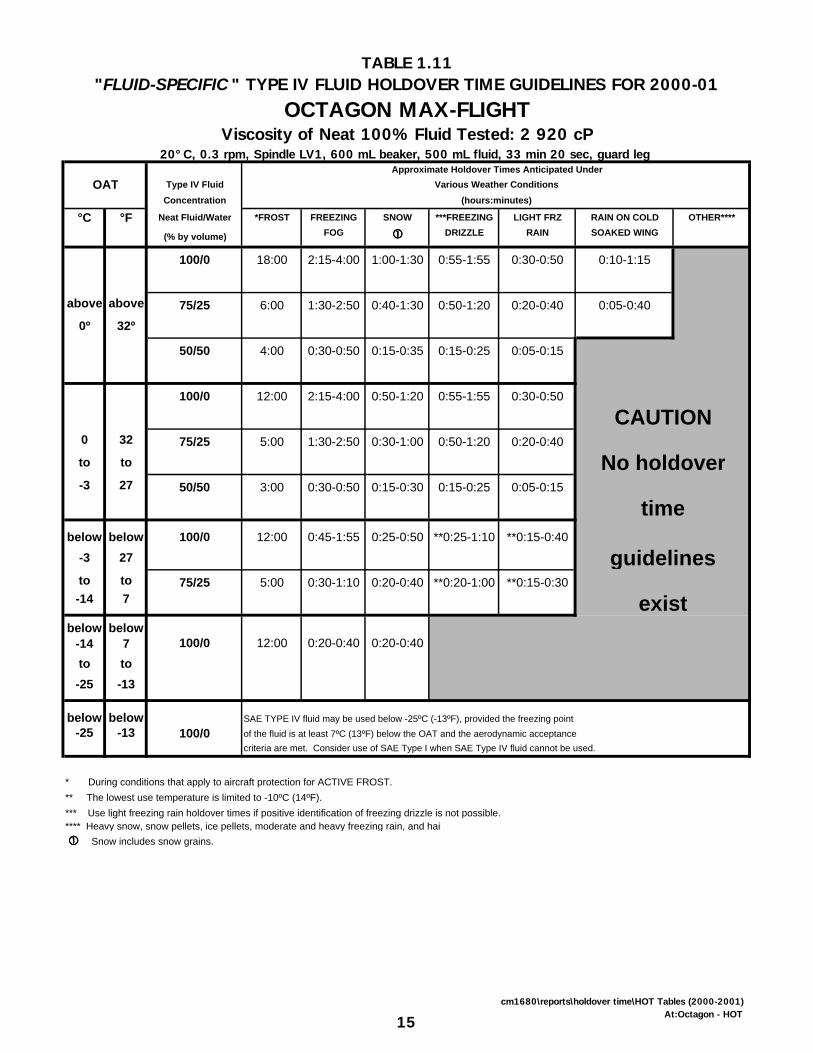
TABLE 1.11"FLUID-SPECIFIC " TYPE IV FLUID HOLDOVER TIME GUIDELINES FOR 2000-01
OCTAGON MAX-FLIGHTViscosity of Neat 100% Fluid Tested: 2 920 cP
20°C, 0.3 rpm, Spindle LV1, 600 mL beaker, 500 mL fluid, 33 min 20 sec, guard leg Approximate Holdover Times Anticipated Under
OAT Type IV Fluid Various Weather ConditionsConcentration (hours:minutes)
°C °F Neat Fluid/Water *FROST FREEZING SNOW ***FREEZING LIGHT FRZ RAIN ON COLD OTHER****
(% by volume) FOG ���� DRIZZLE RAIN SOAKED WING
100/0 18:00 2:15-4:00 1:00-1:30 0:55-1:55 0:30-0:50 0:10-1:15
above above 75/25 6:00 1:30-2:50 0:40-1:30 0:50-1:20 0:20-0:40 0:05-0:40
0º 32º
50/50 4:00 0:30-0:50 0:15-0:35 0:15-0:25 0:05-0:15
100/0 12:00 2:15-4:00 0:50-1:20 0:55-1:55 0:30-0:50
CAUTION0 32 75/25 5:00 1:30-2:50 0:30-1:00 0:50-1:20 0:20-0:40
to to No holdover-3 27 50/50 3:00 0:30-0:50 0:15-0:30 0:15-0:25 0:05-0:15
timebelow below 100/0 12:00 0:45-1:55 0:25-0:50 **0:25-1:10 **0:15-0:40
-3 27 guidelinesto to 75/25 5:00 0:30-1:10 0:20-0:40 **0:20-1:00 **0:15-0:30-14 7 exist
below below-14 7 100/0 12:00 0:20-0:40 0:20-0:40
to to-25 -13
below below SAE TYPE IV fluid may be used below -25ºC (-13ºF), provided the freezing point-25 -13 100/0 of the fluid is at least 7ºC (13ºF) below the OAT and the aerodynamic acceptance
criteria are met. Consider use of SAE Type I when SAE Type IV fluid cannot be used.
* During conditions that apply to aircraft protection for ACTIVE FROST.** The lowest use temperature is limited to -10ºC (14ºF).*** Use light freezing rain holdover times if positive identification of freezing drizzle is not possible.**** Heavy snow, snow pellets, ice pellets, moderate and heavy freezing rain, and hail� � � � Snow includes snow grains.
15cm1680\reports\holdover time\HOT Tables (2000-2001)
At:Octagon - HOT

TABLE 1.12"FLUID-SPECIFIC " TYPE IV FLUID HOLDOVER TIME GUIDELINES FOR 2000-01
SPCA AD-480Viscosity of Neat 100% Fluid Tested: 15 200 cP
20°C, 0.3 rpm, Spindle SC4-34/13R, 10 mL fluid, 30 minApproximate Holdover Times Anticipated Under
OAT Type IV Fluid Various Weather ConditionsConcentration (hours:minutes)
°C °F Neat Fluid/Water *FROST FREEZING SNOW ***FREEZING LIGHT FRZ RAIN ON COLD OTHER****
(% by volume) FOG ���� DRIZZLE RAIN SOAKED WING
100/0 18:00 2:00-3:30 0:55-1:50 0:50-1:30 0:35-0:55 0:15-1:35
above above 75/25 6:00 1:30-2:45 0:40-1:20 0:50-1:15 0:30-0:45 0:10-1:15
0º 32º
50/50 4:00 0:30-0:45 0:15-0:30 0:15-0:25 0:05-0:15
100/0 12:00 2:00-3:30 0:40-1:20 0:50-1:30 0:35-0:55
CAUTION0 32 75/25 5:00 1:30-2:45 0:30-1:05 0:50-1:15 0:30-0:45
to to No holdover-3 27 50/50 3:00 0:30-0:45 0:10-0:20 0:15-0:25 0:05-0:15
timebelow below 100/0 12:00 0:20-1:20 0:30-0:55 **0:25-1:20 **0:15-0:30
-3 27 guidelinesto to 75/25 5:00 0:25-0:50 0:20-0:45 **0:25-1:05 **0:15-0:30-14 7 exist
below below-14 7 100/0 12:00 0:15-0:40 0:25-0:40
to to-25 -13
below below SAE TYPE IV fluid may be used below -25ºC (-13ºF), provided the freezing point
-25 -13 100/0 of the fluid is at least 7ºC (13ºF) below the OAT and the aerodynamic acceptance
criteria are met. Consider use of SAE Type I when SAE Type IV fluid cannot be used.
* During conditions that apply to aircraft protection for ACTIVE FROST.** The lowest use temperature is limited to -10ºC (14ºF).*** Use light freezing rain holdover times if positive identification of freezing drizzle is not possible.**** Heavy snow, snow pellets, ice pellets, moderate and heavy freezing rain, and hail.� � � � Snow includes snow grains.
16cm1680\reports\holdover time\HOT Tables (2000-2001)
At:SPCA 480
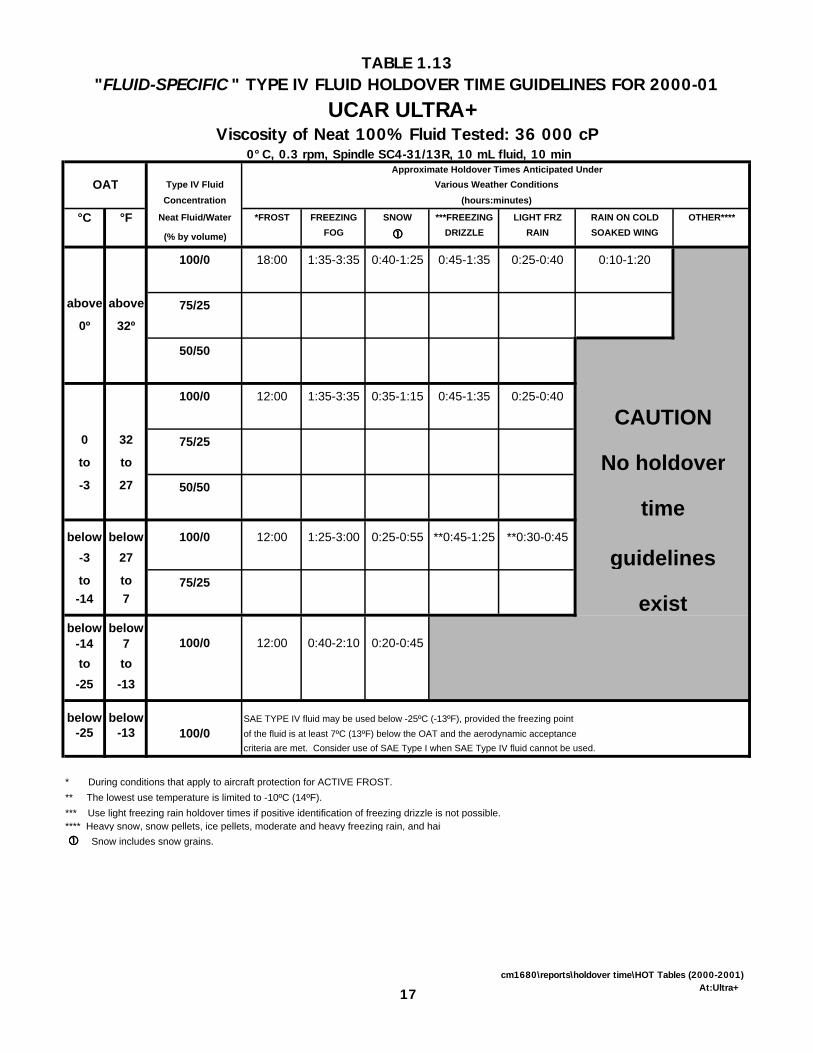
TABLE 1.13"FLUID-SPECIFIC " TYPE IV FLUID HOLDOVER TIME GUIDELINES FOR 2000-01
UCAR ULTRA+Viscosity of Neat 100% Fluid Tested: 36 000 cP
0°C, 0.3 rpm, Spindle SC4-31/13R, 10 mL fluid, 10 minApproximate Holdover Times Anticipated Under
OAT Type IV Fluid Various Weather ConditionsConcentration (hours:minutes)
°C °F Neat Fluid/Water *FROST FREEZING SNOW ***FREEZING LIGHT FRZ RAIN ON COLD OTHER****
(% by volume) FOG ���� DRIZZLE RAIN SOAKED WING
100/0 18:00 1:35-3:35 0:40-1:25 0:45-1:35 0:25-0:40 0:10-1:20
above above 75/250º 32º
50/50
100/0 12:00 1:35-3:35 0:35-1:15 0:45-1:35 0:25-0:40
CAUTION0 32 75/25to to No holdover-3 27 50/50
timebelow below 100/0 12:00 1:25-3:00 0:25-0:55 **0:45-1:25 **0:30-0:45
-3 27 guidelinesto to 75/25-14 7 exist
below below-14 7 100/0 12:00 0:40-2:10 0:20-0:45
to to-25 -13
below below SAE TYPE IV fluid may be used below -25ºC (-13ºF), provided the freezing point-25 -13 100/0 of the fluid is at least 7ºC (13ºF) below the OAT and the aerodynamic acceptance
criteria are met. Consider use of SAE Type I when SAE Type IV fluid cannot be used.
* During conditions that apply to aircraft protection for ACTIVE FROST.** The lowest use temperature is limited to -10ºC (14ºF).*** Use light freezing rain holdover times if positive identification of freezing drizzle is not possible.**** Heavy snow, snow pellets, ice pellets, moderate and heavy freezing rain, and hail� � � � Snow includes snow grains.
17cm1680\reports\holdover time\HOT Tables (2000-2001)
At:Ultra+

18
This page intentionally left blank.

2. METHODOLOGY
X:\@APS ARCHIVE\CM1680 (exBM3833) TC-Deicing 00-01 (REPORTS ONLY)\Reports\HOT\Final Version 1.0\Final Version 1.0.doc Final Version 1.0
August 05APS AVIATION INC.
19
2. METHODOLOGY
Described in this section are the tests, equipment, and procedures employed during the 2000-01 test season. The definition of weather, test sites, test conditions, equipment, procedures, fluid failure criteria, data forms, fluids, personnel, and analysis methodology are presented in subsections. 2.1 Weather Conditions
Holdover times (see Tables 1.2 to 1.13) are provided as a function of weather condition, fluid mixture, and outside air temperature (OAT). The objective of the winter test program was to substantiate these holdover times in the various conditions or to develop new holdover times based on the most recent test data. Table 2.1 provides definitions of most weather conditions experienced in winter operations and includes the criteria used to determine precipitation intensity (light, moderate, and heavy). This table was compiled by the National Center for Atmospheric Research (NCAR) from the World Meteorological Organization Guide to Meteorological Instruments and Methods of Observation (1983) [4], and from the American Meteorological Society, Glossary of Meteorology WSOH # 7 Manual of Surface Weather Observations (MANOBS) (3/94) [5]. Table 2.1 includes definitions for the weather conditions noted in the holdover time tables (presented in subsection 1.1): frost, freezing fog, snow, freezing drizzle, light freezing rain, and rain. Definitions for hail and ice pellets are also presented; however, these are conditions for which holdover time guidelines do not exist.
The test methodology traditionally used to determine fluid failure times has included the upper and lower limits for precipitation rates for each type of precipitation. These limits were discussed in detail at a meeting in 1997 of the SAE G-12 Holdover Time Subcommittee, where standard definitions of upper and lower precipitation rate limits were approved for each category of precipitation. These limits are documented and discussed in Subsection 2.9. 2.1.1 Snow Table 2.1 contains the criteria generally used to estimate the intensity of snow. These criteria are based on horizontal visibility. Three intensity levels are defined as follows:

TABLE 2.1DEFINITION OF WEATHER PHENOMENA
20cm1680/report/hot/WTH_PHEN

2. METHODOLOGY
X:\@APS ARCHIVE\CM1680 (exBM3833) TC-Deicing 00-01 (REPORTS ONLY)\Reports\HOT\Final Version 1.0\Final Version 1.0.doc Final Version 1.0
August 05APS AVIATION INC.
21
• Light Visibility is greater than or equal to 1.0 km; • Moderate Visibility is 0.5 km to less than1.0 km; and • Heavy Visibility is less than 0.5 km.
As stated in a cautionary note in Table 2.1, visibility is only an indicator of snow intensity, and the two parameters are not always correlated. Table 2.2 provides more detail about snow visibility than outlined in Table 2.1. Devised by NCAR and Transport Canada [6], this table is based on NCAR field data and theoretical work on classes of snow. NCAR has classified the snow data by crystal arrangement and temperature and has correlated this information with visibility measurements. The table gives visibility in distance for three snowfall intensities both in daylight and in darkness (at night). The circled values in Table 2.2 most closely represent the previous designations. The Snow Visibility versus Snowfall Intensity Chart, shown in Table 2.2, is published annually by Transport Canada for use in winter operations (see Transport Canada website [7]).
2.1.2 Freezing Drizzle Freezing drizzle is composed of closely spaced fine water droplets with a diameter of less than 0.5 mm (see Table 2.1). Like snow, the intensity of freezing drizzle is estimated through the measurement of horizontal visibility. The holdover time table has one column for freezing drizzle, but Table 2.1 shows three intensity levels (light, moderate, and heavy). For example, under moderate freezing drizzle, the rate of precipitation should range between 2.5 and 5.1 g/dm²/h. For heavy freezing drizzle, the definition indicates that the intensity is greater than 5 g/dm²/h. The upper limit value of 12.7 g/dm²/h for freezing drizzle was discussed and set by United Airlines, NCAR, and NRC. This value was also used as the lower limit for light freezing rain.
2.1.3 Freezing Rain
Freezing rain exists in the form of droplets distinguished by a diameter size of greater or less than 0.5 mm. In contrast to drizzle, freezing rain droplets are widely separated. For each of the three intensities of freezing rain given in Table 2.1, a visual description is supplied to provide a subjective guideline for estimating rain intensity. However, when an instrument is available to measure the intensity of precipitation, the following definitions apply:
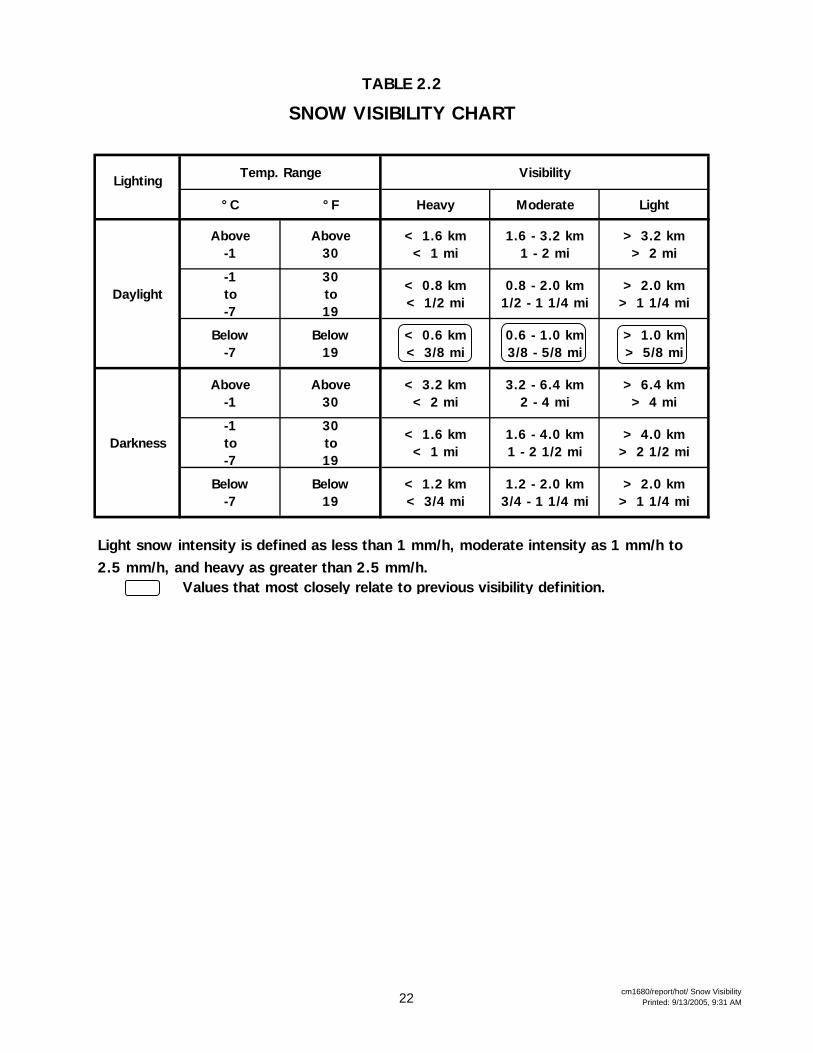
TABLE 2.2
SNOW VISIBILITY CHART
LightingTemp. Range Visibility
°C °F Heavy Moderate Light
Above-1
Above30
< 1.6 km< 1 mi
1.6 - 3.2 km1 - 2 mi
> 3.2 km> 2 mi
Daylight-1to-7
30to19
< 0.8 km< 1/2 mi
0.8 - 2.0 km1/2 - 1 1/4 mi
> 2.0 km> 1 1/4 mi
Below-7
Below19
< 0.6 km< 3/8 mi
0.6 - 1.0 km3/8 - 5/8 mi
> 1.0 km> 5/8 mi
Above-1
Above30
< 3.2 km< 2 mi
3.2 - 6.4 km2 - 4 mi
> 6.4 km> 4 mi
Darkness-1to-7
30to19
< 1.6 km< 1 mi
1.6 - 4.0 km1 - 2 1/2 mi
> 4.0 km> 2 1/2 mi
Below-7
Below19
< 1.2 km< 3/4 mi
1.2 - 2.0 km3/4 - 1 1/4 mi
> 2.0 km> 1 1/4 mi
Light snow intensity is defined as less than 1 mm/h, moderate intensity as 1 mm/h to 2.5 mm/h, and heavy as greater than 2.5 mm/h.
Values that most closely relate to previous visibility definition.
22 cm1680/report/hot/ Snow VisibilityPrinted: 9/13/2005, 9:31 AM

2. METHODOLOGY
X:\@APS ARCHIVE\CM1680 (exBM3833) TC-Deicing 00-01 (REPORTS ONLY)\Reports\HOT\Final Version 1.0\Final Version 1.0.doc Final Version 1.0
August 05APS AVIATION INC.
23
• Light Precipitation rate is ≤ 25 g/dm²/h; • Moderate Precipitation rate is >25 g/dm²/h but ≤76 g/dm²/h; and • Heavy Precipitation rate is >76 g/dm²/h.
2.1.4 Freezing Fog Freezing fog is defined as suspended minute water droplets that freeze upon impact with the ground or exposed objects. Table 2.1 reports that the horizontal visibility is reduced to less than 1 km but does not provide any indication of intensity or liquid water content of the fog. 2.2 Test Sites
Natural snow testing for the 2000-01 winter was performed at the APS Dorval Airport test site. The location of the site is shown on the plan view of the airport in Figure 2.1. Photo 2.1 was taken at the site and shows a remote sensor mounted on top of the test stand on the left and a trailer at the back. The same trailer used in past winters was used in the 2000-01 test season. Due to space limitations, an additional trailer was rented and the two trailers were located adjacent to each other. The second trailer was used only for equipment storage. The APS test site is located near Environment Canada’s MSC automated weather observation station (Photo 2.2). Tests under conditions of freezing fog, rain on a cold-soaked surface, freezing drizzle, and light freezing rain were conducted indoors at the NRC’s CEF, where simulated precipitation was produced. Tests in artificial snow conditions were also conducted at the CEF using the NCAR artificial snowmaking system. For the purpose of this report, i.e., the term “simulated” means simulating the effects of the precipitation (i.e., not producing the real precipitation in significant detail but providing equivalent results). The term “artificial” signifies that precipitation is produced and significant details are well simulated; however, equivalent results may not be achieved for test purposes. The CEF is partitioned into two sections separated by an insulated dividing door. Conditions in each section can be controlled independently, permitting different tests to be conducted simultaneously. Photo 2.3 provides a view of the building from the outside. Photos 2.4 and 2.5 provide interior images of the small and large ends of the facility. The size of the chamber is 30 m by 5.4 m, with a height of 8 m. The lowest temperature achievable is -46ºC.

24
2. METHODOLOGY
X:\@APS ARCHIVE\CM1680 (exBM3833) TC-Deicing 00-01 (REPORTS ONLY)\Reports\HOT\Final Version 1.0\Final Version 1.0.doc Final Version 1.0
August 05APS AVIATION INC.
25
Preliminary testing in simulated frost conditions was conducted at IREQ’s high humidity chamber in Varennes. The evaluation of the IREQ chamber for future use in frost endurance time testing is presented in an associated report, TP 13831E [3]. 2.3 Test Conditions Outdoor testing was conducted during natural precipitation events. Supplementary tests to simulate freezing precipitation were carried out at the CEF (see Photo 2.4). Subsections 2.3.1 and 2.3.2 provide descriptions of the spray assembly (see Photo 2.6) and of the methods used to produce and calibrate the fine water droplets in these simulated precipitation tests. Subsection 2.3.3 provides a summary of the categories and characteristics of each precipitation type produced for these tests.
2.3.1 Droplet Size and Rate of Precipitation
In the past few years, more industry attention has been given to the influence of droplet size on holdover time. To explore this relationship further, experiments were performed to measure droplet sizes produced by various nozzles (hypodermic needle tips) at various water and air pressures in the spray delivery unit. Although the gauge of the needles is an important factor in the production of water droplets with appropriate dimensions, the air and water pressure levels in the sprayer system are equally important. A new and improved sprayer assembly was developed in 1997-98 by NRC and is shown in Photo 2.6. The new sprayer provides a larger scan area and improved spray uniformity over the test bed area. The sprayer scanner consists of a horizontal main shaft supported by two bearings. The actual spray head assembly is shaft-mounted on a rotating scanner, so that one scan covers a lateral running strip of the test bed area. A stepper motor is synchronized to index the relative angle of the spray head between scans along an axis perpendicular to the scan axis. This amounts to having two axes of rotation: essentially an x-y plane, one along each axis. Each scan is consecutively indexed in order to complete the precipitation coverage of the test bed area. This defines one cycle of the spray unit. The scan rate, index angle, and the number of scans per cycle are adjusted, along with the fluid delivery pressures (water and air) to obtain appropriate droplet sizes and precipitation rates. The spray nozzle is shown in Photo 2.7. Prior to 1995, calibration experiments were conducted by NRC using an optical gauge manufactured by HSS (see Photo 2.8) to verify that the simulation of

2. METHODOLOGY
X:\@APS ARCHIVE\CM1680 (exBM3833) TC-Deicing 00-01 (REPORTS ONLY)\Reports\HOT\Final Version 1.0\Final Version 1.0.doc Final Version 1.0
August 05APS AVIATION INC.
26
freezing fog, freezing drizzle, and light freezing rain provided adequate droplet sizes.
Since 1995, droplet size calibration has been carried out by the APS team using a manual dye-stain technique employed by personnel at the CEF. This technique consists of dusting Whatman # 1 filter paper discs with a water-activated, very finely divided powder form of methylene blue dye. The prepared discs are manually positioned (Photo 2.9) under artificial precipitation for a fixed time to acquire a droplet size pattern. A calibration curve is then used to convert the measured diameter of the droplets on the pattern to the experimental median volume diameter (MVD). To determine whether droplets produced in the CEF resembled droplets from natural precipitation, a test was conducted during natural light freezing rain conditions in 1997-98 at Dorval Airport. Droplets were measured and compared to the droplet sizes of simulated light freezing rain obtained from tests conducted at NRC. The results of these tests are as follows:
• For the outdoor test:
Location: Dorval Airport Precipitation: Natural Light Freezing Rain Precipitation Rate: 20 g/dm²/h Calibrated MVD: 1.0 mm
• For the indoor test:
Location: National Research Council Precipitation: Simulated Light Freezing Rain Precipitation Rate: 25 g/dm²/h Calibrated MVD: 1.0 mm
The median volume diameter for both natural and simulated light freezing rain was 1 mm.
In 2000-01, droplet size verification was conducted by APS staff using both the dye-stain and slide impact method. The slide impact method consists of spreading mineral or silicone oil with a known viscosity (5000 mPas) onto a microscope slide, and placing the slide under precipitation to collect water droplets within the oil on the slide. The droplet size is then determined either by direct observation under a microscope equipped with a ruled graticule eyepiece or from enlarged photographs of the slide.

2. METHODOLOGY
X:\@APS ARCHIVE\CM1680 (exBM3833) TC-Deicing 00-01 (REPORTS ONLY)\Reports\HOT\Final Version 1.0\Final Version 1.0.doc Final Version 1.0
August 05APS AVIATION INC.
27
2.3.2 Median Volume Diameter of Raindrops The median volume diameter (MVD) of a rain droplet was researched and found to be related to the precipitation rate as follows:
MVD = (precipitation rate/10) 0.23
where the MVD is in mm and the rate of precipitation is in g/dm²/h. At 25 g/dm²/h, this equation gives an MVD of 1.2 mm, and at 76 g/dm²/h the MVD is 1.6 mm.
The theoretical MVD for rain at various rates of precipitation were determined based on this equation. These values are listed below along with the experimental MVDs for each precipitation condition.
• Experimental MVD (mm): Moderate Rain (High rate: 76 g/dm²/h) 1.4 Light Rain (Low rate: 12.7 g/dm²/h) 1.0 Light Rain (High rate: 25 g/dm²/h) 1.0 Drizzle (Low rate: 5 g/dm²/h) 0.25 Drizzle (High rate: 12.7 g/dm²/h) 0.35 • Theoretical MVD (mm): Moderate Rain (High rate: 76 g/dm²/h) 1.6 Light Rain (Low rate: 12.7 g/dm²/h) < 1.1 Light Rain (High rate: 25 g/dm²/h) 1.2 Drizzle (Low rate: 5 g/dm²/h) < 0.5 Drizzle (High rate: 12.7 g/dm²/h) < 0.5 Fog < 0.1
2.3.3 Characteristics of Precipitation Produced This subsection gives a summary in point form of the characteristics of the precipitation produced in conditions of freezing drizzle, light freezing rain, rain on a cold-soaked surface, and freezing fog. The characteristics specified include precipitation rate, droplet MVD, the size of the hypodermic needle producing the droplet, and air temperature.
• Freezing Drizzle: High precipitation rate: 12.7 g/dm²/h; Droplet MVD: 350 µm; Droplets produced with two # 23 hypodermic needles; and Air temperature: -3 and -10ºC.

2. METHODOLOGY
X:\@APS ARCHIVE\CM1680 (exBM3833) TC-Deicing 00-01 (REPORTS ONLY)\Reports\HOT\Final Version 1.0\Final Version 1.0.doc Final Version 1.0
August 05APS AVIATION INC.
28
Low precipitation rate: 5 g/dm²/h; Droplet MVD: 250 µm; Droplets produced with two # 24 hypodermic needles; and Air temperature: -3 and -10ºC.
• Light Freezing Rain: High precipitation rate: 25 g/dm²/h; Droplet MVD: 1 000 µm; Droplets produced with two # 20 hypodermic needles; and Air temperature: -3 and -10ºC. Low precipitation rate: 12.7 g/dm²/h; Droplet MVD: 1 000 µm; Droplets produced with two # 20 hypodermic needles; and Air temperature: -3 and -10ºC. • Drizzle on a Cold-Soaked Surface: Precipitation rate: 5 g/dm²/h; Droplet MVD: 250 µm; Droplets produced with two # 24 hypodermic needles; and Air temperature: +1ºC. • Moderate Rain on a Cold-Soaked Surface: Precipitation rate: 76 g/dm²/h; Droplet MVD: 1 400 µm; Droplets produced with two # 17 hypodermic needles; and Air temperature: +1ºC. • Freezing Fog: Precipitation rate: 2 and 5 g/dm²/h; Droplet MVD: 30 µm; and Air temperature: -3°C, -14°C and -25ºC.
2.4 Equipment
Figure 2.2 shows a schematic of the test platform used in holdover time testing. For natural snow tests, six standard test plates are mounted on the test stand, which has a working surface inclined at 10º to the horizontal. Each plate represents a flat plate test. The standard test plate, for the purpose of this document, is restricted to the plate used in endurance time testing. It is an aluminum alloy plate 50 cm (20 in.) long and 30 cm (12 in.) wide adopted by SAE for the evaluation and
2. METHODOLOGY
X:\@APS ARCHIVE\CM1680 (exBM3833) TC-Deicing 00-01 (REPORTS ONLY)\Reports\HOT\Final Version 1.0\Final Version 1.0.doc Final Version 1.0
August 05APS AVIATION INC.
29
certification of de/anti-icing fluid performance. For testing it is mounted at 10° to the horizontal. Along the top and two sides a line is marked 2.5 cm (1 in.) from the edge; ice crystals commencing in these zones are ignored as outside the test area. The bottom edge is a special case because the fluid is held back and is excessively thick there. The test area of the test plate is about 75 percent of the total area. The plate is marked with horizontal lines parallel to the top edge at 7.5 cm (3 in.), 15 cm (6 in.), 22.5 cm (9 in.), 30 cm (12 in.), and 37.5 cm (15 in.). On each of these lines are marked three crosshairs, one in the middle of the line and the other two evenly spaced 7.5 cm (3 in.) each side of it for a total of 15 crosshair sites [8]. Figure 2.2 depicts the size and surface markings of a standard flat plate. The crosshair sites are used in determining whether end conditions (see Subsection 2.5.2 for definition) were achieved. Photo 2.10, taken outdoors at Dorval, shows six test plates mounted on a stand; two plates (shown as U and W in Figure 2.2) are equipped with Allied Signal Contaminant/Fluid Integrity Monitoring System (C/FIMS) ice detection sensors mounted at the 15 cm (6 in.) line. For simulated freezing precipitation tests at NRC, 12 plates were mounted on the stand and numbered from 1 to 12, as shown in Figure 2.2. Figure 2.3 shows the collection (plate) pan, which is the same size as a standard flat plate and is used to make precipitation rate measurements during outdoor tests. Photo 2.11 shows the collection pans used for measuring precipitation rates indoors at NRC. A new snow gauge, CR21X, was made available to measure precipitation during the 1996-97 winter season. However, the unit was exposed during this early testing and gave inaccurate results. Over the past several years, a shield was installed around the CR21X gauge, which has contributed to improved accuracy and resolution over instrumentation used in previous seasons. Detailed analysis of the results obtained since 1995 using the CR21X snow gauge is presented in Transport Canada report, TP 13830E [9].
Sealed boxes (7.5 cm deep) were used for simulating a cold-soaked wing (see Figure 2.3). The top of the cold-soak box consisted of an aluminum flat plate identical to the standard flat plate. A box-shaped reservoir was welded to the bottom of the plate. The volume (depth) of the reservoir was selected based on the analyses contained in Transport Canada report, TP 12899E [10]. Two large digital clocks purchased in 1998-99 were visible from a considerable distance and facilitated the recording of precipitation rate collection times in natural and simulated conditions (see Photo 2.12). Fluid freeze points were measured using a hand-held Misco refractometer with a Brix scale (see Photo 2.13).

30

2. METHODOLOGY
X:\@APS ARCHIVE\CM1680 (exBM3833) TC-Deicing 00-01 (REPORTS ONLY)\Reports\HOT\Final Version 1.0\Final Version 1.0.doc Final Version 1.0
August 05APS AVIATION INC.
32
One-litre pour containers were purchased to ensure that accurate quantities of fluid were being applied to the test plates in all endurance time tests.
Equipment to measure temperature, wind speed, and wind direction was purchased several years ago (see Photo 2.1). Additional measurements of these parameters were obtained using equipment provided by Environment Canada, shown in Photo 2.2. In addition to the data collected using the meteorological equipment at the APS Dorval site, data from Environment Canada’s automated weather observation equipment located on a lot adjacent to the APS test site, were made available. This equipment, the Remote Environmental Automatic Data Acquisition Concept (READAC), relayed information electronically on a minute-by-minute basis to MSC for the entire winter. The READAC equipment provides an indispensable means of monitoring meteorological conditions for test programs such as this. It comprises the following instruments:
• Relative Humidity Gauge and Thermometer; • Anemometer and wind vane at a 10 m height; • Precipitation Occurrence Sensing System (POSS): The POSS system
(instrument shown at the rear in Photo 2.14) consists of a Doppler radar set with a transmitter and a receiver as separate units (bi-static set-up). The Doppler frequency shift of the returned signal provides the precipitation type, and the power spectrum of the returned signal provides a measure of the intensity (light, moderate or heavy) of precipitation. The output of the system consists of the start time, stop time, type, and intensity of precipitation;
• Precipitation Gauge: The READAC precipitation gauge (instrument shown
at the right in Photo 2.14) is a modified Belfort weighing gauge. A bucket is attached to a spring balance and cable pulley arrangement, which is connected to a rotating shaft. The degree of rotation of the shaft corresponds to the amount of accumulated precipitation in the bucket. The total amount of precipitation is the only value returned by the precipitation gauge arrangement. The gauge output resolution is 0.5 mm (liquid water equivalent); and
• Belfort Forward Scattermeter: The Belfort Forward Scattermeter
(instrument shown at the left in Photo 2.14) provides an estimate of visibility. The system consists of a Xenon bulb transmitter and a receiver both at an angle of 22º below the horizontal aimed at a 0.02 m³ sample volume of air 2.5 m above the ground. The transmitter illuminates the

2. METHODOLOGY
X:\@APS ARCHIVE\CM1680 (exBM3833) TC-Deicing 00-01 (REPORTS ONLY)\Reports\HOT\Final Version 1.0\Final Version 1.0.doc Final Version 1.0
August 05APS AVIATION INC.
33
sample. The receiver measures the amount of light scattering off the aerosols present in the sample volume of air. The measurement is inversely proportional to visibility. The instrument output scale is in units of miles. The measurements outputted by the instrument are the time-averaged signal envelopes from the previous 10 minutes of monitoring.
2.5 Test Procedures Tests consisted of pouring deicing or anti-icing fluids directly onto clean test panels (exposed to various winter precipitation conditions) and recording the elapsed time for each crosshair to fail until the test panels reached the defined end condition (see Subsection 2.5.2). 2.5.1 Test Protocol For the tests at Dorval, a test stand contained six test plates, each plate representing a flat plate test. The procedure for natural snow flat plate tests was developed by the SAE G-12 Holdover Time Subcommittee. The major steps in the natural snow flat plate test procedure are:
• Synchronize all timepieces;
• Clean the panels and start;
• Apply (pour) fluids to the test panels. Type I fluids are at room temperature (20ºC ± 3°C). Type II and Type IV fluids are applied at the outdoor ambient temperature. Fluids are poured using a single-step fluid application;
• Record crosshair end condition times;
• Continue testing until at least five crosshairs or 1/3 of the plate have failed;
• Record weather conditions; and
• Clean panels and restart.
Complete details of the test procedures are provided in Appendix B. Appendix C contains the procedures used for testing at the CEF in conditions of freezing drizzle, light freezing rain, freezing fog, and rain on cold-soaked surfaces.
2. METHODOLOGY
X:\@APS ARCHIVE\CM1680 (exBM3833) TC-Deicing 00-01 (REPORTS ONLY)\Reports\HOT\Final Version 1.0\Final Version 1.0.doc Final Version 1.0
August 05APS AVIATION INC.
34
2.5.2 End Condition Definitions The test procedures and the determination of defined end conditions evolved from the experience the APS team has accumulated from previous winter season test programs. Either of the following descriptions provide the general guidelines observers use to judge when fluid failure occurs and to determine the extent of contamination or failure:
• There is a visible accumulation of snow bridging on top of the fluid or
plate when viewed from the front. There should be an indication that the fluid can no longer absorb the precipitation; or
• Ice has formed or accumulated on top of the plate or fluid, or ice is suspended within the fluid (freezing precipitation tests).
The standard flat plate end condition is achieved when visual failures occur at any five of the crosshair markings on the plate or when the general failure coverage reaches 1/3 of the entire test plate surface. For further fluid failure criteria and icing definitions, please see Transport Canada report, TP 13832E [8]. Listed below is a subset of those definitions that pertain to fluid failure criteria. Protection time: The period that an anti-icing treatment protects aerodynamically critical surfaces from the adhesion of contamination and the resulting roughness that could cause a premature stall or result in loss of control and prevent the crew from safely operating the aircraft. Endurance time: The time from initial application of anti-icing fluid to a standard test plate to the moment of the standard plate failure for a specific test condition simulating a weather condition. Holdover time: The time from initial application of anti-icing fluid onto an aircraft to the moment the fluid can no longer be guaranteed to provide protection at the anticipated takeoff time. These times must be at least five minutes less than the protection time, and may be substantially less. Visual failure: A layer of ice crystals is plainly visible at the surface and the layer is building up thickness as precipitation continues. Generally, in the case of Type II, III, and IV fluids, uncontaminated fluid is in contact with the supporting surface at this time and therefore the ice crystal layer is not in contact with that surface and is not adhering to it. The growth of crystals in the fluid is compounded by incoming precipitation, resulting in an increased accumulation of crystals on the surface and thus in a visibly contaminated surface. When this
2. METHODOLOGY
X:\@APS ARCHIVE\CM1680 (exBM3833) TC-Deicing 00-01 (REPORTS ONLY)\Reports\HOT\Final Version 1.0\Final Version 1.0.doc Final Version 1.0
August 05APS AVIATION INC.
35
area is large enough to be seen by an observer, a visual failure is adjudged. Obviously, the distance of the observer from the surface will influence what can be seen. For a test technician observing a plate from inches away, visual failure is characterized as a loss of gloss or obscuration of the surface by ice or slush affecting one third of a standard test plate surface. For an aircrew member viewing a wing through a window at night at a distance of several feet, only slush or bridging snow covering about one third of a critical area such as an aileron or a leading edge will be visible. Visual failure on test plates is the mode used to establish endurance times and thus holdover times. Failure front: Anti-icing fluid varies in thickness over a surface as a result of the unevenness of the application, gaps or recesses in the surface, and surface gradients. Generally, the thinner areas of fluid are diluted more rapidly, so that an ice crystal layer forms at these thin fluid locations and an icing front advances into the thicker areas with continuing precipitation. Standard plate failure: Failure is established as a visual failure of one third of the test surface based on the observation of conditions on full-scale aircraft. This usually occurs when the failure front on the plate crosses the 15 cm (6 in.) line. However, in outside snow tests, because there is usually wind, the start point may be anywhere on the plate and the progression in any direction. Under these conditions, visual failure may be estimated. Alternatively, when contamination is visible on 5 of the 15 cross hairs, the plate is determined to be one-third covered and therefore visually failed. Fifth cross hair failure: When the ice crystals that indicate visual failure obliterate only four cross hairs on a standard test plate, the fluid is considered to be good. When the fifth cross hair is obscured, the fluid is considered to be visually failed. This represents a standard plate failure mode. 2.5.3 Precipitation Rate Measurement Procedures 2.5.3.1 Simulated precipitation conditions Prior to the start of the rate collection, the proper needles and nozzles are installed in the spray unit, and both the air and water pressures are adjusted. Water spray calibration is performed by placing catch pans on the test stand, marking each pan with a number identifying the collection location on the test stand, and exposing the pans to a predetermined precipitation collection period, typically 10 minutes.

2. METHODOLOGY
X:\@APS ARCHIVE\CM1680 (exBM3833) TC-Deicing 00-01 (REPORTS ONLY)\Reports\HOT\Final Version 1.0\Final Version 1.0.doc Final Version 1.0
August 05APS AVIATION INC.
36
The pans are weighed prior to exposure to precipitation and the weights are recorded. Before the precipitation catch period begins, the exact time (hh:mm:ss) is recorded. The pans are re-weighed following this collection period and the precipitation rates over the area of the test stand are examined. If the rates are unacceptable, the water spray unit is re-calibrated. If the rates are deemed acceptable, the pans are weighed and placed on the stand for a second collection period. After the second collection period has ended, the pans are again re-weighed and the rates computed. When two rates have been collected at each test location, the catch rates of the first and second collection are examined. If the average catch rate for any location is deemed to be acceptable for this condition, then the pouring of fluids may begin at this location. Rates are continuously monitored at a minimum of two locations during a test to ensure there are no significant rate fluctuations. Pans are placed at these locations and re-weighed at fixed intervals (15 minutes, typically) during the course of a test. If a rate fluctuation occurs, the tests are stopped.
Following the failure of a fluid on a test plate, a rate collection pan is weighed and placed at the plate location for a predetermined time interval. It is then re-weighed and placed again on the stand to collect a minimum of two additional rates at this location. The rate of precipitation for any location on the stand is calculated by averaging the two rates collected prior to the test and the two rates collected following the test. A program was developed to manage the collection of precipitation rates in simulated conditions. The program runs in Microsoft Excel, and the spreadsheet contains several macros. The rate program spreadsheet guide appears in Appendix H. The following procedure is used for measuring the distribution of precipitation rate distribution in simulated conditions:
• Clean test plates are placed on the test stand prior to rate collection, and are exposed to the simulated precipitation to verify that an even ice formation occurs over the entire test area. If this visual inspection proves satisfactory, the rate collection period will begin. If this visual inspection proves unsatisfactory, the test stand must be repositioned under the spray device and the process repeated;
2. METHODOLOGY
X:\@APS ARCHIVE\CM1680 (exBM3833) TC-Deicing 00-01 (REPORTS ONLY)\Reports\HOT\Final Version 1.0\Final Version 1.0.doc Final Version 1.0
August 05APS AVIATION INC.
37
• To verify the rate distribution on the test stand, a continuous rate-monitoring pan is replaced with a detailed rate distribution pan, which consists of four small pans of equivalent size. The area of the four small pans combined is similar to that of a standard rate collection pan. The small pans are weighed and placed at these locations and re-weighed at fixed intervals. The typical collection period for rate distribution is 60 minutes; however, this interval may be shorter if all tests have been completed within an hour. The variation between the rate of any of the four small pans and that of the average rate of that location has typically been found to be less than 10 percent; and
• Two examples of the detailed rate distributions are shown in Table 2.3.
Both rate distribution tests were conducted in freezing drizzle, one at the low rate (5 g/dm2/h) and the other at the high rate (12.7 g/dm2/h). The average precipitation rate over the entire position in the low rate example in Table 2.3 was 5.1 g/dm2/h. The individual rates of the four smaller pans were 5.0, 4.9, 5.2, and 5.3 g/dm2/h, suggesting a maximum variation of 4.1 percent from the average rate over the entire position.
2.5.3.2 Natural precipitation conditions Two rate collection pans per test stand are used to determine precipitation rates in natural conditions. Prior to the rate collection period, both pans are marked (upper and lower), and the inner bottom and sides of the each pan are wetted with Type IV anti-icing fluid to prevent blowing snow from escaping the pan. The wetted pans are then weighed to the nearest 0.2 g. The start time of the rate collection period is recorded (h:min:sec) from the digital clock located near the rate station before the pans are brought outside the trailer.
The pans are positioned at locations 6 and 7 (see Figure 2.2) to collect precipitation for 10-minute intervals in normal conditions and for 5-minute intervals in periods of high precipitation rates and high winds. Before the plate pans are removed from the test stand and re-weighed, any accumulated precipitation on the lips and outer sides of each plate pan is carefully removed. The plate pans are then carried to the rate station to be re-weighed. Upon entering the trailer, the exact time is noted. The new weights of the plate pans are recorded and the pans are brought back outside. This procedure is repeated until the final plate on the test stand has failed. The rate for any holdover time test in natural snow is obtained by computing the time-weighted average of the rates collected in the upper and lower pans over the duration of the particular test.

TABLE 2.3DETAILED RATE DISTRIBUTIONSimulated Precipitation Conditions
Freezing Drizzle (low rate)ZD AT NRC (-3°C)
DETAILED RATE OF PRECIPITATION
FORM: 1PAN Plate t1 t2 w1 w2 w2-w1 t2-t1 RATE
# Loc. TIME TIME WEIGHT WEIGHT (g) (min) (g/dm²/h)BEFORE AFTER BEFORE AFTER
3 2-top left 14:02 14:34 81.6 88.8 7.2 31.9 5.0
4 2-top right 14:02 14:34 81.6 88.6 7 31.9 4.9
5 2-bottom left 14:02 14:34 81.8 89.2 7.4 31.9 5.2
6 2-bottom right 14:02 14:34 81.6 89.2 7.6 31.9 5.3
3 4 5 STD DEV
5.0 4.9 -1.4% -4.1% 0.1815.2 5.3 1.4% 4.1%5 6
X Axis Area Full YPartial
Speed High YLow
Y Axis Area Full YPartial
Speed High YLow
Freezing Drizzle (high rate)ZD AT NRC (-3°C)
DETAILED RATE OF PRECIPITATION
FORM: 1PAN Plate t1 t2 w1 w2 w2-w1 t2-t1 RATE
# Loc. TIME TIME WEIGHT WEIGHT (g) (min) (g/dm²/h)BEFORE AFTER BEFORE AFTER
3 5-top left 12:12 12:43 81.8 98.8 17 30.8 12.34 5-top right 12:12 12:43 81.6 98.8 17.2 30.8 12.55 5-bottom left 12:12 12:43 81.6 100.2 18.6 30.8 13.56 5-bottom right 12:12 12:43 81.6 100.2 18.6 30.8 13.5
3 4 12.9 STD DEV12.3 12.5 -4.8% -3.6% 0.63113.5 13.5 4.2% 4.2%5 6
X Axis Area Full YPartial
Speed High YLow
Y Axis Area Full YPartial
Speed High YLow
38cm1680/reports/holdover time/Table2.3
9/13/2005, 9:38 AM

2. METHODOLOGY
X:\@APS ARCHIVE\CM1680 (exBM3833) TC-Deicing 00-01 (REPORTS ONLY)\Reports\HOT\Final Version 1.0\Final Version 1.0.doc Final Version 1.0
August 05APS AVIATION INC.
39
An example of the rate calculation method for tests in natural snow conditions is displayed in Figure 2.4. Typically, two collections pans are used for each test. The start and end times of the test are 10:15 and 10:45, respectively. Precipitation rates for one pan were collected at three periods during this test, indicated by t1, t2, and t3 (minutes). The calculated rates for each collection period are indicated by R1, R2, and R3 (g/dm2/h). In order to calculate the average rate for this pan, the following formula is then used:
(R1 x t1 + R2 x t2 + R3 x t3) t1 +t2+t3
In the example shown in Figure 2.4, the rate is calculated as follows:
(25 x 10 + 22 x 8 + 34 x 5) 10 + 8 +5
The calculated average rate for this pan is 25.9 g/dm2/h. The average rate for the other collection pan is calculated in a similar fashion, and the average of the two rates is then taken.
2.6 Data Forms
Two data forms were used to manually record data at Dorval during the 2000-01 winter season. The form used to record fluid failure times for each crosshair on the plates is shown in Table 2.4. The second form (Table 2.5) was used to record data related to meteorological conditions during tests. One half of the form was designated for plate pan precipitation rate measurements, and the rest for recording meteorological conditions. The data forms used in simulated precipitation tests at NRC were similar to those used in natural precipitation tests and are shown in Appendix C. 2.7 Fluids 2.7.1 General
Type I fluids were obtained from manufacturers in concentrated form. Tests with Type I fluids in the 2000-01 winter were conducted with diluted solutions specific to particular test temperature requirements. Whenever fluid dilution was required, the concentrations were adjusted by mixing with hard water and verified by measuring the refractive index of the resulting solution.

40
cm1680/report/holdover time/Rate ExampleAt: RATE
FIGURE 2.4
CALCULATION OF OUTDOOR PRECIPITATION RATETYPICAL TEST
0
10
20
30
40
50
60
70
80
10:00 10:05 10:10 10:15 10:20 10:25 10:30 10:35 10:40 10:45 10:50 10:55 11:00
Time of Day
Plat
e Pa
n Pr
ecip
itatio
n Rat
e (g
/dm
²/h)
R1
t1t2
t3
R3
R2
wheret = time (min)R = Precipitation Rate (g/dm²/h)
Start of Test End of Test
Rate = (R1 x t1 + R2 x t2 + R3 x t3) t1 +t2+t3
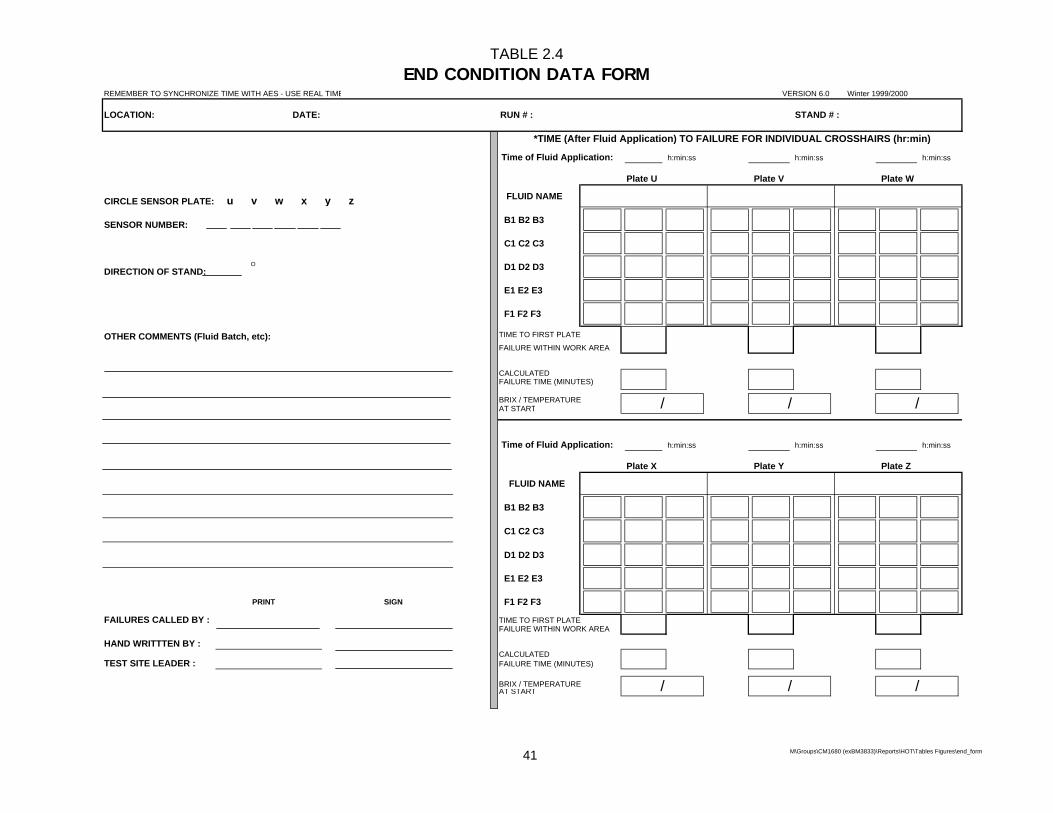
TABLE 2.4END CONDITION DATA FORM
REMEMBER TO SYNCHRONIZE TIME WITH AES - USE REAL TIME VERSION 6.0 Winter 1999/2000
LOCATION: DATE: RUN # : STAND # :
*TIME (After Fluid Application) TO FAILURE FOR INDIVIDUAL CROSSHAIRS (hr:min)
Time of Fluid Application: h:min:ss h:min:ss h:min:ss
Plate U Plate V Plate W
CIRCLE SENSOR PLATE: u v w x y z FLUID NAME
SENSOR NUMBER: B1 B2 B3
C1 C2 C3
DIRECTION OF STAND: O D1 D2 D3
E1 E2 E3
F1 F2 F3
OTHER COMMENTS (Fluid Batch, etc): TIME TO FIRST PLATE
FAILURE WITHIN WORK AREA
CALCULATEDFAILURE TIME (MINUTES)
BRIX / TEMPERATUREAT START
Time of Fluid Application: h:min:ss h:min:ss h:min:ss
Plate X Plate Y Plate Z
FLUID NAME
B1 B2 B3
C1 C2 C3
D1 D2 D3
E1 E2 E3
PRINT SIGN F1 F2 F3
FAILURES CALLED BY : TIME TO FIRST PLATEFAILURE WITHIN WORK AREA
HAND WRITTTEN BY :CALCULATED
TEST SITE LEADER : FAILURE TIME (MINUTES)
BRIX / TEMPERATUREAT START
/ / /
/ / /
41 M\Groups\CM1680 (exBM3833)\Reports\HOT\Tables Figures\end_form

TABLE 2.5METEO/PLATE PAN DATA FORM
REMEMBER TO SYNCHRONIZE TIME WITH AES - USE REAL TIME VERSION 6.0 Winter 98/99
LOCATION: DATE: RUN # : STAND # :
HAND HELD VIDEO CASSETTE #:
PLATE PAN WEIGHT MEASUREMENTS * METEO OBSERVATIONS **
t t w w COMPUTE TYPE (Fig. 4) CLASSIF. If SNOW,PAN TIME BUFFER TIME BUFFER WEIGHT WEIGHT RATE TIME ZR, ZL,S, SG (See Fig. 3) WET or DRY
# BEFORE TIME AFTER TIME BEFORE AFTER ( w*4.7/ t) (h:min) IP, IC, BS, SP
(hh:mm:ss) (Seconds) (hh:mm:ss) (Seconds) (grams) (grams) (g/dm2/h)
**observations at beginning, end, and every 10 min. intervals. Additional observations when there are significant changes.
TEMPERATURE AT START OF TEST ºC
WIND SPEED AT START OF TEST kph
WIND DIRECTION AT START OF TEST º
COMMENTS :
PRINT SIGN
WRITTEN & PERFORMED BY :
VIDEO BY :
TEST SITE LEADER :
*measurements every 15 min. and at failure time of each test panel.
42 M\Groups\CM1680 (exBM3833)\Reports\HOT\Tables Figures\meteo_form

2. METHODOLOGY
X:\@APS ARCHIVE\CM1680 (exBM3833) TC-Deicing 00-01 (REPORTS ONLY)\Reports\HOT\Final Version 1.0\Final Version 1.0.doc Final Version 1.0
August 05APS AVIATION INC.
43
The hard water was produced according to AMS 1424. To produce 18 L of hard water, 6.54 g of Calcium Acetate Monohydrate and 5.04 g of Magnesium Sulfate Heptahydrate were weighed and added to 18 L of distilled water.
All holdover time testing conducted with Type I fluids during the 2000-01 winter used solutions diluted to a 10°C buffer. The 10°C buffer implies that for any test, the diluted test solution must possess a freeze point 10°C below that of the ambient test temperature. For example, if a given test was performed at 0ºC, the concentration of the test solution was adjusted for the fluid to freeze at -10ºC. Type II and Type IV fluids are often delivered by manufacturers to air carriers at a concentration designated as neat (100 percent). These fluids actually contain a minimum of 50 percent glycol and are thickened by incorporating additives to the fluid formulations. These additives are rheological and therefore modify the viscosities and flow properties of the fluid. The modified formulations enable anti-icing fluids to assume thicker films and to remain on the aircraft surfaces until the time of takeoff. In some cases, (mostly in Europe), neat Type II and Type IV fluids are mixed with water as follows:
• 75 percent neat formulation and 25 percent water by volume. These are
designated Type II or Type IV 75/25; and • 50 percent neat formulation and 50 percent water by volume. These are
designated Type II or Type IV 50/50. 2.7.2 Fluids Tested The de/anti-icing fluids used in tests in 2000-01 were formulated with ethylene glycol (EG), propylene glycol (PG) or diethylene glycol (DEG). Type I testing with fluids diluted to a 10°C buffer was carried out using Lyondell ArcoPlus (PG); an experimental fluid from Lyondell, originally designated ArcoPlus-ST (PG); Clariant EG I 1996 (EG); Clariant MP I 1938 (PG); and Newave Aerochemical FCY-1A (EG). All five Type I fluids were provided to APS in their concentrated form. Subsequent dilution was performed with the addition of hard water. To prepare the fluids for endurance time testing, hard water and concentrated Type I fluid was mixed in 10 L containers according to the mixture recipes prepared for each fluid (Appendix E). Following the mixture of any dilute fluid, the refractive index was verified to ensure the accuracy of the fluid freeze point. If the freeze point of the mixed fluid matched that indicated in Appendix E Table 1, the fluid was ready for testing. If the freeze point did not match that

2. METHODOLOGY
X:\@APS ARCHIVE\CM1680 (exBM3833) TC-Deicing 00-01 (REPORTS ONLY)\Reports\HOT\Final Version 1.0\Final Version 1.0.doc Final Version 1.0
August 05APS AVIATION INC.
44
indicated in the table, either concentrated fluid or hard water was added to the mixture. This step was repeated until the desired freeze point was attained.
One Type II fluid, SPCA Ecowing 26 (PG) was tested in 2000-01. Four Type IV fluids were also tested: Clariant Safewing MP IV Protect 2012 (PG), Clariant MP IV 2015 TF (PG), Octagon Max-Flight (PG), and an experimental fluid from UCAR (DEG). In addition, a limited investigation was performed with a degraded viscosity sample of Kilfrost ABC-S that was also tested in the 1999-2000 winter.
A list of the fluids requested for testing, the dates they were received, batch numbers, and fluid freeze points has been compiled in Table 2.6. The fluids were received in 20 L containers or in 200 L drums. For anti-icing fluids, the addition of hard water to obtain either 50/50 or 75/25 formulations was carried out by the fluid manufacturers in their production facilities.
2.7.3 Evolution of Type IV Fluids Tests with several Type IV fluids have been conducted since 1996; however, some fluids are no longer available or the formulations have been modified.
The fluid viscosities of the different anti-icing fluids used in testing have also changed. In holdover time testing conducted in 1996-97 and 1997-98, Type IV fluids consisted mainly of mid-range viscosity fluids. In 1998-99, tests were conducted using fluids representative of the manufacturers’ lowest recommended on-wing viscosity. In 1999-2000 and 2000-01, the viscosities of the various fluids tested were selected by the fluid manufacturers using the sample selection procedures agreed upon at the SAE G-12 Fluids Subcommittee meeting in Toronto in 1999. Fluid-specific holdover time guidelines were developed for the anti-icing fluids, and these are described in detail in Subsection 4.2.1 of this report.
A summary of the changes for each fluid is presented below according to manufacturer. 2.7.3.1 Union Carbide/Dow UCAR Ultra was the first fluid tested several years ago and had far superior holdover times than other Type II fluids. This fluid led to the development of Type IV fluids. An improved formulation, UCAR Ultra+, was tested in 1996-97 and 1998-99. Following the initial testing with UCAR Ultra+, APS was informed that the fluid was not certified for use in diluted forms.

TABLE 2.6FLUID REQUEST/RECEIPT
Bot
tle FluidManufac.
FluidType
DateReceived
QuantityOrdered(Litres)
BrandName
Received
QuantityReceived(Litres)
Batch#
BrixStated/Freezing Point
(°C)
BrixMeasured
Viscosity Stated Using Manufacturer's
Method (mPas)
Viscosity Measured Using Manufacturer's
Method (mPas)Comments
S Octagon T IV Neat October 10, 2000 - Maxflight 80 F- 21290 37 5900 5990T Octagon T IV 75/25 October 10, 2000 - Maxflight 60 F- 21290 28.75 - 34950 *U Octagon T IV 50/50 October 10, 2000 - Maxflight 40 F- 21290 21 - 41300 *
V Kilfrost T IV Neat March 27, 2000 - ABC-S - degraded viscosity 20 P711 36.25 2600 2450
Z Lyondell T I October 25, 2000 200 ARCOPLUS ST 4CE 101 311 - - - - AG CAAC T I February 18, 2001 200 Newave Aerochemical FCY-1A - - - -
L Clariant T IV Neat January 28, 2001 300 Safewing MP IV 2015 TF 300 TV 324 -34°C 18400 15100M Clariant T IV 75/25 January 28, 2001 200 Safewing MP IV 2015 TF 200 TV 324 -21°C 19200 16500N Clariant T IV 50/50 January 28, 2001 140 Safewing MP IV 2015 TF 100 TV 324 -10°C 3800 2200W Clariant T IV Neat January 8, 2001 300 Safewing MP IV Protect 2012 300 TV 317 -34°C 35 9800 7800 ShearedX Clariant T IV 75/25 January 8, 2001 200 Safewing MP IV Protect 2012 200 TV 317 -21°C 27.5 17200 13900 ShearedY Clariant T IV 50/50 January 8, 2001 140 Safewing MP IV Protect 2012 140 TV 317 -10°C 18.5 6200 6800 Sheared
AH UCAR DOW T IV Neat March 9, 2001 18 MJM 101 18 MJM 101 15475 15500 small sampleUCAR DOW T IV 75/25 March 9, 2001 18 MJM 101 18 MJM 101UCAR DOW T IV 50/50 March 9, 2001 18 MJM 101 18 MJM 101
AD SPCA T II Neat February 18, 2001 300 ECOWING 26 300 L 1043 -36°C 36.5 5200 4900AE SPCA T II 75/25 February 18, 2001 200 ECOWING 26 200 L 1043 -21°C 28.75 3400 3700AF SPCA T II 50/50 February 18, 2001 140 ECOWING 26 140 L 1043 -10°C 20 1300 1000
* Viscosity was not stable
45 MGroups\CM1680 (exBM3833)\Reports\HOT\Tables Figures\FLD_REQ

2. METHODOLOGY
X:\@APS ARCHIVE\CM1680 (exBM3833) TC-Deicing 00-01 (REPORTS ONLY)\Reports\HOT\Final Version 1.0\Final Version 1.0.doc Final Version 1.0
August 05APS AVIATION INC.
46
Two additional Type IV fluids from Union Carbide, UCAR Ultra IV and UCAR PG AAF, were tested in 1997-98; however, these fluids were never produced. In 2000-01, APS tested an experimental Type IV fluid on behalf of Union Carbide/Dow. Dow requested that testing with this product be discontinued prior to its completion.
2.7.3.2 Clariant/Hoechst Type IV Hoechst MPIV 1957 was first tested during the winter of 1996-97. In the winter of 1997-98, the manufacturer changed its name to Clariant and reformulated the MPIV 1957 product. For clarity, the fluid tested in 1996-97 is referred to as Hoechst MPIV 1957, while the fluid tested in 1997-98 and 1998-99 is referred to as Clariant MPIV 1957. In addition, Clariant developed a new Type IV fluid, Clariant MPIV 2001, which was tested in 1997-98. Additional testing was conducted with the MPIV 2001 product in 1999-2000 in conditions of freezing fog and rain on a cold-soaked wing.
In 1998-99, APS was provided with another Type IV fluid for testing: Clariant Safewing Four. Despite having tested the fluid in all conditions in 1998-99, Clariant chose not to produce the fluid in 1999-2000. In 1999-2000, Clariant provided APS with two samples of a newly formulated Clariant Safewing Four product, a high viscosity sample (Safewing Four Plus) and a low viscosity sample (Safewing Four). Following the SAE meetings in Toulouse in May 2000, APS was informed that the Clariant Safewing Four Plus would not be produced commercially.
In 2000-01, Clariant furnished APS with two additional Type IV fluids for testing, Clariant Safewing MPIV Protect 2012 and Clariant Safewing MPIV 2015 TF. The test results for both fluids were presented at the SAE G-12 Holdover Time Subcommittee meeting in New Orleans in May 2001. Shortly after the meeting, Clariant informed the industry that the 2015 TF product would not be manufactured. In September 2001, APS was informed that production of Clariant Safewing Four would be discontinued immediately. 2.7.3.3 SPCA
SPCA AD-404 was tested in the 1995-96 and 1997-98 winters. A new Type IV fluid, SPCA AD-480, was tested for the first time in 1997-98. Additional testing with the AD-480 fluid was conducted in natural snow in 1998-99 due to a lack of data points at cold temperatures from the previous year. A low viscosity sample of the AD-480 product was tested again in 1999-2000. SPCA AD-404 is no longer available.

2. METHODOLOGY
X:\@APS ARCHIVE\CM1680 (exBM3833) TC-Deicing 00-01 (REPORTS ONLY)\Reports\HOT\Final Version 1.0\Final Version 1.0.doc Final Version 1.0
August 05APS AVIATION INC.
47
2.7.3.4 Kilfrost
Type IV Kilfrost ABC-S fluid was tested during three seasons: 1996-97, 1997-98, and 1998-99. A degraded viscosity sample of the Kilfrost ABC-S was delivered to APS during the 1999-2000 and 2000-01 winters for holdover time testing. In this case, a degraded fluid would be considered to have changed/altered from its primary/natural state, either as a result of time or by the influence of precipitation. 2.7.3.5 Octagon
Type IV Octagon Max-Flight was tested during four seasons: 1996-97, 1997-98, 1998-99, and 2000-01. In 1998-99, Octagon supplied APS with a low viscosity sample of Max-Flight for holdover time testing. The result was substantially lower fluid-specific holdover times.
In 2000-01, Octagon tested a higher viscosity sample of Max-Flight in an attempt to increase the fluid-specific holdover times for this fluid. The results of 1998-99 tests with the low viscosity fluid were discarded and are not included in this report.
2.8 Personnel The site at Dorval was staffed mainly by technicians and university students, and supervised by APS project staff. Depending on the rate and duration of precipitation, as many as four test stands were in use at Dorval. Nine testers with the following responsibilities (see Appendix B, Attachment II for details) were enlisted to operate four test stands:
• Test Site Leader (1): Supervise and train site personnel, ensure that the site is functional, and ensure that test procedures are adhered to. Video-record fluid failure, as required;
• End Condition (4): Record end condition times for each crosshair;
and • Meteo (4): Record meteorological conditions during every
test. Because prolonged precipitation events require backup personnel, a fairly large number of technicians were trained to perform experiments. Due to the nature,

2. METHODOLOGY
X:\@APS ARCHIVE\CM1680 (exBM3833) TC-Deicing 00-01 (REPORTS ONLY)\Reports\HOT\Final Version 1.0\Final Version 1.0.doc Final Version 1.0
August 05APS AVIATION INC.
48
scale, and schedule of the testing (both holdover time and full-scale) and the requirement to keep costs to a minimum, a pool of students was considered to be the best option for the manpower requirements of these tests.
Personnel responsibilities for the cold chamber indoor tests were slightly different. To ensure that the cold chamber facility was utilized at all times, technicians were often assigned specific tasks. For example, fluids were prepared, mixed, cooled and replenished after every test. During cold-soak testing, one technician verified that the cold-soak boxes were properly thermostatted. To ensure accurate precipitation rate measurements, the rate measurement procedure was semi-automated and a technician was assigned the task of calculating and displaying printed summaries of the precipitation rates. A computer and printer were dedicated for this process.
In order to obtain consistent results from fluid failure calls, the same individual has recorded the end conditions for the NRC freezing precipitation tests since the 1996-97 test season. This individual has pilot experience, was available during all natural snow tests conducted at Dorval Airport, and supervised most of the failure calls.
2.9 Analysis Methodology This section of the report describes the various categories of precipitation and the precipitation rate limits used during the course of holdover time testing. The process of data analysis used in the evaluation of fluid holdover times is also described. 2.9.1 Descriptions of Data Ranges and Precipitation Definitions
The test program developed to measure fluid failure times was carried out in five general categories of precipitation:
• Natural snow; • Freezing drizzle; • Light freezing rain; • Freezing fog; and • Rain on a cold-soaked surface.
Tests were conducted over temperature and precipitation rate ranges specific to each category of precipitation. A multi-variable regression analysis was used to evaluate fluid holdover times (first presented in Transport Canada report, TP 13131E [11]). This procedure is based on the refinement of an equation for

2. METHODOLOGY
X:\@APS ARCHIVE\CM1680 (exBM3833) TC-Deicing 00-01 (REPORTS ONLY)\Reports\HOT\Final Version 1.0\Final Version 1.0.doc Final Version 1.0
August 05APS AVIATION INC.
49
a curve that best represents the fluid failure time test data, and involves solving that equation at the upper and lower limits of a defined precipitation range. To support this procedure, precipitation rate limits for each specific category of precipitation were defined, reviewed, and approved. The precipitation rate limits used for the evaluation of holdover times are represented schematically in Figure 2.5. Detailed definitions and explanations of the data types and ranges are described in the following subsections. Meteorological definitions of these conditions are outlined in Table 2.1. 2.9.1.1 Natural snow All fluid failure tests in natural snow were conducted at the APS Dorval Airport test site. Data were collected for precipitation rates that ranged from less than 10 g/dm2/h to greater than 25 g/dm2/h. However, upper and lower limits for each cell in this column of the holdover time tables were determined at rates of 10 and 25 g/dm2/h, respectively. If precipitation rates less than the lower limit (light snow) were encountered in actual operation, the upper time limit of the holdover time range was selected for use.
The upper precipitation rate limit (25 g/dm2/h) corresponds to the onset of heavy snow. Above this rate, it is standard practice to refer to the cautionary note included in the holdover time tables indicating that the time of protection will be shortened in heavy weather conditions (i.e., heavy precipitation or high moisture content). 2.9.1.2 Freezing drizzle Freezing drizzle is considered to occur over the range of 0 to 12.7 g/dm2/h. The upper limit in this range was not specifically defined in Table 2.1, but has been adopted based on discussions with meteorological experts and aircraft operators on the SAE G-12 Holdover Time Subcommittee. For test purposes, the precipitation rate spectrum for freezing drizzle is confined to rates between 5 and 12.7 g/dm2/h, inclusively. This rate range corresponds to heavy drizzle and was selected to provide aircraft operators with a greater margin of safety.

FIGURE 2.5
PRECIPITATION RATE RANGES USED FOR EVALUATION OF HOLDOVER TIME LIMITS
Rate of Precipitation (g/dm²/h)
0 5 10 15 20 25 76
FOG
ZD
12.7
ZR
SNOW
ROCSW
2
H:cm1680/report/hot/ranges.ppt
Conditions
Fog
Snow
ROCSW: Rain on Cold-Soaked Wing
ZD: Freezing Drizzle
ZR: Freezing Rain
50
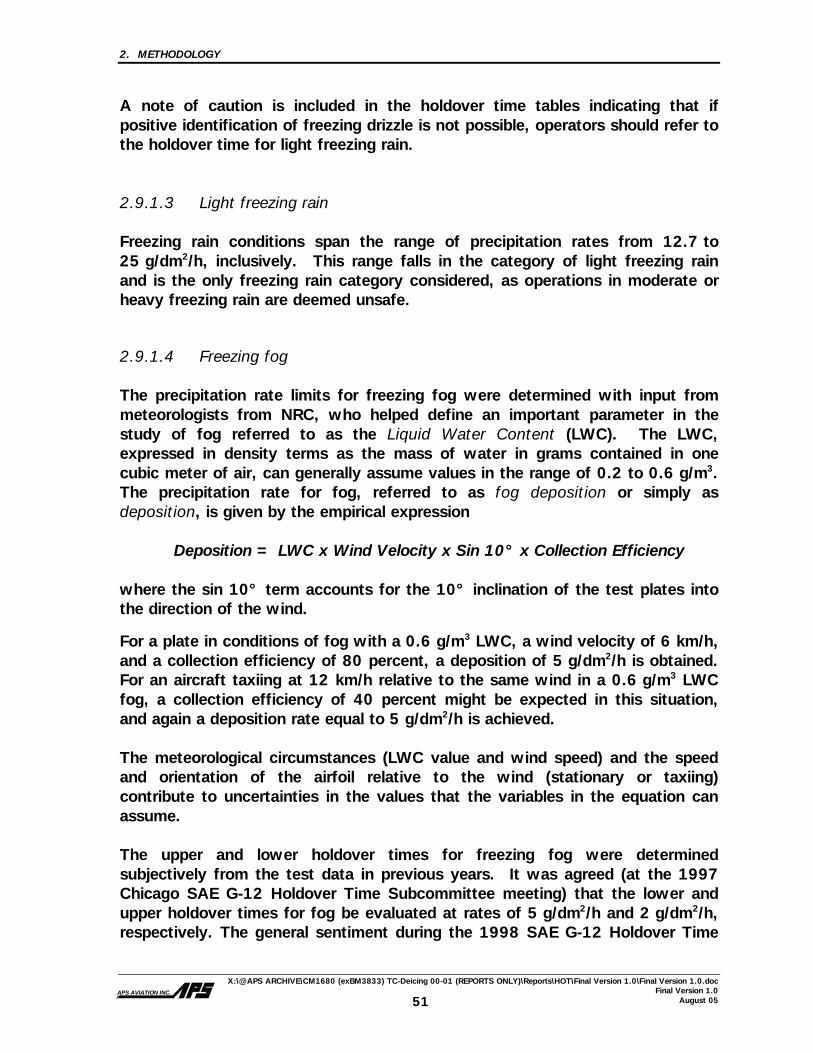
2. METHODOLOGY
X:\@APS ARCHIVE\CM1680 (exBM3833) TC-Deicing 00-01 (REPORTS ONLY)\Reports\HOT\Final Version 1.0\Final Version 1.0.doc Final Version 1.0
August 05APS AVIATION INC.
51
A note of caution is included in the holdover time tables indicating that if positive identification of freezing drizzle is not possible, operators should refer to the holdover time for light freezing rain. 2.9.1.3 Light freezing rain Freezing rain conditions span the range of precipitation rates from 12.7 to 25 g/dm2/h, inclusively. This range falls in the category of light freezing rain and is the only freezing rain category considered, as operations in moderate or heavy freezing rain are deemed unsafe. 2.9.1.4 Freezing fog The precipitation rate limits for freezing fog were determined with input from meteorologists from NRC, who helped define an important parameter in the study of fog referred to as the Liquid Water Content (LWC). The LWC, expressed in density terms as the mass of water in grams contained in one cubic meter of air, can generally assume values in the range of 0.2 to 0.6 g/m3. The precipitation rate for fog, referred to as fog deposition or simply as deposition, is given by the empirical expression
Deposition = LWC x Wind Velocity x Sin 10° x Collection Efficiency
where the sin 10° term accounts for the 10° inclination of the test plates into the direction of the wind.
For a plate in conditions of fog with a 0.6 g/m3 LWC, a wind velocity of 6 km/h, and a collection efficiency of 80 percent, a deposition of 5 g/dm2/h is obtained. For an aircraft taxiing at 12 km/h relative to the same wind in a 0.6 g/m3 LWC fog, a collection efficiency of 40 percent might be expected in this situation, and again a deposition rate equal to 5 g/dm2/h is achieved.
The meteorological circumstances (LWC value and wind speed) and the speed and orientation of the airfoil relative to the wind (stationary or taxiing) contribute to uncertainties in the values that the variables in the equation can assume. The upper and lower holdover times for freezing fog were determined subjectively from the test data in previous years. It was agreed (at the 1997 Chicago SAE G-12 Holdover Time Subcommittee meeting) that the lower and upper holdover times for fog be evaluated at rates of 5 g/dm2/h and 2 g/dm2/h, respectively. The general sentiment during the 1998 SAE G-12 Holdover Time

2. METHODOLOGY
X:\@APS ARCHIVE\CM1680 (exBM3833) TC-Deicing 00-01 (REPORTS ONLY)\Reports\HOT\Final Version 1.0\Final Version 1.0.doc Final Version 1.0
August 05APS AVIATION INC.
52
Subcommittee meeting in Vienna was that 2 g/dm²/h was not indicative of low-rate natural fog. As a result, the upper holdover times in each of the freezing fog cells of the holdover time tables remained the same in the 1998-99 winter operating season. During a meeting of the Workgroup on Laboratory Methods to Derive Holdover Time Guidelines in Montreal in March 1999, it was again agreed that the rate of 2 g/dm2/h would be used in subsequent holdover time testing to determine the upper holdover time limit in freezing fog conditions. Substantial improvements were made to the freezing fog spray delivery system during the 1998-99 test season. These changes afforded improved control over fog deposition rates during 1998-99 and 1999-2000 indoor tests. In previous years, freezing fog was sprayed horizontally from the walls of the chamber onto the test plates. In 1998-99, the spray assembly was positioned above the test stand, allowing the freezing fog to be sprayed vertically down onto the plates. In addition, a snowfence was set up at the NRC chamber for freezing fog tests to shield the spray assembly from horizontal air currents caused by the cooling systems (see Photo 2.15).
A study to quantify freezing fog deposition rates was conducted by APS during the 1999-2000 season. The objective of this study was to calculate and correlate the range of deposition rates that occurs naturally in fog with the range from 2 g/dm2/h to 5 g/dm2/h achieved in environmental chambers. For a full account of these tests, refer to Subsection 6.4 of TP 13659E [2]. 2.9.1.5 Rain on a cold-soaked surface
Data used for the evaluation of holdover times for this category of precipitation were limited to precipitation rates ranging from 5 to 76 g/dm2/h, which encompasses drizzle (5 to 12.7 g/dm2/h), light rain (12.7 to 25 g/dm2/h), and moderate rain (25 to 76 g/dm2/h). The heavy rain category is covered by the cautionary note at the bottom of the holdover time table regarding heavy weather conditions. 2.9.2 Protocol for the Determination of Holdover Times Each cell in a holdover time table represents a range of time during which a fluid at a specified concentration will provide protection for a particular temperature range in a particular category of precipitation. The Type II and Type IV holdover time tables are composed of a maximum of 45 cells. Each cell contains a lower and upper time limit (except for frost) for a maximum of 81 time values.

2. METHODOLOGY
X:\@APS ARCHIVE\CM1680 (exBM3833) TC-Deicing 00-01 (REPORTS ONLY)\Reports\HOT\Final Version 1.0\Final Version 1.0.doc Final Version 1.0
August 05APS AVIATION INC.
53
Holdover time values in each cell are determined by plotting failure time versus rate of precipitation and recording the failure time at two pre-selected rate limits. In previous years, several protocols were employed in determining endurance times. Due to the subjective natures of these different protocols, different interpretations of the data were possible. A multi-variable regression approach was subsequently devised in 1996-97 (see Transport Canada report, TP 13131E [11]) and has been used to evaluate fluid endurance times for the past four test seasons. Endurance times were then converted to holdover times by the SAE G-12 Holdover Time Subcommittee. 2.9.2.1 Multi-variable regression protocol Data corresponding to each cell in the holdover time table were assembled and sorted according to precipitation type, fluid manufacturer, dilution factor, and temperature range. The data for each fluid and each cell in the holdover time table were plotted. The data points on each graph were used to fit an equation of the form
t = cRa
where t = Time (minutes);
R = Rate of precipitation (g/dm2/h); and a,c = Coefficients determined from the regression.
The coefficient a gives the rate dependency of the failure time.
A plot of Log t versus Log R is shown in Figure 2.6. The plot contains data from one temperature range for one Neat Type IV fluid in light freezing rain conditions. The best-fit regression line is superimposed onto the plot and was obtained from the analysis using the lowest temperature in the temperature range from which the data were selected.
The same data plotted on a linear scale (failure time t versus precipitation rate R) are shown in Figure 2.7.
The curve, generated from the power law form of the equation using the coefficients determined from the fit, is superimposed onto the plot. The holdover time range is determined from the intersections of the curve with the precipitation rate limits defined for light freezing rain.


2. METHODOLOGY
X:\@APS ARCHIVE\CM1680 (exBM3833) TC-Deicing 00-01 (REPORTS ONLY)\Reports\HOT\Final Version 1.0\Final Version 1.0.doc Final Version 1.0
August 05APS AVIATION INC.
55
The holdover times for this fluid at -10°C are 34 minutes at 12.7 g/dm2/h and 20 minutes at 25 g/dm2/h, establishing the holdover time range for this particular fluid. This illustrates the general approach used in the determination of a fluid holdover time range for any given cell in the holdover time table. Appendix F lists the results of all the regression analyses performed and includes all the corresponding equations, with their associated coefficients determined, from each analysis and their associated output summaries. The categories of precipitation are separated into five groups: natural snow, freezing drizzle, light freezing rain, freezing fog, and rain on a cold-soaked surface. Each group was subject to a slightly modified version of the general equation given above, as described below.
• Light Freezing Rain and Freezing Drizzle
The equation used to treat the data in these categories of precipitation is the unaltered form of the original equation: t = cRa Tests in freezing drizzle and light freezing rain were conducted at predetermined temperature limits (-3 and -10°C). The best-fit curves for data corresponding to a given cell in the holdover time table in these conditions were also obtained by using the most restrictive (lowest) temperature cell range.
An exception was made for temperatures above 0°C. Because experiments for freezing drizzle and light freezing rain could not be performed artificially at temperatures above 0°C, the equation could not be calculated for this temperature range. Consequently, Type IV endurance times noted in the holdover time table for temperatures above 0°C were obtained by using the same values calculated at -3°C. For Type I fluids, the times from tests at -10°C were used in the Above 0°C cell.
• Simulated Freezing Fog
The same method used to evaluate freezing fog data in 1996-97 (see Transport Canada report, TP 13131E [11]) was also used to evaluate 2000-01 freezing fog data. The original equation is used to treat the data:
t = cRa
2. METHODOLOGY
X:\@APS ARCHIVE\CM1680 (exBM3833) TC-Deicing 00-01 (REPORTS ONLY)\Reports\HOT\Final Version 1.0\Final Version 1.0.doc Final Version 1.0
August 05APS AVIATION INC.
56
• Natural Snow
The general form of the regression equation was modified for natural snow by substituting (2-T) for the variable T to prevent taking the log of a negative number, as natural snow can occur at temperatures approaching 2°C. t = cRa(2-T)b Best-fit curves were plotted for each fluid in each cell of the snow column using the most restrictive (lowest) temperature for that cell. For example, in cases of natural snow tests conducted at ambient temperatures above 0°C, the temperature value used in the procedure was 0°C.
The upper and lower holdover time values were determined from the points at which the best-fit curve intersects the lower and upper precipitation limits, respectively.
• Rain on a Cold-Soaked Wing
The same method for the evaluation of holdover times in light freezing rain and freezing drizzle was used for this category of precipitation.
2.9.3 Determination of Generic and Fluid-Specific Holdover Times At the SAE Holdover Time Subcommittee meeting in Chicago in July 1997, Type IV fluid holdover times obtained using the multi-variable regression protocol of data analysis were presented. Wide variations in fluid performance among the different Type IV fluid brands precipitated the development of a generic or SAE Type IV holdover time table as well as fluid-specific Type IV holdover time tables. Generic and fluid-specific holdover time tables have subsequently been generated in 1997-98, 1998-99, 1999-2000, and 2000-01. During the 1998-99 winter testing, a new Type II fluid also demonstrated superior performance in some conditions. This finding resulted in the development of a fluid-specific holdover time table for this fluid. Additional testing of Type II fluids in 1999-2000 and 2000-01 has prompted the compilation of two more Type II fluid-specific tables which will be available for use in 2001-02 winter operations.
The generic holdover time guidelines were endorsed and published by SAE until 2000. The generic holdover time guidelines for use in 2001-02 winter operations will be made available by Transport Canada and the FAA.

2. METHODOLOGY
X:\@APS ARCHIVE\CM1680 (exBM3833) TC-Deicing 00-01 (REPORTS ONLY)\Reports\HOT\Final Version 1.0\Final Version 1.0.doc Final Version 1.0
August 05APS AVIATION INC.
57
2.9.3.1 Generic holdover time guidelines The plots containing the data from tests conducted in the winter of 2000-01 and illustrating the effect of fluid brand and rate of precipitation on holdover time were assembled according to the procedure outlined in Subsection 2.9.2.1 (see Appendix G). The holdover time results from tests conducted in 1996-97, 1997-98, 1998-99, and 1999-2000 used the same regression method of analysis and appear in Section 4 of this report. The results were compared on a cell-by-cell basis to determine the worst possible holdover time values in each cell of the holdover time table. The generic holdover time table for Type IV fluid (approved for use in 2001-02) contains the worst performing fluid holdover time values from tests conducted in 1996-97, 1997-98, 1998-99, 1999-2000, and 2000-01 tests and is included in Section 4.
Although no single worst-case fluid exists, the concept of a worst-case or generic fluid possessing performance characteristics that reflect the worst-case holdover times is useful for the purpose of discussion. The term generic is used in the remainder of this report and refers to a hypothetical fluid that exhibits the worst-case holdover time performance. 2.9.3.2 Fluid-specific holdover time tables The development of a fluid-specific holdover time table was prompted by the fact that certain Type IV fluid brands were observed to significantly outperform other fluids under conditions corresponding to particular cells in the holdover time tables. In general, any one fluid brand does not globally outperform the other fluid brands, but rather does so at a specific dilution, temperature range, and/or category of precipitation.
At the meeting in Chicago in 1997, most members of the SAE G-12 Holdover Time Subcommittee did not favour the creation of fluid-specific tables. However, significant reductions to holdover times for the cells corresponding to the most common Type IV fluid usage convinced the committee of the need to consider the development of fluid-specific and generic tables. Furthermore, some members wanted to take advantage of the significant benefits exhibited by some fluids in certain conditions. Fluid-specific holdover times were adopted for use in 1997-98 and 1998-99 winter operations for the three most commonly occurring precipitation categories in the holdover time tables: freezing drizzle, light freezing rain, and snow. For the other categories of precipitation (freezing fog, rain on cold-soaked surfaces, and frost), generic holdover times were adopted.

2. METHODOLOGY
X:\@APS ARCHIVE\CM1680 (exBM3833) TC-Deicing 00-01 (REPORTS ONLY)\Reports\HOT\Final Version 1.0\Final Version 1.0.doc Final Version 1.0
August 05APS AVIATION INC.
58
Beginning in the 1999-2000 winter operation season, fluid-specific holdover time values were adopted for all categories of precipitation with the exception of frost. Following is a summary of the steps to determine specific values for each fluid:
• The method used to determine holdover times was generally the same as
the one agreed upon in Chicago in 1997 at the SAE G-12 Holdover Time Subcommittee meeting;
• For each cell of the holdover time tables, four tests were typically conducted at the lowest temperature in the temperature range for that cell. Two tests were conducted at the low precipitation rate condition and at the high precipitation rate condition, for a total of four tests per cell;
• For each cell of the holdover time table (except frost), a best-fit power law curve for each fluid was developed from the tests conducted at the low and high precipitation rate condition of that cell;
• Regression-generated holdover times were rounded off to the nearest whole “5” digit. For example, 55.1 to 57.4 minutes was rounded down to 55 minutes; 57.5 to 59.9 minutes was rounded up to 60 minutes;
• In all cases where the regression-generated holdover times were below 10 minutes, the numbers were rounded down as a precautionary measure. For example, 9 minutes was rounded down to 5 minutes; and
• Values were capped at 2 hours for all precipitation conditions except freezing fog, for which they were capped at 4 hours.

2. METHODOLOGY
X:\@APS ARCHIVE\CM1680 (exBM3833) TC-Deicing 00-01 (REPORTS ONLY)\Reports\HOT\Report Components\Photos\Chapter2.doc Final Version 1.0 August 05 59APS AVIATION INC.
Photo 2.1 View of Dorval Test Site and Associated Equipment
Photo 2.2 Environment Canada's Weather Observation Station at Dorval Airport

60
This page intentionally left blank.

2. METHODOLOGY
X:\@APS ARCHIVE\CM1680 (exBM3833) TC-Deicing 00-01 (REPORTS ONLY)\Reports\HOT\Report Components\Photos\Chapter2.doc Final Version 1.0 August 05 61APS AVIATION INC.
Photo 2.3 Outdoor View of National Research Council Canada’s Climatic Engineering Facility
Photo 2.4 Inside View of Small End of Climatic Engineering Facility

62
This page intentionally left blank.

2. METHODOLOGY
X:\@APS ARCHIVE\CM1680 (exBM3833) TC-Deicing 00-01 (REPORTS ONLY)\Reports\HOT\Report Components\Photos\Chapter2.doc Final Version 1.0 August 05 63APS AVIATION INC.
Photo 2.5 Inside View of Large End of Climatic Engineering Facility
Photo 2.6 Sprayer Assembly Used at National Research Council Canada

64
This page intentionally left blank.

2. METHODOLOGY
X:\@APS ARCHIVE\CM1680 (exBM3833) TC-Deicing 00-01 (REPORTS ONLY)\Reports\HOT\Report Components\Photos\Chapter2.doc Final Version 1.0 August 05 65APS AVIATION INC.
Photo 2.7 Sprayer Nozzle
Photo 2.8 Optical Gauge Manufactured by HSS to Measure Droplet Size

66
This page intentionally left blank.
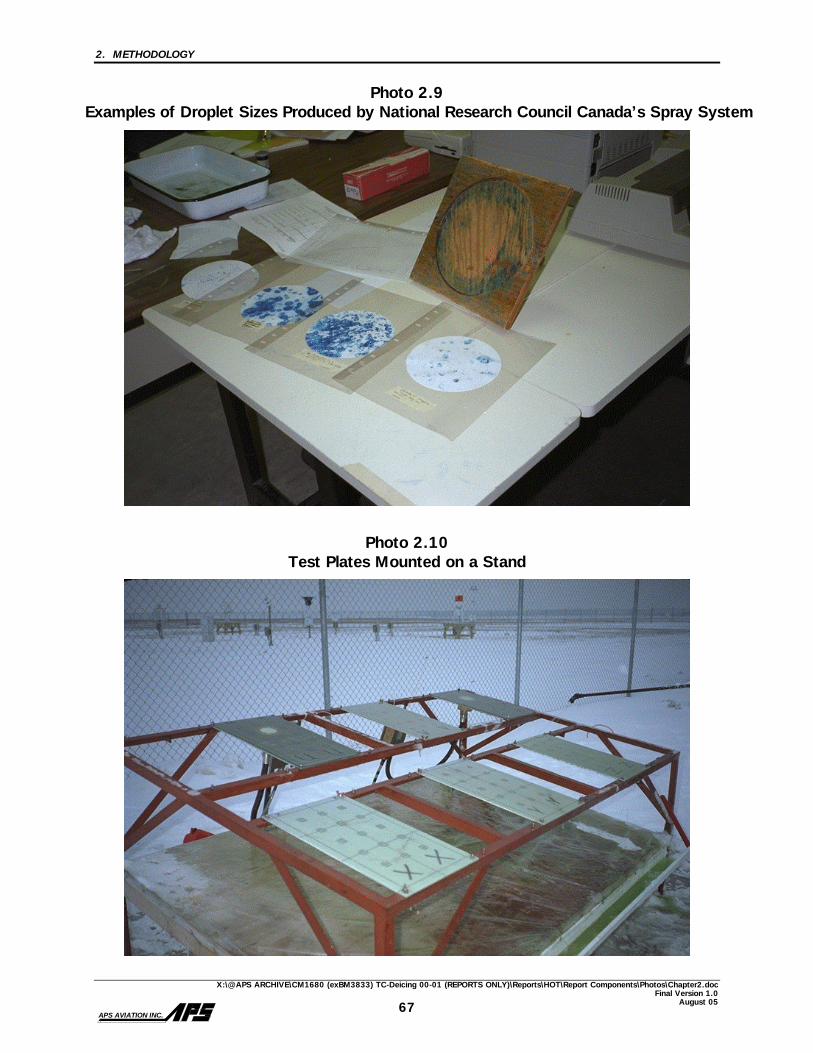
2. METHODOLOGY
X:\@APS ARCHIVE\CM1680 (exBM3833) TC-Deicing 00-01 (REPORTS ONLY)\Reports\HOT\Report Components\Photos\Chapter2.doc Final Version 1.0 August 05 67APS AVIATION INC.
Photo 2.9 Examples of Droplet Sizes Produced by National Research Council Canada’s Spray System
Photo 2.10 Test Plates Mounted on a Stand

68
This page intentionally left blank.

2. METHODOLOGY
X:\@APS ARCHIVE\CM1680 (exBM3833) TC-Deicing 00-01 (REPORTS ONLY)\Reports\HOT\Report Components\Photos\Chapter2.doc Final Version 1.0 August 05 69APS AVIATION INC.
Photo 2.11 Collection Pans Used Indoors at National Research Council Canada
Photo 2.12 Digital Clock Used in Holdover Time Testing

70
This page intentionally left blank.

2. METHODOLOGY
X:\@APS ARCHIVE\CM1680 (exBM3833) TC-Deicing 00-01 (REPORTS ONLY)\Reports\HOT\Report Components\Photos\Chapter2.doc Final Version 1.0 August 05 71APS AVIATION INC.
Photo 2.13 Misco Refractometer Used to Measure Freeze Point
Photo 2.14 Meteorological Services Canada’s Automated Weather Station Instruments

72
This page intentionally left blank.
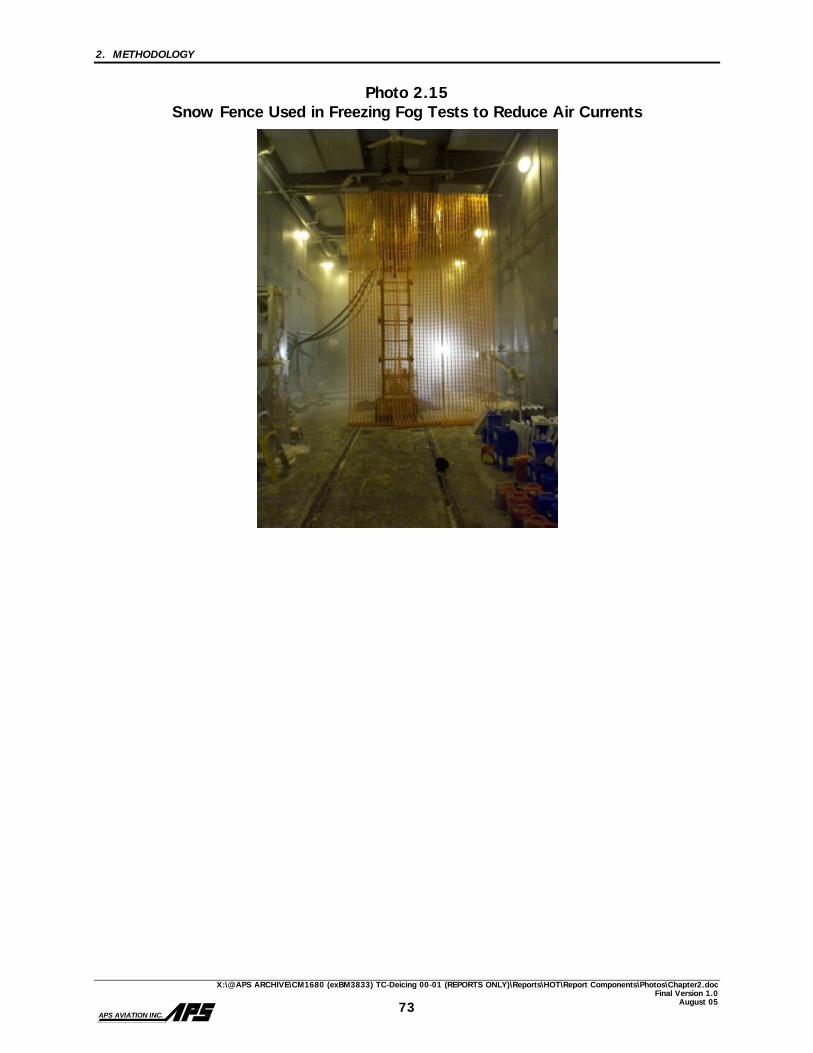
2. METHODOLOGY
X:\@APS ARCHIVE\CM1680 (exBM3833) TC-Deicing 00-01 (REPORTS ONLY)\Reports\HOT\Report Components\Photos\Chapter2.doc Final Version 1.0 August 05 73APS AVIATION INC.
Photo 2.15 Snow Fence Used in Freezing Fog Tests to Reduce Air Currents

74
This page intentionally left blank.

3. DESCRIPTION OF DATA
X:\@APS ARCHIVE\CM1680 (exBM3833) TC-Deicing 00-01 (REPORTS ONLY)\Reports\HOT\Final Version 1.0\Final Version 1.0.doc Final Version 1.0
August 05APS AVIATION INC.
75
3. DESCRIPTION OF DATA This section provides a summary of the number of tests conducted for natural snow, simulated light freezing rain, simulated freezing drizzle, simulated freezing fog, and rain on cold-soaked surfaces. The quantity of tests performed is presented according to fluid type and weather parameters such as temperature, precipitation rate, and wind speed. Natural snow tests were conducted at the APS test site, located at Dorval Airport. A total of 445 usable tests were conducted over the 2000-01 winter season. Simulated light freezing rain, drizzle, fog, and rain on cold-soak box tests were conducted at NRC’s CEF in Ottawa. The complete log of endurance time tests conducted in 2000-01 appears in Appendix K. 3.1 Dorval Natural Snow Tests 3.1.1 Data Acquisition The test plan developed for experiments conducted in natural snow conditions is described in Appendix B. During the 2000-01 test season, a total of 445 tests were performed on flat plates at the APS test site at Dorval Airport. All 445 data points were collected during natural precipitation.
The breakdown, by fluid type, of the 445 usable tests conducted in natural snow is shown in Figure 3.1. Table 3.1 provides a summary of the anti-icing fluid tests that were conducted in natural snow conditions on a month-by-month basis. The largest number of tests was conducted in the month of March. 3.1.2 Test Location and Fluids Tested The Type I, Type II, and Type IV fluids tested at Dorval Airport were manufactured by Clariant, Octagon, Lyondell, Newave Aerochemical, SPCA, and Union Carbide/Dow. Figure 3.1 shows all the fluid brands and dilutions tested in natural snow conditions at Dorval Airport, including the number of tests conducted.

76
I:\Groups\CM1680(exBM3833)\reports\HOT\Figure 3.1At:fig 3.1 (2)
39
15
26
16
27
21
21
25
24
32
11
22
3023 27 18
17
17
19
15
0
10
20
30
40
50
60
70
80
90
100
Num
ber
of T
ests
Type IV Neat Type IV75/25
Type IV50/50
Type II Neat Type II 75/25 Type II 50/50 Type I (10°CBuffer)
FIGURE 3.1NUMBER OF NATURAL SNOW TESTS
2000-01 Test Season at Dorval
UCAR/DOW
Octagon Maxflight
Clariant Safewing MP IV 2015 TF
Clariant Safewing Protect 2012
UCAR /DOW UCAR /DOW
Octagon Maxflight
Octagon Maxflight
Clariant Safewing MP IV 2015 TF
Clariant Safewing MP IV 2015 TF
Clariant Safewing Protect 2012
Clariant Safewing Protect 2012 SPCA Ecowing 26 SPCA Ecowing 26 SPCA Ecowing 26 Clariant EG I 1996
Clariant MP I 1938
Lyondell Arco Plus
Lyondell Arco Plus ST
Newave Aerochemical FCY-1A
Total Tests: 445

TABLE 3.1DORVAL NATURAL SNOW DATA
Type II and Type IV Fluids( Number of Tests: 359 )
Fluid
December JanuarySun Mon Tues Weds Thurs Fri Sat Sun Mon Tues Weds Thurs Fri Sat
1 2 1 2 3 4 5 6
3 4 5 6 7 8 9 7 8 9 10 11 12 13
10 11 12 13 14 15 16 14 15 16 17 18 19 20
4 6 817 18 19 20 21 22 23 21 22 23 24 25 26 27
24 25 26 27 28 29 30 28 29 30 31
4 11 1831
February MarchSun Mon Tues Weds Thurs Fri Sat Sun Mon Tues Weds Thurs Fri Sat
1 2 3 1 2 3
74 5 6 7 8 9 10 4 5 6 7 8 9 10
15 38 12 1911 12 13 14 15 16 17 11 12 13 14 15 16 17
25 39 7118 19 20 21 22 23 24 18 19 20 21 22 23 24
29 14 16 925 26 27 28 25 26 27 28 29 30 31
14
30
1122
685863
2616
CLARIANT SAFEWING MP IV 2015 TF
117
Neat3915
126
2721
UCAR/DOW TYPE IV
Total:
2001
2001
359
50/502432
Total90
27116
2001
75/25
2000
80
212523SPCA ECOWING 26
CLARIANT SAFEWING PROTECT 2012
OCTAGON MAXFLIGHT
77
I:\Groups\CM1680(exBM3833)\reports\HOT\Table 3.1At:test dates

3. DESCRIPTION OF DATA
X:\@APS ARCHIVE\CM1680 (exBM3833) TC-Deicing 00-01 (REPORTS ONLY)\Reports\HOT\Final Version 1.0\Final Version 1.0.doc Final Version 1.0
August 05APS AVIATION INC.
78
3.1.3 Distribution of Average Precipitation Rates
Precipitation at Dorval was measured using plate pans and two automated gauges from Environment Canada (READAC and CR21X). The rates of precipitation used in this report were computed using the plate pan method. Environment Canada gauges were used as a backup and also for evaluation of weather snow data, which is described in a separate report, TP 13830E [9].
The distribution of the average precipitation rate for the tests is summarized in Figure 3.2 for Type IV fluids, Figure 3.3 for Type II fluids, and Figure 3.4 for Type I fluids.
3.1.4 Distribution of Other Meteorological Conditions Air temperature and wind speed data were obtained from Environment Canada’s automated weather station (READAC). In previous years, these parameters were measured with instruments purchased by APS on behalf of Transport Canada. These instruments were used in 2000-01 for weather monitoring purposes only.
A summary of the distribution of the READAC measurements for each fluid type is illustrated in Figures 3.5 to 3.10 as follows:
• Figure 3.5 Distribution of Air Temperature for Type IV Fluids; • Figure 3.6 Distribution of Air Temperature for Type II Fluids; • Figure 3.7 Distribution of Air Temperature for Type I Fluids; • Figure 3.8 Distribution of Wind Speed for Type IV Fluids; • Figure 3.9 Distribution of Wind Speed for Type II Fluids; and • Figure 3.10 Distribution of Wind Speed for Type I Fluids.
3.2 Freezing Drizzle and Light Freezing Rain Tests 3.2.1 Data Acquisition
The test plan developed for experiments conducted in freezing drizzle and light freezing rain is described in Appendix C. A total of 105 freezing drizzle tests and 92 light freezing rain tests were carried out in the 2000-01 winter, as shown in Figure 3.11.

FIGURE 3.2DISTRIBUTION OF PRECIPTATION RATE - TYPE IV FLUIDS
Natural Snow Tests 2001-02
3
19
33
20
11 11 10
3
106
11
0
5
10
15
20
25
30
35N
umbe
r of
Tes
ts
0 4 8 12 16 20 24 28 32 36 38
Rate of Precipitation (±2g/dm²/h)
Type IV Neat
Total Number of Tests: 137Average Precipitation: 17 g/dm2/hMin.= 1 g/dm2/hMax.= 57 g/dm2/h
2
1213
10
7
11
5
8
1
46
0
2
4
6
8
10
12
14
Num
ber
of T
ests
0 4 8 12 16 20 24 28 32 36 38
Rate of Precipitation (±2g/dm²/h)
Type IV 75/25
Total Number of Tests: 79Average Precipitation: 18 g/dm2/hMin.= 1 g/dm2/hMax.= 52 g/dm2/h
6
2 2
910
4
76
9
7
0
1
2
3
4
5
6
7
8
9
10
Num
ber
of T
ests
0 4 8 12 16 20 24 28 32 36 38
Rate of Precipitation (±2g/dm²/h)
Type IV 50/50
Total Number of Tests: 62Average Precipitation: 25 g/dm2/hMin.= 1 g/dm2/hMax.= 60 g/dm2/h
79CM1680(exBM3833)\Analysis\HOT\type CM1680\Analysis\HOT\TypeIV\test summaryA\Figures 3.2etc
At:type IV

FIGURE 3.3DISTRIBUTION OF PRECIPITATION RATE - TYPE II FLUIDS
Natural Snow Tests 2001-02
1
14
29
1410
13
6 74
86
0
5
10
15
20
25
30
Num
ber
of T
ests
0 4 8 12 16 20 24 28 32 36 38
Rate of Precipitation (±2g/dm²/h)
Type II Neat
Total Number of Tests: 112Average Precipitation: 17 g/dm2/hMin.= 1 g/dm2/hMax.= 59 g/dm2/h
3
17
36
149 9
6 5 47 7
0
5
10
15
20
25
30
35
40
Num
ber
of T
ests
0 4 8 12 16 20 24 28 32 36 38
Rate of Precipitation (±2g/dm²/h)
Type II 75/25
Total Number of Tests: 117Average Precipitation: 16 g/dm2/hMin.= 1 g/dm2/hMax.= 56 g/dm2/h
7
11
7
3
12
9 911
89
16
0
2
4
6
8
10
12
14
16
Num
ber
of T
ests
0 4 8 12 16 20 24 28 32 36 38
Rate of Precipitation (±2g/dm²/h)
Type II 50/50
Total Number of Tests: 102Average Precipitation: 23 g/dm2/hMin.= 1 g/dm2/hMax.= 58 g/dm2/h
80
CM1680(exBM3833)\Analysis\HOT\type IV\Figures 3.2etcAt:type II
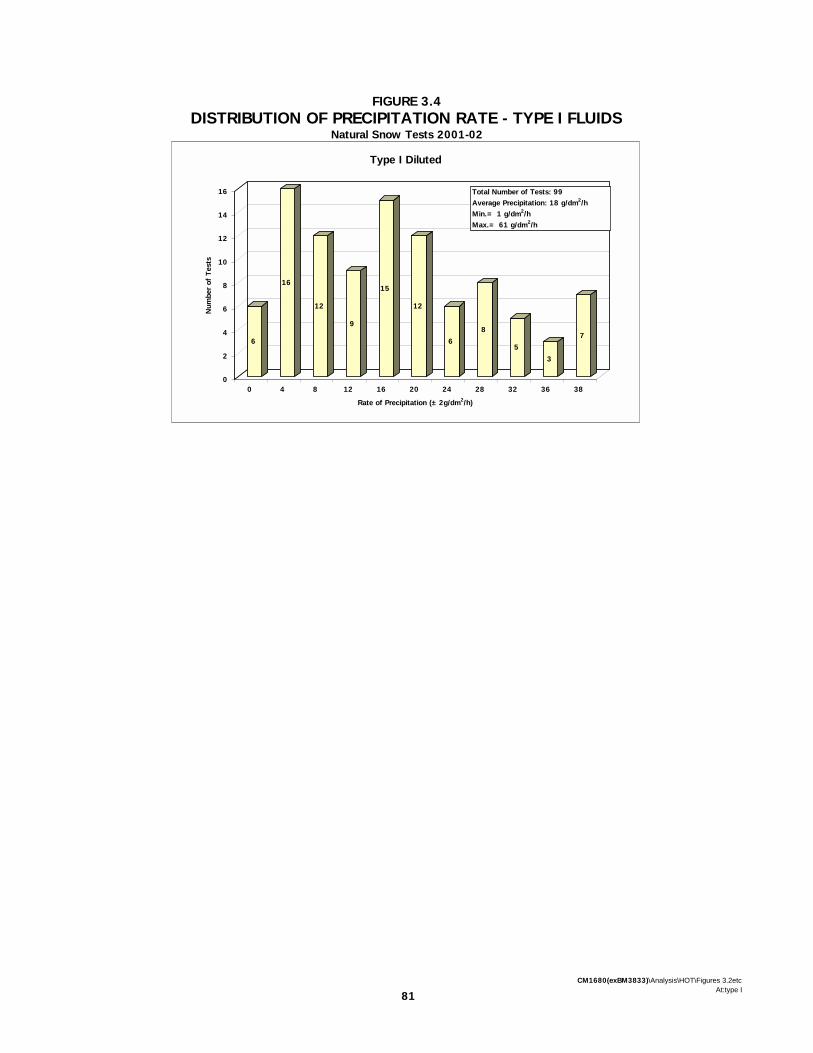
FIGURE 3.4DISTRIBUTION OF PRECIPITATION RATE - TYPE I FLUIDS
Natural Snow Tests 2001-02
6
16
12
9
15
12
6
8
5
3
7
0
2
4
6
8
10
12
14
16
Num
ber
of T
ests
0 4 8 12 16 20 24 28 32 36 38
Rate of Precipitation (±2g/dm2/h)
Type I Diluted
Total Number of Tests: 99Average Precipitation: 18 g/dm2/hMin.= 1 g/dm2/hMax.= 61 g/dm2/h
81CM1680(exBM3833)\Analysis\HOT\Figures 3.2etc
At:type I

FIGURE 3.5DISTRIBUTION OF AIR TEMPERATURE - TYPE IV FLUIDS
Natural Snow Tests 2001-02
7
29
8
25
11
6
51
0
2
4
6
8
10
12
14
16
18
20
Num
ber
of T
ests
0-2-4-6-8-10-12-14-16-18-20
Air Temperature (± 1°C)
Type IV NeatTotal Number of Tests: 137Average Air Temperature: -4.8 °CMin.= -13.9°CMax.= 0.4°C
16 17
8
4
34
0
2
4
6
8
10
12
14
16
18
20
Num
ber
of T
ests
0-2-4-6-8-10-12-14-16-18-20
Air Temperature (± 1°C)
Type IV 75/25
Total Number of Tests: 79Average Air Temperature: -3.8 °CMin.= -9.3°CMax.= 0.4°C
16
46
0
2
4
6
8
10
12
14
16
18
20
Num
ber
of T
ests
0-2-4-6-8-10-12-14-16-18-20
Air Temperature (± 1°C)
Type IV 50/50
Total Number of Tests: 62Average Air Temperature: -0.7 °CMin.= -2.8°CMax.= 0.5°C
82I:\Groups\CM1680(exBM3833)\Analysis\HOT\type IV\Figures 3.2etc
At:Air type IVPrinted:12:06 PM, 9/13/2005

FIGURE 3.6DISTRIBUTION OF AIR TEMPERATURE - TYPE II FLUIDS
Natural Snow Tests 2001-02
3
23
2
19
11
7
47
0
2
4
6
8
10
12
14
16
18
20N
umbe
r of
Tes
ts
0-2-4-6-8-10-12-14-16-18-20
Air Temperature (± 1°C)
Type II Neat
Total Number of Tests: 112Average Air Temperature: -4.0 °CMin.= -13.9°CMax.= 0.4°C
0
4
24
8
19
10 9
43
0
2
4
6
8
10
12
14
16
18
20
Num
ber
of T
ests
0-2-4-6-8-10-12-14-16-18-20
Air Temperature (± 1°C)
Type II 75/25
Total Number of Tests: 117Average Air Temperature: -4.4 °CMin.= -13.9°CMax.= 0.4°C
3
21 78
0
2
4
6
8
10
12
14
16
18
20
Num
ber
of T
ests
0-2-4-6-8-10-12-14-16-18-20
Air Temperature (± 1°C)
Type II 50/50
Total Number of Tests: 102Average Air Temperature: -0.7 °CMin.= -3.4°CMax.= 0.5°C
83
CM1680(exBM3833)\Analysis\HOT\Figures 3.2etcAt:Air type II
Printed:12:07 PM, 9/13/2005

FIGURE 3.7DISTRIBUTION OF AIR TEMPERATURE - DILUTED TYPE I FLUID
Natural Snow Tests 2001-02
31
8
5
12
22 48
0
2
4
6
8
10
12
14
16
18
20N
umbe
r of
Tes
ts
0-2-4-6-8-10-12-14-16-18-20
Air Temperature (± 2°C)
Type I Diluted
Total Number of Tests: 99Average Air Temperature: -2.3°CMin.= -13.9°CMax.= 1.0°C
84
CM1680(exBM3833)\Analysis\HOT\Figures 3.2etcAt:Air type 1

85
CM1680(exBM3833)\Analysis\HOT\wind type IV Chart 1
At:wind type IV Chart 1
119 10
25
810
3
0
2
4
6
8
10
12
14
16
18
20
Num
ber
of T
ests
0 4 8 12 16 20 24 28 32 36Wind Speed (± 2 km/h)
Type IV Neat
Total Number of Tests: 76Average Wind Speed: 22 km/hMin.= 11 km/h

FIGURE 3.9DISTRIBUTION OF WIND SPEED - TYPE II FLUIDS
Natural Snow Tests 2001-02
2
6
10
16
24
6 7
10
2
4
6
8
10
12
14
16
18
20
Num
ber
of T
ests
0 4 8 12 16 20 24 28 32 36
Wind Speed (± 2 km/h)
Type II Neat
Total Number of Tests: 72Average Wind Speed: 22 km/hMin.= 7 km/hMax.= 42 km/h
13
11 11
18 18
10
4
10
2
4
6
8
10
12
14
16
18
20
Num
ber
of T
ests
0 4 8 12 16 20 24 28 32 36
Wind Speed (± 2 km/h)
Type II 75/25
Total Number of Tests: 77Average Wind Speed: 20 km/hMin.= 1 km/hMax.= 43 km/h
4
9
6
24 20
12
9
0
2
4
6
8
10
12
14
16
18
20
Num
ber
of T
ests
0 4 8 12 16 20 24 28 32 36
Wind Speed (± 2 km/h)
Type II 50/50
Total Number of Tests: 84Average Wind Speed: 22 km/hMin.= 0 km/hMax.= 33 km/h
86
CM1680(exBM3833)\Analysis\HOT\Figures 3.2etcAt:wind Type II
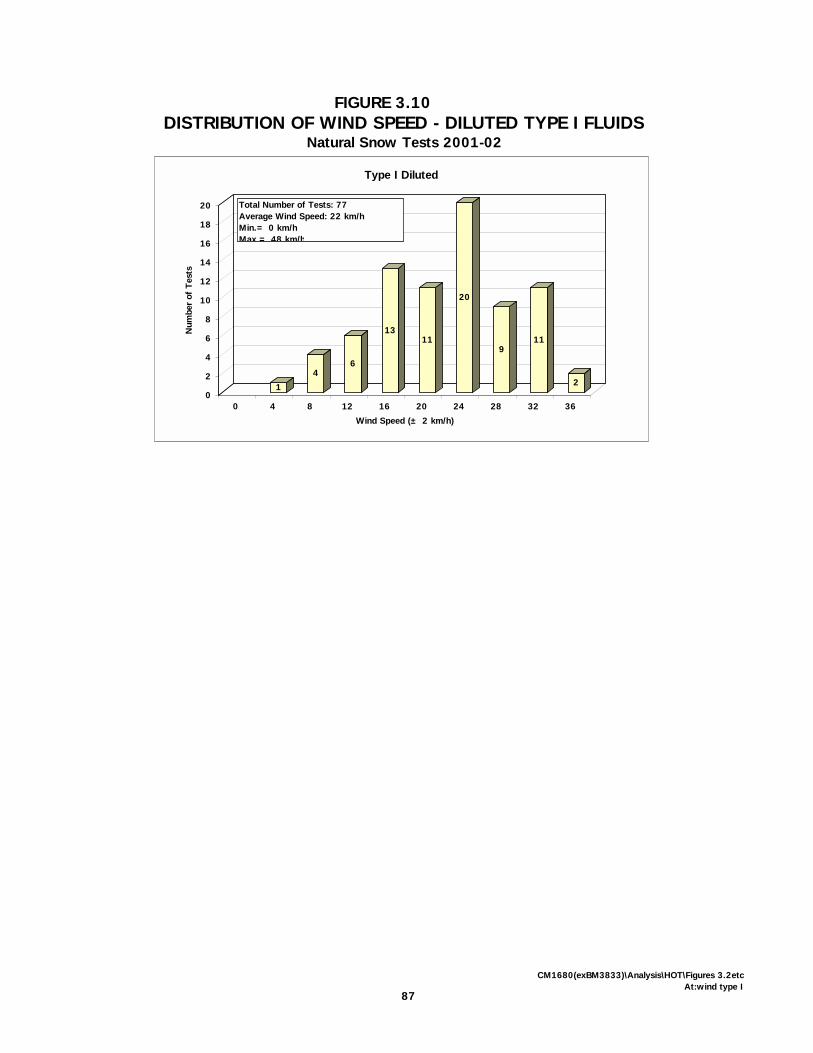
FIGURE 3.10DISTRIBUTION OF WIND SPEED - DILUTED TYPE I FLUIDS
Natural Snow Tests 2001-02
1
46
1311
20
911
20
2
4
6
8
10
12
14
16
18
20
Num
ber
of T
ests
0 4 8 12 16 20 24 28 32 36
Wind Speed (± 2 km/h)
Type I Diluted
Total Number of Tests: 77Average Wind Speed: 22 km/hMin.= 0 km/hMax = 48 km/h
87
CM1680(exBM3833)\Analysis\HOT\Figures 3.2etcAt:wind type I
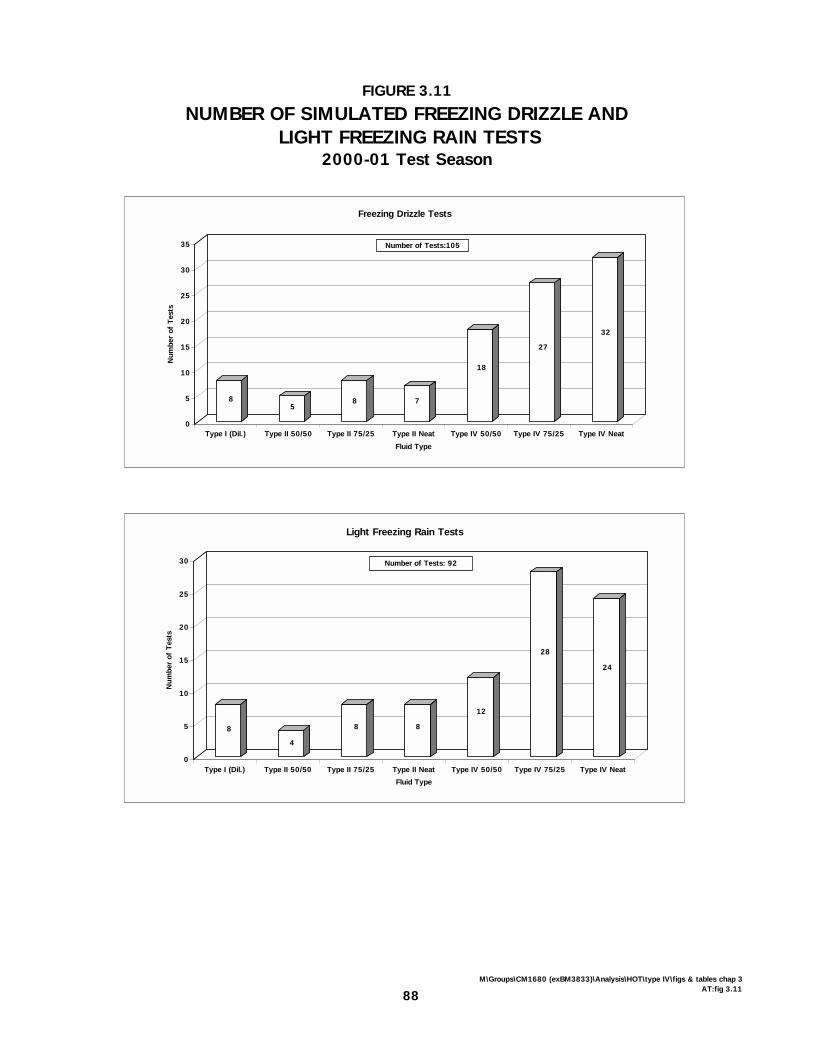
FIGURE 3.11
NUMBER OF SIMULATED FREEZING DRIZZLE AND LIGHT FREEZING RAIN TESTS
2000-01 Test Season
85
8 7
18
27
32
0
5
10
15
20
25
30
35
Num
ber
of T
ests
Type IV NeatType IV 75/25Type IV 50/50Type II NeatType II 75/25Type II 50/50Type I (Dil.)
Fluid Type
Freezing Drizzle Tests
Number of Tests:105
8
4
8 8
12
28
24
0
5
10
15
20
25
30
Num
ber
of T
ests
Type IV NeatType IV 75/25Type IV 50/50Type II NeatType II 75/25Type II 50/50Type I (Dil.)
Fluid Type
Light Freezing Rain Tests
Number of Tests: 92
88M\Groups\CM1680 (exBM3833)\Analysis\HOT\type IV\figs & tables chap 3
AT:fig 3.11

3. DESCRIPTION OF DATA
X:\@APS ARCHIVE\CM1680 (exBM3833) TC-Deicing 00-01 (REPORTS ONLY)\Reports\HOT\Final Version 1.0\Final Version 1.0.doc Final Version 1.0
August 05APS AVIATION INC.
89
3.2.2 Test Location and Fluids Tested All 197 freezing precipitation tests were conducted at NRC’s CEF in Ottawa. The fluids tested were supplied by Clariant, Lyondell, Newave Aerochemical, Octagon, SPCA, and Union Carbide/Dow. 3.2.3 Distribution of Average Precipitation Rates
Table 3.2 shows the distribution of average precipitation rates recorded for fluid Types I, II, and IV. As described in Section 2, the average precipitation rates for freezing drizzle and light freezing rain were computed from weight measurements taken with plate pans. The pans were positioned on the stand at every plate position before and after each run for a minimum of two 10-minute periods.
All fluids were tested at the upper and lower precipitation rate limits. The limits were 5 and 12.7 g/dm²/h for freezing drizzle, and 12.7 and 25 g/dm²/h for light freezing rain, respectively.
3.2.4 Distribution of Other Meteorological Conditions Air temperature was the only other meteorological factor that varied during the freezing drizzle and light freezing rain tests. The distribution of air temperatures is presented in Table 3.2. 3.3 Simulated Freezing Fog Tests 3.3.1 Data Acquisition A total of 121 tests were conducted with Type I, Type II, and Type IV fluids in freezing fog conditions. The breakdown of these tests is shown in Figure 3.12.
3.3.2 Test Location and Fluids Tested
All 121 freezing fog tests were conducted at NRC’s CEF in Ottawa. The fluids tested were supplied by Clariant, Lyondell, Newave Aerochemical, Octagon, SPCA, and UCAR/Dow.
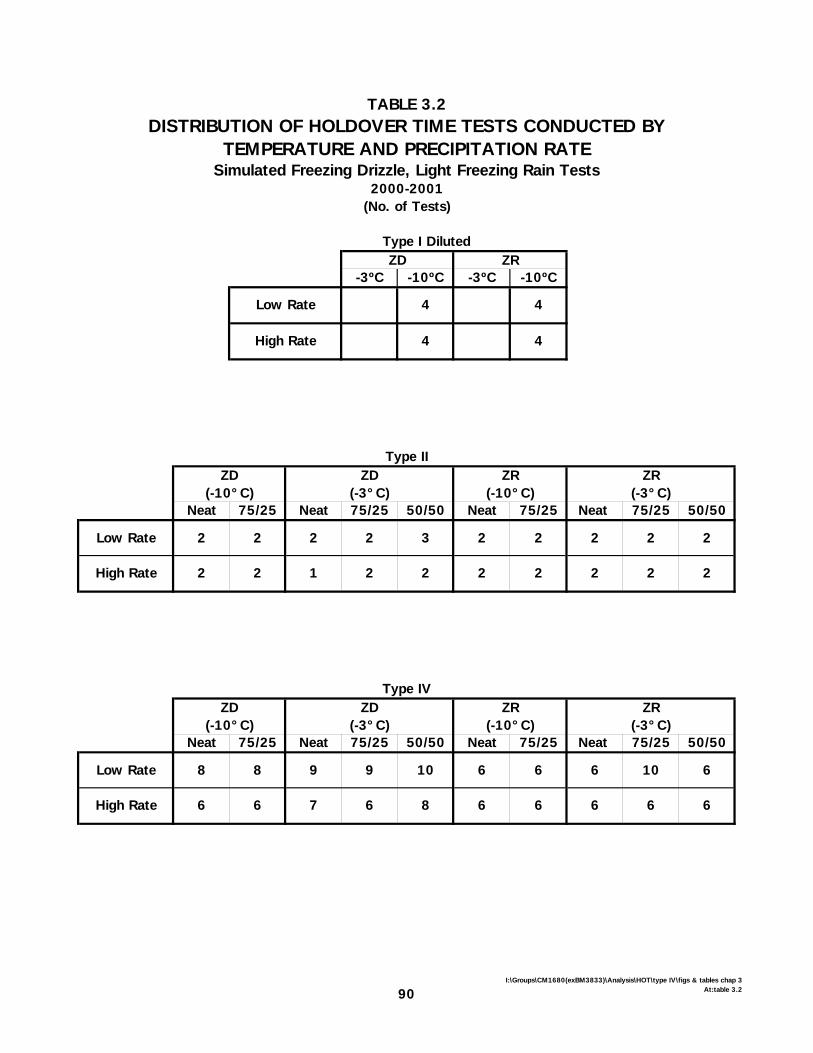
TABLE 3.2DISTRIBUTION OF HOLDOVER TIME TESTS CONDUCTED BY
TEMPERATURE AND PRECIPITATION RATESimulated Freezing Drizzle, Light Freezing Rain Tests
2000-2001(No. of Tests)
Type I Diluted
-3ºC -10ºC -3ºC -10ºC
Type II
Neat 75/25 Neat 75/25 50/50 Neat 75/25 Neat 75/25 50/50
Type IV
Neat 75/25 Neat 75/25 50/50 Neat 75/25 Neat 75/25 50/50
Low Rate
High Rate
ZR
4
4
ZD
4
4
6 6
6
2 2
2
6 6
6 10 6
High Rate 6 6 7 6 8 6
9 10 6Low Rate 8 8 9
ZD (-10°C)
ZD (-3°C)
ZR (-10°C)
ZR (-3°C)
2 2
2 2 2
High Rate 2 2 1 2 2 2
2 3 2Low Rate 2 2 2
ZD (-10°C)
ZD (-3°C)
ZR (-10°C)
ZR (-3°C)
90I:\Groups\CM1680(exBM3833)\Analysis\HOT\type IV\figs & tables chap 3
At:table 3.2
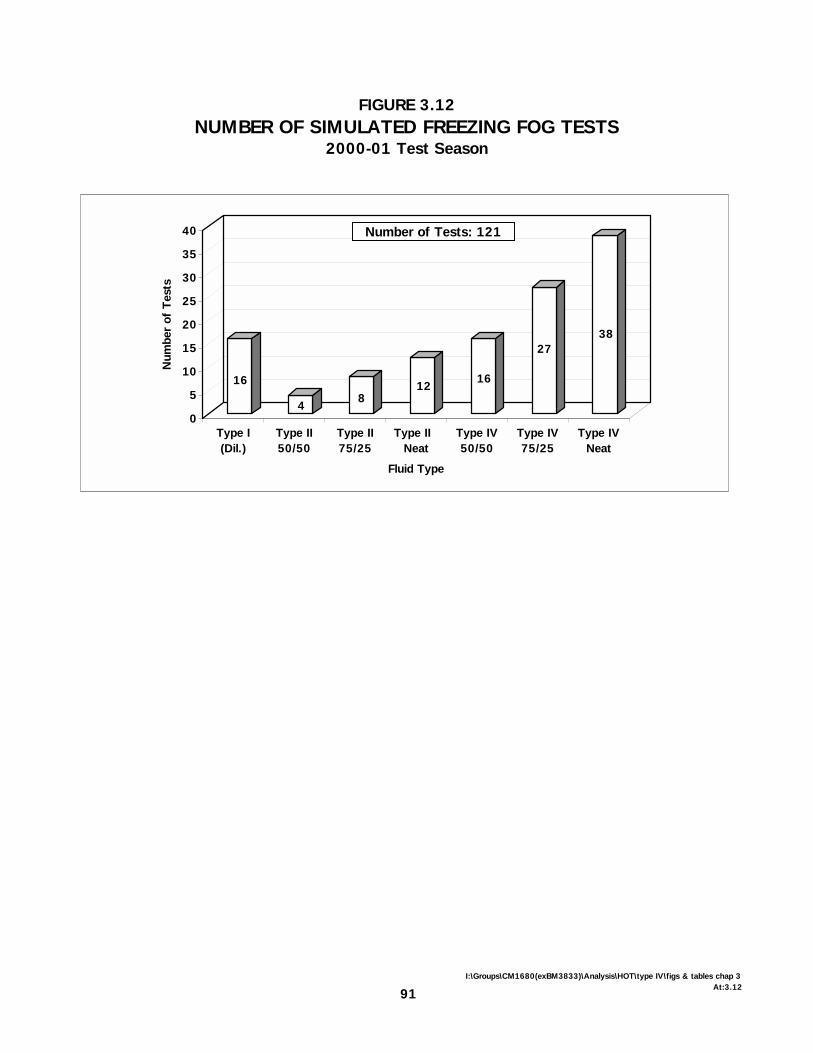
FIGURE 3.12NUMBER OF SIMULATED FREEZING FOG TESTS
2000-01 Test Season
16
48
1216
2738
0
5
10
15
20
25
30
35
40
Num
ber
of T
ests
Type IVNeat
Type IV75/25
Type IV50/50
Type II Neat
Type II75/25
Type II50/50
Type I(Dil.)
Fluid Type
Number of Tests: 121
91I:\Groups\CM1680(exBM3833)\Analysis\HOT\type IV\figs & tables chap 3
At:3.12

3. DESCRIPTION OF DATA
X:\@APS ARCHIVE\CM1680 (exBM3833) TC-Deicing 00-01 (REPORTS ONLY)\Reports\HOT\Final Version 1.0\Final Version 1.0.doc Final Version 1.0
August 05APS AVIATION INC.
92
3.3.3 Distribution of Average Precipitation Rates
Table 3.3 shows the distribution of average precipitation rates recorded for all holdover time tests. As described in Section 2, the average precipitation rates for freezing fog were computed from weight measurements taken with plate pans. The pans were positioned on the stand at every plate location before and after each run for two 10- to 15-minute periods. Holdover time tests were conducted at precipitation rates of 2 to 5 g/dm²/h.
3.3.4 Distribution of Tests by Air Temperature
The other variable in freezing fog tests was temperature. The distributions of air temperatures for freezing fog tests are presented in Table 3.3. 3.4 Simulated Rain on Cold-Soaked Surface Tests 3.4.1 Data Acquisition
A total of 49 cold-soak tests, using 7.5 cm deep-sealed boxes, were conducted during the 2000-01 test season. The breakdown of tests is shown in Figure 3.13.
3.4.2 Test Location and Fluids Tested
All 49 tests were conducted at NRC’s CEF in Ottawa. The fluids tested were supplied by Clariant, Lyondell, Newave Aerochemical, Octagon, SPCA, and UCAR/Dow. 3.4.3 Distribution of Average Precipitation Rates Table 3.4 shows the distribution of precipitation rate. The average precipitation rate was measured using plate pans. The precipitation for drizzle was produced using the same apparatus as was used for freezing drizzle. Moderate rain was also produced using the same equipment, but with different hypodermic needles and water/air pressures.
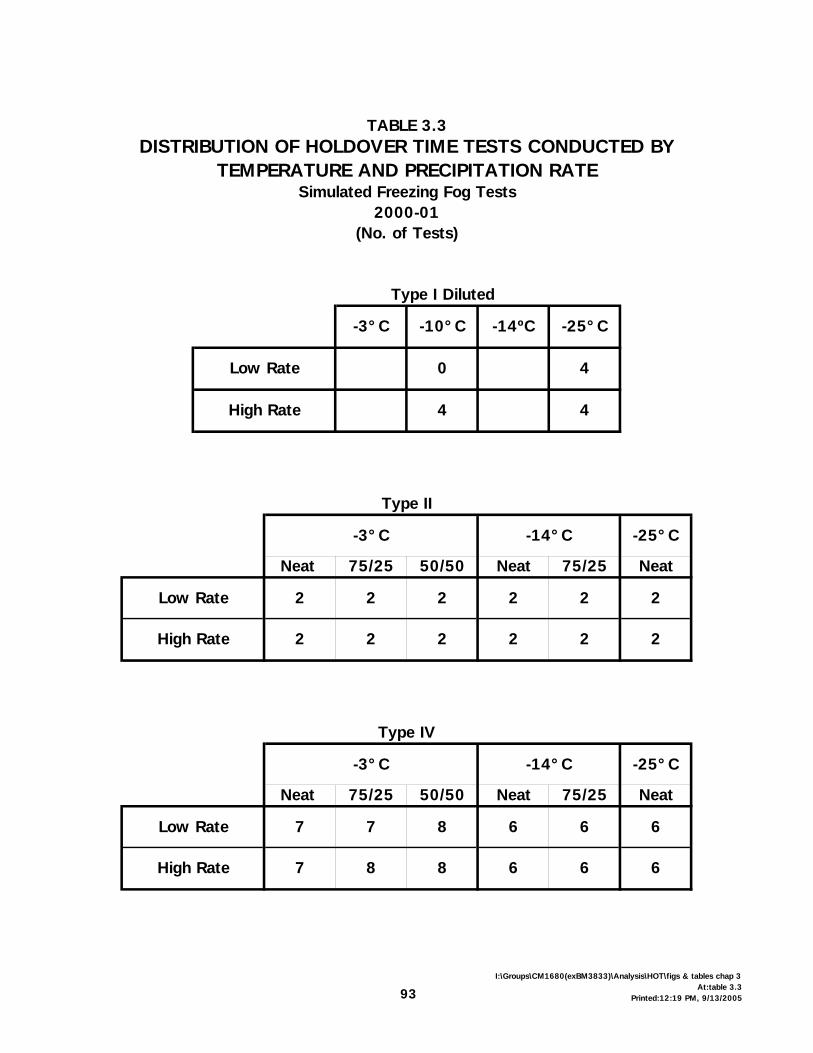
TABLE 3.3DISTRIBUTION OF HOLDOVER TIME TESTS CONDUCTED BY
TEMPERATURE AND PRECIPITATION RATESimulated Freezing Fog Tests
2000-01(No. of Tests)
Type I Diluted
Type II
Neat 75/25 50/50 Neat 75/25 Neat
Type IV
Neat 75/25 50/50 Neat 75/25 Neat
4
Low Rate
High Rate 4
-25°C
0 4
-10°C -14ºC-3°C
-14°C
2 2
2
-25°C-3°C
2 2
22Low Rate
High Rate
2
2 2 2
2
-3°C -14°C -25°C
Low Rate 7 7 8 6 6 6
6 6 6High Rate 7 8 8
93I:\Groups\CM1680(exBM3833)\Analysis\HOT\figs & tables chap 3
At:table 3.3Printed:12:19 PM, 9/13/2005
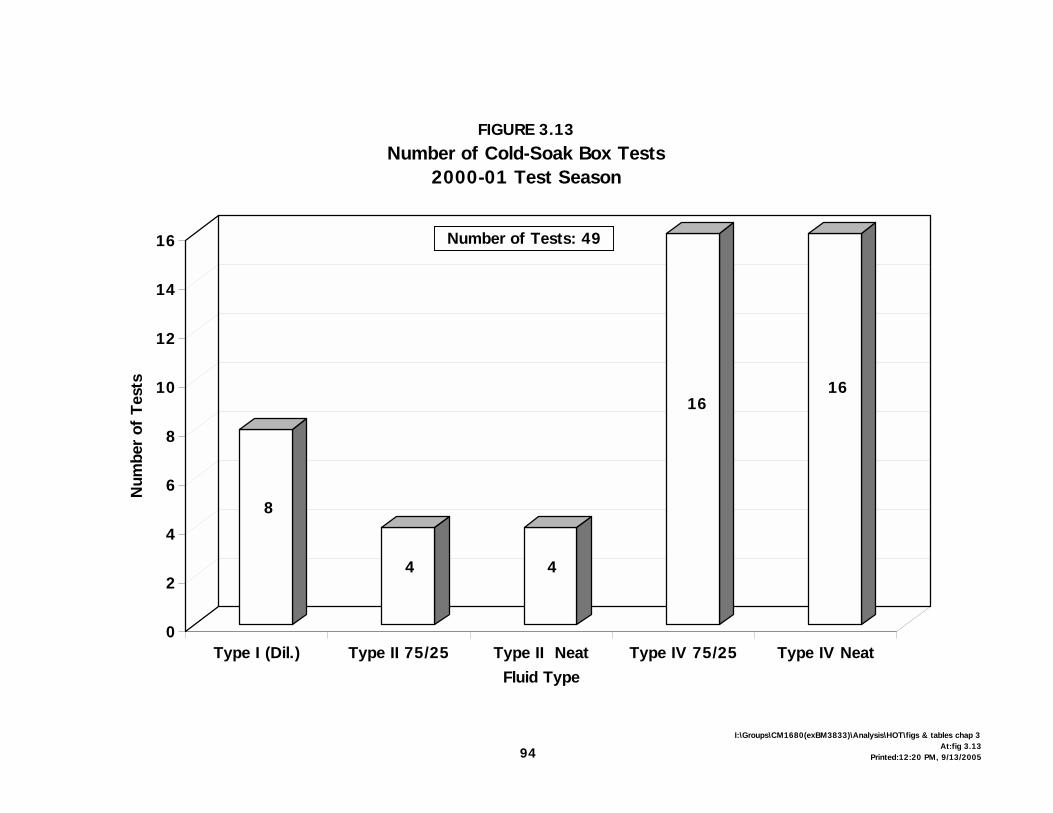
94I:\Groups\CM1680(exBM3833)\Analysis\HOT\figs & tables chap 3
At:fig 3.13Printed:12:20 PM, 9/13/2005
8
4 4
1616
0
2
4
6
8
10
12
14
16
Num
ber
of T
ests
Type IV NeatType IV 75/25Type II NeatType II 75/25Type I (Dil.)Fluid Type
FIGURE 3.13Number of Cold-Soak Box Tests
2000-01 Test Season
Number of Tests: 49

TABLE 3.4DISTRIBUTION OF HOLDOVER TIME TESTS CONDUCTED BY
TEMPERATURE AND PRECIPITATION RATECold-Soak Box Tests
2000-01(No. of Tests)
Type I
Type II
Type IV
2
Low Rate
8
8 8
8
2
Diluted
4
4
Neat 75/25
75/25
2
High Rate
Neat
2
Low Rate
High Rate
High Rate
Low Rate
95CM1680(exBM3833)\Analysis\HOT\figs & tables chap 3
At:Table 3.4
96
This page intentionally left blank.

4. HOLDOVER TIME TABLES, RESULTS, AND DISCUSSIONS
X:\@APS ARCHIVE\CM1680 (exBM3833) TC-Deicing 00-01 (REPORTS ONLY)\Reports\HOT\Final Version 1.0\Final Version 1.0.doc Final Version 1.0
August 05APS AVIATION INC.
97
4. HOLDOVER TIME TABLES, RESULTS, AND DISCUSSIONS The methods used to evaluate the test data are reviewed in Subsection 2.9. In this section, the officially accepted holdover time guidelines are presented and important findings are discussed. Each of the different categories of precipitation is introduced in a cell-by-cell fashion with comments and discussions. Type IV fluid results are discussed in Subsection 4.2, Type II fluids are discussed in Subsection 4.3, Type I in Subsection 4.4, and Type III in Subsection 4.5. All the holdover time guidelines are presented in Subsection 4.6. These include the generic Type I, Type II, and Type IV holdover time guidelines; the three Type II fluid-specific guidelines; and the eight Type IV fluid-specific guidelines. These tables are proposed for use worldwide during the 2001-02 winter season. 4.1 Background 4.1.1 Viscosity of Anti-icing Fluid Tested in 1996-97
In 1996-97, fluid manufacturers provided mid-production range viscosity samples for fluid holdover time testing. During a meeting of the Workgroup on Laboratory Methods to Derive Holdover Time Guidelines in Montreal in November 1997, it was decided that low viscosity fluid samples should be tested in future holdover time tests. It was understood that this would result in more conservative holdover time values. Subsequently, APS requested that fluid manufacturers ship pre-sheared fluids that were representative of the lower end of the production viscosity range for 1997-98 test purposes. 4.1.2 Viscosity of Anti-icing Fluids Tested in 1997-98 Following several holdover time test sessions at the Dorval site in 1997-98, the results using a Kilfrost fluid were found to be inferior to those obtained in previous tests conducted with the same fluid. As a result, APS examined the different batches of fluid delivered by the manufacturers. The Kilfrost fluid was found to have a viscosity level below the production range for this fluid. Examination of the viscosity levels of the other fluids revealed other inconsistencies. The fluid samples for Clariant MPIV 1957 and MPIV 2001 were believed to be at the low end of the production range for these fluids. The remainder of the fluid samples provided to APS had viscosity levels representative of the mid-production range, not the lower end of the production range, as requested.

4. HOLDOVER TIME TABLES, RESULTS, AND DISCUSSIONS
X:\@APS ARCHIVE\CM1680 (exBM3833) TC-Deicing 00-01 (REPORTS ONLY)\Reports\HOT\Final Version 1.0\Final Version 1.0.doc Final Version 1.0
August 05APS AVIATION INC.
98
Prior to the start of testing in freezing drizzle, light freezing rain, freezing fog, and rain on a cold-soaked wing at the CEF in April 1998, APS requested that Kilfrost and Clariant provide mid-range viscosity fluids for these tests to ensure that all fluids were tested on an even par. As a result, the holdover time tests conducted in 1997-98 were performed using mid-production range viscosity fluids. 4.1.3 Viscosity of Anti-icing Fluids Tested in 1998-99 For holdover time testing in 1998-99, manufacturers were asked to provide fluid samples representative of the lowest recommended on-wing viscosity. Upon reception of the individual fluid samples, APS personnel verified the fluid viscosity measurements obtained from the manufacturers. For the first time, each manufacturer was required to send a sample of the fluid provided for holdover time testing to Anti-icing Materials International Laboratory (AMIL) for Water Spray Endurance Time (WSET) testing. At the SAE G-12 meetings in Toronto in May 1999, the results of the WSET tests were discussed. Specifications precluded that a Type IV fluid must achieve a minimum of 80 minutes in the WSET test to pass certification. However, several of the fluid samples tested by APS in 1998-99 had WSET results below the minimum, due to the shearing required to reduce the fluid viscosities for holdover time testing. After considerable discussion, the results of holdover time tests conducted with Clariant MPIV 1957, Octagon Max-Flight, and Kilfrost ABC-S were accepted, despite the fact that the samples had WSET results inferior to the minimum requirements. To obtain a fluid-specific table for their fluid, manufacturers were required to conduct holdover time tests in 1998-99 using a lowest on-wing viscosity fluid, regardless of whether the fluid had been tested previously. Two fluid manufacturers, Clariant and SPCA, insisted that the Clariant MPIV 2001 and SPCA AD-480 fluids delivered for testing in 1997-98 were representative of the manufacturers’ recommended lowest on-wing viscosity. As a result, no holdover time testing was conducted using these two fluids in order to generate fluid-specific values. At the Holdover Time Subcommittee meeting in Toronto in May 1999, Clariant was asked to provide a sample of the MPIV 2001 fluid sent to APS for holdover time testing in 1997-98, to AMIL for WSET verification. The average WSET of the sheared sample was 81 minutes. A sample was also provided to APS for viscosity testing. The viscosity measurement obtained by APS (18 000 cP, 20°C, 0.3 rpm, Spindle SC4-34/13R, 10 mL fluid, 15 minutes) appears in the fluid-specific holdover time table for Clariant MPIV 2001.

4. HOLDOVER TIME TABLES, RESULTS, AND DISCUSSIONS
X:\@APS ARCHIVE\CM1680 (exBM3833) TC-Deicing 00-01 (REPORTS ONLY)\Reports\HOT\Final Version 1.0\Final Version 1.0.doc Final Version 1.0
August 05APS AVIATION INC.
99
It was also decided in Toronto that the viscosity of the fluid sample used in holdover time testing, as measured by the testing agency, would now appear on the fluid-specific holdover time table for any given fluid. In addition to noting the viscosity, the instrument spindle, chamber size, temperature, and rotations per minute are also documented. To maintain the validity of the fluid-specific values, operators must ensure that the viscosity of the fluid used is superior to the viscosity published by the manufacturers by following the same viscosity measurement method published.
Several viscosity measurements of the various anti-icing fluids obtained by APS during the 1998-99 test season were acquired using different methods and spindles from the manufacturers. In most cases, APS employed a common method when conducting viscosity measurements: Spindle SC4-31/13R, 20°C, 33 minutes and 20 seconds, 0.3 rpm, and 10 mL of fluid. This approach caused much confusion at the SAE G-12 Holdover Time Subcommittee meeting in Toronto, as the fluid viscosities documented by APS and the fluid manufacturers were not comparable. After much discussion, it was resolved that APS would re-measure all anti-icing fluid viscosities using the same method employed by the manufacturers. Due to ongoing confusion over the test samples required for holdover time test purposes on a yearly basis, sample selection procedures were devised and agreed upon by the SAE G-12 Holdover Time Subcommittee in Toronto in May 1999. These new documents will appear in Proposed SAE Aerospace Standard 5485 to regulate the test samples that are delivered to the various testing agencies. The new documents allow the various manufacturers to select the fluid viscosity to be tested and to appear on the fluid-specific table, provided that the WSET values of the fluids selected achieve the minimum requirements. 4.1.4 Viscosity of Anti-icing Fluids Tested in 2000-01 Four different Type IV fluids were provided to APS for 2000-01 endurance time testing: Clariant Safewing MPIV Protect 2012, Clariant Safewing MPIV 2015 TF, Octagon Max-Flight, and an experimental Type IV fluid from UCAR/Dow. Testing with the UCAR/Dow product was discontinued prior to its completion. The Octagon Max-Flight testing was conducted in a bid to increase the fluid-specific holdover times for this fluid. The results of 1998-99 Max-Flight tests with a low viscosity fluid were omitted and are not included in this report. Prior to the publication of the holdover time guidelines, APS was informed that one fluid, Clariant Safewing MPIV 2015 TF, which was tested extensively during the past test season, would not be produced commercially for the

4. HOLDOVER TIME TABLES, RESULTS, AND DISCUSSIONS
X:\@APS ARCHIVE\CM1680 (exBM3833) TC-Deicing 00-01 (REPORTS ONLY)\Reports\HOT\Final Version 1.0\Final Version 1.0.doc Final Version 1.0
August 05APS AVIATION INC.
100
upcoming winter. Consequently, the results obtained with this fluid have not been included in the production of the generic Type IV fluid holdover time guidelines.
The viscosity values of the Type IV fluids tested in 2000-01 appear in Table 4.1. The WSET results of the same fluids appear in Table 4.2. At the SAE G-12 Holdover Time Subcommittee meeting in Toulouse in May 2000, it was decided that snow grains would be included in the snow column of the various holdover time tables for fluid Types I, II, and IV. These changes were included in the official holdover time tables accepted for use in 2000-01 winter operations.
4.2 Type IV Fluids New Fluids Introduced: Four Type IV fluids from three different manufacturers were tested during the 2000-01 winter test season: Clariant Safewing MPIV Protect 2012, Clariant Safewing MPIV 2015 TF, Octagon Max-Flight, and an experimental Type IV from UCAR/Dow. The Clariant Safewing MP IV 2015 TF and UCAR/Dow products were later removed from this list after the manufacturers indicated that the fluids would not be produced in the upcoming year. Old Fluids Removed: A total of nine different fluids tested since 1996-97 were used to develop the generic holdover time table for Type IV fluids: Clariant Safewing Four, Clariant MPIV 1957, Clariant MPIV 2001, Clariant Safewing MPIV Protect 2012, Kilfrost ABC-S, Octagon Max-Flight, SPCA AD-404, SPCA AD-480, and UCAR/Dow Ultra+. At the SAE G-12 Holdover Time Subcommittee meeting in New Orleans in May 2001, it was decided that test data from fluids that have not been commercially available for four years would be eliminated from the generic tables. Two fluids, Hoechst MP IV 1957 and diluted forms of UCAR Ultra+, were eliminated, which resulted in several increases to the generic holdover time table. The results of Type IV tests conducted in 2000-01 are shown in Figures 4.3 to 4.29. The results of tests conducted in 1996-97, 1997-98, 1998-99, and 1999-2000 appear in report TP 13659E [2].

X:\@APS ARCHIVE\CM1680 (exBM3833) TC-Deicing 00-01 (REPORTS ONLY)\Reports\HOT\Working Documents\Tables & Figures\TABLE 4.1+4.2.doc
101
TABLE 4.1 FLUID VISCOSITY
FLUIDS TESTED IN 2000-2001
TABLE 4.2 WSET VALUES OF SAMPLES TESTED
(FIRST ICE EVENT) FLUIDS TESTED IN 2000-01
FLUID Manufacturer Value
Using Manufacturer Method (cP)
APS Value Using Manufacturer Method
(cP)
9800 7800 Clariant Safewing MPIV 2012
Protect 20ºC, 0.3 rpm, Spindle SC4-34/13R, 10 mL fluid, 15 min
20ºC, 0.3 rpm, Spindle SC4-34/13R, 10 mL fluid, 15 min
5990 5900/5540
Octagon Max-Flight 20ºC, 0.3 rpm, Spindle LV1, 600 mL beaker, 500 mL fluid,
33 min 20 sec, guard leg
20ºC, 0.3 rpm, Spindle LV1, 600 mL beaker, 500 mL fluid,
33 min 20 sec, guard leg
5200 4900
SPCA ECOWING 26 20ºC, 0.3 rpm, Spindle SC4-34/13R, 10 mL fluid, 30 min
20ºC, 0.3 rpm, Spindle SC4-34/13R, 10 mL fluid, 30 min
FLUID MINUTES
Clariant Safewing MPIV 2012 Protect 131
Octagon Max-Flight 120
SPCA Ecowing 26 56
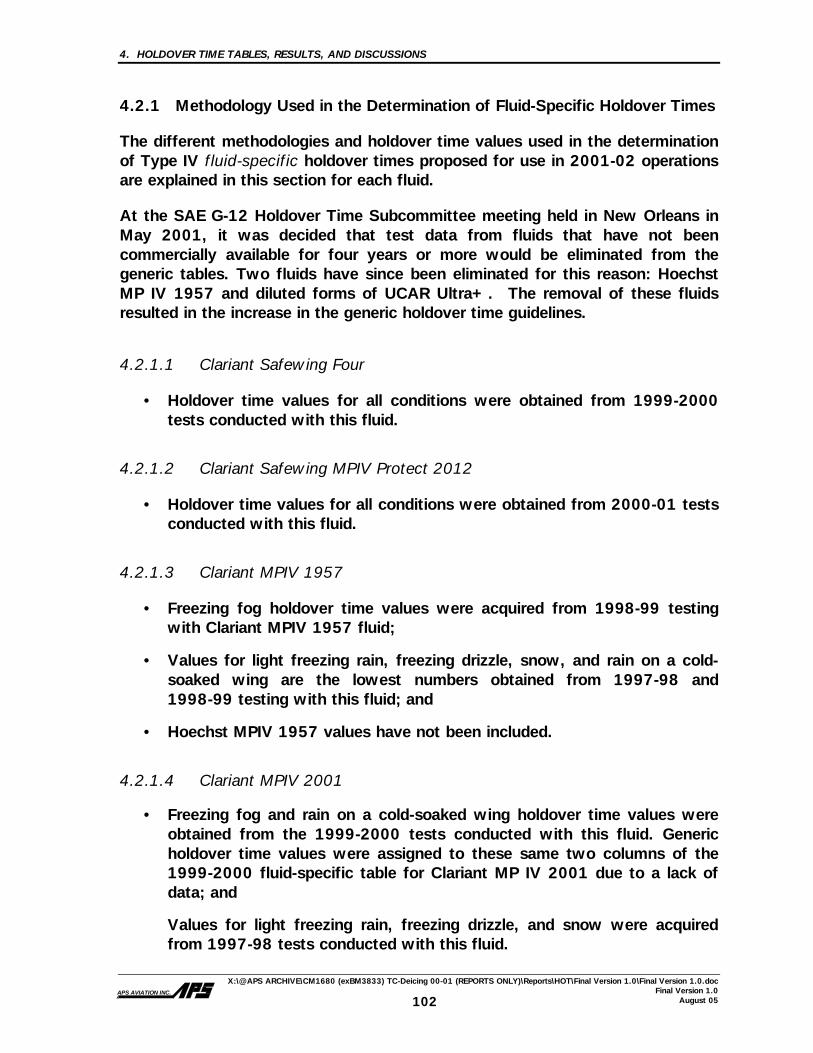
4. HOLDOVER TIME TABLES, RESULTS, AND DISCUSSIONS
X:\@APS ARCHIVE\CM1680 (exBM3833) TC-Deicing 00-01 (REPORTS ONLY)\Reports\HOT\Final Version 1.0\Final Version 1.0.doc Final Version 1.0
August 05APS AVIATION INC.
102
4.2.1 Methodology Used in the Determination of Fluid-Specific Holdover Times The different methodologies and holdover time values used in the determination of Type IV fluid-specific holdover times proposed for use in 2001-02 operations are explained in this section for each fluid. At the SAE G-12 Holdover Time Subcommittee meeting held in New Orleans in May 2001, it was decided that test data from fluids that have not been commercially available for four years or more would be eliminated from the generic tables. Two fluids have since been eliminated for this reason: Hoechst MP IV 1957 and diluted forms of UCAR Ultra+. The removal of these fluids resulted in the increase in the generic holdover time guidelines.
4.2.1.1 Clariant Safewing Four
• Holdover time values for all conditions were obtained from 1999-2000 tests conducted with this fluid.
4.2.1.2 Clariant Safewing MPIV Protect 2012
• Holdover time values for all conditions were obtained from 2000-01 tests conducted with this fluid.
4.2.1.3 Clariant MPIV 1957
• Freezing fog holdover time values were acquired from 1998-99 testing with Clariant MPIV 1957 fluid;
• Values for light freezing rain, freezing drizzle, snow, and rain on a cold-soaked wing are the lowest numbers obtained from 1997-98 and 1998-99 testing with this fluid; and
• Hoechst MPIV 1957 values have not been included.
4.2.1.4 Clariant MPIV 2001
• Freezing fog and rain on a cold-soaked wing holdover time values were obtained from the 1999-2000 tests conducted with this fluid. Generic holdover time values were assigned to these same two columns of the 1999-2000 fluid-specific table for Clariant MP IV 2001 due to a lack of data; and
Values for light freezing rain, freezing drizzle, and snow were acquired from 1997-98 tests conducted with this fluid.

4. HOLDOVER TIME TABLES, RESULTS, AND DISCUSSIONS
X:\@APS ARCHIVE\CM1680 (exBM3833) TC-Deicing 00-01 (REPORTS ONLY)\Reports\HOT\Final Version 1.0\Final Version 1.0.doc Final Version 1.0
August 05APS AVIATION INC.
103
4.2.1.5 Kilfrost ABC-S
• Freezing fog holdover time values were obtained from 1998-99 testing with this fluid;
• Light freezing rain, freezing drizzle, and snow values are the lowest numbers from testing in 1996-97, 1997-98 and 1998-99 with this fluid; and
• Values for rain on a cold-soaked wing are the lowest results obtained from testing with this fluid in 1997-98 and 1998-99.
4.2.1.6 Octagon Max-Flight
• The tests conducted with the low viscosity sample of Octagon Max-Flight in 1998-99 were eliminated;
• Freezing fog holdover time values were acquired from 2000-01 testing with this fluid;
• Values obtained in conditions of light freezing rain, freezing drizzle, and snow are the lowest numbers achieved from testing with this fluid in 1996-97, 1997-98, and 2000-01; and
• Rain on a cold-soaked wing values are the lowest results acquired from 1997-98 and 2000-01 testing with this fluid.
4.2.1.7 SPCA AD-480
• Tests were conducted with this fluid in 1997-98 and 1999-2000. Due to a lack of data below -7°C in 1997-98 tests, additional tests in natural snow were conducted in 1998-99;
• Freezing fog and rain on a cold-soaked wing holdover time values were obtained from 1999-2000 tests conducted with this fluid. Generic holdover time values were used in these columns of the 1998-99 fluid-specific table for this fluid due to a lack of data;
• Light freezing rain and freezing drizzle values are the lowest numbers from 1999-2000 and 1997-98 tests conducted with SPCA AD-480 fluid; and
• In natural snow, the results of the 1997-98 and 1998-99 tests were combined. The snow values in the 2000-01 fluid-specific table are the lowest of tests conducted in 1999-2000 and of the two years 1997-98 and 1998-99, which appeared in the 1999-2000 fluid-specific table for this fluid.

4. HOLDOVER TIME TABLES, RESULTS, AND DISCUSSIONS
X:\@APS ARCHIVE\CM1680 (exBM3833) TC-Deicing 00-01 (REPORTS ONLY)\Reports\HOT\Final Version 1.0\Final Version 1.0.doc Final Version 1.0
August 05APS AVIATION INC.
104
4.2.1.8 UCAR Ultra+
• Freezing fog holdover time values were obtained from 1998-99 testing with this fluid;
• Light freezing rain, freezing drizzle, and snow holdover time values are the lowest results of 1996-97 and 1998-99 testing with this fluid; and
• Rain on a cold-soaked wing holdover time values were acquired from 1998-99 testing conducted with this fluid.
4.2.2 Natural Snow
The natural snow holdover time data were obtained from tests conducted by APS at the Dorval Airport test facility. The fluid failure time versus precipitation rate data have been plotted either as a function of temperature or as a function of fluid brand (Appendix G). The latter plot format lends itself more easily to the cell-by-cell presentation of results for each category of precipitation. It is used here to present the changes proposed to the holdover times and to allow direct comparison to the numbers obtained from the regression analyses. Subsections 4.2.2.1.1 to 4.2.2.1.9 contain the Type IV fluid holdover time results in the snow column. They are arranged in tabular form and follow the sequence of temperature ranges as they appear in the holdover time tables, from top to bottom. For each fluid tested in natural snow conditions, a family of curves has been drawn based on the data collected using the formula outlined in Subsection 2.9.2.1. An example of the family of curves generated by the snow regression analysis for a given fluid is shown in Figure 4.1. Using this method, curves were drawn at the most restrictive temperatures in each of the cells of the snow column for this fluid. Generic Holdover Time Guidelines
For the process of evaluating the generic holdover time guidelines in each cell of the generic holdover time table, the curves for each fluid drawn at a specific temperature have been removed from the individual fluid charts and placed in Figures 4.3 to 4.11. For example, in Figure 4.2, the curves drawn at -3°C for Octagon Max-Flight and Clariant Safewing MPIV 2012 Protect were removed from the individual fluid charts and were placed in the chart used to evaluate the holdover time performance of Type IV fluids in the 0°C to -3°C cell. This process was followed for each cell of the snow column. If the values determined from the brand specific fluids are lower that the generic holdover guidelines, then the generic holdover guidelines are reduced.
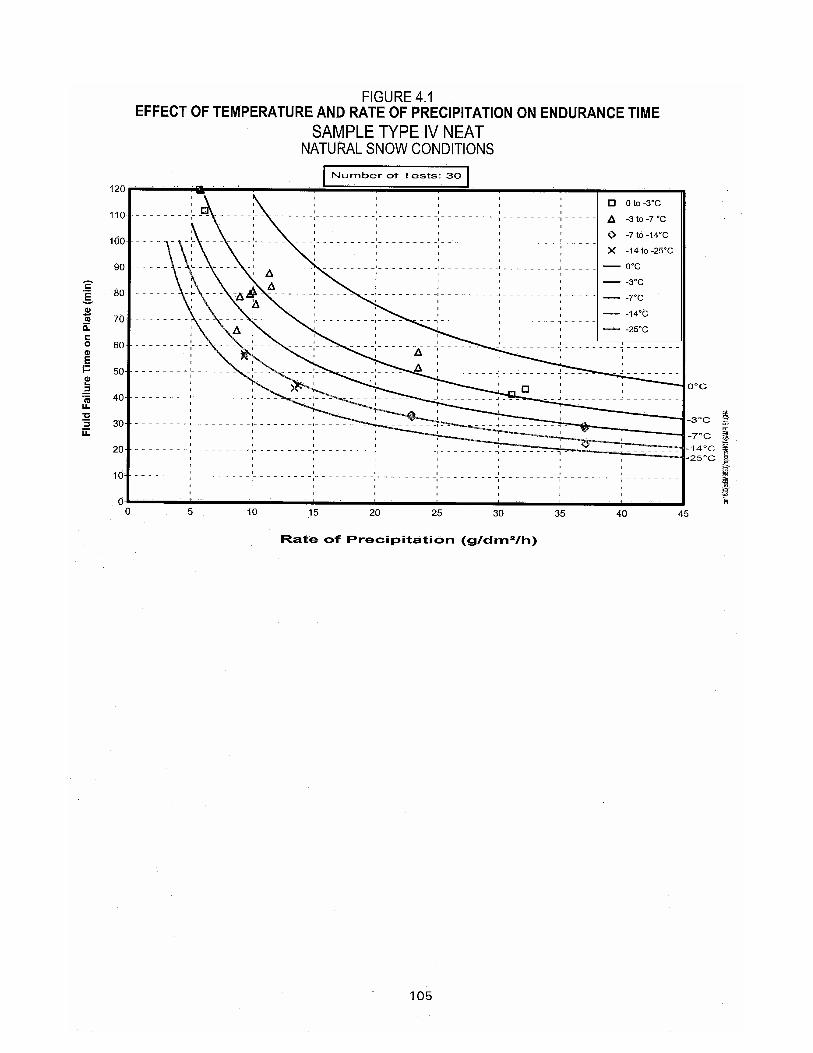

h:\cm1680(exBM3833)\reports\HOT\Family of Curves1.pt
FIGURE 4.2PROCESS FOR EVALUATING HOLDOVER TIMES
NATURAL SNOWFamily of Curves
CLARIANT SAFEWING MPIV 2012 PROTECT
0
10
20
30
40
50
60
70
80
90
100
110
120
0 5 10 15 20 25 30 35 40 45
Plate PanRate of Precipitation (g/dm²/h)
Flui
d Fa
ilure
Tim
e on
Pla
te (
min
)
Above 0°C
0 to -3°C
-3 to -7°C
-7 to -14°C
-14 to -25°C
0°C
-3°C
-14°C
-25°C
# of Tests = 47
0°C
-3°C
-14°C-25°C
Rate of Precipitation (g/dm²/h)
OCTAGON MAX-FLIGHT
0
10
20
30
40
50
60
70
80
90
100
110
120
0 5 10 15 20 25 30 35 40 45Plate Pan
Flui
d Fa
ilure
Tim
e on
Pla
te (
min
)
Above 0°C
0 to -3°C
-3 to -7°C
-7 to -14°C
-14 to -25°C
0°C
-3°C
-14°C
-25°C
# of Tests = 43
0°C
-3°C
-14°C
-25°C
Cell EvaluationTYPE IV NEAT (0 to -3°C)
0
10
20
30
40
50
60
70
80
90
100
110
120
0 5 10 15 20 25 30 35 40 45
Rate of Precipitation (g/dm²/h)
Failu
re T
ime
(min
)
# of Tests = 20
CLARIANT PROTECT 2012
OCTAGON MAX-FLIGHT
CLARIANT SAFEWING MPIV 2012 PROTECT (0 to -3°C)
OCTAGON MAX-FLIGHT (0 to -3°C)
CLARIANT SAFEWING MPIV 2012 PROTECT (-3°C)
OCTAGON MAX-FLIGHT (-3°C)
Current Generic HOT (0 to -3°C)
106

4. HOLDOVER TIME TABLES, RESULTS, AND DISCUSSIONS
X:\@APS ARCHIVE\CM1680 (exBM3833) TC-Deicing 00-01 (REPORTS ONLY)\Reports\HOT\Final Version 1.0\Final Version 1.0.doc Final Version 1.0
August 05APS AVIATION INC.
107
4.2.2.1 Changes to Type IV fluid holdover times for snow The results of Type IV fluid testing in 1996-97, 1997-98, 1998-99, 1999-2000, and 2000-01 are presented in this section. The first horizontal row of values in each of the tables that follow contains the generic and fluid-specific holdover time values used in 1997-98, a result of tests conducted in 1996-97. The second line in each table contains the endurance time results from 1997-98 testing. The third line contains the generic and fluid-specific holdover time values that were used in winter operations in 1998-99. The fourth set of values is the endurance time test results from 1998-99 testing. The fifth row in each table contains the generic and fluid-specific holdover time values accepted for use in 1999-2000 winter operations. The sixth row in each table contains the endurance time results from 1999-2000 testing. The seventh row contains the generic and fluid-specific holdover time results accepted for use in winter operations in 2000-01. The eighth row contains the endurance time test results from 2000-01 testing. The ninth and final row in each of the tables contains the generic and fluid-specific holdover times accepted for use in 2001-02 winter operations. The underlined holdover time values in the tables indicate the fluids responsible for the generic holdover time. Despite being removed from the SAE test data at the G-12 meetings in New Orleans, the test data for Hoechst MPIV 1957 and diluted forms of Ultra+ are presented in each of the tables for the purpose of highlighting increases made to the various times. The values, although crossed out, remain in the table to chart the history of the generic and fluid-specific holdover time tables. Due to space limitations, the fluid codes indicated in brackets are used in the tables: Hoechst MPIV 1957 (H-1957); Kilfrost ABC-S (K-ABC-S); Octagon Max-Flight (Oct Max); UCAR Ultra+ (Ultra+); Clariant MPIV 1957 (C-1957) [Clariant reformulated Hoechst MPIV 1957 and changed its name as described in Section 2.7.3.2]; Clariant MPIV 2001 (C-2001); Clariant Safewing Four (C-S4); Clariant Safewing MPIV Protect 2012 (C-2012); SPCA AD-404 (S-404); SPCA AD-480 (S-480).

4. HOLDOVER TIME TABLES, RESULTS, AND DISCUSSIONS
X:\@APS ARCHIVE\CM1680 (exBM3833) TC-Deicing 00-01 (REPORTS ONLY)\Reports\HOT\Final Version 1.0\Final Version 1.0.doc Final Version 1.0
August 05APS AVIATION INC.
108
4.2.2.1.1 Neat fluid, above 0°C, snow (Figure 4.3) In this cell, the generic holdover times have remained unchanged and are based on the results of the low-viscosity Clariant MPIV 1957 fluid tested in 1998-99. Several upper fluid-specific holdover times have been limited to two hours in order to prevent the appearance of excessively long times in the holdover time tables.
TABLE 4.3 Holdover Time Guidelines for Neat Fluid, Above 0°C, Snow
SAE Oct Max K-ABC-S C-1957 H-1957 C-S4 Ultra+ S-480 C-2001 C-2012 S-404
1996-97 Test Results and Table Values Used in 1997-98
0:45-1:25 1:15-2:00 1:10-2:00 0:45-1:25
0:50-1:40
1997-98 Endurance Time Test Results 1:05-2:00
1:10-2:00 1:55-2:00 1:40-2:00
1998-99 HOT Table Values
0:45-1:25 1:15-2:00 1:10-2:00 1:05-2:00
0:50-1:40 1:10-2:00 1:55-2:00 1:40-2:00
1998-99 Endurance Time Test Results
1:00-1:30 1:10-2:00 0:35-1:05
0:40-1:25 1:45-2:00
1999-2000 HOT Table Values
0:35-1:05 1:00-1:30 1:10-2:00 0:35-1:05
0:40-1:25 1:10-2:00 1:55-2:00
1999-2000 Endurance Time Test Results 0:45-1:45 0:55-1:50
HIS
TO
RIC
AL
2000-01 HOT Table Values
0:35-1:05 1:00-1:30 1:10-2:00 0:35-1:05 0:45-1:45 0:40-1:25 0:55-1:50 1:55-2:00
2000-01 Endurance Time Test Results
2:00-2:00
1:05-2:00
CU
RREN
T
2001-02 HOT Table Values
0:35-1:05 1:15-2:00 1:10-2:00 0:35-1:05 0:45-1:45 0:40-1:25 0:55-1:50 1:55-2:00 1:05-2:00

109I:\Groups\CM1680(exBM3833)\Analysis\HOT\type IVHOT Summary snow1
At: Neat 0°C
FIGURE 4.3EFFECT OF FLUID BRAND AND RATE OF PRECIPITATION ON ENDURANCE TIME
TYPE IV NEAT (Above 0°C)NATURAL SNOW
0
10
20
30
40
50
60
70
80
90
100
110
120
0 5 10 15 20 25 30 35 40 45
Rate of Precipitation (g/dm²/h)
Flui
d Fa
ilure
Tim
e (m
inut
es)
CLARIANT 2012
OCTAGON MAX-FLIGHT
Current Generic HOT (Above 0°C)
# of Tests = 0
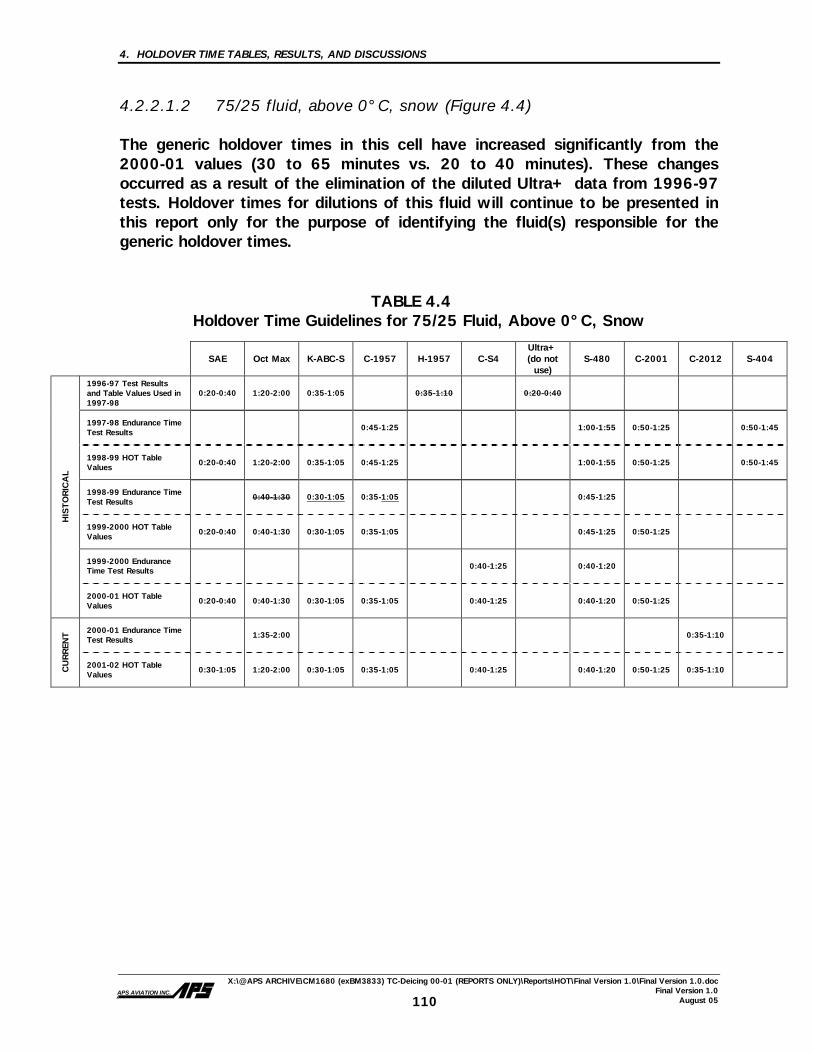
4. HOLDOVER TIME TABLES, RESULTS, AND DISCUSSIONS
X:\@APS ARCHIVE\CM1680 (exBM3833) TC-Deicing 00-01 (REPORTS ONLY)\Reports\HOT\Final Version 1.0\Final Version 1.0.doc Final Version 1.0
August 05APS AVIATION INC.
110
4.2.2.1.2 75/25 fluid, above 0°C, snow (Figure 4.4) The generic holdover times in this cell have increased significantly from the 2000-01 values (30 to 65 minutes vs. 20 to 40 minutes). These changes occurred as a result of the elimination of the diluted Ultra+ data from 1996-97 tests. Holdover times for dilutions of this fluid will continue to be presented in this report only for the purpose of identifying the fluid(s) responsible for the generic holdover times.
TABLE 4.4 Holdover Time Guidelines for 75/25 Fluid, Above 0°C, Snow
SAE Oct Max K-ABC-S C-1957 H-1957 C-S4
Ultra+ (do not
use) S-480 C-2001 C-2012 S-404
1996-97 Test Results and Table Values Used in 1997-98
0:20-0:40 1:20-2:00 0:35-1:05 0:35-1:10
0:20-0:40
1997-98 Endurance Time Test Results
0:45-1:25
1:00-1:55 0:50-1:25
0:50-1:45
1998-99 HOT Table Values
0:20-0:40 1:20-2:00 0:35-1:05 0:45-1:25
1:00-1:55 0:50-1:25
0:50-1:45
1998-99 Endurance Time Test Results
0:40-1:30 0:30-1:05 0:35-1:05
0:45-1:25
1999-2000 HOT Table Values
0:20-0:40 0:40-1:30 0:30-1:05 0:35-1:05
0:45-1:25 0:50-1:25
1999-2000 Endurance Time Test Results 0:40-1:25 0:40-1:20
HIS
TO
RIC
AL
2000-01 HOT Table Values
0:20-0:40 0:40-1:30 0:30-1:05 0:35-1:05 0:40-1:25 0:40-1:20 0:50-1:25
2000-01 Endurance Time Test Results
1:35-2:00
0:35-1:10
CU
RREN
T
2001-02 HOT Table Values
0:30-1:05 1:20-2:00 0:30-1:05 0:35-1:05 0:40-1:25 0:40-1:20 0:50-1:25 0:35-1:10

111I:\Groups\CM1680(exBM3833)\Analysis\HOT\type IV\HOT Summary snow1
At: 75% 0°CPrinted:9/13/2005, 12:44 PM
FIGURE 4.4EFFECT OF FLUID BRAND AND RATE OF PRECIPITATION ON ENDURANCE TIME
TYPE IV 75/25 (Above 0°C)NATURAL SNOW
0
10
20
30
40
50
60
70
80
90
100
110
120
0 5 10 15 20 25 30 35 40 45Rate of Precipitation (g/dm²/h)
Flui
d Fa
ilure
Tim
e (m
inut
es)
CLARIANT 2012
OCTAGON MAX-FLIGHT
Current Generic HOT (Above 0°C)
# of Tests = 0
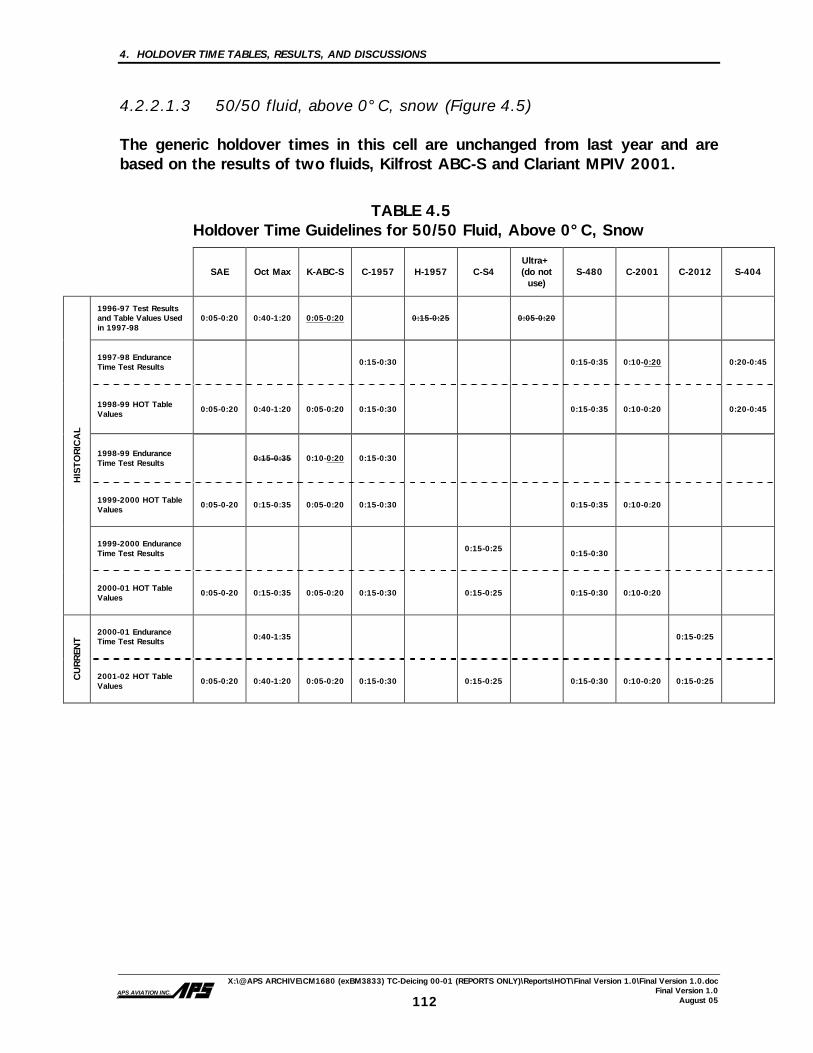
4. HOLDOVER TIME TABLES, RESULTS, AND DISCUSSIONS
X:\@APS ARCHIVE\CM1680 (exBM3833) TC-Deicing 00-01 (REPORTS ONLY)\Reports\HOT\Final Version 1.0\Final Version 1.0.doc Final Version 1.0
August 05APS AVIATION INC.
112
4.2.2.1.3 50/50 fluid, above 0°C, snow (Figure 4.5) The generic holdover times in this cell are unchanged from last year and are based on the results of two fluids, Kilfrost ABC-S and Clariant MPIV 2001.
TABLE 4.5 Holdover Time Guidelines for 50/50 Fluid, Above 0°C, Snow
SAE Oct Max K-ABC-S C-1957 H-1957 C-S4
Ultra+ (do not
use) S-480 C-2001 C-2012 S-404
1996-97 Test Results and Table Values Used in 1997-98
0:05-0:20 0:40-1:20 0:05-0:20 0:15-0:25
0:05-0:20
1997-98 Endurance Time Test Results
0:15-0:30
0:15-0:35 0:10-0:20 0:20-0:45
1998-99 HOT Table Values
0:05-0:20 0:40-1:20 0:05-0:20 0:15-0:30
0:15-0:35 0:10-0:20 0:20-0:45
1998-99 Endurance Time Test Results
0:15-0:35 0:10-0:20 0:15-0:30
1999-2000 HOT Table Values
0:05-0-20 0:15-0:35 0:05-0:20 0:15-0:30
0:15-0:35 0:10-0:20
1999-2000 Endurance Time Test Results
0:15-0:25 0:15-0:30
HIS
TO
RIC
AL
2000-01 HOT Table Values
0:05-0-20 0:15-0:35 0:05-0:20 0:15-0:30 0:15-0:25 0:15-0:30 0:10-0:20
2000-01 Endurance Time Test Results 0:40-1:35
0:15-0:25
CU
RREN
T
2001-02 HOT Table Values
0:05-0:20 0:40-1:20 0:05-0:20 0:15-0:30 0:15-0:25 0:15-0:30 0:10-0:20 0:15-0:25

113I:\Groups\CM1680(exBM3833)\Analysis\HOT\type IVHOT Summary snow1
At: 50% 0°C
FIGURE 4.5EFFECT OF FLUID BRAND AND RATE OF PRECIPITATION ON ENDURANCE TIME
TYPE IV 50/50 (Above 0°C)NATURAL SNOW
0
10
20
30
40
50
60
70
80
90
100
110
120
0 5 10 15 20 25 30 35 40 45Rate of Precipitation (g/dm²/h)
Flui
d Fa
ilure
Tim
e (m
inut
es)
CLARIANT 2012
CLARIANT 2012
OCTAGON MAX-FLIGHT
Current Generic HOT (Above 0°C)
# of Tests = 2
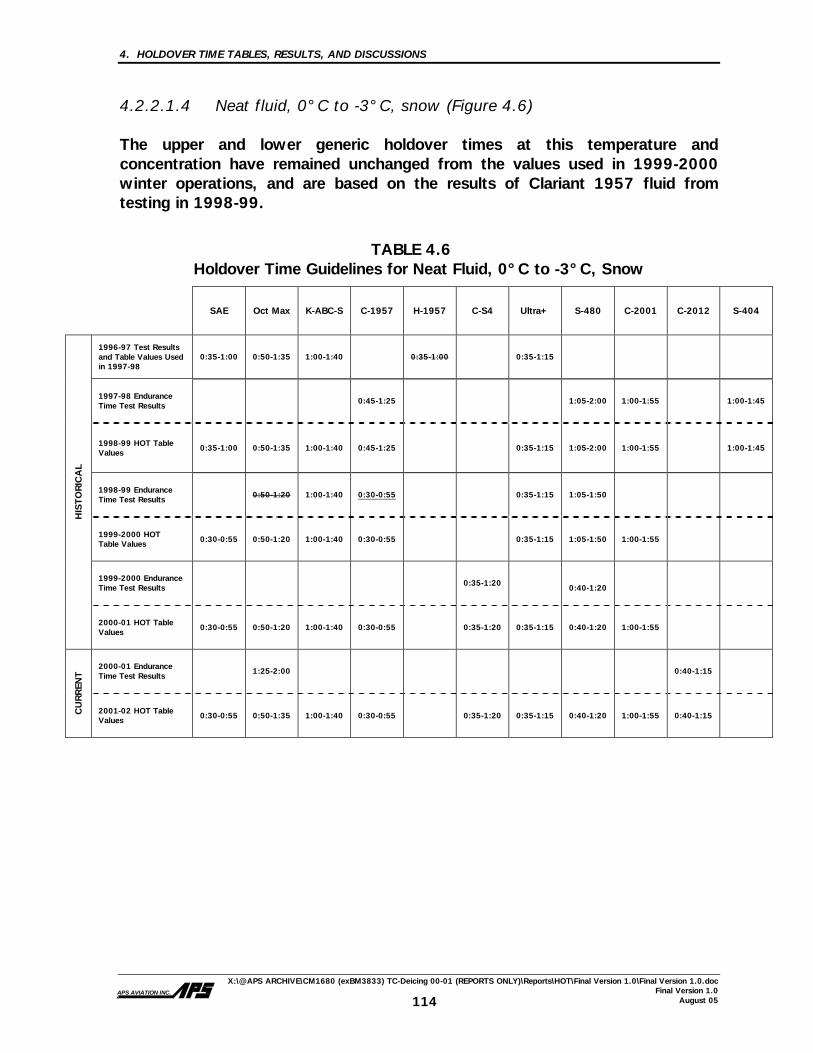
4. HOLDOVER TIME TABLES, RESULTS, AND DISCUSSIONS
X:\@APS ARCHIVE\CM1680 (exBM3833) TC-Deicing 00-01 (REPORTS ONLY)\Reports\HOT\Final Version 1.0\Final Version 1.0.doc Final Version 1.0
August 05APS AVIATION INC.
114
4.2.2.1.4 Neat fluid, 0°C to -3°C, snow (Figure 4.6) The upper and lower generic holdover times at this temperature and concentration have remained unchanged from the values used in 1999-2000 winter operations, and are based on the results of Clariant 1957 fluid from testing in 1998-99.
TABLE 4.6 Holdover Time Guidelines for Neat Fluid, 0°C to -3°C, Snow
SAE Oct Max K-ABC-S C-1957 H-1957 C-S4 Ultra+ S-480 C-2001 C-2012 S-404
1996-97 Test Results and Table Values Used in 1997-98
0:35-1:00 0:50-1:35 1:00-1:40 0:35-1:00
0:35-1:15
1997-98 Endurance Time Test Results
0:45-1:25
1:05-2:00 1:00-1:55 1:00-1:45
1998-99 HOT Table Values
0:35-1:00 0:50-1:35 1:00-1:40 0:45-1:25
0:35-1:15 1:05-2:00 1:00-1:55 1:00-1:45
1998-99 Endurance Time Test Results
0:50-1:20 1:00-1:40 0:30-0:55
0:35-1:15 1:05-1:50
1999-2000 HOT Table Values 0:30-0:55 0:50-1:20 1:00-1:40 0:30-0:55
0:35-1:15 1:05-1:50 1:00-1:55
1999-2000 Endurance Time Test Results
0:35-1:20 0:40-1:20
HIS
TO
RIC
AL
2000-01 HOT Table Values
0:30-0:55 0:50-1:20 1:00-1:40 0:30-0:55 0:35-1:20 0:35-1:15 0:40-1:20 1:00-1:55
2000-01 Endurance Time Test Results
1:25-2:00
0:40-1:15
CU
RREN
T
2001-02 HOT Table Values 0:30-0:55 0:50-1:35 1:00-1:40 0:30-0:55 0:35-1:20 0:35-1:15 0:40-1:20 1:00-1:55 0:40-1:15
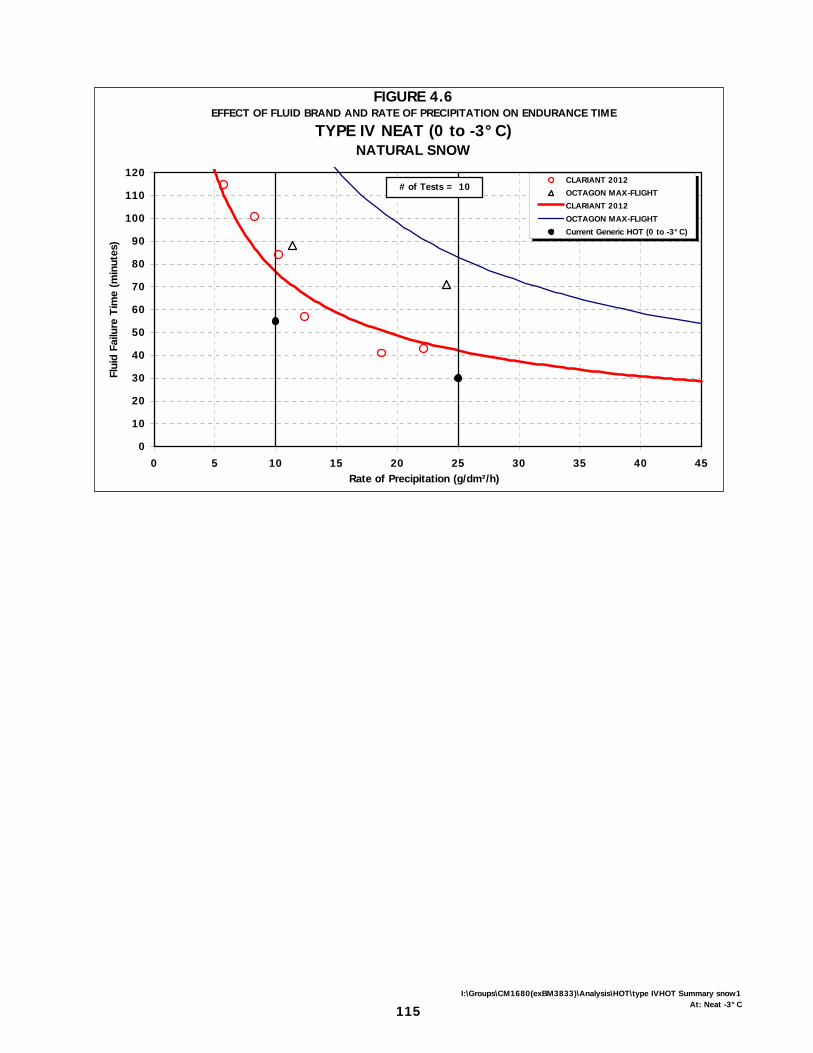
115I:\Groups\CM1680(exBM3833)\Analysis\HOT\type IVHOT Summary snow1
At: Neat -3°C
FIGURE 4.6EFFECT OF FLUID BRAND AND RATE OF PRECIPITATION ON ENDURANCE TIME
TYPE IV NEAT (0 to -3°C)NATURAL SNOW
0
10
20
30
40
50
60
70
80
90
100
110
120
0 5 10 15 20 25 30 35 40 45Rate of Precipitation (g/dm²/h)
Flui
d Fa
ilure
Tim
e (m
inut
es)
CLARIANT 2012
OCTAGON MAX-FLIGHT
CLARIANT 2012
OCTAGON MAX-FLIGHT
Current Generic HOT (0 to -3°C)
# of Tests = 10
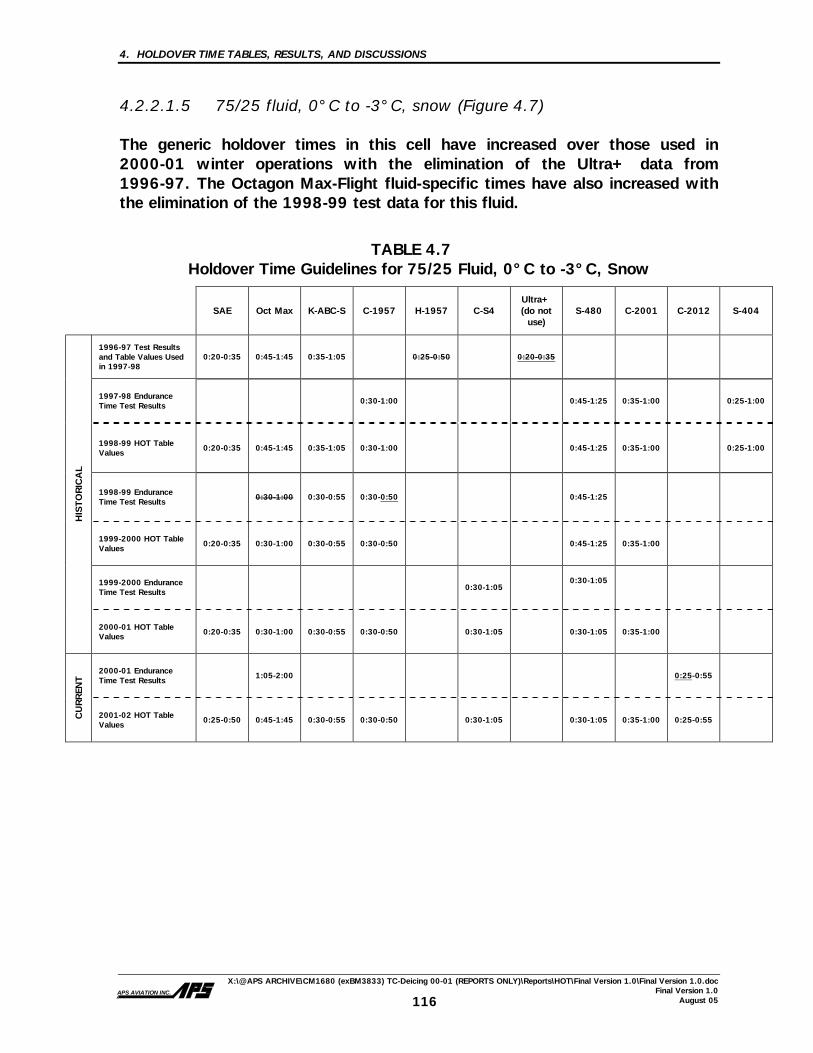
4. HOLDOVER TIME TABLES, RESULTS, AND DISCUSSIONS
X:\@APS ARCHIVE\CM1680 (exBM3833) TC-Deicing 00-01 (REPORTS ONLY)\Reports\HOT\Final Version 1.0\Final Version 1.0.doc Final Version 1.0
August 05APS AVIATION INC.
116
4.2.2.1.5 75/25 fluid, 0°C to -3°C, snow (Figure 4.7) The generic holdover times in this cell have increased over those used in 2000-01 winter operations with the elimination of the Ultra+ data from 1996-97. The Octagon Max-Flight fluid-specific times have also increased with the elimination of the 1998-99 test data for this fluid.
TABLE 4.7 Holdover Time Guidelines for 75/25 Fluid, 0°C to -3°C, Snow
SAE Oct Max K-ABC-S C-1957 H-1957 C-S4
Ultra+ (do not
use) S-480 C-2001 C-2012 S-404
1996-97 Test Results and Table Values Used in 1997-98
0:20-0:35 0:45-1:45 0:35-1:05 0:25-0:50
0:20-0:35
1997-98 Endurance Time Test Results
0:30-1:00
0:45-1:25 0:35-1:00 0:25-1:00
1998-99 HOT Table Values
0:20-0:35 0:45-1:45 0:35-1:05 0:30-1:00
0:45-1:25 0:35-1:00 0:25-1:00
1998-99 Endurance Time Test Results
0:30-1:00 0:30-0:55 0:30-0:50
0:45-1:25
1999-2000 HOT Table Values
0:20-0:35 0:30-1:00 0:30-0:55 0:30-0:50
0:45-1:25 0:35-1:00
1999-2000 Endurance Time Test Results
0:30-1:05
0:30-1:05
HIS
TO
RIC
AL
2000-01 HOT Table Values 0:20-0:35 0:30-1:00 0:30-0:55 0:30-0:50 0:30-1:05 0:30-1:05 0:35-1:00
2000-01 Endurance Time Test Results
1:05-2:00
0:25-0:55
CU
RREN
T
2001-02 HOT Table Values
0:25-0:50 0:45-1:45 0:30-0:55 0:30-0:50 0:30-1:05 0:30-1:05 0:35-1:00 0:25-0:55

117I:\Groups\CM1680(exBM3833)\Analysis\HOT\type IVHOT Summary snow1
At: 75% -3°C
FIGURE 4.7EFFECT OF FLUID BRAND AND RATE OF PRECIPITATION ON ENDURANCE TIME
TYPE IV 75/25 (0 to -3°C)NATURAL SNOW
0
10
20
30
40
50
60
70
80
90
100
110
120
0 5 10 15 20 25 30 35 40 45
Rate of Precipitation (g/dm²/h)
Flui
d Fa
ilure
Tim
e (m
inut
es)
CLARIANT 2012
OCTAGON MAX-FLIGHT
CLARIANT 2012
OCTAGON MAX-FLIGHT
Current Generic HOT (0 to -3°C)
# of Tests = 10

4. HOLDOVER TIME TABLES, RESULTS, AND DISCUSSIONS
X:\@APS ARCHIVE\CM1680 (exBM3833) TC-Deicing 00-01 (REPORTS ONLY)\Reports\HOT\Final Version 1.0\Final Version 1.0.doc Final Version 1.0
August 05APS AVIATION INC.
118
4.2.2.1.6 50/50 fluid, 0°C to -3°C, snow (Figure 4.8) The generic holdover times in this cell remain unchanged from those used in 2000-01 winter operations. The holdover time performances of the various fluids are quite similar at this dilution and temperature range, with the exception of Octagon Max-Flight, which significantly outperforms the rest. The Octagon Max-Flight fluid-specific times have also increased with the elimination of the 1998-99 test data for this fluid.
TABLE 4.8 Holdover Time Guidelines for 50/50 Fluid, 0°C to -3°C, Snow
SAE Oct Max K-ABC-
S C-1957 H-1957 C-S4
Ultra+ (do not
use) S-480 C-2001 C-2012 S-404
1996-97 Test Results and Table Values Used in 1997-98
0:05-0:15
0:40-1:20
0:05-0:15
0:15-0:25
0:05-0:15
1997-98 Endurance Time Test Results
0:40-1:20
0:05-0:15
0:10-0:20
0:10-0:30
0:10-0:20
0:15-0:30
1998-99 HOT Table Values
0:05-0:15
0:40-1:20
0:05-0:15
0:10-0:20
0:10-0:30
0:10-0:20 0:15-
0:30
1998-99 Endurance Time Test Results
0:05-0:15
0:15-0:30
0:05-0:15
0:10-0:20
1999-2000 HOT Table Values
0:05-0:15
0:15-0:30
0:05-0:15
0:10-0:20
0:10-0:30
0:10-0:20
1999-2000 Endurance Time Test Results
0:10-0:20
0:10-0:20
HIS
TO
RIC
AL
2000-01 HOT Table Values
0:05-0:15
0:15-0:30
0:05-0:15
0:10-0:20
0:10-0:20
0:10-0:20
0:10-0:20
2000-01 Endurance Time Test Results
0:25-1:15
0:15-0:25
CU
RREN
T
2001-02 HOT Table Values
0:05-0:15
0:25-1:15
0:05-0:15
0:10-0:20
0:10-0:20
0:10-0:20
0:10-0:20
0:15-0:25
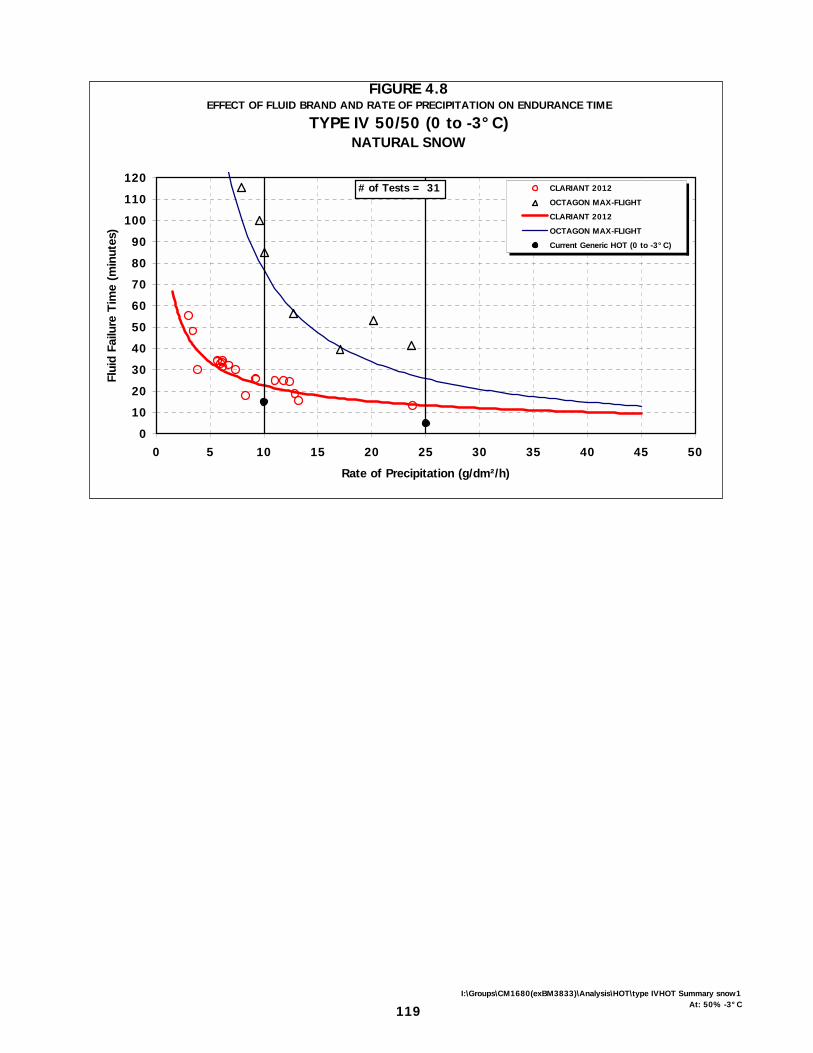
119I:\Groups\CM1680(exBM3833)\Analysis\HOT\type IVHOT Summary snow1
At: 50% -3°C
FIGURE 4.8EFFECT OF FLUID BRAND AND RATE OF PRECIPITATION ON ENDURANCE TIME
TYPE IV 50/50 (0 to -3°C)NATURAL SNOW
0
10
20
30
40
50
60
70
80
90
100
110
120
0 5 10 15 20 25 30 35 40 45 50
Rate of Precipitation (g/dm²/h)
Flui
d Fa
ilure
Tim
e (m
inut
es)
CLARIANT 2012
OCTAGON MAX-FLIGHT
CLARIANT 2012
OCTAGON MAX-FLIGHT
Current Generic HOT (0 to -3°C)
# of Tests = 31
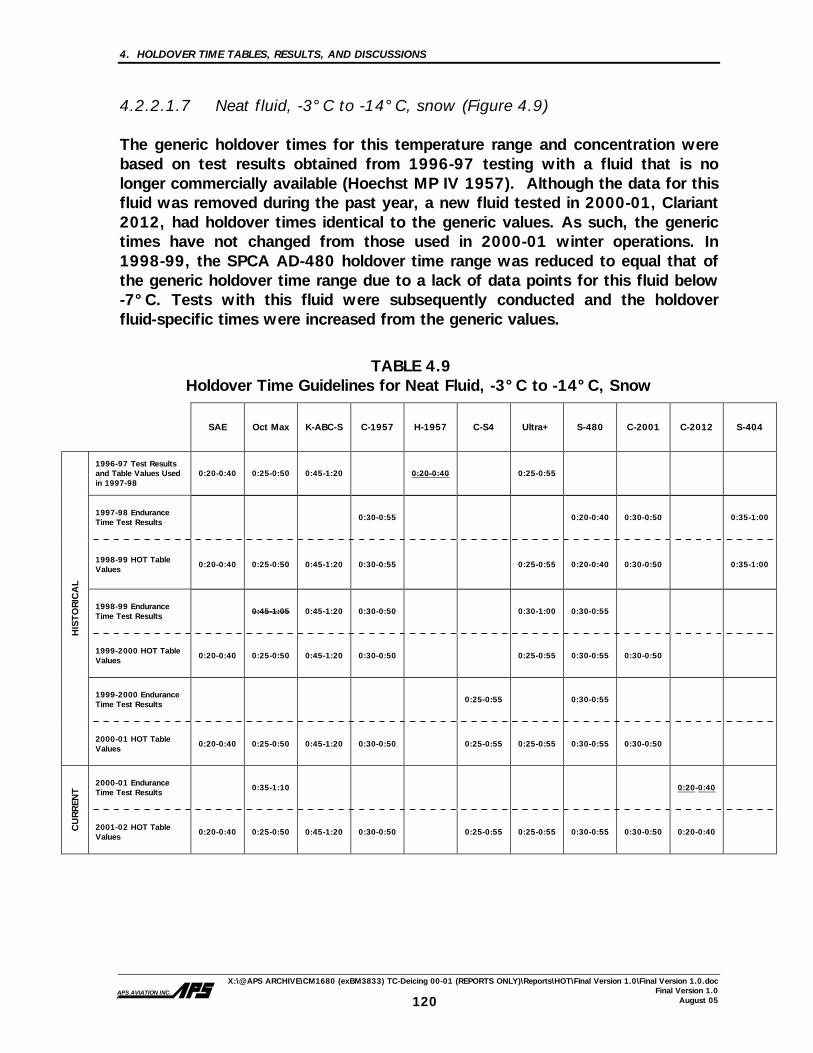
4. HOLDOVER TIME TABLES, RESULTS, AND DISCUSSIONS
X:\@APS ARCHIVE\CM1680 (exBM3833) TC-Deicing 00-01 (REPORTS ONLY)\Reports\HOT\Final Version 1.0\Final Version 1.0.doc Final Version 1.0
August 05APS AVIATION INC.
120
4.2.2.1.7 Neat fluid, -3°C to -14°C, snow (Figure 4.9) The generic holdover times for this temperature range and concentration were based on test results obtained from 1996-97 testing with a fluid that is no longer commercially available (Hoechst MP IV 1957). Although the data for this fluid was removed during the past year, a new fluid tested in 2000-01, Clariant 2012, had holdover times identical to the generic values. As such, the generic times have not changed from those used in 2000-01 winter operations. In 1998-99, the SPCA AD-480 holdover time range was reduced to equal that of the generic holdover time range due to a lack of data points for this fluid below -7°C. Tests with this fluid were subsequently conducted and the holdover fluid-specific times were increased from the generic values.
TABLE 4.9 Holdover Time Guidelines for Neat Fluid, -3°C to -14°C, Snow
SAE Oct Max K-ABC-S C-1957 H-1957 C-S4 Ultra+ S-480 C-2001 C-2012 S-404
1996-97 Test Results and Table Values Used in 1997-98
0:20-0:40 0:25-0:50 0:45-1:20 0:20-0:40
0:25-0:55
1997-98 Endurance Time Test Results
0:30-0:55
0:20-0:40 0:30-0:50 0:35-1:00
1998-99 HOT Table Values
0:20-0:40 0:25-0:50 0:45-1:20 0:30-0:55
0:25-0:55 0:20-0:40 0:30-0:50 0:35-1:00
1998-99 Endurance Time Test Results
0:45-1:05 0:45-1:20 0:30-0:50
0:30-1:00 0:30-0:55
1999-2000 HOT Table Values
0:20-0:40 0:25-0:50 0:45-1:20 0:30-0:50
0:25-0:55 0:30-0:55 0:30-0:50
1999-2000 Endurance Time Test Results
0:25-0:55 0:30-0:55
HIS
TO
RIC
AL
2000-01 HOT Table Values
0:20-0:40 0:25-0:50 0:45-1:20 0:30-0:50 0:25-0:55 0:25-0:55 0:30-0:55 0:30-0:50
2000-01 Endurance Time Test Results
0:35-1:10
0:20-0:40
CU
RREN
T
2001-02 HOT Table Values
0:20-0:40 0:25-0:50 0:45-1:20 0:30-0:50 0:25-0:55 0:25-0:55 0:30-0:55 0:30-0:50 0:20-0:40

121I:\Groups\CM1680(exBM3833)\Analysis\HOT\type IVHOT Summary snow1
At: Neat -14°C
FIGURE 4.9EFFECT OF FLUID BRAND AND RATE OF PRECIPITATION ON ENDURANCE TIME
TYPE IV NEAT (-3 to -14°C)NATURAL SNOW
0
10
20
30
40
50
60
70
80
90
100
110
120
0 5 10 15 20 25 30 35 40 45
Rate of Precipitation (g/dm²/h)
Flui
d Fa
ilure
Tim
e (m
inut
es)
CLARIANT 2012
OCTAGON MAX-FLIGHT
CLARIANT 2012
OCTAGON MAX-FLIGHT
Current Generic HOT (-3 to -14°C)
# of Tests = 38
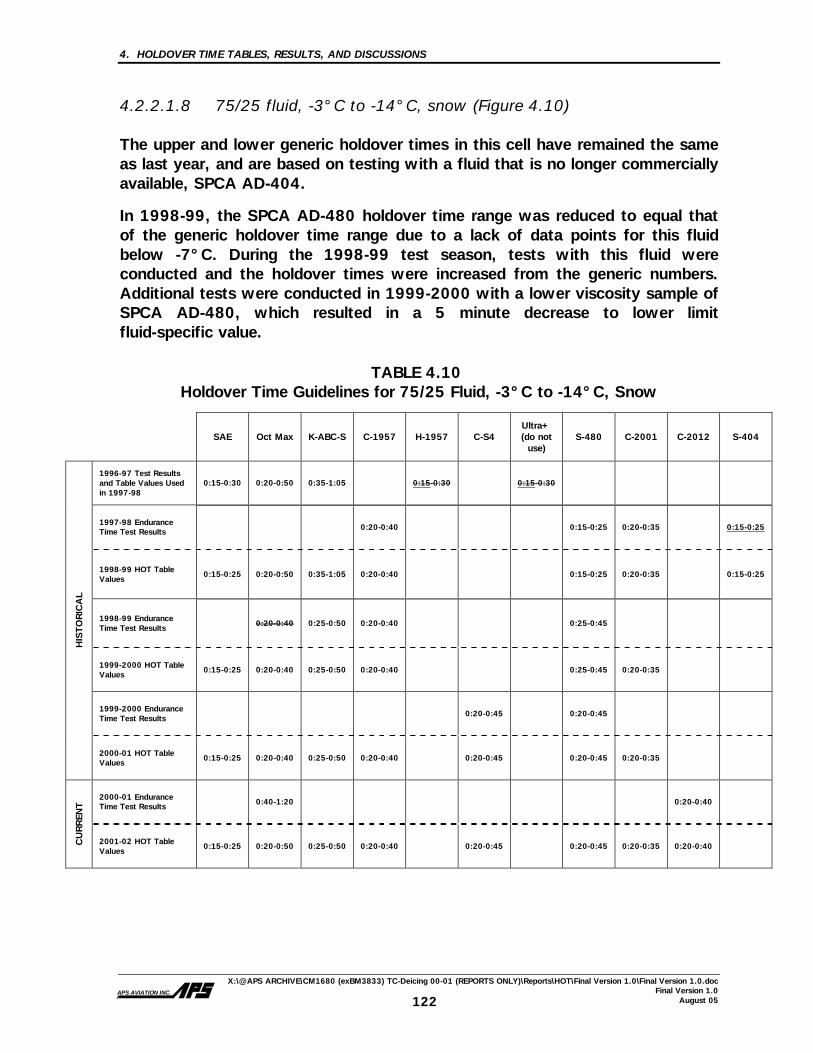
4. HOLDOVER TIME TABLES, RESULTS, AND DISCUSSIONS
X:\@APS ARCHIVE\CM1680 (exBM3833) TC-Deicing 00-01 (REPORTS ONLY)\Reports\HOT\Final Version 1.0\Final Version 1.0.doc Final Version 1.0
August 05APS AVIATION INC.
122
4.2.2.1.8 75/25 fluid, -3°C to -14°C, snow (Figure 4.10) The upper and lower generic holdover times in this cell have remained the same as last year, and are based on testing with a fluid that is no longer commercially available, SPCA AD-404.
In 1998-99, the SPCA AD-480 holdover time range was reduced to equal that of the generic holdover time range due to a lack of data points for this fluid below -7°C. During the 1998-99 test season, tests with this fluid were conducted and the holdover times were increased from the generic numbers. Additional tests were conducted in 1999-2000 with a lower viscosity sample of SPCA AD-480, which resulted in a 5 minute decrease to lower limit fluid-specific value.
TABLE 4.10 Holdover Time Guidelines for 75/25 Fluid, -3°C to -14°C, Snow
SAE Oct Max K-ABC-S C-1957 H-1957 C-S4
Ultra+ (do not
use) S-480 C-2001 C-2012 S-404
1996-97 Test Results and Table Values Used in 1997-98
0:15-0:30 0:20-0:50 0:35-1:05 0:15-0:30
0:15-0:30
1997-98 Endurance Time Test Results 0:20-0:40
0:15-0:25 0:20-0:35 0:15-0:25
1998-99 HOT Table Values
0:15-0:25 0:20-0:50 0:35-1:05 0:20-0:40
0:15-0:25 0:20-0:35 0:15-0:25
1998-99 Endurance Time Test Results
0:20-0:40 0:25-0:50 0:20-0:40
0:25-0:45
1999-2000 HOT Table Values
0:15-0:25 0:20-0:40 0:25-0:50 0:20-0:40
0:25-0:45 0:20-0:35
1999-2000 Endurance Time Test Results
0:20-0:45 0:20-0:45
HIS
TO
RIC
AL
2000-01 HOT Table Values
0:15-0:25 0:20-0:40 0:25-0:50 0:20-0:40 0:20-0:45 0:20-0:45 0:20-0:35
2000-01 Endurance Time Test Results 0:40-1:20
0:20-0:40
CU
RREN
T
2001-02 HOT Table Values
0:15-0:25 0:20-0:50 0:25-0:50 0:20-0:40 0:20-0:45 0:20-0:45 0:20-0:35 0:20-0:40

123I:\Groups\CM1680(exBM3833)\Analysis\HOT\HOT Summary snow1
At: 75% -14ºC
FIGURE 4.10EFFECT OF FLUID BRAND AND RATE OF PRECIPITATION ON ENDURANCE TIME
TYPE IV 75/25 (-3 to -14°C)NATURAL SNOW
0
10
20
30
40
50
60
70
80
90
100
110
120
0 5 10 15 20 25 30 35 40 45
Rate of Precipitation (g/dm²/h)
Flui
d Fa
ilure
Tim
e (m
inut
es)
CLARIANT 2012
OCTAGON MAX-FLIGHT
CLARIANT 2012
OCTAGON MAX-FLIGHT
Current Generic HOT (-3 to -14°C)
# of Tests = 37
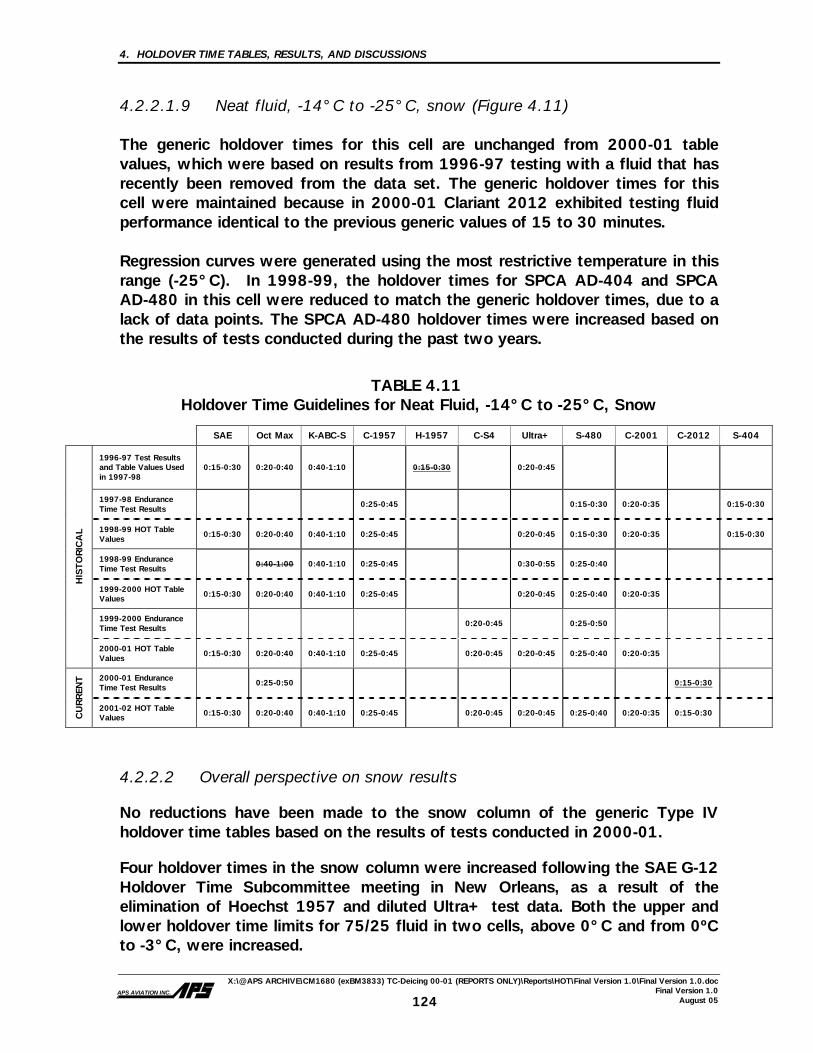
4. HOLDOVER TIME TABLES, RESULTS, AND DISCUSSIONS
X:\@APS ARCHIVE\CM1680 (exBM3833) TC-Deicing 00-01 (REPORTS ONLY)\Reports\HOT\Final Version 1.0\Final Version 1.0.doc Final Version 1.0
August 05APS AVIATION INC.
124
4.2.2.1.9 Neat fluid, -14°C to -25°C, snow (Figure 4.11) The generic holdover times for this cell are unchanged from 2000-01 table values, which were based on results from 1996-97 testing with a fluid that has recently been removed from the data set. The generic holdover times for this cell were maintained because in 2000-01 Clariant 2012 exhibited testing fluid performance identical to the previous generic values of 15 to 30 minutes. Regression curves were generated using the most restrictive temperature in this range (-25°C). In 1998-99, the holdover times for SPCA AD-404 and SPCA AD-480 in this cell were reduced to match the generic holdover times, due to a lack of data points. The SPCA AD-480 holdover times were increased based on the results of tests conducted during the past two years.
TABLE 4.11 Holdover Time Guidelines for Neat Fluid, -14°C to -25°C, Snow
SAE Oct Max K-ABC-S C-1957 H-1957 C-S4 Ultra+ S-480 C-2001 C-2012 S-404
1996-97 Test Results and Table Values Used in 1997-98
0:15-0:30 0:20-0:40 0:40-1:10 0:15-0:30
0:20-0:45
1997-98 Endurance Time Test Results
0:25-0:45
0:15-0:30 0:20-0:35 0:15-0:30
1998-99 HOT Table Values
0:15-0:30 0:20-0:40 0:40-1:10 0:25-0:45
0:20-0:45 0:15-0:30 0:20-0:35 0:15-0:30
1998-99 Endurance Time Test Results
0:40-1:00 0:40-1:10 0:25-0:45
0:30-0:55 0:25-0:40
1999-2000 HOT Table Values 0:15-0:30 0:20-0:40 0:40-1:10 0:25-0:45
0:20-0:45 0:25-0:40 0:20-0:35
1999-2000 Endurance Time Test Results
0:20-0:45 0:25-0:50
HIS
TO
RIC
AL
2000-01 HOT Table Values
0:15-0:30 0:20-0:40 0:40-1:10 0:25-0:45 0:20-0:45 0:20-0:45 0:25-0:40 0:20-0:35
2000-01 Endurance Time Test Results
0:25-0:50
0:15-0:30
CU
RREN
T
2001-02 HOT Table Values 0:15-0:30 0:20-0:40 0:40-1:10 0:25-0:45 0:20-0:45 0:20-0:45 0:25-0:40 0:20-0:35 0:15-0:30
4.2.2.2 Overall perspective on snow results No reductions have been made to the snow column of the generic Type IV holdover time tables based on the results of tests conducted in 2000-01. Four holdover times in the snow column were increased following the SAE G-12 Holdover Time Subcommittee meeting in New Orleans, as a result of the elimination of Hoechst 1957 and diluted Ultra+ test data. Both the upper and lower holdover time limits for 75/25 fluid in two cells, above 0°C and from 0ºC to -3°C, were increased.

125I:\Groups\CM1680(exBM3833)\Analysis\HOT\type IV\HOT Summary snow1
At: Neat-25ºC
FIGURE 4.11EFFECT OF FLUID BRAND AND RATE OF PRECIPITATION ON ENDURANCE TIME
TYPE IV NEAT (-14 to -25°C)NATURAL SNOW
0
10
20
30
40
50
60
70
80
90
100
110
120
0 5 10 15 20 25 30 35 40 45
Rate of Precipitation (g/dm²/h)
Flui
d Fa
ilure
Tim
e (m
inut
es)
CLARIANT 2012
OCTAGON MAX-FLIGHT
CLARIANT 2012
OCTAGON MAX-FLIGHT
Current Generic HOT (-14 to -25°C)
# of Tests = 17
4. HOLDOVER TIME TABLES, RESULTS, AND DISCUSSIONS
X:\@APS ARCHIVE\CM1680 (exBM3833) TC-Deicing 00-01 (REPORTS ONLY)\Reports\HOT\Final Version 1.0\Final Version 1.0.doc Final Version 1.0
August 05APS AVIATION INC.
126
4.2.3 Freezing Drizzle The freezing drizzle holdover time data originated from tests conducted by APS at the NRC test facility in Ottawa. The fluid failure time versus precipitation rate data have been plotted either as a function of temperature or as a function of fluid brand (Appendix G). The latter plot format lends itself more easily to the cell-by-cell presentation of results for each category of precipitation and accompanies discussions regarding changes to holdover times. These plots appear in the body of the text as Figures 4.12 to 4.16. Subsections 4.2.3.1.1 to 4.2.3.1.5 contain the Type IV fluid holdover time results in the freezing drizzle column. They are arranged in tabular form and follow the sequence of temperature ranges as they appear in the holdover time tables, from top to bottom. Because it was not possible to simulate freezing drizzle above 0°C, the holdover time results for this category of precipitation are identical to those in the range of 0°C to -3°C.
4.2.3.1 Changes to Type IV fluid holdover times for freezing drizzle The results of Type IV fluid testing from 1996-97, 1997-98, 1998-99 1999-2000, and 2000-01 in conditions of freezing drizzle are presented in this section in the same format as presented for snow. (Refer to the explanation of holdover time results in natural snow tests in Subsection 4.2.2.1).
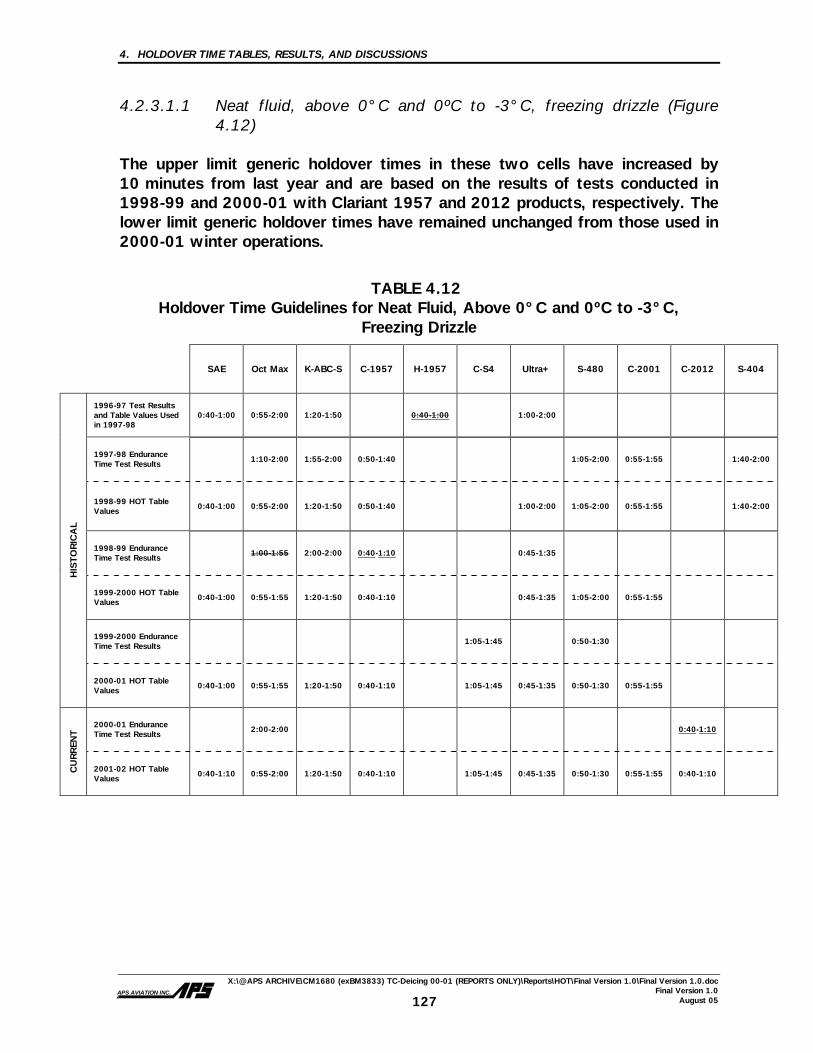
4. HOLDOVER TIME TABLES, RESULTS, AND DISCUSSIONS
X:\@APS ARCHIVE\CM1680 (exBM3833) TC-Deicing 00-01 (REPORTS ONLY)\Reports\HOT\Final Version 1.0\Final Version 1.0.doc Final Version 1.0
August 05APS AVIATION INC.
127
4.2.3.1.1 Neat fluid, above 0°C and 0ºC to -3°C, freezing drizzle (Figure 4.12)
The upper limit generic holdover times in these two cells have increased by 10 minutes from last year and are based on the results of tests conducted in 1998-99 and 2000-01 with Clariant 1957 and 2012 products, respectively. The lower limit generic holdover times have remained unchanged from those used in 2000-01 winter operations.
TABLE 4.12 Holdover Time Guidelines for Neat Fluid, Above 0°C and 0ºC to -3°C,
Freezing Drizzle
SAE Oct Max K-ABC-S C-1957 H-1957 C-S4 Ultra+ S-480 C-2001 C-2012 S-404
1996-97 Test Results and Table Values Used in 1997-98
0:40-1:00 0:55-2:00 1:20-1:50 0:40-1:00
1:00-2:00
1997-98 Endurance Time Test Results
1:10-2:00 1:55-2:00 0:50-1:40
1:05-2:00 0:55-1:55 1:40-2:00
1998-99 HOT Table Values
0:40-1:00 0:55-2:00 1:20-1:50 0:50-1:40
1:00-2:00 1:05-2:00 0:55-1:55 1:40-2:00
1998-99 Endurance Time Test Results
1:00-1:55 2:00-2:00 0:40-1:10
0:45-1:35
1999-2000 HOT Table Values
0:40-1:00 0:55-1:55 1:20-1:50 0:40-1:10
0:45-1:35 1:05-2:00 0:55-1:55
1999-2000 Endurance Time Test Results
1:05-1:45 0:50-1:30
HIS
TO
RIC
AL
2000-01 HOT Table Values
0:40-1:00 0:55-1:55 1:20-1:50 0:40-1:10 1:05-1:45 0:45-1:35 0:50-1:30 0:55-1:55
2000-01 Endurance Time Test Results
2:00-2:00
0:40-1:10
CU
RREN
T
2001-02 HOT Table Values
0:40-1:10 0:55-2:00 1:20-1:50 0:40-1:10 1:05-1:45 0:45-1:35 0:50-1:30 0:55-1:55 0:40-1:10

128I:\Groups\CM1680(exBM3833)\Analysis\HOT\type IV\HOT Summary ARTIF1
At: Neat ZD -3°C
FIGURE 4.12EFFECT OF FLUID BRAND AND RATE OF PRECIPITATION ON ENDURANCE TIME
TYPE IV (NEAT)FREEZING DRIZZLE AT -3oC
0
10
20
30
40
50
60
70
80
90
100
110
120
130
140
150
160
0 2 4 6 8 10 12 14 16
Rate of Precipitation (g/dm²/h)
Failu
re T
ime
(min
utes
)
CLARIANT 2012
OCTAGON MAX-FLIGHT
CLARIANT 2012
OCTAGON MAX-FLIGHT
Current Generic HOT (0 to -3°C)
# of Tests = 9
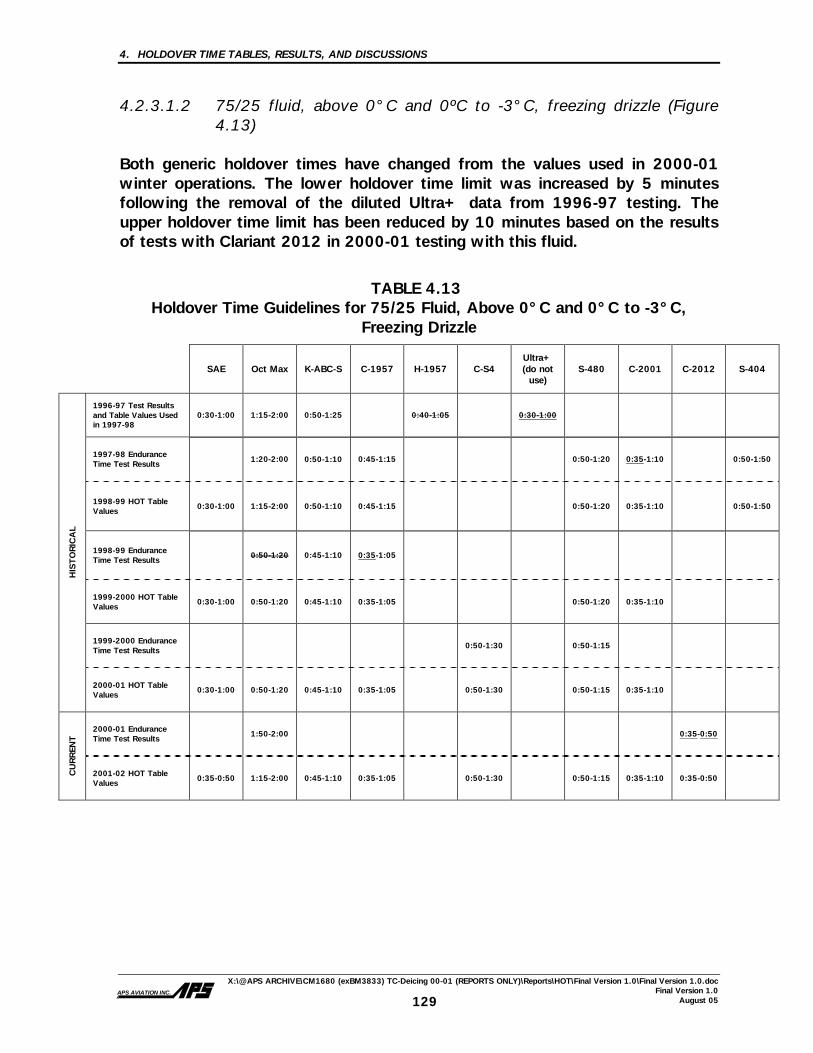
4. HOLDOVER TIME TABLES, RESULTS, AND DISCUSSIONS
X:\@APS ARCHIVE\CM1680 (exBM3833) TC-Deicing 00-01 (REPORTS ONLY)\Reports\HOT\Final Version 1.0\Final Version 1.0.doc Final Version 1.0
August 05APS AVIATION INC.
129
4.2.3.1.2 75/25 fluid, above 0°C and 0ºC to -3°C, freezing drizzle (Figure 4.13)
Both generic holdover times have changed from the values used in 2000-01 winter operations. The lower holdover time limit was increased by 5 minutes following the removal of the diluted Ultra+ data from 1996-97 testing. The upper holdover time limit has been reduced by 10 minutes based on the results of tests with Clariant 2012 in 2000-01 testing with this fluid.
TABLE 4.13 Holdover Time Guidelines for 75/25 Fluid, Above 0°C and 0°C to -3°C,
Freezing Drizzle
SAE Oct Max K-ABC-S C-1957 H-1957 C-S4 Ultra+ (do not
use) S-480 C-2001 C-2012 S-404
1996-97 Test Results and Table Values Used in 1997-98
0:30-1:00 1:15-2:00 0:50-1:25 0:40-1:05
0:30-1:00
1997-98 Endurance Time Test Results
1:20-2:00 0:50-1:10
0:45-1:15
0:50-1:20 0:35-1:10 0:50-1:50
1998-99 HOT Table Values
0:30-1:00 1:15-2:00 0:50-1:10 0:45-1:15
0:50-1:20 0:35-1:10 0:50-1:50
1998-99 Endurance Time Test Results
0:50-1:20 0:45-1:10 0:35-1:05
1999-2000 HOT Table Values
0:30-1:00 0:50-1:20 0:45-1:10 0:35-1:05
0:50-1:20 0:35-1:10
1999-2000 Endurance Time Test Results
0:50-1:30 0:50-1:15
HIS
TO
RIC
AL
2000-01 HOT Table Values
0:30-1:00 0:50-1:20 0:45-1:10 0:35-1:05 0:50-1:30 0:50-1:15 0:35-1:10
2000-01 Endurance Time Test Results
1:50-2:00
0:35-0:50
CU
RREN
T
2001-02 HOT Table Values
0:35-0:50 1:15-2:00 0:45-1:10 0:35-1:05 0:50-1:30 0:50-1:15 0:35-1:10 0:35-0:50

130I:\Groups\CM1680(exBM3833)\Analysis\HOT\type IV\HOT Summary ARTIF1
At: 75-25 ZD -3°C
FIGURE 4.13EFFECT OF FLUID BRAND AND RATE OF PRECIPITATION ON ENDURANCE TIME
TYPE IV (75/25)FREEZING DRIZZLE AT -3oC
0
10
20
30
40
50
60
70
80
90
100
110
120
0 2 4 6 8 10 12 14 16
Rate of Precipitation (g/dm2/h)
Failu
re T
ime
(min
utes
)
CLARIANT 2012
OCTAGON MAX-FLIGHT
CLARIANT 2012
OCTAGON MAX-FLIGHT
Current Generic HOT (0 to -3°C)
# of Tests = 8

4. HOLDOVER TIME TABLES, RESULTS, AND DISCUSSIONS
X:\@APS ARCHIVE\CM1680 (exBM3833) TC-Deicing 00-01 (REPORTS ONLY)\Reports\HOT\Final Version 1.0\Final Version 1.0.doc Final Version 1.0
August 05APS AVIATION INC.
131
4.2.3.1.3 50/50 fluid, above 0°C and 0°C to -3°C, freezing drizzle (Figure 4.14)
The generic holdover times for these two cells remain unchanged from last year and are based on test results with two different fluids. The fluid-specific values for Octagon Max-Flight have increased substantially with the removal of the 1998-99 test data with this fluid.
TABLE 4.14 Holdover Time Guidelines for 50/50 Fluid, Above 0°C and 0°C to -3°C,
Freezing Drizzle
SAE Oct Max K-ABC-S C-1957 H-1957 C-S4 Ultra+ (do not
use) S-480 C-2001 C-2012 S-404
1996-97 Test Results and Table Values Used in 1997-98
0:10-0:20 0:55-1:40 0:15-0:25 0:20-0:35
0:10-0:20
1997-98 Endurance Time Test Results
0:35-1:00
0:15-0:20
0:15-0:25
0:15-0:35 0:10-0:20
0:25-0:55
1998-99 HOT Table Values 0:10-0:20
0:35-1:00
0:15-0:20
0:15-0:25
0:15-0:35 0:10-0:20
0:25-0:55
1998-99 Endurance Time Test Results 0:15-0:25 0:15-0:20 0:15-0:25
1999-2000 HOT Table Values
0:10-0:20 0:15-0:25
0:15-0:20
0:15-0:25
0:15-0:35 0:10-0:20
1999-2000 Endurance Time Test Results
0:15-0:25 0:15-0:25
HIS
TO
RIC
AL
2000-01 HOT Table Values
0:10-0:20 0:15-0:25
0:15-0:20
0:15-0:25 0:15-0:25 0:15-0:25 0:10-0:20
2000-01 Endurance Time Test Results
0:35-1:10
0:15-0:20
CU
RREN
T
2001-02 HOT Table Values
0:10-0:20 0:35-1:00
0:15-0:20
0:15-0:25 0:15-0:25 0:15-0:25 0:10-0:20 0:15-0:20

132I:\Groups\CM1680(exBM3833)\Analysis\HOT\type IV\HOT Summary ARTIF1
At: 50-50 ZD -3°CPrinted: 9/13/2005, 1:01 PM
FIGURE 4.14EFFECT OF FLUID BRAND AND RATE OF PRECIPITATION ON ENDURANCE TIME
TYPE IV (50/50)FREEZING DRIZZLE AT -3oC
0
10
20
30
40
50
60
70
80
90
100
110
120
0 2 4 6 8 10 12 14 16 18 20 22 24 26 28 30
Rate of Precipitation (g/dm²/h)
Failu
re T
ime
(min
utes
)
CLARIANT 2012
OCTAGON MAX-FLIGHT
CLARIANT 2012
OCTAGON MAX-FLIGHT
Current Generic HOT (0 to -3°C)
# of Tests = 9
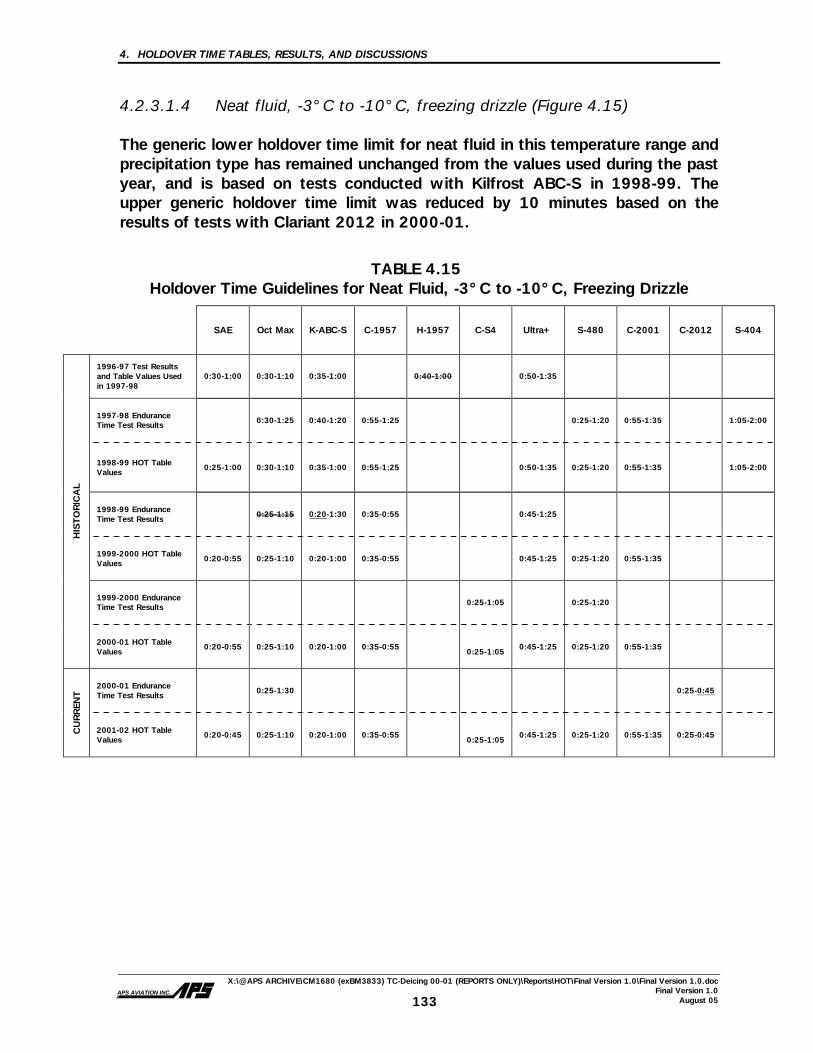
4. HOLDOVER TIME TABLES, RESULTS, AND DISCUSSIONS
X:\@APS ARCHIVE\CM1680 (exBM3833) TC-Deicing 00-01 (REPORTS ONLY)\Reports\HOT\Final Version 1.0\Final Version 1.0.doc Final Version 1.0
August 05APS AVIATION INC.
133
4.2.3.1.4 Neat fluid, -3°C to -10°C, freezing drizzle (Figure 4.15) The generic lower holdover time limit for neat fluid in this temperature range and precipitation type has remained unchanged from the values used during the past year, and is based on tests conducted with Kilfrost ABC-S in 1998-99. The upper generic holdover time limit was reduced by 10 minutes based on the results of tests with Clariant 2012 in 2000-01.
TABLE 4.15 Holdover Time Guidelines for Neat Fluid, -3°C to -10°C, Freezing Drizzle
SAE Oct Max K-ABC-S C-1957 H-1957 C-S4 Ultra+ S-480 C-2001 C-2012 S-404
1996-97 Test Results and Table Values Used in 1997-98
0:30-1:00 0:30-1:10 0:35-1:00 0:40-1:00
0:50-1:35
1997-98 Endurance Time Test Results 0:30-1:25 0:40-1:20 0:55-1:25
0:25-1:20 0:55-1:35 1:05-2:00
1998-99 HOT Table Values
0:25-1:00 0:30-1:10 0:35-1:00 0:55-1:25
0:50-1:35 0:25-1:20 0:55-1:35 1:05-2:00
1998-99 Endurance Time Test Results
0:25-1:15 0:20-1:30 0:35-0:55
0:45-1:25
1999-2000 HOT Table Values
0:20-0:55 0:25-1:10 0:20-1:00 0:35-0:55
0:45-1:25 0:25-1:20 0:55-1:35
1999-2000 Endurance Time Test Results 0:25-1:05 0:25-1:20
HIS
TO
RIC
AL
2000-01 HOT Table Values
0:20-0:55 0:25-1:10 0:20-1:00 0:35-0:55 0:25-1:05
0:45-1:25 0:25-1:20 0:55-1:35
2000-01 Endurance Time Test Results
0:25-1:30
0:25-0:45
CU
RREN
T
2001-02 HOT Table Values
0:20-0:45 0:25-1:10 0:20-1:00 0:35-0:55 0:25-1:05
0:45-1:25 0:25-1:20 0:55-1:35 0:25-0:45

134I:\Groups\CM1680(exBM3833)\Analysis\HOT\type IV\HOT Summary ARTIF1
At: Neat ZD -10°C
FIGURE 4.15EFFECT OF FLUID BRAND AND RATE OF PRECIPITATION ON ENDURANCE TIME
TYPE IV (NEAT)FREEZING DRIZZLE AT -10oC
0
10
20
30
40
50
60
70
80
90
100
110
120
0 2 4 6 8 10 12 14 16Rate of Precipitation (g/dm²/h)
Failu
re T
ime
(min
utes
)
CLARIANT 2012
OCTAGON MAX-FLIGHT
CLARIANT 2012
OCTAGON MAX-FLIGHT
Current Generic HOT (-3 to -10°C)
# of Tests = 8

4. HOLDOVER TIME TABLES, RESULTS, AND DISCUSSIONS
X:\@APS ARCHIVE\CM1680 (exBM3833) TC-Deicing 00-01 (REPORTS ONLY)\Reports\HOT\Final Version 1.0\Final Version 1.0.doc Final Version 1.0
August 05APS AVIATION INC.
135
4.2.3.1.5 75/25 fluid, -3°C to -10°C, freezing drizzle (Figure 4.16) The generic holdover time range for 75/25 fluid in freezing drizzle was reduced from 20 – 50 minutes to 15 – 30 minutes, based on the 2000-01 test results with the Clariant 2012 fluid.
TABLE 4.16 Holdover Time Guidelines for 75/25 Fluid, -3°C to -10°C, Freezing Drizzle
SAE Oct Max K-ABC-S C-1957 H-1957 C-S4
Ultra+ (do not
use) S-480 C-2001 C-2012 S-404
1996-97 Test Results and Table Values Used in 1997-98
0:30-1:00 0:30-1:05 0:50-1:25 0:40-1:05
0:30-1:00
1997-98 Endurance Time Test Results
0:25-1:20 0:30-1:10
0:45-1:15
0:30-1:15 0:40-1:10 0:30-1:45
1998-99 HOT Table Values 0:30-1:00 0:25-1:05 0:30-1:10 0:45-1:15
0:30-1:15 0:40-1:10 0:30-1:45
1998-99 Endurance Time Test Results
0:20-1:00 0:20-1:30 0:25-0:55
1999-2000 HOT Table Values
0:20-0:55 0:20-1:00 0:20-1:10 0:25-0:55
0:30-1:15 0:40-1:10
1999-2000 Endurance Time Test Results
0:20-0:50 0:25-1:05
HIS
TO
RIC
AL
2000-01 HOT Table Values
0:20-0:50 0:20-1:00 0:20-1:10 0:25-0:55 0:20-0:50 0:25-1:05 0:40-1:10
2000-01 Endurance Time Test Results
0:20-1:00
0:15-0:30
CU
RREN
T
2001-02 HOT Table Values
0:15-0:30 0:20-1:00 0:20-1:10 0:25-0:55 0:20-0:50 0:25-1:05 0:40-1:10 0:15-0:30
4.2.3.2 Overall perspective on freezing drizzle results Several reductions and increases have been made to the freezing drizzle column of the generic Type IV holdover time table. The five reductions range from 5 to 20 minutes and are a result of tests conducted during the 2000-01 test season with Clariant 2012 fluid. In addition to the five reductions, four increases were made to the freezing drizzle column of the generic Type IV holdover time table. Obsolete test data from 1996-97 testing were removed, resulting in two 5-minute and two 10-minute increases to the generic numbers.
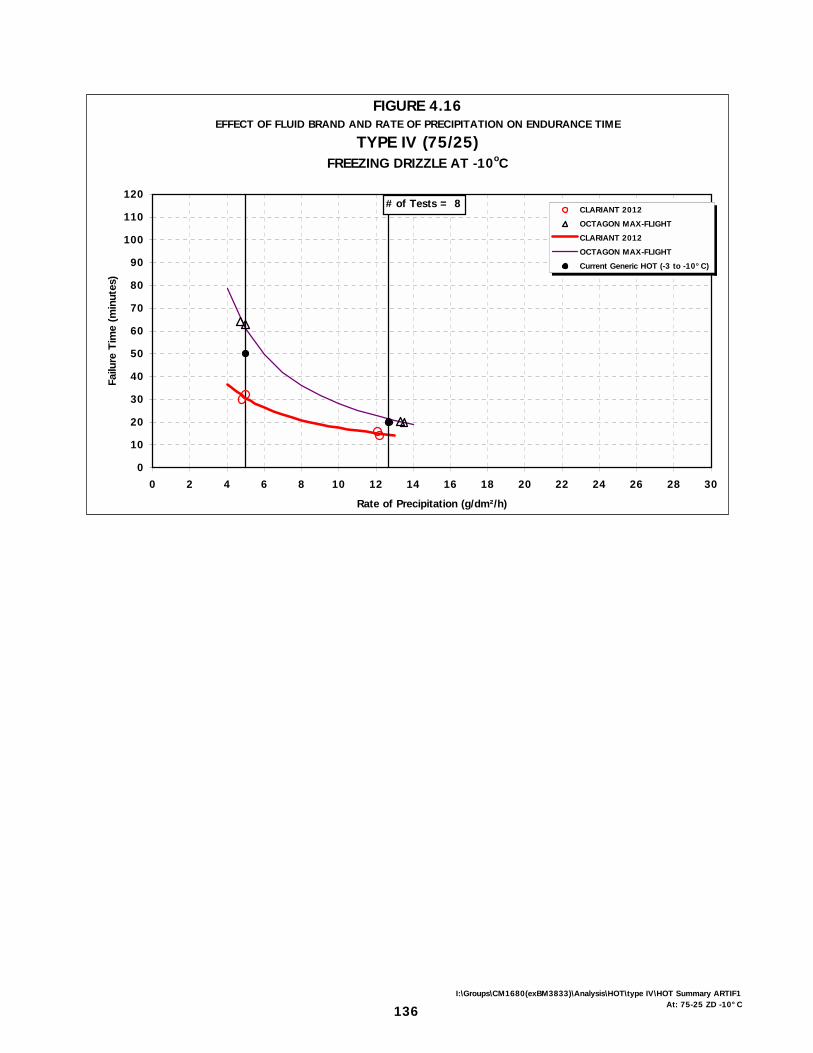
136I:\Groups\CM1680(exBM3833)\Analysis\HOT\type IV\HOT Summary ARTIF1
At: 75-25 ZD -10°C
FIGURE 4.16EFFECT OF FLUID BRAND AND RATE OF PRECIPITATION ON ENDURANCE TIME
TYPE IV (75/25)FREEZING DRIZZLE AT -10oC
0
10
20
30
40
50
60
70
80
90
100
110
120
0 2 4 6 8 10 12 14 16 18 20 22 24 26 28 30
Rate of Precipitation (g/dm²/h)
Failu
re T
ime
(min
utes
)
CLARIANT 2012
OCTAGON MAX-FLIGHT
CLARIANT 2012
OCTAGON MAX-FLIGHT
Current Generic HOT (-3 to -10°C)
# of Tests = 8

4. HOLDOVER TIME TABLES, RESULTS, AND DISCUSSIONS
X:\@APS ARCHIVE\CM1680 (exBM3833) TC-Deicing 00-01 (REPORTS ONLY)\Reports\HOT\Final Version 1.0\Final Version 1.0.doc Final Version 1.0
August 05APS AVIATION INC.
137
4.2.4 Light Freezing Rain The light freezing rain endurance time data were obtained from tests conducted by APS at the NRC test facility in Ottawa. The fluid failure time versus precipitation rate data have been plotted either as a function of temperature or as a function of fluid brand (Appendix G). The latter plot format lends itself more easily to the cell-by-cell presentation of results for each category of precipitation and accompanies discussions regarding changes to holdover times. These plots appear in the body of the text as Figures 4.17 to 4.21. Subsections 4.2.4.1.1 to 4.2.4.1.5 contain the Type IV fluid holdover time results in the light freezing rain column. Results are arranged in tabular form and follow the sequence of temperature ranges as they appear in the holdover time tables, from top to bottom. Because it was not possible to simulate freezing drizzle above 0°C, the holdover time values for the category of precipitation above 0°C are identical to those in the range of 0°C to -3°C.
4.2.4.1 Changes to Type IV fluid holdover times for light freezing rain The results of Type IV fluid testing from 1996-97, 1997-98, 1998-99, and 1999-2000 in conditions of light freezing rain are presented in this subsection in the same format as for freezing drizzle and snow. (Refer to the explanation of holdover time results in natural snow tests in Subsection 4.2.2.1).
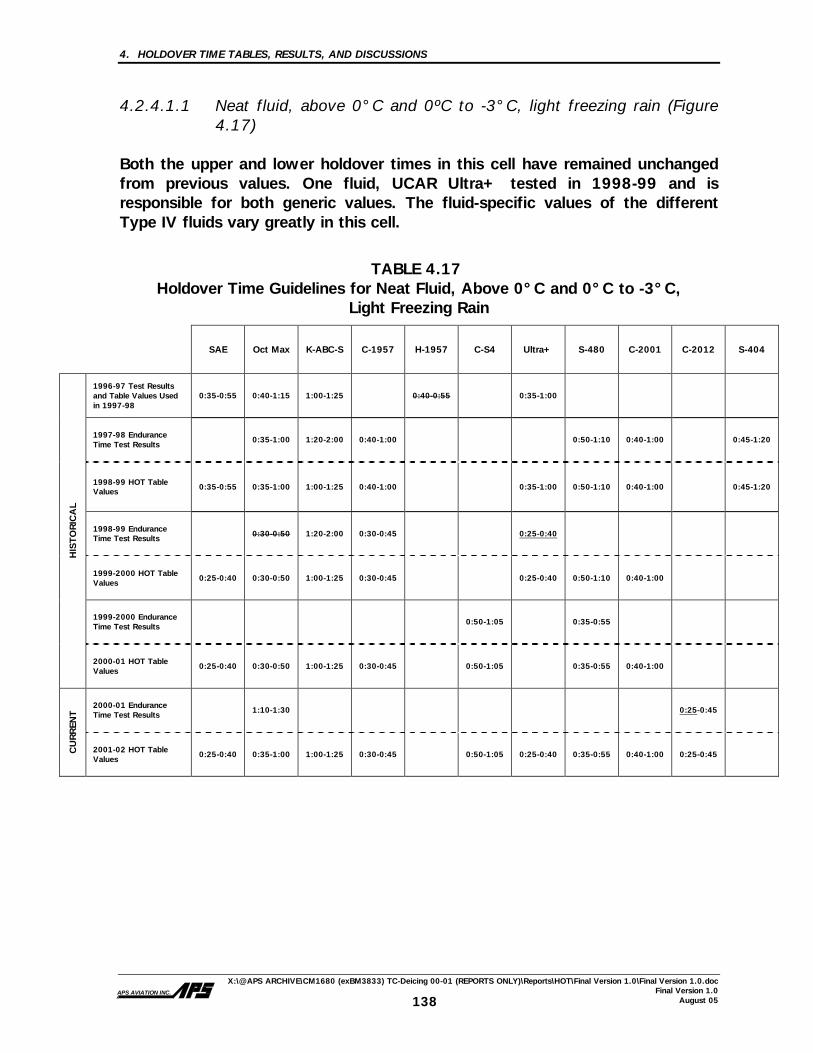
4. HOLDOVER TIME TABLES, RESULTS, AND DISCUSSIONS
X:\@APS ARCHIVE\CM1680 (exBM3833) TC-Deicing 00-01 (REPORTS ONLY)\Reports\HOT\Final Version 1.0\Final Version 1.0.doc Final Version 1.0
August 05APS AVIATION INC.
138
4.2.4.1.1 Neat fluid, above 0°C and 0ºC to -3°C, light freezing rain (Figure 4.17)
Both the upper and lower holdover times in this cell have remained unchanged from previous values. One fluid, UCAR Ultra+ tested in 1998-99 and is responsible for both generic values. The fluid-specific values of the different Type IV fluids vary greatly in this cell.
TABLE 4.17 Holdover Time Guidelines for Neat Fluid, Above 0°C and 0°C to -3°C,
Light Freezing Rain
SAE Oct Max K-ABC-S C-1957 H-1957 C-S4 Ultra+ S-480 C-2001 C-2012 S-404
1996-97 Test Results and Table Values Used in 1997-98
0:35-0:55 0:40-1:15 1:00-1:25 0:40-0:55
0:35-1:00
1997-98 Endurance Time Test Results
0:35-1:00 1:20-2:00 0:40-1:00
0:50-1:10 0:40-1:00 0:45-1:20
1998-99 HOT Table Values 0:35-0:55 0:35-1:00 1:00-1:25 0:40-1:00
0:35-1:00 0:50-1:10 0:40-1:00 0:45-1:20
1998-99 Endurance Time Test Results 0:30-0:50 1:20-2:00 0:30-0:45
0:25-0:40
1999-2000 HOT Table Values
0:25-0:40 0:30-0:50 1:00-1:25 0:30-0:45
0:25-0:40 0:50-1:10 0:40-1:00
1999-2000 Endurance Time Test Results
0:50-1:05 0:35-0:55
HIS
TO
RIC
AL
2000-01 HOT Table Values
0:25-0:40 0:30-0:50 1:00-1:25 0:30-0:45 0:50-1:05 0:35-0:55 0:40-1:00
2000-01 Endurance Time Test Results
1:10-1:30
0:25-0:45
CU
RREN
T
2001-02 HOT Table Values
0:25-0:40 0:35-1:00 1:00-1:25 0:30-0:45 0:50-1:05 0:25-0:40 0:35-0:55 0:40-1:00 0:25-0:45

139I:\Groups\CM1680(exBM3833)\Analysis\HOT\type IV\HOT Summary ZR1
At: Neat ZR -3°C
FIGURE 4.17EFFECT OF FLUID BRAND AND RATE OF PRECIPITATION ON ENDURANCE TIME
TYPE IV (NEAT)LIGHT FREEZING RAIN AT -3oC
0
10
20
30
40
50
60
70
80
90
100
110
120
0 5 10 15 20 25 30
Rate of Precipitation (g/dm²/h)
Failu
re T
ime
(min
utes
)
CLARIANT 2012
OCTAGON MAX-FLIGHT
CLARIANT 2012
OCTAGON MAX-FLIGHT
Current Generic HOT (0 to -3°C)
# of Tests = 8

4. HOLDOVER TIME TABLES, RESULTS, AND DISCUSSIONS
X:\@APS ARCHIVE\CM1680 (exBM3833) TC-Deicing 00-01 (REPORTS ONLY)\Reports\HOT\Final Version 1.0\Final Version 1.0.doc Final Version 1.0
August 05APS AVIATION INC.
140
4.2.4.1.2 75/25 fluid, above 0°C and 0ºC to -3°C, light freezing rain (Figure 4.18)
The generic holdover times in these two cells have remained unchanged and are now based on the results of tests conducted with Clariant 2012 in 2000-01.
TABLE 4.18 Holdover Time Guidelines for 75/25 Fluid, Above 0°C and 0°C to -3°C,
Light Freezing Rain
SAE Oct Max K-ABC-S C-1957 H-1957 C-S4
Ultra+ (do not
use) S-480 C-2001 C-2012 S-404
1996-97 Test Results and Table Values Used in 1997-98
0:15-0:30 0:50-1:15 0:35-0:50 0:25-0:40
0:15-0:30
1997-98 Endurance Time Test Results
0:35-1:10 0:40-0:55 0:30-0:40
0:35-0:50 0:25-0:35 0:30-0:50
1998-99 HOT Table Values
0:15-0:30 0:35-1:10 0:35-0:50 0:30-0:40
0:35-0:50 0:25-0:35 0:30-0:50
1998-99 Endurance Time Test Results
0:20-0:40 0:35-0:50 0:25-0:40
1999-2000 HOT Table Values
0:15-0:30 0:20-0:40 0:35-0:50 0:25-0:40
0:35-0:50 0:25-0:35
1999-2000 Endurance Time Test Results
0:30-0:45 0:30-0:45
HIS
TO
RIC
AL
2000-01 HOT Table Values 0:15-0:30 0:20-0:40 0:35-0:50 0:25-0:40 0:30-0:45 0:30-0:45 0:25-0:35
2000-01 Endurance Time Test Results
1:00-1:20
0:15-0:30
CU
RREN
T
2001-02 HOT Table Values
0:15-0:30 0:35-1:10 0:35-0:50 0:25-0:40 0:30-0:45 0:30-0:45 0:25-0:35 0:15-0:30

141I:\Groups\CM1680(exBM3833)\Analysis\HOT\type IV\HOT Summary ZR1
At: 75-25 ZR-3°C
FIGURE 4.18EFFECT OF FLUID BRAND AND RATE OF PRECIPITATION ON ENDURANCE TIME
TYPE IV (75/25)LIGHT FREEZING RAIN AT -3oC
0
10
20
30
40
50
60
70
80
90
100
110
120
0 5 10 15 20 25 30
Rate of Precipitation (g/dm²/h)
Failu
re T
ime
(min
utes
)
CLARIANT 2012
OCTAGON MAX-FLIGHT
CLARIANT 2012
OCTAGON MAX-FLIGHT
Current Generic HOT (0 to -3°C)
# of Tests = 11

4. HOLDOVER TIME TABLES, RESULTS, AND DISCUSSIONS
X:\@APS ARCHIVE\CM1680 (exBM3833) TC-Deicing 00-01 (REPORTS ONLY)\Reports\HOT\Final Version 1.0\Final Version 1.0.doc Final Version 1.0
August 05APS AVIATION INC.
142
4.2.4.1.3 50/50 fluid, above 0°C and 0ºC to -3°C, light freezing rain (Figure 4.19)
The generic values have not changed in these two cells. Four different fluids are responsible for the generic values in this cell: Kilfrost ABC-S, Clariant MPIV 1957, SPCA AD-480, and Clariant Safewing MPIV Protect 2012. In 1998-99, holdover time results below 10 minutes were rounded down to the nearest whole “5” value as a precautionary measure. As a result, the lower holdover time limit for Clariant 2001 was rounded down to 5 minutes.
TABLE 4.19 Holdover Time Guidelines for 50/50 Fluid, Above 0°C and 0°C to -3°C,
Light Freezing Rain
SAE Oct Max K-ABC-S C-1957 H-1957 C-S4 Ultra+ (do not
use) S-480 C-2001 C-2012 S-404
1996-97 Test Results and Table Values Used in 1997-98
0:05-0:10 0:30-0:55 0:10-0:15 0:15-0:20
0:05-0:10
1997-98 Endurance Time Test Results 0:05-0:10 0:15-0:30 0:10-0:15 0:10-0:15
0:10-0:25 0:10-0:15 0:15-0:35
1998-99 HOT Table Values
0:05-0:10 0:15-0:30 0:10-0:15 0:10-0:15
0:10-0:25 0:10-0:15 0:15-0:35
1998-99 Endurance Time Test Results
0:05-0:10 0:05-0:15 0:05-0:10 0:05-0:15
1999-2000 HOT Table Values 0:05-0:10 0:05-0:15 0:05-0:10 0:05-0:15
0:10-0:25 0:05-0:15
1999-2000 Endurance Time Test Results
0:10-0:15 0:05-0:15
HIS
TO
RIC
AL
2000-01 HOT Table Values
0:05-0:10 0:05-0:15 0:05-0:10 0:05-0:15 0:10-0:15 0:05-0:15 0:05-0:15
2000-01 Endurance Time Test Results
0:25-0:35
0:05-0:10
CU
RREN
T
2001-02 HOT Table Values 0:05-0:10 0:15-0:30 0:05-0:10 0:05-0:15 0:10-0:15 0:05-0:15 0:05-0:15 0:05-0:10
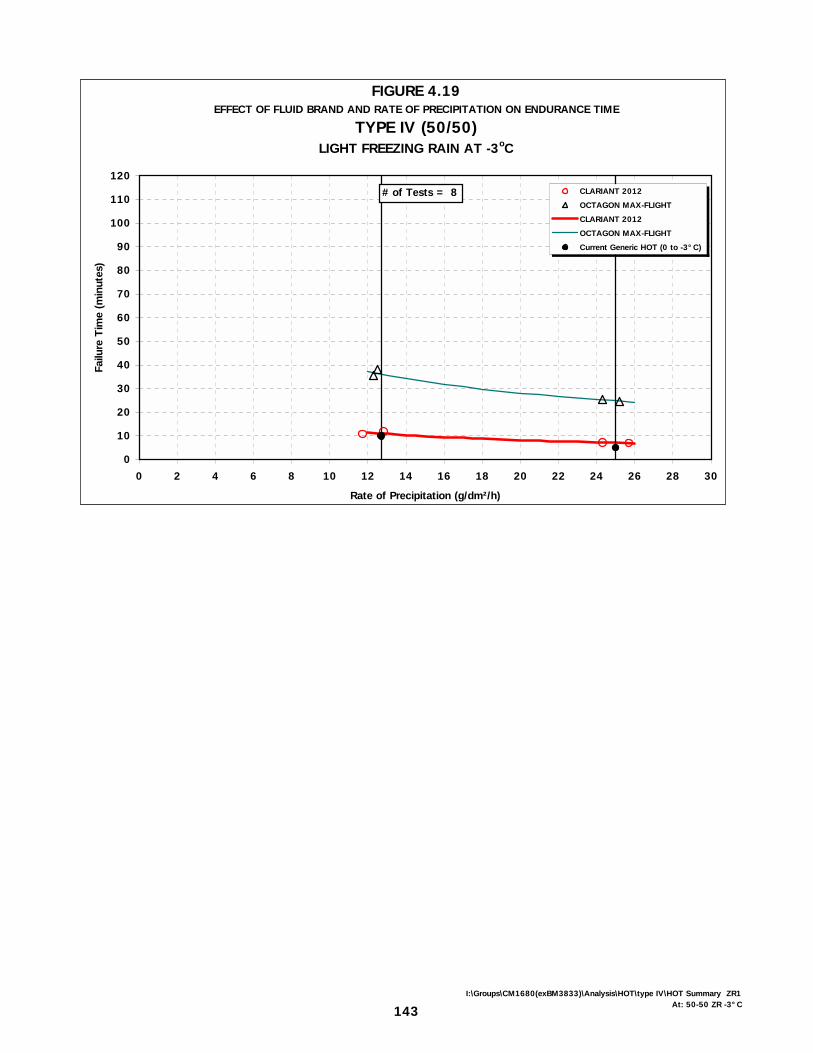
143I:\Groups\CM1680(exBM3833)\Analysis\HOT\type IV\HOT Summary ZR1
At: 50-50 ZR -3°C
FIGURE 4.19EFFECT OF FLUID BRAND AND RATE OF PRECIPITATION ON ENDURANCE TIME
TYPE IV (50/50)LIGHT FREEZING RAIN AT -3oC
0
10
20
30
40
50
60
70
80
90
100
110
120
0 2 4 6 8 10 12 14 16 18 20 22 24 26 28 30
Rate of Precipitation (g/dm²/h)
Failu
re T
ime
(min
utes
)
CLARIANT 2012
OCTAGON MAX-FLIGHT
CLARIANT 2012
OCTAGON MAX-FLIGHT
Current Generic HOT (0 to -3°C)
# of Tests = 8

4. HOLDOVER TIME TABLES, RESULTS, AND DISCUSSIONS
X:\@APS ARCHIVE\CM1680 (exBM3833) TC-Deicing 00-01 (REPORTS ONLY)\Reports\HOT\Final Version 1.0\Final Version 1.0.doc Final Version 1.0
August 05APS AVIATION INC.
144
4.2.4.1.4 Neat fluid, -3° C to -10°C, light freezing rain (Figure 4.20)
The upper generic holdover time for neat fluid in this temperature range and precipitation type has been reduced based on the results of testing with Clariant 2012 in 2000-01. The lower generic value remains unchanged.
TABLE 4.20 Holdover Time Guidelines for Neat Fluid, -3°C to -10°C, Light Freezing Rain
SAE Oct Max K-ABC-S C-1957 H-1957 C-S4 Ultra+ S-480 C-2001 C-2012 S-404
1996-97 Test Results and Table Values Used in 1997-98
0:30-0:45 0:30-0:55 0:30-0:45 0:30-0:50
0:30-0:50
1997-98 Endurance Time Test Results
0:20-0:40 0:20-0:40 0:30-0:45
0:20-0:40 0:30-0:45 0:35-1:20
1998-99 HOT Table Values 0:15-0:30 0:20-0:40 0:20-0:40 0:30-0:45
0:30-0:50 0:20-0:40 0:30-0:45 0:35-1:20
1998-99 Endurance Time Test Results
0:15-0:40 0:10-0:30 0:20-0:35
0:30-0:45
1999-2000 HOT Table Values
0:10-0:30 0:15-0:40 0:10-0:30 0:20-0:35
0:30-0:45 0:20-0:40 0:30-0:45
1999-2000 Endurance Time Test Results
0:15-0:30 0:15-0:30
HIS
TO
RIC
AL
2000-01 HOT Table Values
0:10-0:30 0:15-0:40 0:10-0:30 0:20-0:35 0:15-0:30 0:30-0:45 0:15-0:30 0:30-0:45
2000-01 Endurance Time Test Results
0:20-0:40
0:15-0:25
CU
RREN
T
2001-02 HOT Table Values
0:10-0:25 0:20-0:40 0:10-0:30 0:20-0:35 0:15-0:30 0:30-0:45 0:15-0:30 0:30-0:45 0:15-0:25

145I:\Groups\CM1680(exBM3833)\Analysis\HOT\type IV\HOT Summary ZR1
At: Neat ZR -10ºC
FIGURE 4.20EFFECT OF FLUID BRAND AND RATE OF PRECIPITATION ON ENDURANCE TIME
TYPE IV (NEAT)LIGHT FREEZING RAIN AT -10oC
0
10
20
30
40
50
60
70
80
90
100
110
120
0 2 4 6 8 10 12 14 16 18 20 22 24 26 28 30
Rate of Precipitation (g/dm²/h)
Failu
re T
ime
(min
utes
)
CLARIANT 2012
OCTAGON MAX-FLIGHT
CLARIANT 2012
OCTAGON MAX-FLIGHT
# of Tests = 10

4. HOLDOVER TIME TABLES, RESULTS, AND DISCUSSIONS
X:\@APS ARCHIVE\CM1680 (exBM3833) TC-Deicing 00-01 (REPORTS ONLY)\Reports\HOT\Final Version 1.0\Final Version 1.0.doc Final Version 1.0
August 05APS AVIATION INC.
146
4.2.4.1.5 75/25 fluid, -3°C to -10°C, light freezing rain (Figure 4.21) The upper generic holdover time in this cell has been reduced by 5 minutes, based on the results of Clariant 2012 testing in 2000-01. The same fluid, along with one fluid tested in 1998-99 (Kilfrost ABC-S) exhibits holdover time performance equal to that of the lower generic value.
TABLE 4.21 Holdover Time Guidelines for 75/25 Fluid, -3°C to -10°C, Light Freezing Rain
SAE Oct Max K-ABC-S C-1957 H-1957 C-S4
Ultra+ (do not
use) S-480 C-2001 C-2012 S-404
1996-97 Test Results and Table Values Used in 1997-98
0:15-0:30 0:25-0:35 0:35-0:50 0:25-0:40
0:15-0:30
1997-98 Endurance Time Test Results
0:20-0:30 0:25-0:35
0:25-0:35
0:20-0:35 0:20-0:30 0:30-0:45
1998-99 HOT Table Values 0:15-0:30 0:20-0:30 0:25-0:35
0:25-0:35
0:20-0:35 0:20-0:30 0:30-0:45
1998-99 Endurance Time Test Results 0:15-0:30 0:10-0:35 0:15-0:30
1999-2000 HOT Table Values
0:10-0:30 0:15-0:30 0:10-0:35 0:15-0:30
0:20-0:35 0:20-0:30
1999-2000 Endurance Time Test Results
0:15-0:25 0:15-0:30
HIS
TO
RIC
AL
2000-01 HOT Table Values
0:10-0:25 0:15-0:30 0:10-0:35 0:15-0:30 0:15-0:25 0:15-0:30 0:20-0:30
2000-01 Endurance Time Test Results
0:15-0:30
0:10-0:20
CU
RREN
T
2001-02 HOT Table Values
0:10-0:20 0:15-0:30 0:10-0:35 0:15-0:30 0:15-0:25 0:15-0:30 0:20-0:30 0:10-0:20
4.2.4.2 Overall perspective on light freezing rain results Two changes have been made to the light freezing rain column of the generic Type IV holdover time table. The upper holdover time limits in the -3°C to -10°C cells for Neat and 75/25 fluids have been reduced by five minutes.
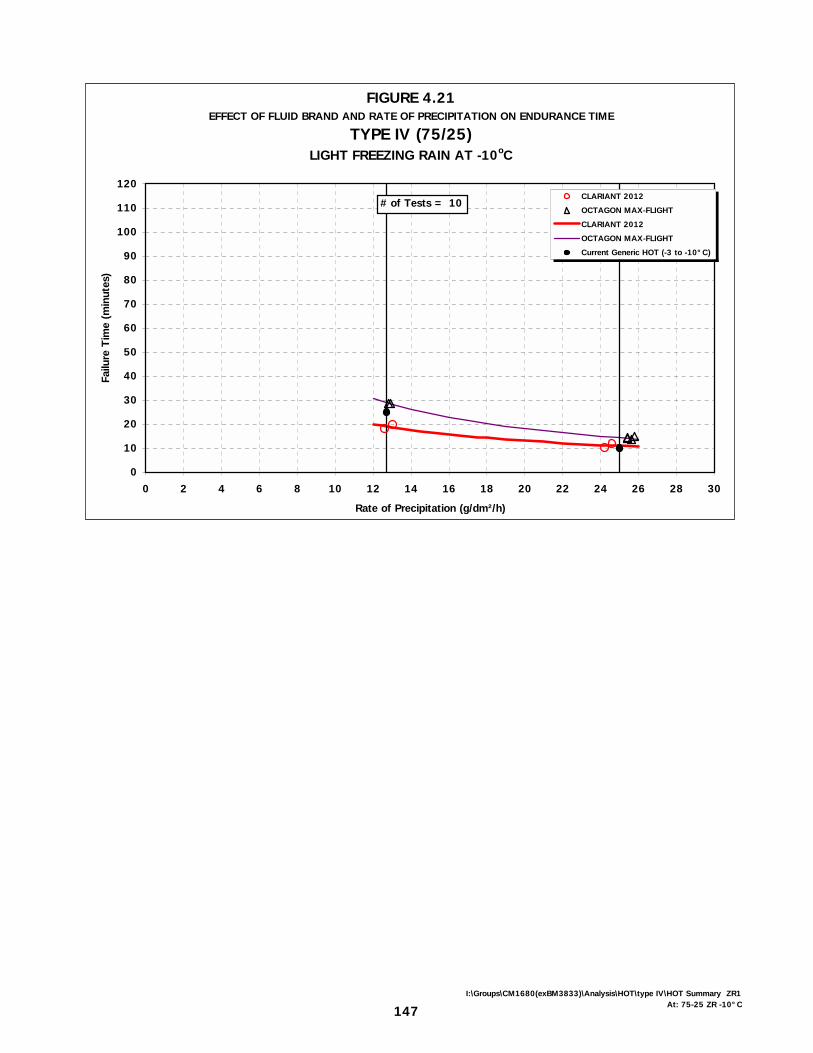
147I:\Groups\CM1680(exBM3833)\Analysis\HOT\type IV\HOT Summary ZR1
At: 75-25 ZR -10°C
FIGURE 4.21EFFECT OF FLUID BRAND AND RATE OF PRECIPITATION ON ENDURANCE TIME
TYPE IV (75/25)LIGHT FREEZING RAIN AT -10oC
0
10
20
30
40
50
60
70
80
90
100
110
120
0 2 4 6 8 10 12 14 16 18 20 22 24 26 28 30
Rate of Precipitation (g/dm²/h)
Failu
re T
ime
(min
utes
)
CLARIANT 2012
OCTAGON MAX-FLIGHT
CLARIANT 2012
OCTAGON MAX-FLIGHT
Current Generic HOT (-3 to -10°C)
# of Tests = 10

4. HOLDOVER TIME TABLES, RESULTS, AND DISCUSSIONS
X:\@APS ARCHIVE\CM1680 (exBM3833) TC-Deicing 00-01 (REPORTS ONLY)\Reports\HOT\Final Version 1.0\Final Version 1.0.doc Final Version 1.0
August 05APS AVIATION INC.
148
4.2.5 Freezing Fog The freezing fog holdover time data originated from tests conducted by APS at the NRC test facility in Ottawa. The freezing fog category is divided into nine cells. The data were collected under precipitation rates of 2 and 5 g/dm2/h. From these data, lower holdover times for each cell were determined at 5 g/dm2/h. In 1997-98, the upper holdover times were to be determined by tests conducted at 2 g/dm2/h; however, the general consensus among attendees at a conference in Vienna in May 1998 was that this rate limit was not indicative of low-rate natural fog. As a result, the upper holdover times in each of the fog cells were left untouched for use in 1998-99 winter operations. The lower rate limit of 2 g/dm2/h was re-established as the lower precipitation rate limit for freezing fog prior to 1998-99 testing. Failure times were measured at three different temperatures: -3°C, -14°C, and -25°C. Due to the inability to produce freezing fog at temperatures above 0°C, holdover times for the temperature range above 0°C are identical to those in the range from 0 to -3°C.
4.2.5.1 Changes to Type IV fluid holdover times for freezing fog In previous years, fluid-specific values were not adopted by the SAE G-12 Holdover Time Subcommittee for this category of precipitation. It was decided at the Toronto SAE meeting in May 1999 that fluid-specific holdover times for fog would be adopted for the first time for use in 1999-2000 winter operations. These holdover times were based on the results of tests conducted during 1998-99 only, since this was the first year that tests were conducted at both rate limits.
The fluid failure time versus precipitation rate data have been plotted either as a function of temperature or as a function of fluid brand (Appendix G). The latter plot format lends itself more easily to the cell-by-cell presentation of results for each category of precipitation and accompanies discussions regarding changes to holdover times. These plots appear in the body of the text as Figures 4.22 to 4.27. The fluid-specific results of Type IV fluid testing from 1996-97 and 1997-98 in freezing fog conditions are not presented in this section, because fluid-specific values in the freezing fog columns only became available during the 1998-99 test season. The first horizontal row of values in each of the following tables contains the generic holdover time values used in 1997-98. The second line in each table does not contain any information, because fluid-specific values were not available. The third line contains the generic holdover time values that were

4. HOLDOVER TIME TABLES, RESULTS, AND DISCUSSIONS
X:\@APS ARCHIVE\CM1680 (exBM3833) TC-Deicing 00-01 (REPORTS ONLY)\Reports\HOT\Final Version 1.0\Final Version 1.0.doc Final Version 1.0
August 05APS AVIATION INC.
149
used in winter operations in 1998-99. The fourth set of values is the endurance time test results from 1998-99 testing. The fifth row in each table contains the generic and fluid-specific holdover time values accepted for use in 1999-2000 winter operations. The sixth row contains the endurance time results from 1999-2000 testing. The seventh presents the generic and fluid-specific holdover time results accepted for use in winter operations in 2000-01. The eighth row contains the endurance time test results from 2000-01 testing. The ninth and final row in each of the tables contains the generic and fluid-specific holdover times accepted for use in 2001-02 winter operations. The underlined holdover time values in the tables indicate the fluids responsible for the generic holdover time.

4. HOLDOVER TIME TABLES, RESULTS, AND DISCUSSIONS
X:\@APS ARCHIVE\CM1680 (exBM3833) TC-Deicing 00-01 (REPORTS ONLY)\Reports\HOT\Final Version 1.0\Final Version 1.0.doc Final Version 1.0
August 05APS AVIATION INC.
150
4.2.5.1.1 Neat fluid, above 0°C and 0°C to -3°C, freezing fog (Figure 4.22) The upper and lower generic holdover time limits have remained unchanged from last year, and are based on 1998-99 test results using the Clariant MPIV 1957 fluid. A wide variation exists in the holdover performances of the various fluids in this condition. The upper fluid-specific values for Kilfrost and Octagon fluids have been capped at four hours.
The Clariant MPIV 2001 and SPCA AD-480 products were originally tested as part of the 1997-98 test season. However, since these fluids were not re-tested in 1998-99, both fluids were assigned generic numbers in the freezing fog columns of their fluid-specific tables for 1999-2000 winter operations. Both fluids were tested again in freezing fog in 1999-2000. The fluid-specific values for both fluids have increased from the generic values as a result of this testing.
TABLE 4.22 Holdover Time Guidelines for Neat Fluid, Above 0°C and 0°C to -3°C,
Freezing Fog
SAE Oct Max K-ABC-S C-1957 H-1957 C-S4 Ultra+ S-480 C-2001 C-2012 S-404
1996-97 Test Results and Table Values Used in 1997-98
2:20-3:00
1997-98 Endurance Time Test Results
1998-99 HOT Table Values 2:00-3:00
1998-99 Endurance Time Test Results
2:15-4:00 2:35-4:00 1:05-2:15
1:35-3:35
1999-2000 HOT Table Values
1:05-2:15 2:15-4:00 2:35-4:00 1:05-2:15
1:35-3:35 1:05-2:15 1:05-2:15
1999-2000 Endurance Time Test Results
1:50-2:45 2:00-3:30
1:20-3:20
HIS
TO
RIC
AL
2000-01 HOT Table Values
1:05-2:15 2:15-4:00 2:35-4:00 1:05-2:15 1:50-2:45 1:35-3:35 2:00-3:30 1:20-3:20
2000-01 Endurance Time Test Results
2:40-4:00
1:15-2:30
CU
RREN
T
2001-02 HOT Table Values
1:05-2:15 2:40-4:00 2:35-4:00 1:05-2:15 1:50-2:45 1:35-3:35 2:00-3:30 1:20-3:20 1:15-2:30
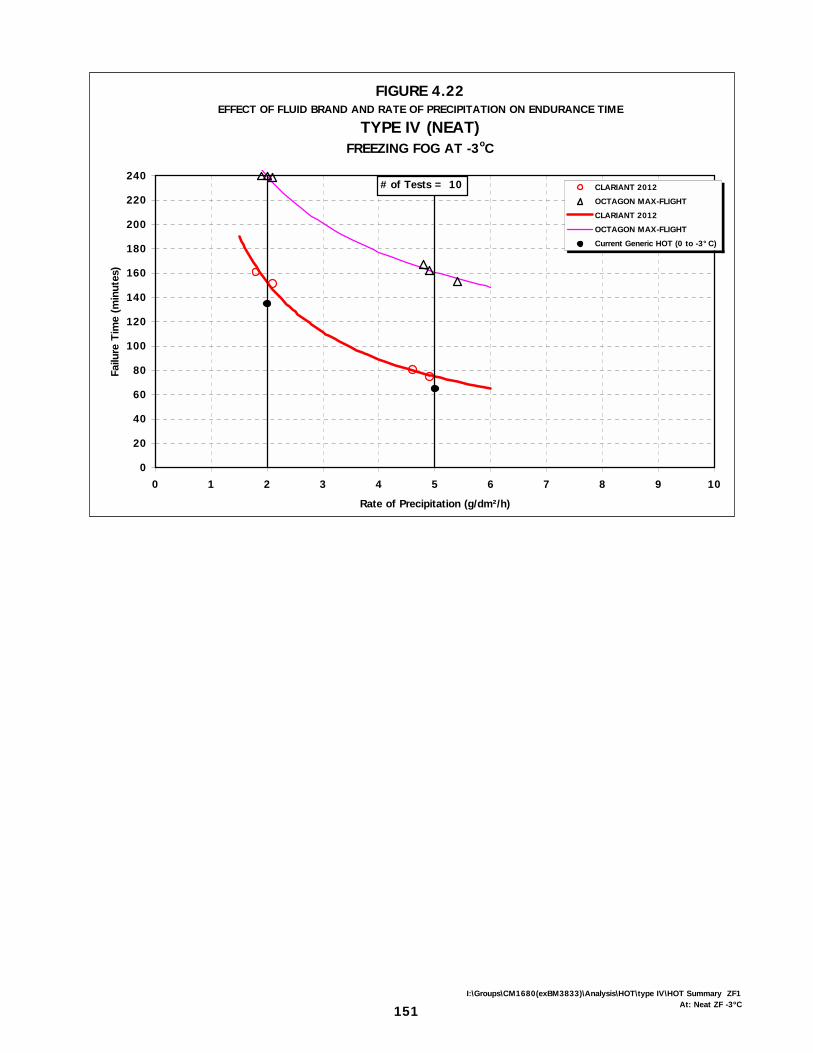
151I:\Groups\CM1680(exBM3833)\Analysis\HOT\type IV\HOT Summary ZF1
At: Neat ZF -3ºC
FIGURE 4.22EFFECT OF FLUID BRAND AND RATE OF PRECIPITATION ON ENDURANCE TIME
TYPE IV (NEAT)FREEZING FOG AT -3oC
0
20
40
60
80
100
120
140
160
180
200
220
240
0 1 2 3 4 5 6 7 8 9 10
Rate of Precipitation (g/dm²/h)
Failu
re T
ime
(min
utes
)
CLARIANT 2012
OCTAGON MAX-FLIGHT
CLARIANT 2012
OCTAGON MAX-FLIGHT
Current Generic HOT (0 to -3°C)
# of Tests = 10

4. HOLDOVER TIME TABLES, RESULTS, AND DISCUSSIONS
X:\@APS ARCHIVE\CM1680 (exBM3833) TC-Deicing 00-01 (REPORTS ONLY)\Reports\HOT\Final Version 1.0\Final Version 1.0.doc Final Version 1.0
August 05APS AVIATION INC.
152
4.2.5.1.2 75/25 fluid, above 0°C and 0ºC to -3°C, freezing fog (Figure 4.23) The upper and lower SAE holdover times for fluids in these cells are based on the result of endurance time tests conducted using one fluid during 1998-99 testing. Because the SPCA AD-480 and Clariant MPIV 2001 fluid-specific values in the 1999-2000 tables were generic, the values for both fluids were increased for the subsequent operational season to match the results of tests conducted in the 1999-2000 test season.
TABLE 4.23 Holdover Time Guidelines for 75/25 Fluid, Above 0°C and 0°C to -3°C,
Freezing Fog
SAE Oct Max K-ABC-S C-1957 H-1957 C-S4 Ultra+ (do not
use) S-480 C-2001 C-2012 S-404
1996-97 Test Results and Table Values Used in 1997-98
1:05-2:00
1997-98 Endurance Time Test Results
1998-99 HOT Table Values
1:05-2:00
1998-99 Endurance Time Test Results
1:30-2:50 1:05-1:45 1:10-2:10
1999-2000 HOT Table Values
1:05-1:45 1:30-2:50 1:05-1:45 1:10-2:10
1:05-1:45 1:05-1:45
1999-2000 Endurance Time Test Results
1:45-2:25 1:30-2:45
1:20-2:00
HIS
TO
RIC
AL
2000-01 HOT Table Values
1:05-1:45 1:30-2:50 1:05-1:45 1:10-2:10 1:45-2:25 1:30-2:45 1:20-2:00
2000-01 Endurance Time Test Results
2:05-3:15
1:10-2:05
CU
RREN
T
2001-02 HOT Table Values
1:05-1:45 2:05-3:15 1:05-1:45 1:10-2:10 1:45-2:25 1:30-2:45 1:20-2:00 1:10-2:05

153I:\Groups\CM1680(exBM3833)\Analysis\HOT\type IV\HOT Summary ZF1
At: 75-25
FIGURE 4.23EFFECT OF FLUID BRAND AND RATE OF PRECIPITATION ON ENDURANCE TIME
TYPE IV (75/25)FREEZING FOG AT -3oC
0
20
40
60
80
100
120
140
160
180
200
220
240
0 1 2 3 4 5 6 7 8 9 10
Rate of Precipitation (g/dm²/h)
Failu
re T
ime
(min
utes
)
CLARIANT 2012
OCTAGON MAX-FLIGHT
CLARIANT 2012
OCTAGON MAX-FLIGHT
Current Generic HOT (0 to -3°C)
# of Tests = 11
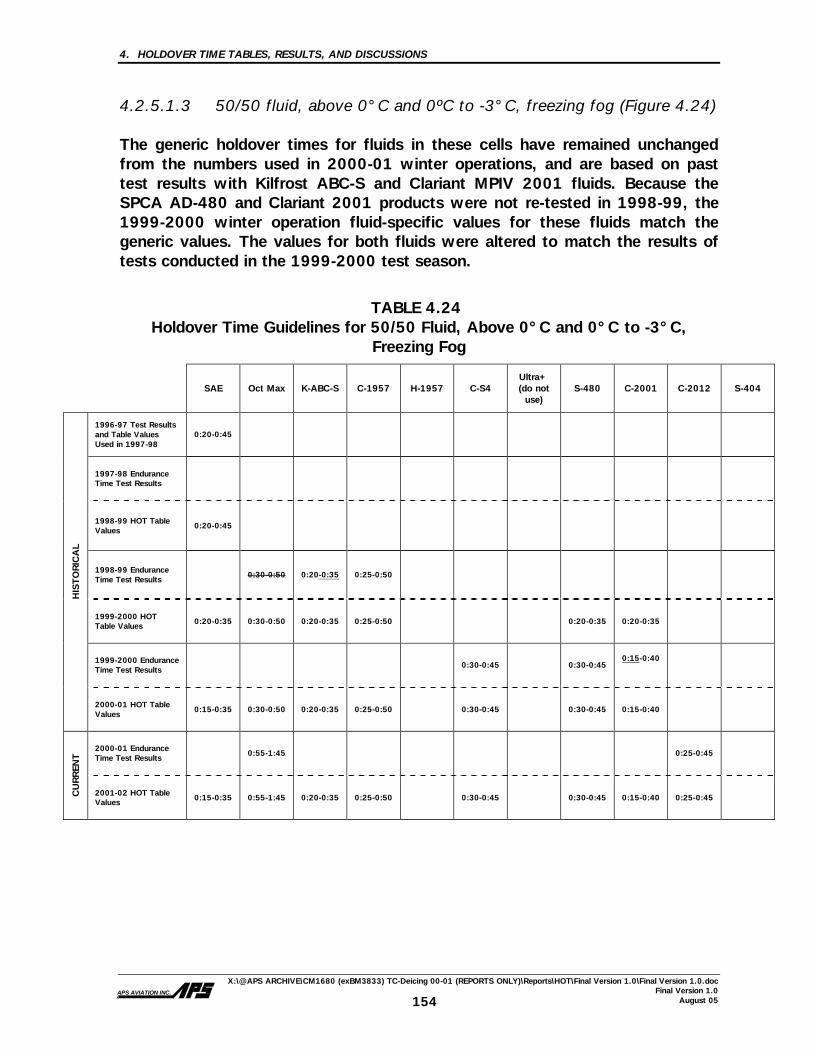
4. HOLDOVER TIME TABLES, RESULTS, AND DISCUSSIONS
X:\@APS ARCHIVE\CM1680 (exBM3833) TC-Deicing 00-01 (REPORTS ONLY)\Reports\HOT\Final Version 1.0\Final Version 1.0.doc Final Version 1.0
August 05APS AVIATION INC.
154
4.2.5.1.3 50/50 fluid, above 0°C and 0ºC to -3°C, freezing fog (Figure 4.24) The generic holdover times for fluids in these cells have remained unchanged from the numbers used in 2000-01 winter operations, and are based on past test results with Kilfrost ABC-S and Clariant MPIV 2001 fluids. Because the SPCA AD-480 and Clariant 2001 products were not re-tested in 1998-99, the 1999-2000 winter operation fluid-specific values for these fluids match the generic values. The values for both fluids were altered to match the results of tests conducted in the 1999-2000 test season.
TABLE 4.24 Holdover Time Guidelines for 50/50 Fluid, Above 0°C and 0°C to -3°C,
Freezing Fog
SAE Oct Max K-ABC-S C-1957 H-1957 C-S4 Ultra+ (do not
use) S-480 C-2001 C-2012 S-404
1996-97 Test Results and Table Values Used in 1997-98
0:20-0:45
1997-98 Endurance Time Test Results
1998-99 HOT Table Values
0:20-0:45
1998-99 Endurance Time Test Results
0:30-0:50 0:20-0:35 0:25-0:50
1999-2000 HOT Table Values 0:20-0:35 0:30-0:50 0:20-0:35 0:25-0:50
0:20-0:35 0:20-0:35
1999-2000 Endurance Time Test Results
0:30-0:45 0:30-0:45
0:15-0:40
HIS
TO
RIC
AL
2000-01 HOT Table Values
0:15-0:35 0:30-0:50 0:20-0:35 0:25-0:50 0:30-0:45 0:30-0:45 0:15-0:40
2000-01 Endurance Time Test Results
0:55-1:45
0:25-0:45
CU
RREN
T
2001-02 HOT Table Values 0:15-0:35 0:55-1:45 0:20-0:35 0:25-0:50 0:30-0:45 0:30-0:45 0:15-0:40 0:25-0:45

155I:\Groups\CM1680(exBM3833)\Analysis\HOT\type IV\HOT Summary ZF1
At: 50-50
FIGURE 4.24EFFECT OF FLUID BRAND AND RATE OF PRECIPITATION ON ENDURANCE TIME
TYPE IV (50/50)FREEZING FOG AT -3oC
0
20
40
60
80
100
120
140
160
180
200
220
240
0 1 2 3 4 5 6 7 8 9 10
Rate of Precipitation (g/dm²/h)
Failu
re T
ime
(min
utes
)
CLARIANT 2012
OCTAGON MAX-FLIGHT
CLARIANT 2012
OCTAGON MAX-FLIGHT
Current Generic HOT (0 to -3°C)
# of Tests = 8
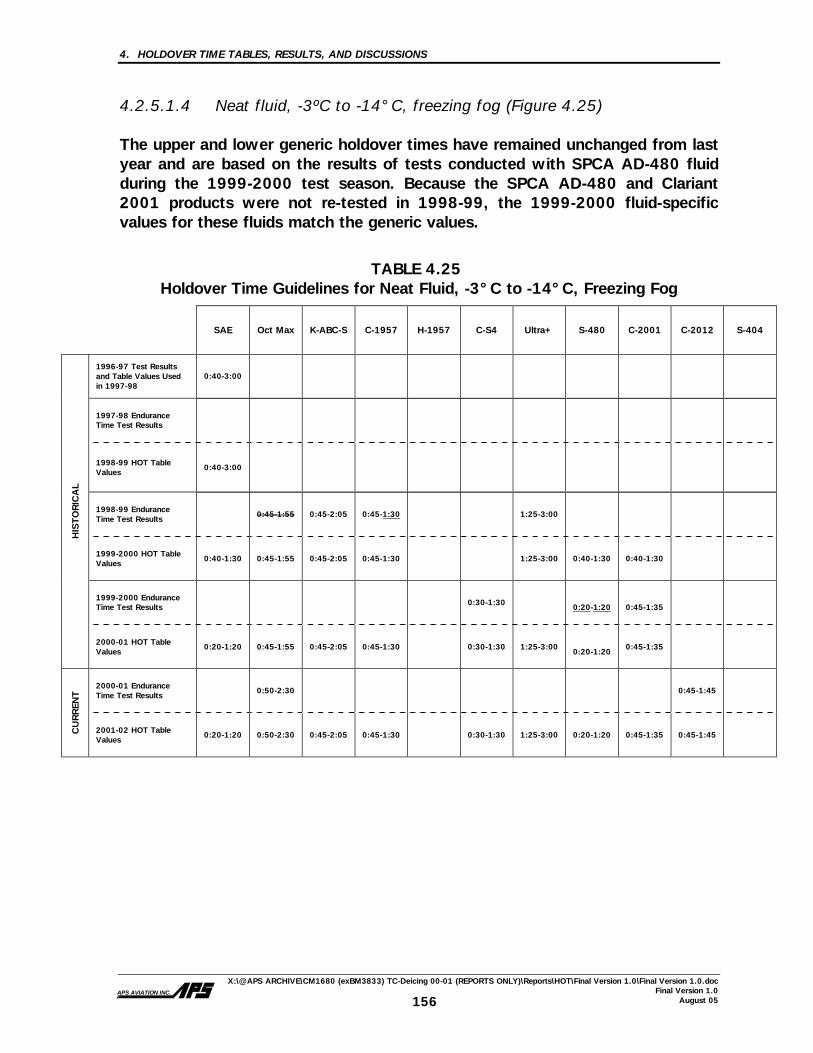
4. HOLDOVER TIME TABLES, RESULTS, AND DISCUSSIONS
X:\@APS ARCHIVE\CM1680 (exBM3833) TC-Deicing 00-01 (REPORTS ONLY)\Reports\HOT\Final Version 1.0\Final Version 1.0.doc Final Version 1.0
August 05APS AVIATION INC.
156
4.2.5.1.4 Neat fluid, -3ºC to -14°C, freezing fog (Figure 4.25) The upper and lower generic holdover times have remained unchanged from last year and are based on the results of tests conducted with SPCA AD-480 fluid during the 1999-2000 test season. Because the SPCA AD-480 and Clariant 2001 products were not re-tested in 1998-99, the 1999-2000 fluid-specific values for these fluids match the generic values.
TABLE 4.25 Holdover Time Guidelines for Neat Fluid, -3°C to -14°C, Freezing Fog
SAE Oct Max K-ABC-S C-1957 H-1957 C-S4 Ultra+ S-480 C-2001 C-2012 S-404
1996-97 Test Results and Table Values Used in 1997-98
0:40-3:00
1997-98 Endurance Time Test Results
1998-99 HOT Table Values
0:40-3:00
1998-99 Endurance Time Test Results
0:45-1:55 0:45-2:05 0:45-1:30
1:25-3:00
1999-2000 HOT Table Values
0:40-1:30 0:45-1:55 0:45-2:05 0:45-1:30
1:25-3:00 0:40-1:30 0:40-1:30
1999-2000 Endurance Time Test Results 0:30-1:30
0:20-1:20
0:45-1:35
HIS
TO
RIC
AL
2000-01 HOT Table Values
0:20-1:20 0:45-1:55 0:45-2:05 0:45-1:30 0:30-1:30 1:25-3:00 0:20-1:20
0:45-1:35
2000-01 Endurance Time Test Results
0:50-2:30
0:45-1:45
CU
RREN
T
2001-02 HOT Table Values
0:20-1:20 0:50-2:30 0:45-2:05 0:45-1:30 0:30-1:30 1:25-3:00 0:20-1:20 0:45-1:35 0:45-1:45

157I:\Groups\CM1680(exBM3833)\Analysis\HOT\type IV\HOT Summary ZF1
At: Neat ZF -14ºC
FIGURE 4.25EFFECT OF FLUID BRAND AND RATE OF PRECIPITATION ON ENDURANCE TIME
TYPE IV (NEAT)FREEZING FOG AT -14oC
0
20
40
60
80
100
120
140
160
180
200
220
240
0 1 2 3 4 5 6 7
Rate of Precipitation (g/dm²/h)
Failu
re T
ime
(min
utes
)
CLARIANT 2012
OCTAGON MAX-FLIGHT
CLARIANT 2012
OCTAGON MAX-FLIGHT
Current Generic HOT (-3 to -14°C)
# of Tests = 8

4. HOLDOVER TIME TABLES, RESULTS, AND DISCUSSIONS
X:\@APS ARCHIVE\CM1680 (exBM3833) TC-Deicing 00-01 (REPORTS ONLY)\Reports\HOT\Final Version 1.0\Final Version 1.0.doc Final Version 1.0
August 05APS AVIATION INC.
158
4.2.5.1.5 75/25 fluid, -3ºC to -14°C, freezing fog (Figure 4.26) The generic holdover times in this cell have not been modified based on the most recent testing with Type IV fluids. All fluids display similar holdover time performance in this cell of the holdover time table. Because the SPCA AD-480 and Clariant 2001 products were not re-tested in 1998-99, the 1999-2000 fluid-specific values for these fluids match the generic values.
TABLE 4.26 Holdover Time Guidelines for 75/25 Fluid, -3°C to -14°C, Freezing Fog
SAE Oct
Max K-ABC-
S C-1957 H-1957 C-S4
Ultra+ (do not
use) S-480 C-2001 C-2012 S-404
1996-97 Test Results and Table Values Used in 1997-98
0:35-2:00
1997-98 Endurance Time Test Results
1998-99 HOT Table Values
0:30-2:00
1998-99 Endurance Time Test Results
0:30-1:10
0:25-1:00
0:25-1:10
1999-2000 HOT Table Values
0:25-1:00 0:30-1:10
0:25-1:00
0:25-1:10
0:25-1:00
0:25-1:00
1999-2000 Endurance Time Test Results
0:30-1:05
0:25-0:50
0:30-1:00
HIS
TO
RIC
AL
2000-01 HOT Table Values
0:25-0:50 0:30-1:10
0:25-1:00
0:25-1:10
0:30-1:05
0:25-0:50
0:30-1:00
2000-01 Endurance Time Test Results 030-1:05
0:25-1:05
CU
RREN
T
2001-02 HOT Table Values
0:25-0:50 030-1:05 0:25-1:00
0:25-1:10
0:30-1:05
0:25-0:50
0:30-1:00
0:25-1:05
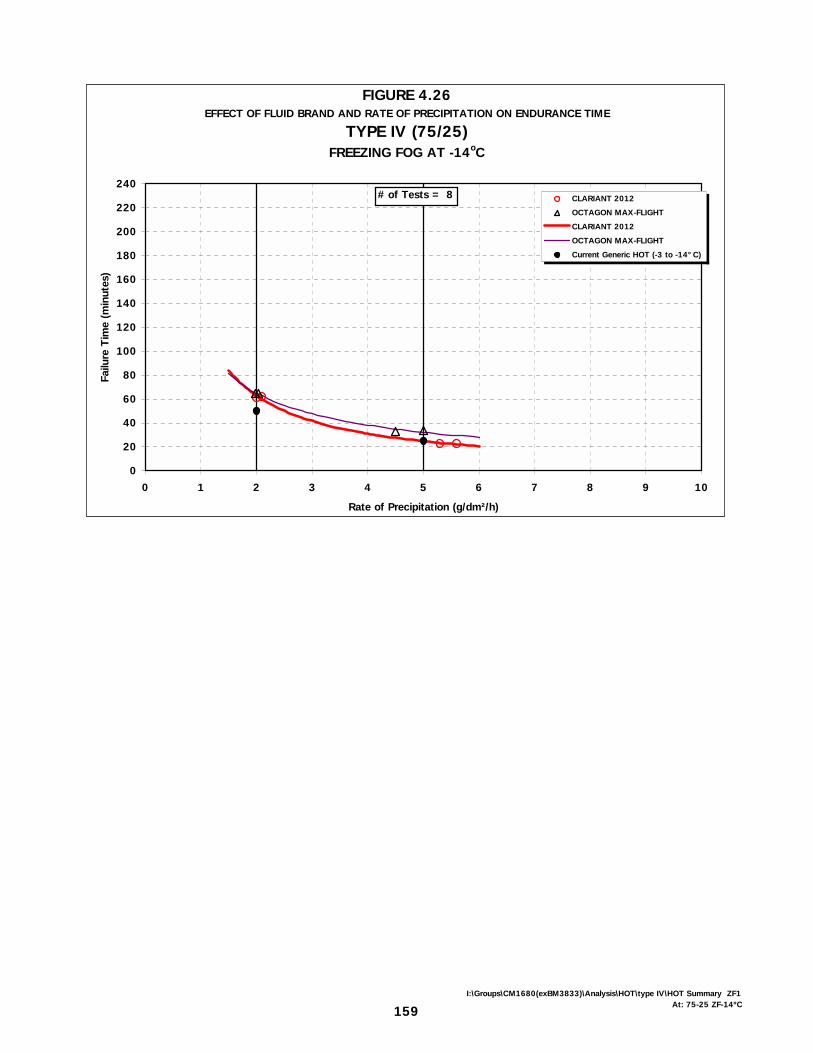
159I:\Groups\CM1680(exBM3833)\Analysis\HOT\type IV\HOT Summary ZF1
At: 75-25 ZF-14ºC
FIGURE 4.26EFFECT OF FLUID BRAND AND RATE OF PRECIPITATION ON ENDURANCE TIME
TYPE IV (75/25)FREEZING FOG AT -14oC
0
20
40
60
80
100
120
140
160
180
200
220
240
0 1 2 3 4 5 6 7 8 9 10
Rate of Precipitation (g/dm²/h)
Failu
re T
ime
(min
utes
)
CLARIANT 2012
OCTAGON MAX-FLIGHT
CLARIANT 2012
OCTAGON MAX-FLIGHT
Current Generic HOT (-3 to -14°C)
# of Tests = 8
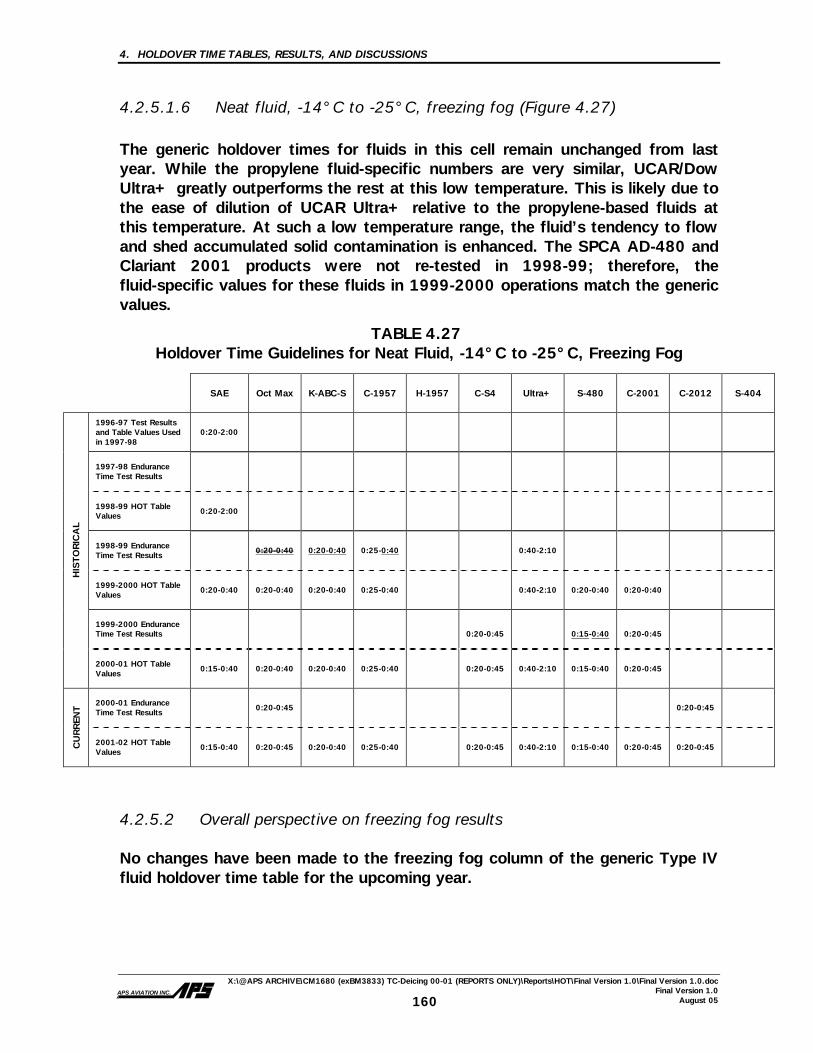
4. HOLDOVER TIME TABLES, RESULTS, AND DISCUSSIONS
X:\@APS ARCHIVE\CM1680 (exBM3833) TC-Deicing 00-01 (REPORTS ONLY)\Reports\HOT\Final Version 1.0\Final Version 1.0.doc Final Version 1.0
August 05APS AVIATION INC.
160
4.2.5.1.6 Neat fluid, -14°C to -25°C, freezing fog (Figure 4.27)
The generic holdover times for fluids in this cell remain unchanged from last year. While the propylene fluid-specific numbers are very similar, UCAR/Dow Ultra+ greatly outperforms the rest at this low temperature. This is likely due to the ease of dilution of UCAR Ultra+ relative to the propylene-based fluids at this temperature. At such a low temperature range, the fluid’s tendency to flow and shed accumulated solid contamination is enhanced. The SPCA AD-480 and Clariant 2001 products were not re-tested in 1998-99; therefore, the fluid-specific values for these fluids in 1999-2000 operations match the generic values.
TABLE 4.27 Holdover Time Guidelines for Neat Fluid, -14°C to -25°C, Freezing Fog
SAE Oct Max K-ABC-S C-1957 H-1957 C-S4 Ultra+ S-480 C-2001 C-2012 S-404
1996-97 Test Results and Table Values Used in 1997-98
0:20-2:00
1997-98 Endurance Time Test Results
1998-99 HOT Table Values 0:20-2:00
1998-99 Endurance Time Test Results
0:20-0:40 0:20-0:40 0:25-0:40
0:40-2:10
1999-2000 HOT Table Values
0:20-0:40 0:20-0:40 0:20-0:40 0:25-0:40
0:40-2:10 0:20-0:40 0:20-0:40
1999-2000 Endurance Time Test Results
0:20-0:45 0:15-0:40
0:20-0:45
HIS
TO
RIC
AL
2000-01 HOT Table Values
0:15-0:40 0:20-0:40 0:20-0:40 0:25-0:40 0:20-0:45 0:40-2:10 0:15-0:40 0:20-0:45
2000-01 Endurance Time Test Results
0:20-0:45
0:20-0:45
CU
RREN
T
2001-02 HOT Table Values
0:15-0:40 0:20-0:45 0:20-0:40 0:25-0:40 0:20-0:45 0:40-2:10 0:15-0:40 0:20-0:45 0:20-0:45
4.2.5.2 Overall perspective on freezing fog results No changes have been made to the freezing fog column of the generic Type IV fluid holdover time table for the upcoming year.
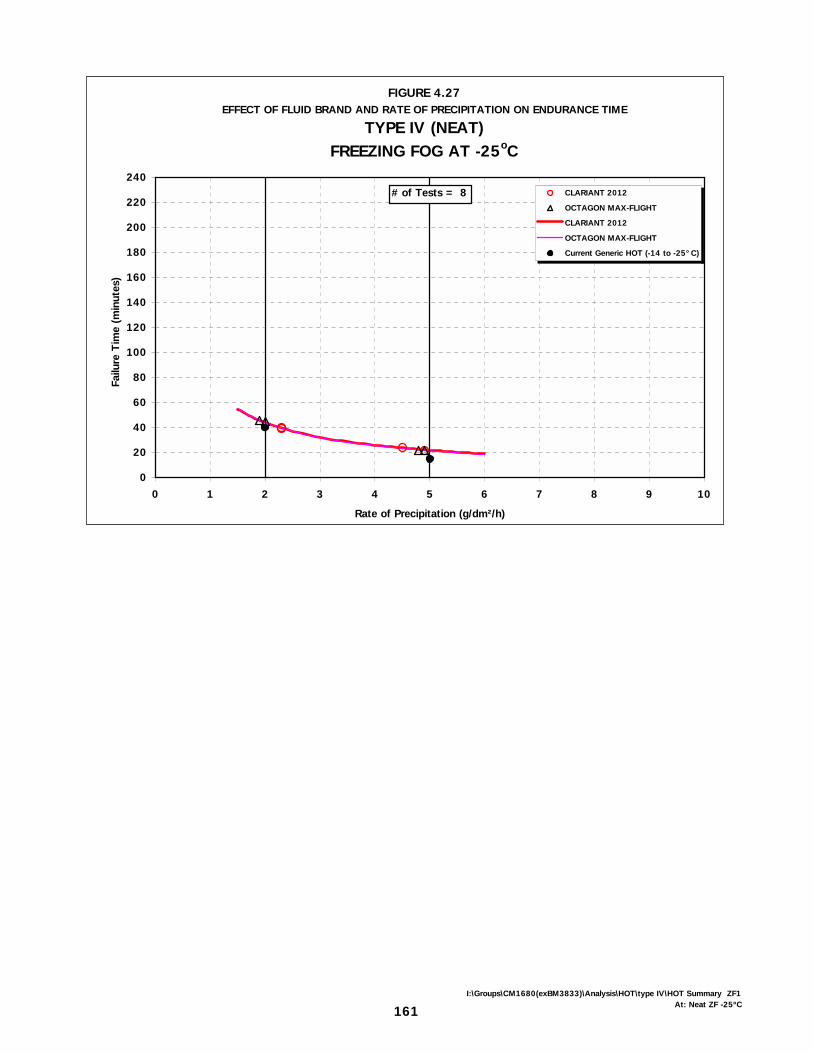
161I:\Groups\CM1680(exBM3833)\Analysis\HOT\type IV\HOT Summary ZF1
At: Neat ZF -25ºC
FIGURE 4.27EFFECT OF FLUID BRAND AND RATE OF PRECIPITATION ON ENDURANCE TIME
TYPE IV (NEAT)FREEZING FOG AT -25oC
0
20
40
60
80
100
120
140
160
180
200
220
240
0 1 2 3 4 5 6 7 8 9 10
Rate of Precipitation (g/dm²/h)
Failu
re T
ime
(min
utes
)
CLARIANT 2012
OCTAGON MAX-FLIGHT
CLARIANT 2012
OCTAGON MAX-FLIGHT
Current Generic HOT (-14 to -25°C)
# of Tests = 8

4. HOLDOVER TIME TABLES, RESULTS, AND DISCUSSIONS
X:\@APS ARCHIVE\CM1680 (exBM3833) TC-Deicing 00-01 (REPORTS ONLY)\Reports\HOT\Final Version 1.0\Final Version 1.0.doc Final Version 1.0
August 05APS AVIATION INC.
162
4.2.6 Rain on a Cold-Soaked Wing The rain on a cold-soaked wing endurance time data originated from tests conducted by APS at the NRC test facility in Ottawa. The data used to evaluate the holdover times for this category of precipitation covered precipitation rates ranging from 5 g/dm2/h to 76 g/dm2/h. This encompasses heavy drizzle (5 to 12.7 g/dm2/h), light rain (12.7 to 25 g/dm2/h), and moderate rain (25 to 76 g/dm2/h). The cold-soak boxes used for testing were 7.5 cm deep. Dimensional details are described in Section 2. The box temperature prior to the start of testing was -10°C. The data are plotted for two Type IV fluid concentrations: neat fluid and 75/25 fluid.
4.2.6.1 Changes to Type IV fluid holdover times for rain on a cold-soaked wing Fluid-specific values were not adopted by the SAE G-12 Holdover Time Subcommittee in previous years for this category of precipitation. It was decided at the Toronto SAE meeting in May 1999 that fluid-specific holdover time guidelines for rain on a cold-soaked wing would be adopted for use for the first time in 1999-2000 winter operations, if this information was available. The fluid failure time versus precipitation rate data have been plotted either as a function of temperature or as a function of fluid brand (Appendix G). The latter plot format lends itself more easily to the cell-by-cell presentation of results for each category of precipitation and accompanies discussions regarding changes to holdover times. These plots appear in the body of the text as Figures 4.28 and 4.29. The fluid-specific results of Type IV fluid testing from 1996-97 in rain on a cold-soaked wing are not presented in this section. Results from testing in subsequent seasons are presented in the same format as for freezing fog, explained in Subsection 4.2.5.1.

4. HOLDOVER TIME TABLES, RESULTS, AND DISCUSSIONS
X:\@APS ARCHIVE\CM1680 (exBM3833) TC-Deicing 00-01 (REPORTS ONLY)\Reports\HOT\Final Version 1.0\Final Version 1.0.doc Final Version 1.0
August 05APS AVIATION INC.
163
4.2.6.1.1 Neat fluid, above 0°C, rain on a cold-soaked wing (Figure 4.28) Although the holdover times in this cell remain unchanged from 2000-01 table values, one fluid tested during the past year, Clariant Safewing MPIV Protect 2012, displayed a holdover time performance equal to that of the lower generic holdover time. The upper generic holdover time is based on the results of past testing. Because the SPCA AD-480 and Clariant 2001 products were not re-tested in 1998-99, the 1999-2000 fluid-specific values for these fluids match the generic values.
TABLE 4.28 Holdover Time Guidelines for Neat Fluid, Above 0°C, Rain on a Cold-Soaked
Wing (ROCSW)
SAE Oct Max K-ABC-S C-1957 H-1957 C-S4 Ultra+ S-480 C-2001 C-2012 S-404
1996-97 Test Results and Table Values Used in 1997-98
0:10-0:50
1997-98 Endurance Time Test Results 0:15-1:15 0:20-1:15 0:15-1:20
1998-99 HOT Table Values
0:10-0:50
1998-99 Endurance Time Test Results
0:10-2:00 0:30-2:00 0:15-1:10
0:10-1:20
1999-2000 HOT Table Values
0:10-0:50 0:10-1:15 0:20-1:15 0:15-1:10
0:10-1:20 0:10-0:50 0:10-0:50
1999-2000 Endurance Test Results
0:10-1:20 0:15-1:35
0:15-2:00
HIS
OTRIC
AL
2000-01 HOT Table Values 0:10-0:50 0:10-1:15 0:20-1:15 0:15-1:10 0:10-1:20 0:10-1:20 0:15-1:35 0:15-2:00
2000-01 Endurance Time Test Results
0:20-2:00
0:10-1:05
CU
RREN
T
2001-02 HOT Table Values
0:10-0:50 0:15-1:15 0:20-1:15 0:15-1:10 0:10-1:20 0:10-1:20 0:15-1:35 0:15-2:00 0:10-1:05
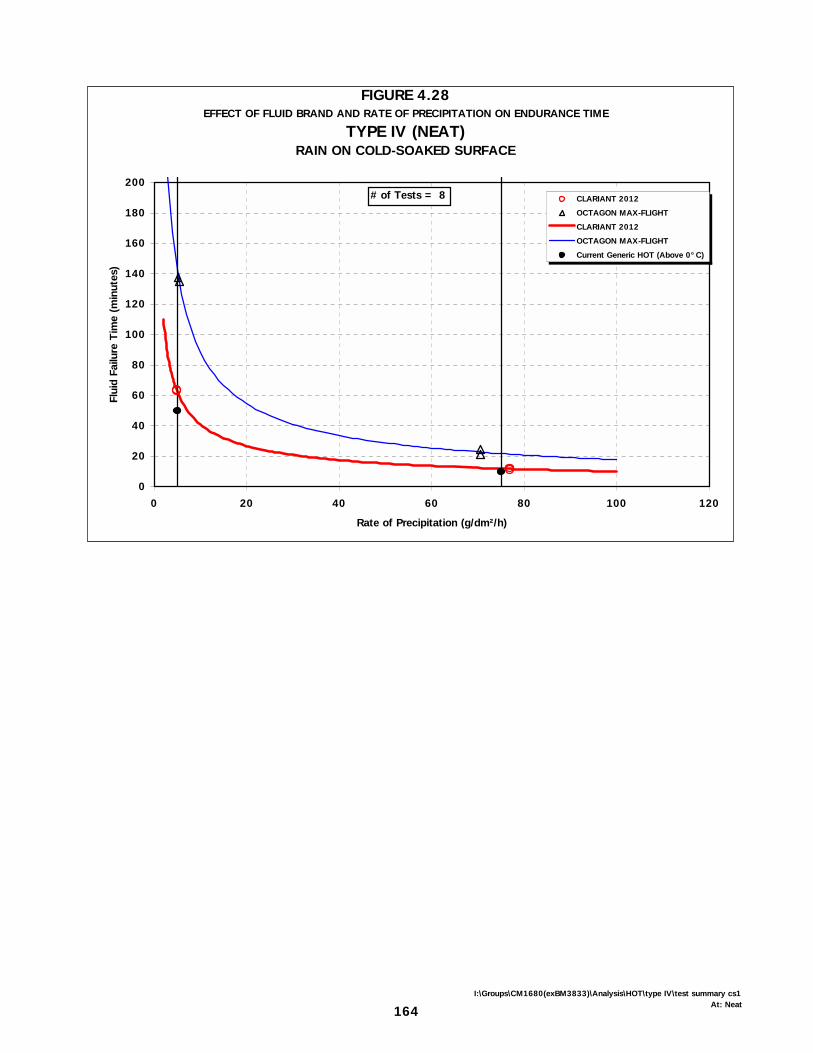
164I:\Groups\CM1680(exBM3833)\Analysis\HOT\type IV\test summary cs1
At: Neat
FIGURE 4.28EFFECT OF FLUID BRAND AND RATE OF PRECIPITATION ON ENDURANCE TIME
TYPE IV (NEAT)RAIN ON COLD-SOAKED SURFACE
0
20
40
60
80
100
120
140
160
180
200
0 20 40 60 80 100 120
Rate of Precipitation (g/dm²/h)
Flui
d Fa
ilure
Tim
e (m
inut
es)
CLARIANT 2012
OCTAGON MAX-FLIGHT
CLARIANT 2012
OCTAGON MAX-FLIGHT
Current Generic HOT (Above 0°C)
# of Tests = 8
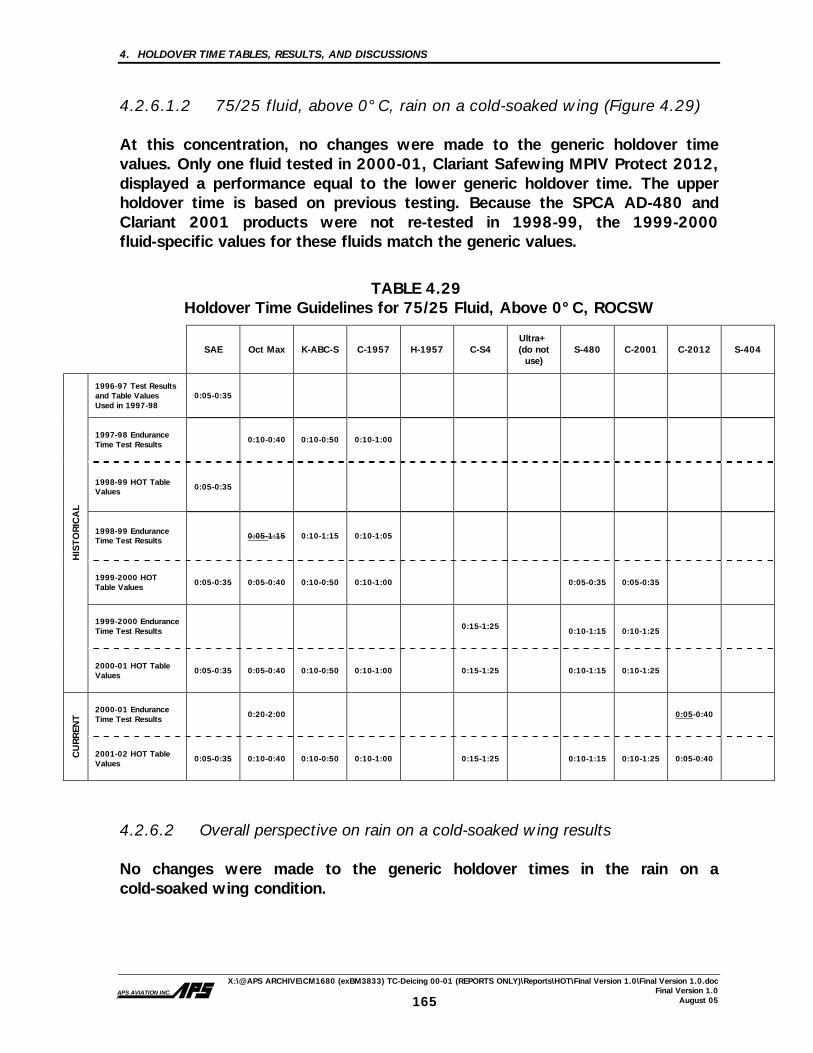
4. HOLDOVER TIME TABLES, RESULTS, AND DISCUSSIONS
X:\@APS ARCHIVE\CM1680 (exBM3833) TC-Deicing 00-01 (REPORTS ONLY)\Reports\HOT\Final Version 1.0\Final Version 1.0.doc Final Version 1.0
August 05APS AVIATION INC.
165
4.2.6.1.2 75/25 fluid, above 0°C, rain on a cold-soaked wing (Figure 4.29) At this concentration, no changes were made to the generic holdover time values. Only one fluid tested in 2000-01, Clariant Safewing MPIV Protect 2012, displayed a performance equal to the lower generic holdover time. The upper holdover time is based on previous testing. Because the SPCA AD-480 and Clariant 2001 products were not re-tested in 1998-99, the 1999-2000 fluid-specific values for these fluids match the generic values.
TABLE 4.29 Holdover Time Guidelines for 75/25 Fluid, Above 0°C, ROCSW
SAE Oct Max K-ABC-S C-1957 H-1957 C-S4
Ultra+ (do not
use) S-480 C-2001 C-2012 S-404
1996-97 Test Results and Table Values Used in 1997-98
0:05-0:35
1997-98 Endurance Time Test Results
0:10-0:40 0:10-0:50 0:10-1:00
1998-99 HOT Table Values 0:05-0:35
1998-99 Endurance Time Test Results 0:05-1:15 0:10-1:15 0:10-1:05
1999-2000 HOT Table Values
0:05-0:35 0:05-0:40 0:10-0:50 0:10-1:00
0:05-0:35 0:05-0:35
1999-2000 Endurance Time Test Results
0:15-1:25 0:10-1:15
0:10-1:25
HIS
TO
RIC
AL
2000-01 HOT Table Values
0:05-0:35 0:05-0:40 0:10-0:50 0:10-1:00 0:15-1:25 0:10-1:15 0:10-1:25
2000-01 Endurance Time Test Results
0:20-2:00
0:05-0:40
CU
RREN
T
2001-02 HOT Table Values
0:05-0:35 0:10-0:40 0:10-0:50 0:10-1:00 0:15-1:25 0:10-1:15 0:10-1:25 0:05-0:40
4.2.6.2 Overall perspective on rain on a cold-soaked wing results No changes were made to the generic holdover times in the rain on a cold-soaked wing condition.

166I:\Groups\CM1680(exBM3833)\Analysis\HOT\type IV\test summary cs1
At: 75-25
FIGURE 4.29EFFECT OF FLUID BRAND AND RATE OF PRECIPITATION ON ENDURANCE TIME
TYPE IV (75/25)RAIN ON COLD-SOAKED SURFACE
0
10
20
30
40
50
60
70
80
90
100
110
120
0 10 20 30 40 50 60 70 80 90 100
Rate of Precipitation (g/dm²/h)
Flui
d Fa
ilure
Tim
e (m
inut
es)
CLARIANT 2012
OCTAGON MAX-FLIGHT
CLARIANT 2012
OCTAGON MAX-FLIGHT
Current Generic HOT (Above 0°C)
# of Tests = 9

4. HOLDOVER TIME TABLES, RESULTS, AND DISCUSSIONS
X:\@APS ARCHIVE\CM1680 (exBM3833) TC-Deicing 00-01 (REPORTS ONLY)\Reports\HOT\Final Version 1.0\Final Version 1.0.doc Final Version 1.0
August 05APS AVIATION INC.
167
4.2.7 Frost Testing APS had not conducted holdover time tests in simulated frost conditions prior to the 1999-2000 test season. Preliminary tests in simulated frost conditions were conducted by APS at the IREQ high humidity chamber in Varennes to determine the capabilities of this chamber for future tests in conditions of simulated frost. The results of these tests are presented in Transport Canada report TP 13659E [2]. Additional testing in frost conditions was performed by APS during 2000-01, refer to TP 13831E [3] for these results. 4.2.8 Changes to the Generic Type IV Table Seven reductions have been made to the generic Type IV table based on the results of Type IV fluid tests in 2000-01. Five reductions were made in the freezing drizzle column, and two reductions occur in the light freezing rain category. Obsolete data from tests conducted in 1996-97 were eliminated. Subsequently, eight generic holdover time values were increased, four each in the snow and freezing drizzle columns of the generic Type IV table. 4.2.9 Worst Case Fluids The fluid(s) responsible for the values in each cell of the generic Type IV fluid holdover time table and the year the fluid was tested are shown in Table 4.30.
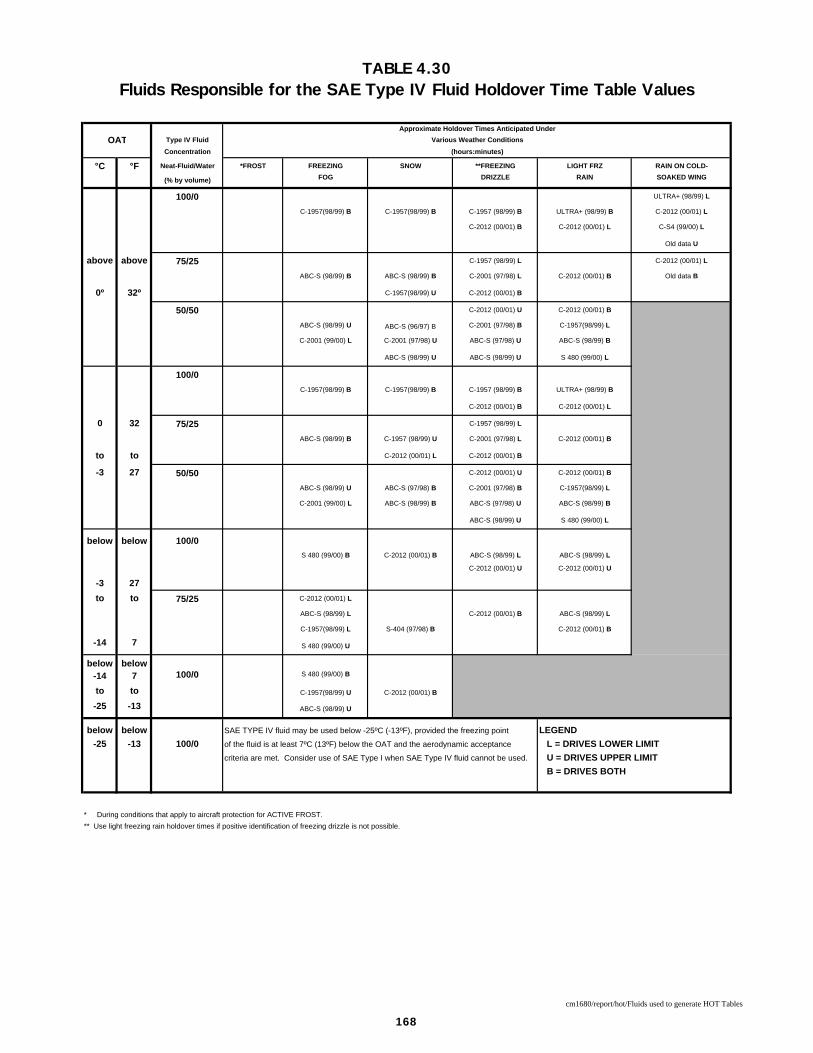
TABLE 4.30Fluids Responsible for the SAE Type IV Fluid Holdover Time Table Values
Approximate Holdover Times Anticipated Under
OAT Type IV Fluid Various Weather ConditionsConcentration (hours:minutes)
°C °F Neat-Fluid/Water *FROST FREEZING SNOW **FREEZING LIGHT FRZ RAIN ON COLD-
(% by volume) FOG DRIZZLE RAIN SOAKED WING
100/0 ULTRA+ (98/99) L
C-1957(98/99) B C-1957(98/99) B C-1957 (98/99) B ULTRA+ (98/99) B C-2012 (00/01) L
C-2012 (00/01) B C-2012 (00/01) L C-S4 (99/00) L
Old data U
above above 75/25 C-1957 (98/99) L C-2012 (00/01) L
ABC-S (98/99) B ABC-S (98/99) B C-2001 (97/98) L C-2012 (00/01) B Old data B
0º 32º C-1957(98/99) U C-2012 (00/01) B
50/50 C-2012 (00/01) U C-2012 (00/01) B
ABC-S (98/99) U ABC-S (96/97) B C-2001 (97/98) B C-1957(98/99) L
C-2001 (99/00) L C-2001 (97/98) U ABC-S (97/98) U ABC-S (98/99) B
ABC-S (98/99) U ABC-S (98/99) U S 480 (99/00) L
100/0C-1957(98/99) B C-1957(98/99) B C-1957 (98/99) B ULTRA+ (98/99) B
C-2012 (00/01) B C-2012 (00/01) L
0 32 75/25 C-1957 (98/99) L
ABC-S (98/99) B C-1957 (98/99) U C-2001 (97/98) L C-2012 (00/01) B
to to C-2012 (00/01) L C-2012 (00/01) B
-3 27 50/50 C-2012 (00/01) U C-2012 (00/01) B
ABC-S (98/99) U ABC-S (97/98) B C-2001 (97/98) B C-1957(98/99) L
C-2001 (99/00) L ABC-S (98/99) B ABC-S (97/98) U ABC-S (98/99) B
ABC-S (98/99) U S 480 (99/00) L
below below 100/0S 480 (99/00) B C-2012 (00/01) B ABC-S (98/99) L ABC-S (98/99) L
C-2012 (00/01) U C-2012 (00/01) U
-3 27to to 75/25 C-2012 (00/01) L
ABC-S (98/99) L C-2012 (00/01) B ABC-S (98/99) L
C-1957(98/99) L S-404 (97/98) B C-2012 (00/01) B
-14 7 S 480 (99/00) U
below below-14 7 100/0 S 480 (99/00) B
to to C-1957(98/99) U C-2012 (00/01) B
-25 -13 ABC-S (98/99) U
below below SAE TYPE IV fluid may be used below -25ºC (-13ºF), provided the freezing point LEGEND-25 -13 100/0 of the fluid is at least 7ºC (13ºF) below the OAT and the aerodynamic acceptance L = DRIVES LOWER LIMIT
criteria are met. Consider use of SAE Type I when SAE Type IV fluid cannot be used. U = DRIVES UPPER LIMIT B = DRIVES BOTH
* During conditions that apply to aircraft protection for ACTIVE FROST.** Use light freezing rain holdover times if positive identification of freezing drizzle is not possible.
168
cm1680/report/hot/Fluids used to generate HOT Tables
4. HOLDOVER TIME TABLES, RESULTS, AND DISCUSSIONS
X:\@APS ARCHIVE\CM1680 (exBM3833) TC-Deicing 00-01 (REPORTS ONLY)\Reports\HOT\Final Version 1.0\Final Version 1.0.doc Final Version 1.0
August 05APS AVIATION INC.
169
4.3 Type II Fluid Holdover Time Tests Type II fluid is a thickened fluid used to provide anti-icing protection to aircraft surfaces following deicing. The Type II fluid holdover time table, substantiated by previous testing and accepted for use in 2000-01, is shown in Table 1.3 (Section 1). A new Type II holdover time table, which was accepted for use in 2001-02 by the SAE G-12 Holdover Time Subcommittee in New Orleans, and the fluid-specific holdover time tables for Kilfrost ABC-II Plus, Clariant MP II 1951, and SPCA Ecowing 26, are shown in Tables 4.64 to 4.67 (Section 4.6). The generic holdover time guidelines for Type II fluid were developed based on the results of endurance time tests conducted during previous years. In addition to these tests, one Type II fluid, Kilfrost ABC-II Plus (formerly Kilfrost ABC-3+), was tested by APS during the 1998-99 test season. At the SAE Holdover Time Subcommittee meetings in Toronto in May 1999, the fluid manufacturer requested a fluid-specific table for this fluid. The request was accepted. Two additional Type II fluids, SPCA AD-260 and Clariant MP II 1951, were tested during the 1999-2000 test season. At the SAE Holdover Time Meeting in Toulouse in May 2000, SPCA informed the committee that the SPCA AD-260 product would not be made commercially available for winter operations in 2000-01. A new Type II fluid from SPCA, Ecowing 26, was tested by APS during the 2000-01 test season. The results are discussed in this section. The SAE G-12 Holdover Time Subcommittee stipulated that the holdover times for any cell in the Type II table may not exceed the holdover times for that same cell in the Type IV fluid table. This is primarily because all Type IV fluids qualify as Type II fluids and are expected to exhibit superior performance to Type II fluids. Type II fluids, on the other hand, do not qualify as Type IV fluids. The imposition of holdover time reductions based on this consideration has been referred to as Type IV fluid holdover time constraint. Due to space limitations, the fluid codes indicated in brackets will be used in the tables: Kilfrost ABC-II Plus (ABC-II+); Clariant MPII 1951 (C-1951); SPCA Ecowing 26 (S E26).
4. HOLDOVER TIME TABLES, RESULTS, AND DISCUSSIONS
X:\@APS ARCHIVE\CM1680 (exBM3833) TC-Deicing 00-01 (REPORTS ONLY)\Reports\HOT\Final Version 1.0\Final Version 1.0.doc Final Version 1.0
August 05APS AVIATION INC.
170
4.3.1 Natural Snow The natural snow endurance time test data for SPCA Ecowing 26 Type II fluid derived from 2000-01 tests conducted at the Dorval Airport test facility.
4.3.1.1 Changes to the Type II fluid holdover times for snow The tables presented in this subsection show columns containing the generic and fluid-specific holdover time results of testing with Type II fluids. The first horizontal row of values contains the generic holdover time values used in 1998-99. The second line contains the endurance time results from 1998-99 testing. The third line contains the generic and fluid-specific holdover time values that were used in winter operations in 1999-2000. The fourth set of values is the endurance time results from 1999-2000 testing. The fifth row contains the generic and fluid-specific holdover time values accepted for use in 2000-01 winter operations. The sixth set of values is the endurance time test results from 2000-01 testing. The seventh and final line contains the generic and fluid-specific holdover time values for use in 2001-02 winter operations. The underlined holdover time values indicate the fluids responsible for the generic holdover time.
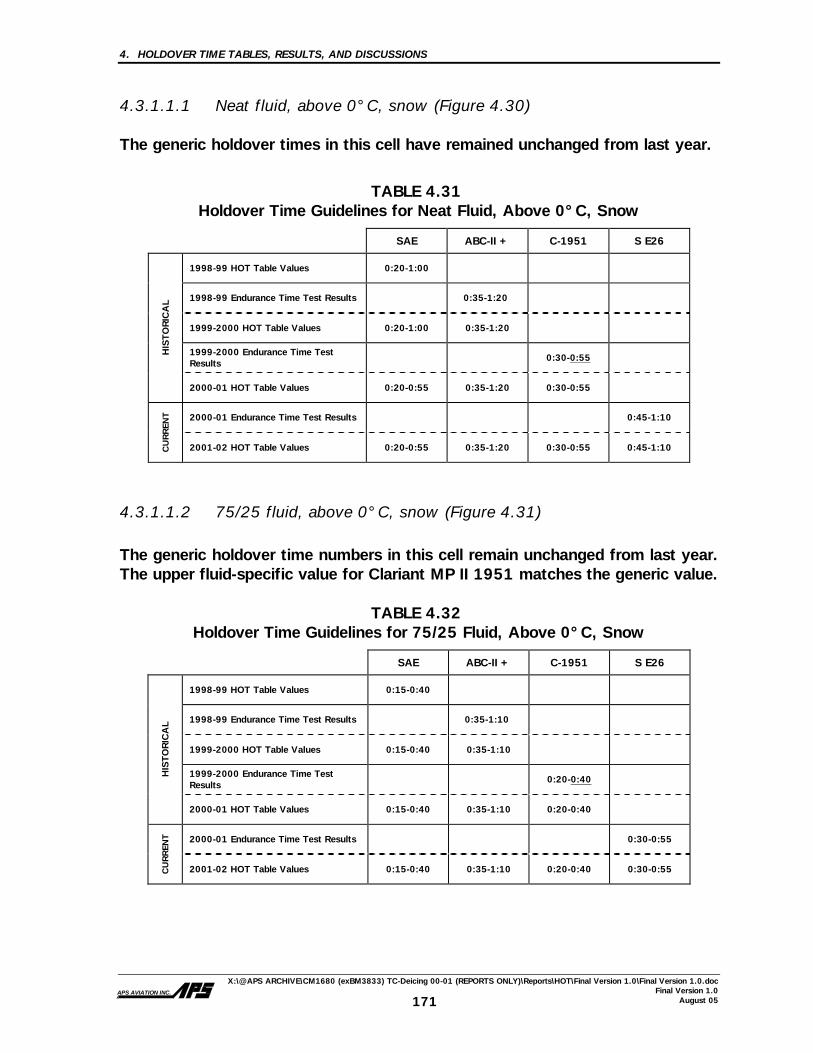
4. HOLDOVER TIME TABLES, RESULTS, AND DISCUSSIONS
X:\@APS ARCHIVE\CM1680 (exBM3833) TC-Deicing 00-01 (REPORTS ONLY)\Reports\HOT\Final Version 1.0\Final Version 1.0.doc Final Version 1.0
August 05APS AVIATION INC.
171
4.3.1.1.1 Neat fluid, above 0°C, snow (Figure 4.30) The generic holdover times in this cell have remained unchanged from last year.
TABLE 4.31 Holdover Time Guidelines for Neat Fluid, Above 0°C, Snow
SAE ABC-II + C-1951 S E26
1998-99 HOT Table Values 0:20-1:00
1998-99 Endurance Time Test Results 0:35-1:20
1999-2000 HOT Table Values 0:20-1:00 0:35-1:20
1999-2000 Endurance Time Test Results
0:30-0:55 HIS
TO
RIC
AL
2000-01 HOT Table Values 0:20-0:55 0:35-1:20 0:30-0:55
2000-01 Endurance Time Test Results 0:45-1:10
CU
RREN
T
2001-02 HOT Table Values 0:20-0:55 0:35-1:20 0:30-0:55 0:45-1:10
4.3.1.1.2 75/25 fluid, above 0°C, snow (Figure 4.31) The generic holdover time numbers in this cell remain unchanged from last year. The upper fluid-specific value for Clariant MP II 1951 matches the generic value.
TABLE 4.32 Holdover Time Guidelines for 75/25 Fluid, Above 0°C, Snow
SAE ABC-II + C-1951 S E26
1998-99 HOT Table Values 0:15-0:40
1998-99 Endurance Time Test Results 0:35-1:10
1999-2000 HOT Table Values 0:15-0:40 0:35-1:10
1999-2000 Endurance Time Test Results
0:20-0:40 HIS
TO
RIC
AL
2000-01 HOT Table Values 0:15-0:40 0:35-1:10 0:20-0:40
2000-01 Endurance Time Test Results 0:30-0:55
CU
RREN
T
2001-02 HOT Table Values 0:15-0:40 0:35-1:10 0:20-0:40 0:30-0:55

FIGURE 4.30EFFECT OF FLUID BRAND AND RATE OF PRECIPITATION ON ENDURANCE TIME
TYPE II NEAT (Above 0°C) NATURAL SNOW
0
10
20
30
40
50
60
70
80
90
100
110
120
0 5 10 15 20 25 30 35 40 45
Rate of Precipitation (g/dm²/h)
Flui
d Fa
ilure
Tim
e (m
inut
es)
SPCA Ecowing 26Current Generic HOT (Above 0°C)
# of Tests = 0
FIGURE 4.31EFFECT OF FLUID BRAND AND RATE OF PRECIPITATION ON ENDURANCE TIME
TYPE II 75/25 (Above 0°C)NATURAL SNOW
0
10
20
30
40
50
60
70
80
90
100
110
120
0 5 10 15 20 25 30 35 40 45
Rate of Precipitation (g/dm²/h)
Flui
d Fa
ilure
Tim
e (m
inut
es)
SPCA Ecowing 26
Current Generic HOT (Above 0°C)
# of Tests = 0
172CM1680(exBM3833)\Analysis\HOT\type II\HOT summary snow
At:fig 4.30-4.31
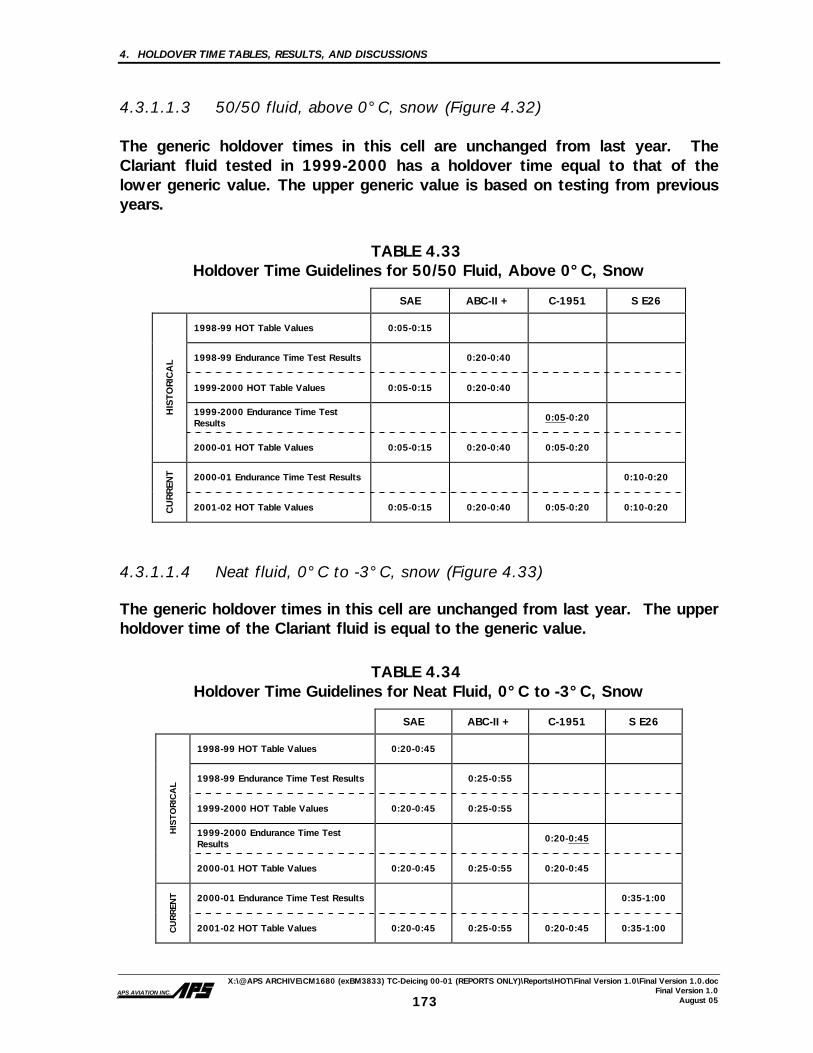
4. HOLDOVER TIME TABLES, RESULTS, AND DISCUSSIONS
X:\@APS ARCHIVE\CM1680 (exBM3833) TC-Deicing 00-01 (REPORTS ONLY)\Reports\HOT\Final Version 1.0\Final Version 1.0.doc Final Version 1.0
August 05APS AVIATION INC.
173
4.3.1.1.3 50/50 fluid, above 0°C, snow (Figure 4.32) The generic holdover times in this cell are unchanged from last year. The Clariant fluid tested in 1999-2000 has a holdover time equal to that of the lower generic value. The upper generic value is based on testing from previous years.
TABLE 4.33 Holdover Time Guidelines for 50/50 Fluid, Above 0°C, Snow
SAE ABC-II + C-1951 S E26
1998-99 HOT Table Values 0:05-0:15
1998-99 Endurance Time Test Results 0:20-0:40
1999-2000 HOT Table Values 0:05-0:15 0:20-0:40
1999-2000 Endurance Time Test Results
0:05-0:20 HIS
TO
RIC
AL
2000-01 HOT Table Values 0:05-0:15 0:20-0:40 0:05-0:20
2000-01 Endurance Time Test Results 0:10-0:20
CU
RREN
T
2001-02 HOT Table Values 0:05-0:15 0:20-0:40 0:05-0:20 0:10-0:20
4.3.1.1.4 Neat fluid, 0°C to -3°C, snow (Figure 4.33) The generic holdover times in this cell are unchanged from last year. The upper holdover time of the Clariant fluid is equal to the generic value.
TABLE 4.34 Holdover Time Guidelines for Neat Fluid, 0°C to -3°C, Snow
SAE ABC-II + C-1951 S E26
1998-99 HOT Table Values 0:20-0:45
1998-99 Endurance Time Test Results 0:25-0:55
1999-2000 HOT Table Values 0:20-0:45 0:25-0:55
1999-2000 Endurance Time Test Results
0:20-0:45
HIS
TO
RIC
AL
2000-01 HOT Table Values 0:20-0:45 0:25-0:55 0:20-0:45
2000-01 Endurance Time Test Results 0:35-1:00
CU
RREN
T
2001-02 HOT Table Values 0:20-0:45 0:25-0:55 0:20-0:45 0:35-1:00

FIGURE 4.32EFFECT OF FLUID BRAND AND RATE OF PRECIPITATION ON ENDURANCE TIME
TYPE II 50/50 (Above 0°C)NATURAL SNOW
0
10
20
30
40
50
60
70
80
90
100
110
120
0 5 10 15 20 25 30 35 40 45Rate of Precipitation (g/dm²/h)
Flui
d Fa
ilure
Tim
e (m
inut
es)
SPCA Ecowing 26SPCA Ecowing 26Current Generic HOT (Above 0°C)
# of Tests = 2
FIGURE 4.33EFFECT OF FLUID BRAND AND RATE OF PRECIPITATION ON ENDURANCE TIME
TYPE II NEAT (0 to -3°C)NATURAL SNOW
0
10
20
30
40
50
60
70
80
90
100
110
120
0 5 10 15 20 25 30 35 40 45Rate of Precipitation (g/dm²/h)
Flui
d Fa
ilure
Tim
e (m
inut
es)
SPCA Ecowing 26
SPCA Ecowing 26
Current Generic HOT (0 to -3°C)# of Tests = 13
174CM1680(exBM3833)\Analysis\HOT\type II\HOT summary snow
At:fig 4.32-4.33
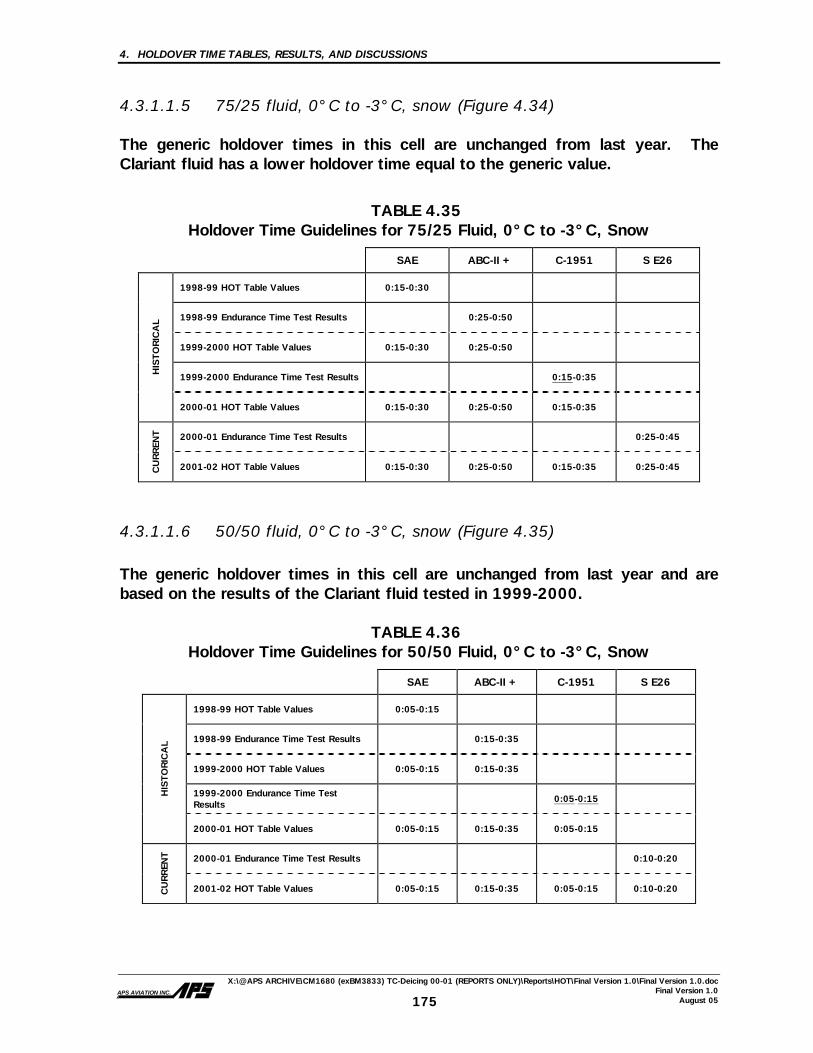
4. HOLDOVER TIME TABLES, RESULTS, AND DISCUSSIONS
X:\@APS ARCHIVE\CM1680 (exBM3833) TC-Deicing 00-01 (REPORTS ONLY)\Reports\HOT\Final Version 1.0\Final Version 1.0.doc Final Version 1.0
August 05APS AVIATION INC.
175
4.3.1.1.5 75/25 fluid, 0°C to -3°C, snow (Figure 4.34) The generic holdover times in this cell are unchanged from last year. The Clariant fluid has a lower holdover time equal to the generic value.
TABLE 4.35 Holdover Time Guidelines for 75/25 Fluid, 0°C to -3°C, Snow
SAE ABC-II + C-1951 S E26
1998-99 HOT Table Values 0:15-0:30
1998-99 Endurance Time Test Results 0:25-0:50
1999-2000 HOT Table Values 0:15-0:30 0:25-0:50
1999-2000 Endurance Time Test Results 0:15-0:35 HIS
TO
RIC
AL
2000-01 HOT Table Values 0:15-0:30 0:25-0:50 0:15-0:35
2000-01 Endurance Time Test Results 0:25-0:45
CU
RREN
T
2001-02 HOT Table Values 0:15-0:30 0:25-0:50 0:15-0:35 0:25-0:45
4.3.1.1.6 50/50 fluid, 0°C to -3°C, snow (Figure 4.35) The generic holdover times in this cell are unchanged from last year and are based on the results of the Clariant fluid tested in 1999-2000.
TABLE 4.36
Holdover Time Guidelines for 50/50 Fluid, 0°C to -3°C, Snow
SAE ABC-II + C-1951 S E26
1998-99 HOT Table Values 0:05-0:15
1998-99 Endurance Time Test Results 0:15-0:35
1999-2000 HOT Table Values 0:05-0:15 0:15-0:35
1999-2000 Endurance Time Test Results
0:05-0:15 HIS
TO
RIC
AL
2000-01 HOT Table Values 0:05-0:15 0:15-0:35 0:05-0:15
2000-01 Endurance Time Test Results 0:10-0:20
CU
RREN
T
2001-02 HOT Table Values 0:05-0:15 0:15-0:35 0:05-0:15 0:10-0:20

FIGURE 4.34EFFECT OF FLUID BRAND AND RATE OF PRECIPITATION ON ENDURANCE TIME
TYPE II 75/25 (0 to -3°C)NATURAL SNOW
0
10
20
30
40
50
60
70
80
90
100
110
120
0 5 10 15 20 25 30 35 40 45Rate of Precipitation (g/dm²/h)
Flui
d Fa
ilure
Tim
e (m
inut
es)
SPCA Ecowing 26
SPCA Ecowing 26
Current Generic HOT (0 to -3°C)
# of Tests = 16
FIGURE 4.35EFFECT OF FLUID BRAND AND RATE OF PRECIPITATION ON ENDURANCE TIME
TYPE II 50/50 (0 to -3°C)NATURAL SNOW
0
10
20
30
40
50
60
70
80
90
100
110
120
0 5 10 15 20 25 30 35 40 45Rate of Precipitation (g/dm²/h)
Flui
d Fa
ilure
Tim
e (m
inut
es)
SPCA Ecowing 26
SPCA Ecowing 26
Current Generic HOT (0 to -3°C)
# of Tests = 25
176CM1680(exBM3833)\Analysis\HOT\type II\HOT summary snow
At:Sheet3

4. HOLDOVER TIME TABLES, RESULTS, AND DISCUSSIONS
X:\@APS ARCHIVE\CM1680 (exBM3833) TC-Deicing 00-01 (REPORTS ONLY)\Reports\HOT\Final Version 1.0\Final Version 1.0.doc Final Version 1.0
August 05APS AVIATION INC.
177
4.3.1.1.7 Neat fluid, -3°C to -14°C, snow (Figure 4.36) The generic values in this cell have remained unchanged.
TABLE 4.37 Holdover Time Guidelines for Neat Fluid, -3°C to -14°C, Snow
SAE ABC-II + C-1951 S E26
1998-99 HOT Table Values 0:15-0:40
1998-99 Endurance Time Test Results 0:15-0:35
1999-2000 HOT Table Values 0:15-0:35 0:15-0:35
1999-2000 Endurance Time Test Results 0:20-0:40
HIS
TO
RIC
AL
2000-01 HOT Table Values 0:15-0:35 0:15-0:35 0:20-0:40
2000-01 Endurance Time Test Results 0:30-0:50
CU
RREN
T
2001-02 HOT Table Values 0:15-0:35 0:15-0:35 0:20-0:40 0:30-0:50
4.3.1.1.8 75/25 fluid, -3°C to -14°C, snow (Figure 4.37)
In the 1999-2000 generic table, the upper generic Type II holdover time in this cell was reduced by five minutes based on Type IV fluid tests. During the 1999-2000 test season, tests conducted with the Clariant fluid provided holdover times equal to the generic values. The generic times have not changed from last year.
TABLE 4.38
Holdover Time Guidelines for 75/25 Fluid, -3°C to -14°C, Snow
SAE ABC-II + C-1951 S E26
1998-99 HOT Table Values 0:15-0:30
1998-99 Endurance Time Test Results 0:15-0:35
1999-2000 HOT Table Values 0:15-0:25 0:15-0:35
1999-2000 Endurance Time Test Results 0:15-0:25 HIS
TO
RIC
AL
2000-01 HOT Table Values 0:15-0:25 0:15-0:35 0:15-0:25
2000-01 Endurance Time Test Results 0:20-0:40
CU
RREN
T
2001-02 HOT Table Values 0:15-0:25 0:15-0:35 0:15-0:25 0:20-0:40

FIGURE 4.36EFFECT OF FLUID BRAND AND RATE OF PRECIPITATION ON ENDURANCE TIME
TYPE II NEAT (-3 to -14°C)NATURAL SNOW
0
10
20
30
40
50
60
70
80
90
100
110
120
0 5 10 15 20 25 30 35 40 45Rate of Precipitation (g/dm²/h)
Flui
d Fa
ilure
Tim
e (m
inut
es)
SPCA Ecowing 26
SPCA Ecowing 26
Current Generic HOT (-3 to -14°C)
# of Tests = 6
FIGURE 4.37EFFECT OF FLUID BRAND AND RATE OF PRECIPITATION ON ENDURANCE TIME
TYPE II 75/25 (-3 to -14°C)NATURAL SNOW
0
10
20
30
40
50
60
70
80
90
100
110
120
0 5 10 15 20 25 30 35 40 45Rate of Precipitation (g/dm²/h)
Flui
d Fa
ilure
Tim
e (m
inut
es)
SPCA Ecowing 26SPCA Ecowing 26Current Generic HOT (-3 to -14°C)
# of Tests = 6
178CM1680(exBM3833)\Analysis\HOT\type II\HOT summary snow
At:fig 4.36-4.37

4. HOLDOVER TIME TABLES, RESULTS, AND DISCUSSIONS
X:\@APS ARCHIVE\CM1680 (exBM3833) TC-Deicing 00-01 (REPORTS ONLY)\Reports\HOT\Final Version 1.0\Final Version 1.0.doc Final Version 1.0
August 05APS AVIATION INC.
179
4.3.1.1.9 Neat fluid, -14°C to -25°C, snow (Figure 4.38) The holdover times in this cell have remained unchanged from last year.
TABLE 4.39 Holdover Time Guidelines for Neat Fluid, -14°C to -25°C, Snow
SAE ABC-II + C-1951 S E26
1998-99 HOT Table Values 0:15-0:30
1998-99 Endurance Time Test Results 0:15-0:30
1999-2000 HOT Table Values 0:15-0:30 0:15-0:30
1999-2000 Endurance Time Test Results 0:20-0:35 HIS
TO
RIC
AL
2000-01 HOT Table Values 0:15-0:30 0:15-0:30 0:20-0:35
2000-01 Endurance Time Test Results 0:30-0:50
CU
RREN
T
2001-02 HOT Table Values 0:15-0:30 0:15-0:30 0:20-0:35 0:30-0:50
4.3.1.2 Overall perspective on snow results No changes were made to the current generic Type II table based on the results of testing conducted with SPCA Ecowing 26.

180CM1680(exBM3833)\Analysis\HOT\type II\fig 4.38 Chart 1
At:fig 4.38 Chart 1
FIGURE 4.38EFFECT OF FLUID BRAND AND RATE OF PRECIPITATION ON ENDURANCE TIME
TYPE II NEAT (-14 to -25°C)NATURAL SNOW
0
10
20
30
40
50
60
70
80
90
100
110
120
0 5 10 15 20 25 30 35 40 45
Rate of Precipitation (g/dm²/h)
Flui
d Fa
ilure
Tim
e (m
inut
es)
SPCA Ecowing 26
SPCA Ecowing 26
Current Generic HOT (-14 to -25°C)
# of Tests = 11
4. HOLDOVER TIME TABLES, RESULTS, AND DISCUSSIONS
X:\@APS ARCHIVE\CM1680 (exBM3833) TC-Deicing 00-01 (REPORTS ONLY)\Reports\HOT\Final Version 1.0\Final Version 1.0.doc Final Version 1.0
August 05APS AVIATION INC.
181
4.3.2 Freezing Drizzle The freezing drizzle endurance time data were derived from tests conducted by APS at the NRC test facility in Ottawa. Subsections 4.3.2.1.1 to 4.3.2.1.5 contain the Type II fluid holdover time results in the freezing drizzle column. They are arranged in tabular form and follow the sequence of temperature ranges as they appear in the holdover time tables, from top to bottom. Because it was not possible to simulate freezing drizzle above 0°C, the holdover time results for this category of precipitation above 0°C are identical to those in the range of 0°C to -3°C.
4.3.2.1 Changes to Type II fluid holdover times for freezing drizzle
The tables presented in this subsection show columns containing the generic and fluid-specific holdover time results of testing with Type II fluids. The first horizontal row of values contains the generic holdover time values used in 1998-99. The second line contains the endurance time results from 1998-99 testing. The third line contains the generic and fluid-specific holdover time values that were used in winter operations in 1999-2000. The fourth set of values is the endurance time results from 1999-2000 testing. The fifth row contains the generic and fluid-specific holdover time values accepted for use in 2000-01 winter operations. The sixth set of values is the endurance time test results from 2000-01 testing. The seventh and final line contains the generic and fluid-specific holdover time values for use in 2001-02 winter operations. The underlined holdover time values indicate the fluids responsible for the generic holdover time.

4. HOLDOVER TIME TABLES, RESULTS, AND DISCUSSIONS
X:\@APS ARCHIVE\CM1680 (exBM3833) TC-Deicing 00-01 (REPORTS ONLY)\Reports\HOT\Final Version 1.0\Final Version 1.0.doc Final Version 1.0
August 05APS AVIATION INC.
182
4.3.2.1.1 Neat fluid, above 0°C and 0°C to -3°C, freezing drizzle (Figure 4.39)
The generic holdover times for fluid in these cells have remained unchanged from last year.
TABLE 4.40 Holdover Time Guidelines for Neat Fluid, Above 0°C and 0°C to -3°C,
Freezing Drizzle
SAE ABC-II + C-1951 S E26
1998-99 HOT Table Values 0:30-1:00
1998-99 Endurance Time Test Results 0:35-1:10
1999-2000 HOT Table Values 0:30-1:00 0:35-1:10
1999-2000 Endurance Time Test Results 0:35-0:55 HIS
TO
RIC
AL
2000-01 HOT Table Values 0:30-0:55 0:35-1:10 0:35-0:55
2000-01 Endurance Time Test Results 0:50-1:35
CU
RREN
T
2001-02 HOT Table Values 0:30-0:55 0:35-1:10 0:35-0:55 0:50-1:35
4.3.2.1.2 75/25 fluid, above 0°C and 0°C to -3°C, freezing drizzle (Figure
4.40) The holdover times in these cells have remained unchanged from last year. The Clariant fluid tested in 1999-2000 has an upper holdover time equal to the upper generic value.
TABLE 4.41 Holdover Time Guidelines for 75/25 Fluid, Above 0°C and 0°C to -3°C,
Freezing Drizzle
SAE ABC-II + C-1951 S E26
1998-99 HOT Table Values 0:20-0:45
1998-99 Endurance Time Test Results 0:30-1:00
1999-2000 HOT Table Values 0:20-0:45 0:30-1:00
1999-2000 Endurance Time Test Results 0:25-0:45 HIS
TO
RIC
AL
2000-01 HOT Table Values 0:20-0:45 0:30-1:00 0:25-0:45
2000-01 Endurance Time Test Results 0:45-1:05
CU
RREN
T
2001-02 HOT Table Values 0:20-0:45 0:30-1:00 0:25-0:45 0:45-1:05
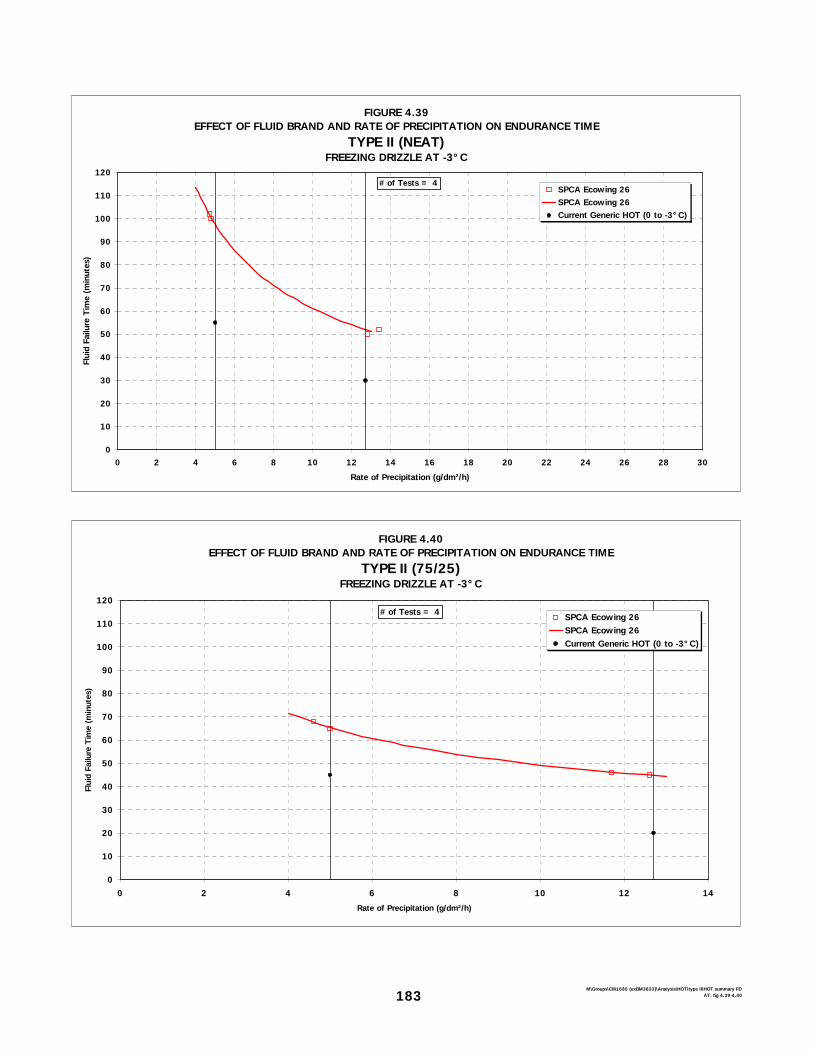
FIGURE 4.39EFFECT OF FLUID BRAND AND RATE OF PRECIPITATION ON ENDURANCE TIME
TYPE II (NEAT)FREEZING DRIZZLE AT -3°C
0
10
20
30
40
50
60
70
80
90
100
110
120
0 2 4 6 8 10 12 14 16 18 20 22 24 26 28 30
Rate of Precipitation (g/dm²/h)
Flui
d Fa
ilure
Tim
e (m
inut
es)
SPCA Ecowing 26SPCA Ecowing 26Current Generic HOT (0 to -3°C)
# of Tests = 4
FIGURE 4.40EFFECT OF FLUID BRAND AND RATE OF PRECIPITATION ON ENDURANCE TIME
TYPE II (75/25)FREEZING DRIZZLE AT -3°C
0
10
20
30
40
50
60
70
80
90
100
110
120
0 2 4 6 8 10 12 14
Rate of Precipitation (g/dm²/h)
Flui
d Fa
ilure
Tim
e (m
inut
es)
SPCA Ecowing 26SPCA Ecowing 26Current Generic HOT (0 to -3°C)
# of Tests = 4
183M\Groups\CM1680 (exBM3833)\Analysis\HOT\type II\HOT summary FD
AT: fig 4.39-4.40

4. HOLDOVER TIME TABLES, RESULTS, AND DISCUSSIONS
X:\@APS ARCHIVE\CM1680 (exBM3833) TC-Deicing 00-01 (REPORTS ONLY)\Reports\HOT\Final Version 1.0\Final Version 1.0.doc Final Version 1.0
August 05APS AVIATION INC.
184
4.3.2.1.3 50/50 fluid, above 0°C and 0°C to -3°C, freezing drizzle (Figure 4.41)
The holdover times in these cells have remained unchanged from last year. Both the Clariant MP II 1951 and the Kilfrost ABC-II Plus have lower holdover times equal to the lower generic value.
TABLE 4.42 Holdover Time Guidelines for 50/50 Fluid, Above 0°C and 0°C to -3°C,
Freezing Drizzle
SAE ABC-II + C-1951 S E26
1998-99 HOT Table Values 0:10-0:20
1998-99 Endurance Time Test Results 0:05-0:25
1999-2000 HOT Table Values 0:05-0:20 0:05-0:25
1999-2000 Endurance Time Test Results 0:05-0:15 HIS
TO
RIC
AL
2000-01 HOT Table Values 0:05-0:15 0:05-0:25 0:05-0:15
2000-01 Endurance Time Test Results 0:15-0:25
CU
RREN
T
2001-02 HOT Table Values 0:05-0:15 0:05-0:25 0:05-0:15 0:15-0:25
4.3.2.1.4 Neat fluid, -3°C to -10°C, freezing drizzle (Figure 4.42) The lower and upper generic holdover time limits for neat fluid in this temperature range for this precipitation type have remained unchanged from the generic values since 1999-2000 and are based on results of tests conducted with Kilfrost ABC-II Plus in 1998-99.
TABLE 4.43 Holdover Time Guidelines for Neat Fluid, -3°C to -10°C, Freezing Drizzle
SAE ABC-II + C-1951 S E26
1998-99 HOT Table Values 0:30-1:00
1998-99 Endurance Time Test Results 0:15-0:45
1999-2000 HOT Table Values 0:15-0:45 0:15-0:45
1999-2000 Endurance Time Test Results 0:25-0:50 HIS
TO
RIC
AL
2000-01 HOT Table Values 0:15-0:45 0:15-0:45 025-0:50
2000-01 Endurance Time Test Results 0:30-1:10
CU
RREN
T
2001-02 HOT Table Values 0:15-0:45 0:15-0:45 025-0:50 0:30-1:10

FIGURE 4.41EFFECT OF FLUID BRAND AND RATE OF PRECIPITATION ON ENDURANCE TIME
TYPE II (50/50)FREEZING DRIZZLE AT -3°C
0
10
20
30
40
50
60
70
80
90
100
110
120
0 2 4 6 8 10 12 14Rate of Precipitation (g/dm²/h)
Flui
d Fa
ilure
Tim
e (m
inut
es)
SPCA Ecowing 26SPCA Ecowing 26Current Generic HOT (0 to -3°C)
# of Tests = 5
FIGURE 4.42EFFECT OF FLUID BRAND AND RATE OF PRECIPITATION ON ENDURANCE TIME
TYPE II (NEAT)FREEZING DRIZZLE AT -10°C
0
10
20
30
40
50
60
70
80
90
100
110
120
0 2 4 6 8 10 12 14 16Rate of Precipitation (g/dm²/h)
Flui
d Fa
ilure
Tim
e (m
inut
es)
SPCA Ecowing 26SPCA Ecowing 26Current Generic HOT (-3 to -10°C)
# of Tests = 4
185 M\Groups\CM1680 (exBM3833)\Analysis\HOT\type II\HOT summary FDAT: fig 4.41-4.42
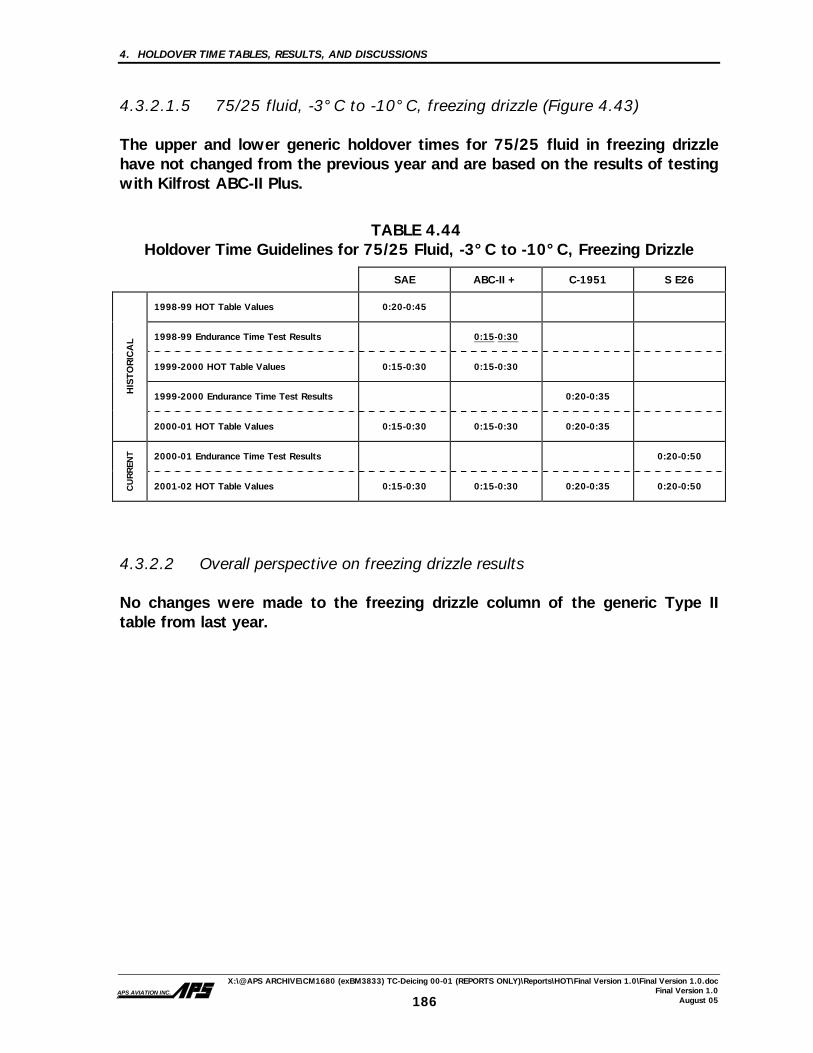
4. HOLDOVER TIME TABLES, RESULTS, AND DISCUSSIONS
X:\@APS ARCHIVE\CM1680 (exBM3833) TC-Deicing 00-01 (REPORTS ONLY)\Reports\HOT\Final Version 1.0\Final Version 1.0.doc Final Version 1.0
August 05APS AVIATION INC.
186
4.3.2.1.5 75/25 fluid, -3°C to -10°C, freezing drizzle (Figure 4.43) The upper and lower generic holdover times for 75/25 fluid in freezing drizzle have not changed from the previous year and are based on the results of testing with Kilfrost ABC-II Plus.
TABLE 4.44 Holdover Time Guidelines for 75/25 Fluid, -3°C to -10°C, Freezing Drizzle
SAE ABC-II + C-1951 S E26
1998-99 HOT Table Values 0:20-0:45
1998-99 Endurance Time Test Results 0:15-0:30
1999-2000 HOT Table Values 0:15-0:30 0:15-0:30
1999-2000 Endurance Time Test Results 0:20-0:35 HIS
TO
RIC
AL
2000-01 HOT Table Values 0:15-0:30 0:15-0:30 0:20-0:35
2000-01 Endurance Time Test Results 0:20-0:50
CU
RREN
T
2001-02 HOT Table Values 0:15-0:30 0:15-0:30 0:20-0:35 0:20-0:50
4.3.2.2 Overall perspective on freezing drizzle results No changes were made to the freezing drizzle column of the generic Type II table from last year.

FIGURE 4.43EFFECT OF FLUID BRAND AND RATE OF PRECIPITATION ON ENDURANCE TIME
TYPE II (75/25)FREEZING DRIZZLE AT -10°C
0
10
20
30
40
50
60
70
80
90
100
110
120
0 2 4 6 8 10 12 14 16 18 20 22 24 26 28 30Rate of Precipitation (g/dm²/h)
Flui
d Fa
ilure
Tim
e (m
inut
es)
SPCA Ecowing 26SPCA Ecowing 26Current Generic HOT (-3 to -10°C)
# of Tests = 4
187M\Groups\CM1680 (exBM3833)\Analysis\HOT\type II\HOT summary FD
AT: fig 4.43

188
This page intentionally left blank.

4. HOLDOVER TIME TABLES, RESULTS, AND DISCUSSIONS
X:\@APS ARCHIVE\CM1680 (exBM3833) TC-Deicing 00-01 (REPORTS ONLY)\Reports\HOT\Final Version 1.0\Final Version 1.0.doc Final Version 1.0
August 05 APS AVIATION INC.
189
4.3.3 Light Freezing Rain The light freezing rain endurance time data were derived from tests conducted by APS at the NRC test facility in Ottawa. Subsections 4.3.3.1.1 to 4.3.3.1.5 contain the Type II fluid holdover time results in the light freezing rain column. Results are arranged in tabular form and follow the sequence of temperature ranges as they appear in the holdover time tables, from top to bottom. Because it was not possible to simulate light freezing rain above 0°C, the holdover time results for the category of precipitation above 0°C are identical to those in the range of 0°C to -3°C.
4.3.3.1 Changes to Type II fluid holdover times for light freezing rain
The tables presented in this subsection show columns containing the generic and fluid-specific holdover time results of testing with Type II fluids. The first horizontal row of values contains the generic holdover time values used in 1998-99. The second line contains the endurance time results from 1998-99 testing. The third line contains the generic and fluid-specific holdover time values that were used in winter operations in 1999-2000. The fourth set of values is the endurance time results from 1999-2000 testing. The fifth row contains the generic and fluid-specific holdover time values accepted for use in 2000-01 winter operations. The sixth set of values is the endurance time test results from 2000-01 testing. The seventh and final line contains the generic and fluid-specific holdover time values for use in 2001-02 winter operations. The underlined holdover time values indicate the fluids responsible for the generic holdover time.

4. HOLDOVER TIME TABLES, RESULTS, AND DISCUSSIONS
X:\@APS ARCHIVE\CM1680 (exBM3833) TC-Deicing 00-01 (REPORTS ONLY)\Reports\HOT\Final Version 1.0\Final Version 1.0.doc Final Version 1.0
August 05 APS AVIATION INC.
190
4.3.3.1.1 Neat fluid, above 0°C and 0ºC to -3°C, light freezing rain (Figure 4.44)
The holdover times have remained unchanged in these cells of the Type II table for light freezing rain. The upper holdover time of the Clariant fluid is equal to the generic value.
TABLE 4.45 Holdover Time Guidelines for Neat Fluid, Above 0°C and 0ºC to -3°C,
Light Freezing Rain
SAE ABC-II + C-1951 S E26
1998-99 HOT Table Values 0:15-0:30
1998-99 Endurance Time Test Results 0:30-0:40
1999-2000 HOT Table Values 0:15-0:30 0:30-0:40
1999-2000 Endurance Time Test Results 0:20-0:30 HIS
TO
RIC
AL
2000-01 HOT Table Values 0:15-0:30 0:30-0:40 0:20-0:30
2000-01 Endurance Time Test Results 0:40-0:50
CU
RREN
T
2001-02 HOT Table Values 0:15-0:30 0:30-0:40 0:20-0:30 0:40-0:50
4.3.3.1.2 75/25 fluid, above 0°C and 0ºC to -3°C, light freezing rain (Figure
4.45)
The holdover times have remained unchanged in these cells of the Type II table for light freezing rain. The upper holdover time of the Clariant fluid is equal to the generic value.
TABLE 4.46 Holdover Time Guidelines for 75/25 Fluid, Above 0°C and 0ºC to -3°C,
Light Freezing Rain
SAE ABC-II + C-1951 S E26
998-99 HOT Table Values 0:10-0:25
1998-99 Endurance Time Test Results 0:20-0:40
1999-2000 HOT Table Values 0:10-0:25 0:20-0:40
1999-2000 Endurance Time Test Results 015-0:25 HIS
TO
RIC
AL
2000-01 HOT Table Values 0:10-0:25 0:20-0:40 0:15-0:25
2000-01 Endurance Time Test Results 0:25-0:35
CU
RREN
T
2001-02 HOT Table Values 0:10-0:25 0:20-0:40 0:15-0:25 0:25-0:35
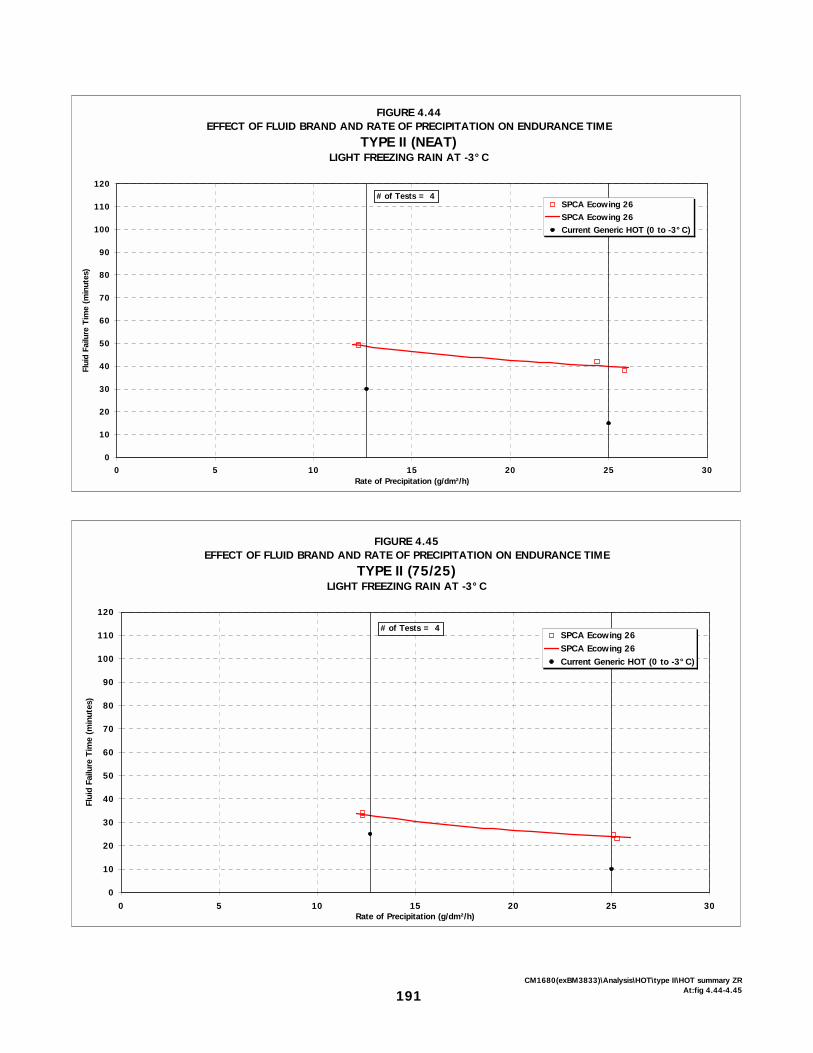
FIGURE 4.44EFFECT OF FLUID BRAND AND RATE OF PRECIPITATION ON ENDURANCE TIME
TYPE II (NEAT)LIGHT FREEZING RAIN AT -3°C
0
10
20
30
40
50
60
70
80
90
100
110
120
0 5 10 15 20 25 30Rate of Precipitation (g/dm²/h)
Flui
d Fa
ilure
Tim
e (m
inut
es)
SPCA Ecowing 26SPCA Ecowing 26Current Generic HOT (0 to -3°C)
# of Tests = 4
FIGURE 4.45EFFECT OF FLUID BRAND AND RATE OF PRECIPITATION ON ENDURANCE TIME
TYPE II (75/25)LIGHT FREEZING RAIN AT -3°C
0
10
20
30
40
50
60
70
80
90
100
110
120
0 5 10 15 20 25 30Rate of Precipitation (g/dm²/h)
Flui
d Fa
ilure
Tim
e (m
inut
es)
SPCA Ecowing 26SPCA Ecowing 26Current Generic HOT (0 to -3°C)
# of Tests = 4
191CM1680(exBM3833)\Analysis\HOT\type II\HOT summary ZR
At:fig 4.44-4.45
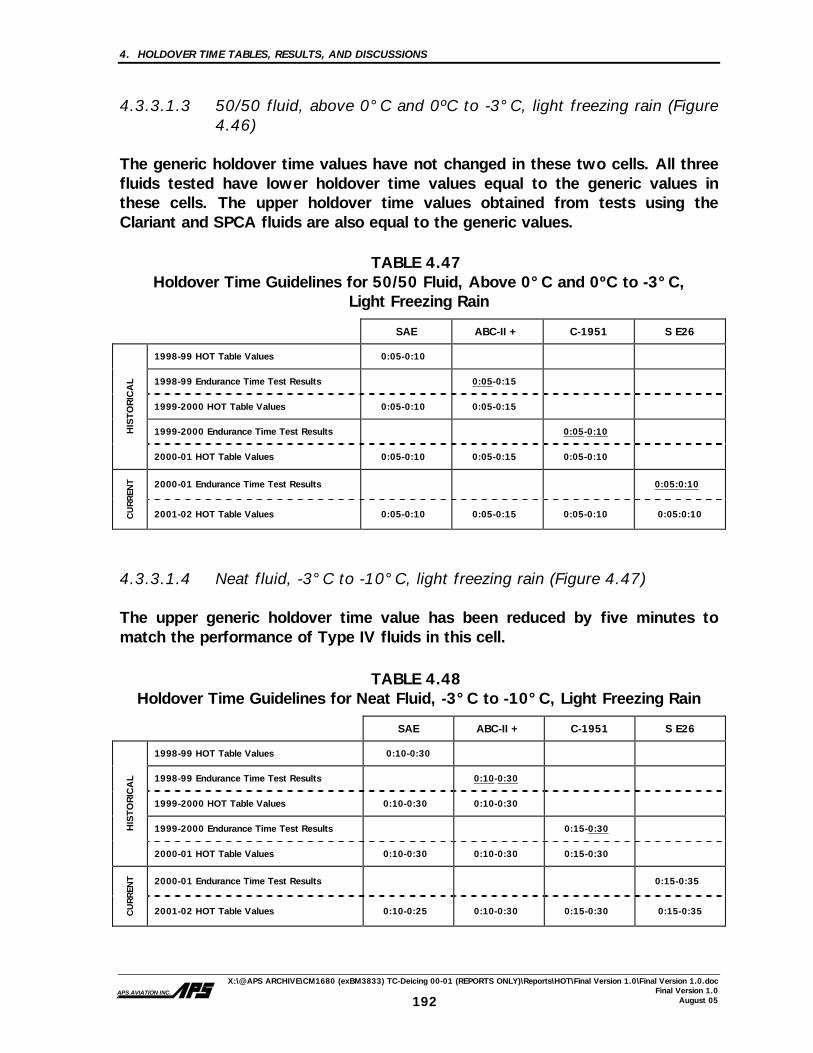
4. HOLDOVER TIME TABLES, RESULTS, AND DISCUSSIONS
X:\@APS ARCHIVE\CM1680 (exBM3833) TC-Deicing 00-01 (REPORTS ONLY)\Reports\HOT\Final Version 1.0\Final Version 1.0.doc Final Version 1.0
August 05 APS AVIATION INC.
192
4.3.3.1.3 50/50 fluid, above 0°C and 0ºC to -3°C, light freezing rain (Figure 4.46)
The generic holdover time values have not changed in these two cells. All three fluids tested have lower holdover time values equal to the generic values in these cells. The upper holdover time values obtained from tests using the Clariant and SPCA fluids are also equal to the generic values.
TABLE 4.47 Holdover Time Guidelines for 50/50 Fluid, Above 0°C and 0ºC to -3°C,
Light Freezing Rain
SAE ABC-II + C-1951 S E26
1998-99 HOT Table Values 0:05-0:10
1998-99 Endurance Time Test Results 0:05-0:15
1999-2000 HOT Table Values 0:05-0:10 0:05-0:15
1999-2000 Endurance Time Test Results 0:05-0:10 HIS
TO
RIC
AL
2000-01 HOT Table Values 0:05-0:10 0:05-0:15 0:05-0:10
2000-01 Endurance Time Test Results 0:05:0:10
CU
RREN
T
2001-02 HOT Table Values 0:05-0:10 0:05-0:15 0:05-0:10 0:05:0:10
4.3.3.1.4 Neat fluid, -3°C to -10°C, light freezing rain (Figure 4.47)
The upper generic holdover time value has been reduced by five minutes to match the performance of Type IV fluids in this cell.
TABLE 4.48 Holdover Time Guidelines for Neat Fluid, -3°C to -10°C, Light Freezing Rain
SAE ABC-II + C-1951 S E26
1998-99 HOT Table Values 0:10-0:30
1998-99 Endurance Time Test Results 0:10-0:30
1999-2000 HOT Table Values 0:10-0:30 0:10-0:30
1999-2000 Endurance Time Test Results 0:15-0:30 HIS
TO
RIC
AL
2000-01 HOT Table Values 0:10-0:30 0:10-0:30 0:15-0:30
2000-01 Endurance Time Test Results 0:15-0:35
CU
RREN
T
2001-02 HOT Table Values 0:10-0:25 0:10-0:30 0:15-0:30 0:15-0:35

FIGURE 4.46EFFECT OF FLUID BRAND AND RATE OF PRECIPITATION ON ENDURANCE TIME
TYPE II (50/50)LIGHT FREEZING RAIN AT -3°C
0
10
20
30
40
50
60
70
80
90
100
110
120
0 2 4 6 8 10 12 14 16 18 20 22 24 26 28 30Rate of Precipitation (g/dm²/h)
Flui
d Fa
ilure
Tim
e (m
inut
es)
SPCA Ecowing 26SPCA Ecowing 26Current Generic HOT (0 to -3°C)
# of Tests = 4
FIGURE 4.47EFFECT OF FLUID BRAND AND RATE OF PRECIPITATION ON ENDURANCE TIME
TYPE II (NEAT)LIGHT FREEZING RAIN AT -10°C
0
10
20
30
40
50
60
70
80
90
100
110
120
0 2 4 6 8 10 12 14 16 18 20 22 24 26 28 30Rate of Precipitation (g/dm²/h)
Flui
d Fa
ilure
Tim
e (m
inut
es)
SPCA Ecowing 26SPCA Ecowing 26Current Generic HOT (-3 to -10°C)
# of Tests = 4
193CM1680(exBM3833)\Analysis\HOT\type II\HOT summary ZR
At:fig 4.46-4.47
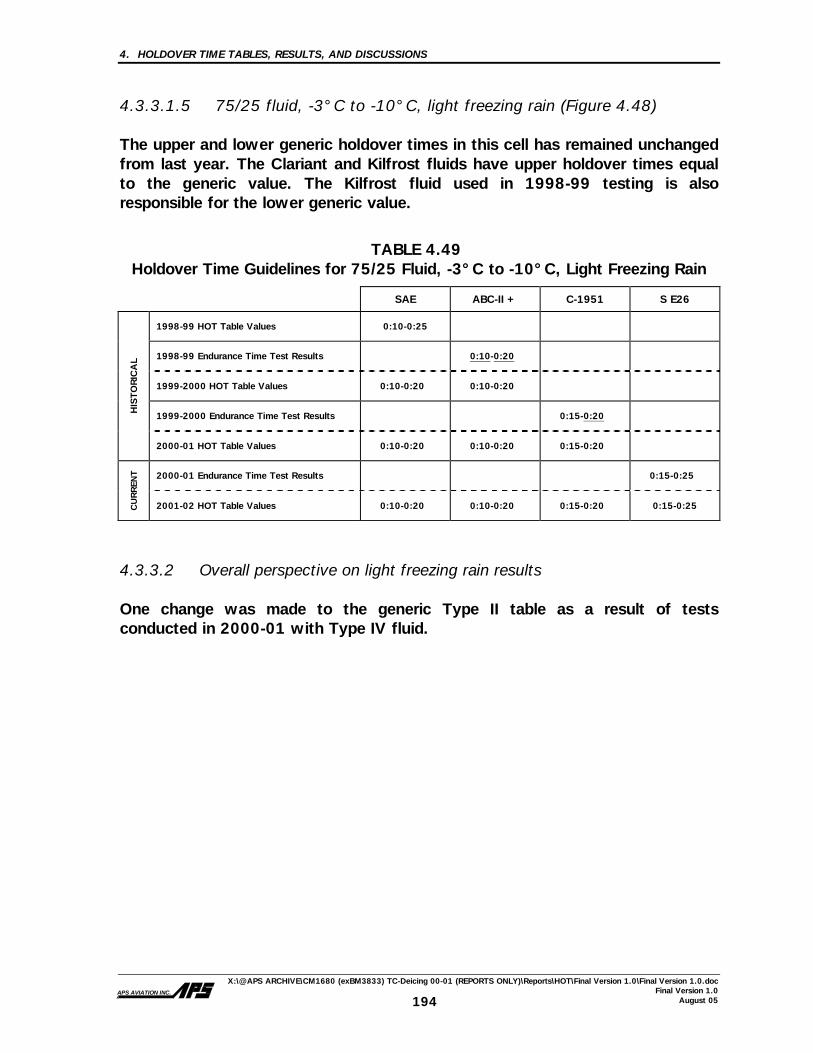
4. HOLDOVER TIME TABLES, RESULTS, AND DISCUSSIONS
X:\@APS ARCHIVE\CM1680 (exBM3833) TC-Deicing 00-01 (REPORTS ONLY)\Reports\HOT\Final Version 1.0\Final Version 1.0.doc Final Version 1.0
August 05 APS AVIATION INC.
194
4.3.3.1.5 75/25 fluid, -3°C to -10°C, light freezing rain (Figure 4.48) The upper and lower generic holdover times in this cell has remained unchanged from last year. The Clariant and Kilfrost fluids have upper holdover times equal to the generic value. The Kilfrost fluid used in 1998-99 testing is also responsible for the lower generic value.
TABLE 4.49 Holdover Time Guidelines for 75/25 Fluid, -3°C to -10°C, Light Freezing Rain
SAE ABC-II + C-1951 S E26
1998-99 HOT Table Values 0:10-0:25
1998-99 Endurance Time Test Results 0:10-0:20
1999-2000 HOT Table Values 0:10-0:20 0:10-0:20
1999-2000 Endurance Time Test Results 0:15-0:20 HIS
TO
RIC
AL
2000-01 HOT Table Values 0:10-0:20 0:10-0:20 0:15-0:20
2000-01 Endurance Time Test Results 0:15-0:25
CU
RREN
T
2001-02 HOT Table Values 0:10-0:20 0:10-0:20 0:15-0:20 0:15-0:25
4.3.3.2 Overall perspective on light freezing rain results One change was made to the generic Type II table as a result of tests conducted in 2000-01 with Type IV fluid.

FIGURE 4.48EFFECT OF FLUID BRAND AND RATE OF PRECIPITATION ON ENDURANCE TIME
TYPE II (75/25)LIGHT FREEZING RAIN AT -10°C
0
10
20
30
40
50
60
70
80
90
100
110
120
0 5 10 15 20 25 30Rate of precipitation (g/dm²/h)
Flui
d Fa
ilure
Tim
e (m
inut
es)
SPCA Ecowing 26SPCA Ecowing 26Current Generic HOT (-3 to -10°C)
# of Tests = 4
195CM1680(exBM3833)\Analysis\HOT\type II\HOT summary ZR
At:fig 4.48
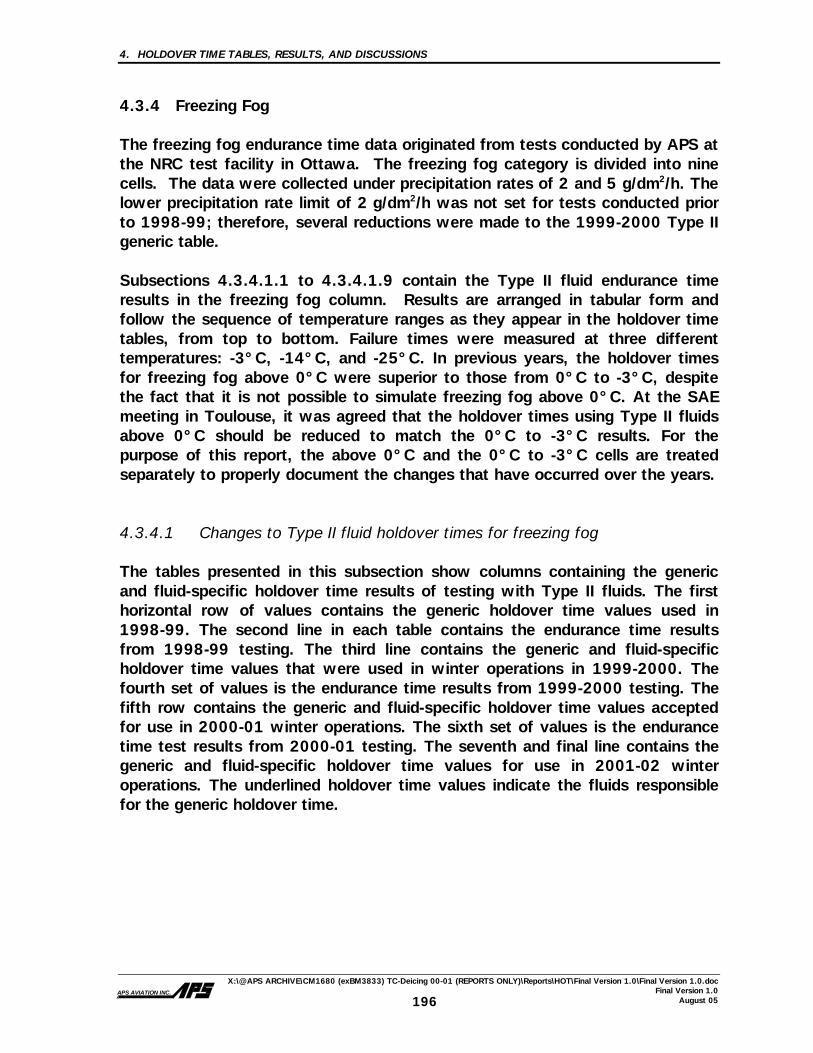
4. HOLDOVER TIME TABLES, RESULTS, AND DISCUSSIONS
X:\@APS ARCHIVE\CM1680 (exBM3833) TC-Deicing 00-01 (REPORTS ONLY)\Reports\HOT\Final Version 1.0\Final Version 1.0.doc Final Version 1.0
August 05 APS AVIATION INC.
196
4.3.4 Freezing Fog The freezing fog endurance time data originated from tests conducted by APS at the NRC test facility in Ottawa. The freezing fog category is divided into nine cells. The data were collected under precipitation rates of 2 and 5 g/dm2/h. The lower precipitation rate limit of 2 g/dm2/h was not set for tests conducted prior to 1998-99; therefore, several reductions were made to the 1999-2000 Type II generic table. Subsections 4.3.4.1.1 to 4.3.4.1.9 contain the Type II fluid endurance time results in the freezing fog column. Results are arranged in tabular form and follow the sequence of temperature ranges as they appear in the holdover time tables, from top to bottom. Failure times were measured at three different temperatures: -3°C, -14°C, and -25°C. In previous years, the holdover times for freezing fog above 0°C were superior to those from 0°C to -3°C, despite the fact that it is not possible to simulate freezing fog above 0°C. At the SAE meeting in Toulouse, it was agreed that the holdover times using Type II fluids above 0°C should be reduced to match the 0°C to -3°C results. For the purpose of this report, the above 0°C and the 0°C to -3°C cells are treated separately to properly document the changes that have occurred over the years.
4.3.4.1 Changes to Type II fluid holdover times for freezing fog
The tables presented in this subsection show columns containing the generic and fluid-specific holdover time results of testing with Type II fluids. The first horizontal row of values contains the generic holdover time values used in 1998-99. The second line in each table contains the endurance time results from 1998-99 testing. The third line contains the generic and fluid-specific holdover time values that were used in winter operations in 1999-2000. The fourth set of values is the endurance time results from 1999-2000 testing. The fifth row contains the generic and fluid-specific holdover time values accepted for use in 2000-01 winter operations. The sixth set of values is the endurance time test results from 2000-01 testing. The seventh and final line contains the generic and fluid-specific holdover time values for use in 2001-02 winter operations. The underlined holdover time values indicate the fluids responsible for the generic holdover time.
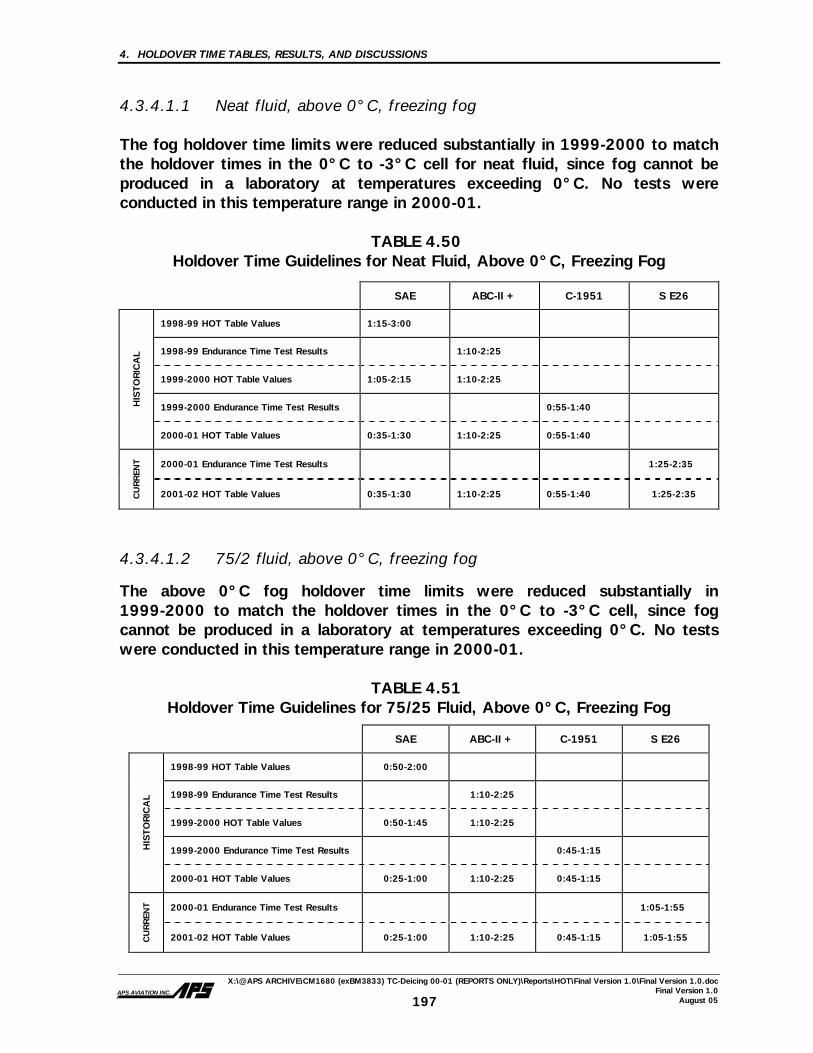
4. HOLDOVER TIME TABLES, RESULTS, AND DISCUSSIONS
X:\@APS ARCHIVE\CM1680 (exBM3833) TC-Deicing 00-01 (REPORTS ONLY)\Reports\HOT\Final Version 1.0\Final Version 1.0.doc Final Version 1.0
August 05 APS AVIATION INC.
197
4.3.4.1.1 Neat fluid, above 0°C, freezing fog The fog holdover time limits were reduced substantially in 1999-2000 to match the holdover times in the 0°C to -3°C cell for neat fluid, since fog cannot be produced in a laboratory at temperatures exceeding 0°C. No tests were conducted in this temperature range in 2000-01.
TABLE 4.50 Holdover Time Guidelines for Neat Fluid, Above 0°C, Freezing Fog
SAE ABC-II + C-1951 S E26
1998-99 HOT Table Values 1:15-3:00
1998-99 Endurance Time Test Results 1:10-2:25
1999-2000 HOT Table Values 1:05-2:15 1:10-2:25
1999-2000 Endurance Time Test Results 0:55-1:40 HIS
TO
RIC
AL
2000-01 HOT Table Values 0:35-1:30 1:10-2:25 0:55-1:40
2000-01 Endurance Time Test Results 1:25-2:35
CU
RREN
T
2001-02 HOT Table Values 0:35-1:30 1:10-2:25 0:55-1:40 1:25-2:35
4.3.4.1.2 75/2 fluid, above 0°C, freezing fog
The above 0°C fog holdover time limits were reduced substantially in 1999-2000 to match the holdover times in the 0°C to -3°C cell, since fog cannot be produced in a laboratory at temperatures exceeding 0°C. No tests were conducted in this temperature range in 2000-01.
TABLE 4.51 Holdover Time Guidelines for 75/25 Fluid, Above 0°C, Freezing Fog
SAE ABC-II + C-1951 S E26
1998-99 HOT Table Values 0:50-2:00
1998-99 Endurance Time Test Results 1:10-2:25
1999-2000 HOT Table Values 0:50-1:45 1:10-2:25
1999-2000 Endurance Time Test Results 0:45-1:15 HIS
TO
RIC
AL
2000-01 HOT Table Values 0:25-1:00 1:10-2:25 0:45-1:15
2000-01 Endurance Time Test Results 1:05-1:55
CU
RREN
T
2001-02 HOT Table Values 0:25-1:00 1:10-2:25 0:45-1:15 1:05-1:55

4. HOLDOVER TIME TABLES, RESULTS, AND DISCUSSIONS
X:\@APS ARCHIVE\CM1680 (exBM3833) TC-Deicing 00-01 (REPORTS ONLY)\Reports\HOT\Final Version 1.0\Final Version 1.0.doc Final Version 1.0
August 05 APS AVIATION INC.
198
4.3.4.1.3 50/50 fluid, above 0°C, freezing fog The generic holdover times in this cell have remained unchanged from last year. In 1999-2000, the upper generic holdover time limit was reduced by five minutes due to the result of Clariant tests between 0°C and -3°C. No tests were conducted in this temperature range in 2000-01.
TABLE 4.52 Holdover Time Guidelines for 50/50 Fluid, Above 0°C, Freezing Fog
SAE ABC-II + C-1951 S E26
1998-99 HOT Table Values 0:20-0:45
1998-99 Endurance Time Test Results 0:15-0:45
1999-2000 HOT Table Values 0:15-0:35 0:15-0:45
1999-2000 Endurance Time Test Results 0:20-0:30 HIS
TO
RIC
AL
2000-01 HOT Table Values 0:15-0:30 0:15-0:45 0:20-0:30
2000-01 Endurance Time Test Results 0:30-0:45
CU
RREN
T
2001-02 HOT Table Values 0:15-0:30 0:15-0:45 0:20-0:30 0:30-0:45
4.3.4.1.4 Neat fluid, 0°C to -3°C, freezing fog (Figure 4.49) The current holdover time limits have not been reduced based on recent testing.
TABLE 4.53 Holdover Time Guidelines for Neat Fluid, 0°C to -3°C, Freezing Fog
SAE ABC-II + C-1951 S E26
1998-99 HOT Table Values 0:35-1:30
1998-99 Endurance Time Test Results 1:10-2:25
1999-2000 HOT Table Values 0:35-1:30 1:10-2:25
1999-2000 Endurance Time Test Results 0:55-1:40 HIS
TO
RIC
AL
2000-01 HOT Table Values 0:35-1:30 1:10-2:25 0:55-1:40
2000-01 Endurance Time Test Results 1:25-2:35
CU
RREN
T
2001-02 HOT Table Values 0:35-1:30 1:10-2:25 0:55-1:40 1:25-2:35
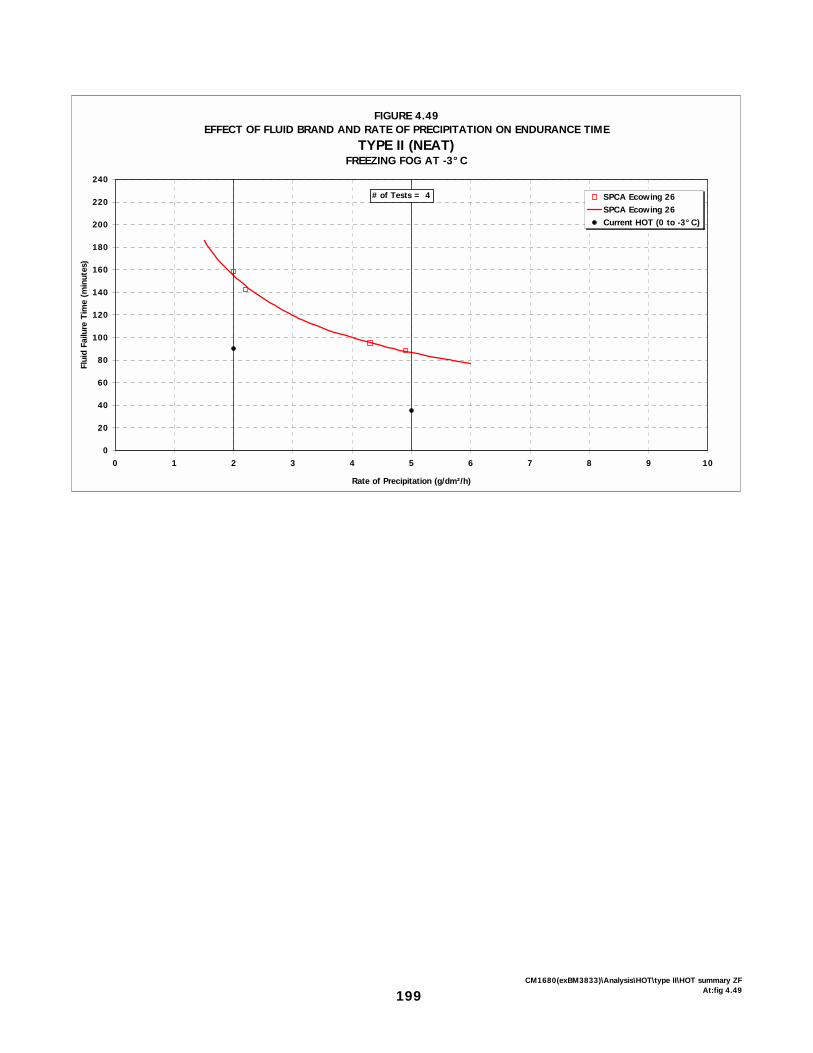
FIGURE 4.49EFFECT OF FLUID BRAND AND RATE OF PRECIPITATION ON ENDURANCE TIME
TYPE II (NEAT)FREEZING FOG AT -3°C
0
20
40
60
80
100
120
140
160
180
200
220
240
0 1 2 3 4 5 6 7 8 9 10
Rate of Precipitation (g/dm²/h)
Flui
d Fa
ilure
Tim
e (m
inut
es)
SPCA Ecowing 26SPCA Ecowing 26Current HOT (0 to -3°C)
# of Tests = 4
199CM1680(exBM3833)\Analysis\HOT\type II\HOT summary ZF
At:fig 4.49

4. HOLDOVER TIME TABLES, RESULTS, AND DISCUSSIONS
X:\@APS ARCHIVE\CM1680 (exBM3833) TC-Deicing 00-01 (REPORTS ONLY)\Reports\HOT\Final Version 1.0\Final Version 1.0.doc Final Version 1.0
August 05 APS AVIATION INC.
200
4.3.4.1.5 75/25 fluid, 0°C to -3°C, freezing fog (Figure 4.50) The current holdover time limits have not been reduced based on recent testing.
TABLE 4.54 Holdover Time Guidelines for 75/25 Fluid, 0°C to -3°C, Freezing Fog
SAE ABC-II + C-1951 S E26
1998-99 HOT Table Values 0:25-1:00
1998-99 Endurance Time Test Results 1:10-2:25
1999-2000 HOT Table Values 0:25-1:00 1:10-2:25
1999-2000 Endurance Time Test Results 0:45-1:15 HIS
TO
RIC
AL
2000-01 HOT Table Values 0:25-1:00 1:10-2:25 0:45-1:15
2000-01 Endurance Time Test Results 1:05-1:55
CU
RREN
T
2001-02 HOT Table Values 0:25-1:00 1:10-2:25 0:45-1:15 1:05-1:55
4.3.4.1.6 50/50 fluid, 0°C to -3°C, freezing fog (Figure 4.51) The current holdover time limits have not been reduced based on recent testing.
TABLE 4.55 Holdover Time Guidelines for 50/50 Fluid, 0°C to -3°C, Freezing Fog
SAE ABC-II + C-1951 S E26
1998-99 HOT Table Values 0:15-0:45
1998-99 Endurance Time Test Results 0:15-0:45
1999-2000 HOT Table Values 0:15-0:35 0:15-0:45
1999-2000 Endurance Time Test Results 0:20-0:30 HIS
TO
RIC
AL
2000-01 HOT Table Values 0:15-0:30 0:15-0:45 0:20-0:30
2000-01 Endurance Time Test Results 0:30-0:45
CU
RREN
T
2001-02 HOT Table Values 0:15-0:30 0:15-0:45 0:20-0:30 0:30-0:45

FIGURE 4.50EFFECT OF FLUID BRAND AND RATE OF PRECIPITATION ON ENDURANCE TIME
TYPE II (75/25)FREEZING FOG AT -3°C
0
20
40
60
80
100
120
140
160
180
200
220
240
0 1 2 3 4 5 6 7Rate of Precipitation (g/dm²/h)
Flui
d Fa
ilure
Tim
e (m
inut
es)
SPCA Ecowing 26SPCA Ecowing 26Current Generic HOT (0 to -3°C)
# of Tests = 4
FIGURE 4.51EFFECT OF FLUID BRAND AND RATE OF PRECIPITATION ON ENDURANCE TIME
TYPE II (50/50)FREEZING FOG AT -3°C
0
20
40
60
80
100
120
140
160
180
200
220
240
0 1 2 3 4 5 6 7 8 9 10Rate of Precipitation (g/dm²/h)
Flui
d Fa
ilure
Tim
e (m
inut
es)
SPCA Ecowing 26SPCA Ecowing 26Current Generic HOT (0 to -3°C)
# of Tests = 4
201ICM1680(exBM3833)\Analysis\HOT\type II\HOT summary ZF
At:fig 4.50-4.51

4. HOLDOVER TIME TABLES, RESULTS, AND DISCUSSIONS
X:\@APS ARCHIVE\CM1680 (exBM3833) TC-Deicing 00-01 (REPORTS ONLY)\Reports\HOT\Final Version 1.0\Final Version 1.0.doc Final Version 1.0
August 05 APS AVIATION INC.
202
4.3.4.1.7 Neat fluid, -3ºC to -14°C, freezing fog (Figure 4.52) The holdover times have remained unchanged in these cells of the Type II table for freezing fog.
TABLE 4.56 Holdover Time Guidelines for Neat Fluid, -3°C to -14°C, Freezing Fog
SAE ABC-II + C-1951 S E26
1998-99 HOT Table Values 0:35-1:30
1998-99 Endurance Time Test Results 0:30-1:05
1999-2000 HOT Table Values 0:30-1:05 0:30-1:05
1999-2000 Endurance Time Test Results 0:45-1:25 H
ISTO
RIC
AL
2000-01 HOT Table Values 0:20-1:05 0:30-1:05 0:45-1:25
2000-01 Endurance Time Test Results 0:45-2:15
CU
RREN
T
2001-02 HOT Table Values 0:20-1:05 0:30-1:05 0:45-1:25 0:45-2:15
4.3.4.1.8 75/25 fluid, -3ºC to -14°C, freezing fog (Figure 4.53) The upper and lower generic holdover times in this cell have remained unchanged from last year.
TABLE 4.57 Holdover Time Guidelines for 75/25 Fluid, -3°C to -14°C, Freezing Fog
SAE ABC-II + C-1951 S E26
1998-99 HOT Table Values 0:25-1:00
1998-99 Endurance Time Test Results 0:20-0:55
1999-2000 HOT Table Values 0:20-0:55 0:20-0:55
1999-2000 Endurance Time Test Results
0:35-1:00 HIS
TO
RIC
AL
2000-01 HOT Table Values 0:20-0:55 0:20-0:55 0:35-1:00
2000-01 Endurance Time Test Results 0:35-1:15
CU
RREN
T
2001-02 HOT Table Values 0:20-0:55 0:20-0:55 0:35-1:00 0:35-1:15
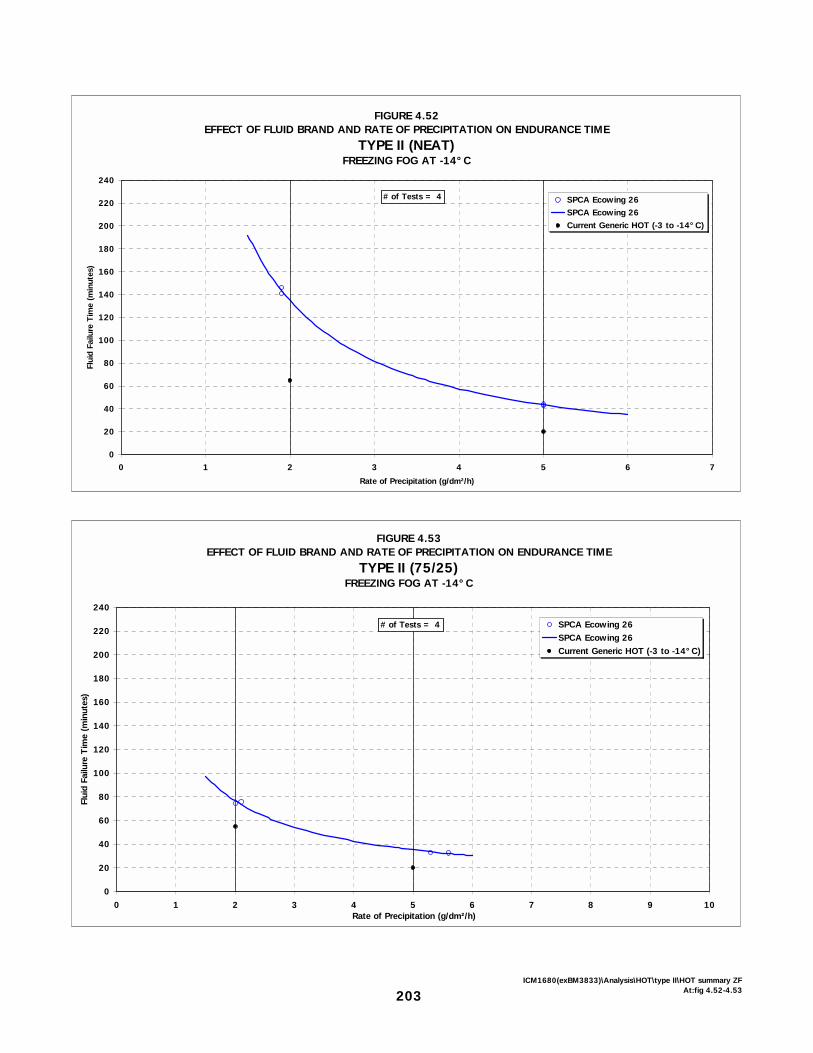
FIGURE 4.52EFFECT OF FLUID BRAND AND RATE OF PRECIPITATION ON ENDURANCE TIME
TYPE II (NEAT)FREEZING FOG AT -14°C
0
20
40
60
80
100
120
140
160
180
200
220
240
0 1 2 3 4 5 6 7
Rate of Precipitation (g/dm²/h)
Flui
d Fa
ilure
Tim
e (m
inut
es)
SPCA Ecowing 26SPCA Ecowing 26Current Generic HOT (-3 to -14°C)
# of Tests = 4
FIGURE 4.53EFFECT OF FLUID BRAND AND RATE OF PRECIPITATION ON ENDURANCE TIME
TYPE II (75/25)FREEZING FOG AT -14°C
0
20
40
60
80
100
120
140
160
180
200
220
240
0 1 2 3 4 5 6 7 8 9 10Rate of Precipitation (g/dm²/h)
Flui
d Fa
ilure
Tim
e (m
inut
es)
SPCA Ecowing 26SPCA Ecowing 26Current Generic HOT (-3 to -14°C)
# of Tests = 4
203ICM1680(exBM3833)\Analysis\HOT\type II\HOT summary ZF
At:fig 4.52-4.53

4. HOLDOVER TIME TABLES, RESULTS, AND DISCUSSIONS
X:\@APS ARCHIVE\CM1680 (exBM3833) TC-Deicing 00-01 (REPORTS ONLY)\Reports\HOT\Final Version 1.0\Final Version 1.0.doc Final Version 1.0
August 05 APS AVIATION INC.
204
4.3.4.1.9 Neat fluid, -14°C to -25°C, freezing fog (Figure 4.54) The upper and lower generic holdover times in this cell have remained unchanged from last year and are based on the results using the Kilfrost fluid in tests performed in 1998-99.
TABLE 4.58 Holdover Time Guidelines for Neat Fluid, -14°C to -25°C, Freezing Fog
SAE ABC-II + C-1951 S E26
1998-99 HOT Table Values 0:20-1:30
1998-99 Endurance Time Test Results 0:15-0:20
1999-2000 HOT Table Values 0:15-0:20 0:15-0:20
1999-2000 Endurance Time Test Results 0:20-0:40 HIS
TO
RIC
AL
2000-01 HOT Table Values 0:15-0:20 0:15-0:20 0:20-0:40
2000-01 Endurance Time Test Results 0:25-0:45
CU
RREN
T
2001-02 HOT Table Values 0:15-0:20 0:15-0:20 0:20-0:40 0:25-0:45
4.3.4.2 Overall perspective on freezing fog results No changes were made to the freezing fog column in the generic Type II table based on the tests conducted with SPCA Ecowing 26 in 2000-01.

205CM1680(exBM3833)\Analysis\HOT\type II\fig 4.54 Chart 1
At:fig 4.54 Chart 1
FIGURE 4.54EFFECT OF FLUID BRAND AND RATE OF PRECIPITATION ON ENDURANCE TIME
TYPE II (NEAT)FREEZING FOG AT -25°C
0
20
40
60
80
100
120
140
160
180
200
220
240
0 1 2 3 4 5 6 7 8 9 10
Rate of Precipitation (g/dm²/h)
Flui
d Fa
ilure
Tim
e (m
inut
es)
SPCA Ecowing 26
SPCA Ecowing 26
Current Generic HOT (-14 to -25°C)
# of Tests = 4

206
This page intentionally left blank.

4. HOLDOVER TIME TABLES, RESULTS, AND DISCUSSIONS
X:\@APS ARCHIVE\CM1680 (exBM3833) TC-Deicing 00-01 (REPORTS ONLY)\Reports\HOT\Final Version 1.0\Final Version 1.0.doc Final Version 1.0
August 05 APS AVIATION INC.
207
4.3.5 Rain on a Cold-Soaked Wing The rain on cold-soaked wing endurance time data were derived from tests conducted by APS at the NRC test facility in Ottawa. The data used to evaluate the endurance times for this category of precipitation covered precipitation rates ranging from 5 g/dm2/h to 76 g/dm2/h. These rates encompass heavy drizzle (5 to 12.7 g/dm2/h), light rain (12.7 to 25 g/dm2/h), and moderate rain (25 to 76 g/dm2/h). The box temperature prior to the start of testing was -10°C. Test data are plotted for two Type II fluid concentrations: neat fluid and 75/25 fluid. Subsections 4.3.5.1.1 and 4.3.5.1.2 contain the Type II fluid holdover time results in the rain on a cold-soaked wing column.
4.3.5.1 Changes to Type II fluid holdover times for rain on a cold-soaked wing
The tables presented in this subsection show columns containing the generic and fluid-specific holdover time results with testing of Type II fluids. The first horizontal row of values contains the generic holdover time values used in 1998-99. The second line contains the endurance time results from 1998-99 testing. The third line contains the generic and fluid-specific holdover time values that were used in winter operations in 1999-2000. The fourth set of values is the endurance time results from 1999-2000 testing. The fifth row contains the generic and fluid-specific holdover time values accepted for use in 2000-01 winter operations. The sixth set of values is the endurance time test results from 2000-01 testing. The seventh and final line contains the generic and fluid-specific holdover time values for use in 2001-02 winter operations. The underlined holdover time values indicate the fluids responsible for the generic holdover time.
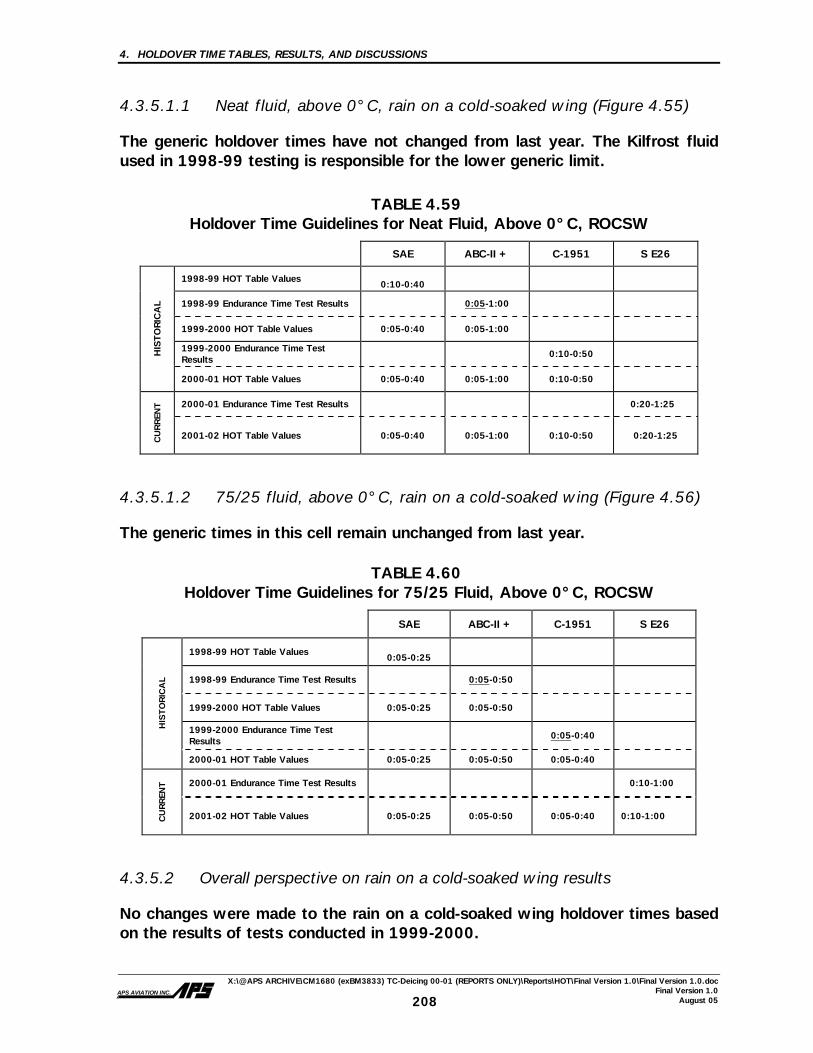
4. HOLDOVER TIME TABLES, RESULTS, AND DISCUSSIONS
X:\@APS ARCHIVE\CM1680 (exBM3833) TC-Deicing 00-01 (REPORTS ONLY)\Reports\HOT\Final Version 1.0\Final Version 1.0.doc Final Version 1.0
August 05 APS AVIATION INC.
208
4.3.5.1.1 Neat fluid, above 0°C, rain on a cold-soaked wing (Figure 4.55) The generic holdover times have not changed from last year. The Kilfrost fluid used in 1998-99 testing is responsible for the lower generic limit.
TABLE 4.59 Holdover Time Guidelines for Neat Fluid, Above 0°C, ROCSW
SAE ABC-II + C-1951 S E26
1998-99 HOT Table Values 0:10-0:40
1998-99 Endurance Time Test Results 0:05-1:00
1999-2000 HOT Table Values 0:05-0:40 0:05-1:00
1999-2000 Endurance Time Test Results
0:10-0:50 HIS
TO
RIC
AL
2000-01 HOT Table Values 0:05-0:40 0:05-1:00 0:10-0:50
2000-01 Endurance Time Test Results 0:20-1:25
CU
RREN
T
2001-02 HOT Table Values 0:05-0:40 0:05-1:00 0:10-0:50 0:20-1:25
4.3.5.1.2 75/25 fluid, above 0°C, rain on a cold-soaked wing (Figure 4.56) The generic times in this cell remain unchanged from last year.
TABLE 4.60 Holdover Time Guidelines for 75/25 Fluid, Above 0°C, ROCSW
SAE ABC-II + C-1951 S E26
1998-99 HOT Table Values 0:05-0:25
1998-99 Endurance Time Test Results 0:05-0:50
1999-2000 HOT Table Values 0:05-0:25 0:05-0:50
1999-2000 Endurance Time Test Results
0:05-0:40
HIS
TO
RIC
AL
2000-01 HOT Table Values 0:05-0:25 0:05-0:50 0:05-0:40
2000-01 Endurance Time Test Results 0:10-1:00
CU
RREN
T
2001-02 HOT Table Values 0:05-0:25 0:05-0:50 0:05-0:40 0:10-1:00
4.3.5.2 Overall perspective on rain on a cold-soaked wing results No changes were made to the rain on a cold-soaked wing holdover times based on the results of tests conducted in 1999-2000.
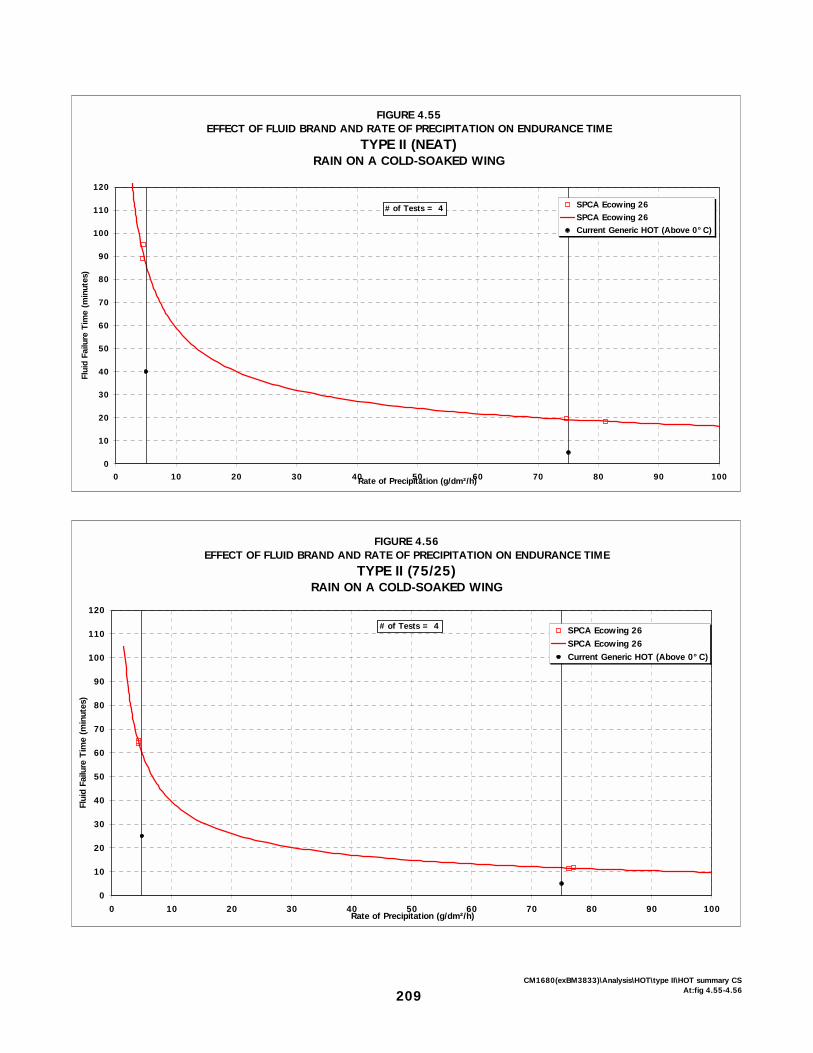
FIGURE 4.55EFFECT OF FLUID BRAND AND RATE OF PRECIPITATION ON ENDURANCE TIME
TYPE II (NEAT)RAIN ON A COLD-SOAKED WING
0
10
20
30
40
50
60
70
80
90
100
110
120
0 10 20 30 40 50 60 70 80 90 100Rate of Precipitation (g/dm²/h)
Flui
d Fa
ilure
Tim
e (m
inut
es)
SPCA Ecowing 26SPCA Ecowing 26Current Generic HOT (Above 0°C)
# of Tests = 4
FIGURE 4.56EFFECT OF FLUID BRAND AND RATE OF PRECIPITATION ON ENDURANCE TIME
TYPE II (75/25)RAIN ON A COLD-SOAKED WING
0
10
20
30
40
50
60
70
80
90
100
110
120
0 10 20 30 40 50 60 70 80 90 100Rate of Precipitation (g/dm²/h)
Flui
d Fa
ilure
Tim
e (m
inut
es)
SPCA Ecowing 26SPCA Ecowing 26Current Generic HOT (Above 0°C)
# of Tests = 4
209CM1680(exBM3833)\Analysis\HOT\type II\HOT summary CS
At:fig 4.55-4.56

4. HOLDOVER TIME TABLES, RESULTS, AND DISCUSSIONS
X:\@APS ARCHIVE\CM1680 (exBM3833) TC-Deicing 00-01 (REPORTS ONLY)\Reports\HOT\Final Version 1.0\Final Version 1.0.doc Final Version 1.0
August 05 APS AVIATION INC.
210
4.3.6 Changes to the Generic Type II Table One change was made to the generic Type II table for use in 2001-02 winter operations. In light freezing rain for Neat Type II fluid between -3°C and -10°C, the upper generic value was reduced by five minutes based on the results of Type IV fluid tests from 2000-01. No changes in the Type II table were made as a result of the most recent Type II fluid tests. 4.4 Type I Fluid Holdover Time Tests Type I fluids are deicing fluids. They are not rheologically modified fluids, but rather exhibit Newtonian fluid properties. Type I fluids are used primarily to remove ice and snow from aircraft surfaces. They are applied at high pressures and elevated temperatures. These fluids do not offer the extended protection of thickened fluids. Depending on weather conditions, anticipated taxi times, or other pre-takeoff delays, an operator can choose to extend the time of fluid protection by application of Type II or Type IV anti-icing fluid on top of the Type I fluid. Although the Type I holdover time table has been substantiated by tests conducted prior to 1996, several new Type I fluids have become available on an annual basis since the 1998-99 test season. Two Type I fluids, Newave Aerochemical FCY-1A and an experimental Type I product from Lyondell, were tested during the 2000-01 winter in natural and simulated conditions. Three additional fluids, Clariant EG I 1996, Clariant MP I 1938, and Lyondell ArcoPlus, were tested in natural snow conditions only. The results of WSET tests with these Type I fluids are displayed in Table 4.61. A significant amount of time was required to prepare the various samples required for testing. Because fluids need to be diluted, freeze point curves (dilution curves) and lowest operational use temperatures (LOUTS) were obtained for each fluid. Fluid concentrations were lowered by adding hard water and the resultant freeze points were verified using calibrated Brix-scale refractometers.
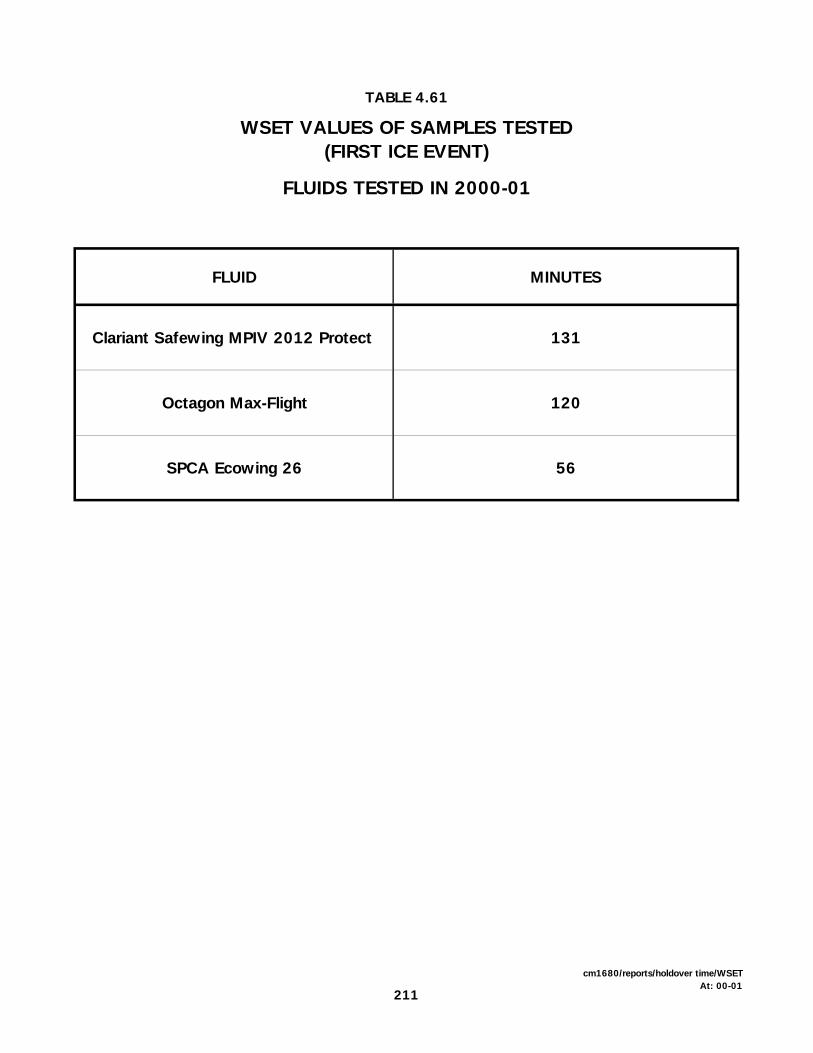
TABLE 4.61
WSET VALUES OF SAMPLES TESTED(FIRST ICE EVENT)
FLUIDS TESTED IN 2000-01
FLUID MINUTES
Clariant Safewing MPIV 2012 Protect 131
Octagon Max-Flight 120
SPCA Ecowing 26 56
211
cm1680/reports/holdover time/WSETAt: 00-01

4. HOLDOVER TIME TABLES, RESULTS, AND DISCUSSIONS
X:\@APS ARCHIVE\CM1680 (exBM3833) TC-Deicing 00-01 (REPORTS ONLY)\Reports\HOT\Final Version 1.0\Final Version 1.0.doc Final Version 1.0
August 05 APS AVIATION INC.
212
Type I tests were carried out at three temperatures: +1°C, -10°C, and -25°C. Because testing required fluids diluted to a 10°C buffer, fluid samples were prepared with freeze points of -9°C, -20°C, and -35°C, respectively. Attempts were made to conduct tests at the LOUT for each fluid.
Due to procedural and logistical problems and complications related to maintaining chamber capabilities at extremely cold temperatures, -25°C was selected as the test temperature in cold conditions. No significant holdover time fluctuations were anticipated at a LOUT of -25°C due to the 10°C buffer. The information necessary for the preparation of the diluted Type I fluid samples is contained within Appendix E, and the procedure is described in Subsection 2.7.2.
The data from the Type fluid I tests (diluted to a 10°C buffer) conducted in 2000-01 are shown in Figures 4.57 to 4.62. For clarity, the regression curves for each of the Type I fluids have been omitted. It is important to note, however, that the regression method of analysis was used to determine the holdover times of the Type I fluids. The figures for each individual fluid, including the regression curves, appear in Appendix G.
Despite several changes that were made to the generic Type I table at the SAE G-12 Subcommittee meeting in Toulouse in May 2000, Transport Canada and the Federal Aviation Administration elected to publish the old Type I numbers in their tables for use during 2000-01 winter operations.
4.4.1 Freezing Drizzle The following is a cell-by-cell summary of the holdover time performance of all Type I fluid brands tested under conditions of simulated freezing drizzle. The results are arranged according to the sequence of temperature ranges (from top to bottom) that appear in the corresponding columns of the holdover time tables. Because it was not possible to simulate freezing drizzle above 0°C, the holdover time results for the category of precipitation above 0°C are identical to those in the range of 0°C to -10°C. 4.4.1.1 Type I diluted fluid, above 0°C and 0°C to -10°C, freezing drizzle
(Figure 4.57) The generic holdover times in this cell are 5 to 8 minutes. Two Type I fluids tested, Newave Aerochemical FCY-1A and the experimental Type I from Lyondell, both had holdover times similar to fluids tested during the 1999-2000 winter test season.

FIGURE 4.57EFFECT OF FLUID BRAND AND RATE OF PRECIPITATION ON ENDURANCE TIME
TYPE I DILUTED (10° BUFFER)FREEZING DRIZZLE AT -10°C
0
5
10
15
20
25
30
0 2 4 6 8 10 12 14 16 18 20 22 24 26 28 30
Rate of Precipitation (g/dm²/h)
Flui
d Fa
ilure
Tim
e (m
inut
es)
LYONDELL ARCO PLUS-ST
NEWAVE FCY-1A
Winter 1999-2000 Data
Current Generic HOT (above 0°C)
Current Generic HOT (0 to -10°C)
# of Tests = 32
213CM1680(exBM3833)\Analysis\HOT\CS,ZD,ZF,ZR\Charts for all conditions\ZD - Combined Charts
At: 10°Charts
4. HOLDOVER TIME TABLES, RESULTS, AND DISCUSSIONS
X:\@APS ARCHIVE\CM1680 (exBM3833) TC-Deicing 00-01 (REPORTS ONLY)\Reports\HOT\Final Version 1.0\Final Version 1.0.doc Final Version 1.0
August 05 APS AVIATION INC.
214
4.4.2 Light Freezing Rain The following is a cell-by-cell summary of the holdover time performance of the new Type I fluids tested under conditions of simulated light freezing rain. Because it was not possible to simulate freezing precipitation above 0°C, the holdover time results for the category of precipitation above 0°C are identical to those in the range of 0°C to -10°C.
4.4.2.1 Type I diluted fluid, above 0°C and 0ºC to -10°C, light freezing rain
(Figure 4.58) The generic holdover times of 2 to 5 minutes in these cells are appropriate, based on the results of the recent Type I tests. Both of the Type I fluids exhibit similar holdover times. 4.4.3 Freezing Fog The freezing fog category is divided into three cells. The data were collected under precipitation rates of 2 and 5 g/dm2/h. Failure times were measured at two temperatures: -10°C and -25°C. Although it was not possible to create freezing fog at temperatures above 0°C, the holdover times in the Type I holdover time tables differ in the two temperature ranges, above 0°C and 0°C to -10°C.
4.4.3.1 Type I diluted fluid, above 0°C, freezing fog No testing was conducted during the past year in this temperature range, since it was not possible to generate freezing fog at temperatures above 0°C. 4.4.3.2 Type I diluted fluid, 0°C to -10°C, freezing fog (Figure 4.59) At the SAE G-12 Holdover Time Subcommittee meeting in Toulouse, the holdover time range in this cell was reduced to 6 - 11 min, based on the results from testing in July 1999. All the fluids tested in April 2001 exhibited a holdover time performance in excess of the new generic values.

FIGURE 4.58EFFECT OF FLUID BRAND AND RATE OF PRECIPITATION ON ENDURANCE TIME
TYPE I DILUTED (10° BUFFER)LIGHT FREEZING RAIN AT -10° C
0
5
10
15
20
25
30
0 2 4 6 8 10 12 14 16 18 20 22 24 26 28 30
Rate of Precipitation (g/dm²/h)
Flui
d Fa
ilure
Tim
e (m
inut
es)
LYONDELL ARCO PLUS-STNEWAVE FCY-1AWinter 1999-2000 DataCurrent Generic HOT (above 0°C)Current Generic HOT (0 to -10°C)
# of Tests = 32
FIGURE 4.59EFFECT OF FLUID BRAND AND RATE OF PRECIPITATION ON ENDURANCE TIME
TYPE I DILUTED (10° BUFFER)FREEZING FOG AT -10° C
0
5
10
15
20
25
30
0 1 2 3 4 5 6 7 8 9 10
Rate of Precipitation (g/dm²/h)
Flui
d Fa
ilure
Tim
e (m
inut
es)
LYONDELL ARCO PLUS-ST
NEWAVE FCY-1A
Winter 1999-2000 Data
Current Generic HOT (0 to -10°C)
# of Tests = 32
215CM1680(exBM3833)\Analysis\HOT\CS,ZD,ZF,ZR\Charts for all conditions\ZR - Combined Charts
At: 10° chart
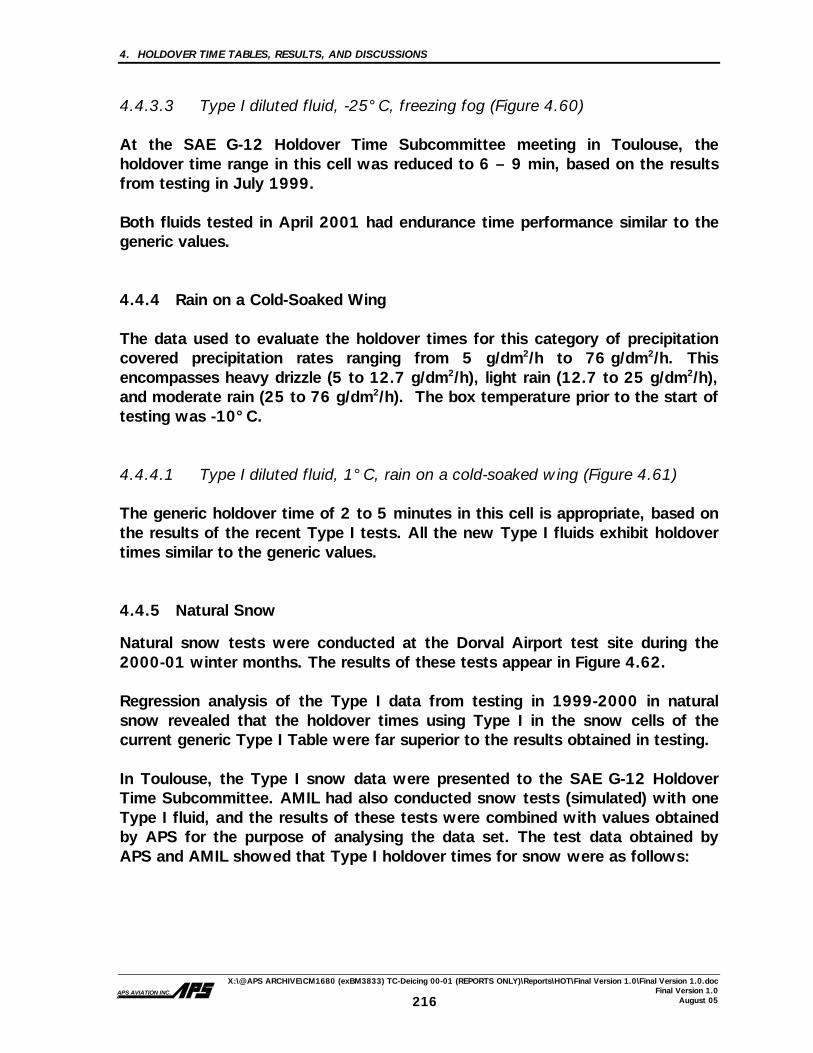
4. HOLDOVER TIME TABLES, RESULTS, AND DISCUSSIONS
X:\@APS ARCHIVE\CM1680 (exBM3833) TC-Deicing 00-01 (REPORTS ONLY)\Reports\HOT\Final Version 1.0\Final Version 1.0.doc Final Version 1.0
August 05 APS AVIATION INC.
216
4.4.3.3 Type I diluted fluid, -25°C, freezing fog (Figure 4.60)
At the SAE G-12 Holdover Time Subcommittee meeting in Toulouse, the holdover time range in this cell was reduced to 6 – 9 min, based on the results from testing in July 1999. Both fluids tested in April 2001 had endurance time performance similar to the generic values. 4.4.4 Rain on a Cold-Soaked Wing The data used to evaluate the holdover times for this category of precipitation covered precipitation rates ranging from 5 g/dm2/h to 76 g/dm2/h. This encompasses heavy drizzle (5 to 12.7 g/dm2/h), light rain (12.7 to 25 g/dm2/h), and moderate rain (25 to 76 g/dm2/h). The box temperature prior to the start of testing was -10°C. 4.4.4.1 Type I diluted fluid, 1°C, rain on a cold-soaked wing (Figure 4.61) The generic holdover time of 2 to 5 minutes in this cell is appropriate, based on the results of the recent Type I tests. All the new Type I fluids exhibit holdover times similar to the generic values. 4.4.5 Natural Snow
Natural snow tests were conducted at the Dorval Airport test site during the 2000-01 winter months. The results of these tests appear in Figure 4.62.
Regression analysis of the Type I data from testing in 1999-2000 in natural snow revealed that the holdover times using Type I in the snow cells of the current generic Type I Table were far superior to the results obtained in testing.
In Toulouse, the Type I snow data were presented to the SAE G-12 Holdover Time Subcommittee. AMIL had also conducted snow tests (simulated) with one Type I fluid, and the results of these tests were combined with values obtained by APS for the purpose of analysing the data set. The test data obtained by APS and AMIL showed that Type I holdover times for snow were as follows:
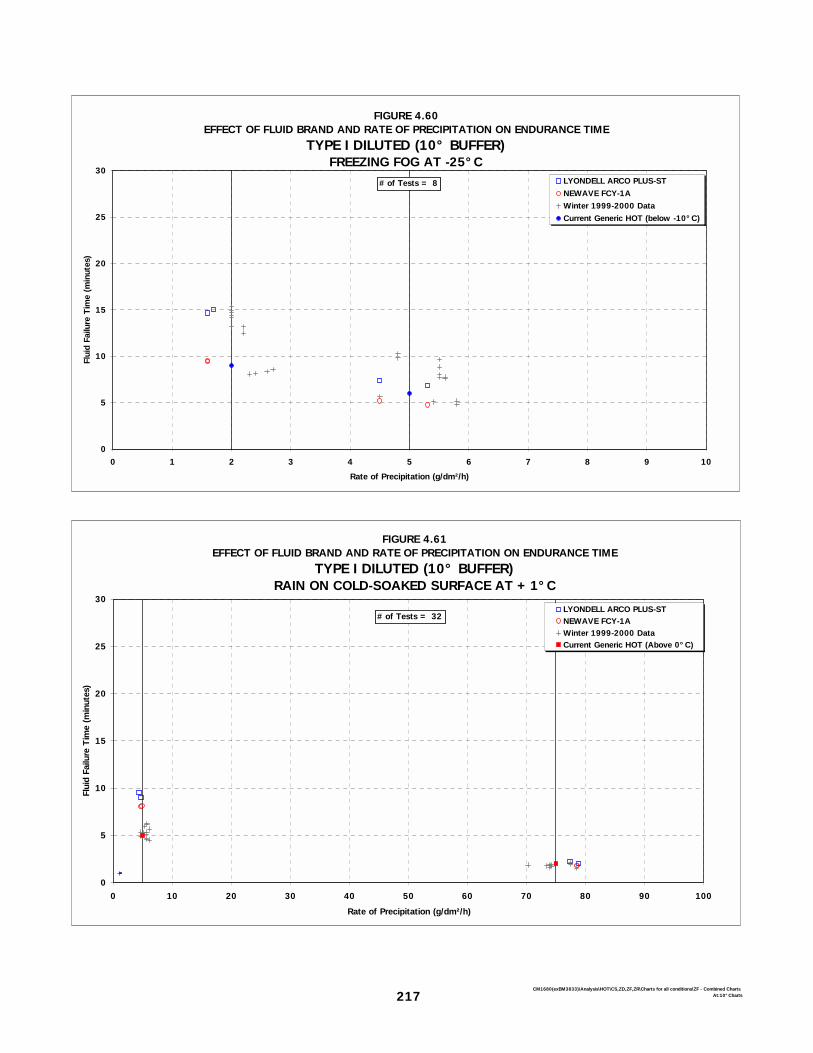
FIGURE 4.60EFFECT OF FLUID BRAND AND RATE OF PRECIPITATION ON ENDURANCE TIME
TYPE I DILUTED (10° BUFFER)FREEZING FOG AT -25°C
0
5
10
15
20
25
30
0 1 2 3 4 5 6 7 8 9 10
Rate of Precipitation (g/dm²/h)
Flui
d Fa
ilure
Tim
e (m
inut
es)
LYONDELL ARCO PLUS-STNEWAVE FCY-1AWinter 1999-2000 DataCurrent Generic HOT (below -10°C)
# of Tests = 8
FIGURE 4.61EFFECT OF FLUID BRAND AND RATE OF PRECIPITATION ON ENDURANCE TIME
TYPE I DILUTED (10° BUFFER)RAIN ON COLD-SOAKED SURFACE AT +1°C
0
5
10
15
20
25
30
0 10 20 30 40 50 60 70 80 90 100
Rate of Precipitation (g/dm²/h)
Flui
d Fa
ilure
Tim
e (m
inut
es)
LYONDELL ARCO PLUS-STNEWAVE FCY-1AWinter 1999-2000 DataCurrent Generic HOT (Above 0°C)
# of Tests = 32
217CM1680(exBM3833)\Analysis\HOT\CS,ZD,ZF,ZR\Charts for all conditions\ZF - Combined Charts
At:10°Charts
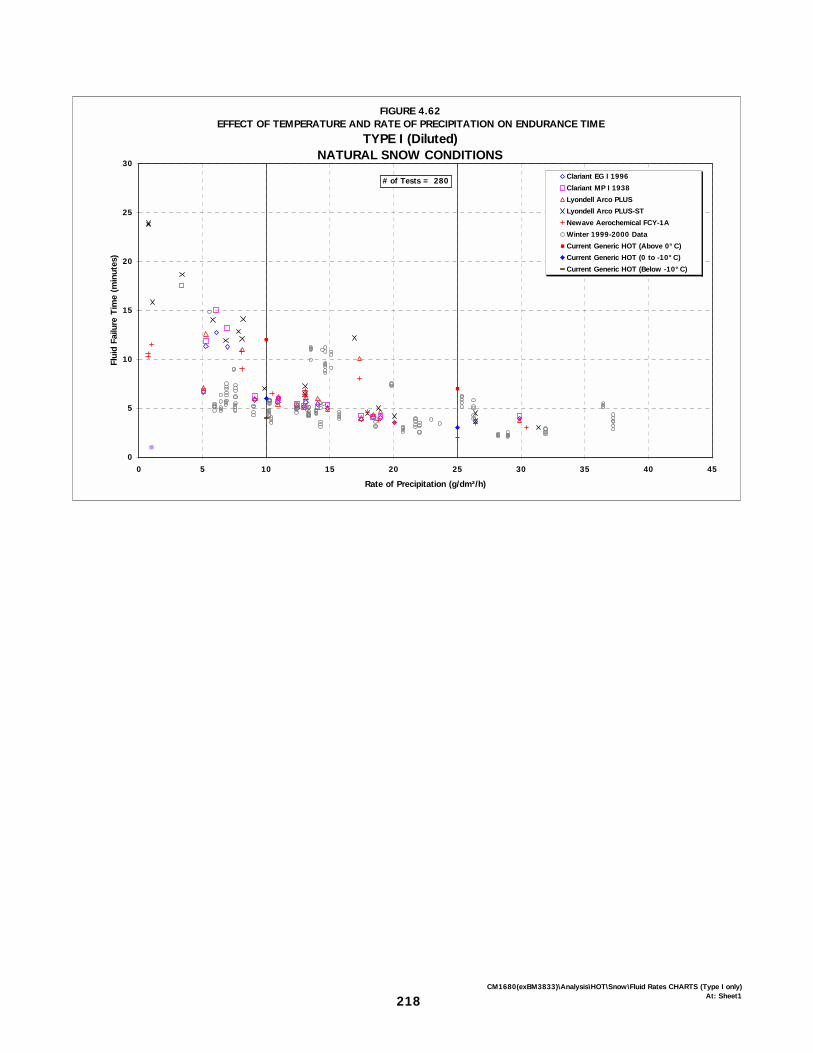
FIGURE 4.62EFFECT OF TEMPERATURE AND RATE OF PRECIPITATION ON ENDURANCE TIME
TYPE I (Diluted)NATURAL SNOW CONDITIONS
0
5
10
15
20
25
30
0 5 10 15 20 25 30 35 40 45
Rate of Precipitation (g/dm²/h)
Flui
d Fa
ilure
Tim
e (m
inut
es)
Clariant EG I 1996
Clariant MP I 1938
Lyondell Arco PLUS
Lyondell Arco PLUS-ST
Newave Aerochemical FCY-1A
Winter 1999-2000 Data
Current Generic HOT (Above 0°C)
Current Generic HOT (0 to -10°C)
Current Generic HOT (Below -10°C)
# of Tests = 280
218CM1680(exBM3833)\Analysis\HOT\Snow\Fluid Rates CHARTS (Type I only)
At: Sheet1

4. HOLDOVER TIME TABLES, RESULTS, AND DISCUSSIONS
X:\@APS ARCHIVE\CM1680 (exBM3833) TC-Deicing 00-01 (REPORTS ONLY)\Reports\HOT\Final Version 1.0\Final Version 1.0.doc Final Version 1.0
August 05 APS AVIATION INC.
219
• 7 to 12 minutes for Type I above 0°C; • 3 to 6 minutes for Type I between 0°C and -10°C; and • 2 to 4 minutes for Type I fluid below -10°C.
After considerable discussion, it was decided that the new regression-generated holdover times for Type I fluid would be adopted in the various snow cells of the generic table, despite the fact that several members, including the co-chairs of the Holdover Time Subcommittee, were severely opposed to these changes. Because the holdover time of Type I fluid is influenced primarily by the heat of the fluid at application, many people believe that the new holdover times in the snow column are not indicative of real-life values.
In general, the endurance times of the Type I fluids tested in 2000-01 in natural snow conditions were similar to the results of 1999-2000 tests, which resulted in reductions to the snow column of the generic Type I table.
4.4.6 Overall Perspective on Type I Results In general, the Type I endurance time results from 2000-01 tests agree with the current generic Type I holdover time guidelines and were approved by the SAE G-12 Holdover Time Subcommittee meeting in Toulouse in May 2000.
4.5 Type III Fluid Type III fluid is a thickened anti-icing fluid that exhibits shear, flow, and anti-icing properties that lie between Type I and Type IV fluids. The fluid was designed specifically for use on aircraft with lower rotation speeds. The earliest holdover time tests with a Type III fluid were carried out during the 1991-92 season (see Transport Canada report TP 11454E [12]). The next series of Type III fluid tests were conducted during the 1992-93 season and are documented in Transport Canada report TP 11836E [13]. These data are somewhat obsolete, as the fluid tested is no longer commercially available. The Type III fluid data cited in TP 11836E were combined with 75/25 Type IV fluid data and provided the basis for a proposed Type III fluid holdover time table. The first holdover time table for Type III fluid appeared in 1996 in Transport Canada report TP 12896E [8]. The latest Type III fluid test data were acquired during the 1996-97 test season using one fluid from one fluid manufacturer. The Type III fluid data were subject to the same regression method of analysis used to determine holdover

4. HOLDOVER TIME TABLES, RESULTS, AND DISCUSSIONS
X:\@APS ARCHIVE\CM1680 (exBM3833) TC-Deicing 00-01 (REPORTS ONLY)\Reports\HOT\Final Version 1.0\Final Version 1.0.doc Final Version 1.0
August 05 APS AVIATION INC.
220
times for Type IV fluids. The Type III fluid used in the 1996-97 holdover time tests has since been removed from the market. No Type III fluids were available during the past test season and, therefore, no testing with Type III fluids was performed by APS. A Type III holdover time table does exist; however, no qualified Type III fluids are currently available. The values in the Type III table would need to be substantiated if new fluids become available.
4.6 Official Holdover Time Tables for 2001-02 The officially accepted generic holdover time tables for Type I, Type II, and Type IV fluids are presented in this section. These tables are proposed for use worldwide during the 2001-02 winter season. The viscosity of the fluid sample used in holdover time testing, as measured by APS personnel, appears on the fluid-specific holdover time table for any given anti-icing fluid. The instrument spindle, chamber size, temperature, and rpm are documented with the viscosity measurement. For the fluid-specific values of a fluid to be valid, operators must ensure that the viscosity of the fluid used is superior to the published viscosity of that fluid, and use the same published viscosity measurement method. Table 4.62 presents the accepted generic holdover time guidelines for Type I fluids and provides a summary of the material discussed in Subsection 4.4. Because it is believed that the holdover time of Type I fluid is influenced primarily by the heat of the fluid at application and the thermal mass of the receiving wing, the regulatory agencies contend that the new generic holdover times in the snow column are not indicative of real-life values. Table 4.62 displays the holdover time guidelines for Type I fluids published by Transport Canada for use in 2001-02 winter operations. Table 4.64 presents the accepted holdover time table for generic Type II fluids and provides a summary of the material discussed in Subsection 4.3. The fluid-specific holdover time tables for Kilfrost ABC-II Plus, Clariant MP II 1951, and SPCA Ecowing 26 are given in Tables 4.65, 4.66, and 4.67, respectively. There are eight Type IV fluid holdover time tables. The new generic Type IV fluid holdover time table is provided in Table 4.66. Tables 4.69 to 4.76 display the fluid-specific Type IV holdover time tables and correspond to Clariant Safewing MPIV 1957, Clariant Safewing MPIV 2001, Clariant Safewing Four, Clariant Safewing MP IV 2012 Protect, Kilfrost ABC-S, Octagon Max-Flight,

4. HOLDOVER TIME TABLES, RESULTS, AND DISCUSSIONS
X:\@APS ARCHIVE\CM1680 (exBM3833) TC-Deicing 00-01 (REPORTS ONLY)\Reports\HOT\Final Version 1.0\Final Version 1.0.doc Final Version 1.0
August 05 APS AVIATION INC.
221
SPCA AD-480, and Union Carbide Ultra+ fluids, respectively. These tables provide a summary of the material presented in Section 4.2. The Transport Canada and FAA generic and fluid-specific holdover time guidelines are found in Appendices I and J. This section includes the same tables but in a format that facilitates viewing of the individual holdover time cells. This format contains only a small portion of the notes listed at the bottom of the tables intended for official use.
4.6.1 Methodology to Re-Categorize Fluid Holdover Time Tables As new products are constantly being introduced into the market, the number of fluid-specific tables continues to increase. This has caused some concern in the industry. In addition, the generic fluid holdover time guidelines are annually changed to encompass the new fluids that are introduced into the market. APS conducted a preliminary evaluation in 2001 aimed at providing a method that would reduce the number of holdover time guidelines that exist in the industry. This preliminary evaluation appears in Appendix L.
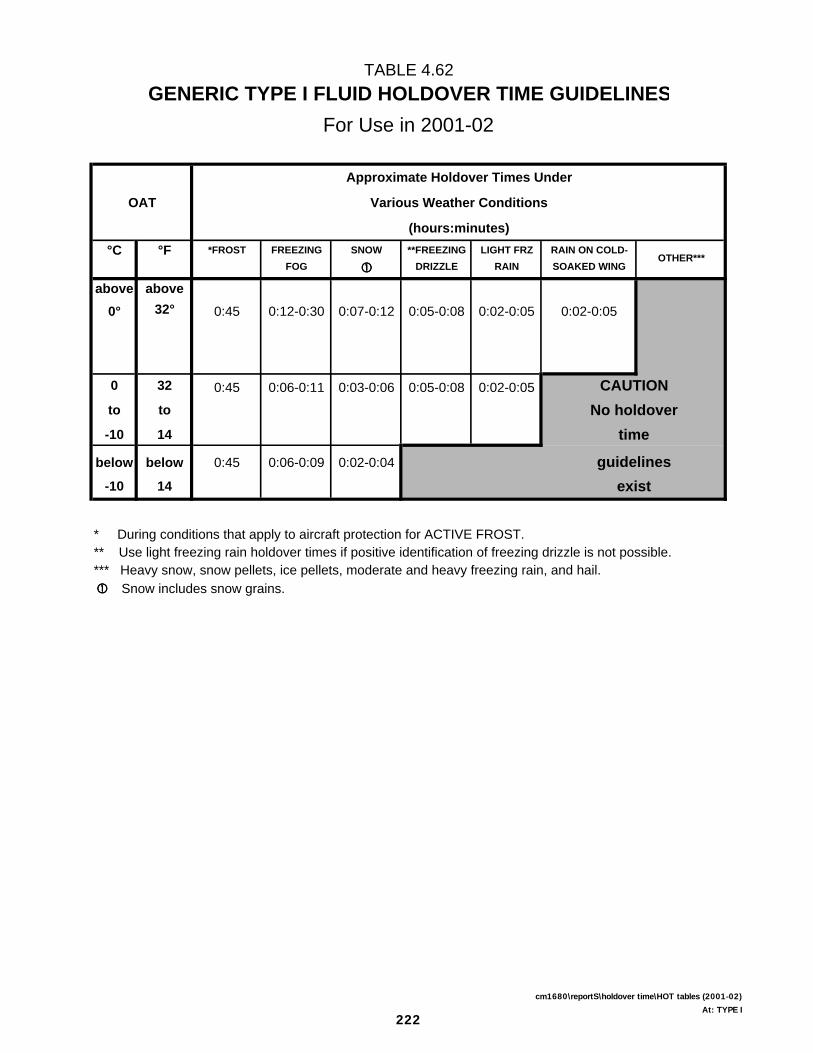
TABLE 4.62GENERIC TYPE I FLUID HOLDOVER TIME GUIDELINES
For Use in 2001-02
Approximate Holdover Times Under
OAT Various Weather Conditions
(hours:minutes)°C °F *FROST FREEZING SNOW **FREEZING LIGHT FRZ RAIN ON COLD-
FOG ���� DRIZZLE RAIN SOAKED WING
above above0° 32° 0:45 0:12-0:30 0:07-0:12 0:05-0:08 0:02-0:05 0:02-0:05
0 32 0:45 0:06-0:11 0:03-0:06 0:05-0:08 0:02-0:05 CAUTIONto to No holdover-10 14 time
below below 0:45 0:06-0:09 0:02-0:04 guidelines-10 14 exist
* During conditions that apply to aircraft protection for ACTIVE FROST.** Use light freezing rain holdover times if positive identification of freezing drizzle is not possible.*** Heavy snow, snow pellets, ice pellets, moderate and heavy freezing rain, and hail.���� Snow includes snow grains.
OTHER***
222
cm1680\reportS\holdover time\HOT tables (2001-02)
At: TYPE I
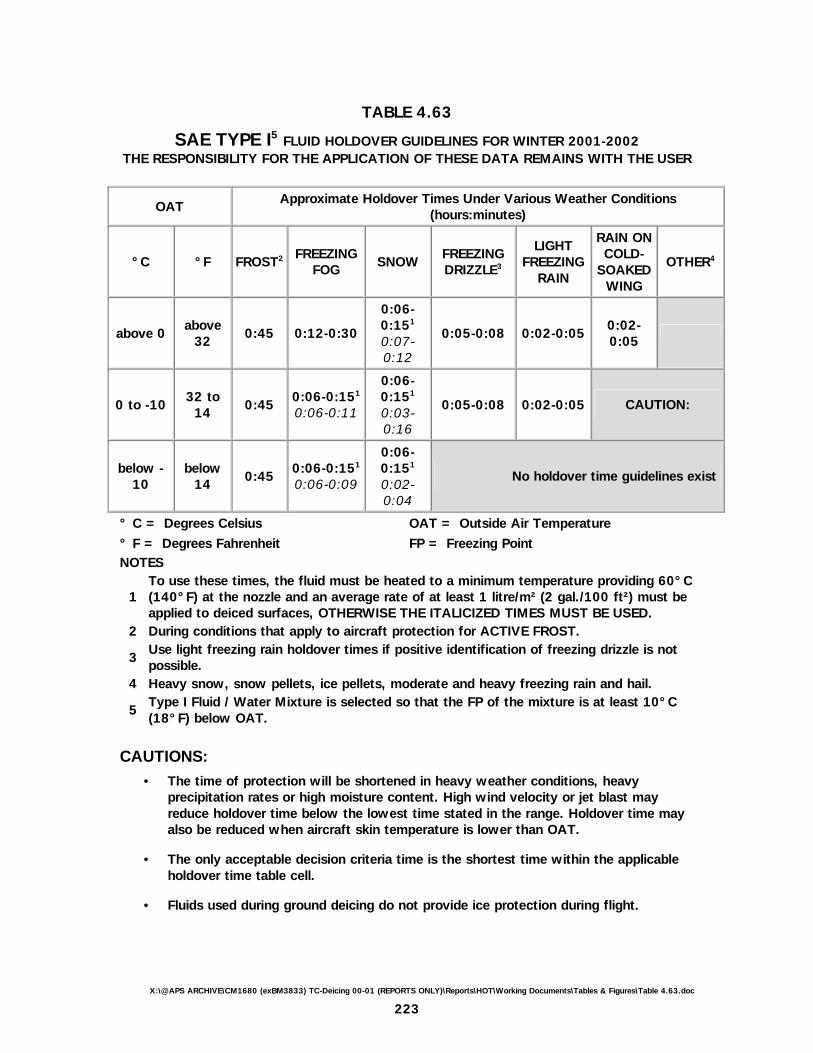
X:\@APS ARCHIVE\CM1680 (exBM3833) TC-Deicing 00-01 (REPORTS ONLY)\Reports\HOT\Working Documents\Tables & Figures\Table 4.63.doc
223
TABLE 4.63
SAE TYPE I5 FLUID HOLDOVER GUIDELINES FOR WINTER 2001-2002 THE RESPONSIBILITY FOR THE APPLICATION OF THESE DATA REMAINS WITH THE USER
OAT Approximate Holdover Times Under Various Weather Conditions (hours:minutes)
°C °F FROST2 FREEZING FOG SNOW FREEZING
DRIZZLE3 LIGHT
FREEZING RAIN
RAIN ON COLD-
SOAKED WING
OTHER4
above 0 above 32 0:45 0:12-0:30
0:06-0:151 0:07-0:12
0:05-0:08 0:02-0:05 0:02-0:05
0 to -10 32 to 14 0:45 0:06-0:151
0:06-0:11
0:06-0:151 0:03-0:16
0:05-0:08 0:02-0:05 CAUTION:
below -10
below 14 0:45 0:06-0:151
0:06-0:09
0:06-0:151 0:02-0:04
No holdover time guidelines exist
° C = Degrees Celsius OAT = Outside Air Temperature ° F = Degrees Fahrenheit FP = Freezing Point NOTES
1 To use these times, the fluid must be heated to a minimum temperature providing 60°C (140°F) at the nozzle and an average rate of at least 1 litre/m² (2 gal./100 ft²) must be applied to deiced surfaces, OTHERWISE THE ITALICIZED TIMES MUST BE USED.
2 During conditions that apply to aircraft protection for ACTIVE FROST.
3 Use light freezing rain holdover times if positive identification of freezing drizzle is not possible.
4 Heavy snow, snow pellets, ice pellets, moderate and heavy freezing rain and hail.
5 Type I Fluid / Water Mixture is selected so that the FP of the mixture is at least 10°C (18°F) below OAT.
CAUTIONS:
• The time of protection will be shortened in heavy weather conditions, heavy precipitation rates or high moisture content. High wind velocity or jet blast may reduce holdover time below the lowest time stated in the range. Holdover time may also be reduced when aircraft skin temperature is lower than OAT.
• The only acceptable decision criteria time is the shortest time within the applicable holdover time table cell.
• Fluids used during ground deicing do not provide ice protection during flight.

TABLE 4.64GENERIC TYPE II FLUID HOLDOVER TIME GUIDELINES
For Use in 2001-02
Approximate Holdover Times Under
OAT SAE Type II Fluid Various Weather Conditions
Concentration (hours:minutes)°C °F Neat-Fluid/Water *FROST FREEZING SNOW ***FREEZING LIGHT FRZ RAIN ON COLD- OTHER****
(Vol%/Vol%) FOG ���� DRIZZLE RAIN SOAKED WING
100/0 12:00 0:35-1:30 0:20-0:55 0:30-0:55 0:15-0:30 0:05-0:40
above above 75/25 6:00 0:25-1:00 0:15-0:40 0:20-0:45 0:10-0:25 0:05-0:25
0° 32° 50/50 4:00 0:15-0:30 0:05-0:15 0:05-0:15 0:05-0:10
100/0 8:00 0:35-1:30 0:20-0:45 0:30-0:55 0:15-0:30
CAUTION0 32 75/25 5:00 0:25-1:00 0:15-0:30 0:20-0:45 0:10-0:25to to No holdover-3 27 50/50 3:00 0:15-0:30 0:05-0:15 0:05-0:15 0:05-0:10
timebelow below 100/0 8:00 0:20-1:05 0:15-0:35 **0:15-0:45 **0:10-0:25
-3 27 guidelinesto to 75/25 5:00 0:20-0:55 0:15-0:25 **0:15-0:30 **0:10-0:20-14 7 exist
below below
-14 7 100/0 8:00 0:15-0:20 0:15-0:30
to to-25 -13
below below SAE TYPE II fluid may be used below -25ºC (-13ºF), provided the freezing point of the
-25 -13 100/0 fluid is at least 7ºC (13ºF) below the OAT and the aerodynamic acceptance criteria are
met. Consider use of SAE Type I when SAE Type II fluid cannot be used.
* During conditions that apply to aircraft protection for ACTIVE FROST.** The lowest use temperature is limited to -10ºC (14ºF).*** Use light freezing rain holdover times if positive identification of freezing drizzle is not possible.**** Heavy snow, snow pellets, ice pellets, moderate and heavy freezing rain, and hail.���� Snow includes snow grains.
224CM1680/reports/holdover time/HOT tables (2001-02)
At: SAE TYPE II

TABLE 4.65"FLUID-SPECIFIC " TYPE II FLUID HOLDOVER TIME GUIDELINES FOR 2001-02
KILFROST ABC-II PLUSViscosity of Neat 100% Fluid Tested 3 600 cP
20°C, 0.3 rpm, Spindle LV2, 250 mL beaker, 150 mL fluid, 10 min, guard legApproximate Holdover Times Anticipated Under
OAT Type II Fluid Various Weather ConditionsConcentration (hours:minutes)
°C °F Neat-Fluid/Water *FROST FREEZING SNOW ***FREEZING LIGHT FRZ RAIN ON COLD OTHER****
(% by volume) FOG ���� DRIZZLE RAIN SOAKED WING
100/0 12:00 1:10-2:25 0:35-1:20 0:35-1:10 0:30-0:40 0:05-1:00
above above 75/25 6:00 1:10-2:25 0:35-1:10 0:30-1:00 0:20-0:40 0:05-0:50
0º 32º
50/50 4:00 0:15-0:45 0:20-0:40 0:05-0:25 0:05-0:15
100/0 8:00 1:10-2:25 0:25-0:55 0:35-1:10 0:30-0:40
CAUTION0 32 75/25 5:00 1:10-2:25 0:25-0:50 0:30-1:00 0:20-0:40
to to No holdover-3 27 50/50 3:00 0:15-0:45 0:15-0:35 0:05-0:25 0:05-0:15
timebelow below 100/0 8:00 0:30-1:05 0:15-0:35 **0:15-0:45 **0:10-0:30
-3 27 guidelinesto to 75/25 5:00 0:20-0:55 0:15-0:35 **0:15-0:30 **0:10-0:20-14 7 exist
below below-14 7 100/0 8:00 0:15-0:20 0:15-0:30
to to-25 -13
below below SAE TYPE II fluid may be used below -25ºC (-13ºF) provided the freezing point of the-25 -13 100/0 fluid is at least 7ºC (13ºF) below the OAT and the aerodynamic acceptance criteria are
met. Consider use of SAE Type I when SAE Type II fluid cannot be used.
* During conditions that apply to aircraft protection for ACTIVE FROST.** The lowest use temperature is limited to -10ºC (14ºF).*** Use light freezing rain holdover times if positive identification of freezing drizzle is not possible.**** Heavy snow, snow pellets, ice pellets, moderate and heavy freezing rain, and hail.� Snow includes snow grains.
225cm1680\reports/holdover time\HOT tables (2001-02)
At:Kilfrost ABC-II HOT

TABLE 4.66"FLUID-SPECIFIC " TYPE II FLUID HOLDOVER TIME GUIDELINES FOR 2001-02
CLARIANT SAFEWING MPII 1951Viscosity of Neat 100% Fluid Tested 8 700 cP
20°C, 0.3 rpm, Spindle SC4-34/13R, 10 mL fluid, 15 minApproximate Holdover Times Anticipated Under
OAT Type IV Fluid Various Weather ConditionsConcentration (hours:minutes)
°C °F Neat-Fluid/Water *FROST FREEZING SNOW ***FREEZING LIGHT FRZ RAIN ON COLD- OTHER****
(% by volume) FOG ���� DRIZZLE RAIN SOAKED WING
100/0 12:00 0:55-1:40 0:30-0:55 0:35-0:55 0:20-0:30 0:10-0:50
above above 75/25 6:00 0:45-1:15 0:20-0:40 0:25-0:45 0:15-0:25 0:05-0:40
0º 32º
50/50 4:00 0:20-0:30 0:05-0:20 0:05-0:15 0:05-0:10
100/0 8:00 0:55-1:40 0:25-0:45 0:35-0:55 0:20-0:30
CAUTION0 32 75/25 5:00 0:45-1:15 0:15-0:35 0:25-0:45 0:15-0:25
to to No holdover-3 27 50/50 3:00 0:20-0:30 0:05-0:15 0:05-0:15 0:05-0:10
timebelow below 100/0 8:00 0:45-1:25 0:20-0:40 **0:25-0:50 **0:15-0:30
-3 27 guidelinesto to 75/25 5:00 0:35-1:00 0:15-0:25 **0:20-0:35 **0:15-0:20-14 7 exist
below below-14 7 100/0 8:00 0:20-0:40 0:20-0:35
to to-25 -13
below below SAE TYPE II fluid may be used below -25ºC (-13ºF), provided the freezing point of the
-25 -13 100/0 fluid is at least 7ºC (13ºF) below the OAT and the aerodynamic acceptance criteria are
met. Consider use of SAE Type I when SAE Type II fluid cannot be used.
* During conditions that apply to aircraft protection for ACTIVE FROST.** The lowest use temperature is limited to -10ºC (14ºF).*** Use light freezing rain holdover times if positive identification of freezing drizzle is not possible.**** Heavy snow, snow pellets, ice pellets, moderate and heavy freezing rain, and hail.� Snow includes snow grains.
226cm1680/reports/holdover time/HOT tables (2001-02)
At: Clariant 1951
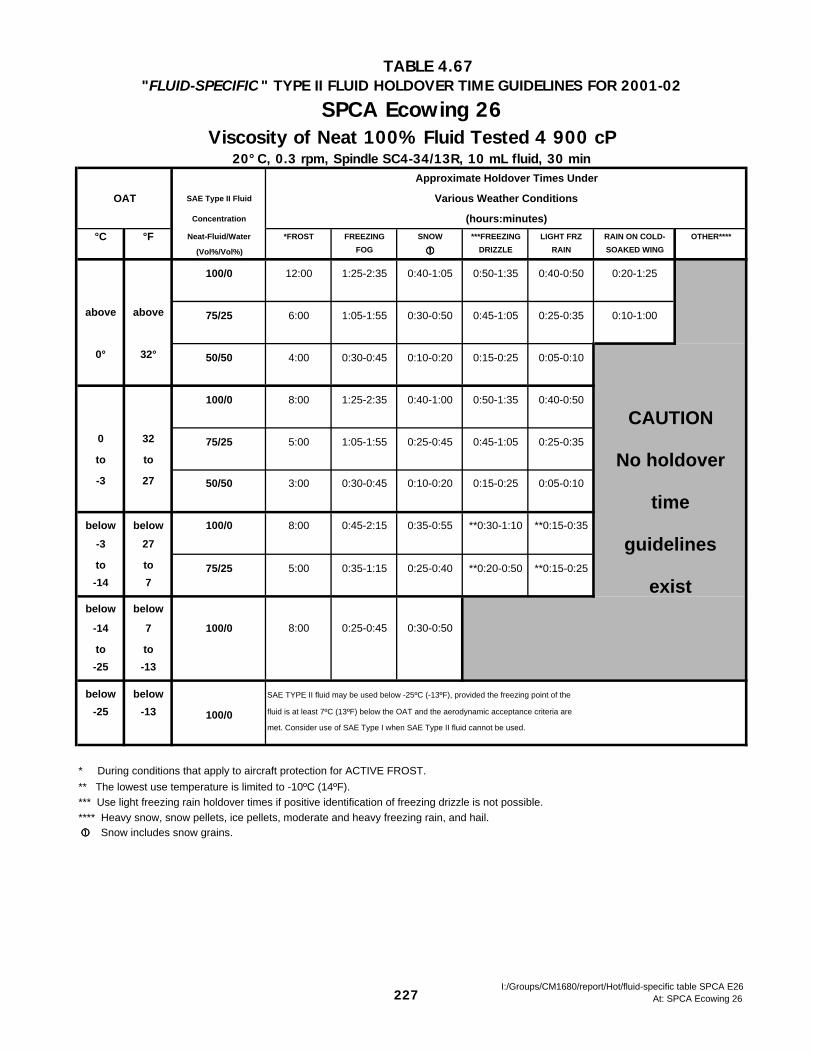
TABLE 4.67"FLUID-SPECIFIC " TYPE II FLUID HOLDOVER TIME GUIDELINES FOR 2001-02
SPCA Ecowing 26Viscosity of Neat 100% Fluid Tested 4 900 cP
20°C, 0.3 rpm, Spindle SC4-34/13R, 10 mL fluid, 30 minApproximate Holdover Times Under
OAT SAE Type II Fluid Various Weather Conditions
Concentration (hours:minutes)°C °F Neat-Fluid/Water *FROST FREEZING SNOW ***FREEZING LIGHT FRZ RAIN ON COLD- OTHER****
(Vol%/Vol%) FOG ���� DRIZZLE RAIN SOAKED WING
100/0 12:00 1:25-2:35 0:40-1:05 0:50-1:35 0:40-0:50 0:20-1:25
above above 75/25 6:00 1:05-1:55 0:30-0:50 0:45-1:05 0:25-0:35 0:10-1:00
0° 32° 50/50 4:00 0:30-0:45 0:10-0:20 0:15-0:25 0:05-0:10
100/0 8:00 1:25-2:35 0:40-1:00 0:50-1:35 0:40-0:50
CAUTION0 32 75/25 5:00 1:05-1:55 0:25-0:45 0:45-1:05 0:25-0:35to to No holdover-3 27 50/50 3:00 0:30-0:45 0:10-0:20 0:15-0:25 0:05-0:10
timebelow below 100/0 8:00 0:45-2:15 0:35-0:55 **0:30-1:10 **0:15-0:35
-3 27 guidelinesto to 75/25 5:00 0:35-1:15 0:25-0:40 **0:20-0:50 **0:15-0:25-14 7 exist
below below
-14 7 100/0 8:00 0:25-0:45 0:30-0:50
to to-25 -13
below below SAE TYPE II fluid may be used below -25ºC (-13ºF), provided the freezing point of the
-25 -13 100/0 fluid is at least 7ºC (13ºF) below the OAT and the aerodynamic acceptance criteria are
met. Consider use of SAE Type I when SAE Type II fluid cannot be used.
* During conditions that apply to aircraft protection for ACTIVE FROST.** The lowest use temperature is limited to -10ºC (14ºF).*** Use light freezing rain holdover times if positive identification of freezing drizzle is not possible.**** Heavy snow, snow pellets, ice pellets, moderate and heavy freezing rain, and hail.���� Snow includes snow grains.
227I:/Groups/CM1680/report/Hot/fluid-specific table SPCA E26
At: SPCA Ecowing 26

TABLE 4.68
GENERIC TYPE IV FLUID HOLDOVER TIME GUIDELINESFor Use in 2001-02
Approximate Holdover Times Anticipated Under
OAT Type IV Fluid Various Weather ConditionsConcentration (hours:minutes)
°C °F Neat-Fluid/Water *FROST FREEZING SNOW ***FREEZING LIGHT FRZ RAIN ON COLD- OTHER****
(% by volume) FOG ���� DRIZZLE RAIN SOAKED WING
100/0 18:00 1:05-2:15 0:35-1:05 0:40-1:10 0:25-0:40 0:10-0:50
above above 75/25 6:00 1:05-1:45 0:30-1:05 0:35-0:50 0:15-0:30 0:05-0:35
0º 32º
50/50 4:00 0:15-0:35 0:05-0:20 0:10-0:20 0:05-0:10
100/0 12:00 1:05-2:15 0:30-0:55 0:40-1:10 0:25-0:40
CAUTION0 32 75/25 5:00 1:05-1:45 0:25-0:50 0:35-0:50 0:15-0:30
to to No holdover-3 27 50/50 3:00 0:15-0:35 0:05-0:15 0:10-0:20 0:05-0:10
timebelow below 100/0 12:00 0:20-1:20 0:20-0:40 **0:20-0:45 **0:10-0:25
-3 27 guidelinesto to 75/25 5:00 0:25-0:50 0:15-0:25 0:15-0:30 **0:10-0:20-14 7 exist
below below-14 7 100/0 12:00 0:15-0:40 0:15-0:30
to to-25 -13
below below SAE TYPE IV fluid may be used below -25ºC (-13ºF), provided the freezing point-25 -13 100/0 of the fluid is at least 7ºC (13ºF) below the OAT and the aerodynamic acceptance
criteria are met. Consider use of SAE Type I when SAE Type IV fluid cannot be used.
* During conditions that apply to aircraft protection for ACTIVE FROST.** The lowest use temperature is limited to -10ºC (14ºF).*** Use light freezing rain holdover times if positive identification of freezing drizzle is not possible.**** Heavy snow, snow pellets, ice pellets, moderate and heavy freezing rain, and hail���� Snow includes snow grains.
228cm1680\reports\holdover time\SAE type4 2001_02
At:SAE Type IV
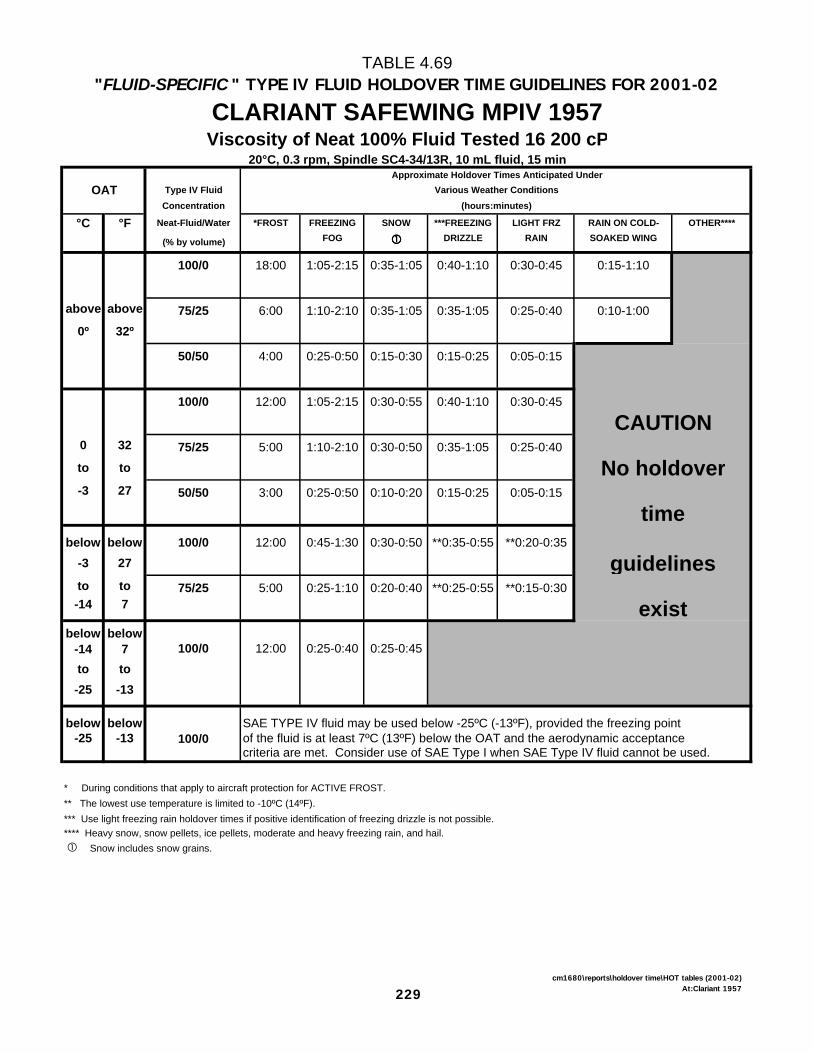
TABLE 4.69"FLUID-SPECIFIC " TYPE IV FLUID HOLDOVER TIME GUIDELINES FOR 2001-02
CLARIANT SAFEWING MPIV 1957Viscosity of Neat 100% Fluid Tested 16 200 cP
20°C, 0.3 rpm, Spindle SC4-34/13R, 10 mL fluid, 15 minApproximate Holdover Times Anticipated Under
OAT Type IV Fluid Various Weather ConditionsConcentration (hours:minutes)
°C °F Neat-Fluid/Water *FROST FREEZING SNOW ***FREEZING LIGHT FRZ RAIN ON COLD- OTHER****
(% by volume) FOG ���� DRIZZLE RAIN SOAKED WING
100/0 18:00 1:05-2:15 0:35-1:05 0:40-1:10 0:30-0:45 0:15-1:10
above above 75/25 6:00 1:10-2:10 0:35-1:05 0:35-1:05 0:25-0:40 0:10-1:00
0º 32º
50/50 4:00 0:25-0:50 0:15-0:30 0:15-0:25 0:05-0:15
100/0 12:00 1:05-2:15 0:30-0:55 0:40-1:10 0:30-0:45
CAUTION0 32 75/25 5:00 1:10-2:10 0:30-0:50 0:35-1:05 0:25-0:40
to to No holdover-3 27 50/50 3:00 0:25-0:50 0:10-0:20 0:15-0:25 0:05-0:15
timebelow below 100/0 12:00 0:45-1:30 0:30-0:50 **0:35-0:55 **0:20-0:35
-3 27 guidelinesto to 75/25 5:00 0:25-1:10 0:20-0:40 **0:25-0:55 **0:15-0:30-14 7 exist
below below-14 7 100/0 12:00 0:25-0:40 0:25-0:45
to to-25 -13
below below SAE TYPE IV fluid may be used below -25ºC (-13ºF), provided the freezing point-25 -13 100/0 of the fluid is at least 7ºC (13ºF) below the OAT and the aerodynamic acceptance
criteria are met. Consider use of SAE Type I when SAE Type IV fluid cannot be used.
* During conditions that apply to aircraft protection for ACTIVE FROST.** The lowest use temperature is limited to -10ºC (14ºF).*** Use light freezing rain holdover times if positive identification of freezing drizzle is not possible.**** Heavy snow, snow pellets, ice pellets, moderate and heavy freezing rain, and hail.� Snow includes snow grains.
229cm1680\reports\holdover time\HOT tables (2001-02)
At:Clariant 1957
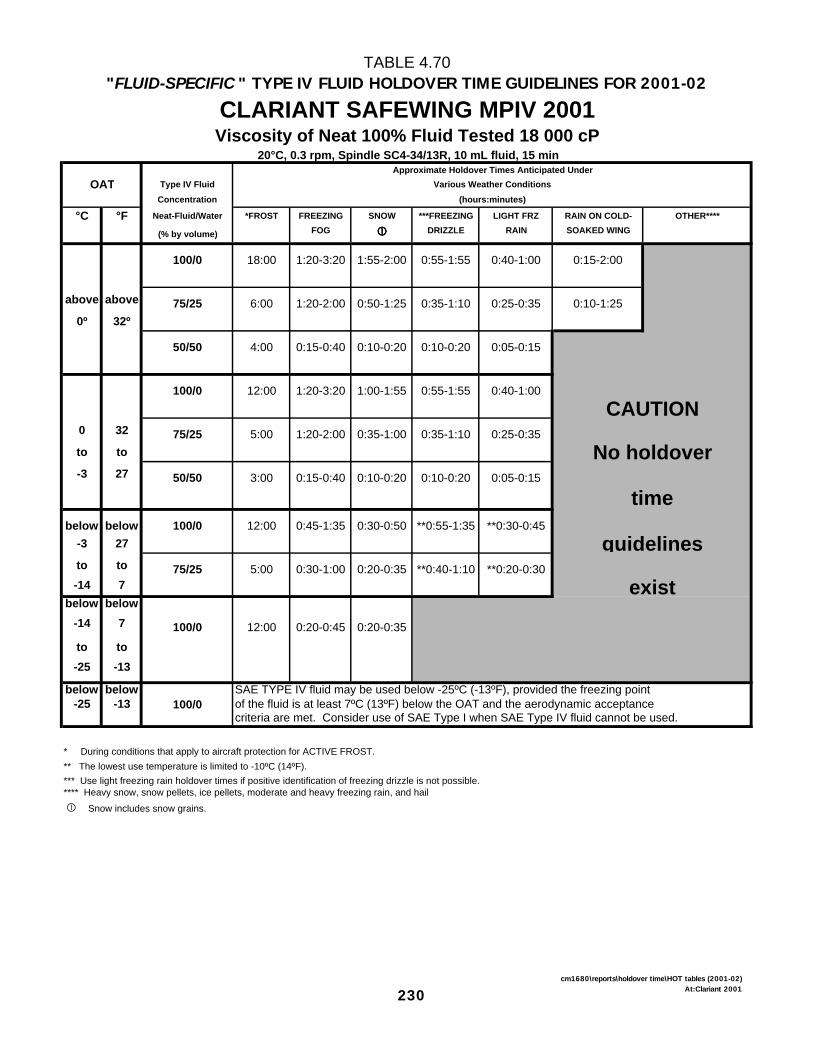
TABLE 4.70"FLUID-SPECIFIC " TYPE IV FLUID HOLDOVER TIME GUIDELINES FOR 2001-02
CLARIANT SAFEWING MPIV 2001Viscosity of Neat 100% Fluid Tested 18 000 cP
20°C, 0.3 rpm, Spindle SC4-34/13R, 10 mL fluid, 15 minApproximate Holdover Times Anticipated Under
OAT Type IV Fluid Various Weather ConditionsConcentration (hours:minutes)
°C °F Neat-Fluid/Water *FROST FREEZING SNOW ***FREEZING LIGHT FRZ RAIN ON COLD- OTHER****
(% by volume) FOG ���� DRIZZLE RAIN SOAKED WING
100/0 18:00 1:20-3:20 1:55-2:00 0:55-1:55 0:40-1:00 0:15-2:00
above above 75/25 6:00 1:20-2:00 0:50-1:25 0:35-1:10 0:25-0:35 0:10-1:250º 32º
50/50 4:00 0:15-0:40 0:10-0:20 0:10-0:20 0:05-0:15
100/0 12:00 1:20-3:20 1:00-1:55 0:55-1:55 0:40-1:00
CAUTION0 32 75/25 5:00 1:20-2:00 0:35-1:00 0:35-1:10 0:25-0:35to to No holdover-3 27 50/50 3:00 0:15-0:40 0:10-0:20 0:10-0:20 0:05-0:15
timebelow below 100/0 12:00 0:45-1:35 0:30-0:50 **0:55-1:35 **0:30-0:45
-3 27 guidelinesto to 75/25 5:00 0:30-1:00 0:20-0:35 **0:40-1:10 **0:20-0:30-14 7 exist
below below-14 7 100/0 12:00 0:20-0:45 0:20-0:35
to to-25 -13
below below SAE TYPE IV fluid may be used below -25ºC (-13ºF), provided the freezing point-25 -13 100/0 of the fluid is at least 7ºC (13ºF) below the OAT and the aerodynamic acceptance
criteria are met. Consider use of SAE Type I when SAE Type IV fluid cannot be used.
* During conditions that apply to aircraft protection for ACTIVE FROST.** The lowest use temperature is limited to -10ºC (14ºF).*** Use light freezing rain holdover times if positive identification of freezing drizzle is not possible.**** Heavy snow, snow pellets, ice pellets, moderate and heavy freezing rain, and hail
� Snow includes snow grains.
230cm1680\reports\holdover time\HOT tables (2001-02)
At:Clariant 2001
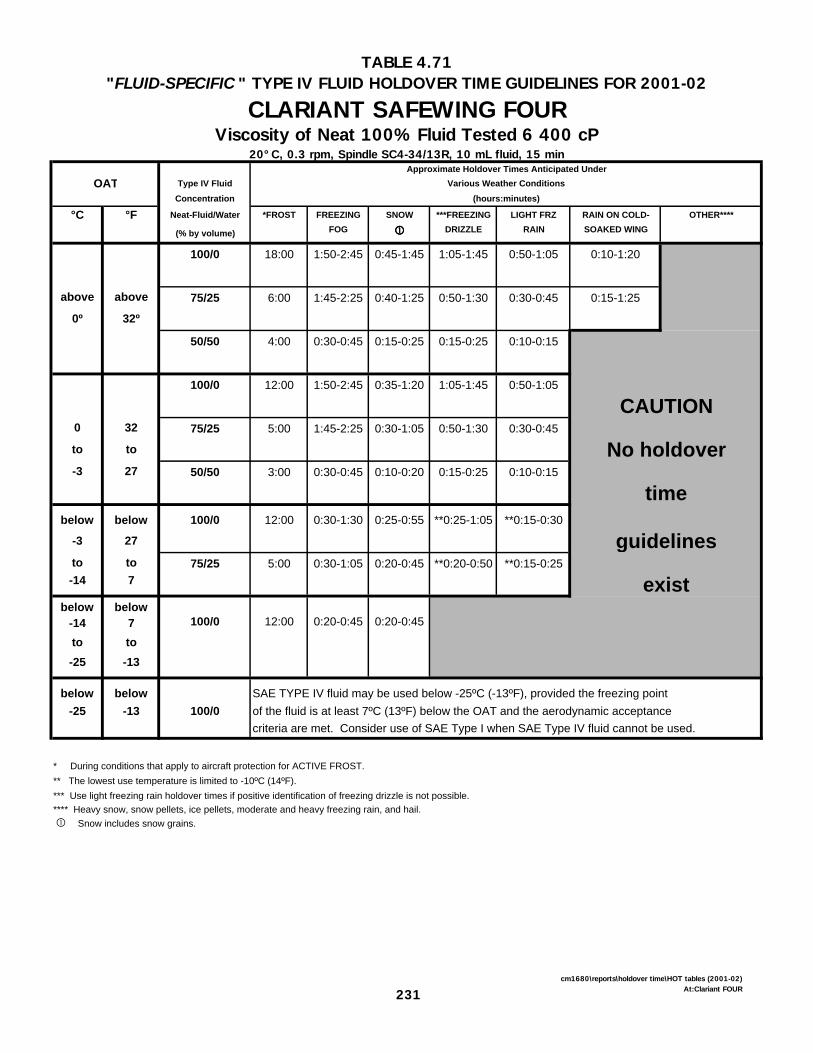
TABLE 4.71"FLUID-SPECIFIC " TYPE IV FLUID HOLDOVER TIME GUIDELINES FOR 2001-02
CLARIANT SAFEWING FOURViscosity of Neat 100% Fluid Tested 6 400 cP
20°C, 0.3 rpm, Spindle SC4-34/13R, 10 mL fluid, 15 minApproximate Holdover Times Anticipated Under
OAT Type IV Fluid Various Weather ConditionsConcentration (hours:minutes)
°C °F Neat-Fluid/Water *FROST FREEZING SNOW ***FREEZING LIGHT FRZ RAIN ON COLD- OTHER****
(% by volume) FOG ���� DRIZZLE RAIN SOAKED WING
100/0 18:00 1:50-2:45 0:45-1:45 1:05-1:45 0:50-1:05 0:10-1:20
above above 75/25 6:00 1:45-2:25 0:40-1:25 0:50-1:30 0:30-0:45 0:15-1:25
0º 32º
50/50 4:00 0:30-0:45 0:15-0:25 0:15-0:25 0:10-0:15
100/0 12:00 1:50-2:45 0:35-1:20 1:05-1:45 0:50-1:05
CAUTION0 32 75/25 5:00 1:45-2:25 0:30-1:05 0:50-1:30 0:30-0:45
to to No holdover-3 27 50/50 3:00 0:30-0:45 0:10-0:20 0:15-0:25 0:10-0:15
timebelow below 100/0 12:00 0:30-1:30 0:25-0:55 **0:25-1:05 **0:15-0:30
-3 27 guidelinesto to 75/25 5:00 0:30-1:05 0:20-0:45 **0:20-0:50 **0:15-0:25-14 7 exist
below below-14 7 100/0 12:00 0:20-0:45 0:20-0:45
to to-25 -13
below below SAE TYPE IV fluid may be used below -25ºC (-13ºF), provided the freezing point-25 -13 100/0 of the fluid is at least 7ºC (13ºF) below the OAT and the aerodynamic acceptance
criteria are met. Consider use of SAE Type I when SAE Type IV fluid cannot be used.
* During conditions that apply to aircraft protection for ACTIVE FROST.** The lowest use temperature is limited to -10ºC (14ºF).*** Use light freezing rain holdover times if positive identification of freezing drizzle is not possible.**** Heavy snow, snow pellets, ice pellets, moderate and heavy freezing rain, and hail.� Snow includes snow grains.
231cm1680\reports\holdover time\HOT tables (2001-02)
At:Clariant FOUR
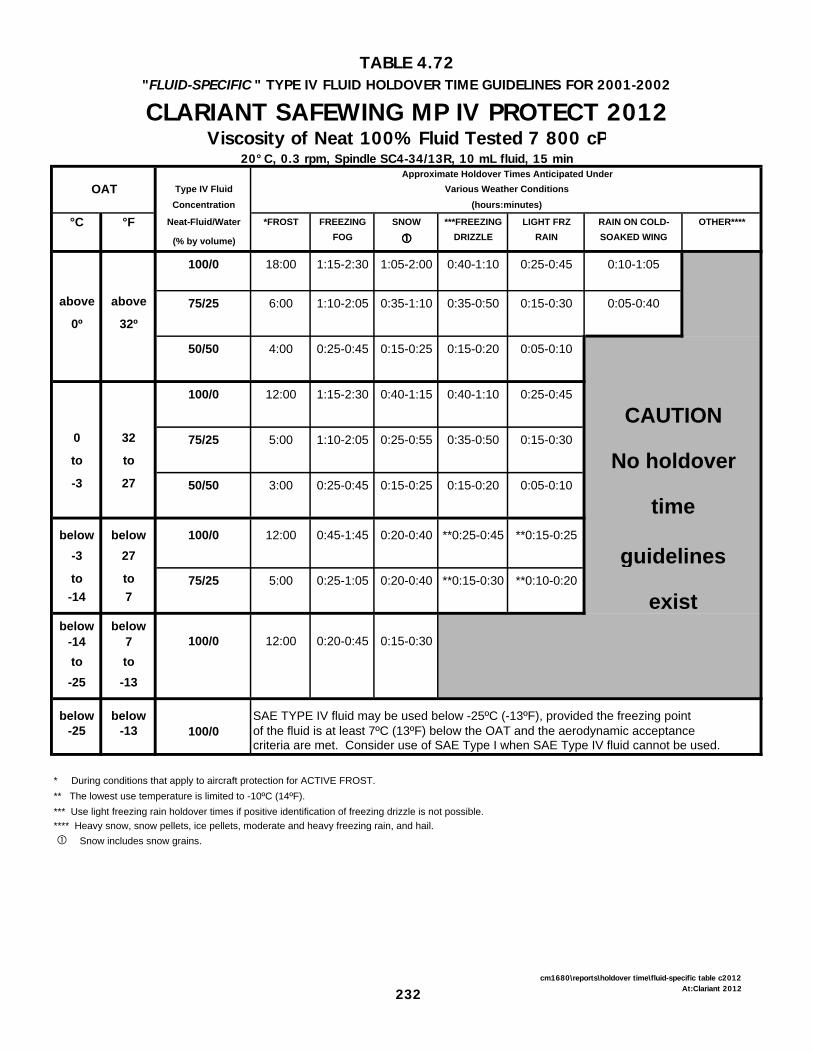
TABLE 4.72"FLUID-SPECIFIC " TYPE IV FLUID HOLDOVER TIME GUIDELINES FOR 2001-2002
CLARIANT SAFEWING MP IV PROTECT 2012Viscosity of Neat 100% Fluid Tested 7 800 cP
20°C, 0.3 rpm, Spindle SC4-34/13R, 10 mL fluid, 15 minApproximate Holdover Times Anticipated Under
OAT Type IV Fluid Various Weather ConditionsConcentration (hours:minutes)
°C °F Neat-Fluid/Water *FROST FREEZING SNOW ***FREEZING LIGHT FRZ RAIN ON COLD- OTHER****
(% by volume) FOG ���� DRIZZLE RAIN SOAKED WING
100/0 18:00 1:15-2:30 1:05-2:00 0:40-1:10 0:25-0:45 0:10-1:05
above above 75/25 6:00 1:10-2:05 0:35-1:10 0:35-0:50 0:15-0:30 0:05-0:40
0º 32º
50/50 4:00 0:25-0:45 0:15-0:25 0:15-0:20 0:05-0:10
100/0 12:00 1:15-2:30 0:40-1:15 0:40-1:10 0:25-0:45
CAUTION0 32 75/25 5:00 1:10-2:05 0:25-0:55 0:35-0:50 0:15-0:30
to to No holdover-3 27 50/50 3:00 0:25-0:45 0:15-0:25 0:15-0:20 0:05-0:10
timebelow below 100/0 12:00 0:45-1:45 0:20-0:40 **0:25-0:45 **0:15-0:25
-3 27 guidelinesto to 75/25 5:00 0:25-1:05 0:20-0:40 **0:15-0:30 **0:10-0:20-14 7 exist
below below-14 7 100/0 12:00 0:20-0:45 0:15-0:30
to to-25 -13
below below SAE TYPE IV fluid may be used below -25ºC (-13ºF), provided the freezing point-25 -13 100/0 of the fluid is at least 7ºC (13ºF) below the OAT and the aerodynamic acceptance
criteria are met. Consider use of SAE Type I when SAE Type IV fluid cannot be used.
* During conditions that apply to aircraft protection for ACTIVE FROST.** The lowest use temperature is limited to -10ºC (14ºF).*** Use light freezing rain holdover times if positive identification of freezing drizzle is not possible.**** Heavy snow, snow pellets, ice pellets, moderate and heavy freezing rain, and hail.� Snow includes snow grains.
232cm1680\reports\holdover time\fluid-specific table c2012
At:Clariant 2012
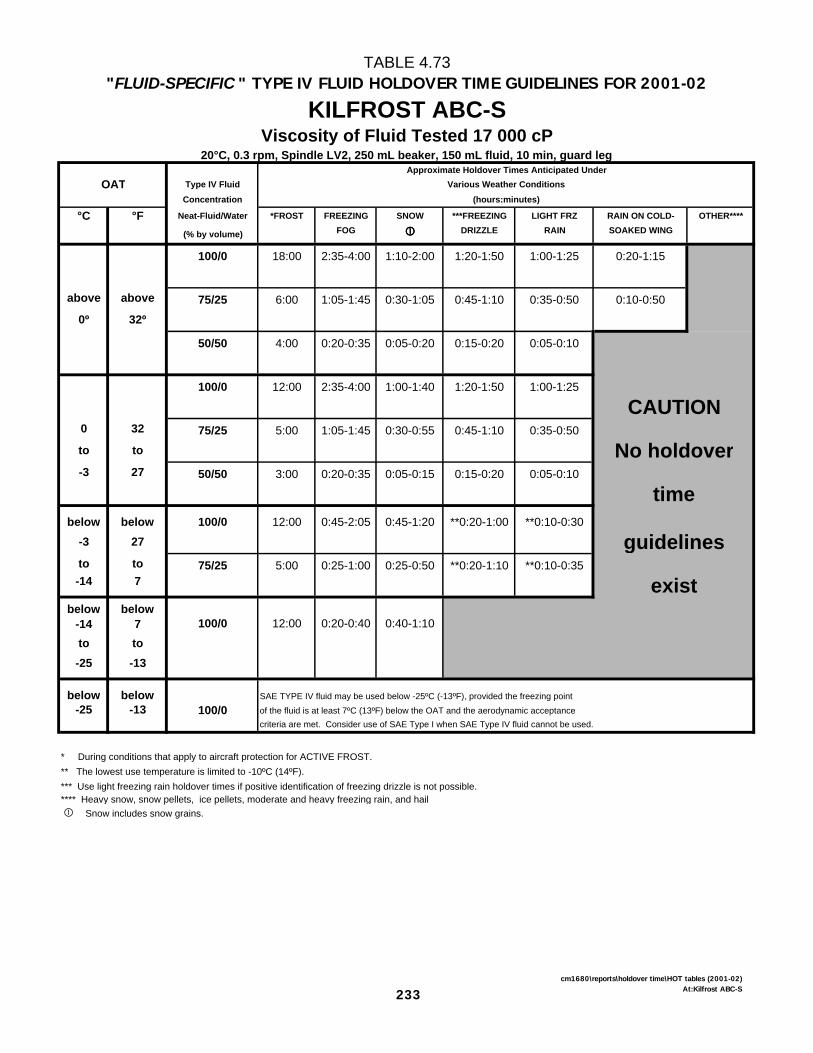
TABLE 4.73"FLUID-SPECIFIC " TYPE IV FLUID HOLDOVER TIME GUIDELINES FOR 2001-02
KILFROST ABC-SViscosity of Fluid Tested 17 000 cP
20°C, 0.3 rpm, Spindle LV2, 250 mL beaker, 150 mL fluid, 10 min, guard legApproximate Holdover Times Anticipated Under
OAT Type IV Fluid Various Weather ConditionsConcentration (hours:minutes)
°C °F Neat-Fluid/Water *FROST FREEZING SNOW ***FREEZING LIGHT FRZ RAIN ON COLD- OTHER****
(% by volume) FOG ���� DRIZZLE RAIN SOAKED WING
100/0 18:00 2:35-4:00 1:10-2:00 1:20-1:50 1:00-1:25 0:20-1:15
above above 75/25 6:00 1:05-1:45 0:30-1:05 0:45-1:10 0:35-0:50 0:10-0:50
0º 32º
50/50 4:00 0:20-0:35 0:05-0:20 0:15-0:20 0:05-0:10
100/0 12:00 2:35-4:00 1:00-1:40 1:20-1:50 1:00-1:25
CAUTION0 32 75/25 5:00 1:05-1:45 0:30-0:55 0:45-1:10 0:35-0:50
to to No holdover-3 27 50/50 3:00 0:20-0:35 0:05-0:15 0:15-0:20 0:05-0:10
timebelow below 100/0 12:00 0:45-2:05 0:45-1:20 **0:20-1:00 **0:10-0:30
-3 27 guidelinesto to 75/25 5:00 0:25-1:00 0:25-0:50 **0:20-1:10 **0:10-0:35-14 7 exist
below below-14 7 100/0 12:00 0:20-0:40 0:40-1:10
to to-25 -13
below below SAE TYPE IV fluid may be used below -25ºC (-13ºF), provided the freezing point-25 -13 100/0 of the fluid is at least 7ºC (13ºF) below the OAT and the aerodynamic acceptance
criteria are met. Consider use of SAE Type I when SAE Type IV fluid cannot be used.
* During conditions that apply to aircraft protection for ACTIVE FROST.** The lowest use temperature is limited to -10ºC (14ºF).*** Use light freezing rain holdover times if positive identification of freezing drizzle is not possible.**** Heavy snow, snow pellets, ice pellets, moderate and heavy freezing rain, and hail� Snow includes snow grains.
233cm1680\reports\holdover time\HOT tables (2001-02)
At:Kilfrost ABC-S

TABLE 4.74"FLUID-SPECIFIC " TYPE IV FLUID HOLDOVER TIME GUIDELINES FOR 2001-02
OCTAGON MAX-FLIGHTViscosity of Neat 100% Fluid Tested 5 540 cP
20°C, 0.3 rpm, Spindle LV1, 600 mL beaker, 500 mL fluid, 33 min 20 sec, guard leg Approximate Holdover Times Anticipated Under
OAT Type IV Fluid Various Weather ConditionsConcentration (hours:minutes)
°C °F Neat-Fluid/Water *FROST FREEZING SNOW ***FREEZING LIGHT FRZ RAIN ON COLD- OTHER****
(% by volume) FOG ���� DRIZZLE RAIN SOAKED WING
100/0 18:00 2:40-4:00 1:15-2:00 0:55-2:00 0:35-1:00 0:15-1:15
above above 75/25 6:00 2:05-3:15 1:20-2:00 1:15-2:00 0:35-1:10 0:10-0:40
0º 32º
50/50 4:00 0:55-1:45 0:40-1:20 0:35-1:00 0:15-0:30
100/0 12:00 2:40-4:00 0:50-1:35 0:55-2:00 0:35-1:00
CAUTION0 32 75/25 5:00 2:05-3:15 0:45-1:45 1:15-2:00 0:35-1:10
to to No holdover-3 27 50/50 3:00 0:55-1:45 0:25-1:15 0:35-1:00 0:15-0:30
timebelow below 100/0 12:00 0:50-2:30 0:25-0:50 **0:25-1:10 **0:20-0:40
-3 27 guidelinesto to 75/25 5:00 0:30-1:05 0:20-0:50 **0:20-1:00 **0:15-0:30-14 7 exist
below below-14 7 100/0 12:00 0:20-0:45 0:20-0:40
to to-25 -13
below below SAE TYPE IV fluid may be used below -25ºC (-13ºF), provided the freezing point-25 -13 100/0 of the fluid is at least 7ºC (13ºF) below the OAT and the aerodynamic acceptance
criteria are met. Consider use of SAE Type I when SAE Type IV fluid cannot be used.
* During conditions that apply to aircraft protection for ACTIVE FROST.** The lowest use temperature is limited to -10ºC (14ºF).*** Use light freezing rain holdover times if positive identification of freezing drizzle is not possible.**** Heavy snow, snow pellets, ice pellets, moderate and heavy freezing rain, and hail� Snow includes snow grains.
234cm1680\report\HOT\fluid-specific table maxflight

TABLE 4.75"FLUID-SPECIFIC " TYPE IV FLUID HOLDOVER TIME GUIDELINES FOR 2001-02
SPCA AD-480Viscosity of Neat 100% Fluid Tested 15 200 cP
20°C, 0.3 rpm, Spindle SC4-34/13R, 10 mL fluid, 30 minApproximate Holdover Times Anticipated Under
OAT Type IV Fluid Various Weather ConditionsConcentration (hours:minutes)
°C °F Neat-Fluid/Water *FROST FREEZING SNOW ***FREEZING LIGHT FRZ RAIN ON COLD- OTHER****
(% by volume) FOG ���� DRIZZLE RAIN SOAKED WING
100/0 18:00 2:00-3:30 0:55-1:50 0:50-1:30 0:35-0:55 0:15-1:35
above above 75/25 6:00 1:30-2:45 0:40-1:20 0:50-1:15 0:30-0:45 0:10-1:15
0º 32º
50/50 4:00 0:30-0:45 0:15-0:30 0:15-0:25 0:05-0:15
100/0 12:00 2:00-3:30 0:40-1:20 0:50-1:30 0:35-0:55
CAUTION0 32 75/25 5:00 1:30-2:45 0:30-1:05 0:50-1:15 0:30-0:45
to to No holdover-3 27 50/50 3:00 0:30-0:45 0:10-0:20 0:15-0:25 0:05-0:15
timebelow below 100/0 12:00 0:20-1:20 0:30-0:55 **0:25-1:20 **0:15-0:30
-3 27 guidelinesto to 75/25 5:00 0:25-0:50 0:20-0:45 **0:25-1:05 **0:15-0:30-14 7 exist
below below-14 7 100/0 12:00 0:15-0:40 0:25-0:40
to to-25 -13
below below SAE TYPE IV fluid may be used below -25ºC (-13ºF), provided the freezing point
-25 -13 100/0 of the fluid is at least 7ºC (13ºF) below the OAT and the aerodynamic acceptance
criteria are met. Consider use of SAE Type I when SAE Type IV fluid cannot be used.
* During conditions that apply to aircraft protection for ACTIVE FROST.** The lowest use temperature is limited to -10ºC (14ºF).*** Use light freezing rain holdover times if positive identification of freezing drizzle is not possible.**** Heavy snow, snow pellets, ice pellets, moderate and heavy freezing rain, and hail.� Snow includes snow grains.
235cm1680\reports\holdover time\HOT tables (2001-02)
At:SPCA 480
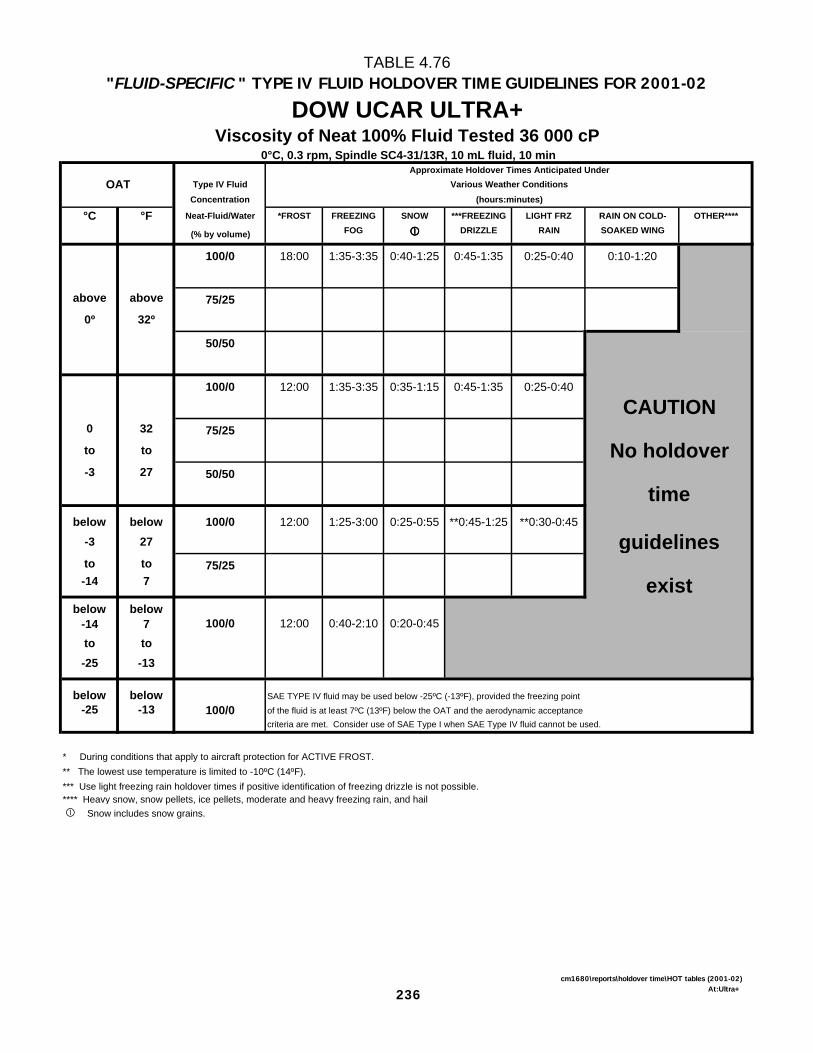
TABLE 4.76"FLUID-SPECIFIC " TYPE IV FLUID HOLDOVER TIME GUIDELINES FOR 2001-02
DOW UCAR ULTRA+Viscosity of Neat 100% Fluid Tested 36 000 cP
0°C, 0.3 rpm, Spindle SC4-31/13R, 10 mL fluid, 10 minApproximate Holdover Times Anticipated Under
OAT Type IV Fluid Various Weather ConditionsConcentration (hours:minutes)
°C °F Neat-Fluid/Water *FROST FREEZING SNOW ***FREEZING LIGHT FRZ RAIN ON COLD- OTHER****
(% by volume) FOG ���� DRIZZLE RAIN SOAKED WING
100/0 18:00 1:35-3:35 0:40-1:25 0:45-1:35 0:25-0:40 0:10-1:20
above above 75/250º 32º
50/50
100/0 12:00 1:35-3:35 0:35-1:15 0:45-1:35 0:25-0:40
CAUTION0 32 75/25to to No holdover-3 27 50/50
timebelow below 100/0 12:00 1:25-3:00 0:25-0:55 **0:45-1:25 **0:30-0:45
-3 27 guidelinesto to 75/25-14 7 exist
below below-14 7 100/0 12:00 0:40-2:10 0:20-0:45
to to-25 -13
below below SAE TYPE IV fluid may be used below -25ºC (-13ºF), provided the freezing point-25 -13 100/0 of the fluid is at least 7ºC (13ºF) below the OAT and the aerodynamic acceptance
criteria are met. Consider use of SAE Type I when SAE Type IV fluid cannot be used.
* During conditions that apply to aircraft protection for ACTIVE FROST.** The lowest use temperature is limited to -10ºC (14ºF).*** Use light freezing rain holdover times if positive identification of freezing drizzle is not possible.**** Heavy snow, snow pellets, ice pellets, moderate and heavy freezing rain, and hail� Snow includes snow grains.
236cm1680\reports\holdover time\HOT tables (2001-02)
At:Ultra+

5. SUPPLEMENTARY TESTS
X:\@APS ARCHIVE\CM1680 (exBM3833) TC-Deicing 00-01 (REPORTS ONLY)\Reports\HOT\Final Version 1.0\Final Version 1.0.doc Final Version 1.0
August 05 APS AVIATION INC.
237
5. SUPPLEMENTARY TESTS In addition to tests performed to determine the holdover times for qualified fluids, APS conducted supplementary tests. The supplementary tests and their corresponding results are presented in this section. The twofold nature of these tests is as follows:
• The evaluation of the holdover time performance of Kilfrost Type IV ABC-S degraded viscosity fluid (Subsection 5.1) and
• A series of round-robin tests conducted at NRC observed differences in
anti-icing fluid endurance times in natural and artificial snow. Tests were also performed in freezing drizzle and light freezing rain using common fluids to identify the differences in endurance times (Subsection 5.2).
5.1 Evaluation of the Holdover Time Performance of a Degraded Viscosity
Sample of Kilfrost Type IV ABC-S At the request of Kilfrost, APS was asked to conduct holdover time tests for a degraded viscosity sample of its Kilfrost ABC-S Type IV anti-icing fluid. The viscosity of the degraded fluid was 3 900 cP (20°C, 0.3 rpm, Spindle LV2, 150 mL beaker, 150 mL fluid, 10 minutes, guard leg), compared to 17 000 cP for the sample used to generate the fluid-specific holdover time table for Kilfrost ABC-S.
Testing was conducted in natural snow at Dorval Airport and in simulated conditions at NRC in Ottawa in March and April 2000. The results of these tests appear in TP 13659E [2].
Due to the late arrival of the fluid in 2000, all of the test data for the degraded ABC-S sample was collected between 0°C and -3°C. APS conducted additional testing with the degraded viscosity sample of ABC-S during the summer of 2000 using the prototype NCAR artificial snowmaking system. These results were presented to Kilfrost, and appear in TP 13659E [2]. At Kilfrost’s request, APS conducted additional testing with the ABC-S degraded sample in natural snow conditions above 0°C during the 2000-01 test season. In total, seven tests were conducted with the neat sample in natural snow conditions above 0°C. The results of 2000-01 tests were combined with results from tests conducted in 1999-2000 tests, and regression curves were drawn based on the combined data set. This information appears in Figure 5.1.
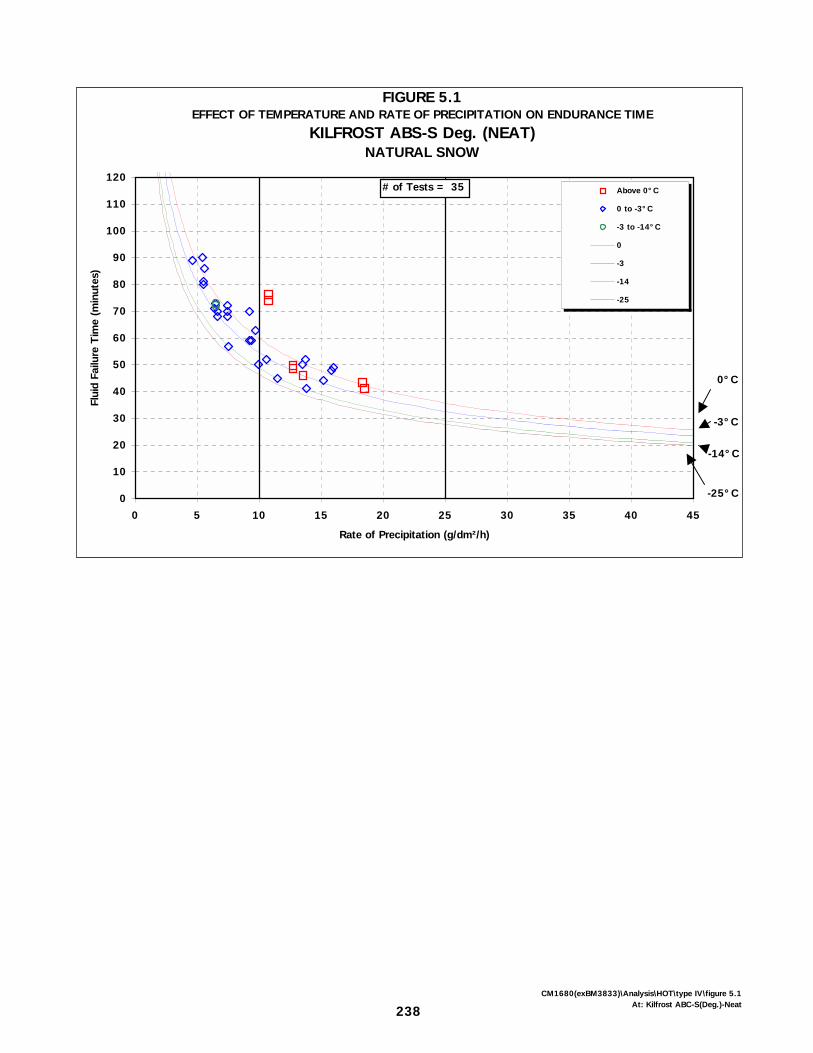
238CM1680(exBM3833)\Analysis\HOT\type IV\figure 5.1
At: Kilfrost ABC-S(Deg.)-Neat
FIGURE 5.1EFFECT OF TEMPERATURE AND RATE OF PRECIPITATION ON ENDURANCE TIME
KILFROST ABS-S Deg. (NEAT)NATURAL SNOW
0
10
20
30
40
50
60
70
80
90
100
110
120
0 5 10 15 20 25 30 35 40 45
Rate of Precipitation (g/dm²/h)
Flui
d Fa
ilure
Tim
e (m
inut
es)
Above 0°C
0 to -3°C
-3 to -14°C
0
-3
-14
-25
# of Tests = 35
-25°C
0°C
-3°C
-14°C

5. SUPPLEMENTARY TESTS
X:\@APS ARCHIVE\CM1680 (exBM3833) TC-Deicing 00-01 (REPORTS ONLY)\Reports\HOT\Final Version 1.0\Final Version 1.0.doc Final Version 1.0
August 05 APS AVIATION INC.
239
5.2 Results of Round-Robin Testing Using Certified Type IV Fluids in Freezing Drizzle and Light Freezing Rain
Tests conducted by APS have provided holdover time guidelines to pilots and operators for several years. There is great concern in the industry that endurance times generated by the test procedures in the Proposed AS 5485 would not produce equivalent fluid endurance times. As part of the 2000-01 test program, APS, AMIL, and NCAR laboratories, in a series of round-robin tests, attempted to examine and reconcile differences in anti-icing fluid endurance times in natural and artificial snow (see TP 13828E [14]). It was also proposed that APS and AMIL conduct tests in freezing drizzle and light freezing rain using common fluids to identify the differences in endurance times. One ethylene glycol-based Type IV fluid and two propylene glycol-based Type IV fluids were tested in natural snow as part of the snow reconciliation test program. To ensure that all laboratories tested fluid of the same viscosity, test samples were delivered from the fluid manufacturers to the test facilities from the same production batches. The same fluids were used in freezing drizzle and light freezing rain tests. The following fluids and dilutions were tested in 2000-01 round-robin testing:
• UCAR Ultra+ neat, viscosity 36 000 cP; • Kilfrost ABC-S neat, viscosity 26 300 cP; • Kilfrost ABC-S 75/25 fluid/water concentration, viscosity 23 200 cP; • Kilfrost ABC-S 50/50 fluid/water concentration, viscosity 1 900 cP; • SPCA AD-480 neat, viscosity 15 200 cP; • SPCA AD-480 75/25 fluid/water concentration, viscosity 16 200 cP; and • SPCA AD-480 50/50 fluid/water concentration, viscosity 7 000 cP;
APS personnel measured all Type IV fluid viscosities using the methods specified for each fluid by the respective fluid manufacturer. The manufacturer-specified methods for viscosity measurement are described in the 1999-2000 Transport Canada report, TP 13659E [2]. Round-robin tests were conducted in the following conditions at NRC in Ottawa using standard APS test procedures:
• Light freezing rain, -10°C, precipitation rate of 25 g/dm2/h; and • Freezing drizzle, -3°C, precipitation rate of 13 g/dm2/h.
The results of the round-robin tests in light freezing rain and freezing drizzle appear in the test log in Table 5.1.
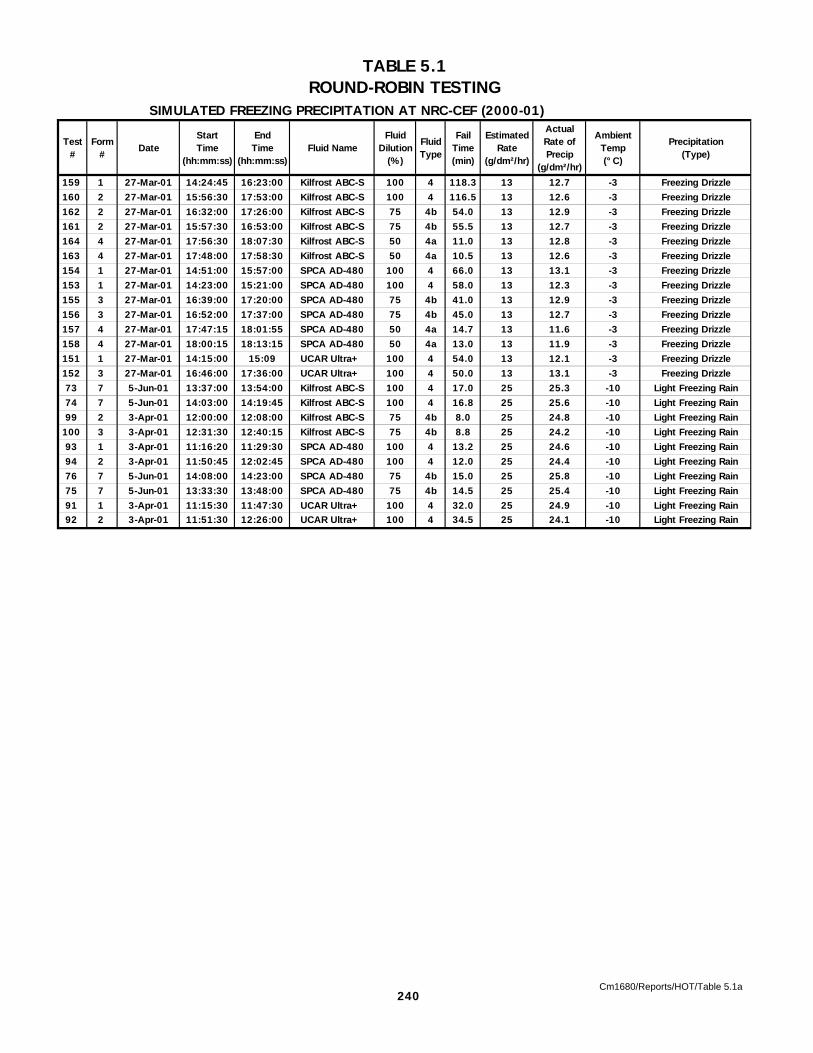
SIMULATED FREEZING PRECIPITATION AT NRC-CEF (2000-01)
Test#
Form#
DateStartTime
(hh:mm:ss)
EndTime
(hh:mm:ss)Fluid Name
FluidDilution
(%)
FluidType
FailTime(min)
EstimatedRate
(g/dm²/hr)
ActualRate of Precip
(g/dm²/hr)
AmbientTemp(°C)
Precipitation(Type)
159 1 27-Mar-01 14:24:45 16:23:00 Kilfrost ABC-S 100 4 118.3 13 12.7 -3 Freezing Drizzle160 2 27-Mar-01 15:56:30 17:53:00 Kilfrost ABC-S 100 4 116.5 13 12.6 -3 Freezing Drizzle162 2 27-Mar-01 16:32:00 17:26:00 Kilfrost ABC-S 75 4b 54.0 13 12.9 -3 Freezing Drizzle161 2 27-Mar-01 15:57:30 16:53:00 Kilfrost ABC-S 75 4b 55.5 13 12.7 -3 Freezing Drizzle164 4 27-Mar-01 17:56:30 18:07:30 Kilfrost ABC-S 50 4a 11.0 13 12.8 -3 Freezing Drizzle163 4 27-Mar-01 17:48:00 17:58:30 Kilfrost ABC-S 50 4a 10.5 13 12.6 -3 Freezing Drizzle154 1 27-Mar-01 14:51:00 15:57:00 SPCA AD-480 100 4 66.0 13 13.1 -3 Freezing Drizzle153 1 27-Mar-01 14:23:00 15:21:00 SPCA AD-480 100 4 58.0 13 12.3 -3 Freezing Drizzle155 3 27-Mar-01 16:39:00 17:20:00 SPCA AD-480 75 4b 41.0 13 12.9 -3 Freezing Drizzle156 3 27-Mar-01 16:52:00 17:37:00 SPCA AD-480 75 4b 45.0 13 12.7 -3 Freezing Drizzle157 4 27-Mar-01 17:47:15 18:01:55 SPCA AD-480 50 4a 14.7 13 11.6 -3 Freezing Drizzle158 4 27-Mar-01 18:00:15 18:13:15 SPCA AD-480 50 4a 13.0 13 11.9 -3 Freezing Drizzle151 1 27-Mar-01 14:15:00 15:09 UCAR Ultra+ 100 4 54.0 13 12.1 -3 Freezing Drizzle152 3 27-Mar-01 16:46:00 17:36:00 UCAR Ultra+ 100 4 50.0 13 13.1 -3 Freezing Drizzle73 7 5-Jun-01 13:37:00 13:54:00 Kilfrost ABC-S 100 4 17.0 25 25.3 -10 Light Freezing Rain74 7 5-Jun-01 14:03:00 14:19:45 Kilfrost ABC-S 100 4 16.8 25 25.6 -10 Light Freezing Rain99 2 3-Apr-01 12:00:00 12:08:00 Kilfrost ABC-S 75 4b 8.0 25 24.8 -10 Light Freezing Rain100 3 3-Apr-01 12:31:30 12:40:15 Kilfrost ABC-S 75 4b 8.8 25 24.2 -10 Light Freezing Rain93 1 3-Apr-01 11:16:20 11:29:30 SPCA AD-480 100 4 13.2 25 24.6 -10 Light Freezing Rain94 2 3-Apr-01 11:50:45 12:02:45 SPCA AD-480 100 4 12.0 25 24.4 -10 Light Freezing Rain76 7 5-Jun-01 14:08:00 14:23:00 SPCA AD-480 75 4b 15.0 25 25.8 -10 Light Freezing Rain75 7 5-Jun-01 13:33:30 13:48:00 SPCA AD-480 75 4b 14.5 25 25.4 -10 Light Freezing Rain91 1 3-Apr-01 11:15:30 11:47:30 UCAR Ultra+ 100 4 32.0 25 24.9 -10 Light Freezing Rain92 2 3-Apr-01 11:51:30 12:26:00 UCAR Ultra+ 100 4 34.5 25 24.1 -10 Light Freezing Rain
TABLE 5.1ROUND-ROBIN TESTING
240Cm1680/Reports/HOT/Table 5.1a

5. SUPPLEMENTARY TESTS
X:\@APS ARCHIVE\CM1680 (exBM3833) TC-Deicing 00-01 (REPORTS ONLY)\Reports\HOT\Final Version 1.0\Final Version 1.0.doc Final Version 1.0
August 05 APS AVIATION INC.
241
The results of APS endurance time tests in the two test conditions were to be compared with tests conducted by AMIL in its facility in Chicoutimi. The latter tests were never performed.

242
This page intentionally left blank
6. CONCLUSIONS
X:\@APS ARCHIVE\CM1680 (exBM3833) TC-Deicing 00-01 (REPORTS ONLY)\Reports\HOT\Final Version 1.0\Final Version 1.0.doc Final Version 1.0
August 05 APS AVIATION INC.
243
6. CONCLUSIONS Generic holdover time guidelines are no longer endorsed and published by the SAE. For the upcoming winter operations season (2001-02), all generic and fluid-specific tables will be published by Transport Canada and the U.S. Federal Aviation Administration. 6.1 Type IV Fluids
The 2000-01 holdover time test program was developed in part to determine the holdover times for one new Type IV fluid (Clariant Safewing MPIV 2012 Protect), and to re-test one certified Type IV fluid (Octagon Max-Flight). Two additional Type IV fluids, one from Clariant and another from UCAR/Dow, were delivered for testing, although neither of these fluids will be manufactured for use in 2001-02.
The fluid viscosities of the Clariant Safewing MPIV 2012 Protect and Octagon Max-Flight were selected by the fluid manufacturers based on the sample selection procedures agreed upon at the SAE meeting in Toronto in 1999. The results of Type IV endurance time tests revealed a wide variation in performance properties among the different fluid brands. In the determination of fluid holdover times, the data for each fluid and each cell of the tables were subjected to a regression analysis. From the results of the analyses, the generic Type IV fluid holdover time guidelines were devised. Each cell of the table contains the holdover times of the poorest performing fluid brand(s). Due to the wide variation in performance of the Type IV fluids tested, fluid-specific holdover time tables were developed. All categories of precipitation, with the exception of frost, were selected to take advantage of enhanced holdover times for individual fluids.
6.1.1 Snow
No reductions were made to the snow column of the generic Type IV holdover time tables based on the results of tests conducted in 2000-01.
Four holdover times in snow were increased following the 2001 SAE G-12 Holdover Time Subcommittee meeting in New Orleans, as a result of the elimination of Hoechst 1957 and diluted UCAR/Dow Ultra+ test data. Both the upper and lower holdover time limits for 75/25 fluid in two cells, above 0°C and 0°C to -3°C, were increased.
6. CONCLUSIONS
X:\@APS ARCHIVE\CM1680 (exBM3833) TC-Deicing 00-01 (REPORTS ONLY)\Reports\HOT\Final Version 1.0\Final Version 1.0.doc Final Version 1.0
August 05 APS AVIATION INC.
244
6.1.2 Freezing Drizzle
Several reductions and increases have been made to the freezing drizzle column of the generic Type IV holdover time table. The five reductions, which range from 5 to 20 minutes, were a result of tests conducted during the 2000-01 test season with Clariant Safewing MPIV Protect 2012 fluid. In addition to the five reductions, four increases were made to the freezing drizzle column of the generic Type IV holdover time table. The removal of obsolete test data from 1996-97 testing resulted in two 5-minute and two 10-minute increases to the generic numbers.
6.1.3 Light Freezing Rain
Two changes were made to the light freezing rain column of the generic Type IV holdover time table. The upper holdover time limits in the -3°C to -10°C cells for neat and 75/25 fluids were reduced by five minutes.
6.1.4 Freezing Fog
No changes were made to the freezing fog column of the generic Type IV fluid holdover time table for the upcoming year.
6.1.5 Rain on a Cold-Soaked Wing
No changes were made to the generic holdover times in the rain on a cold-soaked wing condition.
6.2 Type II Fluids One Type II fluid, SPCA Ecowing 26, was tested extensively in all conditions during the 2000-01 winter season, and a fluid-specific holdover time table for this fluid was generated.
6.2.1 Natural Snow
No changes were made to the generic Type II table as a result of tests conducted in 2000-01 with the SPCA Ecowing 26 product.

6. CONCLUSIONS
X:\@APS ARCHIVE\CM1680 (exBM3833) TC-Deicing 00-01 (REPORTS ONLY)\Reports\HOT\Final Version 1.0\Final Version 1.0.doc Final Version 1.0
August 05 APS AVIATION INC.
245
6.2.2 Freezing Drizzle No changes were made to the generic Type II table as a result of tests conducted in 2000-01 with the SPCA Ecowing 26 product.
6.2.3 Light Freezing Rain One change was made to the generic Type II table as a result of tests conducted in 2000-01 with Type IV fluid. In the -3°C to -10°C cell for neat Type II fluid, the upper generic value was reduced by 5 minutes to match a reduction in the corresponding cell of the Type IV table.
6.2.4 Freezing Fog No changes were made to the generic Type II table as a result of tests conducted in 2000-01 with the SPCA Ecowing 26 product.
6.2.5 Rain on a Cold-Soaked Wing No changes were made to the generic Type II table as a result of tests conducted in 2000-01 with the SPCA Ecowing 26 product.
6.3 Type I Fluids
In general, the Type I holdover time results from tests conducted in 2000-01 agreed with the reduced generic Type I holdover time guidelines, and no changes were made to the generic Type I table.
6.4 Type III Fluids
No Type III fluids were available during the past season; therefore, no Type III tests were performed. A Type III holdover time table exists; however, the values need to be substantiated since the table was generated using a fluid that is no longer commercially available.

6. CONCLUSIONS
X:\@APS ARCHIVE\CM1680 (exBM3833) TC-Deicing 00-01 (REPORTS ONLY)\Reports\HOT\Final Version 1.0\Final Version 1.0.doc Final Version 1.0
August 05 APS AVIATION INC.
246
6.5 Supplementary Tests Natural snow testing was conducted with a degraded viscosity sample of Kilfrost ABC-S in natural snow conditions above 0°C during the 2000-01 test season. The results of 2000-01 tests were combined with 1999-2000 tests, and regression curves were drawn based on the combined data set.
APS also conducted round-robin testing in light freezing rain and freezing drizzle during the past test season. The results of APS endurance time tests in the two test conditions were to be compared with tests conducted by AMIL in their facility in Chicoutimi. The latter tests were never performed.

7. RECOMMENDATIONS
X:\@APS ARCHIVE\CM1680 (exBM3833) TC-Deicing 00-01 (REPORTS ONLY)\Reports\HOT\Final Version 1.0\Final Version 1.0.doc Final Version 1.0
August 05 APS AVIATION INC.
247
7. RECOMMENDATIONS Based on past test results and conclusions, it is recommended that:
• Any new Type I, Type II or Type IV fluids be evaluated over the entire
range of conditions of the holdover time tables; • The holdover time table for Type III fluids be re-evaluated if new Type III
fluids become available for testing in the 2001-02 test season;
• Type II fluid-specific tables be generated for previously certified Type II fluids; and
• A new endurance time test procedure aimed at simulating a real-world
Type I application to a wing be developed for Type I fluids.
248
This page intentionally left blank.
REFERENCES
X:\@APS ARCHIVE\CM1680 (exBM3833) TC-Deicing 00-01 (REPORTS ONLY)\Reports\HOT\Final Version 1.0\Final Version 1.0.doc Final Version 1.0
August 05 APS AVIATION INC.
249
REFERENCES
1. Society of Automotive Engineers (SAE) Proposed Aerospace Standard AS 5485, Endurance Time Tests for Aircraft Deicing/Anti-icing Fluids: SAE Type I, II, III, and IV, October 2000 (unpublished).
2. Chaput, M., Hanna, M., Hunt, M., Aircraft Ground De/Anti-icing Fluid
Holdover Time and Endurance Time Testing Program for the 1999-2000 Winter, APS Aviation Inc., Transportation Development Centre, Montreal, December 2000, TP 13659E (to be published).
3. Alwaid, A., Endurance Time Tests in Simulated Frost Conditions, APS
Aviation Inc., Transportation Development Centre, Montreal, October 2001, TP 13831E (to be published).
4. World Meteorological Organization Guide to Meteorological Instruments
and Methods of Observation (see page 17 of report). 5. American Meteorological Society, Glossary of Meteorology WSDH #7
Manual of Surface Weather Observations (MANOBS). 6. NCAR & TDC Snow Visibility Chart Reference (see page 19 of report). 7. www.tc.gc.ca/tdc/ 8. D'Avirro, J., Aircraft Ground De/Anti-icing Fluid Holdover Time Field
Testing Program for the 1995-1996 Winter, APS Aviation Inc., Transportation Development Centre, Montreal, November 1996, TP 12896E, 172.
9. Moc, N., Winter Weather Data Evaluation (1995-2001), APS Aviation Inc.,
Transportation Development Centre, Montreal, September 2001, TP 13830E (to be published).
10. Dawson, P., D'Avirro, J., Validation of Methodology for Simulating a Cold-
Soaked Wing, APS Aviation Inc., Transportation Development Centre, Montreal, October 1996, TP 12899E, 92.
11. D’Avirro, J., Peters, A., Hanna, M., Dawson, P., Chaput, M., Aircraft
Ground De/Anti-icing Fluid Holdover Time Field Testing Program for the 1996/97 Winter, APS Aviation Inc., Transportation Development Centre, Montreal, November 1997, TP 13131E, 232.

REFERENCES
X:\@APS ARCHIVE\CM1680 (exBM3833) TC-Deicing 00-01 (REPORTS ONLY)\Reports\HOT\Final Version 1.0\Final Version 1.0.doc Final Version 1.0
August 05 APS AVIATION INC.
250
12. D'Avirro, J., Foo, H., Guy, C., Hoppe, A., McConachie, E., Spicer, S., Aircraft Ground De/Anti-icing Fluid Holdover Time Field Testing Program for the 1991-1992 Winter, Aviation Planning Services Ltd., Transportation Development Centre, Montreal, August 1992, TP 11454E, 83.
13. Bilgen, E., Chan, G., Cleary, C., D'Avirro, J., Foo, H., Aircraft Ground
De/Anti-icing Fluid Holdover Time Field Testing Program for the 1992-1993 Winter, APS Aviation Inc., Transportation Development Centre, Montreal, October 1993, TP 11836E, 122.
14. Chaput, M., Campbell, R., Endurance Time Testing in Snow: Reconciliation
of Indoor and Outdoor Snow Data, APS Aviation Inc., Transportation Development Centre, Montreal, October 2001, TP 13828E (to be published).
15. Myers, Barry B., Aircraft Anti-Icing Fluid Endurance, Holdover, and Failure
Times Under Winter Precipitation Conditions: A Glossary of Terms, Transportation Development Centre, Montreal, November 2001, TP 13832.