AIRBUS FY Results 2017 -...
39
15 February 2018 AIRBUS FY Results 2017 Tom Enders Chief Executive Officer Harald Wilhelm Chief Financial Officer
Transcript of AIRBUS FY Results 2017 -...
15 February 2018
AIRBUS FY Results 2017
Tom Enders Chief Executive Officer
Harald Wilhelm Chief Financial Officer

SAFE HARBOUR STATEMENT
DISCLAIMER
This presentation includes forward-looking statements. Words such as “anticipates”, “believes”, “estimates”, “expects”, “intends”, “plans”, “projects”, “may” and similar
expressions are used to identify these forward-looking statements. Examples of forward-looking statements include statements made about strategy, ramp-up and
delivery schedules, introduction of new products and services and market expectations, as well as statements regarding future performance and outlook.
By their nature, forward-looking statements involve risk and uncertainty because they relate to future events and circumstances and there are many factors that could
cause actual results and developments to differ materially from those expressed or implied by these forward-looking statements.
These factors include but are not limited to:
Changes in general economic, political or market conditions, including the cyclical nature of some of Airbus’ businesses;
Significant disruptions in air travel (including as a result of terrorist attacks);
Currency exchange rate fluctuations, in particular between the Euro and the U.S. dollar;
The successful execution of internal performance plans, including cost reduction and productivity efforts;
Product performance risks, as well as programme development and management risks;
Customer, supplier and subcontractor performance or contract negotiations, including financing issues;
Competition and consolidation in the aerospace and defence industry;
Significant collective bargaining labour disputes;
The outcome of political and legal processes including the availability of government financing for certain programmes and the size of defence and space
procurement budgets;
Research and development costs in connection with new products;
Legal, financial and governmental risks related to international transactions;
Legal and investigatory proceedings and other economic, political and technological risks and uncertainties.
As a result, Airbus’ actual results may differ materially from the plans, goals and expectations set forth in such forward-looking statements.
For a discussion of factors that could cause future results to differ from such forward-looking statements, see the Airbus “Registration Document” dated 4 April 2017,
including the Risk Factors section.
Any forward-looking statement contained in this presentation speaks as of the date of this presentation. Airbus undertakes no obligation to publicly revise or update
any forward-looking statements in light of new information, future events or otherwise.
Rounding disclaimer:
Due to rounding, numbers presented may not add up precisely to the totals provided and percentages may not precisely reflect the absolute figures.
IFRS 15 Estimate Disclaimer:
The actual IFRS 15 impacts may differ from the estimates when adopting the standard as of 1st January 2018. The Company has not finalised the re-run of the IFRS
15 changes on IT systems. The new accounting policies are subject to change until the Company presents its first consolidated financial statements that include the
date of initial application.
2
FY Results 2017
Company
Highlights
Divisional
Highlights
Guidance
Highlights
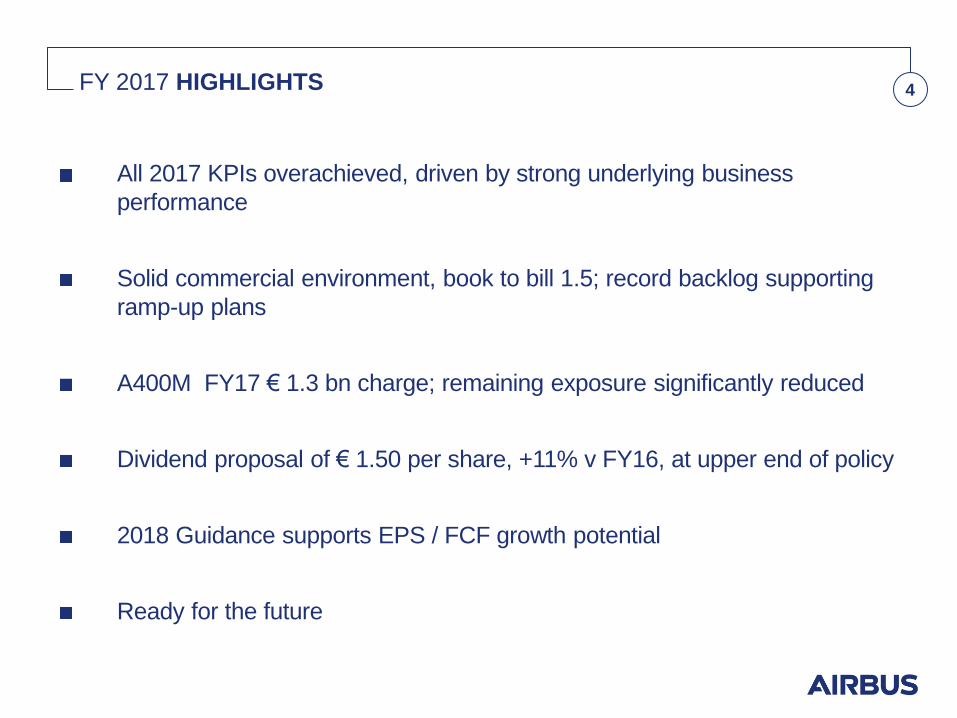
FY 2017 HIGHLIGHTS 4
All 2017 KPIs overachieved, driven by strong underlying business
performance
Solid commercial environment, book to bill 1.5; record backlog supporting
ramp-up plans
A400M FY17 € 1.3 bn charge; remaining exposure significantly reduced
Dividend proposal of € 1.50 per share, +11% v FY16, at upper end of policy
2018 Guidance supports EPS / FCF growth potential
Ready for the future
75%
9%
16%
29%
22% 20%
12%
7%
10%
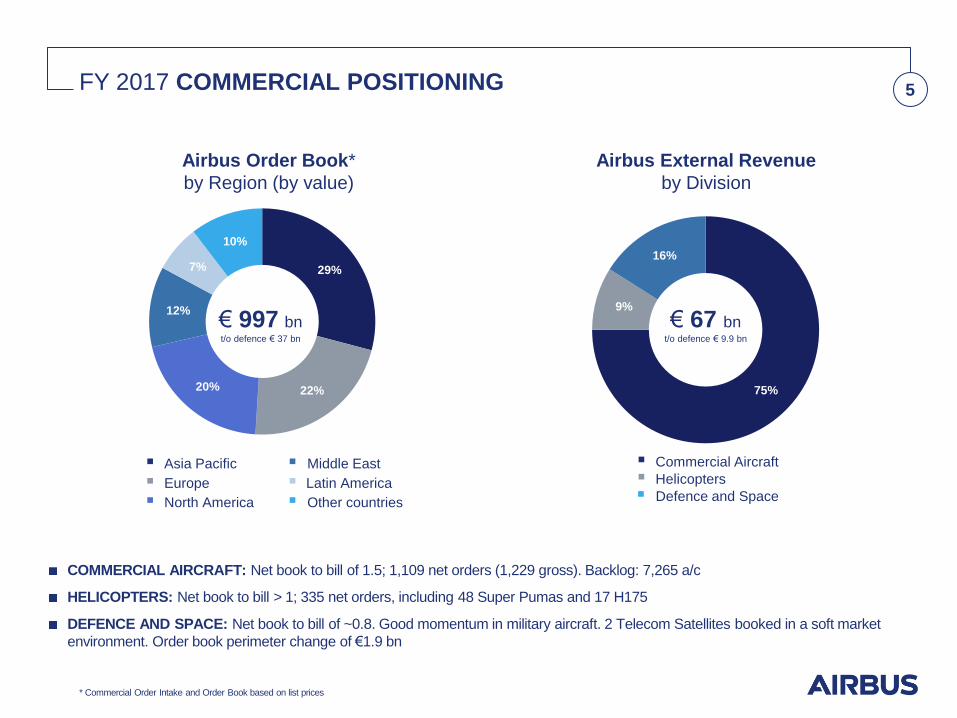
FY 2017 COMMERCIAL POSITIONING 5
* Commercial Order Intake and Order Book based on list prices
COMMERCIAL AIRCRAFT: Net book to bill of 1.5; 1,109 net orders (1,229 gross). Backlog: 7,265 a/c
HELICOPTERS: Net book to bill > 1; 335 net orders, including 48 Super Pumas and 17 H175
DEFENCE AND SPACE: Net book to bill of ~0.8. Good momentum in military aircraft. 2 Telecom Satellites booked in a soft market
environment. Order book perimeter change of €1.9 bn
Airbus Order Book*
by Region (by value)
Airbus External Revenue
by Division
Asia Pacific
Europe
North America
Middle East
Latin America
Other countries
€ 997 bn t/o defence € 37 bn
Commercial Aircraft
Helicopters
Defence and Space
€ 67 bn t/o defence € 9.9 bn

FY 2017 FINANCIAL PERFORMANCE 6
(1) FY 2017 Average number of shares: 773,772,702 compared to 773,798,837 in FY 2016
Capitalised R&D: € 219 m in FY 2017 and € 311 m in FY 2016. All figures before IFRS15
Revenues in € bn
EBIT Adjusted in € bn / RoS (%)
FCF before M&A and Customer Financing
in € bn EPS(1) Adjusted
in €
64.5
66.6 66.8
FY 2015 FY 2016 FY 2017
1.3 1.4
2.9
FY 2015 FY 2016 FY 2017
Strong underlying business performance
Cumulative perimeter changes vs. 2015 compensated: Revenues: ~ - € 3 bn; EBIT Adjusted: ~ - € 0.3 bn
4.11 3.96 4.25
6.4% 5.9% 6.4%
FY 2015 FY 2016 FY 2017
3.39 3.31 3.67
FY 2015 FY 2016 FY 2017
3.96
2.26
4.25 3.42
EBIT Adjusted EBIT Reported
FY 2016 FY 2017
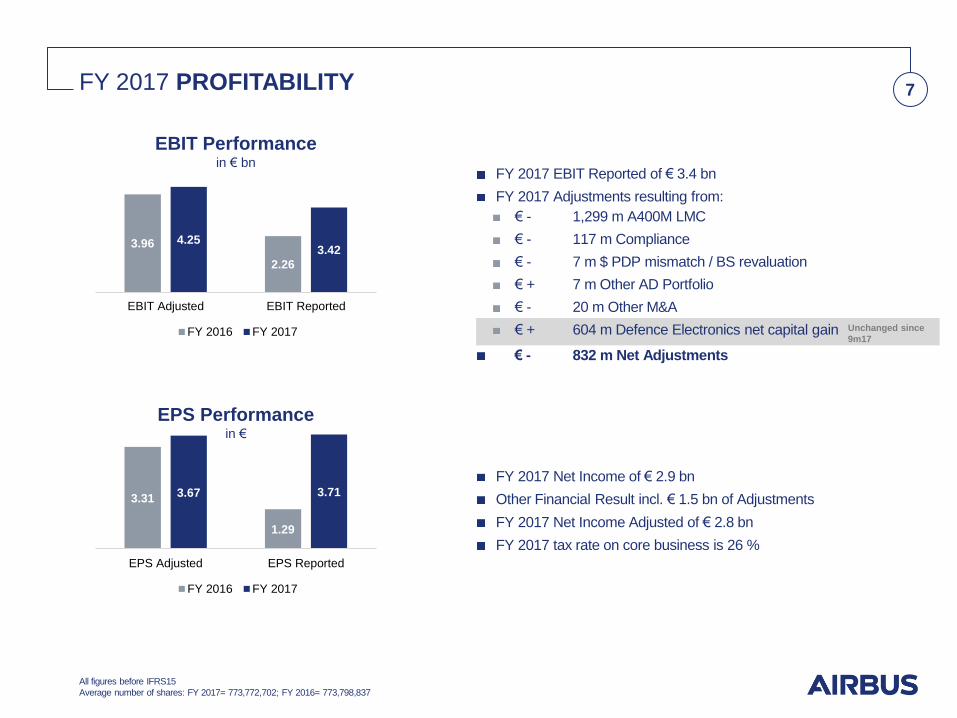
FY 2017 PROFITABILITY 7
All figures before IFRS15
Average number of shares: FY 2017= 773,772,702; FY 2016= 773,798,837
FY 2017 EBIT Reported of € 3.4 bn
FY 2017 Adjustments resulting from:
€ - 1,299 m A400M LMC
€ - 117 m Compliance
€ - 7 m $ PDP mismatch / BS revaluation
€ + 7 m Other AD Portfolio
€ - 20 m Other M&A
€ + 604 m Defence Electronics net capital gain
€ - 832 m Net Adjustments
FY 2017 Net Income of € 2.9 bn
Other Financial Result incl. € 1.5 bn of Adjustments
FY 2017 Net Income Adjusted of € 2.8 bn
FY 2017 tax rate on core business is 26 %
EBIT Performance in € bn
EPS Performance in €
Unchanged since
9m17
3.31
1.29
3.67 3.71
EPS Adjusted EPS Reported
FY 2016 FY 2017
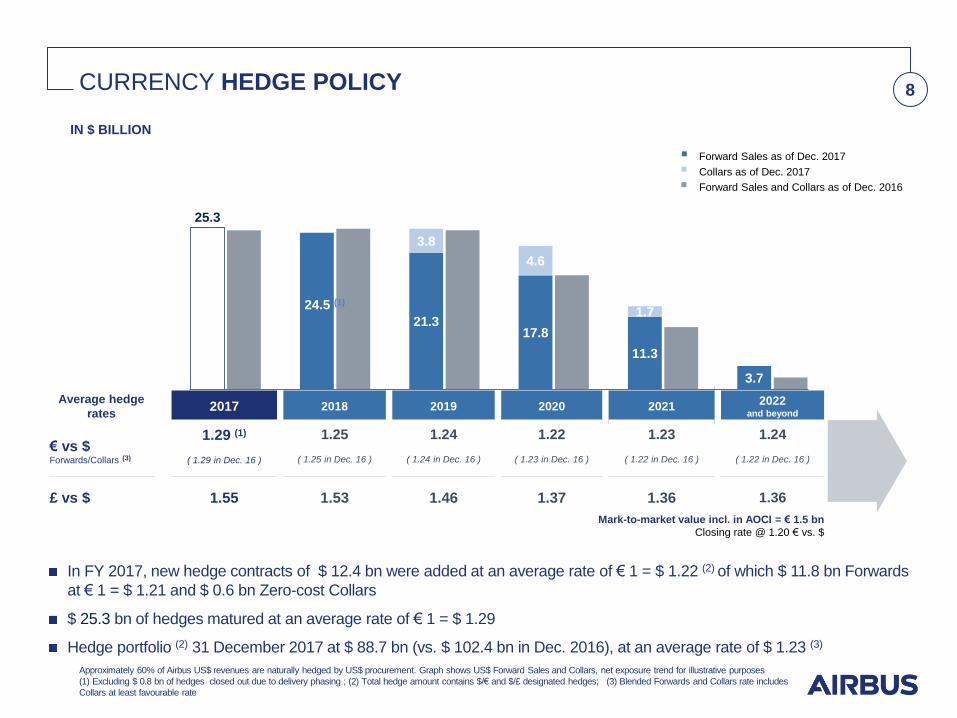
CURRENCY HEDGE POLICY 8
Approximately 60% of Airbus US$ revenues are naturally hedged by US$ procurement. Graph shows US$ Forward Sales and Collars, net exposure trend for illustrative purposes
(1) Excluding $ 0.8 bn of hedges closed out due to delivery phasing ; (2) Total hedge amount contains $/€ and $/£ designated hedges; (3) Blended Forwards and Collars rate includes
Collars at least favourable rate
In FY 2017, new hedge contracts of $ 12.4 bn were added at an average rate of € 1 = $ 1.22 (2) of which $ 11.8 bn Forwards
at € 1 = $ 1.21 and $ 0.6 bn Zero-cost Collars
$ 25.3 bn of hedges matured at an average rate of € 1 = $ 1.29
Hedge portfolio (2) 31 December 2017 at $ 88.7 bn (vs. $ 102.4 bn in Dec. 2016), at an average rate of $ 1.23 (3)
IN $ BILLION
Forward Sales as of Dec. 2017
Collars as of Dec. 2017
Forward Sales and Collars as of Dec. 2016
Average hedge
rates 2017 2018 2019 2020 2021 2022
and beyond
€ vs $ Forwards/Collars (3)
1.29 (1)
( 1.29 in Dec. 16 )
1.25
( 1.25 in Dec. 16 )
1.24
( 1.24 in Dec. 16 )
1.22
( 1.23 in Dec. 16 )
1.23
( 1.22 in Dec. 16 )
1.24
( 1.22 in Dec. 16 )
£ vs $ 1.55 1.53 1.46 1.37 1.36 1.36
Mark-to-market value incl. in AOCI = € 1.5 bn
Closing rate @ 1.20 € vs. $
0.0
24.5 (1)
21.3 17.8
11.3
3.7
25.3
3.8
4.6
1.7
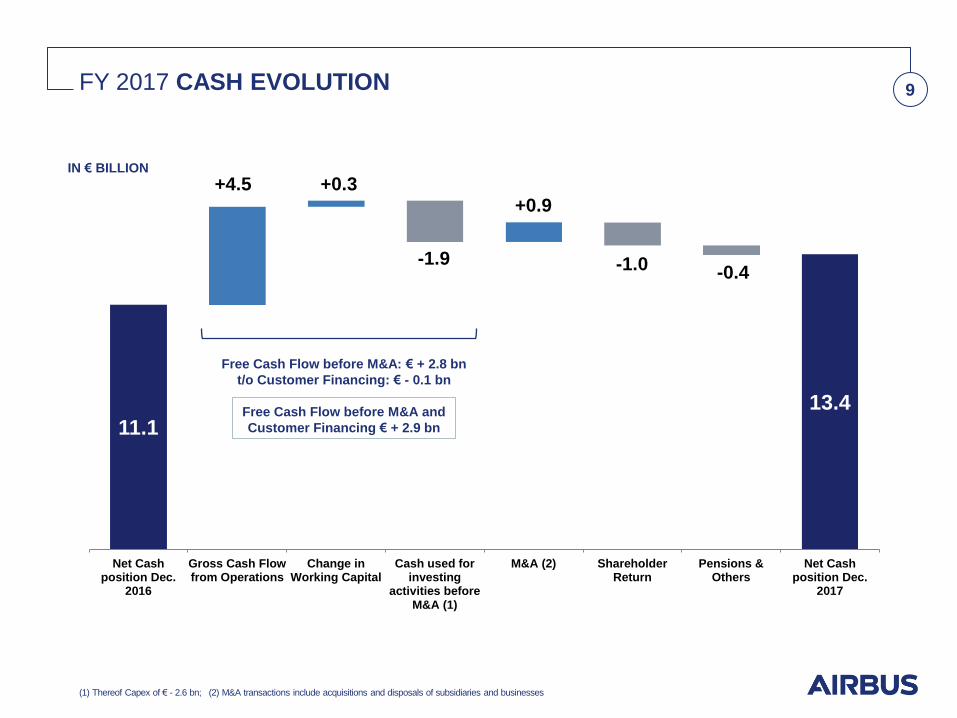
FY 2017 CASH EVOLUTION 9
(1) Thereof Capex of € - 2.6 bn; (2) M&A transactions include acquisitions and disposals of subsidiaries and businesses
IN € BILLION
Free Cash Flow before M&A: € + 2.8 bn
t/o Customer Financing: € - 0.1 bn
Free Cash Flow before M&A and
Customer Financing € + 2.9 bn 11.1
13.4
Net Cashposition Dec.
2016
Gross Cash Flowfrom Operations
Change inWorking Capital
Cash used forinvesting
activities beforeM&A (1)
M&A (2) ShareholderReturn
Pensions &Others
Net Cashposition Dec.
2017
+0.3
-1.9
+0.9
-1.0 -0.4
+4.5
FY Results 2017
Company
Highlights
Divisional
Highlights
Guidance
Highlights
6%
94%
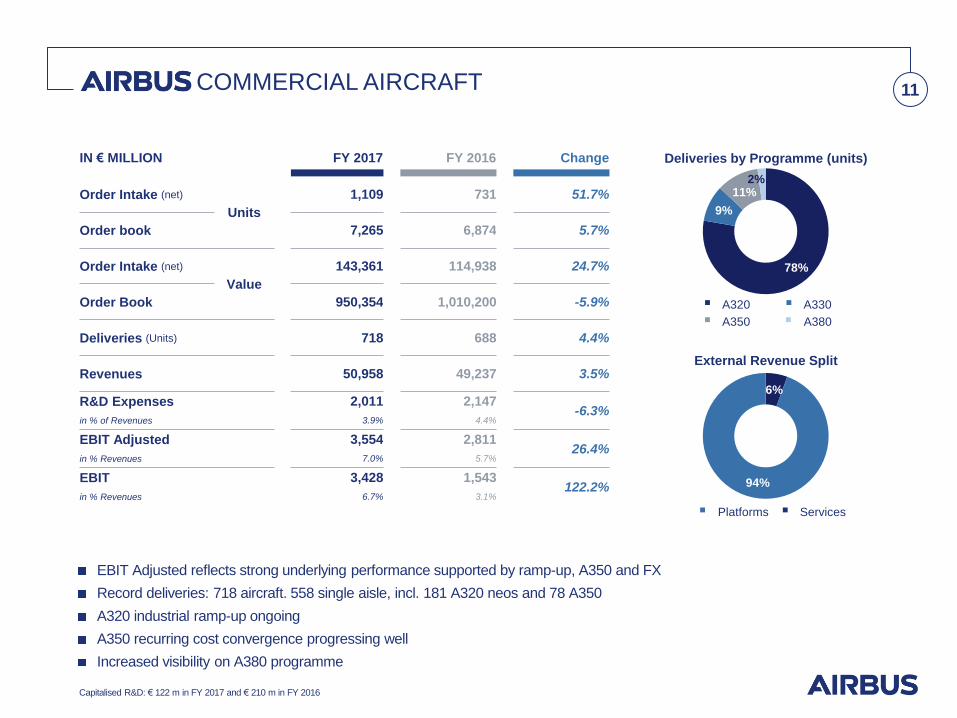
IN € MILLION FY 2017 FY 2016 Change
Order Intake (net)
Units
1,109 731 51.7%
Order book 7,265 6,874 5.7%
Order Intake (net)
Value
143,361 114,938 24.7%
Order Book 950,354 1,010,200 -5.9%
Deliveries (Units) 718 688 4.4%
Revenues 50,958 49,237 3.5%
R&D Expenses 2,011 2,147 -6.3%
in % of Revenues 3.9% 4.4%
EBIT Adjusted 3,554 2,811 26.4%
in % Revenues 7.0% 5.7%
EBIT 3,428 1,543 122.2%
in % Revenues 6.7% 3.1%
COMMERCIAL AIRCRAFT 11
Capitalised R&D: € 122 m in FY 2017 and € 210 m in FY 2016
EBIT Adjusted reflects strong underlying performance supported by ramp-up, A350 and FX
Record deliveries: 718 aircraft. 558 single aisle, incl. 181 A320 neos and 78 A350
A320 industrial ramp-up ongoing
A350 recurring cost convergence progressing well
Increased visibility on A380 programme
External Revenue Split
Deliveries by Programme (units)
A320
A350
A330
A380
78%
9%
11% 2%
Platforms
Services
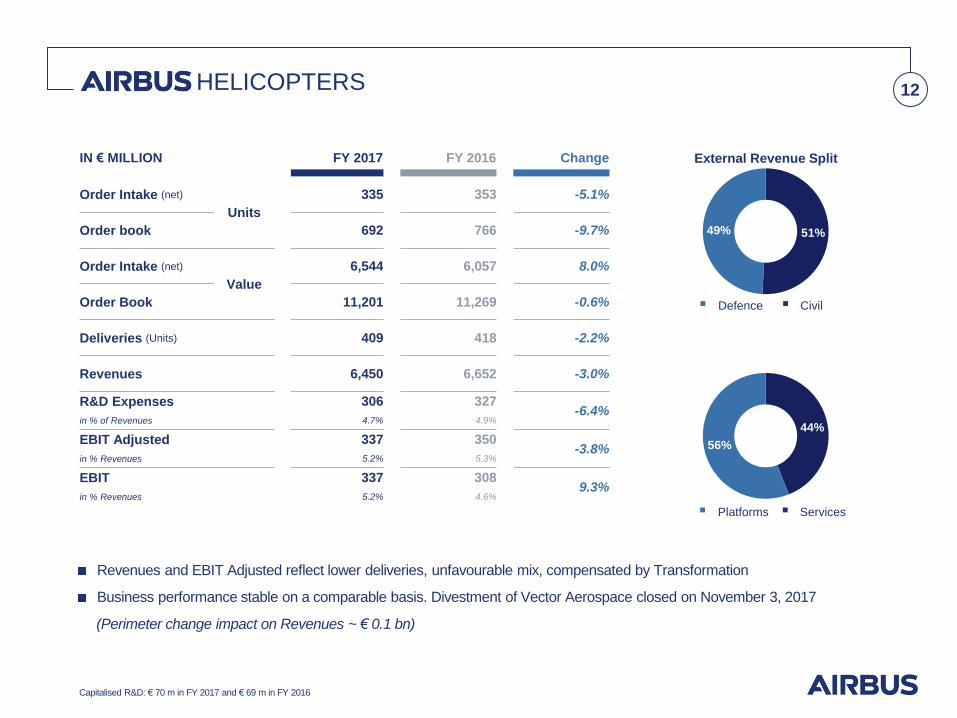
44%
56%
51% 49%
IN € MILLION FY 2017 FY 2016 Change
Order Intake (net)
Units
335 353 -5.1%
Order book 692 766 -9.7%
Order Intake (net)
Value
6,544 6,057 8.0%
Order Book 11,201 11,269 -0.6%
Deliveries (Units) 409 418 -2.2%
Revenues 6,450 6,652 -3.0%
R&D Expenses 306 327 -6.4%
in % of Revenues 4.7% 4.9%
EBIT Adjusted 337 350 -3.8%
in % Revenues 5.2% 5.3%
EBIT 337 308 9.3%
in % Revenues 5.2% 4.6%
HELICOPTERS 12
Capitalised R&D: € 70 m in FY 2017 and € 69 m in FY 2016
Revenues and EBIT Adjusted reflect lower deliveries, unfavourable mix, compensated by Transformation
Business performance stable on a comparable basis. Divestment of Vector Aerospace closed on November 3, 2017
(Perimeter change impact on Revenues ~ € 0.1 bn)
External Revenue Split
Platforms
Services
Defence
Civil
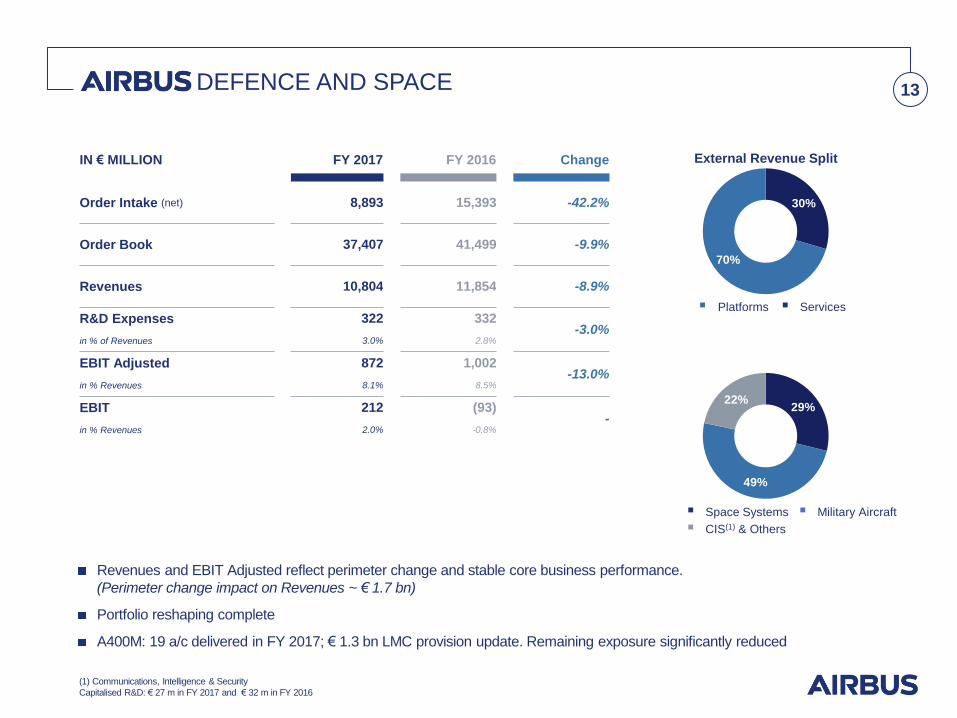
IN € MILLION FY 2017 FY 2016 Change
Order Intake (net) 8,893 15,393 -42.2%
Order Book 37,407 41,499 -9.9%
Revenues 10,804 11,854 -8.9%
R&D Expenses 322 332 -3.0%
in % of Revenues 3.0% 2.8%
EBIT Adjusted 872 1,002 -13.0%
in % Revenues 8.1% 8.5%
EBIT 212 (93) -
in % Revenues 2.0% -0.8%
DEFENCE AND SPACE 13
(1) Communications, Intelligence & Security
Capitalised R&D: € 27 m in FY 2017 and € 32 m in FY 2016
Revenues and EBIT Adjusted reflect perimeter change and stable core business performance.
(Perimeter change impact on Revenues ~ € 1.7 bn)
Portfolio reshaping complete
A400M: 19 a/c delivered in FY 2017; € 1.3 bn LMC provision update. Remaining exposure significantly reduced
External Revenue Split
Space Systems
CIS(1) & Others
Military Aircraft
Platforms
Services
30%
70%
29%
49%
22%

FY Results 2017
Company
Highlights
Divisional
Highlights
Guidance
Highlights
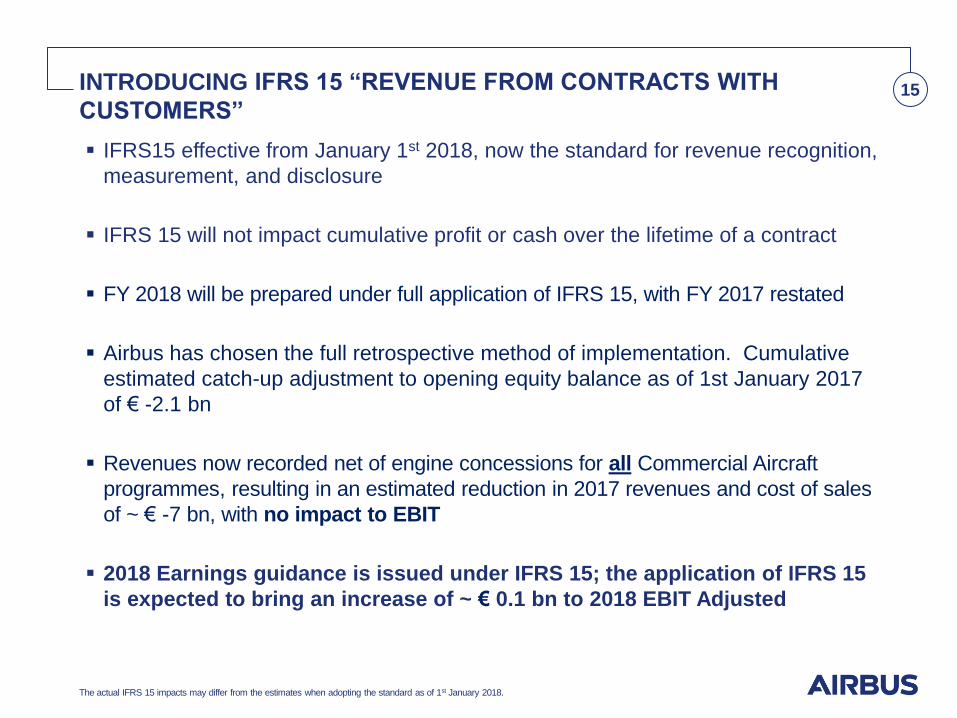
IFRS15 effective from January 1st 2018, now the standard for revenue recognition,
measurement, and disclosure
IFRS 15 will not impact cumulative profit or cash over the lifetime of a contract
FY 2018 will be prepared under full application of IFRS 15, with FY 2017 restated
Airbus has chosen the full retrospective method of implementation. Cumulative
estimated catch-up adjustment to opening equity balance as of 1st January 2017
of € -2.1 bn
Revenues now recorded net of engine concessions for all Commercial Aircraft
programmes, resulting in an estimated reduction in 2017 revenues and cost of sales
of ~ € -7 bn, with no impact to EBIT
2018 Earnings guidance is issued under IFRS 15; the application of IFRS 15
is expected to bring an increase of ~ € 0.1 bn to 2018 EBIT Adjusted
INTRODUCING IFRS 15 “REVENUE FROM CONTRACTS WITH
CUSTOMERS” 15
The actual IFRS 15 impacts may differ from the estimates when adopting the standard as of 1st January 2018.
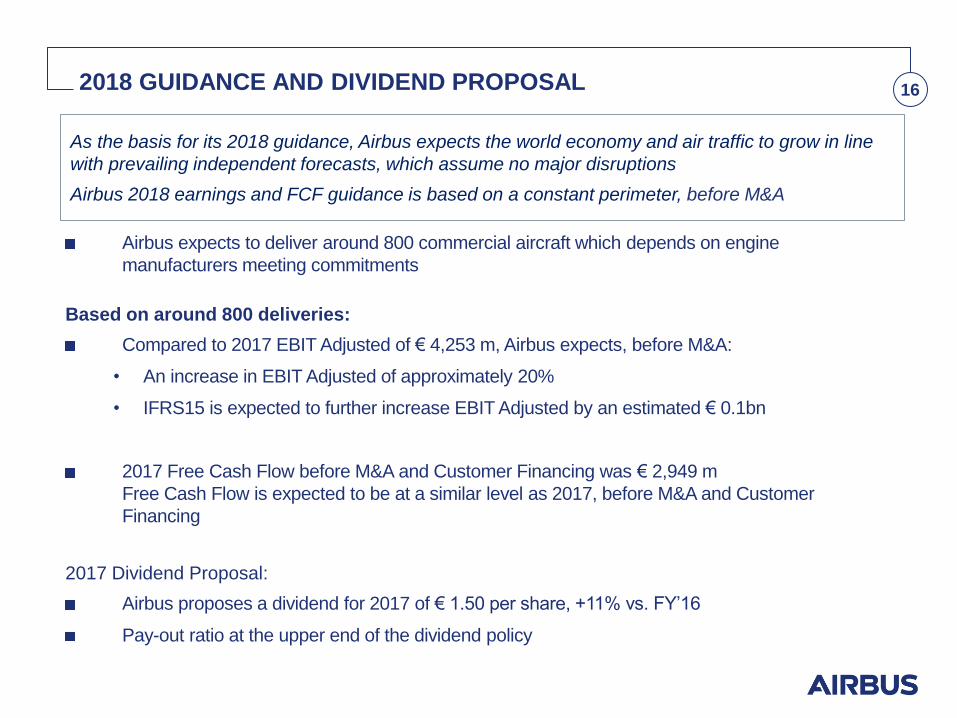
2018 GUIDANCE AND DIVIDEND PROPOSAL 16
As the basis for its 2018 guidance, Airbus expects the world economy and air traffic to grow in line
with prevailing independent forecasts, which assume no major disruptions
Airbus 2018 earnings and FCF guidance is based on a constant perimeter, before M&A
Airbus expects to deliver around 800 commercial aircraft which depends on engine
manufacturers meeting commitments
Based on around 800 deliveries:
Compared to 2017 EBIT Adjusted of € 4,253 m, Airbus expects, before M&A:
• An increase in EBIT Adjusted of approximately 20%
• IFRS15 is expected to further increase EBIT Adjusted by an estimated € 0.1bn
2017 Free Cash Flow before M&A and Customer Financing was € 2,949 m
Free Cash Flow is expected to be at a similar level as 2017, before M&A and Customer
Financing
2017 Dividend Proposal:
Airbus proposes a dividend for 2017 of € 1.50 per share, +11% vs. FY’16
Pay-out ratio at the upper end of the dividend policy
End of
Decade
KEY PRIORITIES 17
Earnings and FCF taking off!
End
2016
FY Results 2017
Appendix
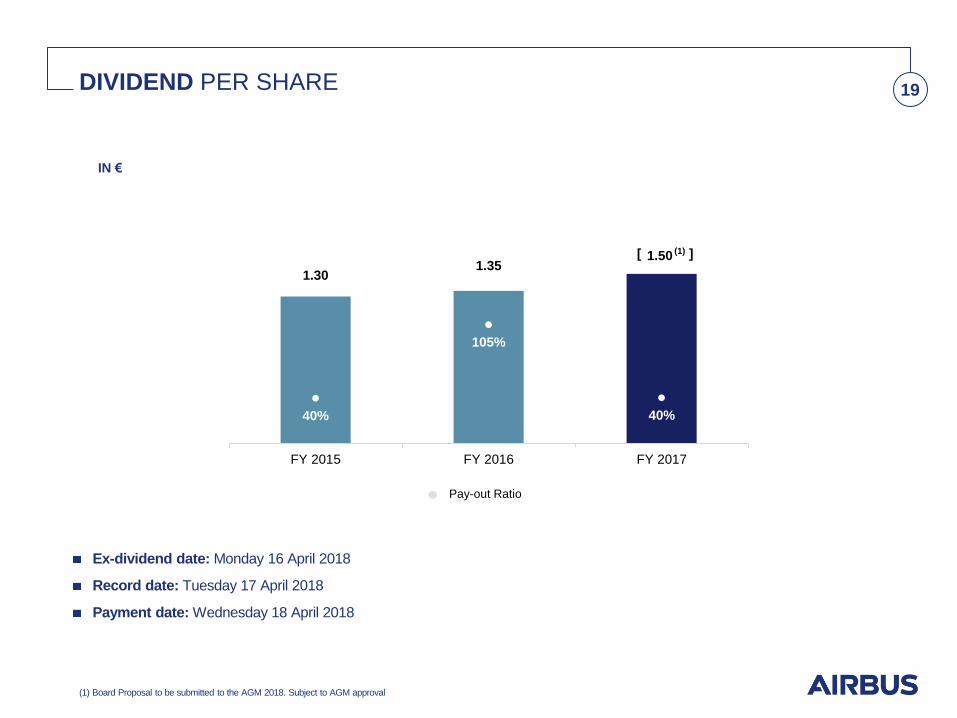
DIVIDEND PER SHARE 19
IN €
Ex-dividend date: Monday 16 April 2018
Record date: Tuesday 17 April 2018
Payment date: Wednesday 18 April 2018
(1) Board Proposal to be submitted to the AGM 2018. Subject to AGM approval
1.30 1.35
1.50
40%
105%
40%
0.00%
20.00%
40.00%
60.00%
80.00%
100.00%
120.00%
140.00%
160.00%
180.00%
FY 2015 FY 2016 FY 2017
Pay-out Ratio
[ (1) ]
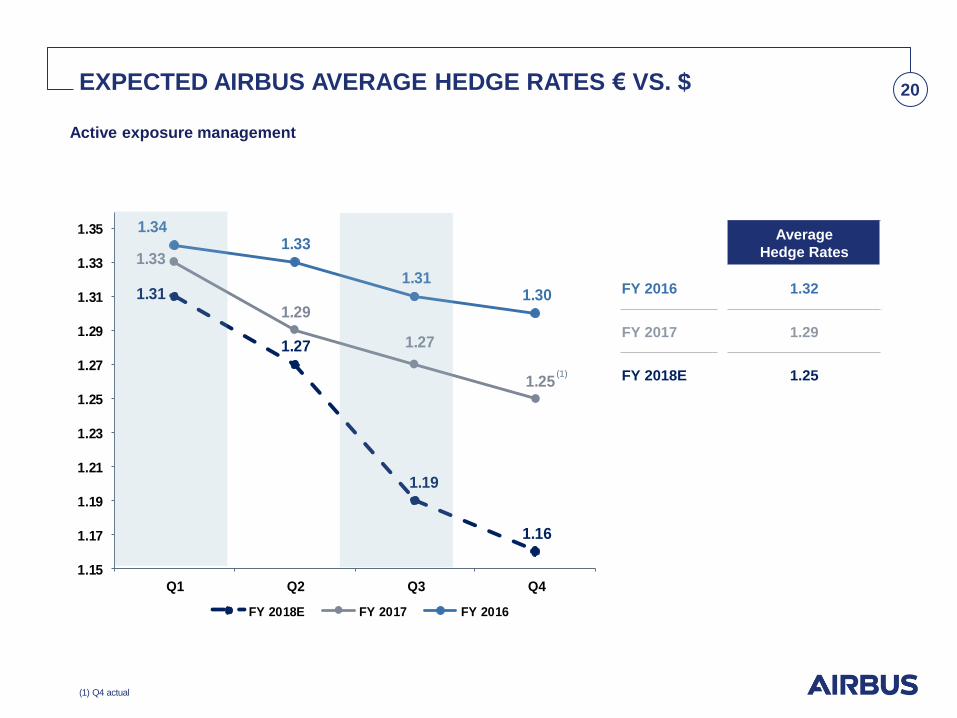
EXPECTED AIRBUS AVERAGE HEDGE RATES € VS. $ 20
(1) Q4 actual
Active exposure management
1.31
1.27
1.19
1.16
1.33
1.29
1.27
1.25
1.341.33
1.311.30
1.15
1.17
1.19
1.21
1.23
1.25
1.27
1.29
1.31
1.33
1.35
Q1 Q2 Q3 Q4
FY 2018E FY 2017 FY 2016
(1)
Average
Hedge Rates
FY 2016 1.32
FY 2017 1.29
FY 2018E 1.25
thereof Adjustments
Impact on EBIT
FY 2017 Operational HQ FX Financial
Result
FY 2017
Adjusted
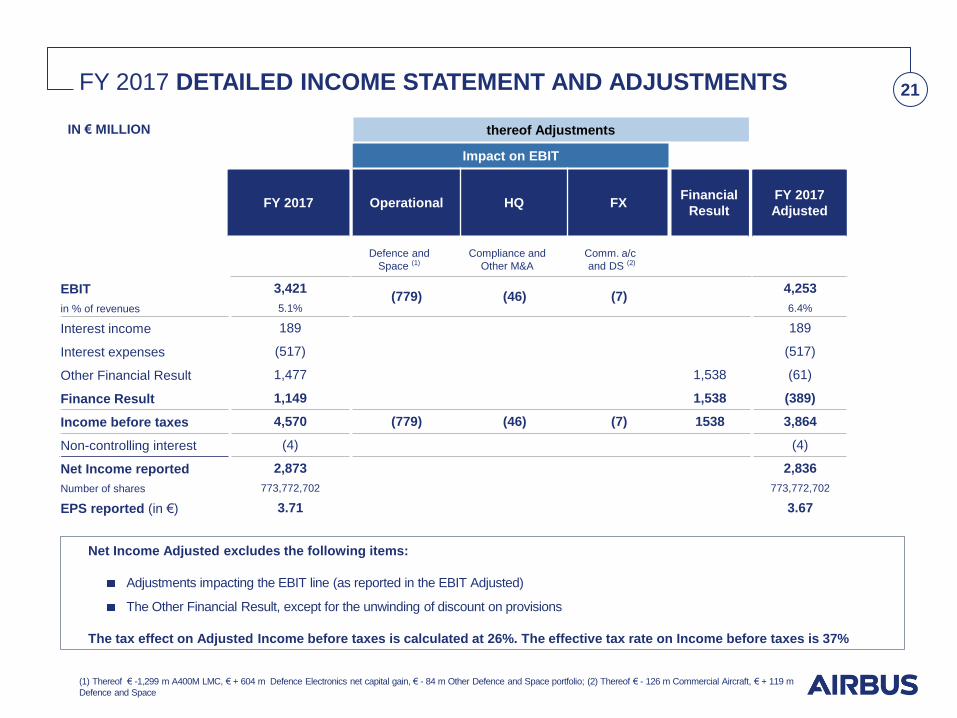
FY 2017 DETAILED INCOME STATEMENT AND ADJUSTMENTS 21
(1) Thereof € -1,299 m A400M LMC, € + 604 m Defence Electronics net capital gain, € - 84 m Other Defence and Space portfolio; (2) Thereof € - 126 m Commercial Aircraft, € + 119 m
Defence and Space
IN € MILLION
Defence and
Space (1)
Compliance and
Other M&A
Comm. a/c
and DS (2)
EBIT 3,421 (779) (46) (7)
4,253
in % of revenues 5.1% 6.4%
Interest income 189 189
Interest expenses (517) (517)
Other Financial Result 1,477 1,538 (61)
Finance Result 1,149 1,538 (389)
Income before taxes 4,570 (779) (46) (7) 1538 3,864
Non-controlling interest (4) (4)
Net Income reported 2,873 2,836
Number of shares 773,772,702 773,772,702
EPS reported (in €) 3.71 3.67
Net Income Adjusted excludes the following items:
Adjustments impacting the EBIT line (as reported in the EBIT Adjusted)
The Other Financial Result, except for the unwinding of discount on provisions
The tax effect on Adjusted Income before taxes is calculated at 26%. The effective tax rate on Income before taxes is 37%
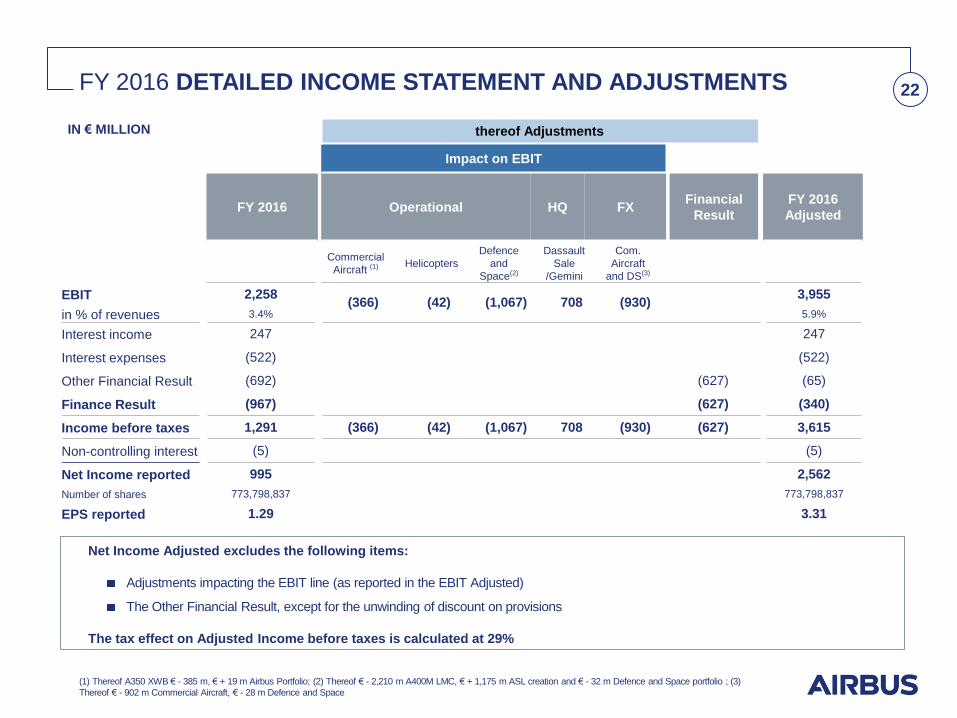
FY 2016 DETAILED INCOME STATEMENT AND ADJUSTMENTS 22
(1) Thereof A350 XWB € - 385 m, € + 19 m Airbus Portfolio; (2) Thereof € - 2,210 m A400M LMC, € + 1,175 m ASL creation and € - 32 m Defence and Space portfolio ; (3)
Thereof € - 902 m Commercial Aircraft, € - 28 m Defence and Space
IN € MILLION
Net Income Adjusted excludes the following items:
Adjustments impacting the EBIT line (as reported in the EBIT Adjusted)
The Other Financial Result, except for the unwinding of discount on provisions
The tax effect on Adjusted Income before taxes is calculated at 29%
thereof Adjustments
Impact on EBIT
FY 2016 Operational HQ FX Financial
Result
FY 2016
Adjusted
Commercial
Aircraft (1) Helicopters
Defence
and
Space(2)
Dassault
Sale
/Gemini
Com.
Aircraft
and DS(3)
EBIT 2,258 (366) (42) (1,067) 708 (930)
3,955
in % of revenues 3.4% 5.9%
Interest income 247 247
Interest expenses (522) (522)
Other Financial Result (692) (627) (65)
Finance Result (967) (627) (340)
Income before taxes 1,291 (366) (42) (1,067) 708 (930) (627) 3,615
Non-controlling interest (5) (5)
Net Income reported 995 2,562
Number of shares 773,798,837 773,798,837
EPS reported 1.29 3.31

Q4 2017 Q4 2016 Q4 2017 Q4 2016 Q4 2017 Q4 2016
Revenues EBIT Adjusted EBIT
Q4 2017 Q4 2016
Order Intake 106,900 61,262
Revenues 23,814 23,876
EBIT Adjusted 2,457 1,547
EBIT 1,109 (98)
Net Income 1,022 (816)
FCF before M&A 6,630 5,885
FCF before M&A and Customer Financing 6,293 5,592
Q4 2017 KEY FIGURES 23
IN € MILLION
Commercial Aircraft 18,315 17,726 2,009 975 1,910 770
Helicopters 2,062 2,369 172 150 172 108
Defence and Space 4,071 4,140 515 566 (688) (672)
HQ / Elim. (634) (359) (239) (144) (285) (304)
Airbus 23,814 23,876 2,457 1,547 1,109 (98)
IN € MILLION

AIRBUS: STRONG LIQUIDITY POSITION AS AT 31 DECEMBER 2017 24
€ 13.4 bn
Net Cash
€ 24.6 bn
Total Gross Cash
Invested in highly rated securities
€ 11.2 bn
Financing Liabilities
€ 3.0 bn
Credit Facility (RSCF)
Credit Facility:
Maturity 2021, undrawn
Fully committed by 40 banks
No financial covenants, no MAC clause
Financing Liabilities:
of which long-term : € 9.0 bn Includes € 3.0 bn EMTN, € 0.5 bn Convertible
Bond, € 1.1 bn exchangeable bond and $ 2.5
bn USD 144A/RegS
Credit Ratings:
Short-term rating:
S & P: A-1+
Moody´s: P-1
Long-term rating:
S & P: A+ stable
Moody’s: A2 stable
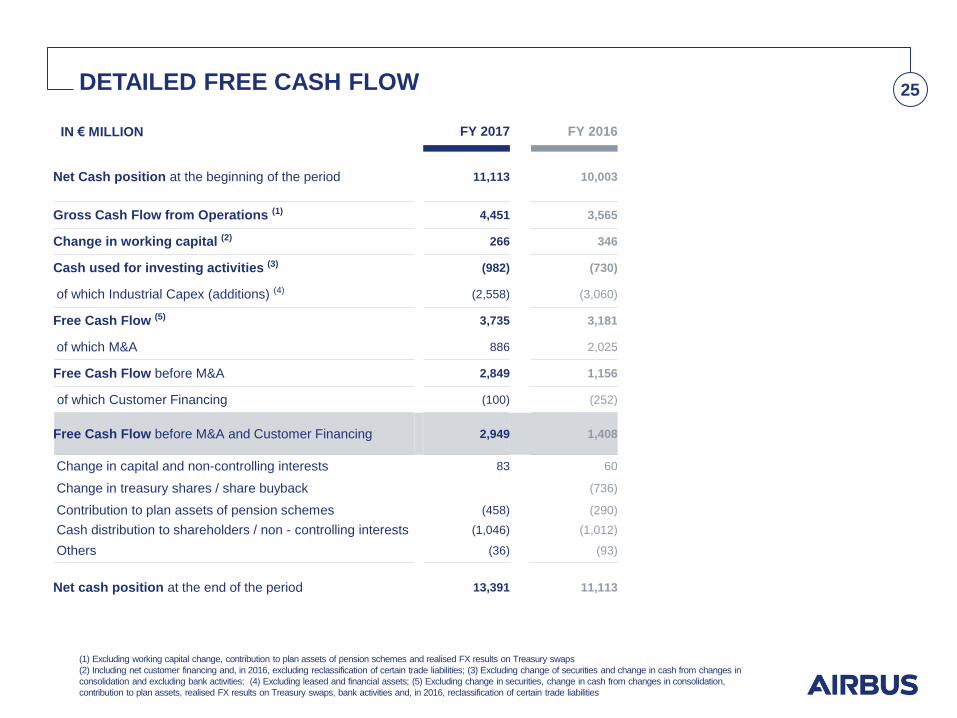
DETAILED FREE CASH FLOW 25
FY 2017 FY 2016
Net Cash position at the beginning of the period 11,113 10,003
Gross Cash Flow from Operations (1) 4,451 3,565
Change in working capital (2) 266 346
Cash used for investing activities (3) (982) (730)
of which Industrial Capex (additions) (4) (2,558) (3,060)
Free Cash Flow (5) 3,735 3,181
of which M&A 886 2,025
Free Cash Flow before M&A 2,849 1,156
of which Customer Financing (100) (252)
Free Cash Flow before M&A and Customer Financing 2,949 1,408
Change in capital and non-controlling interests 83 60
Change in treasury shares / share buyback (736)
Contribution to plan assets of pension schemes (458) (290)
Cash distribution to shareholders / non - controlling interests (1,046) (1,012)
Others (36) (93)
Net cash position at the end of the period 13,391 11,113
IN € MILLION
(1) Excluding working capital change, contribution to plan assets of pension schemes and realised FX results on Treasury swaps
(2) Including net customer financing and, in 2016, excluding reclassification of certain trade liabilities; (3) Excluding change of securities and change in cash from changes in
consolidation and excluding bank activities; (4) Excluding leased and financial assets; (5) Excluding change in securities, change in cash from changes in consolidation,
contribution to plan assets, realised FX results on Treasury swaps, bank activities and, in 2016, reclassification of certain trade liabilities
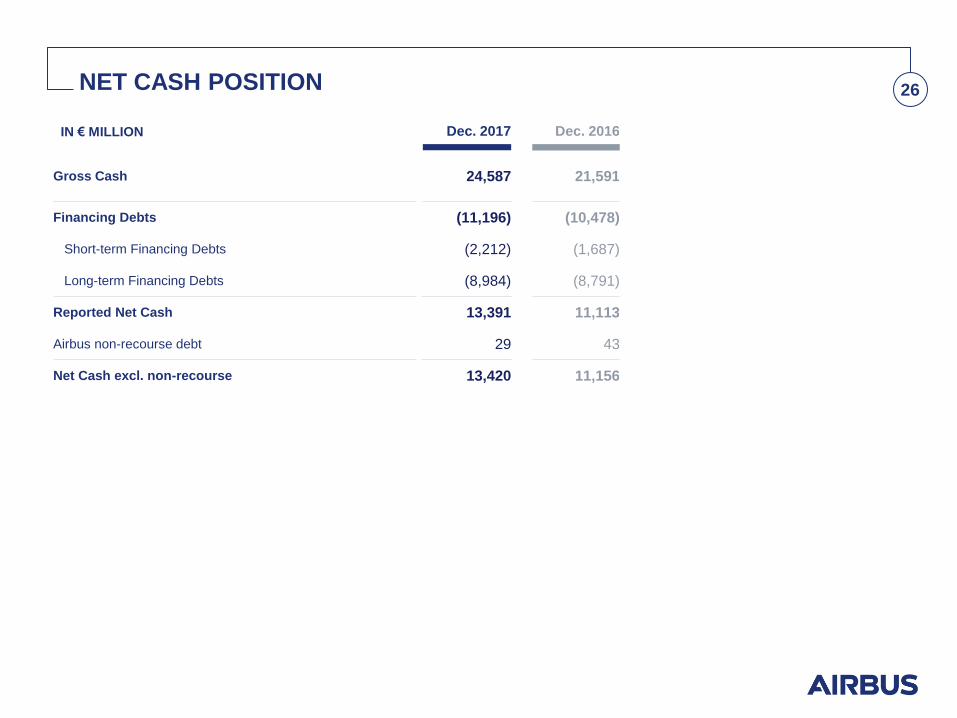
NET CASH POSITION 26
Dec. 2017 Dec. 2016
Gross Cash 24,587 21,591
Financing Debts (11,196) (10,478)
Short-term Financing Debts (2,212) (1,687)
Long-term Financing Debts (8,984) (8,791)
Reported Net Cash 13,391 11,113
Airbus non-recourse debt 29 43
Net Cash excl. non-recourse 13,420 11,156
IN € MILLION
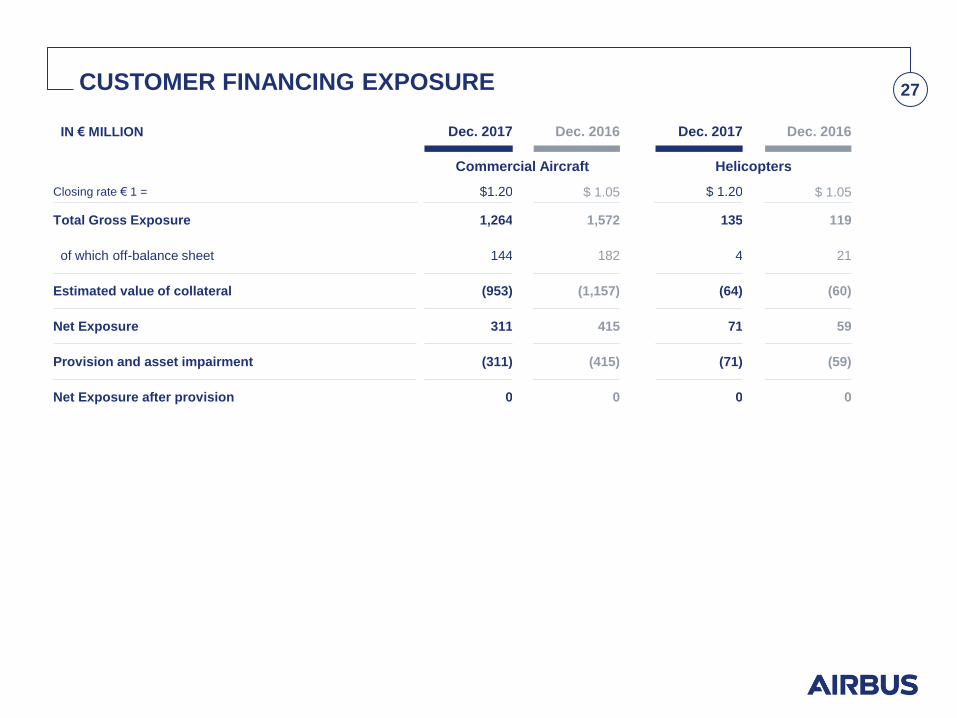
Dec. 2017 Dec. 2016 Dec. 2017 Dec. 2016
Commercial Aircraft Helicopters
CUSTOMER FINANCING EXPOSURE 27
Closing rate € 1 = $1.20 $ 1.05 $ 1.20 $ 1.05
Total Gross Exposure 1,264 1,572 135 119
of which off-balance sheet 144 182 4 21
Estimated value of collateral (953) (1,157) (64) (60)
Net Exposure 311 415 71 59
Provision and asset impairment (311) (415) (71) (59)
Net Exposure after provision 0 0 0 0
IN € MILLION
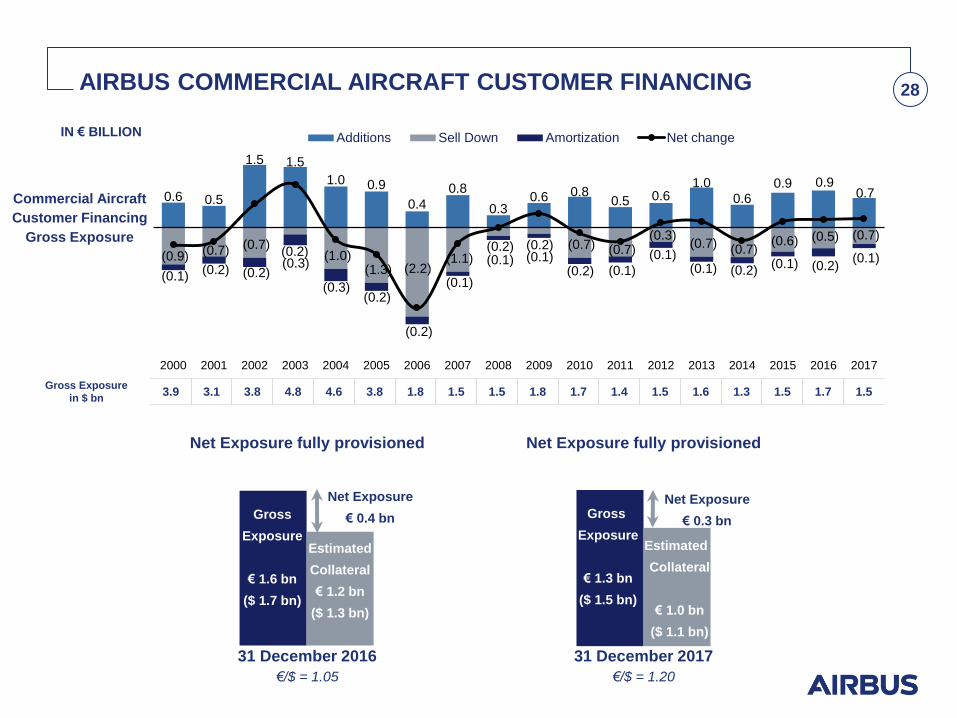
AIRBUS COMMERCIAL AIRCRAFT CUSTOMER FINANCING 28
IN € BILLION
Gross Exposure
in $ bn 3.9 3.1 3.8 4.8 4.6 3.8 1.8 1.5 1.5 1.8 1.7 1.4 1.5 1.6 1.3 1.5 1.7 1.5
Commercial Aircraft
Customer Financing
Gross Exposure
Net Exposure fully provisioned Net Exposure fully provisioned
31 December 2016
€/$ = 1.05
31 December 2017
€/$ = 1.20
0.6 0.5
1.5 1.5
1.0 0.9
0.4
0.8
0.3 0.6 0.8
0.5 0.6 1.0
0.6 0.9 0.9
0.7
(0.9) (0.7) (0.7) (0.2) (1.0)
(1.3) (2.2) (1.1)
(0.2) (0.2) (0.7) (0.7) (0.3)
(0.7) (0.7) (0.6) (0.5) (0.7)
(0.1) (0.2) (0.2)
(0.3)
(0.3) (0.2)
(0.2)
(0.1)
(0.1) (0.1) (0.2) (0.1)
(0.1) (0.1) (0.2)
(0.1) (0.2) (0.1)
2000 2001 2002 2003 2004 2005 2006 2007 2008 2009 2010 2011 2012 2013 2014 2015 2016 2017
Additions Sell Down Amortization Net change
Net Exposure
€ 0.4 bn Gross
Exposure
€ 1.6 bn
($ 1.7 bn)
Estimated
Collateral
€ 1.2 bn
($ 1.3 bn)
Gross
Exposure
€ 1.3 bn
($ 1.5 bn)
Estimated
Collateral
€ 1.0 bn
($ 1.1 bn)
Net Exposure
€ 0.3 bn
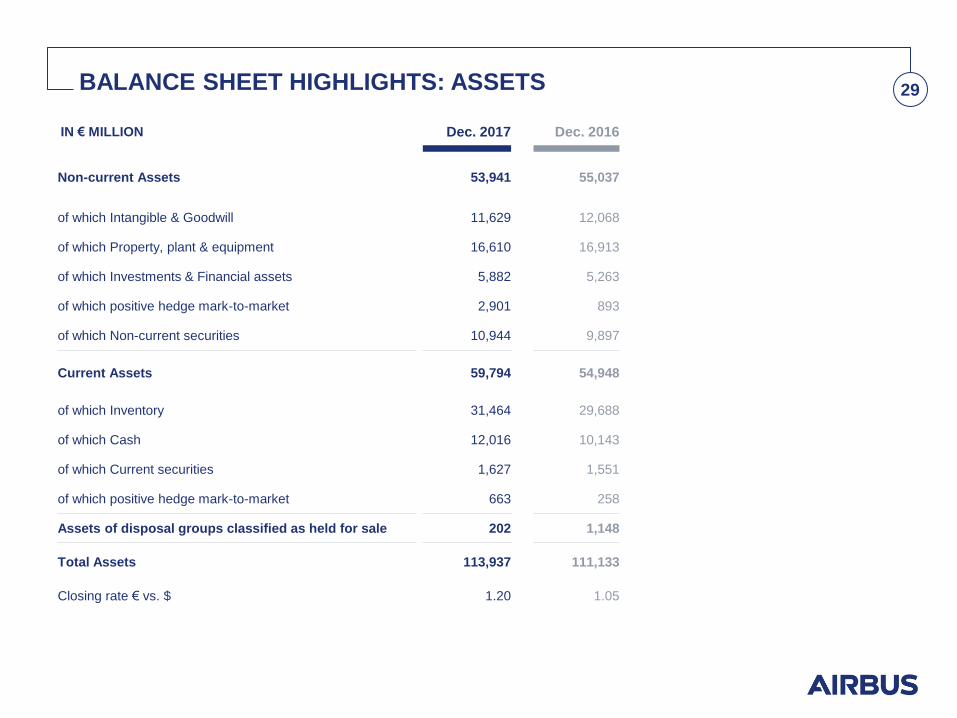
Dec. 2017 Dec. 2016
Non-current Assets 53,941 55,037
of which Intangible & Goodwill 11,629 12,068
of which Property, plant & equipment 16,610 16,913
of which Investments & Financial assets 5,882 5,263
of which positive hedge mark-to-market 2,901 893
of which Non-current securities 10,944 9,897
Current Assets 59,794 54,948
of which Inventory 31,464 29,688
of which Cash 12,016 10,143
of which Current securities 1,627 1,551
of which positive hedge mark-to-market 663 258
Assets of disposal groups classified as held for sale 202 1,148
Total Assets 113,937 111,133
Closing rate € vs. $ 1.20 1.05
BALANCE SHEET HIGHLIGHTS: ASSETS 29
IN € MILLION
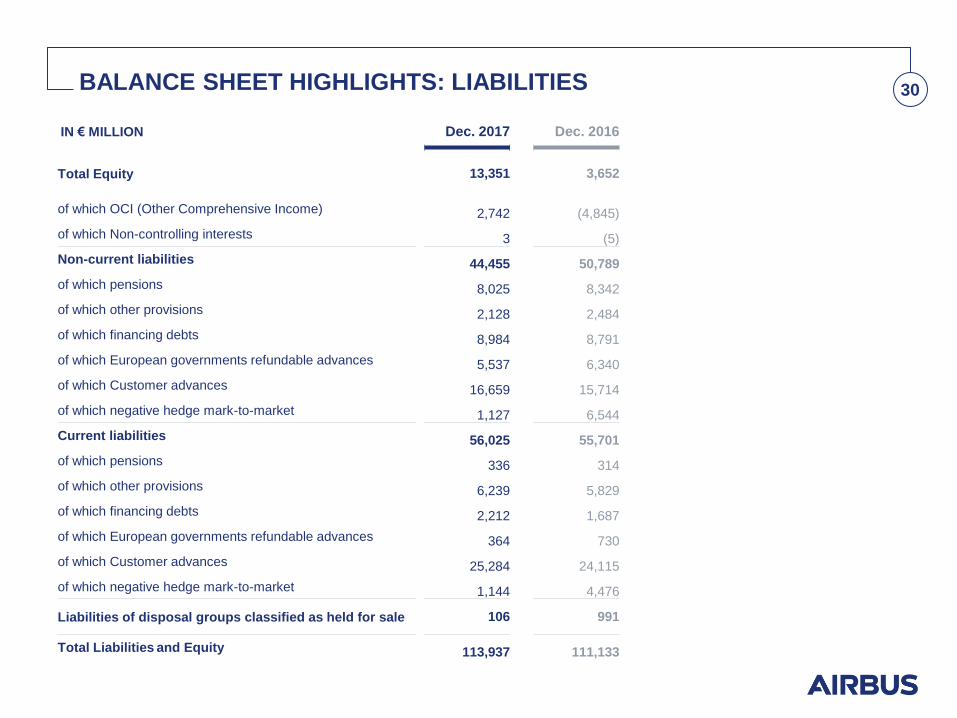
BALANCE SHEET HIGHLIGHTS: LIABILITIES 30
IN € MILLION Dec. 2017 Dec. 2016
Total Equity 13,351 3,652
of which OCI (Other Comprehensive Income) 2,742 (4,845)
of which Non-controlling interests 3 (5)
Non-current liabilities 44,455 50,789
of which pensions 8,025 8,342
of which other provisions 2,128 2,484
of which financing debts 8,984 8,791
of which European governments refundable advances 5,537 6,340
of which Customer advances 16,659 15,714
of which negative hedge mark-to-market 1,127 6,544
Current liabilities 56,025 55,701
of which pensions 336 314
of which other provisions 6,239 5,829
of which financing debts 2,212 1,687
of which European governments refundable advances 364 730
of which Customer advances 25,284 24,115
of which negative hedge mark-to-market 1,144 4,476
Liabilities of disposal groups classified as held for sale 106 991
Total Liabilities and Equity 113,937 111,133

SHAREHOLDING STRUCTURE AS AT 31 DECEMBER 2017 31
774,556,062 shares issued as at 31 December 2017
SOGEPA
GZBV
SEPI
Shareholder Agreement
Free Float
Treasury Shares
73.6%
26.4%
0.0%
73.6%
11.1%
11.1%
4.2%
11.1%
11.1%
4.2%
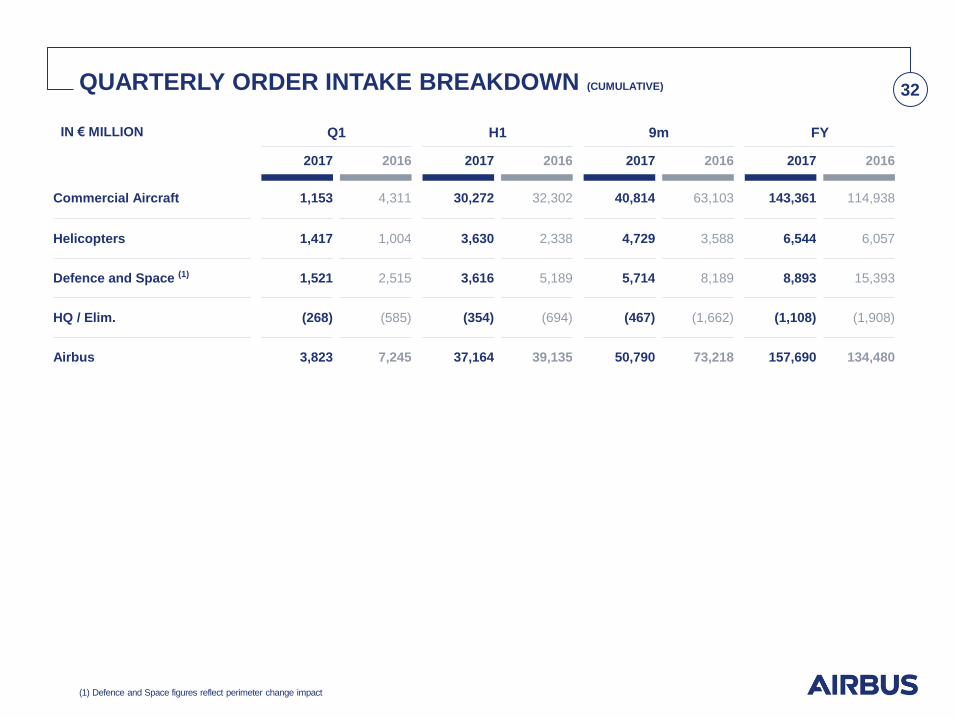
QUARTERLY ORDER INTAKE BREAKDOWN (CUMULATIVE) 32
(1) Defence and Space figures reflect perimeter change impact
IN € MILLION
Commercial Aircraft 1,153 4,311 30,272 32,302 40,814 63,103 143,361 114,938
Helicopters 1,417 1,004 3,630 2,338 4,729 3,588 6,544 6,057
Defence and Space (1) 1,521 2,515 3,616 5,189 5,714 8,189 8,893 15,393
HQ / Elim. (268) (585) (354) (694) (467) (1,662) (1,108) (1,908)
Airbus 3,823 7,245 37,164 39,135 50,790 73,218 157,690 134,480
Q1 H1 9m FY
2017 2016 2017 2016 2017 2016 2017 2016
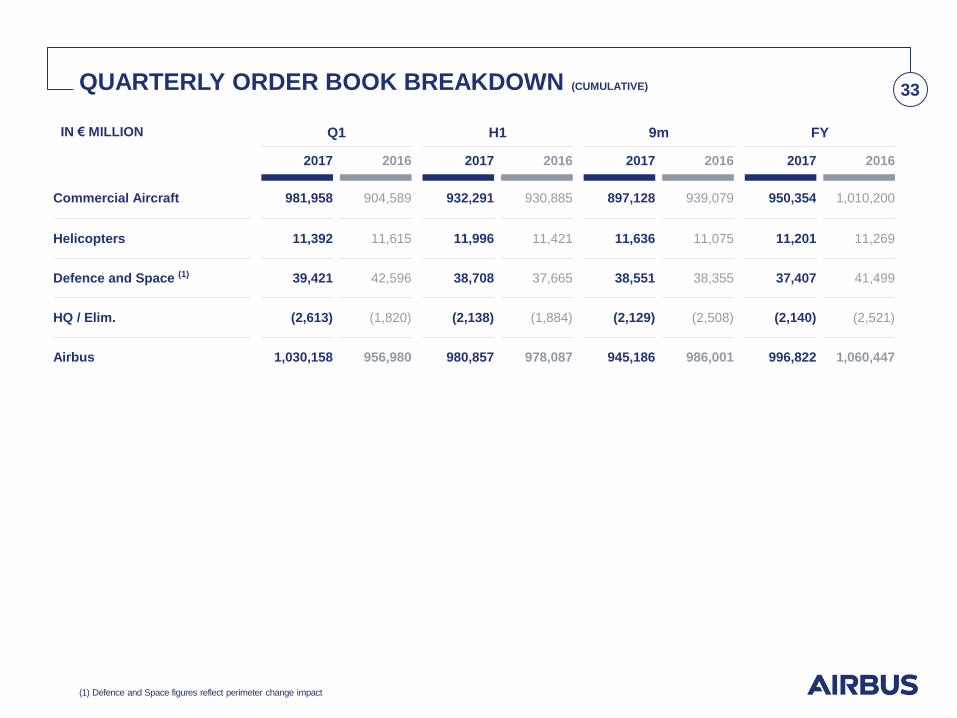
QUARTERLY ORDER BOOK BREAKDOWN (CUMULATIVE) 33
(1) Defence and Space figures reflect perimeter change impact
IN € MILLION
Commercial Aircraft 981,958 904,589 932,291 930,885 897,128 939,079 950,354 1,010,200
Helicopters 11,392 11,615 11,996 11,421 11,636 11,075 11,201 11,269
Defence and Space (1) 39,421 42,596 38,708 37,665 38,551 38,355 37,407 41,499
HQ / Elim. (2,613) (1,820) (2,138) (1,884) (2,129) (2,508) (2,140) (2,521)
Airbus 1,030,158 956,980 980,857 978,087 945,186 986,001 996,822 1,060,447
Q1 H1 9m FY
2017 2016 2017 2016 2017 2016 2017 2016
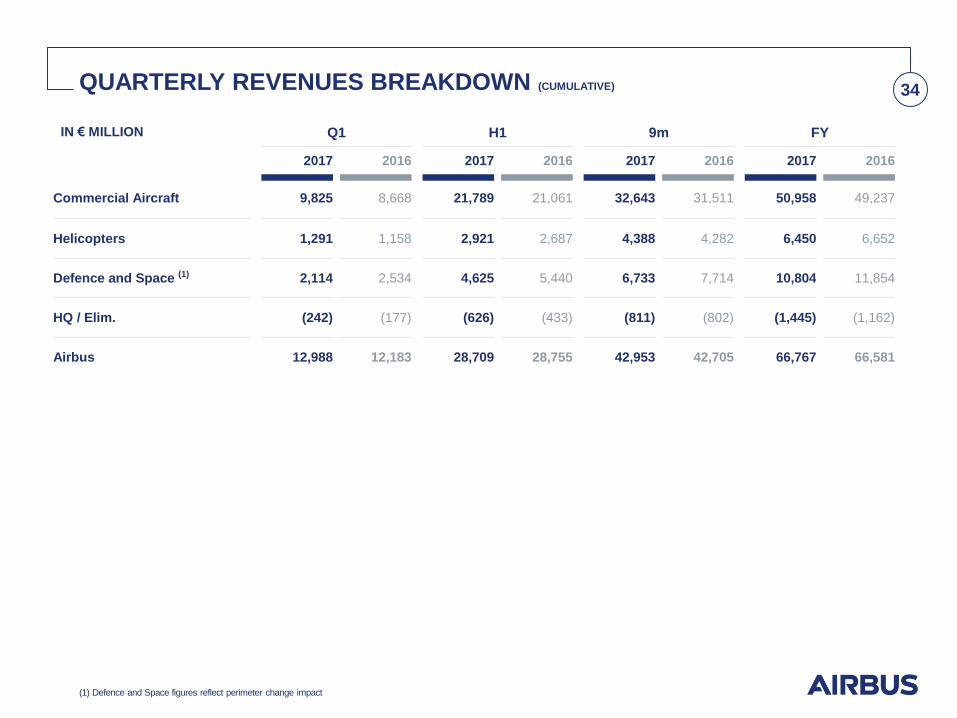
QUARTERLY REVENUES BREAKDOWN (CUMULATIVE) 34
(1) Defence and Space figures reflect perimeter change impact
IN € MILLION
Commercial Aircraft 9,825 8,668 21,789 21,061 32,643 31,511 50,958 49,237
Helicopters 1,291 1,158 2,921 2,687 4,388 4,282 6,450 6,652
Defence and Space (1) 2,114 2,534 4,625 5,440 6,733 7,714 10,804 11,854
HQ / Elim. (242) (177) (626) (433) (811) (802) (1,445) (1,162)
Airbus 12,988 12,183 28,709 28,755 42,953 42,705 66,767 66,581
Q1 H1 9m FY
2017 2016 2017 2016 2017 2016 2017 2016
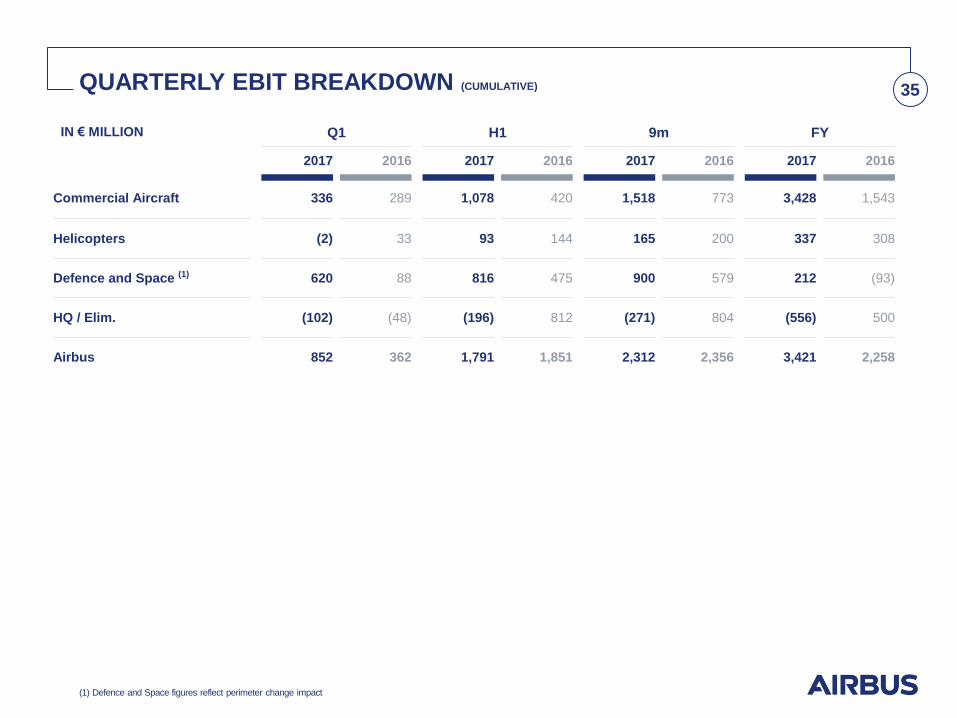
QUARTERLY EBIT BREAKDOWN (CUMULATIVE) 35
(1) Defence and Space figures reflect perimeter change impact
IN € MILLION
Commercial Aircraft 336 289 1,078 420 1,518 773 3,428 1,543
Helicopters (2) 33 93 144 165 200 337 308
Defence and Space (1) 620 88 816 475 900 579 212 (93)
HQ / Elim. (102) (48) (196) 812 (271) 804 (556) 500
Airbus 852 362 1,791 1,851 2,312 2,356 3,421 2,258
Q1 H1 9m FY
2017 2016 2017 2016 2017 2016 2017 2016

Q1 H1 9m FY
2017 2016 2017 2016 2017 2016 2017 2016
QUARTERLY EBIT ADJUSTED BREAKDOWN (CUMULATIVE) 36
(1) Defence and Space figures reflect perimeter change impact
IN € MILLION
Commercial Aircraft 281 406 954 1,269 1,545 1,836 3,554 2,811
Helicopters (2) 33 93 144 165 200 337 350
Defence and Space (1) 63 107 248 322 357 436 872 1,002
HQ / Elim. (102) (48) (196) (56) (271) (64) (510) (208)
Airbus 240 498 1,099 1,679 1,796 2,408 4,253 3,955
FY 2017
Cash provided by (used for) operating activities 4.5
t/o Reimbursement from / contribution to plan assets (0.5)
t/o Treasury swaps 0.2
t/o Change in working capital 0.3
Gross Cash Flow from Operations 4.5
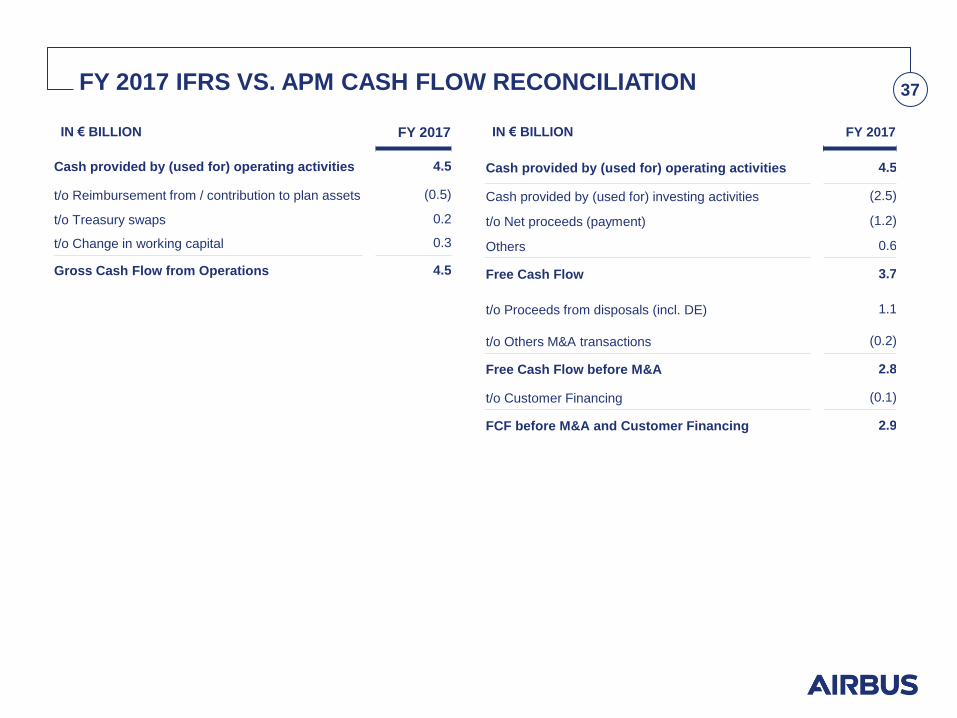
FY 2017 IFRS VS. APM CASH FLOW RECONCILIATION 37
IN € BILLION FY 2017
Cash provided by (used for) operating activities 4.5
Cash provided by (used for) investing activities (2.5)
t/o Net proceeds (payment) (1.2)
Others 0.6
Free Cash Flow 3.7
t/o Proceeds from disposals (incl. DE) 1.1
t/o Others M&A transactions (0.2)
Free Cash Flow before M&A 2.8
t/o Customer Financing (0.1)
FCF before M&A and Customer Financing 2.9
IN € BILLION
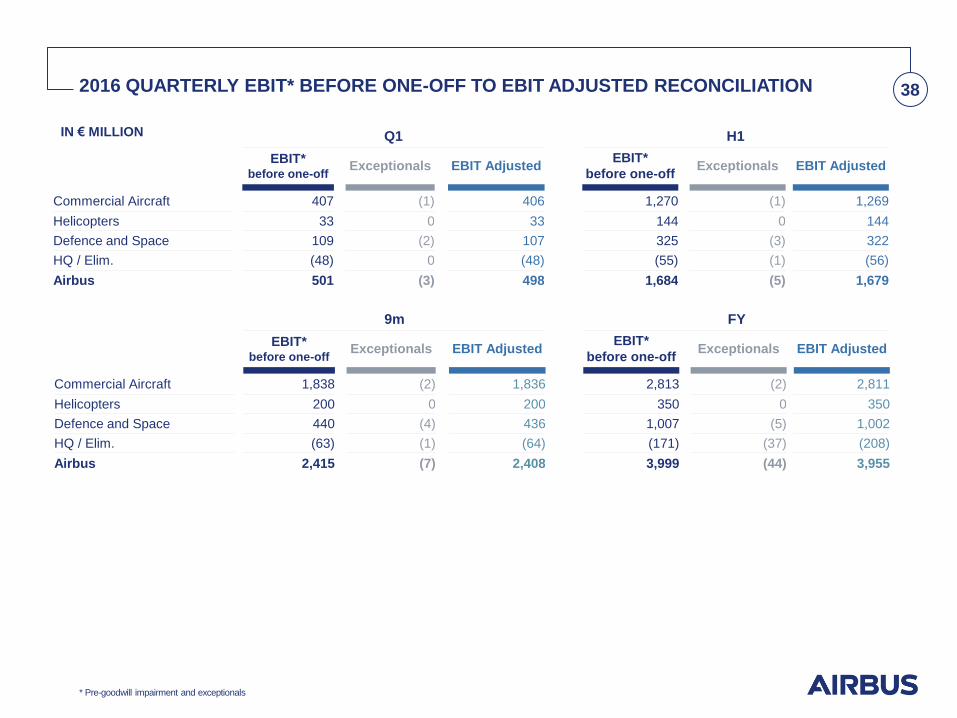
9m FY
EBIT*
before one-off Exceptionals EBIT Adjusted
EBIT*
before one-off Exceptionals EBIT Adjusted
Commercial Aircraft 1,838 (2) 1,836 2,813 (2) 2,811
Helicopters 200 0 200 350 0 350
Defence and Space 440 (4) 436 1,007 (5) 1,002
HQ / Elim. (63) (1) (64) (171) (37) (208)
Airbus 2,415 (7) 2,408 3,999 (44) 3,955
2016 QUARTERLY EBIT* BEFORE ONE-OFF TO EBIT ADJUSTED RECONCILIATION 38
* Pre-goodwill impairment and exceptionals
Q1 H1
EBIT*
before one-off Exceptionals EBIT Adjusted
EBIT*
before one-off Exceptionals EBIT Adjusted
Commercial Aircraft 407 (1) 406 1,270 (1) 1,269
Helicopters 33 0 33 144 0 144
Defence and Space 109 (2) 107 325 (3) 322
HQ / Elim. (48) 0 (48) (55) (1) (56)
Airbus 501 (3) 498 1,684 (5) 1,679
IN € MILLION
39 GLOSSARY ON ALTERNATIVE PERFORMANCE MEASURES (APM)
The following Presentation also contains certain “non-GAAP financial measures”, i.e. financial measures that either exclude or include amounts that are not
excluded or included in the most directly comparable measure calculated and presented in accordance with IFRS. For example, Airbus makes use of the non-
GAAP measures “EBIT Adjusted”, “EPS Adjusted” and “Free Cash Flow”.
Airbus uses these non-GAAP financial measures to assess its consolidated financial and operating performance and believes they are helpful in identifying
trends in its performance. These measures enhance management’s ability to make decisions with respect to resource allocation and whether Airbus is meeting
established financial goals.
Non-GAAP financial measures have certain limitations as analytical tools, and should not be considered in isolation or as substi tutes for analysis of Airbus’
results as reported under IFRS. Because of these limitations, they should not be considered substitutes for the relevant IFRS measures.
EBIT: Airbus continues to use the term EBIT (Earnings before interest and taxes). It is identical to Profit before finance cost and income taxes as defined by
IFRS Rules.
Adjustment is an alternative performance measure used by Airbus which includes material charges or profits caused by movements in provisions related to
programmes, restructuring or foreign exchange impacts as well as capital gains/losses from the disposal and acquisition of businesses.
EBIT Adjusted: Airbus uses an alternative performance measure, EBIT Adjusted as a key indicator capturing the underlying business margin by excluding
material charges or profits caused by movements in provisions related to programmes, restructuring or foreign exchange impacts as well as capital
gains/losses from the disposal and acquisition of businesses.
EPS Adjusted is an alternative performance measure of a basic EPS as reported whereby the net income as the numerator does include Adjustments. For
reconciliation see slide 21.
Gross Cash position: Airbus defines its consolidated gross cash position as the sum of (i) cash and cash equivalents and (ii) securities (all as recorded in
the consolidated statement of financial position).
Net cash position: Airbus defines its consolidated net cash position as the sum of (i) cash and cash equivalents and (ii) securities, minus (iii) financing
liabilities (all as recorded in the consolidated statement of financial position) as defined in MD&A section 2.1.6.
Gross cash flow from operations: Gross cash flow from operations is an alternative performance measure and an indicator used by Airbus to measure its
operating cash performance before changes in working capital. It is defined in Registration Document, MD&A section 2.1.6 as cash provided by operating
activities, excluding (i) changes in other operating assets and liabilities (working capital), (ii) contribution to plan assets of pension schemes and (iii) realised
foreign exchange results on Treasury swaps.
Change in working capital: it is identical to changes in other operating assets and liabilities as defined by IFRS Rules. It is comprised of inventories, trade
receivables, other assets and prepaid expenses netted against trade liabilities, other liabilities (including customer advances), deferred income and
customer financing.
FCF: For the definition of the alternative performance measure free cash flow, see Registration Document, MD&A section 2.1.6.1. It is a key indicator which
allows the Company to measure the amount of cash flow generated from operations after cash used in investing activities.
FCF before M&A refers to FCF as defined in the Registration Document, MD&A section 2.1.6.1. adjusted for net proceeds from disposals and acquisitions.
It is an alternative performance measure and indicator that is important in order to measure FCF excluding those cash flows from the disposal and
acquisition of businesses.
FCF before M&A and Customer Financing refers to free cash flow before mergers and acquisitions adjusted for cash flow related to aircraft financing
activities. It is an alternative performance measure and indicator that may be used from time to time by the Company in its financial guidance, esp. when
there is higher uncertainty around customer financing activities, such as during the suspension of ECA financing support.