
Airborne measurements of the size distribution of ...metnet.imd.gov.in/mausamdocs/156134_F.pdf ·...
14
MAUSAM, 56, 1 (January 2005), 301-314 551.510.42 : 551.46.072 (267.37) (301) Airborne measurements of the size distribution of submicron aerosols over the Arabian Sea during ARMEX – Phase I P. MURUGAVEL, V. GOPALAKRISHNAN and A. K. KAMRA Indian Institute of Tropical Meteorology, Pune – 411 008, India e mail : [email protected] lkj lkj lkj lkj & vjc lkxj ekulwu iz;ksx ¼vkjesDl½ ds nkSjku 6 vxLr ls 24 vxLr 2002 rd vjc lkxj es a lcekbØkWu ok;qfoy;ks a ds lkanz.k vkSj vkdkj ds oxhZdj.k ds ok;q okfgr eki fjdkMZ fd, x, gS aA bu ifj.kkeks a ls ;g irk pyrk gS fd tc feJ.k ¼fefDlax½ lrg dh xgurk bl m¡pkbZ ls vf/kd gks rks 0-9 fd-eh- dh m¡pkbZ ij ok;qfoy; lkanz.k dqN cM+ s gks rs gSa A blds vykok mRrjh if’peh Hkkjr ds e:LFkyks a ls vfHkofgr ok;q jkf’k dh rqyuk es a e/; vjc lkxj vFkok vjc ds e:LFkyks a ls vfHkofgr ok;q jkf’k ds eku 5-1&6 fd- eh- dh Å¡pkbZ ij ok;qfoy; lkanz.k ds eku ,d ls rhu xquk rd vf/kd gks tkrs gSA 0-9 fd- eh- ds Lrj ij ok;q foy; ds vkdkj ds oxhZdj.k lap;u eksM es a 133 ,u- ,e- ij vf/kdre vkSj 75 ,oa 480 ,u- ,e- ij U;wure ckbeksMy vFkok VªkbZeksMy gSaA 5-1&6 fd-eh- dh Å¡pkbZ ij vkdkj ds oxhZdj.k es a ykWx ukeZy dh vks j iz o` r gks rs gSaA bu ifj.kkeks a ls ;g fu"d"kZ fudyrk gS fd ok;qfoy;ks a dk teko vkSj xq:Rokd"kZ.k ds ryNV dh izfØ;k,a eq[;r% leqnz ij fuEu Å¡pkbZ;ks a ij ik, x, vkdkj ds oxhZdj.k dh ekWMy izd`fr ds fodkl dk fu:i.k djrh gSA ok;qfoy;ks a ds vkdkj ds oxhZdj.k dks ifj"d` r djus dh vks j ys tkus okyh izfØ;kvks a ds ckjs es a Hkh bl ’kks/k&Ik= es a ppkZ dh xbZ gSA ABSTRACT. Airborne measurements of the concentration and size distribution of submicron aerosols are made from 6 to 24 August 2002 over the Arabian Sea during the Arabian Sea Monsoon Experiment (ARMEX). Results show that the aerosol concentrations at 0.9 km altitude are larger if the mixing layer depth is more than this height. Further, values of aerosol concentration at 5.1 – 6 kms altitude are one to three orders of magnitude higher if the air mass is being advected from the central Arabian Sea or the Arabian deserts in comparison to the values when the air mass is being advected up from the deserts of the northwest India. Aerosol size distributions at 0.9 km level are bimodal or trimodal with a maximum at 133 nm in accumulation mode and the minima at 75 and 480 nm. Size distributions tend to become log-normal at 5.1 – 6 km altitudes. Results suggest that the processes of aerosol coagulation and gravitational settling mainly determine the evolution of modal nature of size distributions observed at lower altitudes over sea. Processes leading to modification of size distribution are also discussed. Key words - ARMEX, Size distribution of submicron aerosols, Aerosol profiles over Arabian Sea, Airborne measurements. 1. Introduction The observations made during the NE monsoon season during the Indian Ocean Experiment (INDOEX) demonstrate that the haze created by continental pollutants extends over a wide area and covers much of the Arabian Sea, the northern Indian Ocean and extends upto the ITCZ mostly located in the southern hemisphere in the northeast monsoon season (Ramanathan et al., 2001; Lelieveld et al., 2001; Deshpande and Kamra, 2002a and b; Kamra et al., 2003). Ship-borne measurements of Satheesh et al. (1998), Deshpande and Kamra, 2002a and Kamra et al. (2003) show a decrease in aerosol concentrations and optical depth with distance from the coast. Columnar aerosol number size distributions retrieved from radiometric measurements show a bimodal distribution showing an accumulation mode with a mean mode diameter at 0.1 - 0.2 μm and a coarse mode at 1 – 2 μm diameter. Moorthy et al. (1993) and Murugavel and Kamra (1999) reported a change in aerosol size- distribution and attributed it to sea-breeze at a tropical coastal station. de Reus et al. (2001) has made aircraft measure- ments of the aerosols number concentration and size distribution upto an altitude of 12.5 km over the northern Indian Ocean during the INDOEX. Here, we report some results from our aircraft measurements of the concentration and size distribution of submicron aerosols extending upto an altitude of 6 km over the Arabian Sea made during the southwest monsoon season of the Phase I of the Arabian Sea Monsoon Experiment (ARMEX- I) conducted in August, 2002.
Transcript of Airborne measurements of the size distribution of ...metnet.imd.gov.in/mausamdocs/156134_F.pdf ·...

MAUSAM, 56, 1 (January 2005), 301-314
551.510.42 : 551.46.072 (267.37)
(301)
Airborne measurements of the size distribution of submicron aerosols over the
Arabian Sea during ARMEX – Phase I
P. MURUGAVEL, V. GOPALAKRISHNAN and A. K. KAMRA
Indian Institute of Tropical Meteorology, Pune – 411 008, India
e mail : [email protected]
lkj lkj lkj lkj & vjc lkxj ekulwu iz;ksx ¼vkjesDl½ ds nkSjku 6 vxLr ls 24 vxLr 2002 rd vjc lkxj esa
lcekbØkWu ok;qfoy;ksa ds lkanz.k vkSj vkdkj ds oxhZdj.k ds ok;qokfgr eki fjdkMZ fd, x, gSaA bu ifj.kkeksa ls ;g irk pyrk gS fd tc feJ.k ¼fefDlax½ lrg dh xgurk bl m¡pkbZ ls vf/kd gks rks 0-9 fd-eh- dh m¡pkbZ ij ok;qfoy; lkanz.k dqN cM+s gksrs gSaA blds vykok mRrjh if’peh Hkkjr ds e:LFkyksa ls vfHkofgr ok;qjkf’k dh rqyuk esa e/; vjc lkxj vFkok vjc ds e:LFkyksa ls vfHkofgr ok;qjkf’k ds eku 5-1&6 fd- eh- dh Å¡pkbZ ij ok;qfoy; lkanz.k ds eku ,d ls rhu xquk rd vf/kd gks tkrs gSA 0-9 fd- eh- ds Lrj ij ok;q foy; ds vkdkj ds oxhZdj.k lap;u eksM esa 133 ,u- ,e- ij vf/kdre vkSj 75 ,oa 480 ,u- ,e- ij U;wure ckbeksMy vFkok VªkbZeksMy gSaA 5-1&6 fd-eh- dh Å¡pkbZ ij vkdkj ds oxhZdj.k esa ykWx ukeZy dh vksj izor̀ gksrs gSaA bu ifj.kkeksa ls ;g fu"d"kZ fudyrk gS fd ok;qfoy;ksa dk teko vkSj xq:Rokd"kZ.k ds ryNV dh izfØ;k,a eq[;r% leqnz ij fuEu Å¡pkbZ;ksa ij ik, x, vkdkj ds oxhZdj.k dh ekWMy izd`fr ds fodkl dk fu:i.k djrh gSA ok;qfoy;ksa ds vkdkj ds oxhZdj.k dks ifj"dr̀ djus dh vksj ys tkus okyh izfØ;kvksa ds ckjs esa Hkh bl ’kks/k&Ik= esa ppkZ dh xbZ gSA
ABSTRACT. Airborne measurements of the concentration and size distribution of submicron aerosols are made
from 6 to 24 August 2002 over the Arabian Sea during the Arabian Sea Monsoon Experiment (ARMEX). Results show that the aerosol concentrations at 0.9 km altitude are larger if the mixing layer depth is more than this height. Further, values of aerosol concentration at 5.1 – 6 kms altitude are one to three orders of magnitude higher if the air mass is being advected from the central Arabian Sea or the Arabian deserts in comparison to the values when the air mass is being advected up from the deserts of the northwest India. Aerosol size distributions at 0.9 km level are bimodal or trimodal with a maximum at 133 nm in accumulation mode and the minima at 75 and 480 nm. Size distributions tend to become log-normal at 5.1 – 6 km altitudes. Results suggest that the processes of aerosol coagulation and gravitational settling mainly determine the evolution of modal nature of size distributions observed at lower altitudes over sea. Processes leading to modification of size distribution are also discussed.
Key words − ARMEX, Size distribution of submicron aerosols, Aerosol profiles over Arabian Sea, Airborne
measurements. 1. Introduction
The observations made during the NE monsoon season during the Indian Ocean Experiment (INDOEX) demonstrate that the haze created by continental pollutants extends over a wide area and covers much of the Arabian Sea, the northern Indian Ocean and extends upto the ITCZ mostly located in the southern hemisphere in the northeast monsoon season (Ramanathan et al., 2001; Lelieveld et al., 2001; Deshpande and Kamra, 2002a and b; Kamra et al., 2003). Ship-borne measurements of Satheesh et al. (1998), Deshpande and Kamra, 2002a and Kamra et al. (2003) show a decrease in aerosol concentrations and optical depth with distance from the coast. Columnar aerosol number size distributions retrieved from radiometric measurements show a bimodal distribution showing an accumulation mode with a mean mode
diameter at 0.1 - 0.2 µm and a coarse mode at 1 – 2 µm diameter. Moorthy et al. (1993) and Murugavel and Kamra (1999) reported a change in aerosol size-distribution and attributed it to sea-breeze at a tropical coastal station.
de Reus et al. (2001) has made aircraft measure-
ments of the aerosols number concentration and size distribution upto an altitude of 12.5 km over the northern Indian Ocean during the INDOEX. Here, we report some results from our aircraft measurements of the concentration and size distribution of submicron aerosols extending upto an altitude of 6 km over the Arabian Sea made during the southwest monsoon season of the Phase I of the Arabian Sea Monsoon Experiment (ARMEX- I) conducted in August, 2002.

302 MAUSAM, 56, 1 (January 2005)
Figs. 1(a-c). Schematic diagram of (a) air inlet tube, (b) air chamber, and (c) installation of the equipment on the aircraft
2. Instrumentation
An Electrical Aerosol Analyzer (EAA) System (3010 model of TSI) has been used for measurements of the aerosol concentration and size distribution which measures particles of 3 – 1000 nm diameter in 10 different size bins. However, since the accuracy of the instrument in the lowest two channels is not sufficient, measurements were made only in eight channels with mid-point diameters of 13, 24, 48, 75, 133, 240, 480 and 750 nm covering a range of 10 – 1000 nm. The instrument samples ambient air at the rate of 50 lpm and uses only 5 lpm for measurement and 45 lpm as sheath air. The air sample is first passed through a diffusion charger where the aerosols are exposed to gaseous unipolar ions. These charged aerosols are then passed through a mobility analyzer which collects the charged aerosols of same mobility for a particular size range. Likewise, ten mobility ranges are collected to get one full size distribution. The number concentration is then derived from this mobility spectrum. It takes one minute to complete one full size distribution. Since it needs one minute to complete one full size distribution, the constant level flights are conducted atleast for 5 minutes so as to have 5 size-distribution samples at each level.
An AN-32 aircraft of the Indian Air Force was
modified to accommodate the air intake and exhaust systems, measuring instruments, logging computers and control system for measurements of the aerosols and
electrical conductivity of the atmosphere. The Electrical Aerosol Analyzer (EAA) was fitted in the aircraft to measure aerosol number concentration. An air inlet, designed to draw 2165 lpm of air, comprised of a 25 mm OD and 2 mm thick metallic pipe bent smoothly such that the forward facing nozzle protrudes 21 cm from the skin of nose cone and is aligned parallel to the direction of motion [Fig. 1(a)]. The air inlet draws the required air on its own by the aerodynamic force at the average aircraft speed of 350 kmph. This inlet was fixed, at the ‘Single Flare Cartridge Dispenser’ on the port side of the aircraft nose which is located about 5 m ahead of the aircraft propeller so that the air samples are not disturbed by propeller’s circulation. The air is taken through a smooth air duct of the same diameter [Fig. 1(c)] which channels the air to a small chamber shown in Fig. 1(b), from where the air samples are drawn for the individual instruments. The air sample required for the measurement of the electric conductivity with a Gerdien’s apparatus are also taken from the small chamber shown in Fig. 1(b). Results of our measurements of the air electric conductivity will be reported elsewhere. The duct does not have any right-angled bends and is fitted by bending it smoothly at less than 20° at four places. The air is finally extracted out of the aircraft with a 5 cm diameter nozzle facing downwind and fitted in the fuselage of the aircraft. The instruments along with the PC-based data acquisition system and the necessary power supply units were fitted in the fuselage on a shock-proof table specially designed and fabricated for the purpose.
MURUGAVEL et al. : AIRBORNE MEASUREMENTS OF SUBMICRON AEROSOLS 303
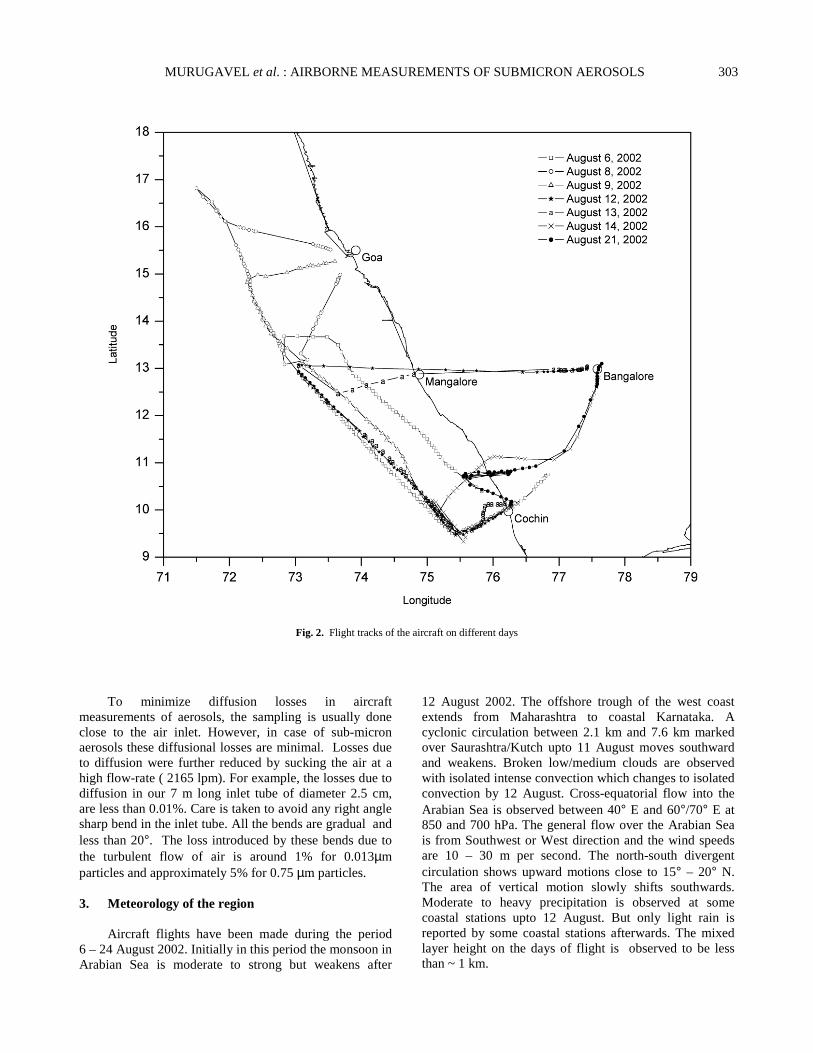
Fig. 2. Flight tracks of the aircraft on different days
To minimize diffusion losses in aircraft measurements of aerosols, the sampling is usually done close to the air inlet. However, in case of sub-micron aerosols these diffusional losses are minimal. Losses due to diffusion were further reduced by sucking the air at a high flow-rate ( 2165 lpm). For example, the losses due to diffusion in our 7 m long inlet tube of diameter 2.5 cm, are less than 0.01%. Care is taken to avoid any right angle sharp bend in the inlet tube. All the bends are gradual and less than 20°. The loss introduced by these bends due to the turbulent flow of air is around 1% for 0.013µm particles and approximately 5% for 0.75 µm particles. 3. Meteorology of the region
Aircraft flights have been made during the period 6 – 24 August 2002. Initially in this period the monsoon in Arabian Sea is moderate to strong but weakens after
12 August 2002. The offshore trough of the west coast extends from Maharashtra to coastal Karnataka. A cyclonic circulation between 2.1 km and 7.6 km marked over Saurashtra/Kutch upto 11 August moves southward and weakens. Broken low/medium clouds are observed with isolated intense convection which changes to isolated convection by 12 August. Cross-equatorial flow into the Arabian Sea is observed between 40° E and 60°/70° E at 850 and 700 hPa. The general flow over the Arabian Sea is from Southwest or West direction and the wind speeds are 10 – 30 m per second. The north-south divergent circulation shows upward motions close to 15° – 20° N. The area of vertical motion slowly shifts southwards. Moderate to heavy precipitation is observed at some coastal stations upto 12 August. But only light rain is reported by some coastal stations afterwards. The mixed layer height on the days of flight is observed to be less than ~ 1 km.

304 MAUSAM, 56, 1 (January 2005)
Fig. 3. Profiles of virtual potential temperature drawn from the radiosonde flights made at 0000 UTC on August 6, 8, 9, 12 and 13 and at 0300 UTC on 14 August 2002 from ORV Sagarkanya
4. Observations
A total of 8 aircraft flights, each of 3-5 hr duration over the 8° – 17° N and 71.5° – 76.2° E region of the Indian west coast upto a maximum altitude of ~ 6 km are made during 6 – 24 August 2002. The flight cruise tracks are shown in Fig. 2. Each flight comprises of several constant-level flights, each of atleast 5-minutes duration, at different altitudes between 0.9 and 6 km altitudes. To meet some other requirements of the experiment, no constant-level flights are performed between 2.1 & 5 km levels. Most of the time, the flight tracks are ~ 200 km away and parallel to the coastline. Because of other requirements of the experiment, the constant-level flights in our measurements except on 14 and 21 August 2002, are made at different latitudinal-longitudinal positions. So the concept of the vertical profile in this paper, otherwise specifically stated, presumes the assumption of the horizontal stratification of the atmosphere over the sea surface in the area of experiment. Since the measurement of one size distribution is completed in about 1-minute duration, atleast 5 samples of size distributions are
TABLE 1
Total aerosol number concentration observed at 0.9 km
Date Mixed layer height (m)
Total aerosol concentration (cm-3 )
6 August 2002 36 1155 (±45.3)
8 August 2002 875 7572 (±436.26)
9 August 2002 1072 5998 (±440.64)
12 August 2002 1089 2936 (±273.33)
13 August 2002 605 1128 (±38.42)
14 August 2002 52 582 (±20.53)
obtained at each level. All aerosol concentrations are reduced to the standard atmospheric temperature and pressure conditions. Two radiosonde flights are made daily at 0000 and 1200 UTC from ORV Sagarkanya sailing in the ARMEX area. Assuming the horizontal stratification of the atmosphere over the sea, the thermodynamic conditions revealed by these profiles are assumed to be nearly representative of the area of aircraft

MURUGAVEL et al. : AIRBORNE MEASUREMENTS OF SUBMICRON AEROSOLS 305
Fig. 4. Aerosol number concentrations measured at different altitudes along the aircraft tracks. Also shown are the number concentrations of the particles in the Aitken mode and accumulation mode
flights. From these thermodynamic profiles, the 8 days of aircraft flights comprise of a variety of the stable, neutral or slightly unstable conditions in the atmospheric boundary layer. Fig. 3 shows profiles of the virtual potential temperature drawn from the data obtained from the radiosonde flights made from ORV Sagarkanya cruising in the ARMEX area. No radiosonde flights are made on 21 and 24 August 2002. Mixing layer is well developed upto an altitude of ~ 1 km on 9 and 12 August 2002 but is limited to a depth of less than 50 m on 6 and 14 August 2002. 5. Total aerosol concentrations close to the top of
mixing layer
The depth of mixing layer varies upto ~ 1 km in altitude during the six days of flight. The lowest leg of the constant altitude flight either roughly coincides with the
mixing layer top or is well above the mixing layer. Therefore, our observations of the total aerosol concentrations at 0.9 km level show large variability from day to day. Observations show large aerosol concentrations whenever the mixing layer is well developed and the flight level is below or close to the top of the mixing layer as compared to the days when mixing layer is not well developed (Table 1). The values in brackets show the standard error of aerosol concentration calculated from different samples collected at that altitude. No radiosonde flights are made on 21 and 24 August 2002. Further, the results for 24 August are not included here because of the excessive cloudiness of the area on that day. However, the values in two columns of Table 1 need to be seen keeping in view the fact that the radiosonde and aircraft flights differed in space and time. The height of mixing layer is calculated from the profiles obtained at 0000 UTC whereas the aircraft measurements are made between 0400 and 0900 UTC.
306 MAUSAM, 56, 1 (January 2005)
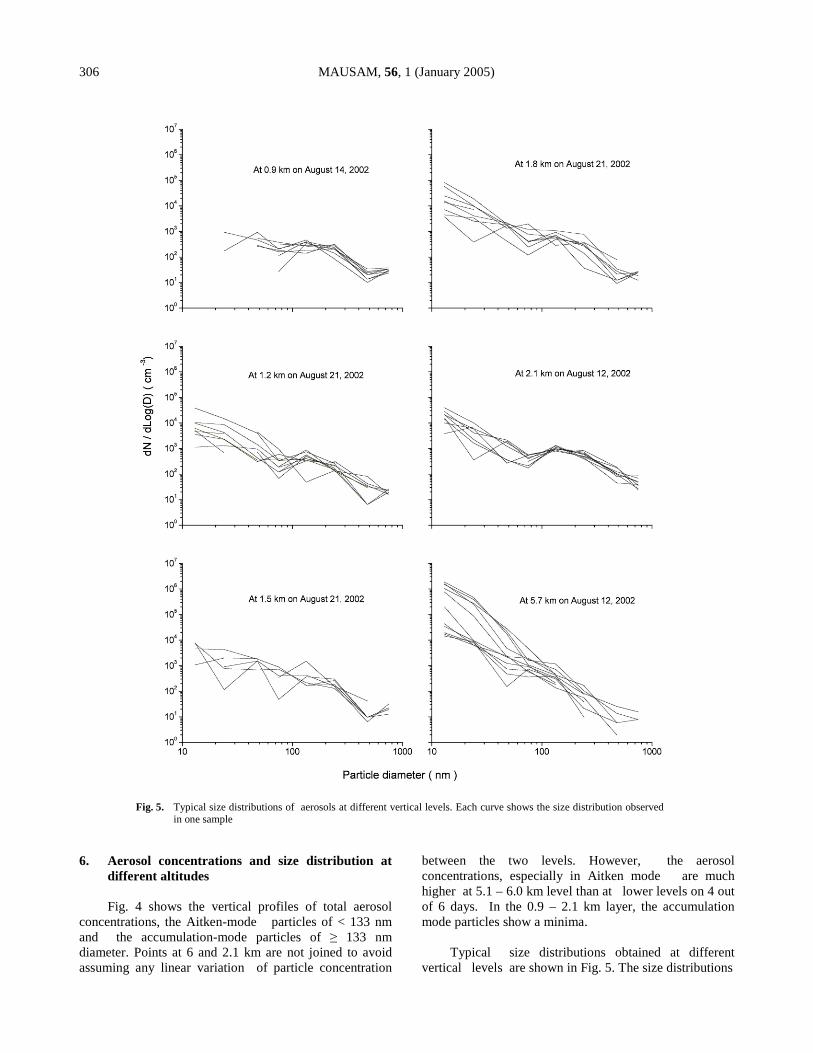
Fig. 5. Typical size distributions of aerosols at different vertical levels. Each curve shows the size distribution observed in one sample
6. Aerosol concentrations and size distribution at
different altitudes
Fig. 4 shows the vertical profiles of total aerosol concentrations, the Aitken-mode particles of < 133 nm and the accumulation-mode particles of ≥ 133 nm diameter. Points at 6 and 2.1 km are not joined to avoid assuming any linear variation of particle concentration
between the two levels. However, the aerosol concentrations, especially in Aitken mode are much higher at 5.1 – 6.0 km level than at lower levels on 4 out of 6 days. In the 0.9 – 2.1 km layer, the accumulation mode particles show a minima.
Typical size distributions obtained at different
vertical levels are shown in Fig. 5. The size distributions

MURUGAVEL et al. : AIRBORNE MEASUREMENTS OF SUBMICRON AEROSOLS 307
Figs. 6(a&b). (a) The aerosol size distributions observed at 0.9 km altitude on different days and (b) the 5-days back trajectories (obtained from NOAA-HYSPLIT model)
Figs. 7(a&b). (a) The aerosol size distributions observed at 2.1 km altitude on different days and (b) The 5-days back trajectories (obtained from NOAA-HYSPLIT model)

308 MAUSAM, 56, 1 (January 2005)
Figs. 8(a&b). (a) The aerosol size distributions observed at 5.1 – 6 km altitude on different days and (b) the 5-days back trajectories (obtained from NOAA-HYSPLIT model)
observed at 0.9 – 2.1 km levels (above mixing layer) are normally bimodal with a maximum at 133 nm and a minimum at 75 nm and sometimes trimodal with an additional minimum at 480 nm. Aerosol concentrations keep increasing at both ends of size distribution in case of trimodal size distributions indicating the maxima for fine and coarse mode particles. The scatter for small particle concentration is much larger than for larger particles. At 5.1 – 6.0 km level the size distributions generally change to the log-normal type. We have examined the type of size distributions observed at different vertical levels with respect to the 5-days back trajectories of the air mass. Fig. 6(a) shows the average size distribution curves calculated from all the size distribution samples obtained at 0.9 km altitude on a particular day. Comparatively, large variabilities of the particle concentrations on either end of the spectra are noticeable. Increasing trend in particle concentration on both ends indicate maxima in the Aitken and coarse modes. The 5-days back trajectories in Fig. 6(b) show that the air mass at this level is being transported from the southern hemisphere. Since the bulk of the cross-equatorial flow occurs between 50° and 60° longitude, the air mass has a large travel over sea.
Fig. 7 shows the aerosol size distributions and back trajectories at 2.1 km level. On the days when the equatorial crossing is west of ~ 48° longitude and the air mass always remains on the sea, e.g. on 8 and 9 August 2002, the aerosol size distributions continue to remain trimodal. However, when the back trajectories show that the air mass, for some time, crossed the Kenya/Somali coastline and has travelled over land e.g. on 14 and 21 August 2002, the size distributions tend to become log-normal. The observations indicate that during the period of the passage of air mass over land, it picks up some particles so as to modify the aerosol size distribution.
Three different types of air trajectories appear at
5.1 - 6.0 km altitude. The aerosol size distributions and trajectories observed on these days are shown in Figs. 8(a&b) respectively. In the first type, the airmass comes from the central Arabian Sea. The aerosol concentrations associated with such air masses are large and tend to follow bimodal nature. In second type, the air trajectories suggest that the air mass is being advected from the deserts of northwest India. Aerosol

MURUGAVEL et al. : AIRBORNE MEASUREMENTS OF SUBMICRON AEROSOLS 309
Fig. 9. The aerosol size distributions observed at different vertical levels on 14 August 2002. The thick curves show the average size distributions with the vertical bars showing the standard error
concentrations associated with such air masses are one to three orders of magnitude lower than that of the first type
and tend to show a coarse mode. The third type of trajectories show that the air mass is being transported

310 MAUSAM, 56, 1 (January 2005)
Fig. 10. Aerosol size distributions observed at different vertical levels on 21 August 2002. The thickness curves show the average size distributions with the vertical bars showing the standard error
from the Arabian desert. The aerosol concentration, especially of smaller size, associated with such air masses
are large and of the same magnitude as in the first type. Moreover, the size distributions in such cases are nearly

MURUGAVEL et al. : AIRBORNE MEASUREMENTS OF SUBMICRON AEROSOLS 311
Fig. 11. The aerosol size distributions observed at 5.7 km altitude over sea and land. The thick curves show the average size distributions
log-normal and are steeper than those associated with the first and second type. 7. Vertical profiles of aerosol concentration and size
distribution
(i) Over the sea surface
On 14 August 2002, a step-flight is made from 1158 LT in the region of 9.5° – 10.2° N, 75.1° – 75.5° E over
the Arabian Sea at about 125 km away from the coastline. The flight consists of six steps at 0.9, 1.2, 1.5, 1.8, 2.1 and 5.2 km altitudes. Each step consists of a constant-level flight for 10 minutes duration and is roughly parallel to the Indian coastline. The monsoon in the Arabian Sea is moderate on 14 August 2002. Since past 3-4 days, the cross-equatorial flow into the Arabian Sea is observed at 925 and 850 hPa between 40° and 60° E. The flow accelerates from 10 to 30 ms-1 along and off Kenya/Somali coast. The general flow direction over the
312 MAUSAM, 56, 1 (January 2005)
Fig. 12. Variations of the aerosol number concentration in each size range with the distance from the
coastline observed at 5.7 km altitude on 12 August 2002
Arabian Sea is from the southwest or west. Scattered low/medium clouds with isolated convection are observed and light to moderate rainfall is reported from some stations along the west coast of India.
The thermodynamic profiles from the radiosonde
flight made at 0830 LT from ORV Sagarkanya which was located at 13° N, 73.2° E show a very dry atmosphere and almost no development of mixing layer. On 14 August, total concentration increases from 582 cm-3 at 0.9 km level to 3272 cm-3 at 2.1 km level and then decreases to 716 cm-3 at 5.2 km level. From Fig. 4, concentration of the accumulation mode particles decreases from 335 cm-3 at 0.9 km altitude to 60 cm-3 at 5.2 km altitude. On the contrary, concentration of the Aitken-mode particles increases from 247 cm-3 at 0.9 km level to 2973 cm-3 at 2.1 km level and then decreases to 656 cm-3 at 5.2 km level. Fig. 9 shows the aerosol size distributions observed at different levels on 14 August 2002. Besides exhibiting the features described for typical curves in Fig. 5 the size-distribution curves become steeper with the increase in altitude between 0.9 and 6 km. With the increase in altitude in this height range, the particle concentrations at smaller end of the curves increase and those at the larger end decrease. At 5.2 km, concentrations of both smaller and larger particles decrease and the size distribution become log-normal.
(ii ) Across the coastline
A vertical profile of aerosol concentration is made at 0600 UTC on 21 August 2002 in the region 10° 50′ N 76° 20′ E to 10° 40′ N 75° 30′ E. Five constant-level flights are made at 1.2, 1.5, 1.8, 2.1 and 5.1 km altitude. Each constant-level flight is nearly perpendicular to the coastline and lasted for ~10 minutes with almost equal leg over land and sea. Aerosol concentrations at each level are much higher on this day than over the sea on 14 August 2002. Moreover, contrary to the profile on 14 August 2002, the profile on 21 August 2002 shows much higher aerosol concentration at 5 km altitude than at 1.2 and 2.1 km altitudes. However, this feature is in conformity with most of the profiles observed over sea on other days. The size distribution curves shown in Fig. 10 show that trimodal nature of curves observed at 1.2 km tends to change to log-normal type at higher altitudes. Moreover, individual curves at 1.2 to 2.1 km altitudes show large scatter in the concentration of particle at smaller end.
8. Land to sea contrast of aerosol concentrations at
5.7 km altitude
A constant-altitude flight is made at 5.7 km (73.1° – 76.7° E, 13° N) for about 35 minutes from 1146 LT on 12 August 2002. The flight is across the coastline and

MURUGAVEL et al. : AIRBORNE MEASUREMENTS OF SUBMICRON AEROSOLS 313
extends over both sea and land for about 15 minutes each. The group of size distribution curves, obtained over land is drastically different and show much higher aerosol concentrations in each size category as compared to those observed over sea (Fig. 11). Fig. 12 shows the variations of the concentration of aerosol particles of different sizes with distance from the coastline along the aircraft track. The concentration of particles of all sizes increases as one approaches the coastline and the increase is steeper and occurs closer to the coastline as the particle size increases. Observation shows that the prevailing southwestern winds in the region restrict the extension of continental aerosols over sea to a distance of only about 100 km from the coastline. Larger particles settle down faster under gravity and so their concentration decreases closer to the coastline as compared to the smaller particles which have smaller terminal velocity and thus can penetrate to greater distances over the sea. The maximum concentrations are observed over sea at a distance of 40 to 100 km from the coastline. 9. Discussion
The 5-day back-trajectories drawn for 0.9 and 2.1 km
levels in Figs. 6 and 7 respectively, show that, as expected in the normal airflow in the southwest monsoon season, the air-mass below ~ 2 km altitude originates from the southern hemisphere and arrives at the site after equatorial crossing. Our observations of a decrease in the concentration of larger particles with height in the range of 0.9 – 2.1 km altitude suggest that these particles originate at the sea surface, most probably by wave breaking during periods of high winds (Blanchard et al., 1984). These particles are then carried by the prevailing southwesterly airflow in the region. During the southwest transport of the aerosol, their size distribution is evolved by the processes of coagulation and gravitational settling of aerosols. Our observations of the bimodal or trimodal size distributions of aerosols in this layer of the atmosphere, support the evolution of the aerosol size distribution by such processes.
The back-trajectories for 5.1 to 6 km levels show that
the air-mass at this level is either being advected up from the Arabian desert or the desert regions of northwest India or being transported with westerly/southwesterly winds over the Indian Ocean. Large difference in aerosol concentrations between the cases when the air mass is brought from the deserts of northwest India or Arabian deserts reflects predominance of the coarse particles in the northwest Indian deserts and that of relatively smaller mineral particles in the Arabian deserts. A small fraction of small particles produced by the erosion of earth’s surface in these air masses may be convected up in these regions. Our observations of the low aerosol
concentration, almost absence of large particles, and the log-normal size distributions of aerosols at this level support such transport of aerosols.
Kamra et al. (2003) suggested from their shipborne measurements during INDOEX that the nucleation mode particles formed in the outflow regions of convective clouds in the free troposphere may be transported downwards to the marine boundary layer. After their formation in the upper free troposphere, these particles slowly grow during their downward transport. Observations of higher concentrations of smaller particles at 5.1 – 6.0 km level as compared to those at 0.9 – 2.1 km level on some days in the present results may be associated with the downward transport of particles in the downdraft regions of some meso-scale systems. Observations of comparatively very low aerosol concentrations, especially of small particles, at 5.2 km level on some days indicates the absence of any new particle formation activity in the free troposphere (Hoppel et al., 1986). Observations of low humidity, dry atmosphere and almost absence of large clouds on such days support the lack of new particle formation activity on some days (O’Dowd et al., 1996; Covert et al., 1992). 10. Conclusions
Our measurements show that the submicron aerosol concentration has sharp gradients at the top of the mixing layer. Processes of coagulation and gravitational settling mainly determine the evolution of the modal size distributions observed in this layer over sea. At the top of the mixing layer, aerosol size distributions are bimodal or trimodal with the maximum at 133 nm and the minima at 75 and 480 nm. In the lower free troposphere at 5.1 – 6.0 km, altitude, the submicron aerosol concentrations are 1 to 3 orders of magnitude higher if the airmass is being advected from the central Arabian Sea or the Arabian deserts in comparison to the values when the airmass is being advected from the deserts of northwest India. At these levels the aerosol size distributions tend to become lognormal.
Acknowledgements
The fixing of the air inlet system and the design, fabrication and fixing of the shock-proof table in the aircraft was done at the Base Repair Depot (1BRD), Kanpur. The air inlet as per our requirements was designed and fabricated by the Hindustan Aeronautics Ltd (HAL). The aircraft flights were taken from the IAF stations, Yehalanka, Bangalore. We thank A.V.M. K. I. Trivedi and his staff of the Indian Air Force for enthusiastically coordinating all these works. We express

314 MAUSAM, 56, 1 (January 2005)
our thanks to Dr. G. S. Bhat of the Indian Institute of Science, Bangalore and the India Meteorological Department for providing the meteorological data. We express our gratitude to Dr. G. B. Pant, Director, Indian Institute of Tropical Meteorology, Pune, for encouragement and support. We are also thankful to the organizers of the ARMEX for our participation in the experiment. The authors gratefully acknowledge the NOAA Air Research Laboratory (ARL) for the provision of the HYSPLIT transport and dispersion model and/or READY website (http://www.arl.noaa.gov/ready.html) used in this publication.
References
Blanchard, D. C., Woodcook, A. H. and Cipriano, R. J., 1984, “The vertical distribution of sea salt in the marine atmosphere near Hawaii”, Tellus, 36(B), 118-125.
Covert, D. S., Kapustin, V. N., Quinn, P. K. and Bates, T. S., 1992, “New particle formation in the marine boundary layer”, J. Geophys. Res., 97, 20,581-20,590.
de Reus, M., Krejci, R., Williams, J., Fischer, H., Scheele, R. and Strom, J., 2001, “Vertical and horizontal distributions of the aerosol number concentration and size distribution over the northern Indian Ocean”, J. Geophys. Res., 106(D22), 28629-28641.
Deshpande, C. G. and Kamra, A. K., 2002a, “Aerosol size distributions in the north and south Indian Ocean during the northeast monsoon season”, Atmospheric Research, 65, 51-76.
Deshpande, C. G. and Kamra, A. K., 2002b, “Atmospheric electric conductivity measurements over the Indian Ocean during the Indian Antarctic Expedition in 1996-97”, J. Geophys. Res., 107(D21), 4598, doi:10.1029/2002JD002118.
Hoppel, W. A., Frick, G. M. and Larson, R. E., 1986, “Effect of non-precipitating clouds on the aerosol size distribution in the marine boundary layer”, Geophys. Res. Lett., 13, 125-128.
Kamra, A. K., Murugavel, P. and Pawar, S. D., 2003, “Measured size distributions of aerosols over the Indian Ocean during INDOEX”, J. Geophys. Res., 108(D3), doi: 10.1029/2002 JD002200.
Lelieveld, J., Crutzen, P. J., Ramanathan, V., Andreae, M. O., Brenninkmeijer, C. A. M., Campos, T., Cass, G. R., Dickerson, R. R., Fischer, H., de Gouw, J. A., Hansal, A., Jefferson, A., Kley, D., de Laat, A. T. J., Lal, S., Lawrence, M. G., Lobert, J. M., Mayol-Bracero, O. L., Mitra, A. P., Novakov, T., Oltmans, S. J., Prather, K. A., Reiner, T., Rodhe, H., Scheeren, H. A., Sikka, D. and Williams, J., 2001, “The Indian Ocean Experiment : Widespread air pollution from south and south- east Asia”, Science, 291, 1031-1035.
Moorthy, K. K., Pillai, P. S., Saha, A. and Niranjan, 1993, “Aerosol size characteristics over the Arabian Sea and Indian Ocean: Extensive sub-micron aerosol loading in the northern hemisphere”, Current Science, 76, 961-967.
Murugavel, P. and Kamra, A. K., 1999, “Changes in the concentration and size distribution of the sub-micron particles associated with the sea and land breezes at a coastal station”, Current Science, 76, 994-997.
O’Dowd and Michael, H. Smith, 1996, “The vertical structure of aerosol and its relationship to boundary-layer thermodynamics over the rural UK”, Q. J. R. Meteorol. Soc., 122, 1799-1814.
Ramanathan, V., Crutzen, P. J., Lelieveld, J., Mitra, A. P., Althausen, D., Anderson, J., Andreae, M. O., Cantrell, W., Cass, G. R., Chung, C. E., Clarke, A. D., Coakley, J. A., Collins, W. D., Conant, W. C., Dulac, F., Heintzenberg, J., Heymsfield, A. J., Holben, B., Howell, S., Hudson, J., Jayaraman, A., Kiehl, J. T., Krishnamurti, T. N., Lubin, D., McFarquhar, G., Novakov, T., Ogren, J. A., Podgorny, I. A., Prather, K., Priestley, K., Prospero, J. M., Quinn, P. K., Rajeev, K., Rasch, P., Rupert, S., Sadourny, R., Satheesh, S. K., Shaw, G. E., Sheridan, P. and Valero, F. P. J., 2001, “Indian Ocean Experiment : An integrated analysis of the climate forcing and effects of the great Indo-Asian haze”, J. Geophys. Res., 106, 28,371-28,398.
Satheesh, S. K., Moorthy, K. K. and Krishna Murthy, B. V., 1998, “Spatial gradients in aerosol characteristics over the Arabian Sea and Indian Ocean”, J. Geophys. Res., 103, 26183-26192.