Air quality during the 2008 Beijing Olympics: … · Air quality during the 2008 Beijing Olympics:...
13
Atmos. Chem. Phys., 10, 7603–7615, 2010 www.atmos-chem-phys.net/10/7603/2010/ doi:10.5194/acp-10-7603-2010 © Author(s) 2010. CC Attribution 3.0 License. Atmospheric Chemistry and Physics Air quality during the 2008 Beijing Olympics: secondary pollutants and regional impact T. Wang 1,2,3 , W. Nie 1,2 , J. Gao 3 , L. K. Xue 1,2 , X. M. Gao 1,2 , X. F. Wang 1,2 , J. Qiu 1 , C. N. Poon 1 , S. Meinardi 4 , D. Blake 4 , S. L. Wang 3 , A. J. Ding 1 , F. H. Chai 3 , Q. Z. Zhang 2 , and W. X. Wang 2,3 1 Department of Civil and Structural Engineering, The Hong Kong Polytechnic University, Hong Kong, China 2 Environment Research Institute, Shandong University, Jinan, China 3 Chinese Research Academy of Environmental Sciences, Beijing, China 4 Department of Chemistry, University of California at Irvine, Irvine, USA Received: 9 April 2010 – Published in Atmos. Chem. Phys. Discuss.: 12 May 2010 Revised: 22 July 2010 – Accepted: 2 August 2010 – Published: 16 August 2010 Abstract. This paper presents the first results of the mea- surements of trace gases and aerosols at three surface sites in and outside Beijing before and during the 2008 Olympics. The official air pollution index near the Olympic Stadium and the data from our nearby site revealed an obvious as- sociation between air quality and meteorology and different responses of secondary and primary pollutants to the control measures. Ambient concentrations of vehicle-related nitro- gen oxides (NO x ) and volatile organic compounds (VOCs) at an urban site dropped by 25% and 20–45% in the first two weeks after full control was put in place, but the levels of ozone, sulfate and nitrate in PM 2.5 increased by 16%, 64%, 37%, respectively, compared to the period prior to the full control; wind data and back trajectories indicated the con- tribution of regional pollution from the North China Plain. Air quality (for both primary and secondary pollutants) im- proved significantly during the Games, which were also as- sociated with the changes in weather conditions (prolonged rainfall, decreased temperature, and more frequent air masses from clean regions). A comparison of the ozone data at three sites on eight ozone-pollution days, when the air masses were from the southeast-south-southwest sector, showed that re- gional pollution sources contributed >34–88% to the peak ozone concentrations at the urban site in Beijing. Regional sources also contributed significantly to the CO concentra- tions in urban Beijing. Ozone production efficiencies at two sites were low (∼3 ppbv/ppbv), indicating that ozone forma- tion was being controlled by VOCs. Compared with data collected in 2005 at a downwind site, the concentrations of ozone, sulfur dioxide (SO 2 ), total sulfur (SO 2 +PM 2.5 sul- Correspondence to: T. Wang ([email protected]) fate), carbon monoxide (CO), reactive aromatics (toluene and xylenes) sharply decreased (by 8–64%) in 2008, but no significant changes were observed for the concentrations of PM 2.5 , fine sulfate, total odd reactive nitrogen (NO y ), and longer lived alkanes and benzene. We suggest that these re- sults indicate the success of the government’s efforts in re- ducing emissions of SO 2 , CO, and VOCs in Beijing, but in- creased regional emissions during 2005–2008. More strin- gent control of regional emissions will be needed for sig- nificant reductions of ozone and fine particulate pollution in Beijing. 1 Introduction The air quality in Beijing has been of great concern to both the Chinese government and researchers, especially after the city won the bid to host the 29th Summer Olympic Games. To significantly improve the city’s air quality during the Games (8–24 August 2008), in addition to the long-term con- trol measures (UNEP, 2009), the Chinese government took drastic actions to reduce the emissions of air pollutants from industry, road traffic, and construction sites (UNEP, 2009; Wang et al., 2009a, 2010b). From 1 July, some 300 000 heavily polluting vehicles (the so called yellow-label vehi- cles) were banned from driving in the Beijing Municipality, which covers an area of 16 808 km 2 , and starting from 20 July, half of the city’s 3.5 million vehicles were taken off the roads through the alternative day-driving scheme. In ad- dition, all construction activities were halted, power plants were asked to use cleaner fuels, and some polluting factories were ordered to reduce their activity. Additional control was implemented after the start of the Games in order to further Published by Copernicus Publications on behalf of the European Geosciences Union.
Transcript of Air quality during the 2008 Beijing Olympics: … · Air quality during the 2008 Beijing Olympics:...
Atmos. Chem. Phys., 10, 7603–7615, 2010www.atmos-chem-phys.net/10/7603/2010/doi:10.5194/acp-10-7603-2010© Author(s) 2010. CC Attribution 3.0 License.
AtmosphericChemistry
and Physics
Air quality during the 2008 Beijing Olympics: secondary pollutantsand regional impact
T. Wang1,2,3, W. Nie1,2, J. Gao3, L. K. Xue1,2, X. M. Gao1,2, X. F. Wang1,2, J. Qiu1, C. N. Poon1, S. Meinardi4,D. Blake4, S. L. Wang3, A. J. Ding1, F. H. Chai3, Q. Z. Zhang2, and W. X. Wang2,3
1Department of Civil and Structural Engineering, The Hong Kong Polytechnic University, Hong Kong, China2Environment Research Institute, Shandong University, Jinan, China3Chinese Research Academy of Environmental Sciences, Beijing, China4Department of Chemistry, University of California at Irvine, Irvine, USA
Received: 9 April 2010 – Published in Atmos. Chem. Phys. Discuss.: 12 May 2010Revised: 22 July 2010 – Accepted: 2 August 2010 – Published: 16 August 2010
Abstract. This paper presents the first results of the mea-surements of trace gases and aerosols at three surface sitesin and outside Beijing before and during the 2008 Olympics.The official air pollution index near the Olympic Stadiumand the data from our nearby site revealed an obvious as-sociation between air quality and meteorology and differentresponses of secondary and primary pollutants to the controlmeasures. Ambient concentrations of vehicle-related nitro-gen oxides (NOx) and volatile organic compounds (VOCs)at an urban site dropped by 25% and 20–45% in the first twoweeks after full control was put in place, but the levels ofozone, sulfate and nitrate in PM2.5 increased by 16%, 64%,37%, respectively, compared to the period prior to the fullcontrol; wind data and back trajectories indicated the con-tribution of regional pollution from the North China Plain.Air quality (for both primary and secondary pollutants) im-proved significantly during the Games, which were also as-sociated with the changes in weather conditions (prolongedrainfall, decreased temperature, and more frequent air massesfrom clean regions). A comparison of the ozone data at threesites on eight ozone-pollution days, when the air masses werefrom the southeast-south-southwest sector, showed that re-gional pollution sources contributed>34–88% to the peakozone concentrations at the urban site in Beijing. Regionalsources also contributed significantly to the CO concentra-tions in urban Beijing. Ozone production efficiencies at twosites were low (∼3 ppbv/ppbv), indicating that ozone forma-tion was being controlled by VOCs. Compared with datacollected in 2005 at a downwind site, the concentrations ofozone, sulfur dioxide (SO2), total sulfur (SO2+PM2.5 sul-
Correspondence to:T. Wang([email protected])
fate), carbon monoxide (CO), reactive aromatics (tolueneand xylenes) sharply decreased (by 8–64%) in 2008, but nosignificant changes were observed for the concentrations ofPM2.5, fine sulfate, total odd reactive nitrogen (NOy), andlonger lived alkanes and benzene. We suggest that these re-sults indicate the success of the government’s efforts in re-ducing emissions of SO2, CO, and VOCs in Beijing, but in-creased regional emissions during 2005–2008. More strin-gent control of regional emissions will be needed for sig-nificant reductions of ozone and fine particulate pollution inBeijing.
1 Introduction
The air quality in Beijing has been of great concern to boththe Chinese government and researchers, especially after thecity won the bid to host the 29th Summer Olympic Games.To significantly improve the city’s air quality during theGames (8–24 August 2008), in addition to the long-term con-trol measures (UNEP, 2009), the Chinese government tookdrastic actions to reduce the emissions of air pollutants fromindustry, road traffic, and construction sites (UNEP, 2009;Wang et al., 2009a, 2010b). From 1 July, some 300 000heavily polluting vehicles (the so called yellow-label vehi-cles) were banned from driving in the Beijing Municipality,which covers an area of 16 808 km2, and starting from 20July, half of the city’s 3.5 million vehicles were taken offthe roads through the alternative day-driving scheme. In ad-dition, all construction activities were halted, power plantswere asked to use cleaner fuels, and some polluting factorieswere ordered to reduce their activity. Additional control wasimplemented after the start of the Games in order to further
Published by Copernicus Publications on behalf of the European Geosciences Union.
7604 T. Wang et al.: Air quality during the 2008 Beijing Olympics
reduce the emissions from vehicles and petrol-filling stations(Wang et al., 2009a). In addition to the strict controls onair pollution sources in Beijing, neighboring provinces alsoreduced their industrial output. A preliminary assessmentsuggests that these emission-reduction measures reduced theemissions of SO2, NOx, CO, VOCs, and PM10 by 14%, 38%,47%, 30%, and 20% in the Beijing area, respectively (UNEP,2009). Much larger reductions of SO2 (41%), NOx (47%),VOCs (57%), and PM10 (55%) are suggested in a more re-cent study (Wang et al., 2010b).
The large reductions in pollution emissions in the summerof 2008 in Beijing represents a human-perturbation experi-ment of unprecedented scale, and provides a rare opportunityto study the impact of pollution emissions on the air qualityand atmospheric chemistry of Beijing and the surroundingregions. From an air-quality management point of view, it isof critical importance to know how the anticipated large re-duction in emissions improved the city’s air quality. Duringthe summer of 2008, we measured trace gases and aerosolsat three sites in and around Beijing before, during, and afterthe Games. Here, we report the first results from the analy-sis of this dataset, which provide new insights into the roleof meteorology, the response of secondary pollutants to thepollution control, and the contribution of regional pollutionto the air quality in Beijing.
A number of papers have been published on the resultsof surface and satellite measurements during the BeijingOlympics, all indicating sharp decreases in the concentra-tions of the measured pollutants in Beijing during the periodof the Olympics. On-road measurements reported significant(12–70%) decreases in the ambient concentrations of CO,NOx, SO2, black carbon (BC), benzene, toluene, ethylben-zene, and xylenes (BTEX), and PM1 during the Olympics(Wang et al., 2009a). Atmospheric measurements at other ur-ban sites showed a decrease in the concentration of 35–43%for fine and coarse particulate matter (Wang et al., 2009b),74% for BC (Wang et al., 2009c), 47–64% for BTEX (Liuet al., 2009), and 35% for total non-methane hydrocarbons(Wang et al., 2010a). These results were based on a compari-son of the data obtained during the Olympics with those fromnon-Olympic periods (before and/or after the Olympics andPara-Olympics). The concentrations of O3, CO, SO2, andNOy in plumes from urban Beijing transported to a rural sitedeceased by 21–61% in August 2008 compared to the samemonth in 2007 (Wang et al., 2009d). Analyses of satellitedata from GOME-2, OMI, and MODIS, by comparing the re-sults obtained during August 2008 with those in the same pe-riod in previous years, have shown a decrease of 43–59% innitrogen dioxide (NO2) column over Beijing (Mijling et al.,2009; Witte et al., 2009), 13% in boundary-layer SO2, 12%in CO at the 700 hPa-level over a large region encompass-ing Beijing and its southern neighboring provinces (Witte etal., 2009), and 11% in aerosol optical thickness over Beijing(Cermak and Kutti, 2009).
With the aid of a chemical transport model or a statisti-cal model, some studies have attempted to examine the rel-ative role of meteorology and emission reduction in the im-provement of the air qualities during the Olympics. Wang etal. (2009c) attributed 55% of the ozone decrease at a ruralsite during the Olympics from the same period in the previ-ous year to the change in meteorology during the two years.Wang et al. (2009a) suggested a more dominant role of me-teorological effects than the emission reductions in the varia-tion in their observed particulate matter at an urban site. Cer-mak and Kutti (2009) also suggested a more important role ofthe meteorology in explaining the decrease in aerosol opticalthickness. Mijling et al. (2009) attributed the 60% reductionin tropospheric NO2 to the emission control.
Most of these published studies so far have focused onprimary pollutants, and there are few results on the levelsand variation of secondary pollutants and on the extent ofregional contribution during the drastic emission control inBeijing. In addition, little attention has been given to theparadoxical response of secondary pollutants during the firsttwo weeks after the full traffic control. The present studyattempts to examine these important topics. We first showthe relationship between weather and the general air qual-ity in Beijing as indicated by the official air pollution indexand our own measurements; we then estimate the regionalcontribution to ozone pollution on eight days when Beijingwas influenced by air masses from the North China Plain inthe south; we also examine the ozone production efficien-cies, and lastly we compare the data collected at a downwindsite in 2005 and 2008 to gain insight into the changes in thecomposition of urban and regional plumes, and discuss thechanges in Beijing and regional emissions during the pastseveral years.
2 Methodology
2.1 Measurement sites
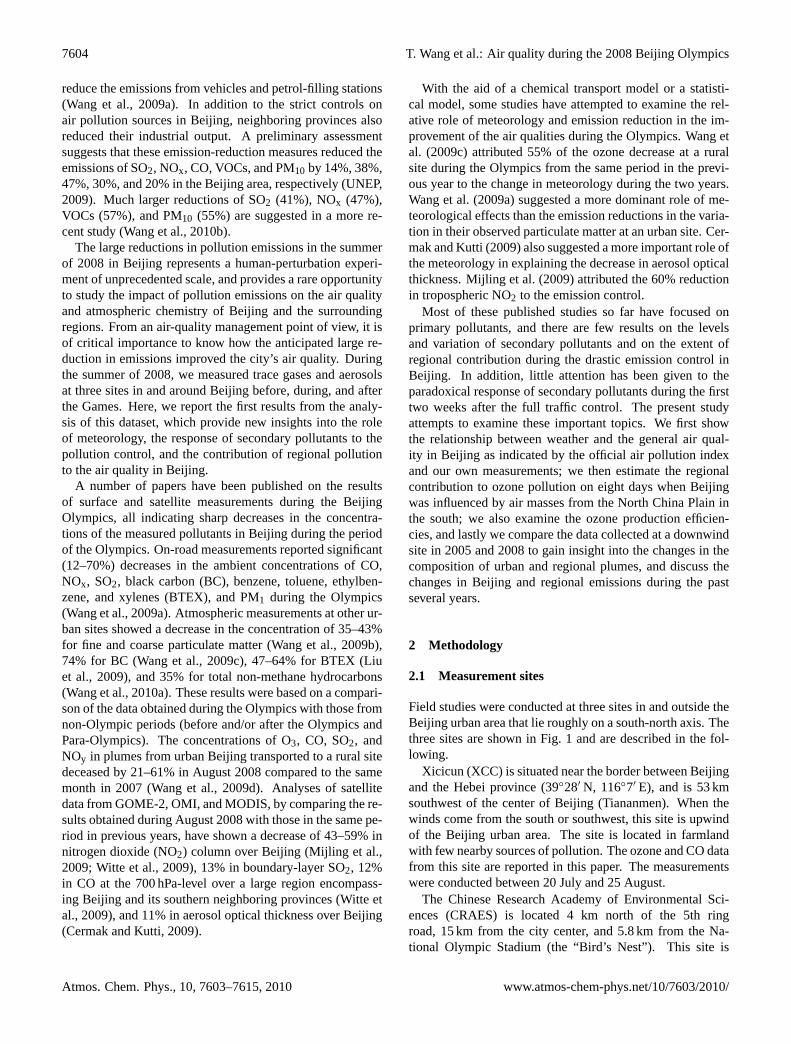
Field studies were conducted at three sites in and outside theBeijing urban area that lie roughly on a south-north axis. Thethree sites are shown in Fig. 1 and are described in the fol-lowing.
Xicicun (XCC) is situated near the border between Beijingand the Hebei province (39◦28′ N, 116◦7′ E), and is 53 kmsouthwest of the center of Beijing (Tiananmen). When thewinds come from the south or southwest, this site is upwindof the Beijing urban area. The site is located in farmlandwith few nearby sources of pollution. The ozone and CO datafrom this site are reported in this paper. The measurementswere conducted between 20 July and 25 August.
The Chinese Research Academy of Environmental Sci-ences (CRAES) is located 4 km north of the 5th ringroad, 15 km from the city center, and 5.8 km from the Na-tional Olympic Stadium (the “Bird’s Nest”). This site is
Atmos. Chem. Phys., 10, 7603–7615, 2010 www.atmos-chem-phys.net/10/7603/2010/
T. Wang et al.: Air quality during the 2008 Beijing Olympics 7605
30
Figure 1. Map showing the three measurement sites (XCC, CRAES, HSZ), the Beijing
Municipality (the area within the white line), and the surrounding regions. Also shown
are the location of the “Bird’s Nest” National Olympic Stadium, a Beijing Municipal
Environmental Protection Bureau’s air quality station and a Beijing Municipal
Meteorological Bureau’s weather station whose data are used in this study.
Fig. 1. Map showing the three measurement sites (XCC, CRAES, HSZ), the Beijing Municipality (the area within the white line), andthe surrounding regions. Also shown are the location of the “Bird’s Nest” National Olympic Stadium, a Beijing Municipal EnvironmentalProtection Bureau’s air quality station and a Beijing Municipal Meteorological Bureau’s weather station whose data are used in this study.
immediately downwind of the maximum emissions from ur-ban Beijing, and is the most heavily instrumented of the threesites. The site is located on the rooftop of a three-floor build-ing in the Academy. Data on ozone, CO, NOx, NOy, VOCsfrom canisters, real-time PM2.5 sulfate and nitrate taken be-tween 10 July and 25 August are analyzed in this paper.
Heishanzhai (HSZ) is a rural mountainous area (40◦22′ N,116◦18′ E, 280 m above sea level), approximately 50 kmnorth of the center of Beijing. This site was used in our previ-ous study in the summer of 2005, when high concentrationsof ozone and secondary aerosol were observed (Wang et al.,2006; Pathak et al., 2009). In 2008, a different building wasused for the measurements due to renovation work in the pre-vious facility. This paper compares the O3, CO, SO2, NOy,24-h PM2.5 mass, sulfate, nitrate, and NMHCs data during10 July-August 25 2008 with the corresponding data fromJuly of 2005.
2.2 Instrumentation
A brief description of the methods used to measure the gasesand aerosols is given in the following. The reader is referredto relevant previous publications for further details. The lim-its of detections of the techniques are all sufficient to accu-rately measure the relatively high concentrations of gases andaerosols at the study sites.
Trace gases: O3 was measured with a UV photometric an-alyzer (TEI model 49i), CO with a non-dispersive infrared
analyzer (API model 300EU or API model 300E), and SO2with a pulsed UV fluorescence analyzer (TEI model 43C).Nitric oxide (NO) and NOy were measured with a commer-cial chemiluminescence analyzer fitted with an externallyplaced molybdenum oxide (MoO) catalytic converter (Wanget al., 2001). NOy is defined as the sum of NO, NO2, HONO,HO2NO2, NO3, PAN, HNO3, N2O5, aerosol nitrate, andother organic nitrates etc, including nitrate in PM2.5. A pho-tolytic converter (Blue Light converter, Meteorologie Con-sult Gubh) coupled to a commercial NO analyzer was usedto measure NO2. The methods used to calibrate these instru-ments were the same as those reported by Wang et al. (2001).The NO2 conversion efficiencies were determined by the gas-phase titration method, and an average efficiency of 35% wasobtained.
Methane, NMHC, and halocarbon concentrations were de-termined by collecting whole-air samples in evacuated 2Lelectro-polished stainless steel canisters each equipped witha bellows valve. Between one and seven samples werecollected each day, with more samples being collected onepisode days. The sampling duration was 2 min. The canis-ters were shipped to the University of California at Irvine forchemical analysis using gas chromatography with flame ion-ization detection, electron capture detection, and mass spec-trometer detection (Colman et al., 2001).
Aerosols: At the HSZ site, 24-h PM2.5 samples werecollected using a Thermo Andersen Chemical Speciation
www.atmos-chem-phys.net/10/7603/2010/ Atmos. Chem. Phys., 10, 7603–7615, 2010
7606 T. Wang et al.: Air quality during the 2008 Beijing Olympics
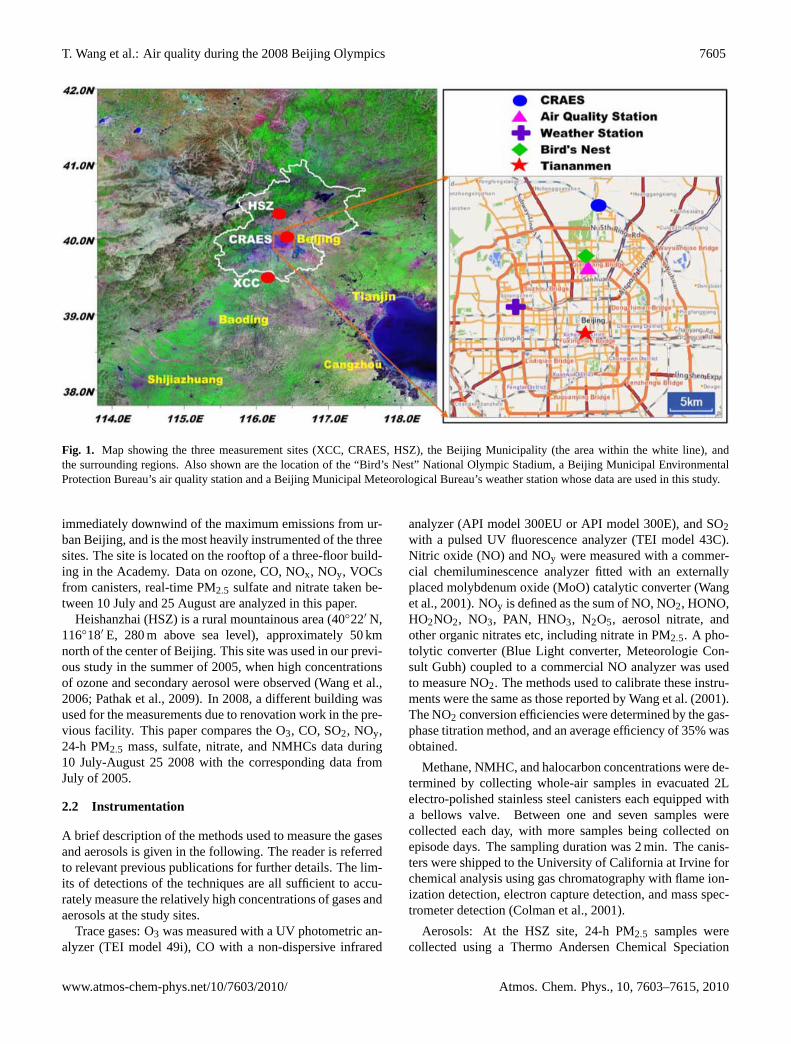
Fig. 2. Time series of(a) Air Pollution Index at a Beijing Municipal Environmental Protection Bureau’s air-quality monitoring stationat the Chaoyang National Olympics Sports Center,(b) hourly concentration of ozone and PM2.5 sulfate measured at CRAES,(c) dailyprecipitation amount,(d) four-hourly wind vectors,(e)daily mean temperature and relative humidity. The meteorological data were obtainedfrom a Beijing Municipal Meteorological Bureau’s weather station (see Fig. 1 for its location).
Monitor (RAAS2.5-400, Thermo Electron Corporation) withTeflon filters (Teflo™, 2 µm pore size and 47 mm diame-ter, Pall Inc.) at a flow rate of 16.7 LPM (Wu and Wang,2007). The PM2.5 mass was determined using the standardgravimetric method, and the water soluble ions SO2−
4 , NO−
3 ,F−, Cl−, NO−
2 , NH+
4 , K+, Na+, Mg2+, and Ca2+ were ana-lyzed using a Dionex ion chromatography 90 (Wu and Wang,2007). At CRAES, real-time PM2.5 ions were measured us-ing an ambient ion monitor (URG 9000B, URG Corporation)(Wu and Wang, 2007). Another instrument (same model)was used in 2008, however, the negative artifact reported inthe previous study was not observed.
2.3 Air pollution index, meteorological data, and backtrajectories
In order to show the air quality at the main Olympic complexand its relationship with the secondary pollutants measured atour nearby CRAES, we obtained official Air Pollution Index(API) data (http://www.bjepb.gov.cn) at the Beijing Munic-ipal Environmental Protection Bureau (BJEPB)’s air-qualitymonitoring station at Chaoyang Olympics Sports Center, lo-cated about 2 km south and southeast of the “Bird’s Nest”(Fig. 1). The API is calculated based on the highest indexof 24-h average concentrations of PM10, SO2, and NO2 fromnoon of the present day to noon of the pervious day. AnAPI of 0–50, 51–100, and 101–200 is classified as “excel-
lent”, “good”, and “slightly polluted” condition, respectively(UNEP, 2009).
To help interpret the chemical data, we used surface me-teorological data on precipitation, temperature, relative hu-midity, and wind speed and direction obtained from the Bei-jing Municipal Meteorological Bureau (BJMB) weather sta-tion located to the west of the city center (Fig. 1). The winddata were collected four times a day (02:00, 08:00, 14:00,and 20:00, local time), and the other data were daily aver-ages. These data were obtained from Global Telecommu-nication Systems. In addition to surface winds, 48-h back-ward trajectories were calculated to identify the origin andtransport pathway of large-scale air masses. The trajec-tories were calculated for four times a day (02:00, 08:00,14:00, and 20:00, local time) using the NOAA ARL HYS-PLIT model with GDAS (Global Data Assimilation System)data (http://ready.arl.noaa.gov/HYSPLIT.php), with the end-point at the CRAES, and at an altitude of 100 m above groundlevel.
3 Results and discussion
3.1 Overall air quality and relation to weatherconditions
Figure 2 shows the daily API, the hourly concentrations ofozone and sulfate at CRAES, and several meteorological
Atmos. Chem. Phys., 10, 7603–7615, 2010 www.atmos-chem-phys.net/10/7603/2010/
T. Wang et al.: Air quality during the 2008 Beijing Olympics 7607
32
Figure 3. Average concentration of secondary pollutants at CRAES: ozone (for the
11:00-18:00 period), NOy, PM2.5 sulfate and nitrate, during the three periods, namely
before the full control (July 10-19), after the full control (July 20-August 8), and during
the Olympics (August 9-24). Vertical bars are half standard deviations.
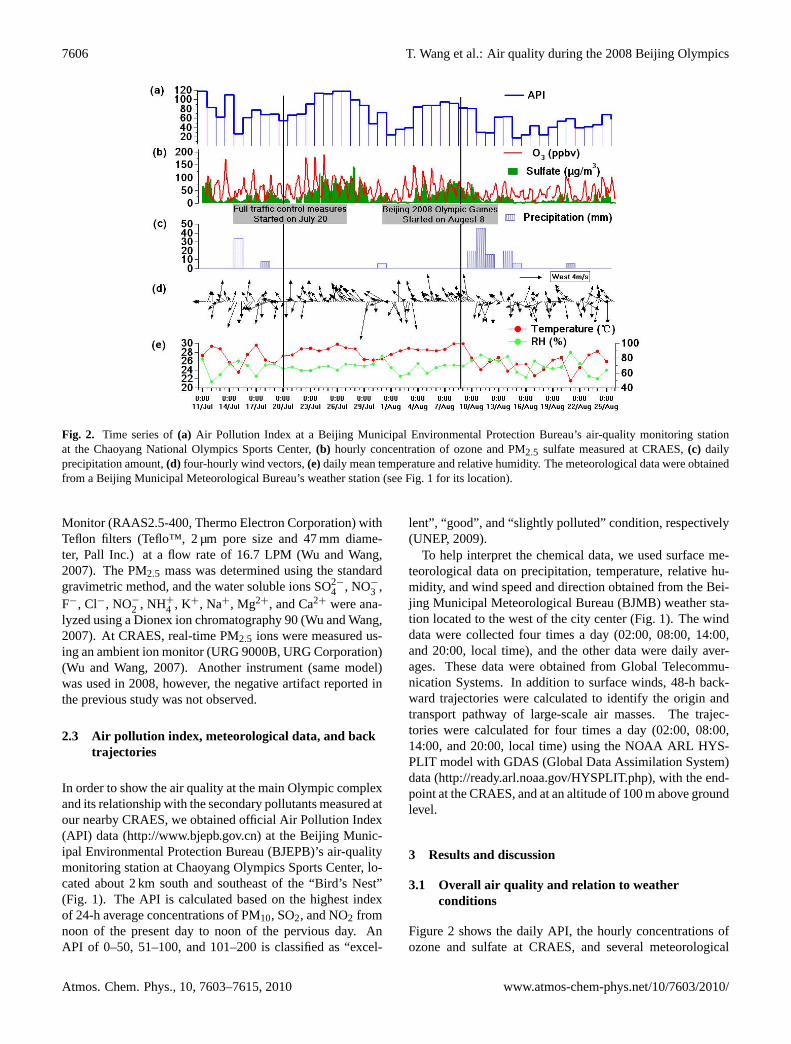
Fig. 3. Average concentration of secondary pollutants at CRAES:ozone (for the 11:00–18:00 period), NOy, PM2.5 sulfate and ni-trate, during the three periods, namely before the full control (10–19 July), after the full control (20 July–8 August), and during theOlympics (9–24 August). Vertical bars are half standard deviations.
parameters from BJMB from July 11 to August 25. Dur-ing the observation period, PM10 was the dominant pollutantof the three reported pollutants (PM10, SO2, and NO2) at theBJEPB site. Thus the officially reported air quality repre-sented levels of coarse particulate matter. An API of 0–50,51–100, and 101–200 corresponds to 0–50, 52–150, 152–350 µg/m3 of PM10, respectively (UNEP, 2009). However,because the computation of API does not include ozone, theAPI does not adequately reflect the situation of photochem-ical pollution. Thus the combined API and the secondarypollutants at our site shown in Fig. 2 better illustrate the vari-ations in air quality (for both primary and secondary pollu-tants) in the Olympics complex and the adjacent areas.
The observation period can be divided into three parts:(1) before the full-scale control (11–19 July), (2) after thefull-scale control but before the Olympics (20 July to 8 Au-gust), and (3) during the Olympics (9–24 August). Moder-ately high API (60–120) (and ozone and sulfate concentra-tions) was recorded in the first period. After the full trafficcontrol came into effect, two multi-day pollution episodesoccurred: one between 23 and 29 July, and one started threeday before the Olympic openings and lasted for five days (4–9 August). The highest readings of API, ozone, and sulfateoccurred during this period: nine days had a maximum 1-h ozone exceeding China’s ambient air quality standard of100 ppbv, with the highest value of 190 ppbv being recordedon 24 July; very high concentrations of sulfate (hourly valuesof 80–140 µg/m3) were also observed. Good air quality wasrecorded on most days during the Games, as indicated by thelowest API values and the concentrations of secondary pol-lutants (see Fig. 2).
33
Figure 4. Mean concentration of vehicle-related primary pollutants during the three
periods at CRAES (a) NOx during rush hours, daytime and whole day and (b) individual
and total C2-C8 NMHCs. Vertical bars are half standard deviations. The number of VOC
samples is 6, 14, 14 for period 1, 2, and 3, respectively.
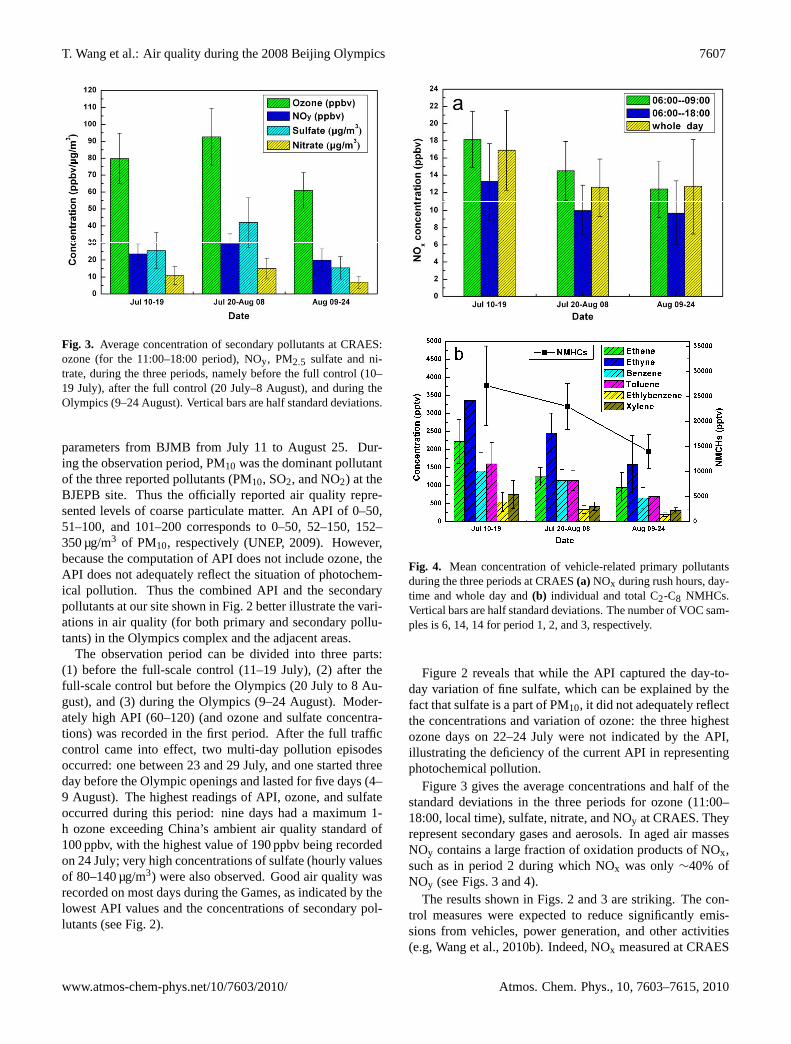
Fig. 4. Mean concentration of vehicle-related primary pollutantsduring the three periods at CRAES(a) NOx during rush hours, day-time and whole day and(b) individual and total C2-C8 NMHCs.Vertical bars are half standard deviations. The number of VOC sam-ples is 6, 14, 14 for period 1, 2, and 3, respectively.
Figure 2 reveals that while the API captured the day-to-day variation of fine sulfate, which can be explained by thefact that sulfate is a part of PM10, it did not adequately reflectthe concentrations and variation of ozone: the three highestozone days on 22–24 July were not indicated by the API,illustrating the deficiency of the current API in representingphotochemical pollution.
Figure 3 gives the average concentrations and half of thestandard deviations in the three periods for ozone (11:00–18:00, local time), sulfate, nitrate, and NOy at CRAES. Theyrepresent secondary gases and aerosols. In aged air massesNOy contains a large fraction of oxidation products of NOx,such as in period 2 during which NOx was only∼40% ofNOy (see Figs. 3 and 4).
The results shown in Figs. 2 and 3 are striking. The con-trol measures were expected to reduce significantly emis-sions from vehicles, power generation, and other activities(e.g, Wang et al., 2010b). Indeed, NOx measured at CRAES
www.atmos-chem-phys.net/10/7603/2010/ Atmos. Chem. Phys., 10, 7603–7615, 2010
7608 T. Wang et al.: Air quality during the 2008 Beijing Olympics
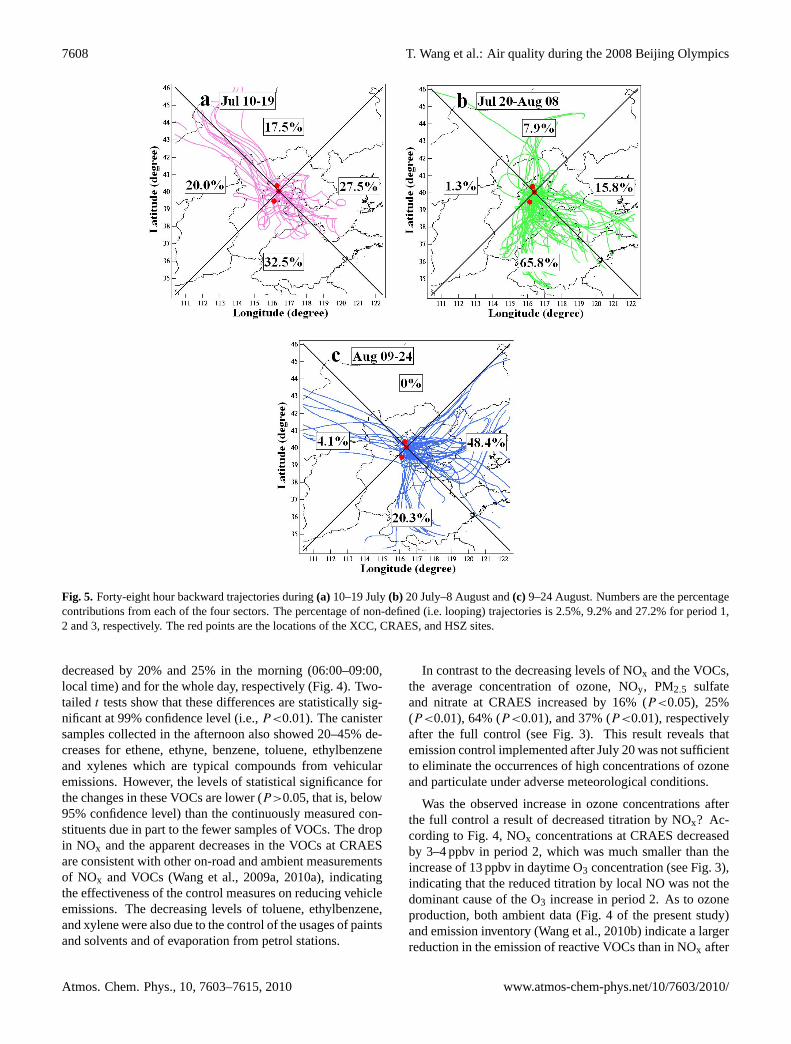
Fig. 5. Forty-eight hour backward trajectories during(a) 10–19 July(b) 20 July–8 August and(c) 9–24 August. Numbers are the percentagecontributions from each of the four sectors. The percentage of non-defined (i.e. looping) trajectories is 2.5%, 9.2% and 27.2% for period 1,2 and 3, respectively. The red points are the locations of the XCC, CRAES, and HSZ sites.
decreased by 20% and 25% in the morning (06:00–09:00,local time) and for the whole day, respectively (Fig. 4). Two-tailed t tests show that these differences are statistically sig-nificant at 99% confidence level (i.e.,P<0.01). The canistersamples collected in the afternoon also showed 20–45% de-creases for ethene, ethyne, benzene, toluene, ethylbenzeneand xylenes which are typical compounds from vehicularemissions. However, the levels of statistical significance forthe changes in these VOCs are lower (P>0.05, that is, below95% confidence level) than the continuously measured con-stituents due in part to the fewer samples of VOCs. The dropin NOx and the apparent decreases in the VOCs at CRAESare consistent with other on-road and ambient measurementsof NOx and VOCs (Wang et al., 2009a, 2010a), indicatingthe effectiveness of the control measures on reducing vehicleemissions. The decreasing levels of toluene, ethylbenzene,and xylene were also due to the control of the usages of paintsand solvents and of evaporation from petrol stations.
In contrast to the decreasing levels of NOx and the VOCs,the average concentration of ozone, NOy, PM2.5 sulfateand nitrate at CRAES increased by 16% (P<0.05), 25%(P<0.01), 64% (P<0.01), and 37% (P<0.01), respectivelyafter the full control (see Fig. 3). This result reveals thatemission control implemented after July 20 was not sufficientto eliminate the occurrences of high concentrations of ozoneand particulate under adverse meteorological conditions.
Was the observed increase in ozone concentrations afterthe full control a result of decreased titration by NOx? Ac-cording to Fig. 4, NOx concentrations at CRAES decreasedby 3–4 ppbv in period 2, which was much smaller than theincrease of 13 ppbv in daytime O3 concentration (see Fig. 3),indicating that the reduced titration by local NO was not thedominant cause of the O3 increase in period 2. As to ozoneproduction, both ambient data (Fig. 4 of the present study)and emission inventory (Wang et al., 2010b) indicate a largerreduction in the emission of reactive VOCs than in NOx after
Atmos. Chem. Phys., 10, 7603–7615, 2010 www.atmos-chem-phys.net/10/7603/2010/
T. Wang et al.: Air quality during the 2008 Beijing Olympics 7609
35
Figure 6. (a) Mean wind and geopotential height for a multi-day pollution episode on
22-28 July 2008 (b) MODIS true-color imagery on July 24.
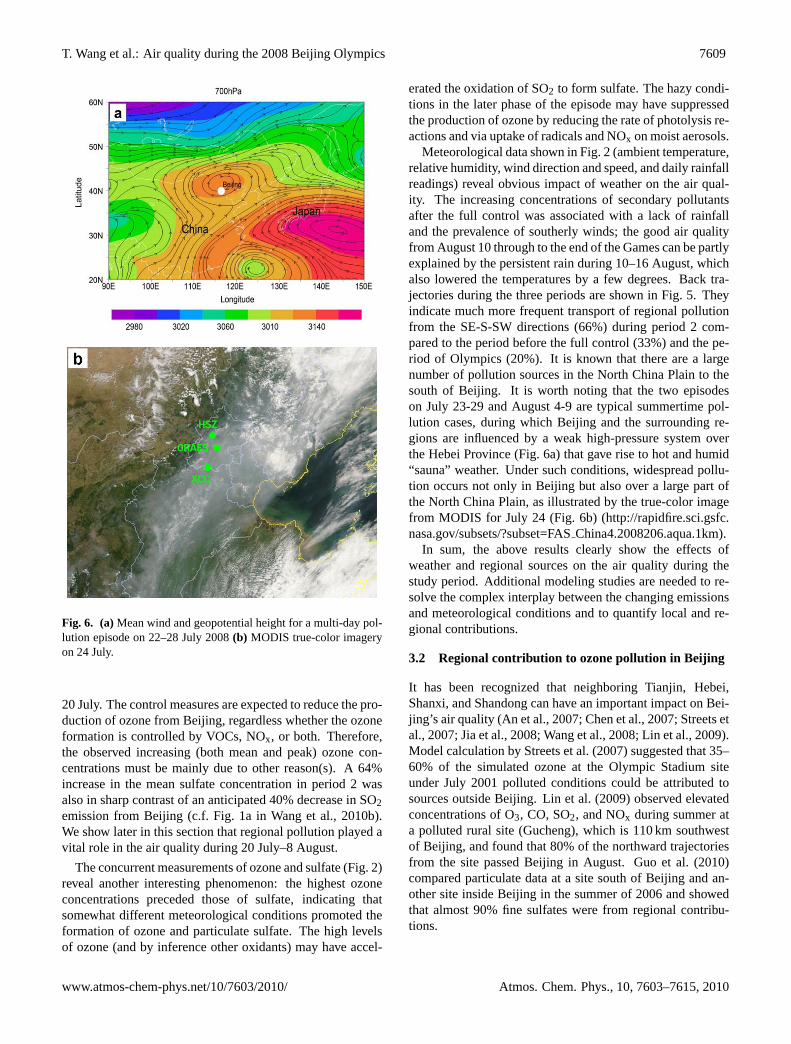
Fig. 6. (a)Mean wind and geopotential height for a multi-day pol-lution episode on 22–28 July 2008(b) MODIS true-color imageryon 24 July.
20 July. The control measures are expected to reduce the pro-duction of ozone from Beijing, regardless whether the ozoneformation is controlled by VOCs, NOx, or both. Therefore,the observed increasing (both mean and peak) ozone con-centrations must be mainly due to other reason(s). A 64%increase in the mean sulfate concentration in period 2 wasalso in sharp contrast of an anticipated 40% decrease in SO2emission from Beijing (c.f. Fig. 1a in Wang et al., 2010b).We show later in this section that regional pollution played avital role in the air quality during 20 July–8 August.
The concurrent measurements of ozone and sulfate (Fig. 2)reveal another interesting phenomenon: the highest ozoneconcentrations preceded those of sulfate, indicating thatsomewhat different meteorological conditions promoted theformation of ozone and particulate sulfate. The high levelsof ozone (and by inference other oxidants) may have accel-
erated the oxidation of SO2 to form sulfate. The hazy condi-tions in the later phase of the episode may have suppressedthe production of ozone by reducing the rate of photolysis re-actions and via uptake of radicals and NOx on moist aerosols.
Meteorological data shown in Fig. 2 (ambient temperature,relative humidity, wind direction and speed, and daily rainfallreadings) reveal obvious impact of weather on the air qual-ity. The increasing concentrations of secondary pollutantsafter the full control was associated with a lack of rainfalland the prevalence of southerly winds; the good air qualityfrom August 10 through to the end of the Games can be partlyexplained by the persistent rain during 10–16 August, whichalso lowered the temperatures by a few degrees. Back tra-jectories during the three periods are shown in Fig. 5. Theyindicate much more frequent transport of regional pollutionfrom the SE-S-SW directions (66%) during period 2 com-pared to the period before the full control (33%) and the pe-riod of Olympics (20%). It is known that there are a largenumber of pollution sources in the North China Plain to thesouth of Beijing. It is worth noting that the two episodeson July 23-29 and August 4-9 are typical summertime pol-lution cases, during which Beijing and the surrounding re-gions are influenced by a weak high-pressure system overthe Hebei Province (Fig. 6a) that gave rise to hot and humid“sauna” weather. Under such conditions, widespread pollu-tion occurs not only in Beijing but also over a large part ofthe North China Plain, as illustrated by the true-color imagefrom MODIS for July 24 (Fig. 6b) (http://rapidfire.sci.gsfc.nasa.gov/subsets/?subset=FASChina4.2008206.aqua.1km).
In sum, the above results clearly show the effects ofweather and regional sources on the air quality during thestudy period. Additional modeling studies are needed to re-solve the complex interplay between the changing emissionsand meteorological conditions and to quantify local and re-gional contributions.
3.2 Regional contribution to ozone pollution in Beijing
It has been recognized that neighboring Tianjin, Hebei,Shanxi, and Shandong can have an important impact on Bei-jing’s air quality (An et al., 2007; Chen et al., 2007; Streets etal., 2007; Jia et al., 2008; Wang et al., 2008; Lin et al., 2009).Model calculation by Streets et al. (2007) suggested that 35–60% of the simulated ozone at the Olympic Stadium siteunder July 2001 polluted conditions could be attributed tosources outside Beijing. Lin et al. (2009) observed elevatedconcentrations of O3, CO, SO2, and NOx during summer ata polluted rural site (Gucheng), which is 110 km southwestof Beijing, and found that 80% of the northward trajectoriesfrom the site passed Beijing in August. Guo et al. (2010)compared particulate data at a site south of Beijing and an-other site inside Beijing in the summer of 2006 and showedthat almost 90% fine sulfates were from regional contribu-tions.
www.atmos-chem-phys.net/10/7603/2010/ Atmos. Chem. Phys., 10, 7603–7615, 2010
7610 T. Wang et al.: Air quality during the 2008 Beijing Olympics
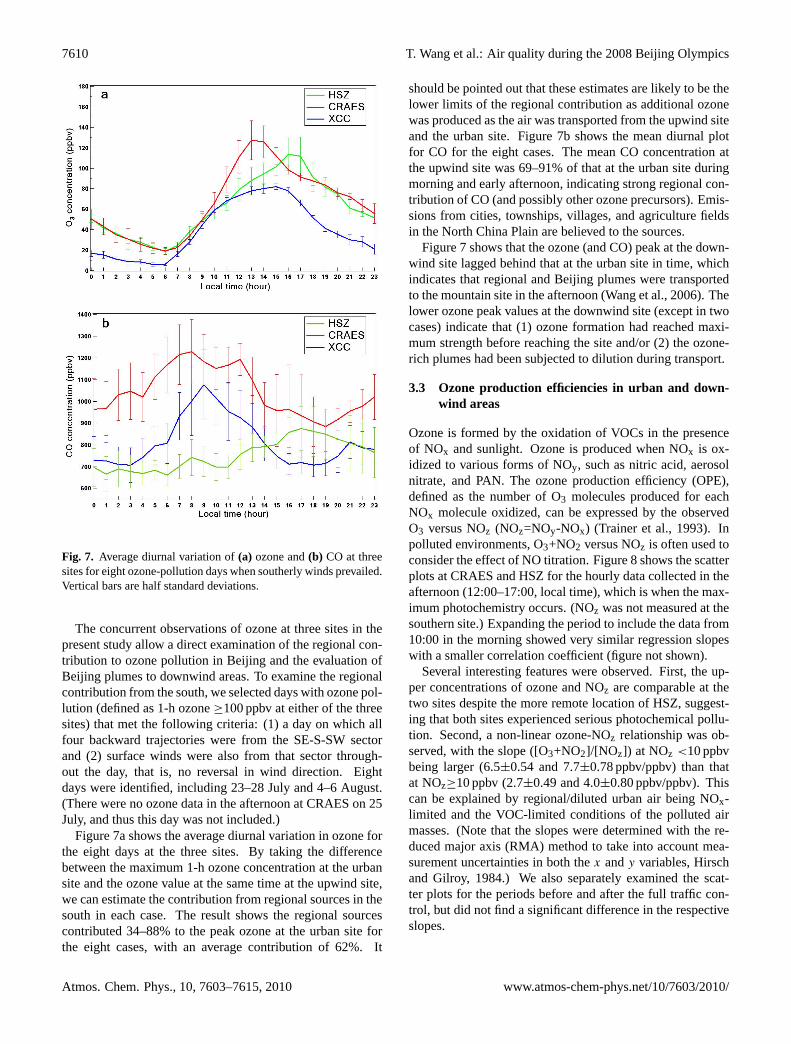
Fig. 7. Average diurnal variation of(a) ozone and(b) CO at threesites for eight ozone-pollution days when southerly winds prevailed.Vertical bars are half standard deviations.
The concurrent observations of ozone at three sites in thepresent study allow a direct examination of the regional con-tribution to ozone pollution in Beijing and the evaluation ofBeijing plumes to downwind areas. To examine the regionalcontribution from the south, we selected days with ozone pol-lution (defined as 1-h ozone≥100 ppbv at either of the threesites) that met the following criteria: (1) a day on which allfour backward trajectories were from the SE-S-SW sectorand (2) surface winds were also from that sector through-out the day, that is, no reversal in wind direction. Eightdays were identified, including 23–28 July and 4–6 August.(There were no ozone data in the afternoon at CRAES on 25July, and thus this day was not included.)
Figure 7a shows the average diurnal variation in ozone forthe eight days at the three sites. By taking the differencebetween the maximum 1-h ozone concentration at the urbansite and the ozone value at the same time at the upwind site,we can estimate the contribution from regional sources in thesouth in each case. The result shows the regional sourcescontributed 34–88% to the peak ozone at the urban site forthe eight cases, with an average contribution of 62%. It
should be pointed out that these estimates are likely to be thelower limits of the regional contribution as additional ozonewas produced as the air was transported from the upwind siteand the urban site. Figure 7b shows the mean diurnal plotfor CO for the eight cases. The mean CO concentration atthe upwind site was 69–91% of that at the urban site duringmorning and early afternoon, indicating strong regional con-tribution of CO (and possibly other ozone precursors). Emis-sions from cities, townships, villages, and agriculture fieldsin the North China Plain are believed to the sources.
Figure 7 shows that the ozone (and CO) peak at the down-wind site lagged behind that at the urban site in time, whichindicates that regional and Beijing plumes were transportedto the mountain site in the afternoon (Wang et al., 2006). Thelower ozone peak values at the downwind site (except in twocases) indicate that (1) ozone formation had reached maxi-mum strength before reaching the site and/or (2) the ozone-rich plumes had been subjected to dilution during transport.
3.3 Ozone production efficiencies in urban and down-wind areas
Ozone is formed by the oxidation of VOCs in the presenceof NOx and sunlight. Ozone is produced when NOx is ox-idized to various forms of NOy, such as nitric acid, aerosolnitrate, and PAN. The ozone production efficiency (OPE),defined as the number of O3 molecules produced for eachNOx molecule oxidized, can be expressed by the observedO3 versus NOz (NOz=NOy-NOx) (Trainer et al., 1993). Inpolluted environments, O3+NO2 versus NOz is often used toconsider the effect of NO titration. Figure 8 shows the scatterplots at CRAES and HSZ for the hourly data collected in theafternoon (12:00–17:00, local time), which is when the max-imum photochemistry occurs. (NOz was not measured at thesouthern site.) Expanding the period to include the data from10:00 in the morning showed very similar regression slopeswith a smaller correlation coefficient (figure not shown).
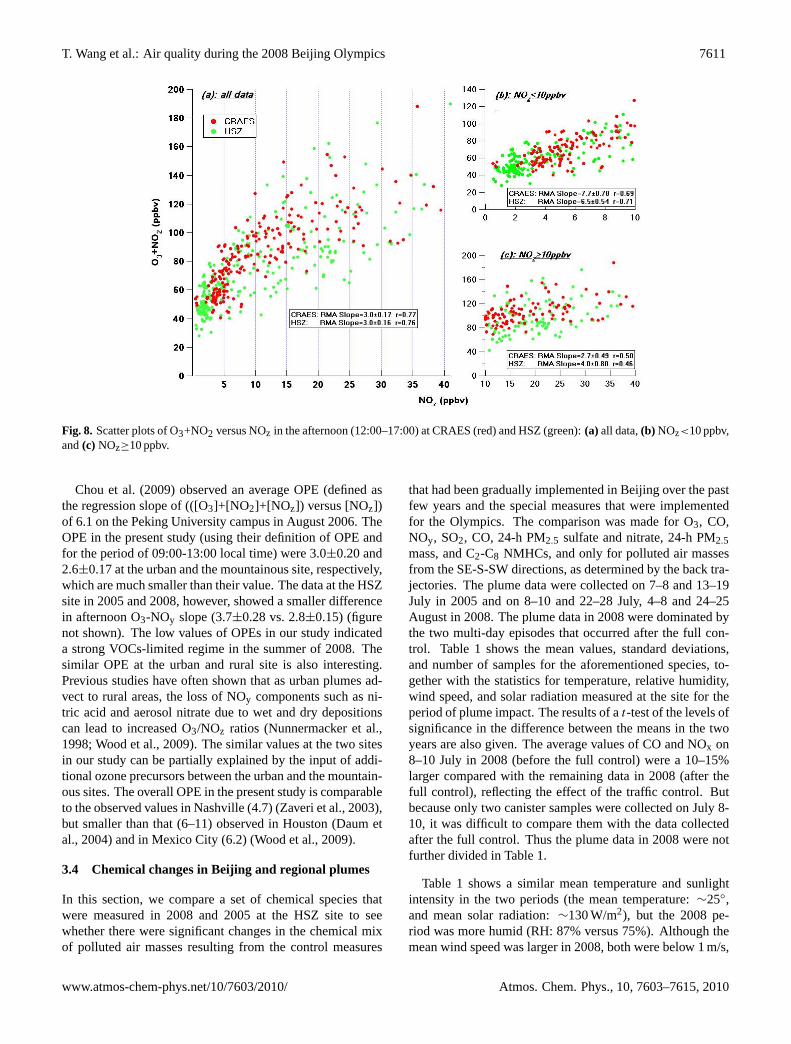
Several interesting features were observed. First, the up-per concentrations of ozone and NOz are comparable at thetwo sites despite the more remote location of HSZ, suggest-ing that both sites experienced serious photochemical pollu-tion. Second, a non-linear ozone-NOz relationship was ob-served, with the slope ([O3+NO2]/[NOz]) at NOz <10 ppbvbeing larger (6.5±0.54 and 7.7±0.78 ppbv/ppbv) than thatat NOz≥10 ppbv (2.7±0.49 and 4.0±0.80 ppbv/ppbv). Thiscan be explained by regional/diluted urban air being NOx-limited and the VOC-limited conditions of the polluted airmasses. (Note that the slopes were determined with the re-duced major axis (RMA) method to take into account mea-surement uncertainties in both thex andy variables, Hirschand Gilroy, 1984.) We also separately examined the scat-ter plots for the periods before and after the full traffic con-trol, but did not find a significant difference in the respectiveslopes.
Atmos. Chem. Phys., 10, 7603–7615, 2010 www.atmos-chem-phys.net/10/7603/2010/
T. Wang et al.: Air quality during the 2008 Beijing Olympics 7611
Fig. 8. Scatter plots of O3+NO2 versus NOz in the afternoon (12:00–17:00) at CRAES (red) and HSZ (green):(a) all data,(b) NOz<10 ppbv,and(c) NOz≥10 ppbv.
Chou et al. (2009) observed an average OPE (defined asthe regression slope of (([O3]+[NO2]+[NOz]) versus [NOz])of 6.1 on the Peking University campus in August 2006. TheOPE in the present study (using their definition of OPE andfor the period of 09:00-13:00 local time) were 3.0±0.20 and2.6±0.17 at the urban and the mountainous site, respectively,which are much smaller than their value. The data at the HSZsite in 2005 and 2008, however, showed a smaller differencein afternoon O3-NOy slope (3.7±0.28 vs. 2.8±0.15) (figurenot shown). The low values of OPEs in our study indicateda strong VOCs-limited regime in the summer of 2008. Thesimilar OPE at the urban and rural site is also interesting.Previous studies have often shown that as urban plumes ad-vect to rural areas, the loss of NOy components such as ni-tric acid and aerosol nitrate due to wet and dry depositionscan lead to increased O3/NOz ratios (Nunnermacker et al.,1998; Wood et al., 2009). The similar values at the two sitesin our study can be partially explained by the input of addi-tional ozone precursors between the urban and the mountain-ous sites. The overall OPE in the present study is comparableto the observed values in Nashville (4.7) (Zaveri et al., 2003),but smaller than that (6–11) observed in Houston (Daum etal., 2004) and in Mexico City (6.2) (Wood et al., 2009).
3.4 Chemical changes in Beijing and regional plumes
In this section, we compare a set of chemical species thatwere measured in 2008 and 2005 at the HSZ site to seewhether there were significant changes in the chemical mixof polluted air masses resulting from the control measures
that had been gradually implemented in Beijing over the pastfew years and the special measures that were implementedfor the Olympics. The comparison was made for O3, CO,NOy, SO2, CO, 24-h PM2.5 sulfate and nitrate, 24-h PM2.5mass, and C2-C8 NMHCs, and only for polluted air massesfrom the SE-S-SW directions, as determined by the back tra-jectories. The plume data were collected on 7–8 and 13–19July in 2005 and on 8–10 and 22–28 July, 4–8 and 24–25August in 2008. The plume data in 2008 were dominated bythe two multi-day episodes that occurred after the full con-trol. Table 1 shows the mean values, standard deviations,and number of samples for the aforementioned species, to-gether with the statistics for temperature, relative humidity,wind speed, and solar radiation measured at the site for theperiod of plume impact. The results of at-test of the levels ofsignificance in the difference between the means in the twoyears are also given. The average values of CO and NOx on8–10 July in 2008 (before the full control) were a 10–15%larger compared with the remaining data in 2008 (after thefull control), reflecting the effect of the traffic control. Butbecause only two canister samples were collected on July 8-10, it was difficult to compare them with the data collectedafter the full control. Thus the plume data in 2008 were notfurther divided in Table 1.
Table 1 shows a similar mean temperature and sunlightintensity in the two periods (the mean temperature:∼25◦,and mean solar radiation:∼130 W/m2), but the 2008 pe-riod was more humid (RH: 87% versus 75%). Although themean wind speed was larger in 2008, both were below 1 m/s,
www.atmos-chem-phys.net/10/7603/2010/ Atmos. Chem. Phys., 10, 7603–7615, 2010
7612 T. Wang et al.: Air quality during the 2008 Beijing Olympics
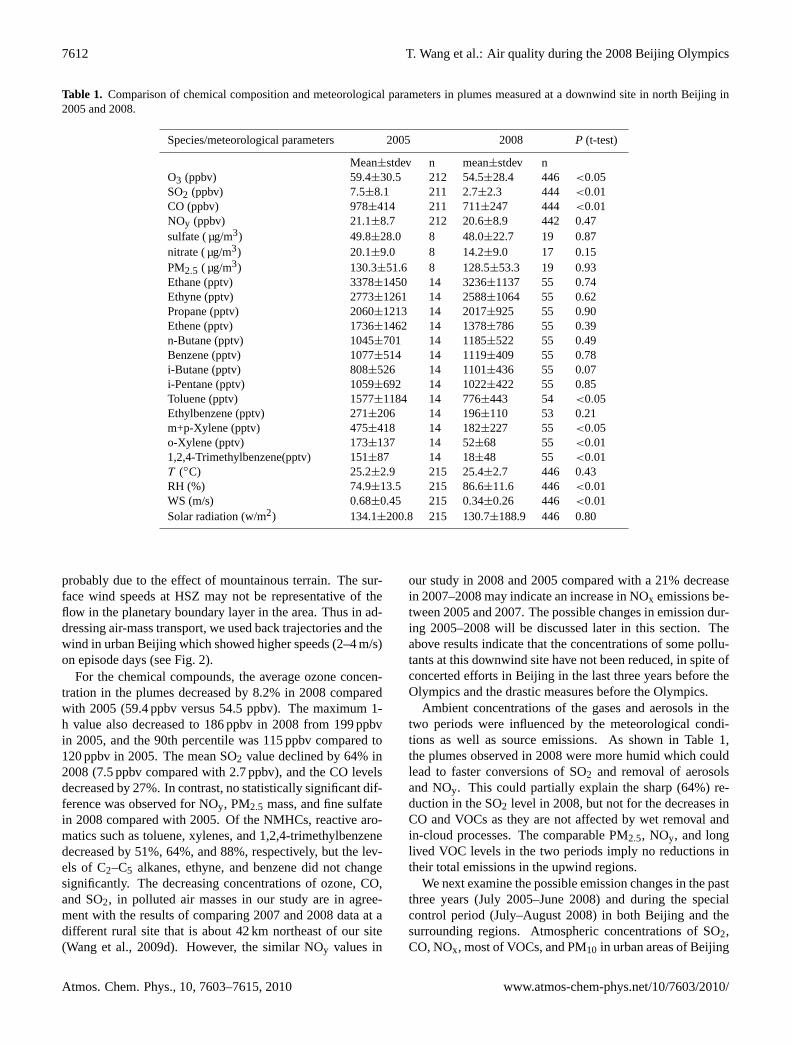
Table 1. Comparison of chemical composition and meteorological parameters in plumes measured at a downwind site in north Beijing in2005 and 2008.
Species/meteorological parameters 2005 2008 P (t-test)
Mean±stdev n mean±stdev nO3 (ppbv) 59.4±30.5 212 54.5±28.4 446 <0.05SO2 (ppbv) 7.5±8.1 211 2.7±2.3 444 <0.01CO (ppbv) 978±414 211 711±247 444 <0.01NOy (ppbv) 21.1±8.7 212 20.6±8.9 442 0.47sulfate ( µg/m3) 49.8±28.0 8 48.0±22.7 19 0.87nitrate ( µg/m3) 20.1±9.0 8 14.2±9.0 17 0.15PM2.5 ( µg/m3) 130.3±51.6 8 128.5±53.3 19 0.93Ethane (pptv) 3378±1450 14 3236±1137 55 0.74Ethyne (pptv) 2773±1261 14 2588±1064 55 0.62Propane (pptv) 2060±1213 14 2017±925 55 0.90Ethene (pptv) 1736±1462 14 1378±786 55 0.39n-Butane (pptv) 1045±701 14 1185±522 55 0.49Benzene (pptv) 1077±514 14 1119±409 55 0.78i-Butane (pptv) 808±526 14 1101±436 55 0.07i-Pentane (pptv) 1059±692 14 1022±422 55 0.85Toluene (pptv) 1577±1184 14 776±443 54 <0.05Ethylbenzene (pptv) 271±206 14 196±110 53 0.21m+p-Xylene (pptv) 475±418 14 182±227 55 <0.05o-Xylene (pptv) 173±137 14 52±68 55 <0.011,2,4-Trimethylbenzene(pptv) 151±87 14 18±48 55 <0.01T (◦C) 25.2±2.9 215 25.4±2.7 446 0.43RH (%) 74.9±13.5 215 86.6±11.6 446 <0.01WS (m/s) 0.68±0.45 215 0.34±0.26 446 <0.01Solar radiation (w/m2) 134.1±200.8 215 130.7±188.9 446 0.80
probably due to the effect of mountainous terrain. The sur-face wind speeds at HSZ may not be representative of theflow in the planetary boundary layer in the area. Thus in ad-dressing air-mass transport, we used back trajectories and thewind in urban Beijing which showed higher speeds (2–4 m/s)on episode days (see Fig. 2).
For the chemical compounds, the average ozone concen-tration in the plumes decreased by 8.2% in 2008 comparedwith 2005 (59.4 ppbv versus 54.5 ppbv). The maximum 1-h value also decreased to 186 ppbv in 2008 from 199 ppbvin 2005, and the 90th percentile was 115 ppbv compared to120 ppbv in 2005. The mean SO2 value declined by 64% in2008 (7.5 ppbv compared with 2.7 ppbv), and the CO levelsdecreased by 27%. In contrast, no statistically significant dif-ference was observed for NOy, PM2.5 mass, and fine sulfatein 2008 compared with 2005. Of the NMHCs, reactive aro-matics such as toluene, xylenes, and 1,2,4-trimethylbenzenedecreased by 51%, 64%, and 88%, respectively, but the lev-els of C2–C5 alkanes, ethyne, and benzene did not changesignificantly. The decreasing concentrations of ozone, CO,and SO2, in polluted air masses in our study are in agree-ment with the results of comparing 2007 and 2008 data at adifferent rural site that is about 42 km northeast of our site(Wang et al., 2009d). However, the similar NOy values in
our study in 2008 and 2005 compared with a 21% decreasein 2007–2008 may indicate an increase in NOx emissions be-tween 2005 and 2007. The possible changes in emission dur-ing 2005–2008 will be discussed later in this section. Theabove results indicate that the concentrations of some pollu-tants at this downwind site have not been reduced, in spite ofconcerted efforts in Beijing in the last three years before theOlympics and the drastic measures before the Olympics.
Ambient concentrations of the gases and aerosols in thetwo periods were influenced by the meteorological condi-tions as well as source emissions. As shown in Table 1,the plumes observed in 2008 were more humid which couldlead to faster conversions of SO2 and removal of aerosolsand NOy. This could partially explain the sharp (64%) re-duction in the SO2 level in 2008, but not for the decreases inCO and VOCs as they are not affected by wet removal andin-cloud processes. The comparable PM2.5, NOy, and longlived VOC levels in the two periods imply no reductions intheir total emissions in the upwind regions.
We next examine the possible emission changes in the pastthree years (July 2005–June 2008) and during the specialcontrol period (July–August 2008) in both Beijing and thesurrounding regions. Atmospheric concentrations of SO2,CO, NOx, most of VOCs, and PM10 in urban areas of Beijing
Atmos. Chem. Phys., 10, 7603–7615, 2010 www.atmos-chem-phys.net/10/7603/2010/
T. Wang et al.: Air quality during the 2008 Beijing Olympics 7613
have decreased in the recent years, indicating reduced emis-sions of these pollutants in Beijing (UNEP, 2009; Shao etal., 2009). During the special control period, the emissionsin Beijing of all the above pollutants have decreased (UNEP,2009; Wang et al., 2010b). Thus we believe the emissionsof SO2, CO, NOx, PM, most of VOCs in Beijing decreasedbetween the two data-collection periods in 2005 and 2008.
The emission trends in the North China Plain are less clear.National SO2 emission in China reached the peak in 2006and decreased by 8.9% during 2005-2008 (NBSC, 2006-2009). The emission of NOx, on the other hand, is expectedto continue the recent upward trend (Zhang et al., 2009) dueto the slow implementation of advanced NOx control in coal-fired power plants and to a relatively small decrease in NOxemissions for new vehicles (Zhang et al., 2009; Zhao et al.,2008). The CO emissions are thought to have stabilized dueto a sharp decrease in emissions from new cars (Zhang et al.,2009), while the VOC emissions increased by 29% during2001-2006. During the special control period, the emissionsof these pollutants are expected to have decreased, althoughno information on the amount of the reduction is available.
With the consideration of the emission situation, we inter-pret the observed concentration changes in 2005 and 2008as follows. The decreases in the concentrations of SO2 (andthe total sulfur), CO, reactive aromatics in 2008 are mainlydue to the long-term and special control measures imple-mented in Beijing: SO2 from control of emissions in coal-fired power plants, CO from reduced emissions from vehi-cles and possibly also from open fires in the North ChinaPlain, toluene, xylenes, and 1,2,4-trimethylbenzene from thecontrol of emissions from vehicles and petrol stations andfrom solvent and paint use in the run up to and during theOlympics. On the other hand, the insignificant changes inaerosol (PM2.5 mass and sulfate), NOy, and longer livedNMHCs during the two periods imply increased emissionsfrom sources outside Beijing and lacking stringent NOx con-trol in coal-fired power plants.
The increased regional emission during 2005–2008 in-ferred from the above analysis and the regional contributionto the very high concentrations of secondary air pollutantsafter the drastic control measures in the summer of 2008 sug-gest that more stringent control of the regional emissions willbe needed in order to significantly improve the air quality(especially ozone and secondary aerosols) in Beijing and thesurrounding regions.
4 Summary and conclusions
Atmospheric measurements from this work clearly demon-strate the strong impact of regional sources and meteorologyon the variations of secondary pollutants (ozone, fine sulfateand nitrate) in the summer of 2008 in Beijing. The pollutionreductions measures for the Beijing Olympics in July andAugust were successful in reducing atmospheric concentra-
tions of primary pollutants such as NOx and VOCs. How-ever, high levels of ozone (with hourly values up to 190 ppbv)and secondary aerosols (with hourly sulfate up to 140 µg/m3)still occurred at an urban site after the full control took ef-fect, which was strongly associated with the transport ofchemically processed air masses from the North China Plain.Regional sources were shown to have significant contribu-tion to the concentrations of ozone and CO (approximately62% and 77%, on average, respectively) at the urban site un-der southerly winds. Much improved air quality on most ofthe days during the Olympics also had apparent relationshipwith weather changes (persistent rainfall, lower temperature,and easterly air flow). Further modeling studies are neededto quantify the relative role of the emission reduction andweather changes and the contribution of local versus regionalsources to the air quality changes.
By comparing with the data collected in July 2005 at theplume-impacted downwind site, we found similar concen-trations of PM2.5 mass, PM2.5 sulfate, total reactive nitrogenand several long lived VOCs. We interpret this as evidence ofgrowing regional emissions during the past several years. Onthe other hand, the sharp reductions in total CO, SO2 (andtotal sulfur), and reactive aromatics suggest the success ofthe government’s efforts in reducing emissions in Beijing bylong-term and special measures. The increasing emissionsfrom regional sources could make the pollution control ef-fects in Beijing less effective in mitigating ozone and fineaerosol problems, which are regional in nature. Thus, morestringent controls of regional sources are needed to furtherimprove the air quality in Beijing and the surrounding re-gions.
Acknowledgements.We thank Jing Wang, Rui Gao, Ravi Pathak,Youping Shou, Linlin Wang, Chao Yuan, Pengju Xu, Zheng Xu,Yangchun Yu, Waishing Wu, Xuehua Zhou, Joe Cheung, andXuezhong Wang for their contributions to the field work. Wethank NOAA Air Resources Laboratory for the provision of theHYSPLIT model. This study was funded by the Research GrantsCouncil of the Hong Kong Special Administrative Region (ProjectNo. PolyU 5294/07E), the National Basic Research Program ofChina (973 Project No. 2005CB422203), and the Hong KongPolytechnic University (Project No. 1-BB94).
Edited by: D. Parrish
References
An, X., Zhu, T., Wang, Z., Li, C., and Wang, Y.: A modeling anal-ysis of a heavy air pollution episode occurred in Beijing, Atmos.Chem. Phys., 7(12), 3103–3114, doi:10.5194/acp-7-3103-2007,2007.
Cermak, J. and Knutti, R.: Beijing Olympics as an aerosolfield experiment, Geophys. Res. Lett., 36, L10806,doi:10.1029/2009GL038572, 2009.
Chen, D. S., Cheng, S. Y., Liu, L., Chen, T., and Guo, X. R.: Anintegrated MM5-CMAQ modeling approach for assessing trans-
www.atmos-chem-phys.net/10/7603/2010/ Atmos. Chem. Phys., 10, 7603–7615, 2010
7614 T. Wang et al.: Air quality during the 2008 Beijing Olympics
boundary PM10 contribution to the host city of 2008 Olympicsummer games – Beijing, China, Atmos. Environ., 41 (6), 1237–1250, 2007.
Chou, C. C. K., Tsai, C. Y., Shiu, C. J., Liu, S. C., and Zhu, T.: Mea-surement of NOy during Campaign of Air Quality Research inBeijing 2006 (CAREBeijing-2006): Implications for the ozoneproduction efficiency of NOx, J. Geophys. Res.-Atmos., 114,D00G01, doi:10.1029/2008JD010446, 2009.
Colman, J. J., Swanson, A. L., Meinardi, S., Sive, B. C., Blake,D. R., and Rowland, F. S.: Description of the analysis of awide range of volatile organic compounds in whole air samplescollected during PEM-Tropics A and B, Anal. Chem., 73 (15),3723–3731, 2001.
Daum, P. H., Kleinman, L. I., Springston, S. R., Nunnermacker, L.J., Lee, Y. N., Weinstein-Lloyd, J., Zheng, J., and Berkowitz, C.M.: Origin and properties of plumes of high ozone observed dur-ing the Texas 2000 Air Quality Study (TexAQS 2000), J. Geo-phys. Res.-Atmos., 109, D17306, doi:10.1029/2003JD004311,2004.
Guo, S., Hu, M., Wang, Z. B., and Zhao, Y. L.: Size-resolvedaerosol water-soluble ionic compositions in the summer of Bei-jing: implication of regional secondary formation, Atmos. Chem.Phys., 10, 947–959, doi:10.5194/acp-10-947-2010, 2010.
Hirsch, R. M. and Gilroy, E. J.: Methods of fitting a straight lineto data: examples in water resources, Water Res. Bull., 20(5),705–711, 1984.
Jia, Y. T., Rahn, K. A., He, K. B., Wen, T. X., and Wang, Y. S.: Anovel technique for quantifying the regional component of urbanaerosol solely from its sawtooth cycles, Geophys. Res. Lett., 113,D21309, doi:10.1029/2008JD010389, 2008.
Lin, W. L., Xu, X. B., and Zhang, X. C.: Characteristics of gaseouspollutants at Gucheng, a rural site southwest of Beijing, J. Geo-phys. Res.-Atmos., 114, D00G14, doi:10.1029/2008JD01 0339,2009.
Liu, J. F., Mu, Y. J., Zhang, Y. J., Zhang, Z. M., Wang, X. K., Liu,Y. J., and Sun, Z. Q.: Atmospheric levels of BTEX compoundsduring the 2008 Olympic Games in the urban area of Beijing,Sci. Total Environ., 408, 109–116, 2009.
Mijling, B., van der A, R. J., Boersma, K. F., Van Roozendael, M.,De Smedt, I., and Kelder, H. M.: Reductions of NO2 detectedfrom space during the 2008 Beijing Olympic Games, Geophys.Res. Lett., 36, L13801, doi:10.1029/2009GL038943, 2009.
NBSC, National Bureau of Statistics of China: China StatisticalYearbook, 2006–2009, China Statistics Press: Beijing, 2006–2009.
Nunnermacker, L. J., Imre, D., Daum, P. H., Kleinman, L., Lee, Y.N., Lee, J. H., Springston, S. R., Newman, L., Weinstein-Lloyd,J., Luke, W. T., Banta, R., Alvarez, R., Senff, C., Sillman, S.,Holdren, M., Keigley, G. W., and Zhou, X.: Charaterization ofthe Nashville urban plume on July 3 and July 18, 1995, J. Geo-phys. Res., 103(D21), 28129–28148, 1998.
Pathak, R. K., Wu, W. S, and Wang, T.: Summertime PM2.5 ionicspecies in four major cities of China: nitrate formation in anammonia-deficient atmosphere, Atmos. Chem. Phys., 9, 1711–1722, doi:10.5194/acp-9-1711-2009, 2009.
Shao, M.,Wang, B., Lu, S. H., Liu, S. C., and Chang, C. C.:Trends in summertime non-methane hydrocarbons in BeijingCity, 2004–2009, IGACtivity News Letter, 42, 18–25, 2009.
Streets, D. G., Fu, J. S., Jang, C. J., Hao, J. M., He, K. B., Tang,
X.Y., Zhang, Y. H., Wang, Z. F., Li, Z. P., Zhang, Q., Wang, L.T., Wang, B. Y., and Yu, C.: Air quality during the 2008 BeijingOlympic Games, Atmos. Environ., 41(3), 480-492, 2007.
Trainer, M., Parrish, D. D., Buhr, M. P., Norton, R. B., Fehsenfeld,F. C., Anlauf, K. G., Bottenheim, J. W., Tang, Y. Z., Wiebe, H.A., Roberts, J. M., Tanner, R. L., Newman, L., Bowersox, V.C., Meagher, J. F., Olszyna, K. J., Rodgers, M. O., Wang, T.,Berresheim, H., Demerjian, K. L., and Roychowdhury, U. K.:Correlation of ozone with NOy in photochemically aged air, J.Geophys. Res.-Atmos., 98(D2), 2917–2915, 1993.
UNEP, United Nations Environmental Programme: Indepen-dent Environmental Assessment Beijing 2008 Plympic Games,Nairobi, Kenya, 2009, online available at:http://www.unep.org/pdf/BEIJING REPORTCOMPLETE.pdf, last access: March2010.
Wang, B., Shao, M., Lu, S. H., Yuan, B., Zhao, Y., Wang, M.,Zhang, S. Q. and Wu. D.: Variation of ambient non-methane hy-drocarbons in Beijing city in summer 2008, Atmos. Chem. Phys.,10, 5911–5923, doi:10.5194/acp-10-5911-2010, 2010a.
Wang, L. T., Hao, J. M., He, K. B., Wang, S. X., Li, J. H., Zhang, Q.,Streets, D. G., Fu, J. S., Jang, C. J., Takekawa, H., and Chatani,S.: A modeling study of coarse particulate matter pollution inBeijing: Regional source contributions and control implicationsfor the 2008 Summer Olympics, J. Air & Waste Manage. Assoc.,58 (8), 1057-1069, 2008.
Wang, M., Zhu, T., Zheng, J., Zhang, R. Y., Zhang, S. Q., Xie,X. X., Han, Y. Q., and Li, Y.: Use of a mobile laboratory toevaluate changes in on-road air pollutants during the Beijing2008 Summer Olympics, Atmos. Chem. Phys., 9, 8247–8263,doi:10.5194/acp-9-8247-2009, 2009a.
Wang, S. X., Zhao, M., Xing, J., Wu, Y., Zhou, Y., Lei, Y., He, K. B.,Fu, L. X., Hao, J. M.: Quantifying the Air Pollutants EmissionReduction during the 2008 Olympic Games in Beijing, Environ.Sci. Technol., 44(7), 2490–2496, 2010b.
Wang, T., Cheung, V. T. F., Anson, M., and Li, Y. S.: Ozone andrelated gaseous pollutants in the boundary layer of eastern China:Overview of the recent measurements at a rural site, Geophys.Res. Lett., 28(12), 2373–2376, 2001.
Wang, T, Ding, A. J., Gao, J., and Wu, W. S.: Strong ozone produc-tion in urban plumes from Beijing, China, Geophys. Res. Lett.,33, L21806, doi:10.1029/2006GL027689, 2006.
Wang, W. T., Primbs, T., Tao, S., and Simonich, S. L. M.: At-mospheric Particulate Matter Pollution during the 2008 BeijingOlympics, Environ. Sci. Technol., 43(14), 5314–5320, 2009b.
Wang, X., Westerdahl, D., Chen, L.C., Wu, Y., Hao, J. M., Pan,X. C., Guo, X. B., and Zhang, K. M.: Evaluating the air qual-ity impacts of the 2008 Beijing Olympic Games: On-road emis-sion factors and black carbon profiles, Atmos. Environ., 43(30),4535–4543, 2009c.
Wang, Y., Hao, J., McElroy, M. B., Munger, J. W., Ma, H., Chen,D., and Nielsen, C. P.: Ozone air quality during the 2008 BeijingOlympics-effectiveness of emission restrictions, Atmos. Chem.Phys., 9, 5237–5251, doi:10.5194/acp-9-5237-2009, 2009d.
Witte, J. C., Schoeberl, M. R., Douglass, A. R., Gleason, J. F.,Krotkov, N. A., Gille, J. C., Pickering, K. E., and Livesey, N.:Satellite observations of changes in air quality during the 2008Beijing Olympics and Paralympics, Geophys. Res. Lett., 36,L17803, doi:10.1029/2009GL039236, 2009.
Wood, E. C., Herndon, S. C., Onasch, T. B., Kroll, J. H., Cana-
Atmos. Chem. Phys., 10, 7603–7615, 2010 www.atmos-chem-phys.net/10/7603/2010/
T. Wang et al.: Air quality during the 2008 Beijing Olympics 7615
garatna, M. R., Kolb, C. E., Worsnop, D. R., Neuman, J.A., Seila, R., Zavala, M., and Knighton, W. B.: A casestudy of ozone production, nitrogen oxides, and the radicalbudget in Mexico City, Atmos. Chem. Phys., 9, 2499–2517,doi:10.5194/acp-9-2499-2009, 2009.
Wu, W. S. and Wang, T.: On the performance of a semi-continuousPM2.5 sulphate and nitrate instrument under high loadings ofparticulate and sulphur dioxide, Atmos. Environ., 41(26), 5442–5451, 2007.
Zaveri, R. A., Berkowitz, C. M., Kleinman, L. I., Springston, S.R., Doskey, P. V., Lonneman, W. A., and Spicer, C. W.: Ozoneproduction efficiency and NOx depletion in an urban plume: In-terpretation of field observations and implications for evaluatingO3-NOx-VOC sensitivity, J. Geophys. Res.-Atmos., 108(D19),4436, doi:10.1029/2002JD003144, 2003.
Zhang, Q., Streets, D. G., Carmichael, G. R., Huo, H., Kannari, A.,Klimont, Z., Park, I. S., Reddy, S., Fu, J. S., Chen, D., Duan,L., Lei, Y., Wang, I. T., and Yao, Z. L.: Asian emissions in 2006for the NASA INTEX-B mission, Atmos. Chem. Phys., 9 (14),5131–5153, doi:10.5194/acp-9-5131-2009, 2009.
Zhao, Y., Wang, S. X., Duan, L., Lei, Y., Cao, P. F., and Hao, J.M.: Primary air pollutant emissions of coal-fired power plantsin China: Current status and future prediction, Atmos. Environ.,42(36), 8442–8452, 2008.
www.atmos-chem-phys.net/10/7603/2010/ Atmos. Chem. Phys., 10, 7603–7615, 2010