Air-cooled fuel cells: Keys to design and build the ...
20
Air-cooled fuel cells: Keys to design and build the oxidant/cooling system A. De las Heras * , F.J. Vivas, F. Segura, M.J. Redondo, J.M. Andújar Grupo de Investigaci on de Control y Rob otica TEP-192, Departamento de Ingeniería Electr onica, de Sistemas Inform aticos y Autom atica, Escuela T ecnica Superior de Ingeniería, Universidad de Huelva.Carretera Huelva, Palos de la Frontera, 21819, La R abida, Palos de la Frontera, Huelva, Spain article info Article history: Available online 19 February 2018 Keywords: Air cooled polymer electrolyte fuel cell BoP configurations Oxidant/cooling subsystem design Experimental study Performance improvement abstract In the field of energy, hydrogen as an energetic vector is becoming increasingly important. Specifically, fuel cells powered by hydrogen are becoming an alternative in automotive and other fields because of their ability to produce electricity without any pollution. Therefore, at this time there is a very active research field. A fuel cell can be described as a scale down industrial plant that consists of different subsystems whose purpose is to make the stack works properly. Air Cooled Polymer Electrolyte Fuel Cells (AC-PEFC) are receiving special attention due to their potential to integrate the oxidant and cooling subsystems into one, which in term gives the fuel cells their capability to reduce its weight, volume, cost and control complexity. In these fuel cells, the Oxidant/Cooling subsystem is of crucial importance and along with three others (Fuel, Electrical and Control subsystems) make up the Balance of Plant (BoP), which together with the stack comprise the full fuel cell system. The aim of this paper is to present a comprehensive experimental study of an AC-PEFC paying particular attention to the Oxidant/Cooling subsystem configuration. According to the scientific literature, this subsystem has not received the same attention as other subsystems like the Fuel and Control subsystems. However, a suitable design and size is critical for the proper functioning of the stack. The analysis carried out in this paper tries to solve some problems that can appear if the design of the Oxidant/Cooling subsystem has not been optimized. These problems are related to important aspects such as the performance and the efficiency of the whole system and temperature distribution over the stack. © 2018 Elsevier Ltd. All rights reserved. 1. Introduction Polymer Electrolyte Fuel Cells (PEFCs) are a promising technol- ogy to produce electricity from hydrogen for stationary power generation due to its operational strength such as high power density, low operating temperature, low corrosion, quiet operation, stack design simplification, relatively quick start up and shut down and especially by its zero emission capability [1e4]. In the past decades, there has been a huge progress in the PEFC field but re- searchers are still focused on new cell designs, cost reduction and performance improvement. PEFC technology is having more and more importance because it is suitable for a wide range of appli- cations, including portable, stationary and automotive power de- livery [5e8] and lately it is being more used in backup systems for emergency situations (e.g. earthquakes, terrorist attacks). Configuration or hybridization of generation systems around the PEFC can be miscellaneous [6][7 ,9], as well as its control modes [10]. For the configuration of a PEFC system, apart from the stack it is necessary to include additional subsystems for the proper system operation. Generally these systems can be divided into five main groups which form the Balance of Plant (BoP): 1- Oxidant subsys- tem: it supplies air/oxygen at the appropriate conditions for the oxidant reaction, 2-Fuel subsystem: it supplies hydrogen at the appropriate conditions for the reduction reaction, 3-Cooling sub- system: it removes the heat produced in the stack and keeps it at the temperature recommended by the manufacturer and removes the water produced, 4-Electrical subsystem: it connects the stack to electric load, and 5-Control subsystem: it processes information from sensors so as to control the actuators, Fig. 1 [11e 13]. When it comes to develop a PEFC system, researchers conclude that an appropriate design of the BoP is essential to the proper PEFC stack operation and influences on the performance of the whole system. Therefore, according to the BoP design, it is important to * Corresponding author. E-mail address: [email protected] (A. De las Heras). Contents lists available at ScienceDirect Renewable Energy journal homepage: www.elsevier.com/locate/renene https://doi.org/10.1016/j.renene.2018.02.077 0960-1481/© 2018 Elsevier Ltd. All rights reserved. Renewable Energy 125 (2018) 1e20
Transcript of Air-cooled fuel cells: Keys to design and build the ...

lable at ScienceDirect
Renewable Energy 125 (2018) 1e20
Contents lists avai
Renewable Energy
journal homepage: www.elsevier .com/locate/renene
Air-cooled fuel cells: Keys to design and build the oxidant/coolingsystem
A. De las Heras*, F.J. Vivas, F. Segura, M.J. Redondo, J.M. AndújarGrupo de Investigaci�on de Control y Rob�otica TEP-192, Departamento de Ingeniería Electr�onica, de Sistemas Inform�aticos y Autom�atica, Escuela T�ecnicaSuperior de Ingeniería, Universidad de Huelva.Carretera Huelva, Palos de la Frontera, 21819, La R�abida, Palos de la Frontera, Huelva, Spain
a r t i c l e i n f o
Article history:Available online 19 February 2018
Keywords:Air cooled polymer electrolyte fuel cellBoP configurationsOxidant/cooling subsystem designExperimental studyPerformance improvement
* Corresponding author.E-mail address: [email protected]
https://doi.org/10.1016/j.renene.2018.02.0770960-1481/© 2018 Elsevier Ltd. All rights reserved.
a b s t r a c t
In the field of energy, hydrogen as an energetic vector is becoming increasingly important. Specifically,fuel cells powered by hydrogen are becoming an alternative in automotive and other fields because oftheir ability to produce electricity without any pollution. Therefore, at this time there is a very activeresearch field. A fuel cell can be described as a scale down industrial plant that consists of differentsubsystems whose purpose is to make the stack works properly. Air Cooled Polymer Electrolyte Fuel Cells(AC-PEFC) are receiving special attention due to their potential to integrate the oxidant and coolingsubsystems into one, which in term gives the fuel cells their capability to reduce its weight, volume, costand control complexity. In these fuel cells, the Oxidant/Cooling subsystem is of crucial importance andalong with three others (Fuel, Electrical and Control subsystems) make up the Balance of Plant (BoP),which together with the stack comprise the full fuel cell system. The aim of this paper is to present acomprehensive experimental study of an AC-PEFC paying particular attention to the Oxidant/Coolingsubsystem configuration. According to the scientific literature, this subsystem has not received the sameattention as other subsystems like the Fuel and Control subsystems. However, a suitable design and size iscritical for the proper functioning of the stack. The analysis carried out in this paper tries to solve someproblems that can appear if the design of the Oxidant/Cooling subsystem has not been optimized. Theseproblems are related to important aspects such as the performance and the efficiency of the wholesystem and temperature distribution over the stack.
© 2018 Elsevier Ltd. All rights reserved.
1. Introduction
Polymer Electrolyte Fuel Cells (PEFCs) are a promising technol-ogy to produce electricity from hydrogen for stationary powergeneration due to its operational strength such as high powerdensity, low operating temperature, low corrosion, quiet operation,stack design simplification, relatively quick start up and shut downand especially by its zero emission capability [1e4]. In the pastdecades, there has been a huge progress in the PEFC field but re-searchers are still focused on new cell designs, cost reduction andperformance improvement. PEFC technology is having more andmore importance because it is suitable for a wide range of appli-cations, including portable, stationary and automotive power de-livery [5e8] and lately it is being more used in backup systems foremergency situations (e.g. earthquakes, terrorist attacks).
om (A. De las Heras).
Configuration or hybridization of generation systems around thePEFC can be miscellaneous [6] [7,9], as well as its control modes[10].
For the configuration of a PEFC system, apart from the stack it isnecessary to include additional subsystems for the proper systemoperation. Generally these systems can be divided into five maingroups which form the Balance of Plant (BoP): 1- Oxidant subsys-tem: it supplies air/oxygen at the appropriate conditions for theoxidant reaction, 2-Fuel subsystem: it supplies hydrogen at theappropriate conditions for the reduction reaction, 3-Cooling sub-system: it removes the heat produced in the stack and keeps it atthe temperature recommended by the manufacturer and removesthewater produced, 4-Electrical subsystem: it connects the stack toelectric load, and 5-Control subsystem: it processes informationfrom sensors so as to control the actuators, Fig. 1 [11e13].
When it comes to develop a PEFC system, researchers concludethat an appropriate design of the BoP is essential to the proper PEFCstack operation and influences on the performance of the wholesystem. Therefore, according to the BoP design, it is important to

Fue Cell System
Stack
Oxidant/Cooling subsystem
Homogeneous cooling
Enough airflow for power and air
temperatre range
temperature
losses
Reduced size
Fuel subsystem
Electrical subsystem
Control subsystem
Fig. 1. Conceptual scheme of an AC-PEFC system and challenges in the design and manufacture of the oxidant/cooling subsystem.
A. De las Heras et al. / Renewable Energy 125 (2018) 1e202
optimize the main subsystems avoiding an oversized BoP config-uration which usually results in an increase of parasitic losses,system volume, weight and noise level [14].
While the PEFC is operating, the stack temperature changesalong the time and with the load demand. The temperature hasinfluence on electrochemical reaction rate and water and reactanttransport. Low temperatures might produce membrane floodingand because of that, it might appear operating problems due tomembrane resistivity variation. Otherwise, high temperaturesmight produce membrane thermal stress and cathode catalystinactivity, resulting in membrane degradation. In basis on this, wecan deduce that the Cooling subsystem plays an important role forreliable and efficient stack operation, besides the few papers foundin the scientific literature focused in this question [13].
In this work, authors we develop the experimental study usingan Air Cooled Polymer Electrolyte (AC-PE) stack. This kind of stacksintegrates Oxidant and Cooling subsystems into one single avoidingthe liquid parts in the Cooling subsystem. This results in facilitatingand simplifying the BoP integration because they do not need pipes,valves, pumps and heat exchangers, contributing to reduce weight,volume and cost. Apart from this, the stack used in this work doesnot require high inlet hydrogen pressure (it can operate nearambient pressure) and this provides security because it is notnecessary to operate with high hydrogen supply pressures and lessstringent requirements in the hydrogen transfer circuit (connec-tions, pipelines, etc.).
The implementation of the Oxidant/Cooling subsystem iscommonly based on a forced-air convection design with one orseveral fans. This design requires especial consideration of the stackcharacteristic curves and the fan/s. Ideally, the operating pointintersection between the stack and the fan characteristic curves
should be located in the optimal operating region of the fan; and besufficiently far away from any unstable region [15].
Different BoP configurations have been developed in severalworks [13,16e25], and the chosen configuration is justified in basison the required particular conditions by the authors. However,there are not too many works in which different configurations areanalysed, discussing their advantages and disadvantages. Thus, Kimet al. [26] show two types of Oxidant/Cooling subsystems (a gasrecirculation subsystem with and without a recycle blower). Sas-mito et al. [15] present a model in which the results indicate thatsome factors such as fan power and type, single fan or fans in series,stack length, and separate air-coolant channels have a significantimpact on the operating point and the stack performance. Meyeret al. [27] point out that in an cathode AC-PEFC, the air blowerspresent the largest parasitic load having a direct influence on thestack performance and its temperature.
Based on the bibliography consulted to establish the state of theart of this paper and in our own experience of more than 10 yearsdealing with PEFCs, we can set six challenges in the design andmanufacture of the oxidant/cooling subsystem (Fig.1): 1) To be ableto cool the stack homogeneously, 2) To provide sufficient airflowrange to control the PEFC temperature, under a range of power androom/coolant air temperature, 3) To place the stack at optimumtemperature, 4) To reduce the auxiliary power consumption, 5) Todo all this within a certain sized box, and finally but not leastimportant 6) To do it cost effectively.
In this paper, authors try to expand the current experimentalstudies published in the scientific literature, and they present adetailed experimental analysis of three different configurations forthe Oxidant/Cooling subsystem in an AC-PEFC.
Our study departs from one configuration based on the own

Table 1Stack experimental parameters.
Variable Definition Range
Vcell (V) Cell Voltage 0.647e1.005IS (A) Stack Current 0e75Topt (ºC) Optimal Operating Temperature 26.01e65.76TS (ºC) Stack Temperature 6e75Tin (ºC) Inlet Air Temperature 10e40Qstack (slpm) Stack Required Air flow 0e18656.63Qcell (slpm) Cell Required Air Flow 0e237.20qcell (W) Heat Produced by Cell 0e45.56E (V) Max. Cell Voltage product water vapor 1.2545
A. De las Heras et al. / Renewable Energy 125 (2018) 1e20 3
stack’s manufacturer proposal. From here, we raise two new con-figurations to enhance the initial, including different ways of con-trolling the fan/s contained within the configurations. As it hasbeen reported in previous works [27], the operating performance ofthis class of PEFCs is conditioned by the coolant air-flow rate,because both the air flow and the room air temperature determinethe operating temperature of a given air-cooled fuel cell, at a certainpower output. Then the study developed in this paper allow us toanalysis what configuration guarantees a better system perfor-mance, attending to those six challenges presented in Fig. 1, at timethat the stack achieves the highest power working inside itsoperating temperature range and air stoichiometric rate. Moreover,this experimental study will show us what configuration requires alowest number of devices or the most complex control system.Additionally, once the best configuration has been identified, it hasbeen checked at different room temperatures to prove it guaranteesthe oxidant/cooling requirements by the stack.
The structure of the paper is as follow: Section 2 exposes themain features of the test bench developed by authors and usedduring all the experimental tests. Section 3 presents the proposedOxidant/Cooling subsystem designs, pointing out the particularitiesof each one. Next, experimental results obtained from eachconfiguration as well as some discussions about them are sum-marised in Section IV and V respectively. Finally, Section 6 drawsthe main conclusions derived from the experimental study.
l Inlet Air Flow/Consumed Air Flow 20e200C (slpm) slpm/A*cell Air Cell Consumption 0.0167ncell Number of cells 80RH/% Relative Humidity 5e100PH2 (kPa) Inlet Hydrogen Pressure 116e156
2. Materials and methods
The test bench for this study (an AC-PEFC system) has been
a) Test bench diagram. b
SCADA LAN -
INTERNET
Fig. 2. Diagram and real implementatio
design and built around an air-cooled FCgen-1200ACS stack modelfrom Ballard®, Fig. 2. Additionally, Table 1 summarizes the stackexperimental parameters.
The used stack does not need external air humidification and ithas a dead-end operation mode; it is used with dry hydrogenwithout humidification as well. The inlet hydrogen pressure can bevaried from 1.16 to 1.56 bars. The stack is made up by 80 cells and itcan reach up to 3.4 kW, according to manufacturer’s data [28,29].This stack has been integrated with a BoP configuration developedby authors according to [16]; the instrumentation specificationscan be accessed in Table 2. The system shown in Fig. 2 presents ahandy test bench to carry out all kinds of tests on a medium power
) Up and c) Down. Oxidant/Cooling subsystem configurations.
Fan 2b
BoP
SCADA
Electronic Load
stack
Fan
Cone-shaped hopper
StackFan 1a
Electronic Load
OscilloscopeSCADA
PolycarbonateEnclosure
Fan 1b
Fan 2a
Fan 2b
n of the test bench for AC-PEFCs.

Table 2Instrumentation specifications.
Component Manufacturer-Model Quantity
Fuel cell stack Ballard-FCS1020ACS 1Oxidant/Cooling
SubsystemFan Embpast-6224TD (Configuration 1 and 2) 4
Embpast-6224TDA (Configuration 3) 1Inlet air temperature
sensorBurkert-8400 Accuracy± 1.5% 1
Fuel cell temperaturesensor
Maruta P/N NCP15WF104F03RCAccuracy± 1%
Includedin stack
Oxigen sensor Figaro-KE50, Accuracy± 1% 1Fuel SubsystemValve supply Burkert-6013 1Purge valve Burkert-6606 1Pressure sensor Burkert-8314, Accuracy± 0.3% 1Hydrogen sensor Figaro-FCM6812, Accuracy± 0.2% 1Electrical SubsystemCurrent sensor LEM LA 55-P, Accuracy± 0.9% 1Stack voltage sensor LEM-LV 25-P, Accuracy ± 0.8%Bloking diode Vishay-T85HFL 1Relay Panasonic-AEV18012 1Control systemMicroprocessor Arduino ATMega256 1Battery Exide-GF 12 094 Y 1
A. De las Heras et al. / Renewable Energy 125 (2018) 1e204
real AC-PEFCs [16].Paying special attention to the Oxidant/Cooling subsystem (blue
line in Fig. 2a), it includes an adjustable flow fan, an inlet air tem-perature sensor (Tin), and a stack temperature sensor (Ts) built-inthe own stack. The manufacturer only includes a stack tempera-ture sensor in the own stack and thermographies of the stack arenot facilitated in the manuals. The air stoichiometric coefficient (l)must be adjusted by the control unit to optimize the system per-formance. Additionally, a concentration oxygen sensor (CO2) isincluded to prevent low concentrations of oxygen in the sur-rounding atmosphere, and a relative humidity sensor (RH) to avoidoperating under overly dry room conditions.
Following Fig. 2a, at the fuel input, the Fuel subsystem (red line)is composed by the hydrogen storage bottle, and a manual pressureregulator to reduce the high pressure from the bottle up to thepressure range recommended by the manufacturer’s data. Inaddition it is available a mass flow meter to measure the hydrogenconsumption, a supply valve to control the hydrogen entry and ahydrogenpressure sensor (PH2) to measure the inlet anode pressureforming the hydrogen input line. In the hydrogen outlet, althoughthe used stack for tests is designed for dead-ended operation, thatis all the fuel enters the anode is used up (fuel stoichiometry: 1), inpractice water vapor, nitrogen and other inert gases can becollected in the anode, so this side must be purged periodically. Forthis reason, a purge valve avoids the accumulation of inert gases fora proper operation of the system and to prevent unsafe roomconditions. Finally, a concentration hydrogen sensor (CH2) has beenincluded.
The Electrical subsystem (black line in Fig. 2a) comprises a stackcurrent sensor (Is), stack voltage sensor (Vs) and a cells voltagemeasurement system (Vc). Additionally, a relay is added to isolatethe fuel cell system from the electronic load and a blocking diode toavoid reversal currents.
In addition to the above elements and in order to make all testbench subsystems works properly, with the aim to get the bestperformance of the stack, a control unit has been developed. Ittakes care of receiving all the information from sensors and decideswhat to do every moment: to open the supply valve, to open thepurge valve, to run the fan, to connect or disconnect the electricalload, and so on.
On the other hand, it is necessary to note that the system doesnot produce electricity instantaneously, even more during thestart-up the stack can’t provide electrical power but the BoP needsto be supply. Therefore, an auxiliary source needed to guarantee theelectrical supply to BoP. This is the role of the battery shown inFig. 2a, where the battery voltage sensor VB warns of its state.
At this point, it is very important to mention that the manage-ment of the test bench requires a complex control system. To thisend, a supervisory control and data acquisition (SCADA) has beendeveloped. Its function is to carry out the high-level supervisorymanagement of the test bench. It is hosted in a PC and it is providedwith a data network connection for remote management, as well asgraphical user interfaces. It can also manage others peripheral de-vices (PIDs, sensors, actuators and so on) by the control unit (seeFig. 2a). This means that, by the SCADA, we can have absolutecontrol of the test bench as well as process all its information.
Fig. 2b and c represent the real configurations of the test benchwhere this experimental study will be carried out. These configu-rations are the result of a design analysis which will be discussedbelow.
Finally, to conclude this section, we must mention that thethermographies shown in this paper has been made with a TESTO®
875-1i camera, with a matrix of 120 � 160 sensors and a thermalresolution (NETD) < 50 mK. Temperature range:�30 �C toþ100 �C.
3. Oxidant/cooling subsystem designs
Now, after the explanation in the previous section of the fea-tures of the test bench (AC-PEFC system), different Oxidant/Coolingsubsystem architectures will be designed and built. Taking intoaccount the manufacturer’s recommendation, uniform flow rate isachieved by using fans to pull air through the stack instead ofmounting fans at the air inlet and blowing air through the stack.This allows the negative pressure zone created at the air outlet willact to distribute airflow evenly through the stack, eluding theflooding phenomena [29]. With this way of working of the fans, it isassumed that the phenomenon of flooding will not appear, becausethe supplied air is sufficient to avoid it. The configuration of eachone are the following:
- Configuration 1: Four fans covering the cathode area of the stackworking two by two without flow control.
- Configuration 2: Four fans covering the cathode area of the stackworking two by two with flow control.
- Configuration 3: One single speed controlled fan.
For configurations 1 and 2, with 4 fans (Fig. 2b), authors haveproposed their designs in basis on stack’s manufacturer recom-mendations [28,29]. Manufacturer advices to use one single fan forstack sizes of 45 cells or less (Fig. 3a), and two fans in other case(remember that the stack under study has 80 cells). For stack sizeshigher than 45 cells the diagram for the fans stand proposed bymanufacturer is shown in Fig. 3b, standard configuration, [29].Then according to these recommended designs, authors haveminimally changed it with the aim to improve the Oxidant/Coolingsubsystem that is the stack air-breathing system. Putting four fansinstead of two, a higher coverage of the stack cathode is guaranteedso the air can arrive at the cells located both at the top and bottom,and at the ends rightmost and leftmost of each cell. This can be seenin Fig. 2b and it has been built over a polycarbonate rectangular-shaped enclosure. The fans selection has been done in basis onthe air stoichiometric requirements of the stack [15,16] and theycorrespond to fan model EbmPapst® DV6224TD. This enclosure hasbeen used to stand the four fans that integrate the Oxidant/Coolingsubsystem.

A. De las Heras et al. / Renewable Energy 125 (2018) 1e20 5
Regarding configuration 3with only a fan, the aim of the authorshas been to improve the air breathing of the stack and its tem-perature distribution over the cathode. This third configurationtries to sort out the problem observed in configurations 1 and 2: theair follow preferential paths surrounding the stack instead ofcrossing it for its cooling.
To carry out the configuration 3, a cone-shaped hopper has beendesigned and built. This additional tool allows to canalise the airflow in the best homogeneous way as possible (Fig. 2c), forcing theair to blow through the stack instead of surrounding it. Addition-ally, it has been put properly around the stack without leaving anyspace between the stack and the hopper avoiding preferential pathsof the air flow.
The homogeneous flow is got minimizing the turbulence whichwill occur in the exit of the flow adapter. To select the high of thehopper (distance between the stack and the fan), authors havecompared three possible distances: 20 cm, 25 cm and 30 cm.Experimental results obtained from the three cases are practicallythe same.
The fan selection has been done in basis on the air stoichio-metric requirements of the stack [15,16], and it consists on theadjustable flow fan model EbmPapst® DV6224TDA. The chosen fanis capable of withstanding the maximum pressure drop and sup-plying the maximum air flow required by system [30].
In summary, regarding to the first two configurations, the thirdpresents two changes to try to enhance the Oxidant/Cooling sub-system. The first change is it uses one single fan instead of four,simplifying the design, minimizing the BoP cost and weight andreducing the auxiliary power consumption and the controlcomplexity. The second change is to use a flow adapter (cone-shaped hopper) instead of a rectangular-shaped enclosure avoidingpreferential paths.
Figs. 4e6 represent in schematic form the mode of operation foreach of the configurations. In Fig. 4 (configuration 1) the four fansare divided into two groups (GROUP 1-fans in blue line and GROUP2-fans in orange line). The first group of fans is always workingwhen the fuel cell system is operating and the second group of fansstarts to work in case of the stack temperature is higher than theoptimal temperature value. The optimal temperature value de-pends on the operating point in which the stack is operating andaccording to manufacturer data [28,29].
Fan
Stack temperature
sensor
Fig. 3. a. Fan enclosure proposed by manufacturer for stack sizes equal or lower than 45 cellsizes higher than 45 cells (standard configuration).
Fig. 5 represents the second configuration, which is similar tothe first one (the actual assembly is again Fig. 2b) but in this case,both groups of fans will be controlled in basis on the differencebetween the real stack temperature value and the optimal stacktemperature value recommended by the manufacturer.
Finally, Fig. 6 represents the last configuration with a flowadapter (cone-shaped hopper) and a speed adjustable fan.
4. Experimental results
The different configurations designed have been implementedon the test bench, as shown in Fig. 2. Once the test bench is set upfor each configuration, its SCADA governs, by the control unit, allthe Oxidant/Cooling subsystem operation (and in general all thefuel cell subsystems and their operations) in each configuration.From it, you can set setpoints; capture, process and show all data, indifferent ways and in different formats. In the following, we willdiscuss the results obtained for each Oxidant/Cooling subsystemconfiguration.
s (standard configuration) Fig. 3b. Fan stand design proposed by manufacturer for stack
Fig. 4. Configuration 1: Four fans working two by two without flow control.

Fig. 5. Configuration 2: Four fans working two by two with flow control.
Fig. 6. Configuration 3: One single speed controlled fan inside a cone-shaped hopper.
Fig. 7. Flow chart of configuration 1: Four fans working two by two without flowcontrol.
A. De las Heras et al. / Renewable Energy 125 (2018) 1e206
a) Configuration 1: Four fans covering the cathode area of the stackworking two by two without flow control.
For this configuration, the test bench is set up as in Fig. 2b. Fig. 8shows the flow chart of the operation with this configuration. Theexperimental analysis starts comparing the real stack temperaturewith the optimal and robust stack temperature recommended bythe manufacturer, expression (1) and (2) respectively, [29].
Topt ¼ 0:46 Istack þ 33:63 (1)
Trob ¼ 0:53 Istack þ 26:01 (2)where,
Topt : Optimal stack temperature (ºC) recommended by manu-facturer for legacy operating conditions (air inlet temperaturefrom 10 �C to 40 �C).Trob: Optimal stack temperature (ºC) recommended by manu-facturer for robust operation over wide air inlet temperaturerange (�20 �Ce52 �C). Keeping the stack near this operatingtemperature, the stack performance and cell stability areachieved.
The aim to compare the real stack temperaturewith optimal androbust temperature provided by themanufacturer, it is to show thatoxidant configurations proposed in this work satisfies Trob< Treal <
Topt even when initial room temperature is below stack tempera-ture (it is also called cold start).
Then, according to the control logic shown in Fig. 7, the firstgroup of fans is always working, and if the stack temperature ishigher than the optimal stack temperature at the actual stack cur-rent value, the second groups of fans starts to work as well. How-ever if the stack temperature is lower than optimal temperatureand also lower than the robust temperature, the control unit doesnot put inwork the second group of fans, keeping in operation onlythe first one. This situation corresponds with the case where thestack temperature is near the recommended values and the stackoperates under acceptable operating conditions. In this case, thefirst group of fans is kept in operation because they are needed tosupply the airflow required by the electrochemical reaction in thestack. In this configurations, fans operating mode is ON/OFF. Thismeans that all the fans will be working at the maximum acceptedvalue, without any control over the fan speed. As an advantage ofthis configuration, we can highlight its simplicity, but it cannot offerthe possibility to adjust the air stoichiometry rate.
Next, we are going to analyse the fuel cell response attending tostack temperature, hydrogen pressure, voltage, current and powersupplied by the fuel cell. To do this the AC-PEFC has been subjectedto a multi steps load profile (10 Ae30 A e 50 A).
Comparing the stack temperature with the optimal and robust

0 200 400 600 8000.2
0.3
0.4
TIME (s) // (Fig. a)
SA
MP
LET
IME
(s)
0 200 400 600 8000
50
100
TIME (s) // (Fig. b)
ST
AC
KT
EM
PE
RA
TU
RE
(ºC
)
T (ºC)Topt (ºC)Trob (ºC)
0 200 400 600 8000.5
1
1.5
TIME (s) // (Fig. c)
HY
DR
OG
EN
PR
ES
SU
RE
(bar
)
0 200 400 600 8000
20
40
60
TIME (s) // (Fig. d)
ST
AC
KC
UR
RE
NT
(A)
0 200 400 600 8000
50
100
TIME (s) // (Fig. e)
ST
AC
KV
OLT
AG
E(V
)
0 200 400 600 8000
1000
2000
TIME (s) // (Fig. f)S
TA
CK
PO
WE
R(W
)
Fig. 8. AC-PEFC response for Configuration 1. From left to right and from top to bottom: (a)-Sample Time (s), (b)-Stack Temperature (ºC), (c)-Hydrogen Pressure (bar), (d)-StackCurrent (A), (e)-Stack Voltage (V) and (f)-Stack Power (W).
A. De las Heras et al. / Renewable Energy 125 (2018) 1e20 7
temperature recommended by the manufacturer (Fig. 8b), we candeduce that during the first load steps, the stack temperature keepsbetween the established margins of robust and optimal tempera-ture, recommended by manufacturer. However, the time intervalthat the stack temperature is between the robust and optimaltemperature is decreasing when the load current is increasing.
Another test done over the developed AC-PEFC with theconfiguration 1 is a thermography analysis with a thermal imagermodel Testo 875-1i, with a range of �30 �C to þ100 �C and ±2%accuracy). This analysis allows us to evaluate if the configurationunder study is suitable or no as optimal Oxidant/Cooling subsys-tem. For this purpose, a thermography has been taken at thebeginning of each load step. Authors have chosen the thermog-raphy as an alternative to use multiple thermocouples placed in thecooling channels by simplicity in the temperature diagnosis. In caseof an air-cooled fuel cell as this, the cathode is designed withmultiple channels for cooling, so this would lead to an extra-wiredstructure with one thermocouple located in each cooling channel.Additionally, thermocouples need to be in contact with the surface,but this is not easy in an 80-cells stack with 40 cooling channelseach cell. Fig. 9a, b and 9c and Tables 3a, b and c show a no uniformtemperature distribution.
At the beginning of the operating time interval (Fig. 9a) the stacktemperature distribution is considerably no homogenous with adifference of 6.6 �C (Table 3a: M1 regarding M7) between thehottest and the coldest point. However, as the load current in-creases the difference of temperature between the hottest and thecoldest point is more significant achieving at 13.8 �C (Table 3c: M4regarding M10).
When the load current is 10 A (Table 3a), the higher temperaturevalues can be found, in this order, inM1,M4, M2 andM5. In the caseof 30 A (Table 3b), in M4, M5 and M1. Finally, for 50 A, in M4, M5,M1 and M2 (Table 3c). Notice that the hottest spots locations forconfiguration 1 are always on the upper left corner of the stack.
b)Configuration 2: Four fans covering the cathode area of thestack working two by two with flow control.
This second configuration aims to improve the AC-PEFC per-formance allowing to control the four fans. This will be donevarying the fans speed taking into account the difference betweenthe stack temperature and the optimal and robust temperaturerecommended by the manufacturer. For this configuration, the testbench is set up as in Fig. 2b.
Fig. 10 shows the flow chart of the operation with configuration2. This is delimited by three stages. The experimental analysis startscalculating the difference between the stack temperature value andthe optimal temperature at the operating point. Additionally, thevariable called LIMIT presents the maximum value allowed for thedifference between the stack temperature and the optimal tem-perature. In this case authors have established that LIMIT¼ 3. Thisvalue corresponds approximately to the difference.
ðTopt� TrobÞ=2, when Istack¼ 0. Then, in basis on the compar-ison between this temperatures difference and the allowablelimit, the control systemdecides to activate one or two groups offans and the speed they must rotate. The action carried out ateach state is described as follow:
- State 0: the stack temperature value is well below the optimaltemperature taking into account the established limit. There-fore, in this stage the stack needs to be warmed so fans will beswitched off to avoid cooling the stack. The stack takes the airfor breathing from the surrounding.
- State 1: the temperatures difference is inside the range of±LIMIT. This means that the stack temperature is found betweenthe accepted ranges recommended by the manufacturer.Therefore, it is necessary to keep the stack temperature insidethis range. Therefore, GROUP 1 is put in working. The fan speedwill be adjusted according to the expressions (3) and (4).

Fig. 9. a. Configuration 1: Thermography at 10 A. Fig. 9b. Configuration 1: Thermography at 30 A. Fig. 9c. Configuration 1: Thermography at 50 A.
Table 3aStack temperature points (Config. 1e10 A).
Point Temp. (ºC) Emis Ref. Temp. (ºC)
M1 36.2± 2 0.94 25.0M2 34.5± 2 0.94 25.0M3 31.8± 2 0.94 25.0M4 35.7± 2 0.94 25.0M5 34.5± 2 0.94 25.0M6 30.9± 2 0.94 25.0M7 29.6± 2 0.94 25.0M8 30.4± 2 0.94 25.0M9 34.0± 2 0.94 25.0M10 33.9± 2 0.94 25.0M11 31.6± 2 0.94 25.0
Table 3bStack temperature points (Config. 1e30 A).
Point Temp. (ºC) Emis Ref. Temp. (ºC)
M1 33.0± 2 0.94 25.0M2 31.5± 2 0.94 25.0M3 31.7± 2 0.94 25.0M4 35.2± 2 0.94 25.0M5 34.8± 2 0.94 25.0M6 29.1± 2 0.94 25.0M7 30.3± 2 0.94 25.0M8 27.8± 2 0.94 25.0M9 30.7± 2 0.94 25.0M10 29.6± 2 0.94 25.0M11 27.8± 2 0.94 25.0
A. De las Heras et al. / Renewable Energy 125 (2018) 1e208
DIF ¼ ðDIF � 2 :LIMITÞK1 (3)
FanSpeedð%Þ ¼ 100DIF
2 :LIMITþ 50 (4)
- State 2: the temperatures difference is far above the definedLIMIT. This means than the stack temperature is higher than theoptimal temperature taking into account the LIMIT. Therefore,both fans groups (GROUP 1 and GROUP 2) must to be activated.
In this state, the fan speed will be adjusted according to theexpressions (5) and (6).
DIF ¼ DIF : K2 (5)
FanSpeedð%Þ ¼ 100DIF
2 : LIMITþ 50 (6)
where K1¼1 and K2¼ 2, are variables related to how much theerror should be increased and therefore how quickly we expect thecontrol acts. Authors in basis on system response have chosen theseconstant values.
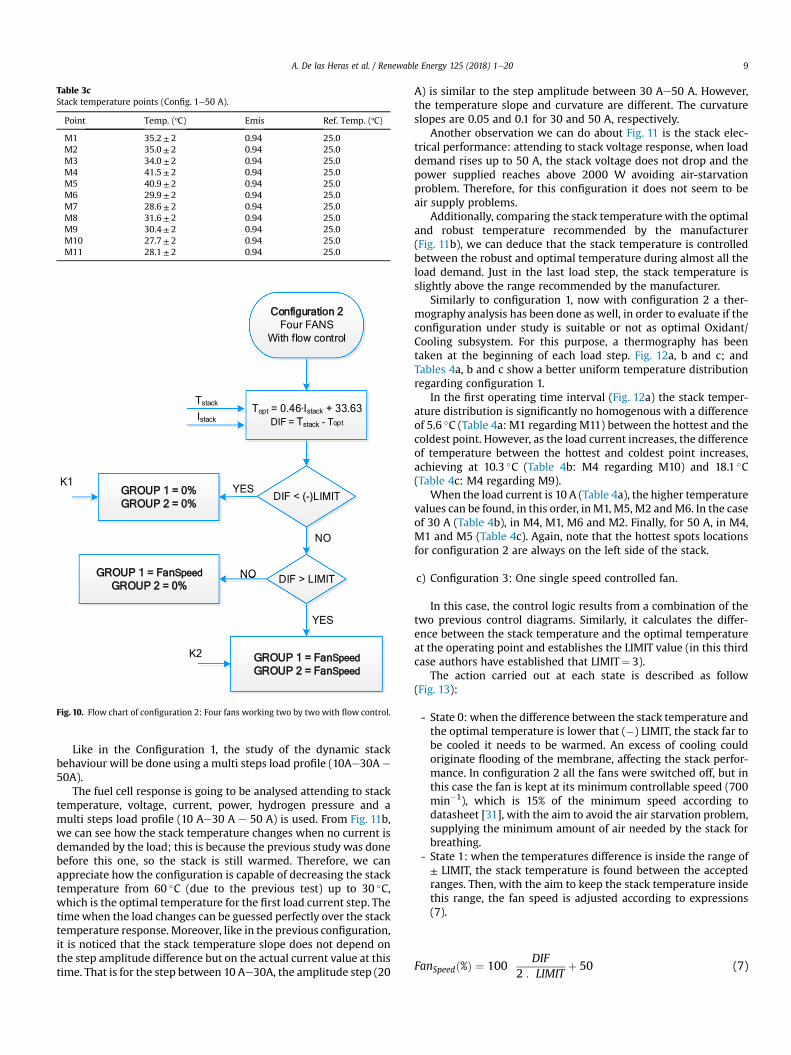
Table 3cStack temperature points (Config. 1e50 A).
Point Temp. (ºC) Emis Ref. Temp. (ºC)
M1 35.2± 2 0.94 25.0M2 35.0± 2 0.94 25.0M3 34.0± 2 0.94 25.0M4 41.5± 2 0.94 25.0M5 40.9± 2 0.94 25.0M6 29.9± 2 0.94 25.0M7 28.6± 2 0.94 25.0M8 31.6± 2 0.94 25.0M9 30.4± 2 0.94 25.0M10 27.7± 2 0.94 25.0M11 28.1± 2 0.94 25.0
Fig. 10. Flow chart of configuration 2: Four fans working two by two with flow control.
A. De las Heras et al. / Renewable Energy 125 (2018) 1e20 9
Like in the Configuration 1, the study of the dynamic stackbehaviour will be done using a multi steps load profile (10Ae30A e
50A).The fuel cell response is going to be analysed attending to stack
temperature, voltage, current, power, hydrogen pressure and amulti steps load profile (10 Ae30 A e 50 A) is used. From Fig. 11b,we can see how the stack temperature changes when no current isdemanded by the load; this is because the previous study was donebefore this one, so the stack is still warmed. Therefore, we canappreciate how the configuration is capable of decreasing the stacktemperature from 60 �C (due to the previous test) up to 30 �C,which is the optimal temperature for the first load current step. Thetimewhen the load changes can be guessed perfectly over the stacktemperature response. Moreover, like in the previous configuration,it is noticed that the stack temperature slope does not depend onthe step amplitude difference but on the actual current value at thistime. That is for the step between 10 Ae30A, the amplitude step (20
A) is similar to the step amplitude between 30 Ae50 A. However,the temperature slope and curvature are different. The curvatureslopes are 0.05 and 0.1 for 30 and 50 A, respectively.
Another observation we can do about Fig. 11 is the stack elec-trical performance: attending to stack voltage response, when loaddemand rises up to 50 A, the stack voltage does not drop and thepower supplied reaches above 2000 W avoiding air-starvationproblem. Therefore, for this configuration it does not seem to beair supply problems.
Additionally, comparing the stack temperature with the optimaland robust temperature recommended by the manufacturer(Fig. 11b), we can deduce that the stack temperature is controlledbetween the robust and optimal temperature during almost all theload demand. Just in the last load step, the stack temperature isslightly above the range recommended by the manufacturer.
Similarly to configuration 1, now with configuration 2 a ther-mography analysis has been done as well, in order to evaluate if theconfiguration under study is suitable or not as optimal Oxidant/Cooling subsystem. For this purpose, a thermography has beentaken at the beginning of each load step. Fig. 12a, b and c; andTables 4a, b and c show a better uniform temperature distributionregarding configuration 1.
In the first operating time interval (Fig. 12a) the stack temper-ature distribution is significantly no homogenous with a differenceof 5.6 �C (Table 4a: M1 regarding M11) between the hottest and thecoldest point. However, as the load current increases, the differenceof temperature between the hottest and coldest point increases,achieving at 10.3 �C (Table 4b: M4 regarding M10) and 18.1 �C(Table 4c: M4 regarding M9).
When the load current is 10 A (Table 4a), the higher temperaturevalues can be found, in this order, inM1,M5, M2 andM6. In the caseof 30 A (Table 4b), in M4, M1, M6 and M2. Finally, for 50 A, in M4,M1 and M5 (Table 4c). Again, note that the hottest spots locationsfor configuration 2 are always on the left side of the stack.
c) Configuration 3: One single speed controlled fan.
In this case, the control logic results from a combination of thetwo previous control diagrams. Similarly, it calculates the differ-ence between the stack temperature and the optimal temperatureat the operating point and establishes the LIMIT value (in this thirdcase authors have established that LIMIT¼ 3).
The action carried out at each state is described as follow(Fig. 13):
- State 0: when the difference between the stack temperature andthe optimal temperature is lower that (�) LIMIT, the stack far tobe cooled it needs to be warmed. An excess of cooling couldoriginate flooding of the membrane, affecting the stack perfor-mance. In configuration 2 all the fans were switched off, but inthis case the fan is kept at its minimum controllable speed (700min�1), which is 15% of the minimum speed according todatasheet [31], with the aim to avoid the air starvation problem,supplying the minimum amount of air needed by the stack forbreathing.
- State 1: when the temperatures difference is inside the range of± LIMIT, the stack temperature is found between the acceptedranges. Then, with the aim to keep the stack temperature insidethis range, the fan speed is adjusted according to expressions(7).
FanSpeedð%Þ ¼ 100DIF
2 : LIMITþ 50 (7)

0 200 400 600 800 10000.2
0.3
0.4
0.5
TIME (s) // (Fig. a)
SA
MP
LET
IME
(s)
0 500 10000
50
100
TIME (s) // (Fig. b)
ST
AC
KT
EM
PE
RA
TU
RE
(ºC
)
T (ºC)Topt (ºC)Trob (ºC)
0 200 400 600 800 10000
0.5
1
1.5
Time (s) // (Fig. c)
HY
DR
OG
EN
PR
ES
SU
RE
(bar
)
0 200 400 600 800 10000
20
40
60
TIME (s) // (Fig. d)
ST
AC
KC
UR
RE
NT
(A)
0 200 400 600 800 10000
50
100
TIME (s) // (Fig. e)
ST
AC
KV
OLT
AG
E(V
)
0 200 400 600 800 10000
1000
2000
3000
TIME (s) // (Fig. f)
ST
AC
KP
OW
ER
(W)
Different SlopesPrevious Test
P = 2010 W
P = 600 W
P = 1560 W
Fig. 11. AC-PEFC for Configuration 2. From left to right and from top to bottom: (a)-Sample Time (s), (a)-Stack Temperature (ºC), (c)-Hydrogen Pressure (bar), (d)-Stack Current (A),(e)-Stack Voltage (V) and (f)-Stack Power (W).
Fig. 12. a. Configuration 2: Thermography at 10 A. Fig. 12b. Configuration 2: Thermography at 30 A. Fig. 12c. Configuration 2: Thermography at 50 A.
A. De las Heras et al. / Renewable Energy 125 (2018) 1e2010

Table 4aStack temperature points (Config. 2e10 A).
Point Temp. (ºC) Emis Ref. Temp. (ºC)
M1 33.6± 2 0.94 26.5M2 32.3± 2 0.94 26.5M3 30.3± 2 0.94 26.5M4 29.4± 2 0.94 26.5M5 33.2± 2 0.94 26.5M6 32.3± 2 0.94 26.5M7 28.3± 2 0.94 26.5M8 28.3± 2 0.94 26.5M9 29.7± 2 0.94 26.5M10 28.3± 2 0.94 26.5M11 28.0± 2 0.94 26.5
Table 4bStack temperature points (Config. 2e30 A).
Point Temp. (ºC) Emis Ref. Temp. (ºC)
M1 38.3± 2 0.94 26.5M2 34.7± 2 0.94 26.5M3 33.0± 2 0.94 26.5M4 40.2± 2 0.94 26.5M5 33.7± 2 0.94 26.5M6 34.8± 2 0.94 26.5M7 32.0± 2 0.94 26.5M8 33.2± 2 0.94 26.5M9 30.9± 2 0.94 26.5M10 29.9± 2 0.94 26.5
Table 4cStack temperature points (Config. 2e50 A).
Point Temp. (ºC) Emis Ref. Temp. (ºC)
M1 39.8± 2 0.94 26.5M2 36.4± 2 0.94 26.5M3 34.1± 2 0.94 26.5M4 49.2± 2 0.94 26.5M5 37.5± 2 0.94 26.5M6 36.6± 2 0.94 26.5M7 36.2± 2 0.94 26.5M8 34.4± 2 0.94 26.5M9 31.1± 2 0.94 26.5
Fig. 13. Flow chart of configuration 3: One single speed controlled fan.
A. De las Heras et al. / Renewable Energy 125 (2018) 1e20 11
- Stage 2: finally, when the temperatures difference is far abovethe defined LIMIT, the fan must rotate at its maximum speed(5500 min�1) to guarantee both the air breathing of the stackand the temperature control.
Additionally to the previous control stages, it is necessary topoint out that the control strategy has to be also based in thefollowing: in case of stack model used in this work, the stoichio-metric rate of the stack recommended by manufacturer varies be-tween 50 and 200. Due to this range is excessively wide, it canhappen that working inside the stoichiometric range, the stackperformance was long from the optimal. Based on this, authorspropose the control diagram for configuration 3 with the aim toaccomplish with the restrictions related to stoichiometric range attime that it pursues to maintain the stack temperature between therecommended values. This condition of stack temperature is morerestrictive than the air stoichiometry criterion. In this case, thedifference between the optimal and robust temperature is nothigher than 7 �C, so the oxidant/cooling subsystem must becontrolled with the aim to guarantee this narrow operating tem-perature margin.
The experimental results obtained for this configuration areshown in Fig. 14. Like in the previous configurations, the study of
the dynamic stack behaviour will be done using a multi steps loadprofile (10Ae30Ae 50A). From Fig. 14, we can point out how thestack temperature remains stabilized when the load demands nocurrent; this is because the stack is cold. The time when the loadchanges can be guessed perfectly over the stack temperatureresponse. Moreover, for all load currents, it can be pointed out thatthe stack temperature is between the recommend range (optimaland robust temperature values) and it keeps stabilized in the sameway that for 0 A. Unlike to previous configurations, where the stacktemperature slope did not depend on the step amplitude differencebut on the actual current value, now the temperature slope andcurvature are identical at the step between 10 Ae30A (amplitudestep of 20 A) and at the step between 30 Ae50 A.
Another observation we can appreciate over Fig. 14 is the stackelectrical performance: attending to stack power response, whenload demand rises up to 50 A, the stack power does not dropabruptly like it happened in configuration 1 (remember Fig. 8), butit achieves more than 2500W.
Regarding the thermography analysis that has been done toevaluate if the configuration under study is suitable or not asoptimal Oxidant/Cooling subsystem, in this case like in the previousones, a thermography has been taken at the beginning of each loadstep. Fig. 15a, b and c, and Tables 5a, b and c, show uniform tem-perature distribution. In the first operating time interval(Figure 15a) the stack temperature distribution is practically ho-mogenous with a difference of 0.8 �C (Table 5a: M5 regarding M6)between the hottest and the coldest point. As the load current in-creases, the difference of temperature between the hottest and thecoldest point increases slightly, achieving at 1.1 �C (Table 5b: M5regarding M3) and 1.4 �C (Table 5c: M5 regarding M3).
Regarding the results obtained up to now, we can have somerelevant data to foresee what configuration fulfils the six re-quirements that the oxidant/cooling systemmust guarantee. Just asa reminder, they were (Fig. 1): 1) To be able to cool the stack

Fig. 14. AC-PEFC for Configuration 3. From left to right and from top to bottom: (a)-Sample Time (s), (b)-Stack Temperature (ºC), (c)-Hydrogen Pressure (bar), (d)-Stack Current (A),(e)-Stack Voltage (V) and (f)-Stack Power (W).
A. De las Heras et al. / Renewable Energy 125 (2018) 1e2012
homogeneously, 2) To provide sufficient airflow range to controlthe PEFC temperature under a range of power and room/coolant airtemperature, 3) To place the stack at optimum temperature, 4) Toreduce the auxiliary power consumption, 5) To do all this within acertain sized box, and finally but not least 6) To do it cost effectively.
Fig. 15. a. Configuration 3: Thermography at 10 A. Fig. 15b. Configuration 3:
Based on the tests performed, it is clear that the only configu-ration able to meet the requirements is the configuration 3. How-ever, we still have to prove that it provides sufficient airflow rangeto control the PEFC temperature, under a range of power and room/coolant air temperature. The previous test has been carried out
Thermography at 30 A. Fig. 15c. Configuration 3: Thermography at 50 A.

Table 5aStack temperature points (Config. 3e10 A).
Point Temp. (ºC) Emis Ref. Temp. (ºC)
M1 30.2± 2 0.94 23M2 30.5± 2 0.94 23M3 30.1± 2 0.94 23M4 30.6± 2 0.94 23M5 30.8± 2 0.94 23M6 30.0± 2 0.94 23M7 30.7± 2 0.94 23M8 30.2± 2 0.94 23
Table 5bStack temperature points (Config. 3e30 A).
Point Temp. (ºC) Emis Ref. Temp. (ºC)
M1 35.9± 2 0.94 23M2 36.5± 2 0.94 23M3 35.7± 2 0.94 23M4 36.6± 2 0.94 23M5 36.8± 2 0.94 23M6 36.0± 2 0.94 23M7 36.7± 2 0.94 23M8 36.3± 2 0.94 23
Table 5cStack temperature points (Config. 3e50 A).
Point Temp. (ºC) Emis Ref. Temp. (ºC)
M1 42.2± 2 0.94 23M2 43.1± 2 0.94 23M3 42.0± 2 0.94 23M4 43.2± 2 0.94 23M5 43.4± 2 0.94 23M6 42.6± 2 0.94 23M7 43.3± 2 0.94 23M8 42.1± 2 0.94 23
0 200 400 600 8000.5
0.55
0.6
Time (s) // (Fig. a)
SA
MP
LET
IME
(s)
0 200 400 600 8000.5
1
1.5
TIME (s) // (Fig. c)
HY
DR
OG
EN
PR
ES
SU
RE
(bar
)
0 200 400 600 80040
60
80
TIME (s) // (Fig. e)
ST
AC
KV
OLT
AG
E(V
)
Fig. 16. AC-PEFC for Configuration 3: Test 2. From left to right and from top to bottom: (aCurrent (A), (e)-Stack Voltage (V) and (f)-Stack Power (W).
A. De las Heras et al. / Renewable Energy 125 (2018) 1e20 13
with a fix room temperature of 23 �C and an initial stack temper-ature of 33 �C.
Then, with the aim to probe that the developed oxidant/coolingsubsystem provides sufficient air in a room temperature range, alast test will be done over configuration 3. Now the room temper-ature has been lowered to 13 �C, which logically brings a significantdrop in stack temperature. The results of this new test are shown inFig. 16.
Regarding Fig. 16, we can observe that stack reaches the tem-perature recommended by the manufacturer at the end of the firststep, due to its low starting temperature. In fact, as you can see inFig. 16b, it takes about 6min for the temperature to be inside thewindow (Top e Trob). From here, the behaviour of the stack tem-perature is becoming more and more suitable. Nevertheless, inbasis on power output, the stack performance is not affected. Thenwe can advance that the stack can provide the design power evenwhen its starting temperature is below the design temperature.
Regarding the thermographies (Figures 17a, b and c; andTables 6a, b and c, at the beginning the difference of Tables 5a and6a, is practically the same as the drop in room temperature. This is,around 10 �C. However, as the stack is working, the gap is comingreduced, and at the end of the test, it is only around 5 �C.
5. Discussion
In the red-ox reaction that takes place in a fuel cell, thehydrogen energy is transformed into electrical power and heat. Astack temperature control non-optimized will lead to a fuel cellwhere the most of the hydrogen energy is converted into heat,resulting an inefficient system. However, a temperature control inwhich the aims is not only to adjust the air stoichiometry but to fixthe stack temperature between the recommended ranges, providesa better fuel cell efficiency: with the same hydrogen consumption,it supplies higher electrical power.
0 200 400 600 80020
40
60
TIME (s) // (Fig. b)
ST
AC
KT
EM
PE
RA
TU
RE
(ºC
)
T (ºC)Topt (ºC)Trob (ºC)
0 200 400 600 8000
50
100
TIME (s) // (Fig. d)
ST
AC
KC
UR
RE
NT
(A)
0 200 400 600 8000
2
4
TIME (s) // (Fig. f)
ST
AC
KP
OW
ER
(W)
Tstack = 23 ºC
P = 2500 W
P = 620 WP = 1630 W
)-Sample Time (s), (b)-Stack Temperature (ºC), (c)-Hydrogen Pressure (bar), (d)-Stack

Table 6aStack temperature points (Config. 3e10 A).
Point Temp. (ºC) Emis Ref. Temp. (ºC)
M1 20.3± 2 0.94 13M2 20.1± 2 0.94 13M3 20.0± 2 0.94 13M4 19.8± 2 0.94 13M5 20.2± 2 0.94 13M6 19.1± 2 0.94 13M7 19.0± 2 0.94 13M8 20.3± 2 0.94 13M9 19.7± 2 0.94 13M10 19.5± 2 0.94 13
Table 6bStack temperature points (Config. 3e30 A).
Point Temp. (ºC) Emis Ref. Temp. (ºC)
M1 30.8± 2 0.94 13M2 31.5± 2 0.94 13M3 30.0± 2 0.94 13M4 30.6± 2 0.94 13M5 32.6± 2 0.94 13M6 31.9± 2 0.94 13M7 30.4± 2 0.94 13M8 32.0± 2 0.94 13M9 30.0± 2 0.94 13M10 23.7± 2 0.94 13
Table 6cStack temperature points (Config. 3e50 A).
Point Temp. (ºC) Emis Ref. Temp. (ºC)
M1 36.5± 2 0.94 13M2 37.6± 2 0.94 13M3 36.5± 2 0.94 13M4 36.1± 2 0.94 13M5 38.6± 2 0.94 13M6 37.9± 2 0.94 13M7 35.8± 2 0.94 13M8 37.0± 2 0.94 13M9 36.6± 2 0.94 13M10 29.8± 2 0.94 13
A. De las Heras et al. / Renewable Energy 125 (2018) 1e2014
In this work, for developed configurations 1 and 2, with 4 fans(Fig. 2b), authors have proposed these designs in basis on stack’smanufacturer recommendations based on a polycarbonate enclo-sure around the stack. This structure serves as stand to support fourfans that cover the area of the stack cathode. Regarding configu-ration 3 with only a fan (Fig. 2c), the design aim of the authors hasbeen to improve the air breathing of the stack and its temperaturedistribution over the cathode. This third configuration tries to sortout the problem observed in configurations 1 and 2: the air follows
Table 7Analysis of Oxidant/Cooling system parameters.
Configuration Air requiredAirstack (m3/h)
Heat GeneratedQstack heat (W)
Ac
# 1 10 A 0.79 470 130 A 2.39 1560 150 A 3.98 4500 2
# 2 10 A 0.79 450 130 A 2.39 1505.7 150 A 3.98 2990 2
# 3 10 A 0.79 380 130 A 2.39 1370 150 A 3.98 2500 2
a l is the stoichiometric rate and it is defined as:l¼ air flow needed for cooling/air flo
preferential paths surrounding the stack instead of crossing it for itscooling. In this sense, authors have proposed a design consisting ona speed controllable fan, which is inserted in a cone-shaped hopperbuilt to facilitate the air blow through the stack and avoidingpreferential paths of the airflow.
In configuration 1 the fans operate in ON/OFF mode. In config-uration 2, the fans are controlled based on the difference betweenthe stack temperature and the optimal temperature recommendedby manufacturer. In configuration 3, the single fan works withvariable speed, under a control law whose purpose is to maintainthe stack temperature within the window of suitable operatingtemperatures of the stack. Someonemight wonder why the authorshave not designed a controller, such as a PID for example that cantrack the optimum temperature (it would have even been easierthan the proposed solution). The answer is that the heating processis not controlled, it depends on the power requested to the stack atany time, and the cooling process, based on ventilation, does notallow to follow a set point exactly; consequently, it is better, morepractical and efficient, to work in a window of allowed values.
The three proposed configurations have been tested under thesame conditions and load profile. The goal to compare proposedconfigurations is to verify the fulfilment of the six design challengesproposed at the beginning of the work. These challenges are:
1) To be able to cool the stack homogeneously.2) To provide sufficient airflow range to control the PEFC temper-
ature, under a range of power and room/coolant airtemperature.
3) To place the stack at optimum temperature.4) To reduce the auxiliary power consumption.5) To do all this within a certain sized box, and6) To do it cost effectively.
Analysing the experimental results, we can observe that inconfiguration 1 (Fig. 8), the stack temperature does not changewhen no current is demanded by the load. Next, stack temperaturestarts to increase as load current gets higher. The time when theload changes can be guessed perfectly over the stack temperatureresponse. Moreover, we can notice, the stack temperature slopedoes not depend on the step amplitude difference but on the actualcurrent value at this time. That is, for the step between 10 Ae30 A,the amplitude step (20 A) is similar to the step between 30 Ae50 A.However, the temperature slopes and curvatures are different. Thecurvature slopes are 0.1 �C/A at 10 A, 0.05 �C/A at 30 A and 0.4 for 50A.
Another observation we can do over Fig. 8 is the electrical per-formance of the fuel cell. Attending to voltage response, when loaddemand rises up to 50 A, the stack voltage drops significantlyreducing the power supplied by the stack below 1000W. Attendingto the real AC-PEFC implementation and the BoP configuration
ir Volume needed forooling _Vs$(m3/h) [la]
Total Air Pressuredrop DPtotalðPaÞ
Fan operating point
32.73 [166.59] 44.43 OFF: 0ON: 5500 rpm79.75 [75.19} 52.69
70.06 [67.78] 69.4312.72 [141.41] 41.40 0e5500 rpm
According to controlalgorithm (Fig. 10)
77.04 [74.06] 52.2215.33 [54.04] 59.5809.46 [137.38] 40.84 700e5500 rpm
According to controlalgorithm (Fig. 13)
64.44 [68.79] 50.1811.81 [53.16] 58.53
w required for oxidant reaction.

Fig. 17. a. Configuration 3. Test 2: Thermography at 10 A. Fig. 17b. Configuration 3. Test 2: Thermography at 30 A. Fig. 17c. Configuration 3. Test 2: Thermography at 50 A.
A. De las Heras et al. / Renewable Energy 125 (2018) 1e20 15

A. De las Heras et al. / Renewable Energy 125 (2018) 1e2016
(Fig. 2), two reasons could be the origin of this: a wrong hydrogensupply or an inefficient oxidant supply system. They are the onlytwo agents involved in the stack red-ox reaction. Attending tohydrogen pressure response (Fig. 8c), it has been kept fixed alongthe whole test so this leads us to think the high temperature ach-ieved by the stack (Fig. 8b) is due to an improper air-breathing andthe oxidant/cooling system is inefficient. Remember that the air-starvation problem can affect the electrical resistivity of themembrane because the membrane is very dry to allow passing ionsacross itself.
Based on the above, configuration 1 is an inefficient Oxidant/Cooling subsystem. The stack temperature increases continually(Fig. 8b) because the Oxidant/Cooling subsystem is not capable ofmaintaining the stack temperature value between the recom-mended ranges. Therefore, the system requires a better control overthe fans to adjust properly the stack temperature as well as tosupply the air needed for breathing. Additionally, there is a clearair-starvation problem, reducing considerably the fuel cell effi-ciency. The thermography images taken along the load profile(Fig. 9a, a and 9c) show clearly how the airflow surrounds the stackfollowing preferential paths because the hottest spots locations arealways (regardless of the power demanded) on the upper leftcorner of the stack (see also values on Tables 3a, b and c). So, adiagonal-shape operating mode for fans activated two by two is notrecommended.
Regarding configuration 2, it solves the air-starvation problempresented by configuration 1. Besides, it shows a better stacktemperature response (Fig. 11). It increases continually as loadcurrent rises and it is closer to the optimal temperature (Fig. 11b)than configuration 1, but most of the time it is still outside.Regarding the fuel cell efficiency, this is better than in previousconfiguration. However, the stack temperature distribution is stillno uniform; note that the hottest spots locations for configuration 2are always on the left side of the stack (please, see Fig. 12a, b and12c; and Tables 4a, b and c). In fact, the no-uniformity in the stacktemperature is even more noticeable than in configuration 1. Thiscan be appreciated in the thermographies at different load currentvalues. Table 4c shows that there is a difference greater than 18 �Cbetween the hottest and the coldest point at the same time in thesame stack.
Finally, the last proposed configuration avoids the preferential
Fig. 18. a. Air chart for fan model Embpast-6224TD (Configuration 1 and 2
paths because the cone-shaped hopper is totally adapted to thestack avoiding the space between the stack and the structure forthe air flow. Therefore, the airflow is forced to cross the stack inorder to cool it. In this case, experimental results show the stacktemperature is fairly well adjusted to optimal temperature, guar-anteeing both the stack oxygenation and cooling (please, seeFigs. 14 and 15, and Tables 5a, b and C). That is, both air-starvationand no-homogeneous cooling problems from configurations 1 and2 are solved. As consequence, this design guarantees both the moreproper air breathing subsystem for the stack and the best fuel cellefficiency. Additionally, thermography images demonstrate thebest temperature distribution is around the stack cathode area.
Up to now, with the tests done over configurations 1, 2 and 3 wecan advance what configuration best fulfils the six requirementsthat the oxidant/cooling systemmust guarantee (see Fig.1). The lastquestion that has been addressed in this paper is the oxidant/cooling subsystem capability. As it was introduced, one of the re-quirements is to provide enough airflow under different poweroutputs and room temperatures. On the other hand, as it isdemonstrated in Ref. [15], the airflow rate needs are higher forstack cooling than for oxygenation. Therefore, if the stack cooling isguaranteed, the stack oxygenation will be too. In this regard, thecooling airflow rate depends on the difference between the stackand air temperature; higher difference, higher airflow needs. Then,the fan selection [15] was done considering the highest tempera-ture the stack could achieve (66 �C at nominal power). Then, thefirst test applied over configuration 3 confirms the design is suit-able for supplying enough airflow to oxygenate and cool the stackat a certain room temperature. The second test completes the firstone showing the proper stack oxygenation and cooling for a roomtemperature range. Regarding this (please see Figs. 16 and 17 andTable 6a, b, c), it is clear that air starvation (deficiency of configu-ration 1) and high stack temperatures (deficiency of configurations1 and 2) have more negative effect on the stack performance than acool starting. In a real application, in case the user desires to startworking inside the temperature range, it is advisable to wait a fewminutes to warm the stack.
The effects of a proper design of the Oxidant/Cooling subsystemcan be observed directly over the stack performance. Then, if thestack is operated at temperatures above optimal one, the mem-brane will dry out and become more electrically resistive, reducing
). Fig. 18bAir chart for fan model Embpast-6224TD (Configuration 3).

0
10
20
30
40
50
60
70
80
0 10 20 30 40 50
STAC
KVO
LTAG
E(V
)
STACK CURRENT (A)
Stack Voltage Comparison
Config. 1Config. 2Config. 3Config. 3: Test 2Manufacturer
0
500
1000
1500
2000
2500
3000
0 10 20 30 40 50
STAC
KPO
WER
(W)
STACK CURRENT (A)
Stack Power Comparison
Config. 1Config. 2Config. 3Config. 3: Test 2Manufacturer
Fig. 19. a. Stack Voltage Comparison. Figure 19b. Stack Power Comparison. Fig. 19c. Stack Temperature Comparison.
A. De las Heras et al. / Renewable Energy 125 (2018) 1e20 17
the stack performance. This is the case of configurations 1 and 2.Even at extreme temperatures, the membrane can becomedamaged, resulting in irreversible performance losses. Specifically,in configuration 1 due to an improper air-breathing and inefficientoxidant/cooling system, stack suffers air-starvation problem. Thisprovokes there is no sufficient air for the redox reaction in the
membrane (oxygen and hydrogen mix to form electricity and wa-ter) and, consequently the voltage will decrease significantly,decreasing too the power provided by the stack.
By contrast, if the stack is operated at temperatures well belowoptimal value, the membrane will be over-humidified, resulting inthe presence of liquid water in the cells. Too much water can cause

1 Regarding stack temperature response, differences at the beginning of each test
A. De las Heras et al. / Renewable Energy 125 (2018) 1e2018
anode flooding, where thewater blocks reactants from reaching thecatalyst layer. This can also cause irreversible performance lossthough localized fuel starvation and cell reversals. For this reason,the temperature control system developed in configuration 3 keepsthe stack temperature very close to the optimum value. That is, inconfiguration 3, the one that shows the best stack performance,there are no situations of air-starvation, nor dry or floodedmembrane.
Paying attention to thermographies we can observe configura-tion 1 point out clearly that the airflow surrounds the stackfollowing preferential paths because the hottest spots appear onthe upper left corner of the stack. With regard to the differencebetween the coldest and hottest point at highest current value(50A), it has been justified than it can achieve more than 13 �C,respect to the value 73 �C, given by the temperature sensor pro-vided into the stack by the manufacturer. Therefore, the stacktemperature distribution in configuration 1 is no uniform at all.
Regarding thermographies obtained from configuration 2, theyshow how the stack temperature distribution is still no uniform. Inthis case, the hottest points also appears on the upper left side ofthe stack, very similar to configuration 1. Moreover, the differencebetween the coldest and hottest point at highest current value(50A), is worse than in the first configuration, increasing up to 18 �Ctaking as reference the value of 65 �C given by the temperaturesensor.
In the last configuration, the third, thermography images pointout that the best temperature distribution is around the stackcathode area. In this case, temperature distribution is clearly ho-mogeneous in the two cases (configuration 3-Test 1 and configu-ration 1-Test 2. The difference between the coldest and hottestpoint is 1.4 �C, while the value offered by the temperature sensor is65 �C. Then, we can conclude that the best configuration, besides itinvolves a more complex control into the fan, is configuration 3. Itguarantees the best air breathing and cooling into the stack, ho-mogenous temperature distribution and the best stackperformance.
Once the three proposed configurations have been discussedseparately, now we are going to compare the main factors definedby the oxidant/cooling subsystem design. These factors are the airmass required for oxidant reaction, the heat generated by the stack,the air flow needed for cooling the stack and the fan operatingpoint.
Based on Table 7, we can see that air required by oxidant reac-tion increases when current rises, and it is much lower than the airflow required for cooling the stack. It is proved that in all the cases,the stoichiometric rate keeps inside the range recommended by themanufacturer (50e200). Additionally, we can observe that the lessefficient configuration (#1) is the one that implies highest heatproduction in the stack. From this, configuration 2 and 3 reducesgradually the heat generation, and therefore the air required forcooling decreases too.
Regarding the fan speed, it is adjusted according to the controlalgorithm. The fan operating point can be known taking into ac-count the pressure drop that the air flowing through the stackexperiences and the air flow needed for cooling. Fig. 18a and bshows the fan/s operating range, in the three cases, is inside ofnominal operating area defined by the fan manufacturer.
Where (equations expressed below have been obtained frommanufacturer data [29,30],
- Airstack ¼ 0:000996$Is$ncell is the air flow required for oxidantreaction (m3/h).
- Qstack heat ¼ ncell$ð1:25 V � VcellÞ$Is is the heat generated by thestack (W).o ncell is the number of cells that integrates the stack (80).o Vcell ¼ Vstack=ncell is the cell voltage (V).o Is is the number stack current (A).
- _Vs ¼ Qstack heatðTs�Tamb�Þ$Cp$rair
is the air volume flow needed for stack
cooling (m3/h).o Ts is the stack temperature (ºC).o Tamb is the ambient temperature (23 �C).o Cp is air heat capacity (1012 J/(Kg∙K)).o rair is the air density (1.29 kg/m3).
- DP ¼ $Ps þ $Pducting is the total pressure drop that the airflowing experiences (Pa).
o Ps ¼ 0:0592$ðTsþ273Þ1:5Tsþ393 $
_Vsðncellþ1Þ is the pressure drop through the
stack (Pa), with _Vs expressed in l/min.o Pducting is the ancillary air pressure drop such as the ducting(no higher than 24 Pa)
Before to conclude, we are going to compare the performancesobtained from each configuration with the standard configurationrecommended by the manufacturer. Then, Fig. 19a shows the stackvoltage obtained in each case, and from it, we can deduce theconfiguration that allows obtaining the best performance from thestack is the one that guarantees the best breathing/cooling to thestack (configuration 3). Fig. 19b shows that configuration 3 allowsextracting from the stack more power than the power offered ac-cording to standard configuration proposed by manufacturer.
The last comparison is related to stack temperature. As we canobserve from Fig. 19c, those configurations where the stack isproperly cooled, the stack temperature is very close to optimaltemperature and it matches with configurations that offer higherpower rates. As a result, worse temperature control involves worsestack performance.1
Finally, Table 8 summarizes the main characteristics of theproposed configurations and the standard configuration proposedby the manufacturer, attending to parameters for accomplishingthe challenges posed as goals of the presented work in relation tothe oxidant/coolant subsystem. These parameters are:
- Number of fans which integrate the subsystem.- Size of the enclosure.- Total weight.- Cost, calculated as unitary cost * number of units.- Auxiliary power consumption, calculated as unitary powerconsumption * number of units.
- Possibility of airflow control.- Homogenous temperature distribution. Taking into account thestack in made up by 80 cells, the maximum difference betweenthe hottest and coldest point to consider the temperature dis-tribution as uniform is fixed at 2 �C; this corresponds with a rateof 0,025 �C/cell
- And finally, fuel cell system efficiency, calculated as “OutputElectrical Power/Hydrogen Consumed)
In basis of them, Table 8 offers a comparative of requirementsachieved by each proposal, showing that configuration 3 accom-plishes all of them.
are justified because stack has been subjected to different initial conditions.

Table 8Summary of the performances obtained from the proposed Oxidant/Cooling subsystems and from the manufacturer standard configuration.
Configuration Structure Numberof fans
Size (W x L x H)(mm)
Weight(gr)
Cost (V) Auxiliary PowerConsumption(W)
Air flowControl
HomogenousTemperatureDistribution
AC-PEFC Efficiency(Electrical power/H2consumption)
1 Four fans without control
Fan 1a
Ts
Fuel cell stackFan 1b
Fan 2a
Fan 2b
Fans withoutflow control
meter, adjusted slightly below
4 400� 200� 600 3280 799.36 364.8 No No 30%
2 Four fans with control
Fan 1a
Ts
Fuel cell stackFan 1b
Fan 2a
Fan 2b
Fans withflow control
4 400� 200� 600 3280 799.36 364.8 Yes No 42%
3 One single speed controlled fan
Ts
Fuel cell stack
Speedcontrolled
Fan
Hop
per
1 350� 250� 440 820 199.84 91 Yes Yes 50%
Manufacturerproposal
2 400� 200� 600 410 399.7 182.4 No No 45%
A. De las Heras et al. / Renewable Energy 125 (2018) 1e20 19
6. Conclusion
This paper presents a comprehensive experimental study ofthree possible configurations of the Oxidant/Cooling subsystem inan AC-PEFC. This presented study justifies that the authors aretrying to enhance the Oxidant/Cooling subsystem. Contrary towhatone might think, and based on experimental results, this paper hasshown how the Oxidant/Cooling subsystem can condition the stackoperation. It is really important to control the stoichiometric ratebetween the values recommended by the manufacturer’s data toavoid the stack deterioration.
This work departs from six challenges in the design andmanufacture of the oxidant/cooling sub-system in an AC-PEFC: 1)to be able to cool the stack homogeneously, 2) to provide sufficientairflow range to control the PEFC temperature, under a range ofpower and room/coolant air temperature, 3) to place the stack atoptimum temperature, 4) to reduce the auxiliary power con-sumption, 5) to do all this within a certain sized box, and last butnot least 6) to do so cost effectively.
In order to overcome the challenges posed, the presented workdeparts from a configuration based on manufacturer recommen-dations and trying to improve the stack temperature controlincluding some changes which could make to enhance the systemoperation.
To carry out the study, different configurations for the Oxidant/
Cooling subsystem have been designed, built and analysed basedon the AC-PEFC responses. Proposed configurations are based oninfluencing on different devices which integrate the Oxidant/Cooling subsystem (fan/s, distance, enclosure design, flow adapter,and so on). Different variables have been analysed from the AC-PEFC system with the different configurations applied to theOxidant/Cooling subsystem. This has been complemented byintroducing different thermography at different stack currentvalues to study the temperature distribution over the stack cathodearea.
Three configurations have been carried out: four fans coveringthe cathode area of the stack working two by two without flowcontrol, four fans covering the cathode area of the stack workingtwo by two with flow control, and one single fan with speedcontrolled. The first two are housed in a polycarbonate rectangular-shaped enclosure that covers the entire stack. The third has beenplaced in a cone-shaped hopper also covering the entire stack. Thiscover is adapted to the stack geometry.
With regard to the experimental results, we can assert that thefirst two proposals present a diminished airflow distributionbecause the airflow follows preferential paths due to the space. Thisspace is found between the polycarbonate enclosure and the stack,and the airflow follows these paths instead of crossing the stackand cooling it.

A. De las Heras et al. / Renewable Energy 125 (2018) 1e2020
References
[1] F. Barbir, PEM Fuel Cells: Theory and Practice, Elsevier Academic Press, NewYork, 2012.
[2] U. Kunze, J. Paschos, O. Stimming, Fuel Cell Comparison to Alternate Tech-nologies, in Fuel Cells, Springer, 2013, pp. 77e95.
[3] EG&G Technical Services, Fuel cell handbook, seventh, U.S: Department ofEnergy, 2004, p. 427.
[4] M. Andersson, S.B. Beale, M. Espinoza, Z. Wu, W. Lehnert, A review of cell-scalemultiphase flow modeling, including water management, in polymer elec-trolyte fuel cells, Appl. Energy 180 (2016) 757e778.
[5] D. Guida, M. Minutillo, Design methodology for a PEM fuel cell power systemin a more electrical aircraft, Appl. Energy (Nov. 2016).
[6] M.J. Vasallo, J.M. Bravo, J.M. Andújar, Optimal sizing for UPS systems based onbatteries and/or fuel cell, Appl. Energy 105 (2013) 170e181.
[7] F. Segura, E. Dur�an, J.M. Andújar, Design, building and testing of a stand alonefuel cell hybrid system, J. Power Sources 193 (2009) 276e284.
[8] S. Cordiner, V. Mulone, A. Giordani, M. Savino, G. Tomarchio, T. Malkow,G. Tsotridis, A. Pilenga, M.L. Karlsen, J. Jensen, Fuel cell based HybridRenewable Energy Systems for off-grid telecom stations: data analysis fromon field demonstration tests, Appl. Energy (2016).
[9] J.J.B.M.J. Vasallo, J.M. Andújar, C. García, A methodology for sizing backup fuel-cell/battery hybrid power systems, Ind. Electron. IEEE Trans. 57 (6) (2010)1964e1975.
[10] F. Segura, J.M. Andújar, Power management based on sliding control appliedto fuel cell systems: a further step towards the hybrid control concept, Appl.Energy 99 (2012) 213e225.
[11] A. Gomez, A. Raj, A.P. Sasmito, T. Shamim, Effect of operating parameters onthe transient performance of a polymer electrolyte membrane fuel cell stackwith a dead-end anode, Appl. Energy 130 (2014) 692e701.
[12] G. Zhang, S.G. Kandlikar, A critical review of cooling techniques in protonexchange membrane fuel cell stacks, Int. J. Hydrogen Energy 37 (3) (2012)2412e2429.
[13] J.W. Ahn, S.Y. Choe, Coolant controls of a PEM fuel cell system, J. PowerSources 179 (2008) 252e264.
[14] H.S. Han, C. Cho, S.Y. Kim, J.M. Hyun, Performance evaluation of a polymerelectrolyte membrane fuel cell system for powering portable freezer, Appl.Energy 105 (2013) 125e137.
[15] A.P. Sasmito, E. Birgersson, K.W. Lum, A.S. Mujumdar, Fan selection and stackdesign for open-cathode polymer electrolyte fuel cell stacks, Renew. Energy37 (1) (2012) 325e332.
[16] F. Segura, J.M. Andújar, Step by step development of a real fuel cell system.Design, implementation, control and monitoring, Int. J. Hydrogen Energy 40
(15) (2015) 5496e5508.[17] F. Philipps, G. Simons, K. Schiefer, Dynamic investigation of PEFC stacks in
interaction with the air supply system, J. Power Sources 154 (2) (Mar. 2006)412e419.
[18] Y.-B. Kim, Improving dynamic performance of proton-exchange membranefuel cell system using time delay control, J. Power Sources 195 (19) (2010)6329e6341.
[19] O. Himanen, T. Hottinen, S. Tuurala, Operation of a planar free-breathingPEMFC in a dead-end mode, Electrochem. Commun. 9 (2007) 891e894.
[20] R. Eckl, W. Zehtner, C. Leu, and U. Wagner, “Experimental analysis of watermanagement in a self-humidifying polymer electrolyte fuel cell stack,” J. Po-wer Sources, vol. 138, no. 1e2, pp. 137e144.
[21] H.-W. Wu, A review of recent development: transport and performancemodeling of PEM fuel cells, Appl. Energy 165 (2016) 81e106.
[22] R.C. Samsun, J. Pasel, H. Janßen, W. Lehnert, R. Peters, D. Stolten, Design andtest of a 5 kWe high-temperature polymer electrolyte fuel cell system oper-ated with diesel and kerosene, Appl. Energy 114 (2014) 238e249.
[23] M. Gerbec, V. Jovan, J. Petrov�ci�c, Operational and safety analyses of a com-mercial PEMFC system, Int. J. Hydrogen Energy 33 (2008) 4147e4160.
[24] U. Soupremanien, S. Le Person, M. Favre-Marinet, Y. Bultel, Tools for designingthe cooling system of a proton exchange membrane fuel cell, Appl. Therm.Eng. 40 (2012) 161e173.
[25] J. Marcinkoski, B.D. James, J. a Kalinoski, W. Podolski, T. Benjamin, J. Kopasz,Manufacturing process assumptions used in fuel cell system cost analyses,J. Power Sources 196 (12) (2011) 5282e5292.
[26] B.J. Kim, M.S. Kim, Studies on the cathode humidification by exhaust gasrecirculation for PEM fuel cell, Int. J. Hydrogen Energy 37 (5) (2012)4290e4299.
[27] Q. Meyer, A. Himeur, S. Ashton, O. Curnick, R. Clague, T. Reisch, P. Adcock,P.R. Shearing, D.J.L. Brett, System-level electro-thermal optimisation of air-cooled open-cathode polymer electrolyte fuel cells: air blower parasitic loadand schemes for dynamic operation, Int. J. Hydrogen Energy 40 (no. 46)(2015) 16760e16766.
[28] Q. Wu, H. Li, W. Yuan, Z. Luo, F. Wang, H. Sun, X. Zhao, H. Fu, Performanceevaluation of an air-breathing high-temperature proton exchange membranefuel cell, Appl. Energy 160 (2015) 146e152.
[29] FCgen ® -1020ACS/FCvelocity ® -1020ACS Fuel Cell Stack. Product Manualand Integration Guide, 2010.
[30] Ballard Putting Fuel Cells to Work FCgen ® -1020ACS Fuel Cell Stack FCve-locity ® -1020ACS Fuel Cell Stack Product Manual and Integration Guide,2014.
[31] Ebmpapst, Product Data Sheet DV6224 TDA, 2012.