Thermal Hydraulics of the Very High Temperature Gas Cooled ...
THERMAL ANALYSIS OF AIR-COOLED FUEL CELLS
By
Setareh Shahsavari
M. Sc., Sharif University of Technology, 2009
B. Sc., Sharif University of Technology, 2006
THESIS SUBMITTED IN PARTIAL FULFILLMENT OF
THE REQUIREMENTS FOR THE DEGREE OF
MASTER OF APPLIED SCIENCE
In the
School of Engineering Science
Faculty of Applied Sciences
© Setareh Shahsavari 2011
SIMON FRASER UNIVERSITY
Summer 2011
All rights reserved. However, in accordance with the Copyright Act of Canada, this work may be
reproduced, without authorization, under the conditions for Fair Dealing. Therefore, limited reproduction of
this work for the purposes of private study, research, criticism, review and news reporting is likely to be in
accordance with the law, particularly if cited appropriately.
ii
APPROVAL
Name: Setareh Shahsavari
Degree: Master of Applied Science
Title of Thesis: Thermal Analysis of Air-cooled Fuel Cells
Examining Committee:
Chair: Dr. Siamak Arzanpour
Assistant Professor of Engineering Science
__________________________________________
Dr. Majid Bahrami
Supervisor
Assistant Professor of Engineering Science
__________________________________________
Dr. Erik Kjeang
Supervisor
Assistant Professor of Engineering Science
__________________________________________
Dr. Farid Golnaraghi
Internal Examiner
Professor and Associate Director Engineering Science
(Surrey); Burnaby Mountain Chair
Date Defended/Approved: __________________________________________
iii
ABSTRACT
Temperature distribution in a fuel cell significantly affects the performance and
efficiency of the fuel cell system. Particularly, in low temperature fuel cells, improvement
of the system requires proper thermal management, which indicates the need for
developing accurate thermal models. In this study, a 3D numerical thermal model is
presented to analyze the heat transfer and predict the temperature distribution in air-
cooled proton exchange membrane fuel cells (PEMFC). In the modeled fuel cell stack,
forced air flow supplies oxidant as well as cooling. Conservation equations of mass,
momentum, and energy are solved in the oxidant channel, while energy equation is
solved in the entire domain, including the gas diffusion layers and separator plates, which
play a significant role in heat transfer. Parametric studies are performed to investigate the
effects of various properties and operating conditions on the maximum cell temperature.
The present results are further validated with experiment. This model provides a
theoretical foundation for thermal analysis of air-cooled PEMFC stacks, where
temperature non-uniformity is high and thermal management and stack cooling is a
significant challenge.
Keywords: PEM fuel cell; Air cooling; Thermal management; Forced convection;
Heat transfer; Numerical modeling

iv
ACKNOWLEDGEMENTS
I would like to thank my supervisors, Dr. Majid Bahrami and Dr. Erik Kjeang, for
their excellent support during my graduate studies. Their professional attitude and
positive personality have continually inspired me, and their encouragements have
refreshed me in desperate moments. I would also like to thank Dr. Farid Golnaraghi for
kindly reviewing this thesis.
I greatly appreciate the technical supports of Mr. Andrew Desouza from Ballard
Power Systems. This project was financially supported by Natural Sciences and
Engineering Research Council of Canada, NSERC and Ballard Power Systems.
v
TABLE OF CONTENTS
Approval .............................................................................................................................................................................. ii
Abstract ............................................................................................................................................................................... iii
Acknowledgements ........................................................................................................................................................ iv
Table of Contents ............................................................................................................................................................. v
List of Figures .................................................................................................................................................................vii
List of Tables .................................................................................................................................................................... ix
Nomenclature .................................................................................................................................................................... x
1: Introduction .................................................................................................................................................. 1
1.1 Influence of Temperature on Fuel Cell Performance ............................................................................. 2
1.2 Review of PEMFC Thermal Models ............................................................................................................ 4
1.2.1 Analytical Models: System-level ................................................................................................... 4 1.2.2 CFD-based Models .............................................................................................................................. 6
1.3 Stack Cooling Methods: Overview ................................................................................................................ 8
1.3.1 Passive Methods ................................................................................................................................... 8 1.3.2 Active Methods .................................................................................................................................. 10 1.3.3 Experimental Studies ....................................................................................................................... 14
1.4 Objectives ............................................................................................................................................................. 15
2: Model Development .................................................................................................................................. 17
2.1 Transport phenomena in PEMFCs .............................................................................................................. 17
2.2 Heat Transfer in a Fuel Cell Stack .............................................................................................................. 19
2.3 Governing Equations........................................................................................................................................ 22
2.3.1 Energy Equation ................................................................................................................................ 22 2.3.2 Heat Generation ................................................................................................................................. 22 2.3.3 Fluid Flow ............................................................................................................................................ 25 2.3.4 Natural Convective Heat Transfer .............................................................................................. 26 2.3.5 Transport of Species ........................................................................................................................ 27
2.4 Summary of Assumptions .............................................................................................................................. 32
2.5 Mesh Independency .......................................................................................................................................... 32
3: Results and Discussion ............................................................................................................................. 34
3.1 Base Case Results.............................................................................................................................................. 34
3.2 Model Validation ............................................................................................................................................... 42
3.2.1 Comparison with Experiments ..................................................................................................... 42 3.2.2 Comparison with Analytical Model ........................................................................................... 43
3.3 Natural Convection Effects ........................................................................................................................... 46
4: Parametric Study ...................................................................................................................................... 50
4.1 Thermal Properties and Operating Conditions ....................................................................................... 50

vi
4.2 Channel Geometry ............................................................................................................................................ 56
5: Conclusions and Recommendations .................................................................................................... 59
6: Reference List ............................................................................................................................................. 62
vii
LIST OF FIGURES
Figure 1-1: Basic construction of a typical PEM fuel cell [2]. ........................................................ 1
Figure 1-2: Schematic of a stack with heat spreaders/fins. ............................................................. 8
Figure 1-3: Micro-heat pipe embedded in a bipolar plate [21]. ....................................................... 9
Figure 1-4 Schematic of two MEAs and one bipolar plate modified for separate reactant
and cooling air in a PEM fuel cell .............................................................................. 12
Figure 1-5: Picture of the flow channel plate and the shaped pyrolytic graphite sheets
[30]. ............................................................................................................................ 15
Figure 2-1: Coupling of Transport Phenomena in a PEMFC [32]. ............................................... 18
Figure 2-2 : Schematic of heat transfer (a) in an air-cooled stack and (b) in a single
channel ....................................................................................................................... 19
Figure 2-3 : 3D schematic of a fuel cell stack and a cathode channel, the computational
domain ........................................................................................................................ 20
Figure 2-4: 2D schematic of the computational domain including ambient air before and
after the channel; the dark lines on top and bottoms specify the periodic
boundary condition. .................................................................................................... 21
Figure 2-5: Diffusion coefficient of water vapour in air [35]. ....................................................... 29
Figure 2-6: Computational domain for the PEMFC thermal model with inlet and outlet air
domain. ....................................................................................................................... 33
Figure 2-7: Mesh configuration of the computational domain with a single flow channel............ 33
Figure 3-1: Temperature contours in the middle cross section of the channel (reference
case)............................................................................................................................ 35
Figure 3-2: Temperature contours in eight slices from inlet to outlet of the channel
(reference case). .......................................................................................................... 35
Figure 3-3: Temperature variation in different directions in bipolar plate (reference case). ......... 36
Figure 3-4: Temperature variation in different directions in air (reference case). ......................... 36
Figure 3-5: Schematic of heat flux vectors; (a) conductive heat flux, (b) convective heat
flux ............................................................................................................................. 37
Figure 3-6: Absolute value of mean conductive and convective heat flux in the direction
of air flow (reference case) ......................................................................................... 38
Figure 3-7: Water vapour mass fraction distribution in cathode channel ..................................... 40
Figure 3-8: Relative humidity distribution in cathode channel .................................................... 40
Figure 3-9: Relative humidity and vapour mass fraction along the cathode channel ................... 41
Figure 3-10: Schematic of the stack configuration. The specified channels in the stack
can be covered by the present numerical model.......................................................... 46

viii
Figure 3-11: Bipolar plate temperature variation in the direction of flow for the central
channel (thermally insulated) and side channel (with natural convection from
one side) ..................................................................................................................... 47
Figure 3-12: (a) Bipolar plate configuration, (b) Temperature distribution in one plate,
interpolated using experimental data points. The experimental and numerical
values for the inlet and outlet temperatures are compared for the central and
side channels............................................................................................................... 48
Figure 4-1: Effect of inlet air velocity on maximum temperature. ................................................ 51
Figure 4-2: Effect of bipolar plate thermal conductivity on maximum temperature. .................... 52
Figure 4-3: Effect of GDL thermal conductivity on GDL temperature distribution along
the channel;................................................................................................................. 53
Figure 4-4: Effect of anisotropic GDL thermal conductivity on GDL temperature
distribution along the channel. .................................................................................... 53
Figure 4-5: Different impact of in-plane and through-plane bipolar plate thermal
conductivity on temperature distribution along the channel. ....................................... 54
Figure 4-6: Effect of bipolar plate in-plane thermal conductivity on temperature
distribution along the channel. .................................................................................... 54
Figure 4-7: Schematic of the fuel cell channel model including thermal contact resistance
(TCR) ......................................................................................................................... 55
Figure 4-8: Effect of TCR on temperature distribution along the channel .................................... 56
Figure 4-9: Temperature variation in flow direction for trapezoidal, square, and
rectangular channel cross-sections. ............................................................................. 57
Figure 4-10: Oxidant relative pressure in flow direction for trapezoidal, square, and
rectangular channel cross-sections. ............................................................................. 58

ix
LIST OF TABLES
Table 2-1. Geometrical and thermophysical parameters used in the reference case. ..................... 31
Table 3-1: Comparison of conductive and convective heat transfer. All parameters are
kept constant in different cases except the oxidant flow rate and plate thermal
conductivity ................................................................................................................ 38
Table 3-2. Model validation.......................................................................................................... 43
Table 3-3: Comparison of Poiseuille number in rectangular channel derived from the
analytical and numerical models. ................................................................................ 45
Table 3-4: Comparison of Nusselt number in rectangular channel derived from the
analytical and numerical models. ................................................................................ 45
Table 3-5: Comparison of heat transfer in central channel and side channel (base case). ............. 47

x
NOMENCLATURE
cross-sectional area of the channel (m2)
concentration (mol m-3
)
specific heat (J K−1
kg−1
)
diffusion coefficient (m2 s
-1)
maximum voltage obtained from converting enthalpy of
formation of hydrogen into electrical energy (V)
Faraday’s constant (C mol-1
)
Gibbs free energy (J)
gravity acceleration (m s-2
)
Grashof number
enthalpy (J)
convective heat transfer coefficient (W m-2
K-1
)
electrical current (Amp)
current density (Amp m-2
)
thermal conductivity (Wm
-1K
-1)
length (m)
mass flow rate (kgs-1
)
molar flux (mol m-3
)
outward unit normal
Nusselt number
pressure, (Pa)
Prandtl number
PEM polymer electrolyte membrane fuel cell
heat generation per unit volume (Wm-3
)
total heat generation (W)
Rayleigh number
entropy (J K-1
)
temperature (K)
thickness (m)
thermodynamic equilibrium potential of the reaction (V)
velocity (m s-1
)
velocity vector (m s-1
)
output voltage (V)
power (W)
width (m), water vapour mass fraction

xi
Greek symbols
volumetric thermal expansion coefficient (K-1
)
fluid viscosity (N.s.m-2
)
kinematic viscosity (m2 s
-1)
density (kg m-3
)
relative humidity
humidity ratio
Subscript
BP bipolar plate
CCM catalyst coated membrane
cell single fuel cell
ch channel
cond conduction
conv convection
domain domain
exp experiment
fluid
GDL gas diffusion layer
in inlet, in-plane
irrev irreversible
m mean
max maximum
MEA membrane electrode assembly
out outlet
rev reversible
rib rib
s solid
sat saturation
sim simulation
thr through-plane

1
1: INTRODUCTION
Fuel cells are devices that produce electricity through electrochemical reactions.
In a proton exchange membrane fuel cell (PEMFC), a membrane separates oxidation and
reduction half reactions. Figure 1-1 schematically shows the basic construction of a
PEMFC. The fuel is hydrogen gas and the oxidant is ambient air or pure oxygen. The
only byproducts of this reaction are heat and water. Considering their high energy
conversion efficiency, zero emission potential, low noise and potential use of renewable
fuels, fuel cells are considered as future devices for mobile, stationary, and portable
power applications. However, PEMFC systems are not currently cost effective;
increasing their efficiency for transportation and stationary applications can improve their
commercialization [1].
Figure 1-1: Basic construction of a typical PEM fuel cell [2].
Operation of a PEMFC is a complex process and includes transport of mass,
momentum, energy, species and charges that take place simultaneously. Different parts of
2
a PEMFC are comprised of current collectors, anode and cathode flow channels, gas
diffusion layers (GDLs), catalyst layers and the membrane. During the operation of a
PEMFC, hydrogen molecules are supplied at the anode and split into protons and
electrons. The polymeric membrane conducts protons to the cathode while the electrons
are pushed round an external circuit and a current is generated from anode side to cathode
side via electric load. Oxygen (form air) is consumed in the cathode side and reacts with
the hydrogen ions, producing water and heat.
Fuel cells are still undergoing intense development, and the combination of new
and optimized materials, improved product development, novel architectures, more
efficient transport processes, and design optimization and integration are expected to lead
to major gains in performance, efficiency, reliability, manufacturability and cost-
effectiveness.
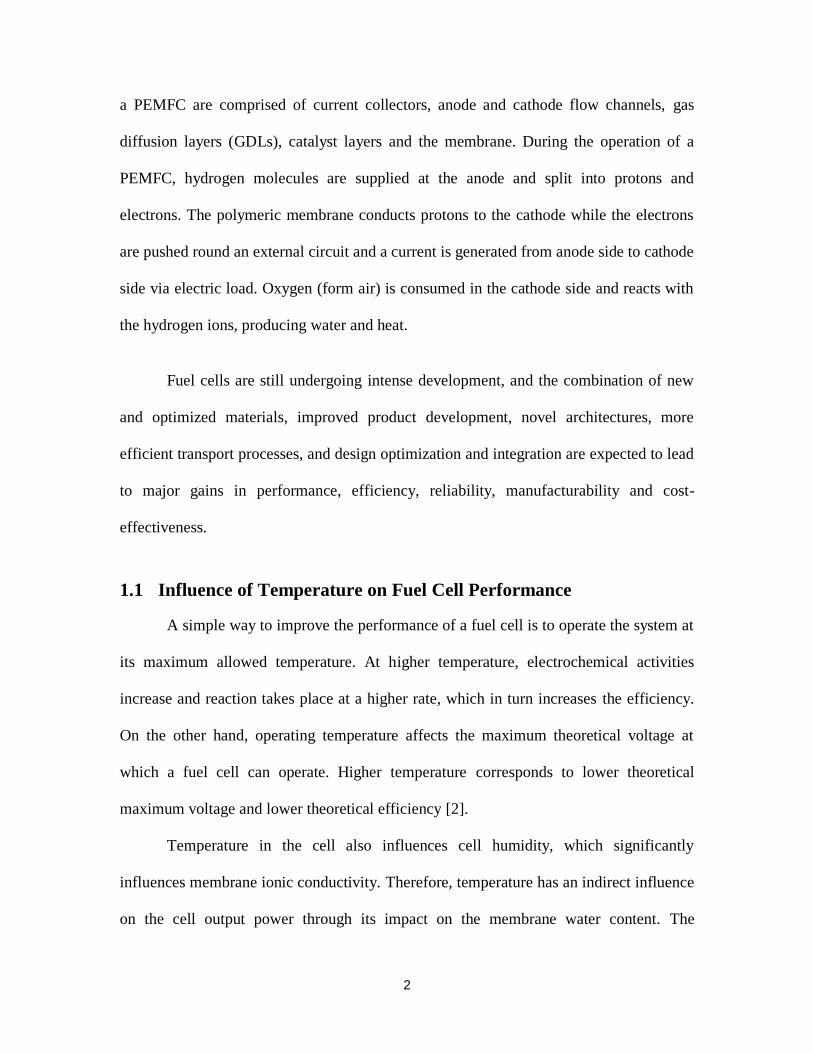
1.1 Influence of Temperature on Fuel Cell Performance
A simple way to improve the performance of a fuel cell is to operate the system at
its maximum allowed temperature. At higher temperature, electrochemical activities
increase and reaction takes place at a higher rate, which in turn increases the efficiency.
On the other hand, operating temperature affects the maximum theoretical voltage at
which a fuel cell can operate. Higher temperature corresponds to lower theoretical
maximum voltage and lower theoretical efficiency [2].
Temperature in the cell also influences cell humidity, which significantly
influences membrane ionic conductivity. Therefore, temperature has an indirect influence
on the cell output power through its impact on the membrane water content. The
3
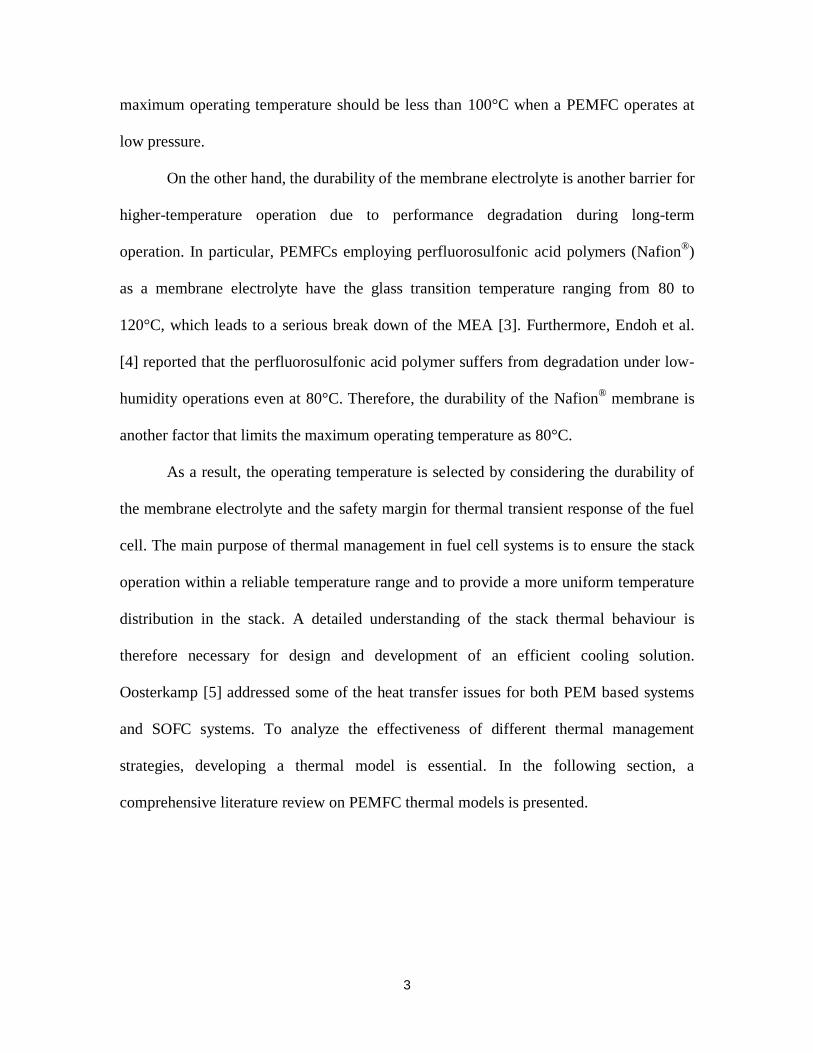
maximum operating temperature should be less than 100°C when a PEMFC operates at
low pressure.
On the other hand, the durability of the membrane electrolyte is another barrier for
higher-temperature operation due to performance degradation during long-term
operation. In particular, PEMFCs employing perfluorosulfonic acid polymers (Nafion®)
as a membrane electrolyte have the glass transition temperature ranging from 80 to
120°C, which leads to a serious break down of the MEA [3]. Furthermore, Endoh et al.
[4] reported that the perfluorosulfonic acid polymer suffers from degradation under low-
humidity operations even at 80°C. Therefore, the durability of the Nafion® membrane is
another factor that limits the maximum operating temperature as 80°C.
As a result, the operating temperature is selected by considering the durability of
the membrane electrolyte and the safety margin for thermal transient response of the fuel
cell. The main purpose of thermal management in fuel cell systems is to ensure the stack
operation within a reliable temperature range and to provide a more uniform temperature
distribution in the stack. A detailed understanding of the stack thermal behaviour is
therefore necessary for design and development of an efficient cooling solution.
Oosterkamp [5] addressed some of the heat transfer issues for both PEM based systems
and SOFC systems. To analyze the effectiveness of different thermal management
strategies, developing a thermal model is essential. In the following section, a
comprehensive literature review on PEMFC thermal models is presented.

4
1.2 Review of PEMFC Thermal Models
Several studies are available on analytical and numerical modeling of PEMFCs.
However, a few of them have concentrated on the area of thermal modeling and thermal
management. Fuel cell thermal models can be categorized as cell-level, stack-level, and
system-level models based on the boundaries of the studied domain. Depending on the
level of study, analytical or numerical approach can be adopted.
1.2.1 Analytical Models: System-level
Due to the complexity of PEMFC systems, system-level models do not include
temperature gradient within the fuel cell stack. Most of the system-level thermal
management studies in the literature are either experimental or simplified analytical
models that consider isothermal condition for the fuel cell stack.
Xue et al. [6] presented a zero-dimensional (lumped) dynamic model to
investigate the mixed effects of temperature, gas flow, and capacitance, with an emphasis
on system transient behaviour. In their thermal model, only the convective heat transfer
to the surrounding was considered. Another transient lumped model was developed by
Yu and Jung [7]. They evaluated the control algorithms of cooling module for the thermal
management of a PEMFC.
Bao et al. [8] developed a system-level model to analyze the effect of air
stoichiometric ratio and the cathode outlet pressure on thermal loads of different
components of a fuel cell system, including fuel cell stack, radiator, condenser, and,
membrane humidifier.
5
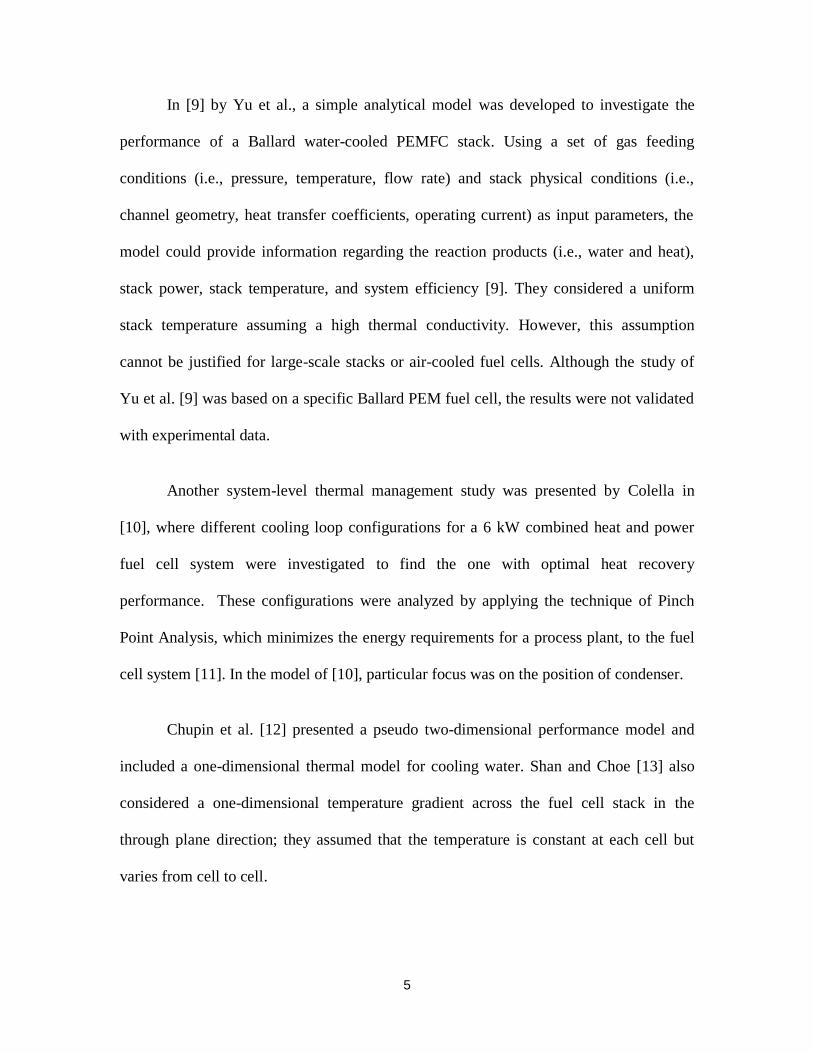
In [9] by Yu et al., a simple analytical model was developed to investigate the
performance of a Ballard water-cooled PEMFC stack. Using a set of gas feeding
conditions (i.e., pressure, temperature, flow rate) and stack physical conditions (i.e.,
channel geometry, heat transfer coefficients, operating current) as input parameters, the
model could provide information regarding the reaction products (i.e., water and heat),
stack power, stack temperature, and system efficiency [9]. They considered a uniform
stack temperature assuming a high thermal conductivity. However, this assumption
cannot be justified for large-scale stacks or air-cooled fuel cells. Although the study of
Yu et al. [9] was based on a specific Ballard PEM fuel cell, the results were not validated
with experimental data.
Another system-level thermal management study was presented by Colella in
[10], where different cooling loop configurations for a 6 kW combined heat and power
fuel cell system were investigated to find the one with optimal heat recovery
performance. These configurations were analyzed by applying the technique of Pinch
Point Analysis, which minimizes the energy requirements for a process plant, to the fuel
cell system [11]. In the model of [10], particular focus was on the position of condenser.
Chupin et al. [12] presented a pseudo two-dimensional performance model and
included a one-dimensional thermal model for cooling water. Shan and Choe [13] also
considered a one-dimensional temperature gradient across the fuel cell stack in the
through plane direction; they assumed that the temperature is constant at each cell but
varies from cell to cell.
6
1.2.2 CFD-based Models
There also exist several computational fluid dynamics (CFD) models of PEMFCs.
A literature overview of models, ranging from one-dimensional, single-component to
complete three-dimensional, large-scale setups, was presented by Siegel in [14] with an
emphasis on heat and mass transfer. His review included modeling strategies and
commonly used assumptions, solver implementations, popular numerical algorithms, and
computational techniques. In addition, an overview of commonly used simulation
software for fuel cell modeling was given in [14].
Among the CFD-based models that considered heat transfer, Yu and Jung [15]
developed a two-dimensional numerical thermal model of a PEMFC and investigated a
thermal management system for fuel cells with large active cell areas. Their fuel cell
model was composed of sub-models for the water transport through the membrane
electrolyte, the electrochemical reaction in the cathode catalyst layer and the temperature
distribution within the fuel cell. Their heat transfer sub-model was focused on heat
rejection from the fuel cell into the cooling water and included the conduction heat
transfer inside the MEA and convective heat rejection from MEA to cooling water flow
and gases. The thermal management system model of [15] included radiator, cooling
pump and fan for investigating the trade-off between the temperature distribution effect
and parasitic losses.
Pharoah and Burheim [16] presented a two-dimensional thermal model and
obtained temperature distributions in a PEMFC in the plane normal to the cathode flow
direction. In their work, only conductive heat transfer was considered. A three-
dimensional model was developed by Shimpalee and Dutta [17], which solved the energy

7
equation to predict the temperature distribution inside a straight channel PEMFC. They
analyzed the effect of heat produced by the electrochemical reactions on the fuel cell
performance.
Adzakpa et al. [18] developed a three-dimensional dynamic model of a single cell
to explain phenomena such as the cell humidity and voltage degradations. Their heat
transfer model included the conduction and heat generation inside the fuel cell and the
convection on the outer surface. Convective heat transfer inside the fuel cell was not
considered in the model of [18]. A comprehensive three-dimensional model that included
analysis of species, heat, and charge transport in a single-channel unit cell, was presented
by Sinha and Wang [19]. They investigated the performance of a PEMFC operating at
high temperature. In their thermal model, a constant temperature condition was applied
on all the external boundaries of the fuel cell.
Ju et al. [20] presented a three-dimensional, thermal model coupled with
electrochemical and mass transport models in order to study thermal and water
management in PEMFCs. Their numerical simulation shows that the thermal effect on
PEMFC becomes more critical at higher current density and/or lower gas diffusion layer
thermal conductivity.
In the next section, various stack cooling methods with relevant studies in the
open literature are introduced.

8
1.3 Stack Cooling Methods: Overview
There are different cooling methods that can be used in fuel cell systems to
maintain a constant temperature. These include heat spreaders, cooling with cathode air
flow, cooling with separate air flow, water cooling, and cooling with antifreeze/coolant
[2].
1.3.1 Passive Methods
Passive cooling refers to design features used for cooling without power
consumption.
Heat spreaders
Employing heat spreaders with high thermal conductivity in a PEMFC stack is a
passive cooling method. By using heat spreaders, heat can be transferred more efficiently
outside the stack. Heat spreaders can be used to transport heat out of the stack through
conduction, then to dissipate the heat to surrounding air through natural or forced
convection. To add as little extra weight and volume as possible to the stack, high
performance heat spreaders must be used.
Figure 1-2: Schematic of a stack with heat spreaders/fins.

9
Heat pipes
A heat pipe is essentially a passive heat transfer device that combines the
principles of thermal conductivity and phase change and has an extremely high effective
thermal conductivity. Faghri and Guo [21] studied recent applications of heat pipe
technology in fuel cell systems, which include new stack designs with heat pipes to
improve heat transfer as well as work on fuel cell system level design. In their study, in
one design, a bipolar plate was designed with holes, into which micro-heat pipes were
inserted and bonded (see Figure 1-3). In another design proposed in [21], flat heat pipes
were integrated with a carbon bipolar plate for improving thermal control in the fuel cell
stack.
Figure 1-3: Micro-heat pipe embedded in a bipolar plate [21].
Natural cooling with cathode air flow
For a small fuel cell, the cathode air flow can work in one of two modes: natural
convection or forced convection. Natural convection is the simplest way to cool the cell
zand evaporate water at the cathode. This is done with a fairly open structure at the
cathode sides, which will increase the volume of the stack. For small PEM fuel cells (less
10
than 100W), natural convection from air breathing can be sufficient to maintain the cell
temperature.
1.3.2 Active Methods
Forced cooling with cathode air flow
Forced convection airflow is another convenient way to bring the waste heat out
of the stack. This will result in a more compact stack structure and increase the cooling
capability. However, very high cathode air flow velocity or a very large gas channel is
necessary for removal of waste heat. When the power of the fuel cell is high, a more
effective cooling approach must be applied. Essentially, air cooling method is simpler
and needs fewer accessories compared to liquid cooling methods but as the output power
increases, it becomes harder to maintain a uniform temperature distribution within the
stack by air cooling method and the parasitic losses associated with the cooling fan
increase inevitably.
Since the specific heat of air is low, high air flow rate is needed to remove the
generated heat. In addition, the dimensions of air cooling channels should be larger than
those of water cooling channels, which make the stack larger than what it needs to be. On
the other hand, temperature distribution within the stack could be more uniform and the
heat removal would be more efficient by using water cooling method; however, this
method needs more accessories and complicated control schemes.
There are not many studies available in the area of air-cooled fuel cells. Sasmito
et al. [22] developed a two-dimensional numerical model to study the forced-air
convection heat transfer in an open-cathode PEMFC. They considered two-phase flow
11
and solved conservation equations of mass, momentum, species and energy in a single
cell, which represented a fuel cell stack by applying periodic boundary conditions. It was
demonstrated in [22] how the fan power and pressure drop over the cathode flow-fields in
the stack affect the overall performance. Also the local distributions of the dependent
field variables such pressure, temperature, velocity, and concentration were presented in
[22].
The main applications of the air-cooled fuel cell is in portable and backup power
generation, where fuel cell solutions have many advantages over conventional lead-acid
batteries and diesel generators, including extended runtime, high reliability, high
efficiency, and reduced environmental impact.
Cooling with separate air flow
Although simply increasing reactant air flow can remove more heat, too much
reactant air may dry out the proton exchange membrane [1]. In such cases, fuel cells will
generally need a separate reactant air supply and cooling system.
Figure 1-4 illustrates a PEM fuel cell structure with separate cooling plates,
through which air is blown. The advantage of this structure is that it can extract more heat
from the stack without affecting the cathode air flow. Air-cooled designs using a bipolar
plate integrated coolant flow are known for low temperature PEMFC [18, 23]. Different
design concepts for an internally or externally cooled high temperature PEMFC (HT-
PEMFC) have been presented in Ref. [24].

12
Figure 1-4 Schematic of two MEAs and one bipolar plate modified for separate reactant and cooling
air in a PEM fuel cell
Water cooling
For hydrogen PEMFCs larger than 10 kW, it is generally necessary to use water
cooling. Units below 2 kW can be air cooled, and cells between 2 kW and 10 kW need a
careful choice regarding whether air or water cooling should be used [1]. Water cooling
requires a more complex design: the temperature and pressure of the cooling water must
be monitored and the flow of cooling water must be supplied by a water pump. Stack
cooling in direct methanol fuel cells (DMFCs) is relatively simpler, since increasing
circulation of dilute methanol solution at the anode could remove more waste heat from
the stack. The water cooling of PEMFCs gives rise to problems associated with water
management such as preventing the product water from freezing, and rapidly melting any
frozen water during start-up when the fuel cell system is operated in sub-freezing

13
conditions. In such situations, an antifreeze/ coolant is used instead of normal water in the
cooling system.
Most of the PEMFC thermal management studies in the literature are focused on
water-cooling. Asghari et al. [25] designed a thermal management subsystem for a water-
cooled 5kW PEMFC system and numerically studied the cooling flow field performance.
In the CFD based thermal model of [25], experimental polarization curve was used as the
input parameter to calculate the amount of heat generation at different working voltage.
The number of parallel channels in parallel serpentine flow field was selected as the
design parameter of the flow field and its optimum value was obtained by compromising
between the minimum pressure drop of coolant across the flow field and maximum
temperature uniformity within the bipolar plate criteria.
Baek et al. [26] numerically investigated fluid flow and heat transfer in cooling
plates of a water-cooled PEMFC and assessed the performance of different coolant flow
field designs in terms of the maximum temperature, temperature uniformity, and pressure
drop characteristics. According to [26], multi-pass serpentine flow field designs could
significantly improve the uniformity of temperature distribution in a cooling plate
compared with the conventional serpentine flow field designs, while a similar
maintaining the coolant pressure drop. The model of [26] only considers the cooling plate
and does not provide temperature distribution inside the stack.
Kurina et al. [27] addressed the heat transfer performance of various cooling
channel designs including parallel, serpentine, wavy, and, coiled. In their study, the
cooling channel was designed to be placed on top of an electronic chip, which dissipates

14
heat at a constant flux. The results can be used for thermal management of PEMFC and
battery stacks as well.
Song et al. [28] designed a stack cooling system for a high-temperature (above
100◦C) water-cooled PEMFC. They implemented a pumpless cooling concept using the
phase-change latent heat of water to decrease the parasitic power required for operating
the system. This concept was based on the buoyancy force caused by the density
difference between vapour and liquid when operated above boiling temperate, which was
utilized to circulate the coolant between the stack and the cooling device.
1.3.3 Experimental Studies
Park and Caton [29] experimentally investigated the effect of air relative humidity
on performance and temperature of a PEMFC stack and showed that fully hydrated inlet
gases play a positive role both for water transport and to maintain the fuel cell stack
temperature to prevent stack drying.
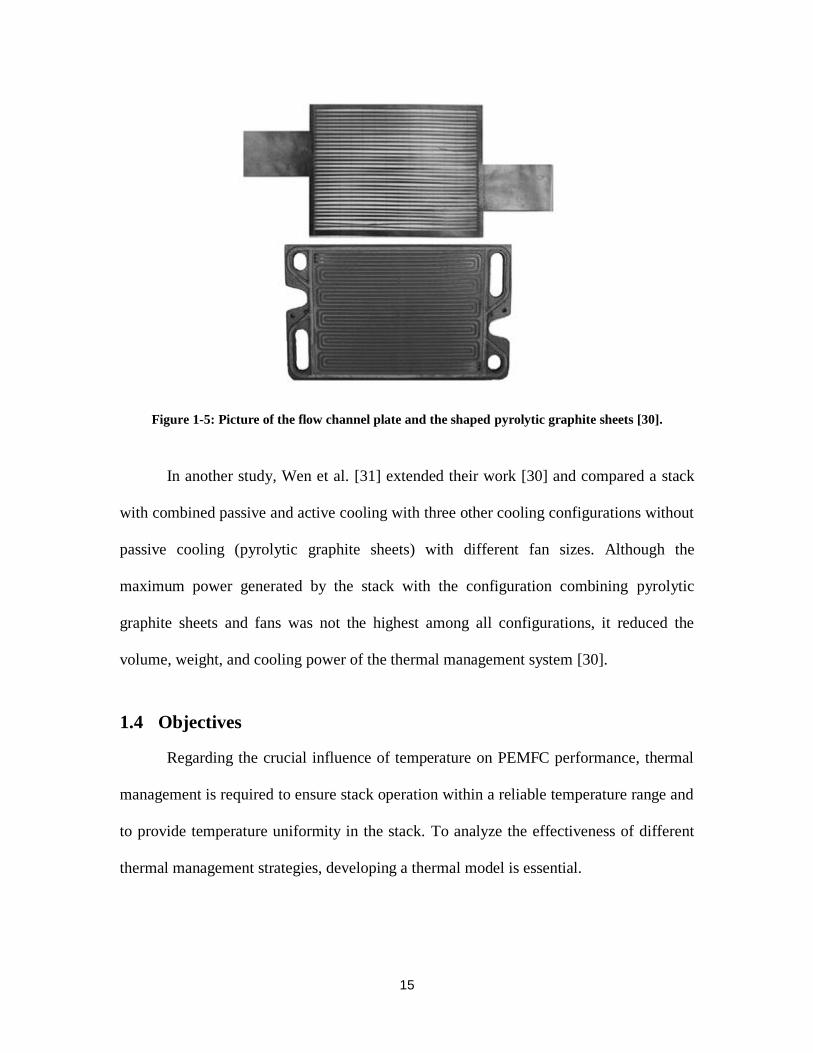
Wen et al. [30] experimentally investigated the effects of the pyrolytic graphite
sheets on the performance and thermal management of a PEMFC stack. In their
experiment, these graphite sheets were cut into the shape of flow channels and bounded
to the cathode gas channel plates.
The features of pyrolytic graphite sheets are light weight and high thermal
conductivity, which make it possible to use them as heat spreaders in the fuel cell stack to
reduce the volume and weight of cooling systems and to homogenize the temperature in
the reaction areas. It was shown in [30] that the maximum power of the stack can be
increased more than 15% with pyrolytic graphite sheets attached.
15
Figure 1-5: Picture of the flow channel plate and the shaped pyrolytic graphite sheets [30].
In another study, Wen et al. [31] extended their work [30] and compared a stack
with combined passive and active cooling with three other cooling configurations without
passive cooling (pyrolytic graphite sheets) with different fan sizes. Although the
maximum power generated by the stack with the configuration combining pyrolytic
graphite sheets and fans was not the highest among all configurations, it reduced the
volume, weight, and cooling power of the thermal management system [30].
1.4 Objectives
Regarding the crucial influence of temperature on PEMFC performance, thermal
management is required to ensure stack operation within a reliable temperature range and
to provide temperature uniformity in the stack. To analyze the effectiveness of different
thermal management strategies, developing a thermal model is essential.
16
Accurately studying of heat transfer in a PEMFC requires consideration of the
three-dimensional effects. However, the majority of the available numerical models are
either not three-dimensional or are complex and involve high computational cost that
makes it almost impossible to do parametric studies.
Our objective is to develop a three-dimensional thermal model of a PEMFC stack
with reasonable computational cost, in order to predict temperature distribution and heat
transfer coefficients and to analyze different thermal management strategies and do
parametric studies. The focus is on air-cooled PEMFCs, in which forced convection heat
transfer inside the stack plays an important role. Air-cooled fuel cell systems combines
the cooling function with the cathode flow field and thus eliminates many of the auxiliary
systems required for conventional fuel cell designs and by this mean lowers the overall
cost.
The results of the present model are successfully validated by experimental data
collected by Ballard Power Systems. In this study, the main goal is investigation of heat
transfer in a PEMFC, in order to employ for developing new cooling strategies.
Therefore, in chapter 3, parametric studies are performed to investigate the effects of air
velocity and thermophysical parameters such as bipolar plate and gas diffusion layer
(GDL) thermal conductivity on the stack temperature.
17
2: MODEL DEVELOPMENT
In this chapter, first, we introduce the transport phenomena in PEMFCs with
governing equations that are solved in our model and the assumptions that were
considered. Finally, we validate the results for temperature distribution with experiments.
2.1 Transport phenomena in PEMFCs
The cathode side of the MEA, shown schematically in Figure 1-1, provides a good
illustration of the complex coupling between various transport phenomena in PEMFCs.
The MEA consists of a proton exchange membrane sandwiched between catalyst and gas
diffusion layers, with the latter two components essentially forming the electrode. This
electrode is a buffer zone that facilitates a number of processes [32]:
The conduction of electrons between the current collectors and the
reaction sites.
The conduction of protons between the membrane and catalyst layer.
The transport of the reactants to the catalyst layer.
The transport of heat away from the reaction site primarily through the
solid matrix.
Condensation/evaporation and transport of liquid water and vapour.
One of the most challenging aspects of computational modeling of PEMFCs is the
multi-physics nature of the transport processes, and the coupling between these processes
18
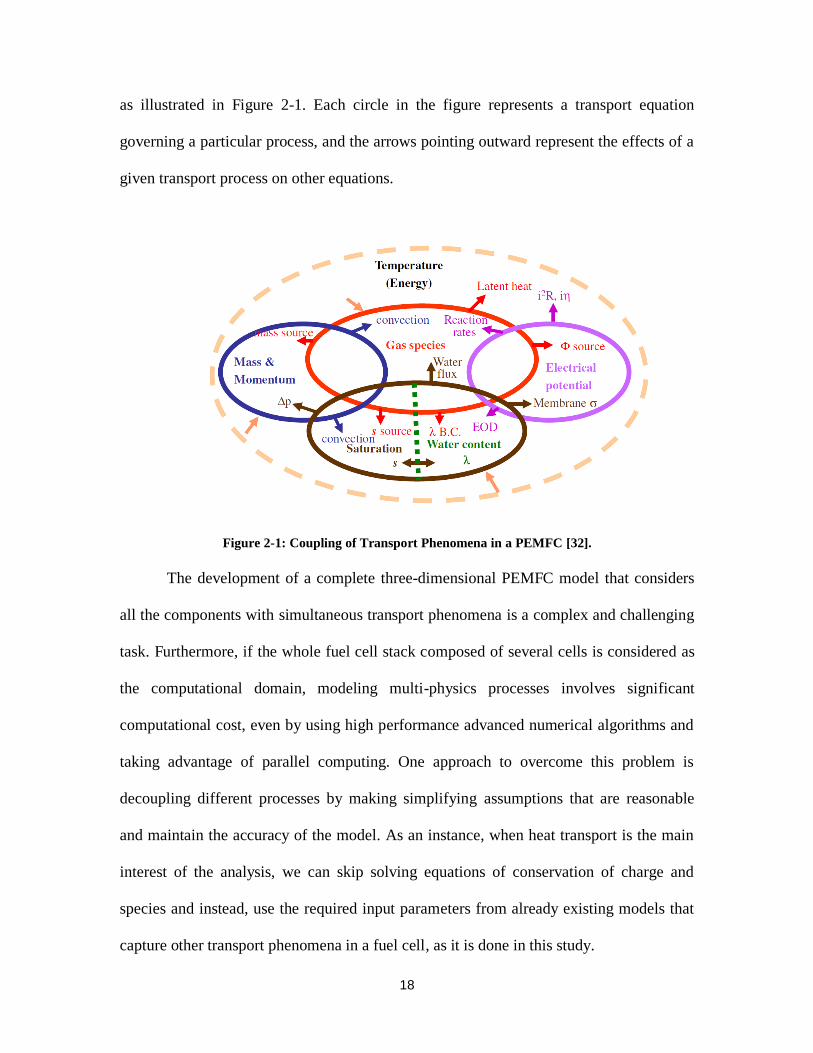
as illustrated in Figure 2-1. Each circle in the figure represents a transport equation
governing a particular process, and the arrows pointing outward represent the effects of a
given transport process on other equations.
Figure 2-1: Coupling of Transport Phenomena in a PEMFC [32].
The development of a complete three-dimensional PEMFC model that considers
all the components with simultaneous transport phenomena is a complex and challenging
task. Furthermore, if the whole fuel cell stack composed of several cells is considered as
the computational domain, modeling multi-physics processes involves significant
computational cost, even by using high performance advanced numerical algorithms and
taking advantage of parallel computing. One approach to overcome this problem is
decoupling different processes by making simplifying assumptions that are reasonable
and maintain the accuracy of the model. As an instance, when heat transport is the main
interest of the analysis, we can skip solving equations of conservation of charge and
species and instead, use the required input parameters from already existing models that
capture other transport phenomena in a fuel cell, as it is done in this study.

19
2.2 Heat Transfer in a Fuel Cell Stack
Figure 2-2 shows the schematic of an air-cooled stack and a single channel and
different modes of heat transfer. Heat transfer modes in a fuel cell stack include:
Natural convection from the outer surface of the stack to ambient air.
Forced convection in the channels and porous layers.
Conductive heat transfer in the solid phase, i.e. bipolar plates, GDLs, and catalyst
coated membrane.
Radiation heat transfer from the stack surface.
(a)
(b)
Figure 2-2 : Schematic of heat transfer (a) in an air-cooled stack and (b) in a single channel
As explained previously, it is desirable to operate the fuel cell system at a
temperature slightly below the maximum allowable temperature. Therefore, predicting
the maximum temperature in a stack is of high importance. Intuitively, one can predict
that the maximum temperature occurs somewhere in the central cells of a fuel cell stack
and the other cells that are closer to the outer surface experience a lower temperature as a
20
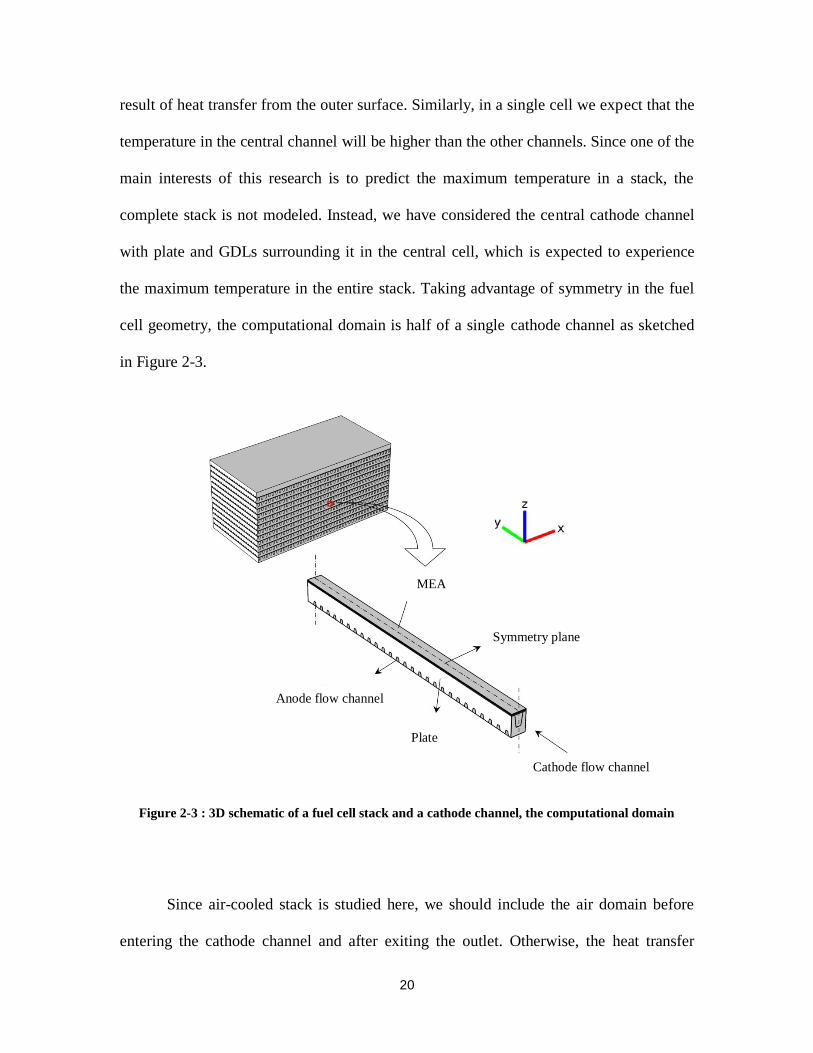
result of heat transfer from the outer surface. Similarly, in a single cell we expect that the
temperature in the central channel will be higher than the other channels. Since one of the
main interests of this research is to predict the maximum temperature in a stack, the
complete stack is not modeled. Instead, we have considered the central cathode channel
with plate and GDLs surrounding it in the central cell, which is expected to experience
the maximum temperature in the entire stack. Taking advantage of symmetry in the fuel
cell geometry, the computational domain is half of a single cathode channel as sketched
in Figure 2-3.
Figure 2-3 : 3D schematic of a fuel cell stack and a cathode channel, the computational domain
Since air-cooled stack is studied here, we should include the air domain before
entering the cathode channel and after exiting the outlet. Otherwise, the heat transfer
Symmetry plane
Cathode flow channel
Plate
Anode flow channel
MEA

21
from the end walls cannot be accurately captured in the model. Even considering an
equivalent convective heat transfer coefficient does not lead to the same results as when
including the air domain in the inlet and outlet. A schematic of the computational domain
including inlet and outlet air is shown in Figure 2-4.
Figure 2-4: 2D schematic of the computational domain including ambient air before and after the
channel; the dark lines on top and bottoms specify the periodic boundary condition.
In the present study, we have considered heat transfer in the entire domain and
laminar fluid flow in the oxidant channel. The convective heat transfer in the hydrogen
channels and porous gas diffusion layers is negligible due to the relatively low velocity of
fluid in these regions. Also, considering the central channel as the computational domain,
it can be shown that radiation heat transfer is negligible since the temperature is not high
and also the surface area of the ends are small compared to the total surface area. The
model inputs are current density, cell voltage, and inlet air temperature and velocity.
y
z
anode channels
MEA
air in cathode channel air out
22
2.3 Governing Equations
In this section, the governing equations that are solved through our modeling
process are described. Since the considered computational domain includes both solid
and fluid sub-domains, the respective equations are presented separately.
2.3.1 Energy Equation
For the solid region, the mechanism of heat transfer is conduction. The energy
equation is as follows:
(2-1)
where is the temperature of the solid region. The term, , is the source term for heat
generation and is assumed to be zero in all the domain except in the cathode catalyst
layer, where the reaction heat is released. The following section describes how this term
is calculated.
2.3.2 Heat Generation
The total heat release from a PEM fuel cell can be derived according to
thermodynamics. In order to determine the amount of heat produced by a fuel cell, an
energy balance for a fuel cell stack can be provided:
(2-2)
where and are the enthalpies of reactants and products respectively. The total
heat generation, , is thus given by:
23
(2-3)
Consider a H2/O2 fuel cell operated at temperature, , pressure, , and current, . The
reversible heat release, , can be written as:
(2-4)
where represents the entropy change of the overall reaction,
, and
the thermodynamic equilibrium potential of the reaction [33]. In addition, there exists
irreversible heat generation due to the cell operated at a different voltage, , from the
equilibrium, . This additional heat generation rate is given by:
(2-5)
where is the Gibbs free energy change of the H2/O2 reaction. This irreversible heat
generation is attributed to ohmic and activation polarizations in a PEMFC. The total heat
generation, , is thus given by:
(2-6)
Notice that the first term on the right side of equation ( 2-6) is the maximum
chemical power available from the overall reaction and the second term is the actual
electrical power produced by a fuel cell. The energy efficiency can then be conveniently
defined as the ratio of these two terms.
24
(2-7)
The heat calculated using equation (2-6) can be approximated by the following equation
[12]:
(2-8)
where is the number of cells in a stack and is the maximum voltage obtained if the
hydrogen heating value or enthalpy of formation were transformed into electrical energy,
and is given by [1]:
(2-9)
The enthalpy of formation of water vapour at 25℃, 100 kPa is -241,826 kJ/kmol.
Therefore, if the lower heating value (LHV) is used, (25℃)=1.253 V. The cases in
which water finally ends in liquid form are so few [1]. So we will restrict the analysis to
the vapour case.
if using HHV
or if using LHV
must be transferred away from the cell to maintain a steady operating
temperature for the fuel cell. It should be noted that by using the LHV, the cooling effect
of evaporation is implicitly included in heat production of equation ( 2-8). It also means
that energy is leaving the fuel cell in three forms: as electricity, as ordinary sensible heat,
and as the latent heat of water vapour.
25
In this study, we use and from experimental measurements. In future work,
a performance model will be integrated with the current thermal model, from which
and can be calculated.
Due to symmetry, we have solved the equations in half of the domain. The
symmetry boundary condition is applied on the side walls, which is equivalent to no heat
flux in the normal direction across this boundary. Also periodic heat condition is applied
on the top and bottom surfaces of the cell, where it contacts the adjacent cells in the
stack. This boundary condition implies that (at ) (at ) and also (at
) (at ) (see axes in Figure 2-3).
2.3.3 Fluid Flow
For the fluid region, continuous, steady state, laminar (Re < 800), incompressible
flow (Ma < 0.3) is assumed; therefore, the mass conservation, momentum principle, and
energy equation are as follows
(2-10)
( 2-11)
( 2-12)
Since the flow is continuous, we have no slip and no temperature jump over the
wall. Therefore, the boundary condition for velocity field is (at wall) and for
temperature field is (at wall) . The flow enters with a constant uniform velocity,
, and constant temperature, . For the fluid flow conditions at the outlet, no viscous
stress along with constant pressure are considered, as follows,

26
( 2-13)
where
is the atmospheric pressure. This boundary condition is physically equivalent
to the flow exiting into a large container. Note that because of the low velocity of
hydrogen in the anode channels, we have neglected the convective heat transfer in anode
side. Therefore, the only governing equation in anode channels is the same as equation
( 2-1). In addition, constant thermophysical properties have been assumed for solid phase
while air properties such as density, heat capacity, dynamic viscosity, and thermal
conductivity vary with temperature. Air density is obtained from ideal gas law.
2.3.4 Natural Convective Heat Transfer
It is expected that most of the generated heat in a fuel cell stack will be removed
by the forced air flow; however, some smaller portions of the heat may be removed by
free convection from stack faces to surrounding. To predict the maximum temperature in
the stack, we neglected the effect of free convection and considered an insulated channel.
However, to investigate the effect of heat removal by the free convection, we have solved
other cases in which natural convective heat transfer from bipolar plate edges to
surrounding is included in the numerical model. Heat convection coefficients are
separately determined for vertical and horizontal edges by governing relations (2-14)-
( 2-17) from Incropera and DeWitt [34]:
( 2-14)
27
( 2-15)
( 2-16)
( 2-17)
2.3.5 Transport of Species
In this section, we study the equations governing the transport of water vapour
produced by the chemical reaction in cathode channel. The rate of water generation is
derived by equation ( 2-18).
(2-18)
The transport of water vapour in the air stream takes place through convection and
diffusion. We have used the Transport of Diluted Species interface in COMSOL
Multiphysics 4.0a, which enables us to model the evolution of chemical species
transported by diffusion and convection. This interface assumes that all present species
are dilute, i.e. their concentration is small compared to a solvent fluid. As a rule of
thumb, a mixture containing several species can be considered dilute when the molar
concentration of the solvent is more than 90%. Due to the dilution, mixture properties
such as density and viscosity can be assumed to correspond to those of the solvent.
When the diffusing species is dilute with respect to a solvent, Fick’s law is
adequate to describe the diffusive transport in the flux vector. As a result, the mass
balance equation can be written in the form of equation ( 2-19).
28
(2-19)
where the dependent variable, , is the concentration of the species (mol/m3) , denotes
the diffusion coefficient (m2/s), is a reaction rate expression for the species (mol/m
3·s),
and, is the velocity vector (m/s) .
The first term on the left-hand side of equation ( 2-19) corresponds to the
accumulation (or consumption) of the species. The second term accounts for the
convective transport due to the velocity field, . This field is obtained from coupling
mass balance to momentum balance. On the right-hand side of the mass balance equation
(equation ( 2-19)), the first term describes the diffusion transport, accounting for
interaction between the dilute species and the solvent.
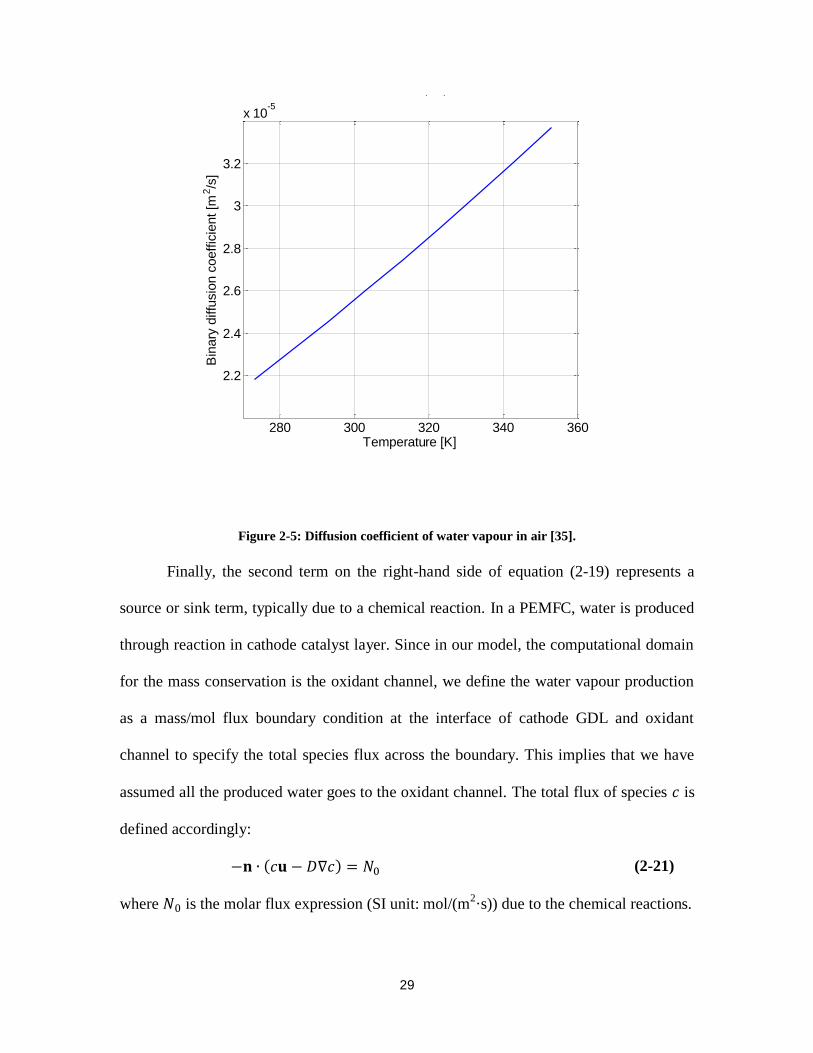
The diffusion coefficient of water vapour in air depends on temperature and can
be described by the following relation proposed by Bolz and Tuve [35], plotted in
Figure 2-5.
(2-20)
29
Figure 2-5: Diffusion coefficient of water vapour in air [35].
Finally, the second term on the right-hand side of equation ( 2-19) represents a
source or sink term, typically due to a chemical reaction. In a PEMFC, water is produced
through reaction in cathode catalyst layer. Since in our model, the computational domain
for the mass conservation is the oxidant channel, we define the water vapour production
as a mass/mol flux boundary condition at the interface of cathode GDL and oxidant
channel to specify the total species flux across the boundary. This implies that we have
assumed all the produced water goes to the oxidant channel. The total flux of species is
defined accordingly:
(2-21)
where is the molar flux expression (SI unit: mol/(m2·s)) due to the chemical reactions.
280 300 320 340 360
2.2
2.4
2.6
2.8
3
3.2
x 10-5
Temperature [K]
Bin
ary
diffu
sio
n c
oeffic
ient [m
2/s
]
Bolz and Tuve (1976)
30
(2-22)
At the inlet, air relative humidity is known. As such, the boundary condition at the
inlet is constant concentration: (SI unit: mol/m3). The inlet concentration is
calculated using equations ( 2-23)-( 2-26).
(2-23)
(2-24)
(2-25)
(2-26)
where , , , , , and,
are the inlet vapour mass fraction, air density,
humidity ratio, vapour partial pressure, and saturated pressure respectively.
At the outlet, the species is transported out of the model domain by the fluid flow.
In mass transport models where it can be assumed that convection is the dominating
effect which causes the mass flow through the outflow boundary, the diffusive effect
from this boundary can be ignored, such that:
(2-27)
This is a useful boundary condition, particularly, in convection-dominated mass
balances where the outlet concentration is unknown.
We have used symmetry and periodic boundary conditions, similar to those for
solving momentum and energy equations.
31
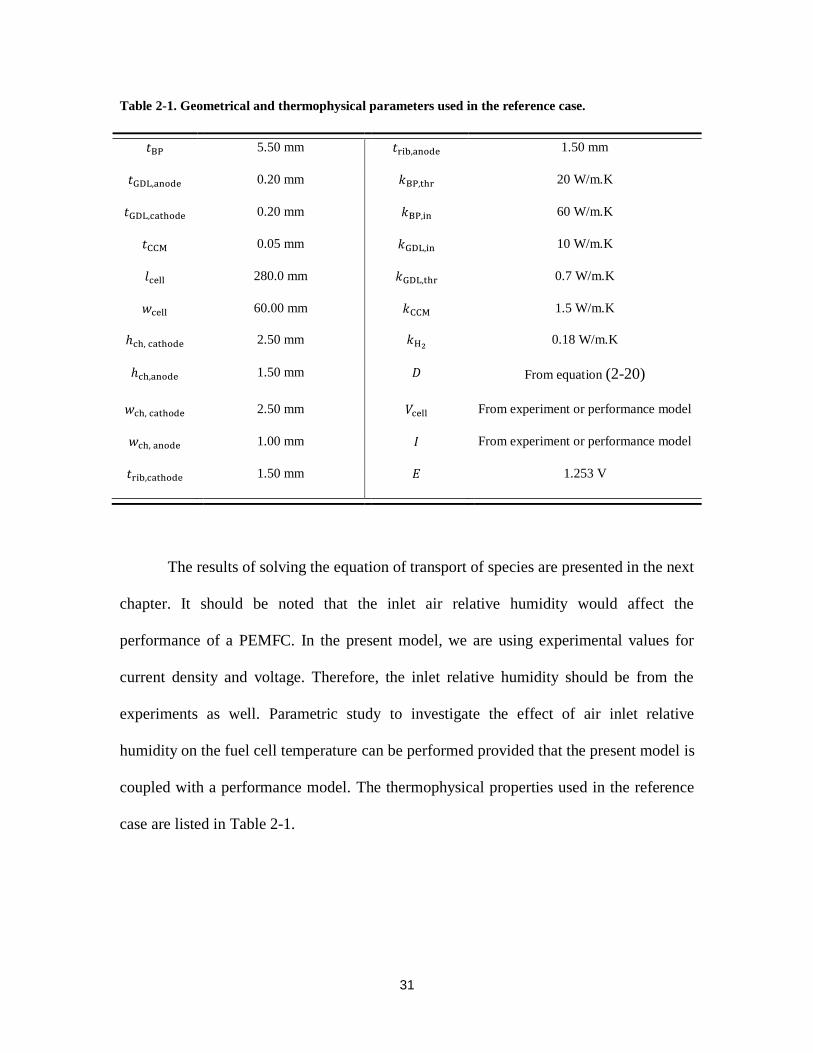
Table 2-1. Geometrical and thermophysical parameters used in the reference case.
5.50 mm 1.50 mm
0.20 mm 20 W/m.K
0.20 mm 60 W/m.K
0.05 mm 10 W/m.K
280.0 mm 0.7 W/m.K
60.00 mm 1.5 W/m.K
2.50 mm 0.18 W/m.K
1.50 mm From equation ( 2-20)
2.50 mm From experiment or performance model
1.00 mm From experiment or performance model
1.50 mm 1.253 V
The results of solving the equation of transport of species are presented in the next
chapter. It should be noted that the inlet air relative humidity would affect the
performance of a PEMFC. In the present model, we are using experimental values for
current density and voltage. Therefore, the inlet relative humidity should be from the
experiments as well. Parametric study to investigate the effect of air inlet relative
humidity on the fuel cell temperature can be performed provided that the present model is
coupled with a performance model. The thermophysical properties used in the reference
case are listed in Table 2-1.
32
2.4 Summary of Assumptions
The following is a summary of the assumptions we made to model the fluid flow
and heat transfer in an air-cooled PEMFC stack. Each of these assumptions is explained
in the relevant sections.
Continuous, steady state, laminar (Re<800), incompressible flow (Ma<0.3)
was assumed.
The central channel was considered to be insulated.
Convective heat transfer in anode channel and GDL was neglected.
Constant thermo-physical properties were assumed for the solid phase.
Radiation heat transfer was neglected (based on scale analysis).
Uniform heat generation in MEA was considered.
LHV was used for heat generation.
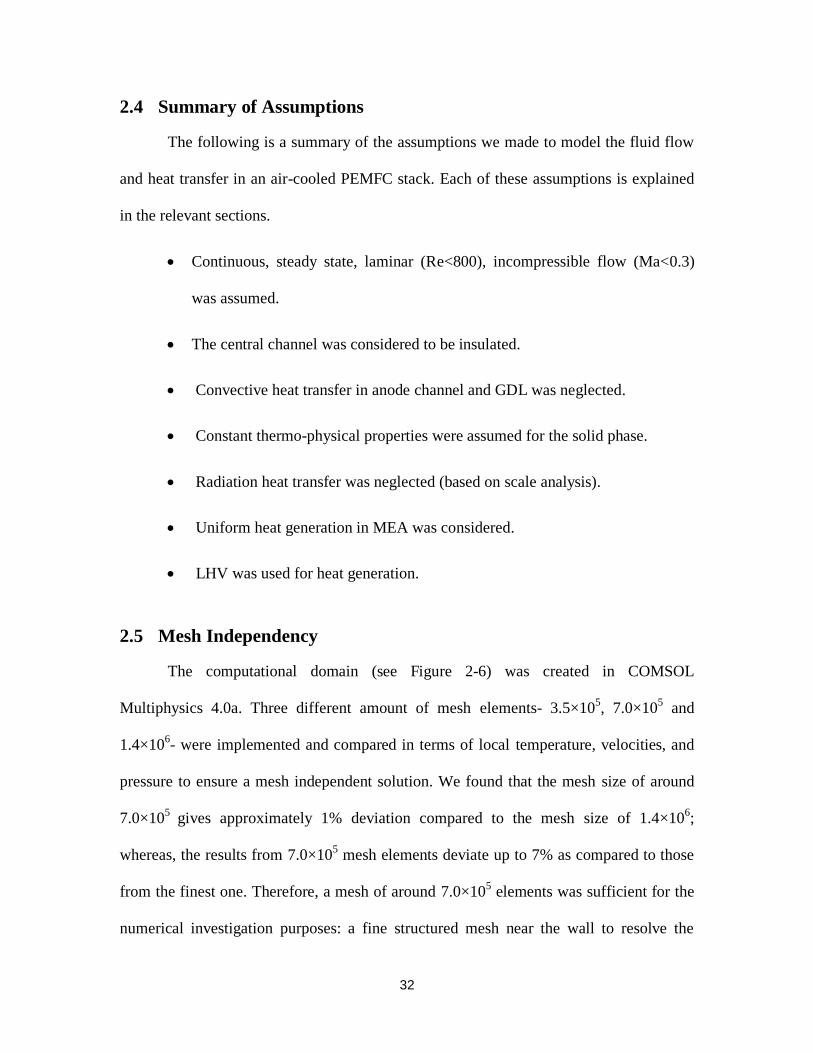
2.5 Mesh Independency
The computational domain (see Figure 2-6) was created in COMSOL
Multiphysics 4.0a. Three different amount of mesh elements- 3.5×10⁵, 7.0×10
5 and
1.4×10⁶- were implemented and compared in terms of local temperature, velocities, and
pressure to ensure a mesh independent solution. We found that the mesh size of around
7.0×10⁵
gives approximately 1% deviation compared to the mesh size of 1.4×10⁶;
whereas, the results from 7.0×10⁵ mesh elements deviate up to 7% as compared to those
from the finest one. Therefore, a mesh of around 7.0×10⁵ elements was sufficient for the
numerical investigation purposes: a fine structured mesh near the wall to resolve the
33
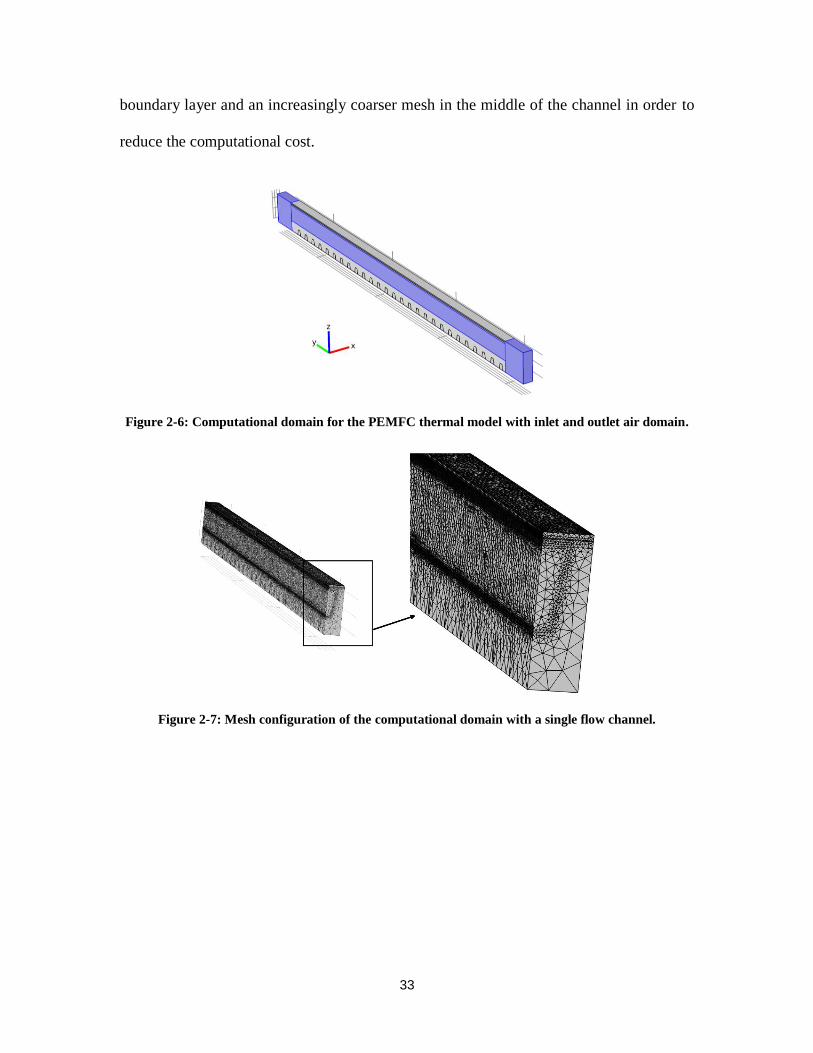
boundary layer and an increasingly coarser mesh in the middle of the channel in order to
reduce the computational cost.
Figure 2-6: Computational domain for the PEMFC thermal model with inlet and outlet air domain.
Figure 2-7: Mesh configuration of the computational domain with a single flow channel.

34
3: RESULTS AND DISCUSSION
For solving the system of partial differential equations explained in chapter 3, we
have used COMSOL Multiphysics 4.0a. Grid independency was checked by solving a
case study using different element size, which led to identical results. In our
base/reference case (describe in Table 2-1), the inlet air velocity was selected 3.0 m/s, the
inlet air temperature was 20℃, and the total heat generated in one cell, was 36W.
Assuming 60 channels in one cell, the total heat generated in the domain (half channel)
was 0.3W.
3.1 Base Case Results
Figure 3-1 shows the temperature contours in the middle cross section of the
channel. A uniform temperature distribution in the solid region is observed, whereas
relatively high temperature gradient exists in the flow channel. Also in Figure 3-2,
temperature contours are shown in different sections along the channel. For better
description of temperature distribution in the solid and fluid regions, their temperature
variations along , , and directions are plotted in Figure 3-3 and Figure 3-4. The
horizontal axis shows the normalized location: , where ,
, and , specify the boundaries of the domain in , , and .

35
Figure 3-1: Temperature contours in the middle cross section of the channel (reference case).
Figure 3-2: Temperature contours in eight slices from inlet to outlet of the channel (reference case).
36
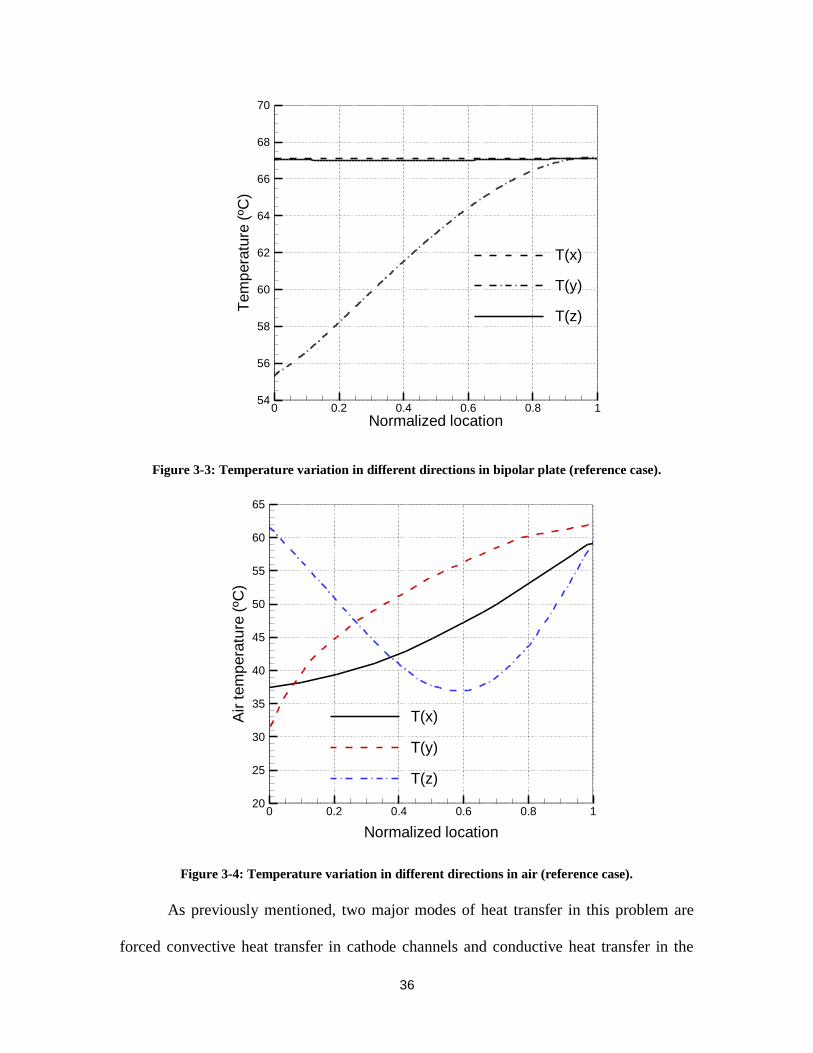
Figure 3-3: Temperature variation in different directions in bipolar plate (reference case).
Figure 3-4: Temperature variation in different directions in air (reference case).
As previously mentioned, two major modes of heat transfer in this problem are
forced convective heat transfer in cathode channels and conductive heat transfer in the
Normalized location
Tem
pera
ture
(ºC
)
0 0.2 0.4 0.6 0.8 154
56
58
60
62
64
66
68
70
T(x)
T(y)
T(z)
Normalized location
Air
tem
pera
ture
(ºC
)
0 0.2 0.4 0.6 0.8 120
25
30
35
40
45
50
55
60
65
T(x)
T(y)
T(z)
37
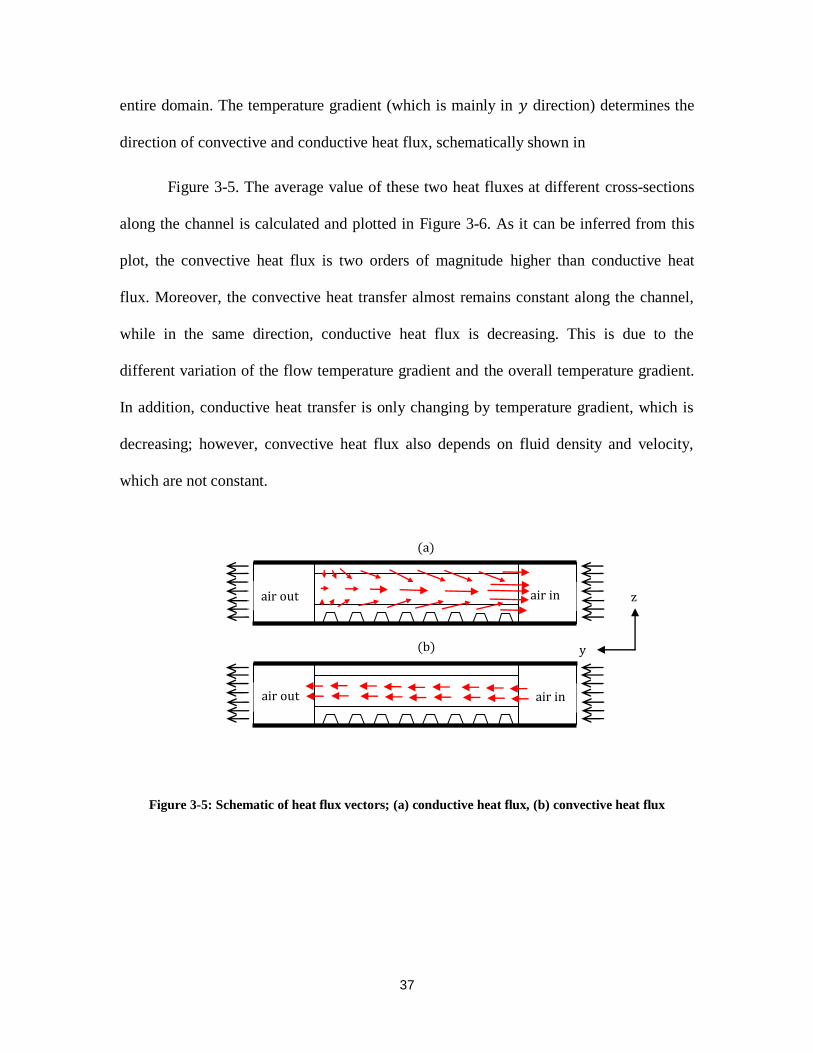
entire domain. The temperature gradient (which is mainly in direction) determines the
direction of convective and conductive heat flux, schematically shown in
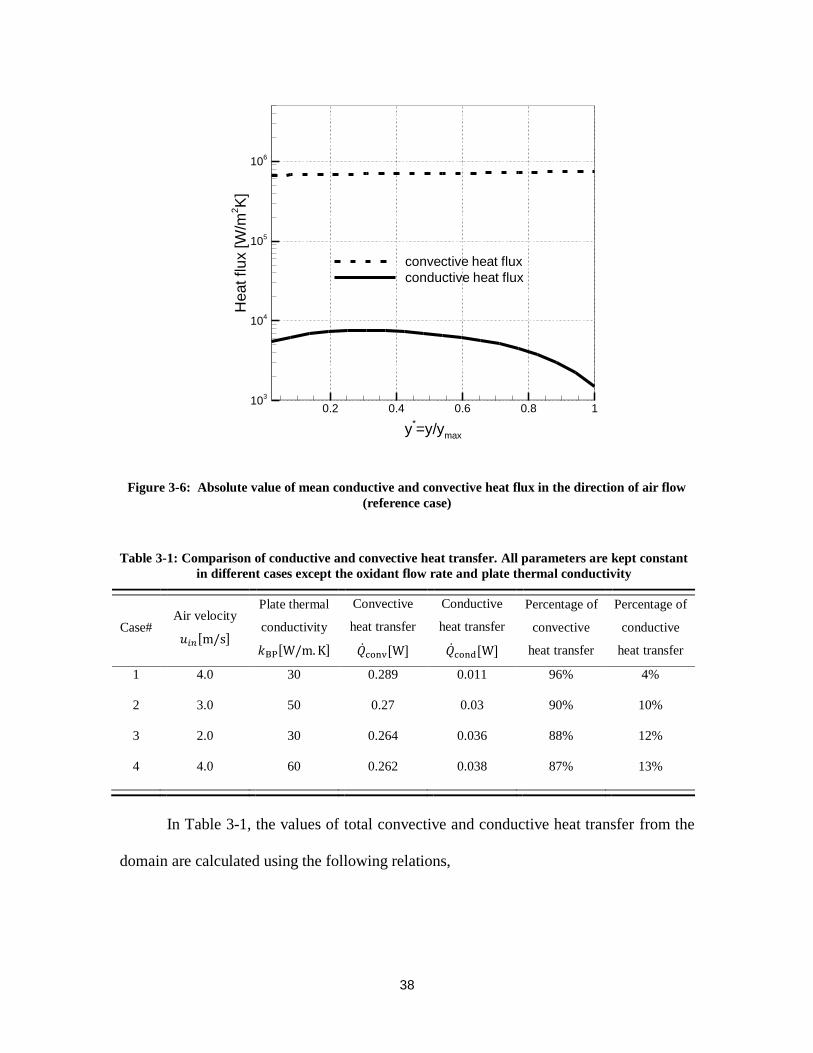
Figure 3-5. The average value of these two heat fluxes at different cross-sections
along the channel is calculated and plotted in Figure 3-6. As it can be inferred from this
plot, the convective heat flux is two orders of magnitude higher than conductive heat
flux. Moreover, the convective heat transfer almost remains constant along the channel,
while in the same direction, conductive heat flux is decreasing. This is due to the
different variation of the flow temperature gradient and the overall temperature gradient.
In addition, conductive heat transfer is only changing by temperature gradient, which is
decreasing; however, convective heat flux also depends on fluid density and velocity,
which are not constant.
Figure 3-5: Schematic of heat flux vectors; (a) conductive heat flux, (b) convective heat flux
y
z
air in air out
air in air out
(a)
(b)
38
Figure 3-6: Absolute value of mean conductive and convective heat flux in the direction of air flow
(reference case)
Table 3-1: Comparison of conductive and convective heat transfer. All parameters are kept constant
in different cases except the oxidant flow rate and plate thermal conductivity
Case# Air velocity
Plate thermal
conductivity
Convective
heat transfer
Conductive
heat transfer
Percentage of
convective
heat transfer
Percentage of
conductive
heat transfer
1 4.0 30 0.289 0.011 96% 4%
2 3.0 50 0.27 0.03 90% 10%
3 2.0 30 0.264 0.036 88% 12%
4 4.0 60 0.262 0.038 87% 13%
In Table 3-1, the values of total convective and conductive heat transfer from the
domain are calculated using the following relations,
y*=y/y
max
Heatflu
x[W
/m2K
]
0.2 0.4 0.6 0.8 110
3
104
105
106
convective heat flux
conductive heat flux

39
( 3-1)
( 3-2)
where, and are the air mean temperatures calculated from ( 3-3), at the inlet
and outlet of the channel, respectively and and or the cross-sectional area of the
solid walls in the inlet and outlet.
( 3-3)
Also, the percentage of each type of heat transfer, under different conditions (air
velocity and plate thermal conductivity), are compared in Table 3-1. In higher air
velocities, convection is the major part of heat transfer, and the contribution of
conductive heat transfer becomes more important as the plate thermal conductivity
increases.
For the reference case, we have also solved the equation of conservation of
species. Adding the air relative humidity to our model does not affect the temperature
distribution directly. Relative humidity has impact on the ionic conductivity of the
membrane and by this means influences the output voltage and current. Therefore, as
long as we provide experimental values for voltage and current we do not need to solve
the equation of species transport to predict the temperature field. In order to see the direct
impact of air relative humidity on temperature, a performance model should be integrated
to the present thermal model.

40
Figure 3-7 and Figure 3-8 respectively, show water vapour mass fraction and
relative humidity distribution in the cathode channel for the reference case. There is a
mass flux from the top surface of the channel; consequently, the mass fraction of water
vapour increases along the channel. In the studied case, the inlet relative humidity is 30%
and the outlet is 11%. The local relative humidity has its maximum value (43%)
approximately 1 cm from the cathode inlet.
Figure 3-7: Water vapour mass fraction distribution in cathode channel
Figure 3-8: Relative humidity distribution in cathode channel
The variation of average value of relative humidity and water vapour mass
fraction is plotted in Figure 3-9. Two factors affect the relative humidity: water vapour

41
accumulation and temperature. Although water vapour diffuses to the channel, it is
noteworthy to observe that the average relative humidity is decreasing along the channel.
This is due to the temperature rise in the air flow, which increases the saturation pressure
and controls the relative humidity. The relative humidity is the ratio of vapour partial
pressure to the saturation pressure at the same temperature:
(3-4)
In Figure 3-9, the horizontal axis starts from the inlet of the channel. Since the air
temperature goes up slightly before entering the channel, relative humidity is less than
30% at the cathode inlet.
Figure 3-9: Relative humidity and vapour mass fraction along the cathode channel
y*=y/ymax
Rela
tive
hu
mid
ity
(%)
Vap
ou
rm
ass
fractio
n
0 0.2 0.4 0.6 0.8 110
12
14
16
18
20
22
24
26
0.004
0.006
0.008
0.010
0.012

42
3.2 Model Validation
3.2.1 Comparison with Experiments
For validating the present model, simulations under certain conditions have been
performed and compared with the experimental data provided by Ballard Power Systems
for an air-cooled fuel cell stack consisting of 28 cells. We have used the experimental
operating conditions as input to our model. The temperature was measured using
thermocouples located in different locations in the fuel cell stack. The maximum
measured temperature was at the central cell of the stack as expected. In these
experiments, the inlet air temperature was constant at room temperature while the air
velocity and heat generation were varying in different cases. The amount of heat
generation was calculated using experimental values of cell current and voltage in
different operating conditions. The velocity was calculated using the fan volumetric flow
rate and area. The results of our model validation are presented in Table 3-2, the last
column of which shows the relative difference between predicted maximum temperature
and experimentally measured maximum temperature. The location of the experimental
temperature measurement is the outlet of the central channel in the middle row of the
stack.

43
Table 3-2. Model validation.
Test #
Air inlet
temperature
℃
Air inlet
velocity,
Heat generated
in one cell,
Maximum temperature, ℃ Relative
difference,
Experiment* Simulation
1 21 2.19 37.7 65 68 4.4%
2 21 1.63 27.6 61 64 4.7%
3 21 1.45 29.1 67 69 2.8%
4 21 0.95 6.3 35 36 2.7%
5 21 0.94 13.7 50 54 7.4%
* Experimental results from Ballard Power Systems
3.2.2 Comparison with Analytical Model
In an earlier study [36], we have developed analytical solutions for velocity and
temperature distributions of laminar fully developed flow of Newtonian, constant
property fluids in channels of various cross-sections. The only limitation for the cross-
section is that it should have at least two symmetry axes. Therefore, we are not able
compare the numerical results of trapezoid channel with the analytical model of [36].
However, it is possible to compare the results of our numerical simulation with the
analytical solution for square or rectangular cross-sections.
In the analytical model, hydrodynamic and thermal characteristics of the flow are
derived. Two important characteristics of convective flow in channels are the Poiseuille
number and the Nusselt number. The Poiseuille number, , is the common
dimensionless number used for analyzing pressure drop in channels and is defined by:
44
(3-5)
where is the hydraulic diameter. The Nusselt number, , is the ratio of convective to
conductive heat transfer normal to the boundary and is defined by:
(3-6)
Using equation ( 3-7), convective heat transfer coefficient, , is calculated from
the temperature distribution. In this equation, is the cross-section perimeter, is the
wall temperature, which is constant at each cross-section, and is the fluid bulk
temperature.
(3-7)
We have modified our reference case geometry to model a cathode channel with
square and rectangular cross-section keeping the cross-sectional area constant. The value
of the Poiseuille calculated from the analytical and numerical models are compared in
Table 3-3 for square and rectangular cross-section with aspect ratio of 0.5. Also Table 3-4
compares the Nusselt number obtained from numerical model and analytical models of
[36] and [37] for isoflux and isotherm boundary conditions. As it can be seen in Table
3-3, the Poiseuille numbers derived from the two approaches are relatively close. The
Nusselt number of the numerical model is higher than that of the analytical solution. The
main reason is due to the different boundary conditions that were applied in the two

45
cases; in the analytical study, constant heat flux was uniformly applied on the channel
walls while in the numerical model, the heat flux was applied only on the top wall of the
channel.
Table 3-3: Comparison of Poiseuille number in rectangular channel derived from the analytical and
numerical models.
Aspect ratio
(Analytical, [36])
(Numerical) Relative difference
1 14.23 15.61 8%
0.5 15.55 16.95 8%
Table 3-4: Comparison of Nusselt number in rectangular channel derived from the analytical and
numerical models.
Aspect
ratio
(Analytical,[37])
(Numerical)
Relative
difference
(Analytical [36])
(Numerical)
Relative
difference
1 3.61 4.2 14% 3.09 4.2 26%
0.5 4.12 3.9 5% 3.02 3.9 22%
Using the new geometries, in addition to comparing the analytical and numerical
results for pressure drop and heat transfer coefficient, we are able to investigate the effect
of channel geometry on the fuel cell temperature. The results for geometrical parametric
study are presented in chapter 4.
46
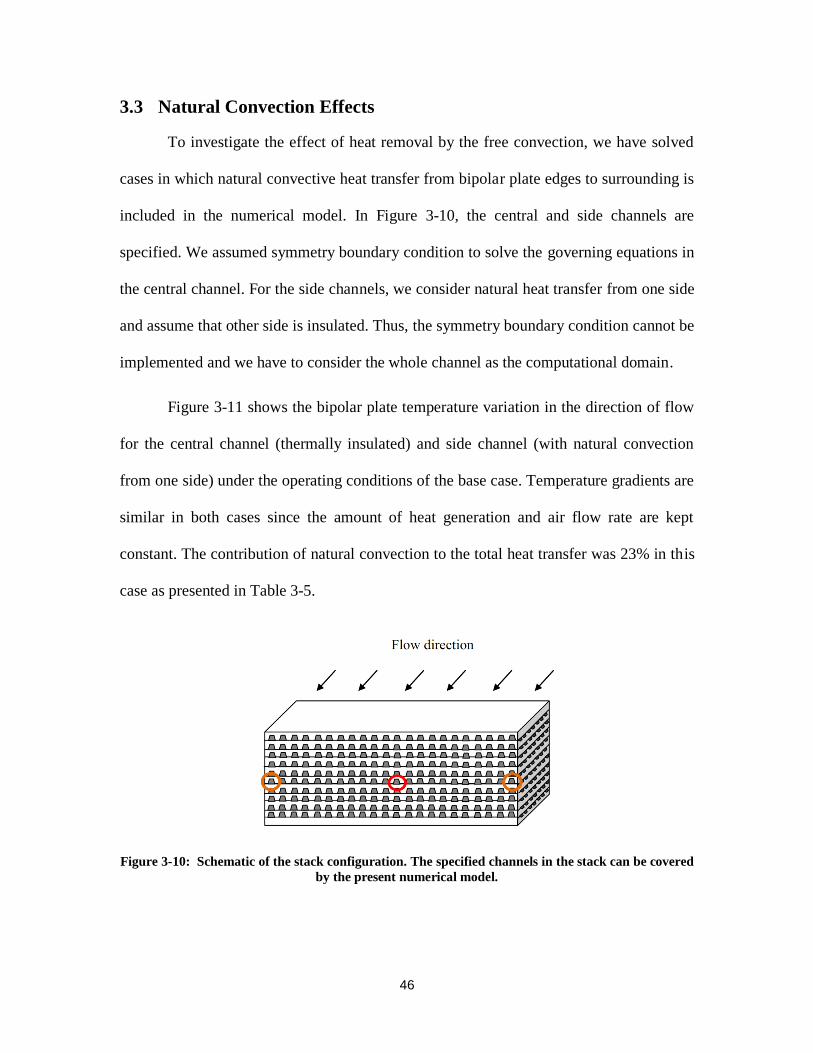
3.3 Natural Convection Effects
To investigate the effect of heat removal by the free convection, we have solved
cases in which natural convective heat transfer from bipolar plate edges to surrounding is
included in the numerical model. In Figure 3-10, the central and side channels are
specified. We assumed symmetry boundary condition to solve the governing equations in
the central channel. For the side channels, we consider natural heat transfer from one side
and assume that other side is insulated. Thus, the symmetry boundary condition cannot be
implemented and we have to consider the whole channel as the computational domain.
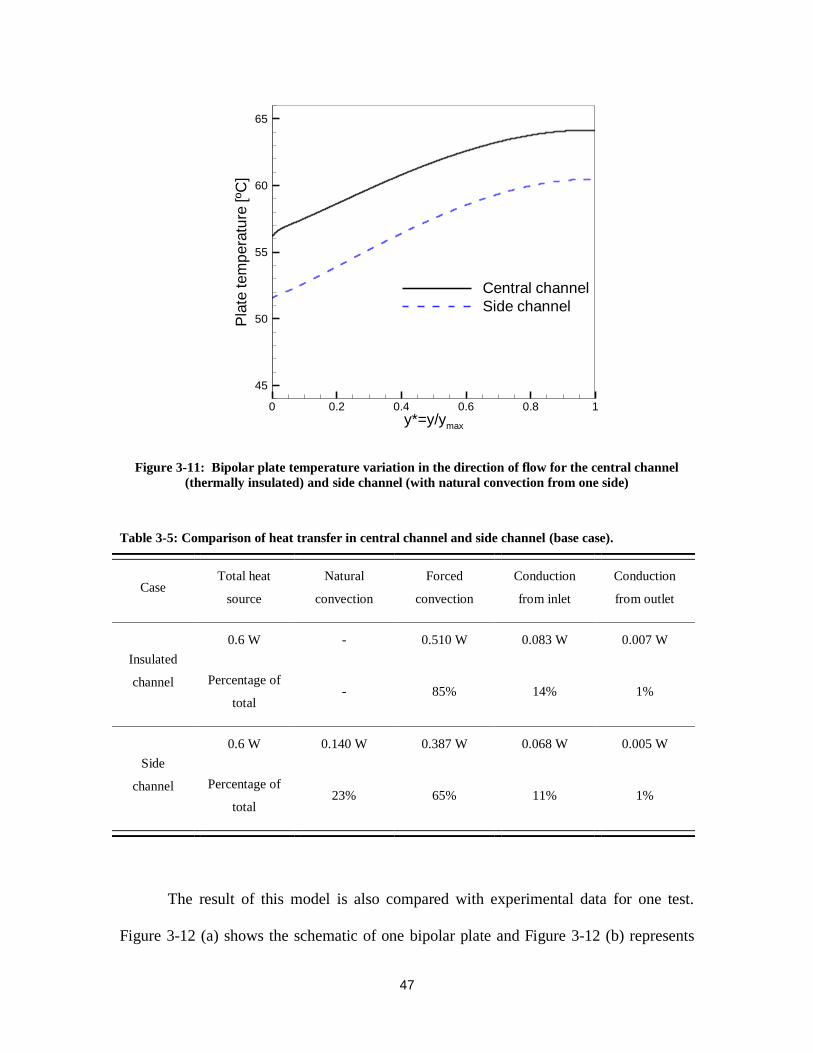
Figure 3-11 shows the bipolar plate temperature variation in the direction of flow
for the central channel (thermally insulated) and side channel (with natural convection
from one side) under the operating conditions of the base case. Temperature gradients are
similar in both cases since the amount of heat generation and air flow rate are kept
constant. The contribution of natural convection to the total heat transfer was 23% in this
case as presented in Table 3-5.
Figure 3-10: Schematic of the stack configuration. The specified channels in the stack can be covered
by the present numerical model.
47
Figure 3-11: Bipolar plate temperature variation in the direction of flow for the central channel
(thermally insulated) and side channel (with natural convection from one side)
Table 3-5: Comparison of heat transfer in central channel and side channel (base case).
Case Total heat
source
Natural
convection
Forced
convection
Conduction
from inlet
Conduction
from outlet
Insulated
channel
0.6 W - 0.510 W 0.083 W 0.007 W
Percentage of
total - 85% 14% 1%
Side
channel
0.6 W 0.140 W 0.387 W 0.068 W 0.005 W
Percentage of
total 23% 65% 11% 1%
The result of this model is also compared with experimental data for one test.
Figure 3-12 (a) shows the schematic of one bipolar plate and Figure 3-12 (b) represents
y*=y/ymax
Pla
tete
mp
era
ture
[ºC
]
0 0.2 0.4 0.6 0.8 1
45
50
55
60
65
Central channel
Side channel

48
the temperature distribution in the plate obtained from interpolation using 24 different
temperature data measured by thermocouples in the central row of the stack. The
experimental and numerical values for the plate temperature in the channel inlet and
outlet are compared for the central and side channels.
Figure 3-12: (a) Bipolar plate configuration, (b) Temperature distribution in one plate, interpolated
using experimental data points. The experimental and numerical values for the inlet and outlet
temperatures are compared for the central and side channels.
(a)
(b)
direction of air flow

49
The relative errors in predicting the maximum and minimum temperature in the
side channel are 5% and 9% respectively. In addition to the simplifying assumptions that
were made in this model, the main sources of error can be: uncertainty in predicting
natural convection heat transfer coefficient, non-uniformity in heat generation in one cell,
and uncertainty in air velocity calculation. Regarding the latter, we have assumed equal
air velocities for different channels, which might not be the real case.
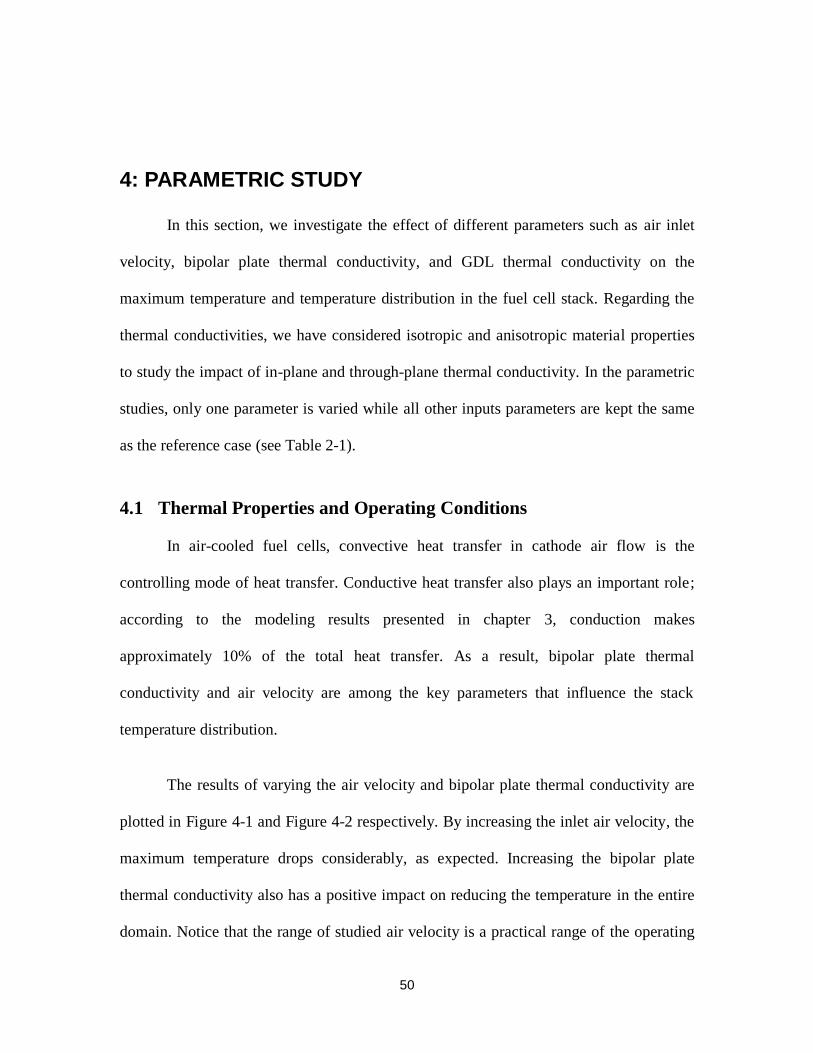
50
4: PARAMETRIC STUDY
In this section, we investigate the effect of different parameters such as air inlet
velocity, bipolar plate thermal conductivity, and GDL thermal conductivity on the
maximum temperature and temperature distribution in the fuel cell stack. Regarding the
thermal conductivities, we have considered isotropic and anisotropic material properties
to study the impact of in-plane and through-plane thermal conductivity. In the parametric
studies, only one parameter is varied while all other inputs parameters are kept the same
as the reference case (see Table 2-1).
4.1 Thermal Properties and Operating Conditions
In air-cooled fuel cells, convective heat transfer in cathode air flow is the
controlling mode of heat transfer. Conductive heat transfer also plays an important role;
according to the modeling results presented in chapter 3, conduction makes
approximately 10% of the total heat transfer. As a result, bipolar plate thermal
conductivity and air velocity are among the key parameters that influence the stack
temperature distribution.
The results of varying the air velocity and bipolar plate thermal conductivity are
plotted in Figure 4-1 and Figure 4-2 respectively. By increasing the inlet air velocity, the
maximum temperature drops considerably, as expected. Increasing the bipolar plate
thermal conductivity also has a positive impact on reducing the temperature in the entire
domain. Notice that the range of studied air velocity is a practical range of the operating
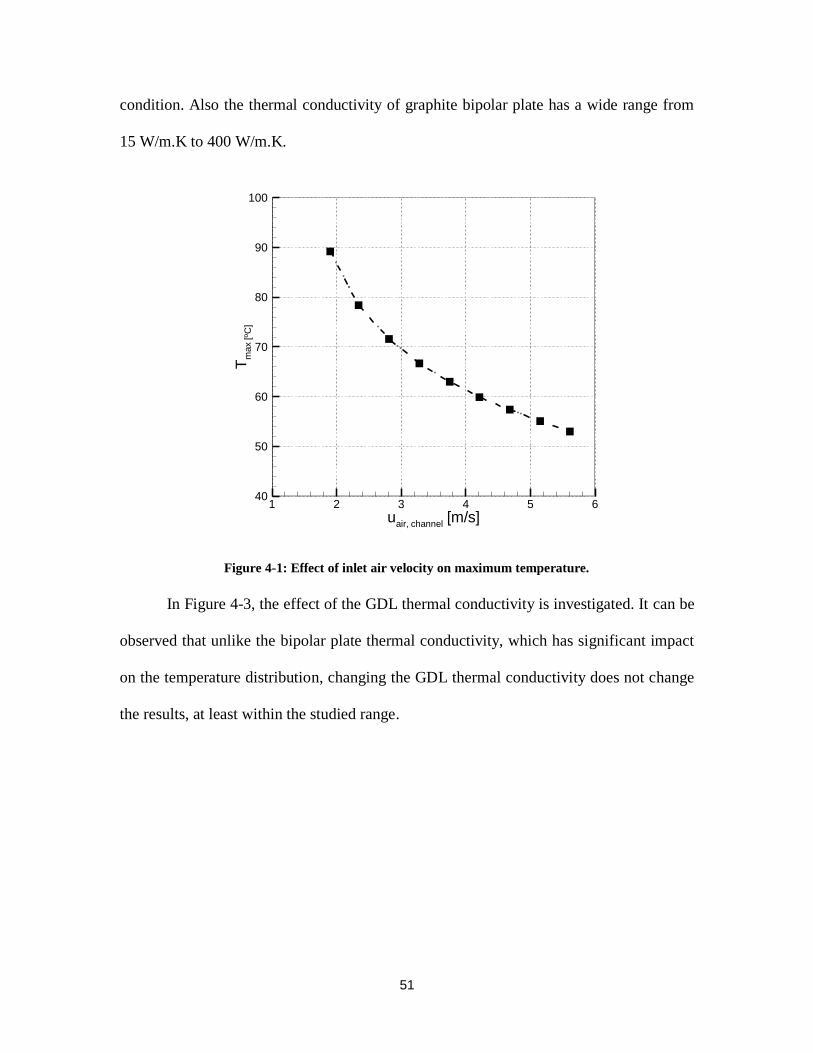
51
condition. Also the thermal conductivity of graphite bipolar plate has a wide range from
15 W/m.K to 400 W/m.K.
Figure 4-1: Effect of inlet air velocity on maximum temperature.
In Figure 4-3, the effect of the GDL thermal conductivity is investigated. It can be
observed that unlike the bipolar plate thermal conductivity, which has significant impact
on the temperature distribution, changing the GDL thermal conductivity does not change
the results, at least within the studied range.
uair, channel
[m/s]
Tm
ax
[ºC
]
1 2 3 4 5 640
50
60
70
80
90
100

52
Figure 4-2: Effect of bipolar plate thermal conductivity on maximum temperature.
Moreover, the effect of anisotropic GDL thermal conductivity is studied in
Figure 4-4. In one case, the in-plane and through plane thermal conductivities are
17 and 0.5 W/m.K respectively while in the other case isotropic GDL was considered
with thermal conductivity of 0.5 W/m.K.
Similarly, the effect of isotropic and anisotropic bipolar plate thermal
conductivity is investigated and temperature distributions are plotted in Figure 4-5 for
comparison. This Figure shows that the impact of in-plane thermal conductivity of
bipolar plate on the temperature distribution is more significant than the effect of
through-plane thermal conductivity. As Figure 4-6 shows, higher thermal conductivity for
bipolar plate leads to a more uniform temperature distribution.
kBP
[W/K.m]
Tm
ax
[ºC
]
0 50 100 150 20063
64
65
66
67
68
69
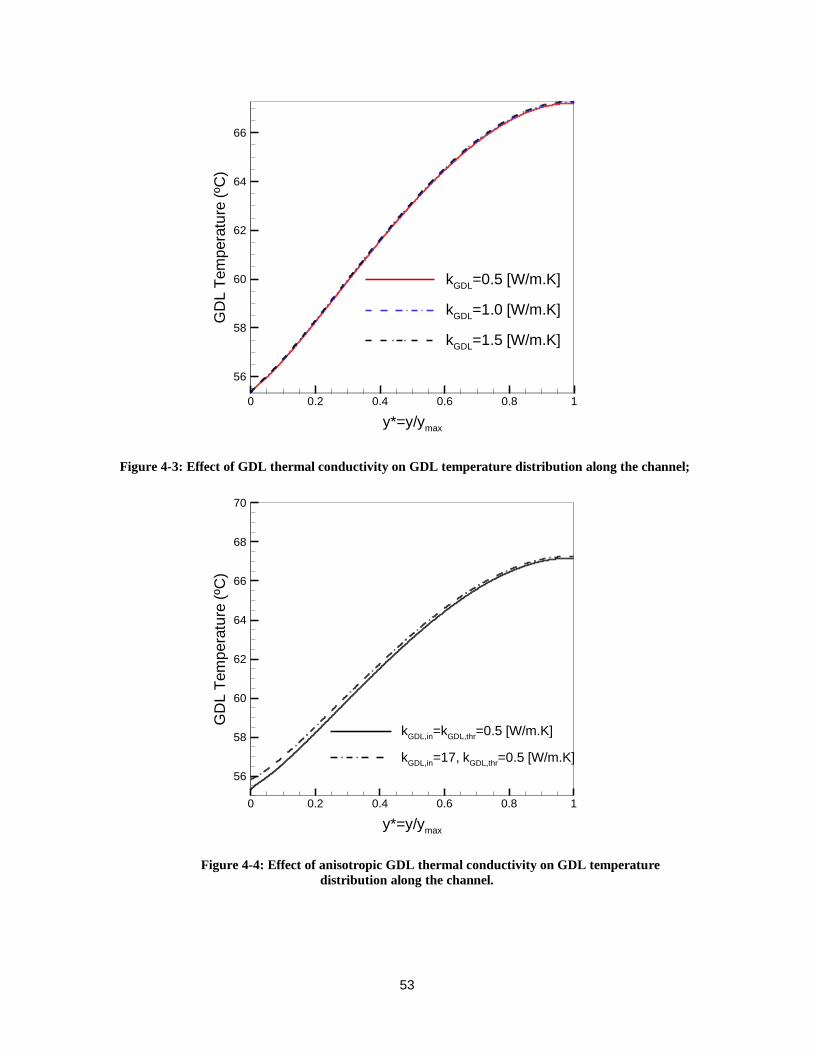
53
Figure 4-3: Effect of GDL thermal conductivity on GDL temperature distribution along the channel;
Figure 4-4: Effect of anisotropic GDL thermal conductivity on GDL temperature
distribution along the channel.
y*=y/ymax
GD
LT
em
pera
ture
(ºC
)
0 0.2 0.4 0.6 0.8 1
56
58
60
62
64
66
kGDL
=0.5 [W/m.K]
kGDL
=1.0 [W/m.K]
kGDL
=1.5 [W/m.K]
y*=y/ymax
GD
LT
em
pera
ture
(ºC
)
0 0.2 0.4 0.6 0.8 1
56
58
60
62
64
66
68
70
kGDL,in
=kGDL,thr
=0.5 [W/m.K]
kGDL,in
=17, kGDL,thr
=0.5 [W/m.K]

54
Figure 4-5: Different impact of in-plane and through-plane bipolar plate thermal conductivity on
temperature distribution along the channel.
Figure 4-6: Effect of bipolar plate in-plane thermal conductivity on temperature distribution along
the channel.
y*=y/ymax
Pla
tete
mp
era
ture
[ºC
]
0 0.2 0.4 0.6 0.8 145
50
55
60
65
70
kBP, in
=kBP, thr
=20 [W/m.K]
kBP, in
=kBP, thr
=40 [W/m.K]
kBP, in
=kBP, thr
=60 [W/m.K]
kBP, in
=60, kBP, thr
=20 [W/m.K]
y*=y/ymax
Pla
tete
mp
era
ture
[ºC
]
0 0.2 0.4 0.6 0.8 140
45
50
55
60
65
70
75
kBP
=10 [W/K.m]
kBP
=30 [W/K.m]
kBP
=50 [W/K.m]
kBP
=100 [W/K.m]
kBP
=600 [W/K.m]

55
In the studied cases, the thermal contact resistance (TCR) between GDLs and
bipolar plate was neglected. In this section, we have studied the effect of including TCR
in our model.
Figure 4-7: Schematic of the fuel cell channel model including thermal contact resistance (TCR)
As shown in Figure 4-7, we have considered a thin layer of a hypothetical
material between bipolar plate and GDL, with an equivalent thermal conductivity to
compensate for the effect of thermal contact resistance. The thickness of this layer, , is
assumed be on the order of the GDL surface roughness (~ 10 ). Due to computational
limits, the smallest thickness that we could include in our model was 50 . However,
we have verified that thinner layers have less effect on the results. This thermal
conductivity is calculated by using the experimental data reported by Sadeghi et al. [38].
We have picked the maximum value of TCR and calculated the equivalent thermal
conductivity, , using the following relation ( 0.08 ):
(4-1)
TCR
bipolar plate
MEA
cathode
channel
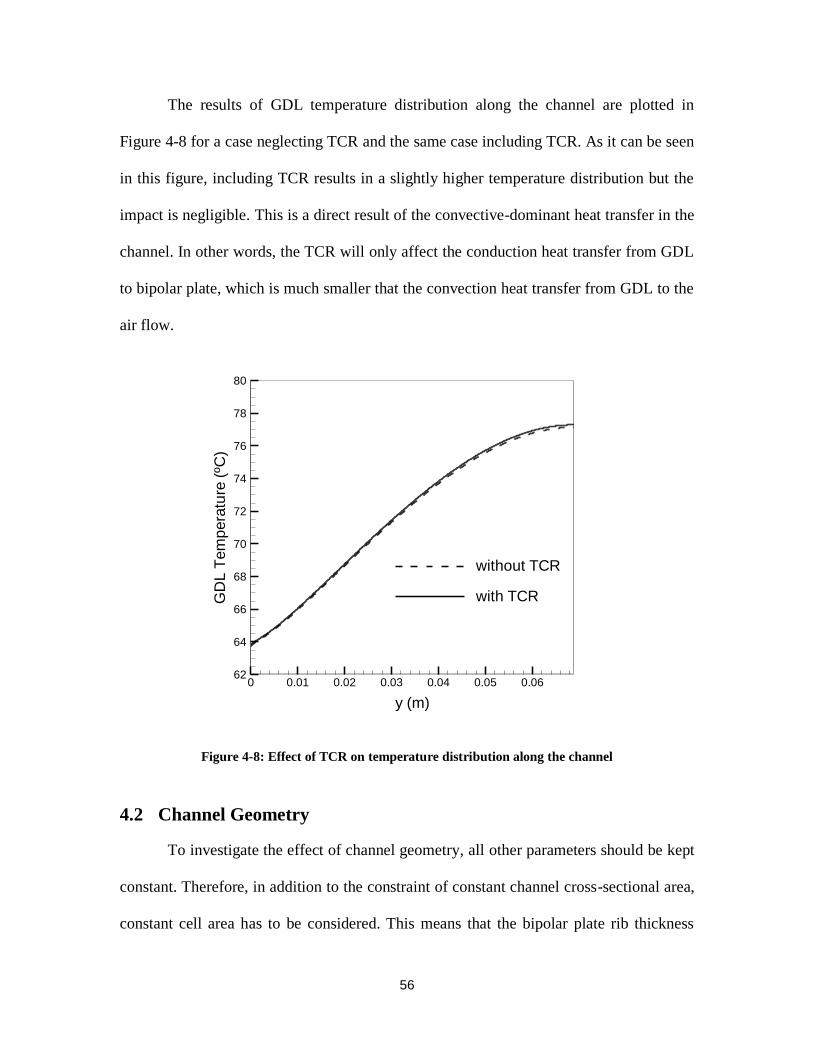
56
The results of GDL temperature distribution along the channel are plotted in
Figure 4-8 for a case neglecting TCR and the same case including TCR. As it can be seen
in this figure, including TCR results in a slightly higher temperature distribution but the
impact is negligible. This is a direct result of the convective-dominant heat transfer in the
channel. In other words, the TCR will only affect the conduction heat transfer from GDL
to bipolar plate, which is much smaller that the convection heat transfer from GDL to the
air flow.
Figure 4-8: Effect of TCR on temperature distribution along the channel
4.2 Channel Geometry
To investigate the effect of channel geometry, all other parameters should be kept
constant. Therefore, in addition to the constraint of constant channel cross-sectional area,
constant cell area has to be considered. This means that the bipolar plate rib thickness
y (m)
GD
LT
em
pera
ture
(ºC
)
0 0.01 0.02 0.03 0.04 0.05 0.0662
64
66
68
70
72
74
76
78
80
without TCR
with TCR
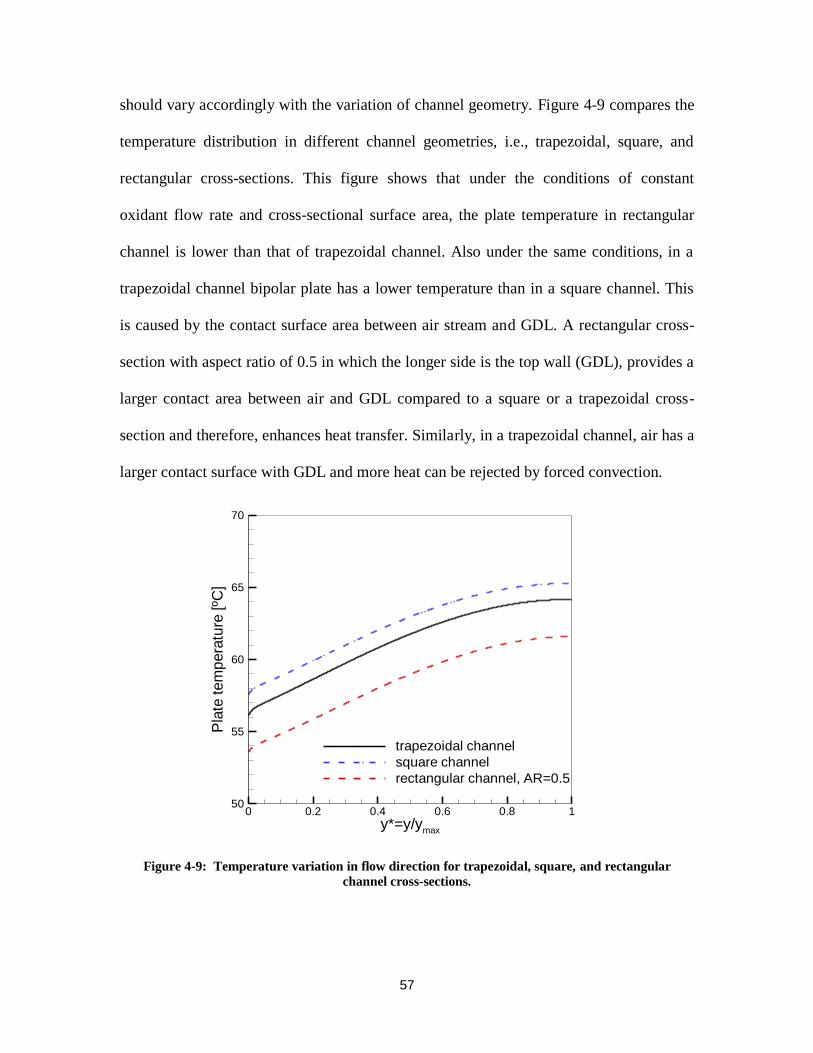
57
should vary accordingly with the variation of channel geometry. Figure 4-9 compares the
temperature distribution in different channel geometries, i.e., trapezoidal, square, and
rectangular cross-sections. This figure shows that under the conditions of constant
oxidant flow rate and cross-sectional surface area, the plate temperature in rectangular
channel is lower than that of trapezoidal channel. Also under the same conditions, in a
trapezoidal channel bipolar plate has a lower temperature than in a square channel. This
is caused by the contact surface area between air stream and GDL. A rectangular cross-
section with aspect ratio of 0.5 in which the longer side is the top wall (GDL), provides a
larger contact area between air and GDL compared to a square or a trapezoidal cross-
section and therefore, enhances heat transfer. Similarly, in a trapezoidal channel, air has a
larger contact surface with GDL and more heat can be rejected by forced convection.
Figure 4-9: Temperature variation in flow direction for trapezoidal, square, and rectangular
channel cross-sections.
y*=y/ymax
Pla
tete
mp
era
ture
[ºC
]
0 0.2 0.4 0.6 0.8 150
55
60
65
70
trapezoidal channel
square channel
rectangular channel, AR=0.5
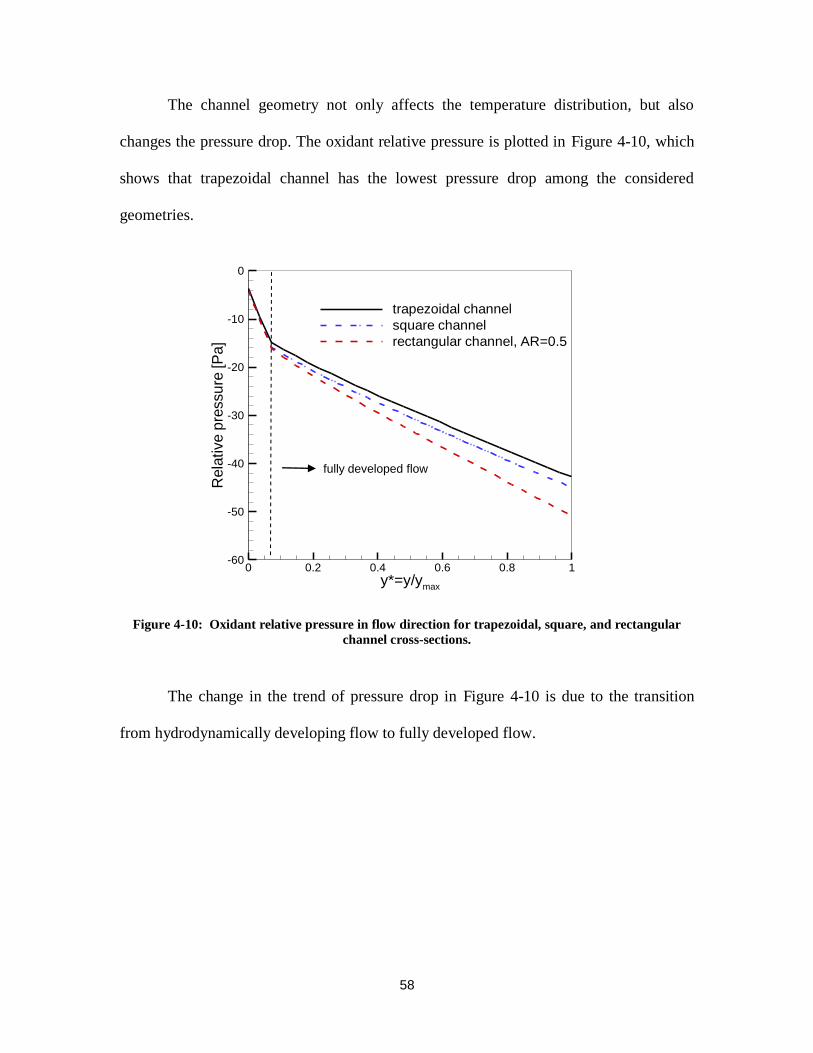
58
The channel geometry not only affects the temperature distribution, but also
changes the pressure drop. The oxidant relative pressure is plotted in Figure 4-10, which
shows that trapezoidal channel has the lowest pressure drop among the considered
geometries.
Figure 4-10: Oxidant relative pressure in flow direction for trapezoidal, square, and rectangular
channel cross-sections.
The change in the trend of pressure drop in Figure 4-10 is due to the transition
from hydrodynamically developing flow to fully developed flow.
y*=y/ymax
Rela
tive
pre
ssu
re[P
a]
0 0.2 0.4 0.6 0.8 1-60
-50
-40
-30
-20
-10
0
trapezoidal channel
square channel
rectangular channel, AR=0.5
fully developed flow

59
5: CONCLUSIONS AND RECOMMENDATIONS
In order to develop techniques and strategies for cooling and thermal management
of PEMFCs, numerical modeling is a strong method that has been much considered in
recent years. In the present work, a three-dimensional thermal model is developed to
predict the temperature distribution in a PEMFC. The proposed model can be used for
design and optimization of cooling devices for PEMFC systems. This model provides the
maximum temperature in an air-cooled PEMFC stack, without considering the whole
stack as the solution domain.
The results show that in a single channel the bipolar plate temperature gradient is
much higher in the flow direction than other directions. However, the oxidant
temperature variation is considerable in all directions, which reveals the necessity of
three-dimensional modeling.
Moreover, different heat transfer regimes are analyzed, which clearly shows that
in air-cooled fuel cell stacks, where the air stoichiometry is high, the most significant heat
transfer mode is the forced convective heat transfer. In fact, parametric studies show that
the air velocity and bipolar plate in-plane thermal conductivity are among the critical
factors that affect the temperature distribution in a PEMFC and thus play important roles
in thermal management of PEMFCs. Bipolar plates can also function as heat spreaders.
Therefore, it is recommended that highly thermal conductive materials such as pyrolytic
graphite sheet (with thermal conductivity of 600 to 800Wm−1
K−1
in the in-plane

60
directions) be used in the stack [30]. Pyrolytic graphite sheet is highly thermal
conductive, lightweight, flexible and heat-resistant, and has been applied successfully in
the thermal management of commercial portable electrical devices like laptop computers,
where the spaces are limited [39].
The validity of the numerical model is verified by comparison of the results with
experimental data provided by Ballard Power Systems. The numerical and experimental
values for the maximum temperature in the central channel are compared, which shows a
good agreement. In most of the cases, our model slightly overestimates the maximum
temperature. The main reason can be due to the assumptions that we made to determine
the boundary conditions; we assumed that the central channel in the stack is insulated and
there is no heat transfer to the adjacent channels. The other source of error can be
uncertainty in thermophysical properties and input parameters such as air velocity and
heat generation.
In our study, the GDL thermal conductivity does not change the temperature
profiles significantly, although the results of some other studies in the literature such as
[20] show that the GDL thermal conductivity strongly impacts the membrane temperature
rise. This conflict rises from different mechanisms of heat transfer in air-cooled fuel cells
and other types of fuel cells. In the studies that temperature distribution is sensitive to
GDL thermal conductivity, the air stoichiometry is low (~2); however, in air-cooled fuel
cells, the air stoichiometry is much higher (~100). Because of this high stoichiometry, the
heat transfer in air-cooled fuel cells is primarily controlled by convection and thus GDL
thermal conductivity does not play a major role. This conclusion is specific to the fuel
61
cell stacks in which convective heat transfer is considerably higher than conductive heat
transfer.
We have also investigated the effect of channel geometry on temperature
distribution and pressure drop. Channels with trapezoid, square, and rectangular cross-
sections with equal surface area were compared in terms of temperature distribution and
pressure drop. The results show that the trapezoidal channel gives the minimum pressure
drop among the considered geometries while the rectangular channel gives the minimum
temperature. Therefore, the selection of channel geometry remains to a trade off design
analysis of operating temperature and pressure that can be considered as a future work.
For the future work, it is also possible to integrate the present thermal model with
a performance model in order to investigate the effects of parameters, such as relative
humidity, that influence the fuel cell current and voltage and finally change the amount of
heat generation in the stack. This three-dimensional model for single cells can form a
theoretical foundation for thermal analysis of multi-cell stacks where thermal
management and stack cooling is a significant engineering challenge.
62
6: REFERENCE LIST
1. Larminie J, Dicks A (2003) Fuel Cell Systems Explained (2nd Edition) John
Wiley & Sons
2. Faghri A, Guo Z (2005) Challenges and opportunities of thermal management
issues related to fuel cell technology and modeling. International Journal of Heat
and Mass Transfer 48: 3891-3920
3. Gasteiger HA, Mathias MF (2004) Fundamental research and development
challenges in polymer electrolyte fuel cell technology. The third international
symposium on proton conducting membrane fuel cells: 1-24
4. Endoh E, Terazono S, Widjaja H, Takimoto Y (2004) Degradation Study of MEA
for PEMFCs under Low Humidity Conditions. Electrochemical and Solid-State
Letters 7: A209-A211
5. van den Oosterkamp PF (2006) Critical issues in heat transfer for fuel cell
systems. Energy Conversion and Management 47: 3552-3561
6. Xue X, Tang J, Smirnova A, England R, Sammes N (2004) System level lumped-
parameter dynamic modeling of PEM fuel cell. Journal of Power Sources 133:
188-204
7. Yu S, Jung D (2010) A study of operation strategy of cooling module with
dynamic fuel cell system model for transportation application. Renewable Energy
35: 2525-2532
8. Bao C, Ouyang M, Yi B (2006) Analysis of the water and thermal management in
proton exchange membrane fuel cell systems. International Journal of Hydrogen
Energy 31: 1040-1057
9. Yu X, Zhou B, Sobiesiak A (2005) Water and thermal management for Ballard
PEM fuel cell stack. Journal of Power Sources 147: 184-195
10. Colella WG (2003) Modelling results for the thermal management sub-system of
a combined heat and power (CHP) fuel cell system (FCS). Journal of Power
Sources 118: 129-149
11. Linnhoff B, Senior PR (1983) Energy Targets Clarify Scope for Better Heat
Integration. Process Engineering: 29-33
12. Chupin S, Colinart T, Didierjean S, Dubé Y, Agbossou K, Maranzana G, Lottin O
(2010) Numerical investigation of the impact of gas and cooling flow
configurations on current and water distributions in a polymer membrane fuel cell
through a pseudo-two-dimensional diphasic model. Journal of Power Sources
195: 5213-5227
63
13. Shan Y, Choe S-Y (2005) A high dynamic PEM fuel cell model with temperature
effects. Journal of Power Sources 145: 30-39
14. Siegel C (2008) Review of computational heat and mass transfer modeling in
polymer-electrolyte-membrane (PEM) fuel cells. Energy 33: 1331-1352
15. Yu S, Jung D (2008) Thermal management strategy for a proton exchange
membrane fuel cell system with a large active cell area. Renewable Energy 33:
2540-2548
16. Pharoah JG, Burheim OS (2010) On the temperature distribution in polymer
electrolyte fuel cells. Journal of Power Sources 195: 5235-5245
17. Shimpalee S, Dutta S (2000) Numerical prediction of temperature distribution in
PEM fuel cells. Numerical Heat Transfer Part A 38: 111-128
18. Adzakpa KP, Ramousse J, Dubé Y, Akremi H, Agbossou K, Dostie M, Poulin A,
Fournier M (2008) Transient air cooling thermal modeling of a PEM fuel cell.
Journal of Power Sources 179: 164-176
19. Sinha PK, Wang C-Y, Beuscher U (2007) Transport Phenomena in Elevated
Temperature PEM Fuel Cells. Journal of The Electrochemical Society 154: B106-
B116
20. Ju H, Meng H, Wang C-Y (2005) A single-phase, non-isothermal model for PEM
fuel cells. International Journal of Heat and Mass Transfer 48: 1303-1315
21. Faghri A, Guo Z (2008) Integration of Heat Pipe into Fuel Cell Technology. Heat
Transfer Engineering 29: 232-238
22. Sasmito AP, Lum KW, Birgersson E, Mujumdar AS (2010) Computational study
of forced air-convection in open-cathode polymer electrolyte fuel cell stacks.
Journal of Power Sources 195: 5550-5563
23. Spitta C, Mathiak J, Dokupil M, Heinzel A (2007) Coupling of a Small Scale
Hydrogen Generator and a PEM Fuel Cell WILEY-VCH Verlag, pp. 197-203.
24. Scholta J, Messerschmidt M, Jörissen L, Hartnig C (2009) Externally cooled high
temperature polymer electrolyte membrane fuel cell stack. Journal of Power
Sources 190: 83-85
25. Asghari S, Akhgar H, Imani BF (2011) Design of thermal management subsystem
for a 5 kW polymer electrolyte membrane fuel cell system. Journal of Power
Sources 196: 3141-3148
26. Baek SM, Yu SH, Nam JH, Kim C-J (2011) A numerical study on uniform
cooling of large-scale PEMFCs with different coolant flow field designs. Applied
Thermal Engineering 31: 1427-1434
27. Kurnia JC, Sasmito AP, Mujumdar AS (2011) Numerical investigation of laminar
heat transfer performance of various cooling channel designs. Applied Thermal
Engineering 31: 1293-1304
64
28. Song T-W, Choi K-H, Kim J-R, Yi JS (2011) Pumpless thermal management of
water-cooled high-temperature proton exchange membrane fuel cells. Journal of
Power Sources 196: 4671-4679
29. Park YH, Caton JA (2008) Development of a PEM stack and performance
analysis including the effects of water content in the membrane and cooling
method. Journal of Power Sources 179: 584-591
30. Wen C-Y, Lin Y-S, Lu C-H (2009) Performance of a proton exchange membrane
fuel cell stack with thermally conductive pyrolytic graphite sheets for thermal
management. Journal of Power Sources 189: 1100-1105
31. Wen C-Y, Lin Y-S, Lu C-H, Luo T-W (2011) Thermal management of a proton
exchange membrane fuel cell stack with pyrolytic graphite sheets and fans
combined. International Journal of Hydrogen Energy 36: 6082-6089
32. Djilali N (2007) Computational modelling of polymer electrolyte membrane
(PEM) fuel cells: Challenges and opportunities. Energy 32: 269-280
33. Gidaspow D (1969) Handbook of fuel cell technology, Carl Berger, Editor,
Prentice-Hall, Englewood Cliffs, N. J. (1968). 607 pages. $18.50. AIChE Journal
15: 3-3 DOI 10.1002/aic.690150103
34. Incropera FP, Dewitt DP (1996) Fundamentals of Heat and Mass Transfer, fourth
edn John Wiley & Sons., Inc., New York
35. Bolz R, Tuve G (1976) Handbook of tables for applied engineering science, 2nd
edn CRC Press, Cleveland
36. Shahsavari S, Kjeang E, Bahrami M (2010) Analytical velocity and temperature
distributions for flow in microchannels of various cross-sectionsThe 8th
International ASME Conference on Nanochannels, Microchannels, and
Minichannels, Monreal, Canada.
37. Shah RK, London AL (1978) Laminar flow forced convection in ducts : a source
book for compact heat exchanger analytical data Academic Press, New York
38. Sadeghi E, Djilali N, Bahrami M (2011) Effective thermal conductivity and
thermal contact resistance of gas diffusion layers in proton exchange membrane
fuel cells. Part 1: Effect of compressive load. Journal of Power Sources 196: 246-
254
39. http://panasonic.com/industrial/electronic-components/ (2010).