AIM Advisory Board PresentationAdvisory Board Presentation
136
AIM Advisory Board Presentation AIM Advisory Board Presentation AIM XXVI April 28 2008 Applied Investment Management XXVI 1 University of Notre Dame • Mendoza College of Business April 28, 2008
Transcript of AIM Advisory Board PresentationAdvisory Board Presentation

AIM Advisory Board PresentationAIM Advisory Board Presentation
AIM XXVIApril 28 2008
Applied Investment Management XXVI 1University of Notre Dame • Mendoza College of Business
April 28, 2008

AIM AIM XXVI AnalystsAIM AIM XXVI AnalystsIntroductions
Brett ThomasBinghamton, NY
Portfolio Overview
Matt KorcinskyGreenville, PA
Economic Environment
Hunter JohnsonBeaumont, TXg ,
Getty Images (GYI)Aqua America (WTR)UBS Investment Bank
Cheryl RamseyCincinnati, OH
,Pharmaceutical Products (PPDI)Republic Services, Inc. (RSG)
Matt WalterCleveland, OHApple (AAPL)
,Pepsico (PEP)Sun Hydraulics Systems (SNHY)AT&T
Eric CrawfordWest Hartford, CTCincinnati, OH
Dentsply International, Inc. (XRAY)Monsanto Corporation (MON)
Portfolio Overview
Apple (AAPL)Progress Energy (PGN)
Economic Environment
B K l
West Hartford, CTYRC Worldwide (YRCW)Weyerhaeuser Co. (WY)UBS Investment Bank
S it A l iEric LarssonTrumbull, CTBarrick Gold (ABX)Kirby Corp. (KEX)IBM
Barry KesslerSpring, TXVaalco Energy (EGY)El Paso Corporation (EP)Simmons and Company
Security Analysis
Andy FreyKalispell, MTBJ Services (BJS)Aptar Group Inc. (ATR)
Julio RivasSan Salvador, El SalvadorWhirlpool (WHR)Boeing Co. (BA)
Matt WeglarzKansas City, MOPotash Corp. (POT)Caterpillar (CAT)
Aldo ArcieriRidgewood, NJZimmer Holdings (ZMH)Intercontinental Exchange, Inc. (ICE)
Applied Investment Management XXVI 2

AIM AIM XXVI AnalystsAIM AIM XXVI AnalystsSecurity Analysis
Jerry WangBeijing, China
Security Analysis
Paul TrahmsRochester, MN
Performance Evaluation
Adam AshleyAshland, KYBeijing, China
Nutri Systems (NTRI)Zhongpin, Inc. (HOGS)Notre Dame Investment Office
Jim McGovernPhiladelphia PA
Rochester, MNWalgreen Co (WAG)Equifax (EFX)
Jake WagnerRedlands, CAMorgan Stanley (MS)
,McGraw-Hill (MHP)Huron Consulting Group (HURN)
Todd BorgmannIndianapolis, INExxon/Mobil (XOM)Philadelphia, PA
PMI Group (PMI)Goldman Sachs Group Inc. (GS)
Mousa KolahdoozSan Francisco, CAT B d (TUP)
Morgan Stanley (MS)Boston Private Financial Holdings (BPFH)Merrill Lynch
Performance Evaluation
Exxon/Mobil (XOM)Toll Brothers, Inc. (TOL)
Bob ManleyBuffalo, NYLOOPnet (LOOP)Ameron International Corp (AMN)Tupperware Brands (TUP)
EMC Corp. (EMC)Citigroup
Andrew SamalisReading, MA
b A
Cory RellasPlano, TXDell Inc. (DELL)Burlington Northern Santa Fe (BNI)Notre Dame Senior Finance Major
Ameron International Corp. (AMN)
General Information
Blair MlnarikCabelas (CAB)Service Corp. Intl. (SCI)
Manish VaswaniNew Delhi, IndiaUnited Health Group (UNH)Sigma Aldrich (SIAL)
Plymouth, MNDigital River (DRIV)FCStone Group, Inc. (FCSX)Robert W. Baird
Applied Investment Management XXVI 3

AIM AgendaAIM Agenda
• IntroductionsIntroductions
• Course overview
• Economic outlook
• Security analysis
• Portfolio performance• Portfolio performance
• Wrap-up
Applied Investment Management XXVI 4

AIMAIM
Course OverviewCourse
O i
Portfolio
P f
Security
A l i
Economic
O tl k
General
I f tiOverview PerformanceAnalysisOutlook Information
Applied Investment Management XXVI 5

AIM Course OverviewAIM Course Overview
• Course Objective:Course Objective:– Applied Investment Management will provide
analysts with a thorough grounding in the process ofanalysts with a thorough grounding in the process of portfolio management, from the broad asset allocation decision through individual stock gevaluation
Applied Investment Management XXVI 6

AIM Course OverviewAIM Course Overview
• Analysts:Analysts: – Inherit portfolio position and update intrinsic value
Select and value one additional stock– Select and value one additional stock• Present to group on several topics including:
– Economic analysis• Industry review
S i l i– Security analysis– Portfolio performance
Applied Investment Management XXVI 7

AIM Investment PoliciesAIM Investment Policies
• Portfolio will comprise of only equities listed onPortfolio will comprise of only equities listed on US exchanges
• No fixed income money market or derivatives• No fixed income, money market or derivatives instruments will be purchasedN i h• No margin purchases
• No short selling except for the industry hedge position (less than 1% of the portfolio value)
Applied Investment Management XXVI 8

AIM Investment PoliciesAIM Investment Policies
• Portfolio composition will roughly match the industrialPortfolio composition will roughly match the industrial sector’s weighting on the S&P500
• No individual holding should exceed 10% of current• No individual holding should exceed 10% of current market value of portfolio
• Long-term target for cash holdings is 0%
• AIM shall invest in companies with values consistent pwith those of the University of Notre Dame (abortifacients, tobacco, birth control, etc)
Applied Investment Management XXVI 9

AIM Investment ConstraintsAIM Investment Constraints
• Perpetual investment horizon• Perpetual investment horizon– Equity investments will be viewed for their
potential over the long term 3 to 5 yearspotential over the long-term, 3 to 5 years
• Prudent person rule– Investing with the care, skill, and diligence that a
prudent person would use– In extraordinary circumstances, fund managers can
intervene as necessary to meet AIM objectives
Applied Investment Management XXVI 10

AIM Investment PhilosophyAIM Investment Philosophy
• Investment objectiveInvestment objective– Outperform S&P 500 over the long-term
• Risks– Managed by diversification
• Investment decisionsF d l l i– Fundamental analysis
Applied Investment Management XXVI 11

AIM Portfolio Target AllocationAIM Portfolio Target AllocationSmall & Mid-
CapCap35%• Sector concentration
will match S&P, plus or i 5%
Large Cap65%
minus 5%
E h i di id l k
• Small cap < $500M
• Each individual stock will not exceed 10% of market value of • Small-cap < $500M
• Mid-cap $500M - $5B• Large-cap > $5B
portfolio
Applied Investment Management XXVI 12

AIM Sector PositionsAIM Sector Positions
• Select one industry to long and one to shortSelect one industry to long and one to short– Economic forecast
Industry reviews– Industry reviews• Long: financials• Short: real estate
Applied Investment Management XXVI 13

AIMAIM
Economic OutlookCourse
O i
Portfolio
P f
General
I f ti
Security
A l i
Economic
O tl kOverview Performance InformationAnalysisOutlook
Applied Investment Management XXVI 14

AIM Economics Group AgendaAIM Economics Group Agenda
• Economic predictionEconomic prediction• How did we get here?
– Major economic indicesMajor economic indices– Housing– Consumer spendingConsumer spending
• What is the Fed doing?– Recession concernsRecession concerns– Inflation expectations
• Portfolio impact
Applied Investment Management XXVI 15
Portfolio impact

AIMAIM
F f h EFuture of the Economy
Applied Investment Management XXVI 16

AIM Economic PredictionAIM Economic Prediction
• RecessionRecession• GDP
D li i GDP ( li d 0 6% i Q4)– Declining GDP (annualized 0.6% in Q4)– Decline of dollar increasing cost pressures
• Housing and consumption– Housing starts continue to decline– Consumer expectations
Applied Investment Management XXVI 17

AIMAIM
R E i HiRecent Economic History
Applied Investment Management XXVI 18

AIM Change in Major Indices AIM Change in Major ndices
8 00%
GDP Consumer Spending Unemployment Rate
6.00%
7.00%
8.00%
4.00%
5.00%
1.00%
2.00%
3.00%
-1.00%
0.00%
2000
2001
2002
2003
2004
2005
2006
2007
Applied Investment Management XXVI 19
-2.00%

AIMAIM
I #1 H iIssue #1: Housing
Applied Investment Management XXVI 20

AIM HousingAIM Housing
• The “precipitous fall”The precipitous fall– Existing home sales, permits, new home sales, prices
all down in one of worst housing markets in historyall down in one of worst housing markets in history
• Buyers pessimistic until prices stabilize• Buyers pessimistic until prices stabilize– More foreclosures, subprime lending gone
Applied Investment Management XXVI 21

AIM Existing Home SalesAIM E isting Ho e Sales7000
8000
4000
5000
6000
000’
s)
1000
2000
3000
(0
0
1000
2000
- Ja
n20
00 -
Jul
2001
- Ja
n20
01 -
Jul
2002
- Ja
n20
02 -
Jul
2003
- Ja
n20
03 -
Jul
2004
- Ja
n20
04 -
Jul
2005
- Ja
n20
05 -
Jul
2006
- Ja
n20
06 -
Jul
2007
- Ja
n20
07 -
Jul
2008
- Ja
n
2 2 2 2 2 2 2 2 2
•Inventory up 12% YoY in March
•Median price of a home dropped 13.3% YoY in March, largest since 1970
Applied Investment Management XXVI 22Applied Investment Management XXVI
•Existing home sales fell 2%, down 7.7% YoY in MarchSource: www.realtor.org

AIM New Home SalesAIM New Home Sales
•Sales of new homes dropped by 8.5% last month to 526,000
Applied Investment Management XXVI 23Applied Investment Management XXVI

AIM Housing StartsAIM Housing Starts
•Housing starts down 11.9% in March YoY to 974,000
Applied Investment Management XXVI 24
•Housing permits down 5.8% in March YoY - future indicator of housing starts

AIM Subprime: Delinquencies Have AcceleratedAIM
Seriously Delinquent % of Total
p q
30
35
Seriously�Delinquent�%�of�Total�
20052006
(%)
20
25
30
2004
2007 17%
10
15
2007
0
5
0 5 10 15 20 25 30 35 40 45
Applied Investment Management XXVI 25
Loan Age (Months)
Applied Investment Management XXVI

AIM Small Segment of US Homes Drives Potential LossesAIM Small Segment of US Homes Drives Potential Losses
Estimated�Mortgage�Losses:�Total�US�Homes128 Million
Homes Financed by Subprime
IMF forecasts that losses could reach one trillion dollarsHomes Financed by Subprime
Loans—6 Million• $575 billion strictly mortgage
• Default losses on non-iti d l t $100 billisecuritized loans at $100 billion
• Adds marked-to-market losses of mortgage related securities
• Adds in other consumer and corporate debt
Applied Investment Management XXVI 26
• Includes potentially recaptured sums
Applied Investment Management XXVI

AIMAIM
I #2 Th CIssue #2: The Consumer
Applied Investment Management XXVI 27

AIM Consumer SpendingAIM Consumer Spending25.00%
Real Disposable Income vs Food & Energy
20.00%
10 00%
15.00%
ng
e Y
/Y
5.00%
10.00%
% C
ha
0.00%
Jun-07 Jul-07 Aug-07 Sep-07 Oct-07 Nov-07 Dec-07 Jan-08 Feb-08 Mar-08
Applied Investment Management XXVI 28
-5.00%
Real Disposable Personal Income Energy Prices Food Prices Source: St. Louis Fed

AIM Consumer SpendingAIM Consumer Spending
Applied Investment Management XXVI 29

AIM Consumer SpendingAIM Consumer Spending
Applied Investment Management XXVI 30

AIM Consumer ConfidenceAIM Consumer Confidence
• University of Michigan April numbers came inUniversity of Michigan April numbers came in at 62.6 (January: 78.4; March 69.5)
• 25 year low• 25 year low – March 1982: 62.0
• Expectations index at 35-year low
• Consistent with Conference BoardSource:�St.�Louis�Fed�and�Conference�Board
Applied Investment Management XXVI 31
• Consistent with Conference Board
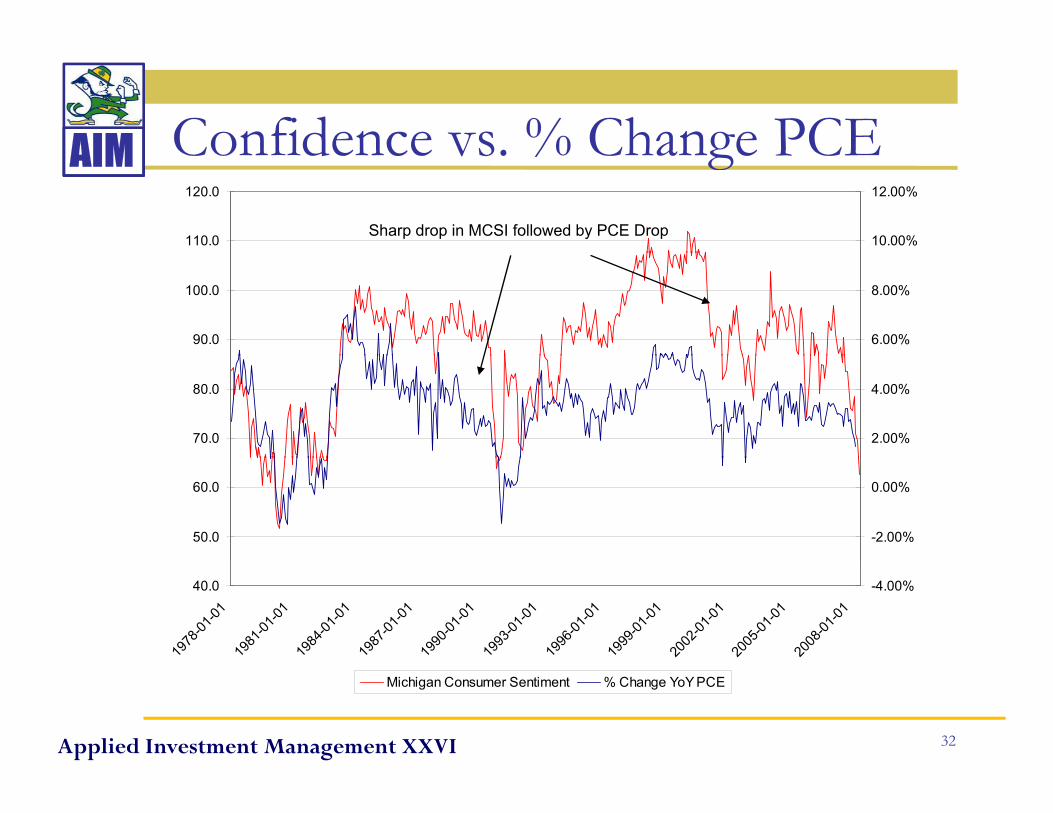
AIM Confidence vs. % Change PCEAIM Confidence vs. % Change PCE110.0
120.0
10.00%
12.00%
Sharp drop in MCSI followed by PCE Drop
90.0
100.0
6.00%
8.00%
70.0
80.0
2.00%
4.00%
50.0
60.0
-2.00%
0.00%
40.0
1978
-01-01
1981
-01-01
1984
-01-01
1987
-01-01
1990
-01-01
1993
-01-01
1996
-01-01
1999
-01-01
2002
-01-01
2005
-01-01
2008
-01-01
-4.00%
Applied Investment Management XXVI 32
Michigan Consumer Sentiment % Change YoY PCE

AIM Payroll Down 3 Months StraightAIM Payroll Down 3 Months Straight
• Layoffs spread:Layoffs spread: – Housing
Construction– Construction– Manufacturing
Fi i l– Financials
Applied Investment Management XXVI 33Applied Investment Management XXVI

AIM Unemployment Rate ClimbsAIM Une ploy ent Rate Cli bs• March Data
– Unemployment rate rose from 4.8% to 5.1%– Increased by 434,000 to 7.8 million, up 1.1 million
from March ‘07• Peak at 6% early next yeary y
Applied Investment Management XXVI 34
Source:�Bureau�of�Labor�Statistics,�USDoL
Applied Investment Management XXVI
AIMAIM
F d A iFed Actions
Applied Investment Management XXVI 35

AIM Fed Actions: RatesAIM Fed Actions: Rates
• Goals:Goals:– Sustainable economic growth
Price stability– Price stability
• Actions:• Actions:– Twelve meetings (six unscheduled) since August ‘07
Si f d f d i S b ‘07– Six fed funds rate cuts since September ‘07• 2.25% from 5.25%
Applied Investment Management XXVI 36
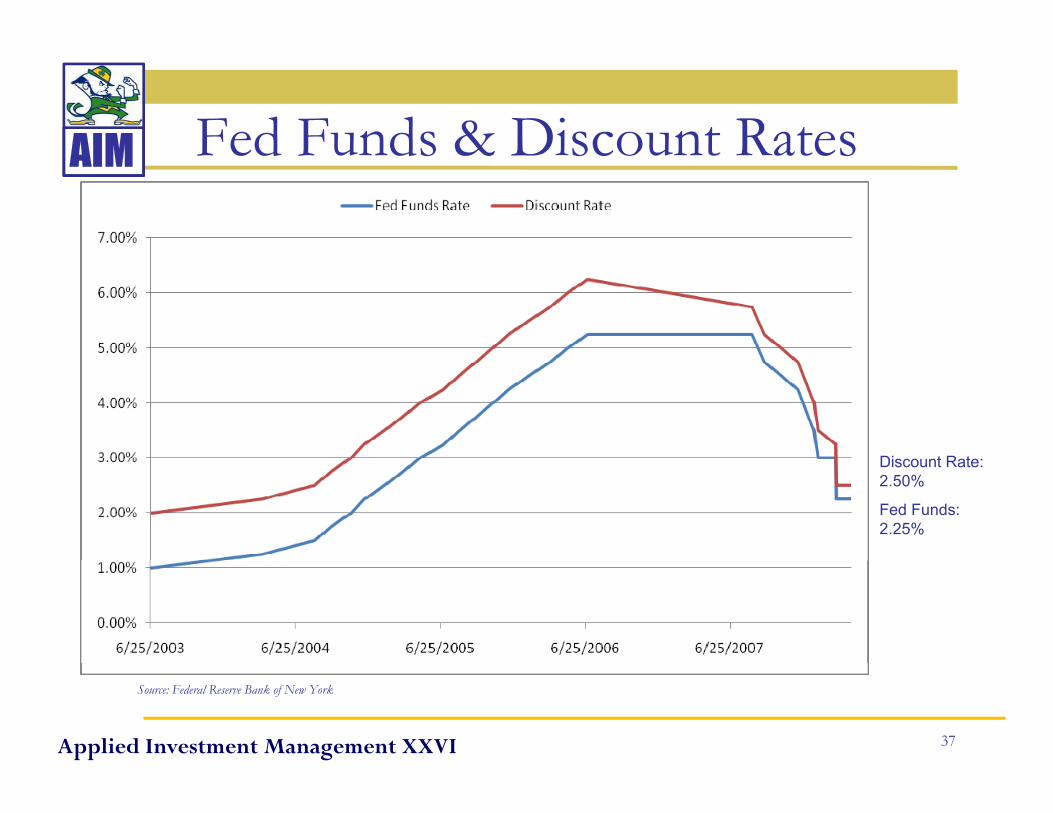
AIM Fed Funds & Discount RatesAIM Fed Funds & Discount Rates
Di t R t
Fed Funds: 2.25%
Discount Rate:2.50%
Applied Investment Management XXVI 37
Source: Federal Reserve Bank of New York
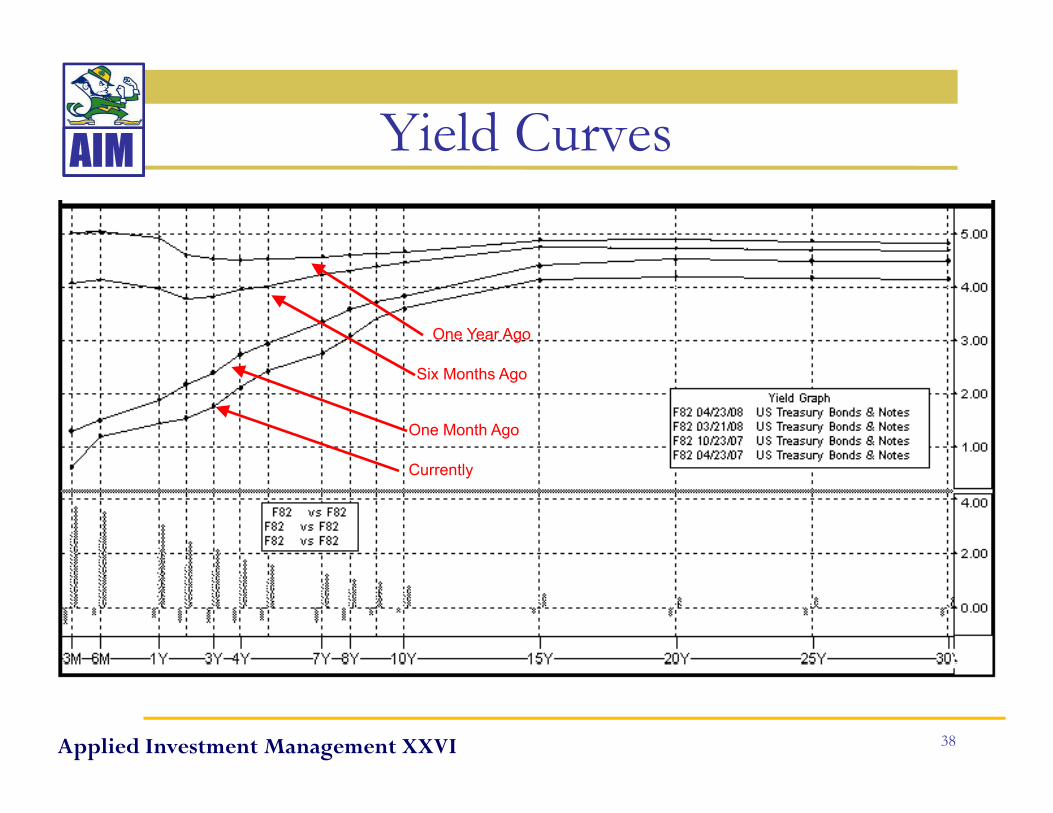
AIM Yield CurvesAIM Yield Curves
One Year Ago
Six Months Ago
One Month Ago
Currently
Applied Investment Management XXVI 38

AIM Fed Actions: LiquidityAIM Fed Actions: Liquidity
• Goal:Goal: – Foster liquidity to “promote moderate growth over
time and to mitigate the risks to economic activity”time and to mitigate the risks to economic activity
• Actions:– Financing arrangement for JPM & BSC– Six month lending facility for primary dealers– $100B in term repurchase transactions– March TAF amounts increased to $100B
Applied Investment Management XXVI 39

AIM Measure of InflationAIM Measure of InflationCore PCE Headline CPI
4 0
4.5
5.0
2 5
3.0
3.5
4.0
1 0
1.5
2.0
2.5
%
0.0
0.5
1.0
Jun-03 Dec-03 Jun-04 Dec-04 Jun-05 Dec-05 Jun-06 Dec-06 Jun-07 Dec-07
Applied Investment Management XXVI 40
Source: St. Louis Fed
Applied Investment Management XXVI

AIM Balancing Inflation & GrowthAIM Balancing Inflation & Growth
• Dollar may stabilize with fewer rate cutsDollar may stabilize with fewer rate cuts
Sl i bl d ll i i• Slumping economy & stable dollar may reign in oil & agricultural prices
• Future Fed actions likely to address liquidity y q yrather than rate cuts
Applied Investment Management XXVI 41

AIM US Dollar StrengthAIM US Dollar Strength$140 110
$80
$100
$120
90
100WTI Crude US Dollar Index
$40
$60
$80
70
80
90
$0
$20
/2/03
/8/03
/8/04
/6/04
31/04
29/05
26/05
23/06
20/06
25/07
21/07
60
70
Source: EIA, St. Louis Fed
1/2 7/8 1/8 7/6
12/31 6/2
9
12/26 6/2
3
12/20 6/2
5
12/21
Applied Investment Management XXVI 42

AIM Dollar and Oil ImpactsAIM Dollar and Oil ImpactsUSD•Dollar continues to weaken, strengthening exports
•Dollar weakness is encouraging foreign investment into the US
•European Central Bank (ECB) not keeping pace with U.S. rate cuts
Crude Oil•Global demand increase despite slo do n in the USA•Global demand increase despite slowdown in the USA
•Continued terrorist activity in Africa and the Middle East impacting supply
Applied Investment Management XXVI 43
impacting supply
Applied Investment Management XXVI
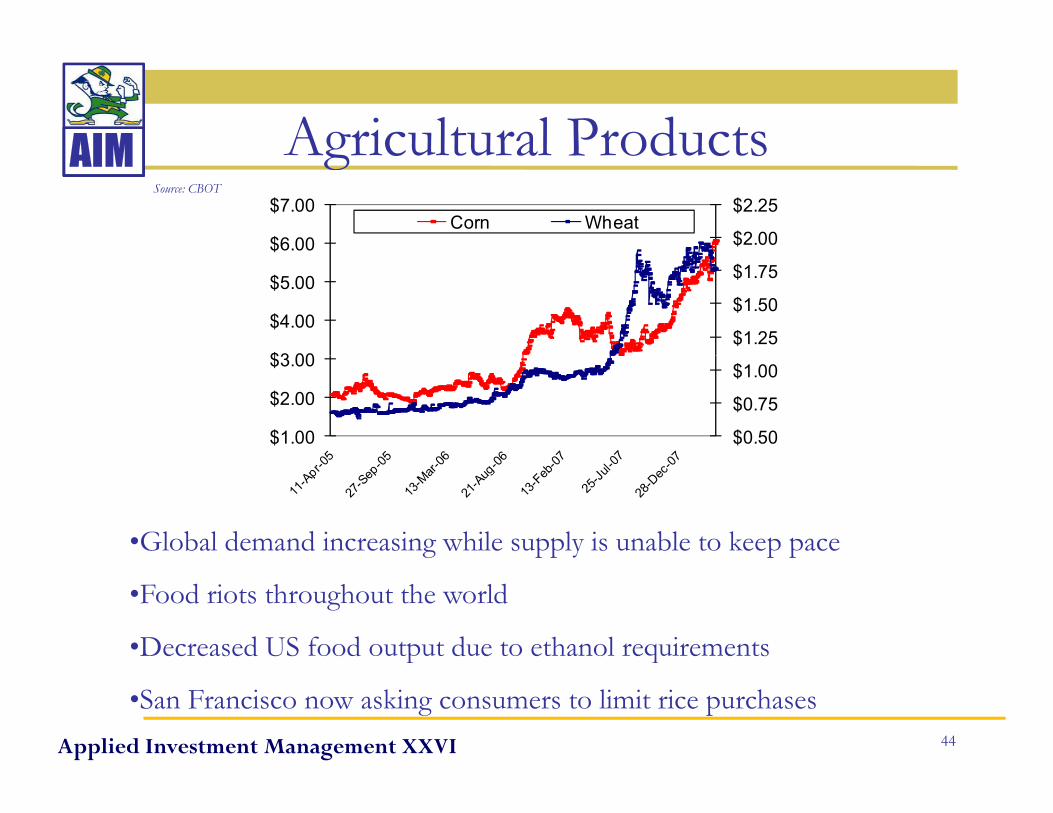
AIM Agricultural ProductsAIM Agricultural Products$2.00
$2.25
$6.00
$7.00Corn Wheat
Source: CBOT
$1.25
$1.50
$1.75
$3 00
$4.00
$5.00
$0.50
$0.75
$1.00
$1.00
$2.00
$3.00
•Global demand increasing while supply is unable to keep pace
•Food riots throughout the world
•Decreased US food output due to ethanol requirements
Applied Investment Management XXVI 44
p q
•San Francisco now asking consumers to limit rice purchases

AIMAIM
P f li IPortfolio Impact
Applied Investment Management XXVI 45

AIM Portfolio Outlook by SectorAIM Portfolio Outlook by SectorSector Outlook Catalyst
Energy
�
Global growth and demand for oil
Consumer Staples Defensive play to slower GDP growth
Materials Strong global demand�Materials Strong global demand
Health Care Positive demographic trends
Financials Steeper yield curve helping banks
Utilities Defensive play to slower GDP growth
Telecom Services � Uncertain industry outlook
Consumer Discretionary
�High commodity costs prohibit spending
IT Disappointing IT capex and mixed earnings
I d t i l Sl US GDP th
Applied Investment Management XXVI 46
�Industrials Slower US GDP growth
Real Estate Commercial following residential trend

AIM Economic ReviewAIM Economic Review
• Projected recessionProjected recession• Economic downturn caused by housing and
consumer issuesconsumer issues• Fed actions promoting liquidity and growth• Inflation may be a concern going forward • Economic factors impact AIM portfoliop p
Applied Investment Management XXVI 47

AIMAIM
Security Analysisy yCourse
O i
Portfolio
P f
General
I f ti
Security
A l i
Economic
O tl kOverview Performance InformationAnalysisOutlook
Applied Investment Management XXVI 48

AIM Security AnalysisAIM Security Analysis
• We are stock pickersWe are stock pickers– Individual stock evaluation and selection
• Alpha generation
• Bottom-up, fundamental analysis– Emphasis on intrinsic valuation
Applied Investment Management XXVI 49

AIM Research ProcessAIM Research Process
• Company backgroundCompany background– How does it make money?
SWOT analysis– SWOT analysis– What can the analyst discover?
• Industry report– Basic fundamental environment & outlook– Determines ETF hedge positions
Applied Investment Management XXVI 50

AIM Research ProcessAIM Research Process
• Fundamental analysisFundamental analysis– Key ratio performance vs. competitors
Identify risk and growth elements– Identify risk and growth elements
E i f 4Q’• Earnings forecast – next 4Q’s– Heuristic method– Financial method
Applied Investment Management XXVI 51
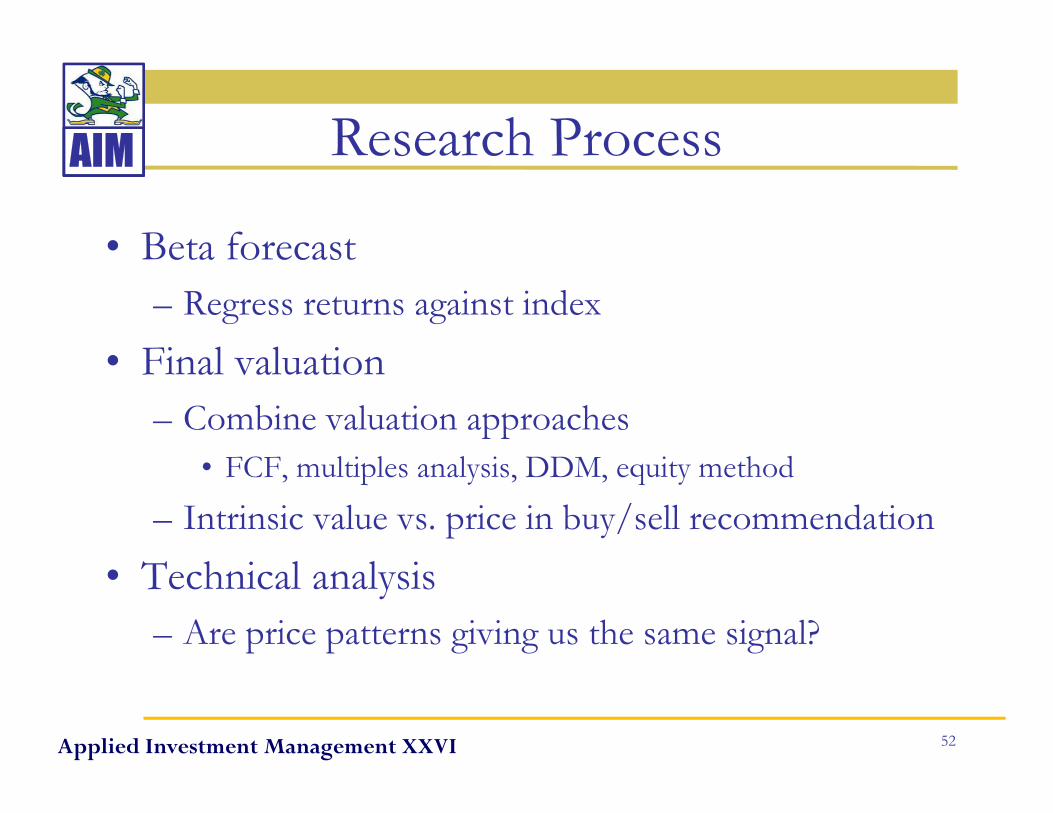
AIM Research ProcessAIM Research Process
• Beta forecastBeta forecast– Regress returns against index
• Fi l l ti• Final valuation– Combine valuation approaches
FCF l i l l i DDM i h d• FCF, multiples analysis, DDM, equity method
– Intrinsic value vs. price in buy/sell recommendation• Technical analysis
– Are price patterns giving us the same signal?
Applied Investment Management XXVI 52

AIM Analyst PresentationsAIM Analyst Presentations
Analyst Ticker FocusAnalyst Ticker FocusAldo Arcieri ICE Background / DiscoveryJ rr W HOGS I d tr A l iJerry Wang HOGS Industry Analysis
Jim McGovern GS Fundamental AnalysisM K l hd EMC E i FMousa Kolahdooz EMC Earnings ForecastAndrew Samalis SCI Beta and Free Cash Flow
Paul Trahms EFX Multiples AnalysisJake Wagner BPFH Technical Analysis
Applied Investment Management XXVI 53Applied Investment Management XXVI

AIM Intercontinental Exchange (ICE)AIM ntercontinental E change ( CE)As of 21-Apr-08
Price: $158.02
Fwd P/E: 30.98
Mkt Cap: $11.08 B
R (E 2008) $804 01 MRev (E 2008): $804.01 M
2008E EPS: $5.10
Applied Investment Management XXVI 54

AIM ICE: Business/Business linesAIM ICE: Business/Business lines
• Operates an electronic futures and over-the-counterOperates an electronic futures and over the counter marketplace for the exchange of global commodity and financial products.
Applied Investment Management XXVI 55Applied Investment Management XXVI

AIM ICE: Revenue By Business LineAIM CE: Revenue y usiness Line
RRevenues12/31/2005 12/31/2006 12/31/2007 05-06 Growth 06-07 Growth
OTC Business 84,179 168,743 241,803 100.46% 43.30%Futures Business 60 082 127 024 289 333 111 42% 127 78% Futures Business 60,082 127,024 289,333 111.42% 127.78%
Market Data Business 11,604 18,032 43,157 55.39% 139.34% Total 155,865 313,799 574,293 101.33% 83.01%
Geographic Analysis
12/31/2005 12/31/2006 12/31/2007 % Split % Split
United States 90,202 178,100 376,012 56.76% 65.47%European Union & Canada 65 663 135 699 198 281 43 24% 34 53% European Union & Canada 65,663 135,699 198,281 43.24% 34.53%
Total 155,865 313,799 574,293
Applied Investment Management XXVI 56

AIM ICE: DiscoveryAIM ICE: Discovery
• Leo Melamed• Leo Melamed-CEO is shrewd and innovative-Still a potential acquisition target
• Dennis Gartman-Global demandNew products-New products
-Growth in the OTC segment
• Hedge Fund Manager• Hedge Fund Manager-28x PE multiple justified-30% growth year over year-Tougher comps in Q3, Q4 2008
Applied Investment Management XXVI 57
g p Q , Q

AIM ICE: Key MetricsAIM ICE: Key Metrics
ICE vs. CompetitorsPrice to Sales, Price to Book, Forward PE Multiple, PEG Ratio
25
15
20
ICE
CME
0
5
10 NYX
Price to Sales Price to Book Forward PE Multiple PEG Ratio
Applied Investment Management XXVI 58Applied Investment Management XXVI
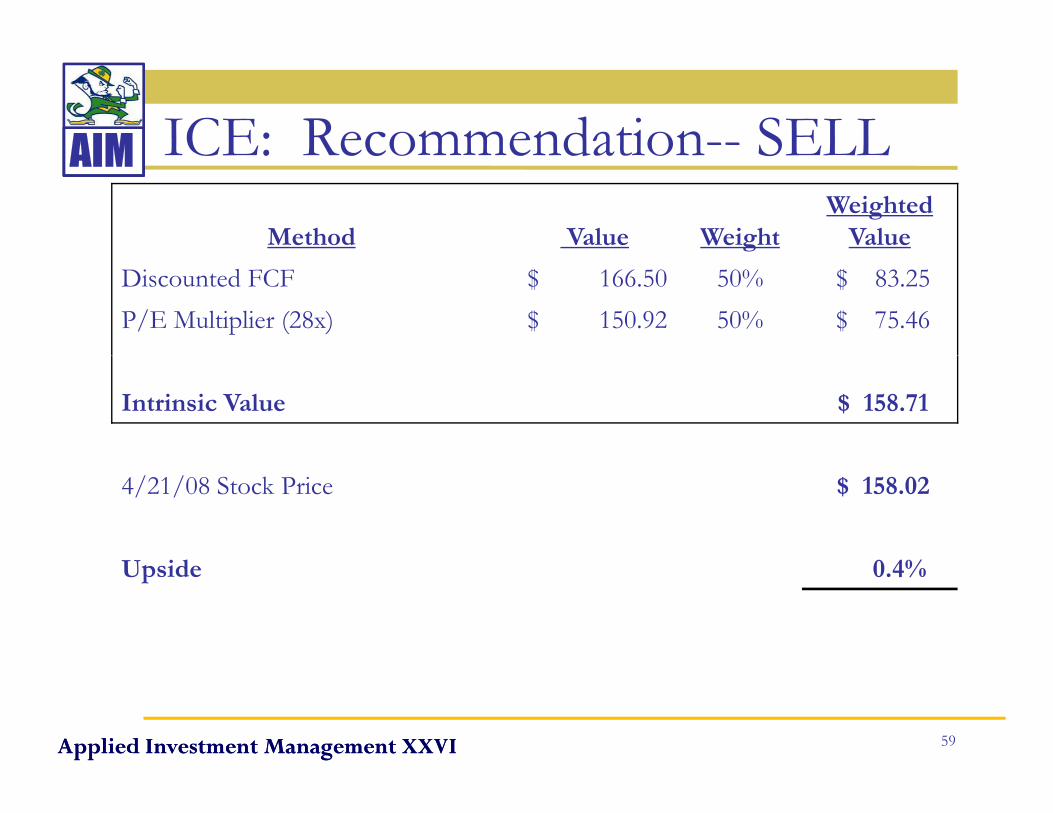
AIM ICE: Recommendation-- SELLAIM ICE: Recommendation SELLMethod Value Weight
Weighted Value
Discounted FCF $ 166.50 50% $ 83.25P/E Multiplier (28x) $ 150.92 50% $ 75.46
Intrinsic Value $ 158.71
4/21/08 Stock Price $ 158.02
U id 0 4%Upside 0.4%
Applied Investment Management XXVI 59Applied Investment Management XXVI

AIM Zhongpin, Inc: HOGSAIM Zhongpin, nc: HOGSAs of 21-Apr-08
Price: $10.68
Fwd P/E: 10.68
Mkt Cap: $281 M
R (E 2008) $497 MRev (E 2008): $497 M
2008E EPS: $1.00
Applied Investment Management XXVI 60

AIM Fast Growing Industry in ChinaAIM Fast Growing ndustry in China
• 50% of world pork consumption (5.2M ton in 2007)50% of world pork consumption (5.2M ton in 2007)• Meat processing industry: CAGR 22% (03-07)• Pork price rose by 67% in 2007Pork price rose by 67% in 2007
Applied Investment Management XXVI 61
Source: Boya Agriculture

AIM Fundamental TransitionAIM Fundamental Transition
• Strengthened regulationg g• Changing consumer behaviors • Consolidation of 30,000 small companies p
Commodities Price(Yuan/Kg) 1Q08 2Q 4Q08
Period(Yuan/Kg) 1Q08 2Q-4Q08
Corn 1.60Soybean 3.81Piglet 48.00Hog 17.60Pork 25.20
Applied Investment Management XXVI 62
Exchange rate: 6.9989 Yuan/USD

AIM Integrated Value ChainAIM ntegrated Value Chain
ProcessorFarmer Distributor Retailer Consumer
• Advanced
• L-T contract
• Unified breed feed
Advanced technology
• ISO9001/ HACCP/
breed, feed, quarantine, procurement
FDA
• Retail stores
• Higher income
• Rising living standard
• Distribution Centers
• ERP
• Restaurants
• Supermarkets
• Export
• Hygienic fresh meat
Applied Investment Management XXVI 63
• Refrigerated Trucks
p
Applied Investment Management XXVI

AIM Transformed State Owned EnterpriseAIM p
• Modernization process • Fast expansion (CAGR 77% 03-07)• Strong brand (Beijing Olympic meat provider)j
Sales
96%103%
120% $1,200MM
45%
72%
96%
71%
60%
80%
100%
$600
$800
$1,000
45%
26% 22% 18% 14%
0%
20%
40%
$0
$200
$400
Applied Investment Management XXVI 64
0%2003 2004 2005 2006 2007 2008e 2009e 2010e 2011e 2012e
$0
Applied Investment Management XXVI

AIM HOGS: Recommendation-- BUYAIM HOGS: Recommendation BUYMethod Value Weight
Weighted Value
P/S Multiplier (.52x) $ 8.49 30% $ 2.55 P/E Multiplier (12.18x) $ 12.10 30% $ 3.63Di d FCF $ 24 19 40% $ 9 68Discounted FCF $ 24.19 40% $ 9.68
Intrinsic Value $ 15.85
4/21/08 Stock Price $ 10.67
Upside 48.6%
Applied Investment Management XXVI 65Applied Investment Management XXVI

AIM Goldman Sachs (GS)AIM Goldman Sachs (GS)As of 21-Apr-08
Price: $181.20
/Fwd P/E: 10.62
Fwd P/B: 1.63
Mkt Cap: $74.42 B
Rev (E 2008): $78.14 B
2008E EPS: $16.95
Applied Investment Management XXVI 66Applied Investment Management XXVI

AIM GS: DuPont ModelAIM GS: DuPont Model2002 2003 2004 2005 2006 2007
ROA 0 6% 0 8% 1 0% 0 9% 1 2% 1 2%ROA 0.6% 0.8% 1.0% 0.9% 1.2% 1.2%ROE 11.4% 14.8% 19.5% 21.1% 29.5% 29.0%
Leverage Ratio 18.7 18.7 21.2 25.2 23.4 26.2
• DuPont Formula: ROE= Return on capital*LeverageDuPont Formula: ROE Return on capital Leverage– Financial companies use leverage to increase ROE– Retail companies use asset turnover to drive performancep p
Applied Investment Management XXVI 67Applied Investment Management XXVI

AIM GS: ProfitabilityAIM GS: Profitability2002 2003 2004 2005 2006 2007 AVG COMP
Gross Profit Margin 61.2% 67.8% 69.0% 57.3% 53.7% 51.9% 55.2% 25.9%
EBITDA Margin 17.5% 23.7% 25.2% 21.0% 22.4% 21.3% 18.6% 13.0%
Operating Margin 14.2% 18.8% 22.4% 19.1% 21.0% 20.0% 16.3% 11.5%
Net Profit Margin 9.3% 12.7% 15.3% 12.9% 13.6% 13.0% 11.5% 8.0%
• Financial performance has been very strongFinancial performance has been very strong– Higher ROE and profitability than all of their competitors– Much better at mitigating riskg g
Applied Investment Management XXVI 68Applied Investment Management XXVI

AIM GS: Financial Risk ProfileAIM GS: Financial Risk Profile2002 2003 2004 2005 2006 2007 AVG
Quick ratio 1.19 1.24 1.25 1.22 1.23 1.23 1.20
Debt to Equity Ratio 2.04 2.66 3.22 3.57 3.43 3.84 2.75
Total Debt Ratio 0.95 0.95 0.95 0.96 0.96 0.96 0.95
Coverage Ratio 1 58 2 11 2 32 1 37 1 18 1 09 1.34
• D/E ratio very high-necessary in brokerage industry• Quick ratio, total debt, and interest coverage ratio are low, but
Coverage Ratio 1.58 2.11 2.32 1.37 1.18 1.09 1.34
Q , , g ,consistent with historical levels– Note that interest income has been higher than interest expense each year
Applied Investment Management XXVI 69Applied Investment Management XXVI

AIM GS: Recommendation-- BUYAIM GS: Recommendation BUYMethod Value Weight
Weighted Value
P/B Multiplier (2.0x) $ 221.79 50% $ 110.89 P/E Multiplier (11.5x) $ 231.56 50% $ 115.78
Intrinsic Value $ 226.67
4/21/08 Stock Price $ 181.20
U id 25 2%Upside 25.2%
Applied Investment Management XXVI 70Applied Investment Management XXVI

AIM EMC Corp (EMC)AIM EMC Corp (EMC)As of 21-Apr-08
Price: $15.60
Fwd P/E: 16.59
Mkt Cap: 32.75B
R (E 2008) $13 23BRev (E 2008): $13.23B
2008E EPS: $0.77
Applied Investment Management XXVI 71Applied Investment Management XXVI

AIM Company BackgroundAIM Co pany ac ground
• EMC Corp specializes in information storage systems, software and services
Systems
• Information Lifecycle Management
Software License & Maintenance
Management
• VMware
Professional Systems Maintenace and Other Services
Applied Investment Management XXVI 72Applied Investment Management XXVI

AIM My EPS vs. Wall StreetAIM My EPS vs. Wall Street2008 EPS Projectons
0 95
1.05
1.15
0.65
0.75
0.85
0.95
0.45
0.55
Applied Investment Management XXVI 73Applied Investment Management XXVI

AIM EMC’s Stake in VMWAIM EMC s Stake in VMWEMC's Vmware Ownership Valuation as of 4/8/2008T t l V h 385 5 385 5 385 5 385 5Total Vmware shares 385.5 385.5 385.5 385.5VMW Target Share Price 64.00$ 64.00$ 64.00$ 64.00$ VMW Mkt Cap 24,672$ 24,672$ 24,672$ 24,672$ Class A and B shares owned by EMC 331 331 331 331VMW owned by EMC 86% 86% 86% 86%
VMW owned by EMC 21,193 21,193 21,193 21,193Liquidity Discount 20% 15% 10% 5%
EMC's VMW w/ Liquidity Discount 16,955$ 18,014$ 19,074$ 20,134$q y , , , ,Total EMC Shares 2158 2158 2158 2158As per EMC share 7.86$ 8.35$ 8.84$ 9.33$
EMC Share Value w/ VMW 18.53$ 19.02$ 19.51$ 20.00$
Applied Investment Management XXVI 74Applied Investment Management XXVI

AIM EMC: Recommendation-- BUYAIM EMC: Recommendation BUY
Method Value WeightWeighted
Valueg
EMC Standalone (FCF) $ 10.67 100% $ 10.67
Discounted FCF w/VMW stake $ 19.02 50% $ 9.51 P/E Multiplier (20x) $ 17.40 50% $ 8.70
Intrinsic Value $ 18.21
4/21/08 Stock Price $ 14.80
Upside 23%
Applied Investment Management XXVI 75
Upside 23%
Applied Investment Management XXVI

AIM Sensitivity AnalysisAIM Sensitivity nalysis
EMC Sensitivity to VMW Price for FCF ValuationEMC Sensitivity to VMW Price for FCF Valuation"+ 1 SD" VMW Price 71.77$
Resulting EMC DCF Value 20.04$
Intrinsic Value 18.72$
"- 1 SD" 32.85$ 1 SD 32.85$ Resulting EMC DCF Value 14.97$
Intrinsic Value 16.19$
Applied Investment Management XXVI 76Applied Investment Management XXVI

AIM Service Corp International (SCI)AIM Service Corp nternational (SC )As of 21-Apr-08
Price: $10.35
Fwd P/E: 14.58
Mkt Cap: $2.71 B
R (E 2008) $2 29 BRev (E 2008): $2.29 B
2008E EPS: $0.60
Applied Investment Management XXVI 77Applied Investment Management XXVI

AIM Background & IndustryAIM Background & IndustryRevenue by Business Unit Industry Competitors MCap & Revenue
$3 000$759.9 $1,525.3
$1,000
$2,000
$3,000
n m
illi
ons) MCAP
Revenue
Funeral Cemetery
$0
$1,000
SCI STEI STON CSV
(in
• Leading provider of deathcare products and services
• Operate 1,300 funeral homes and 350 cemeteries in 43 states
• Recently acquired largest competitor for $1 2B in cash and debt
Applied Investment Management XXVI 78
• Recently acquired largest competitor for $1.2B in cash and debt
Applied Investment Management XXVI

AIM DCF Model – Method & Key DriversAIM y
Method:Forecast revenues, net income, & free cash flows for 2008 – 2013
-Five year high growth period free cash flows discounted at WACC
-Terminal free cash flow discounted at WACC
Sum of discounted future CFs + Excess cash – Liabilities = Equity Value
Applied Investment Management XXVI 79

AIM DCF Model – Method & Key DriversAIM y
Key Drivers:
•Revenue: Modest growth for 2008: 3%; increasing to 5% by 2013
•Expenses: Conservative and gradual decline for COGS & SGA as POS
-Reflective of synergies from Alderwoods acquisitionReflective of synergies from Alderwoods acquisition
•Cap Ex: $150-$250M annual for expansion & existing location maintenance
•Terminal Growth Rate: 3.75% to reflect long term growth
Applied Investment Management XXVI 80

AIM Forecasted Net Income & EPSAIM Forecasted Net Income & EPSForecasted Net Income & EPS
$0.93$0.84
$250
$300$0.90$1.00
$169$181 $190
$207$221
$241$0.78
$0.70$0.66$0.60
$150
$200
$250
me
($00
0s)
$0 50$0.60$0.70$0.80
PS$169
$50
$100
$150
Net
Inco
m
$0.20$0.30$0.40$0.50
EP
$-
$50
2008 2009 2010 2011 2012 2013$-$0.10
Net Income EPS
Forecasted 2008 - 2013
Applied Investment Management XXVI 81
Net Income: $169M - $241M EPS: $0.60 - $0.93
Applied Investment Management XXVI

AIM Forecasted Revenue & FCFAIMForecasted Revenue & FCF 2008 - 2013
$2 947$2 807
$3,500 $250
Forecasted Revenue & FCF
$2,354 $2,448$2,947$2,807
$2,546 $2,673
$2,000
$2,500
$3,000
($00
0s)
$150
$200
0,00
0s)
$1,000
$1,500
Rev
enue
$50
$100
FCF
($00
0
$-
$500
2008 2009 2010 2011 2012 2013
$-
$
Revenue Cash Flows
Forecasted 2008 - 2013
Applied Investment Management XXVI 82
Revenue: $2.3B - $2.9B FCF: $120M - $200M
Applied Investment Management XXVI

AIM Beta & WACCAIMBeta 0.83
Beta & WACC
Risk-Free Rate (10 year bond) 3.47%Market Risk Premium 5.00%Marginal Ta Rate 36 00%Marginal Tax Rate 36.00%
Estimates: D bt W i ht 37 42%Debt Weight 37.42%Equity Weight 62.58%Cost of Debt 4.54%Cost of Equity 7.62%WACC 5.86%
Applied Investment Management XXVI 83
FCF estimated intrinsic share value of $13.08Applied Investment Management XXVI

AIM SCI: Recommendation-- BUYAIM SCI: Recommendation BUYMethod Value Weight
Weighted Value
Discounted FCF $ 13.08 90% $ 11.77 P/E Multiplier (20.0x) $ 12.00 10% $ 1.20
Intrinsic Value $ 12.97
4/21/08 Stock Price $ 10.61
U id 22 2%Upside 22.2%
Applied Investment Management XXVI 84Applied Investment Management XXVI

AIM Equifax (EFX)AIM Equi a (EFX)As of 21-Apr-08
Price: $36.13
Fwd P/E: 14.6
Mkt Cap: $4.65 B
R (E 2008) $2 03 BRev (E 2008): $2.03 B
2008E EPS: $2.30
Applied Investment Management XXVI 85Applied Investment Management XXVI

AIM Equifax (EFX)AIM Equi a (EFX)•Largest personal credit reporting agency in US by revenue
•Database contains files on 220 million people domestically
Oli l 2 tit (E i T U i )•Oligopoly - 2 competitors (Experian, TransUnion)
Consumer Services 74%
Personal Solutions 10%
Small Business 4%
Applied Investment Management XXVI 86
TALX 12%
Applied Investment Management XXVI
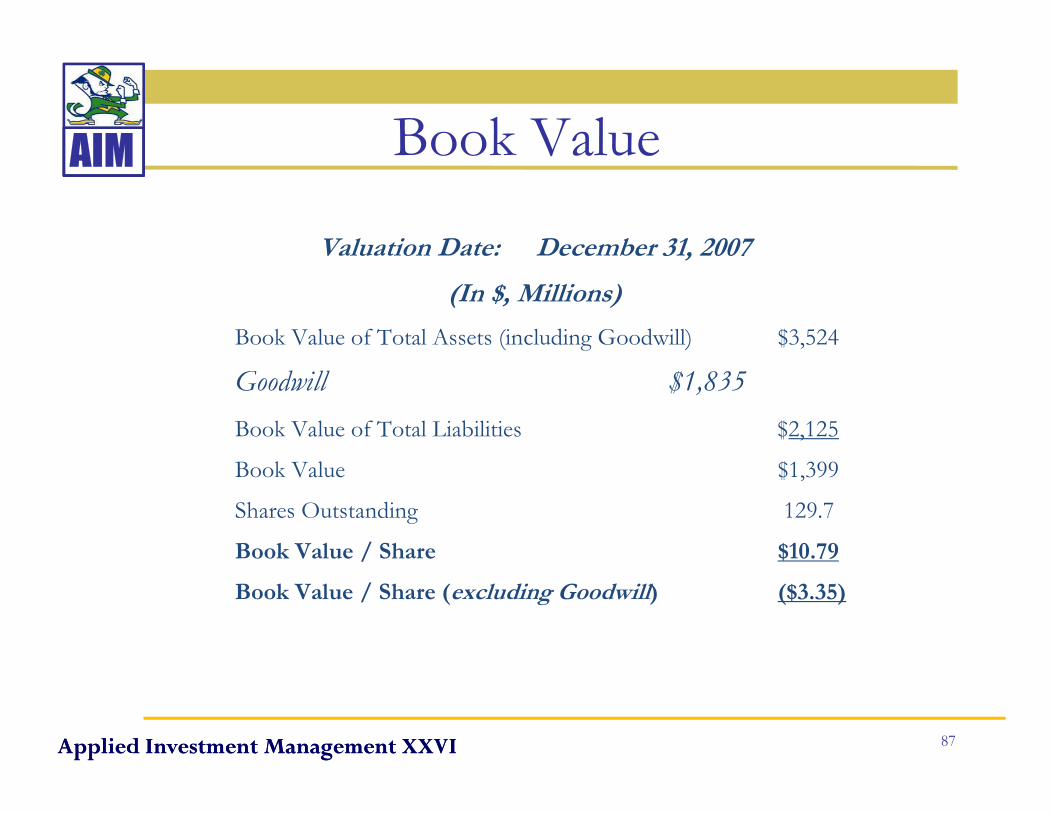
AIM Book ValueAIM Book Value
Valuation Date: December 31, 2007Valuation Date: December 31, 2007
(In $, Millions)
Book Value of Total Assets (including Goodwill) $3,524
Goodwill $1,835
Book Value of Total Liabilities $2,125
Book Value $1,399
Shares Outstanding 129.7
Book Value / Share $10.79/ $
Book Value / Share (excluding Goodwill) ($3.35)
Applied Investment Management XXVI 87Applied Investment Management XXVI

AIM Forward P/S Model = 33% WeightAIM Forward P/S Model 33% Weight
Forward Sales/Share $16.02 Estimated Price/Sales 2.68Estimated Price/Sales 2.68Intrinsic P/S Value $42.93
4/21/08 Stock Price $36.13Trading at a Discount of 19%Trading at a Discount of 19%
Applied Investment Management XXVI 88Applied Investment Management XXVI

AIM Forward P/E Model = 33% WeightAIM Forward P/E Model 33% Weight
Forecasted Price/Earnings $2.37 Estimated Forward P/E 16.4Estimated Forward P/E 16.4Intrinsic P/E Value $38.87
4/21/08 Stock Price $36.13Trading at a Discount of 8%Trading at a Discount of 8%
Applied Investment Management XXVI 89Applied Investment Management XXVI

AIM EFX: Recommendation-- BUYAIM EFX: Recommendation BUYMethod Value Weight
Weighted Value
P/S Multiplier (2.68x) $ 38.87 33% $ 14.17 P/E Multiplier (16.4x) $ 42.93 33% $ 12.82 Di d FCF $ 40 62 34% $ 13 81Discounted FCF $ 40.62 34% $ 13.81
Intrinsic Value $ 40.80
4/21/08 Stock Price $ 36.13
Upside 12.9%
Applied Investment Management XXVI 90Applied Investment Management XXVI

AIM Boston Private Financial Holdings (BPFH)AIM Boston Private Financial Holdings (BPFH)As of 21-Apr-08
Price: $10.01
Fwd P/E: 7.3
Mkt Cap: $341.3 M
Rev (E 2008): $521 3 MRev (E 2008): $521.3 M
2008E EPS: $1.32
Applied Investment Management XXVI 91Applied Investment Management XXVI
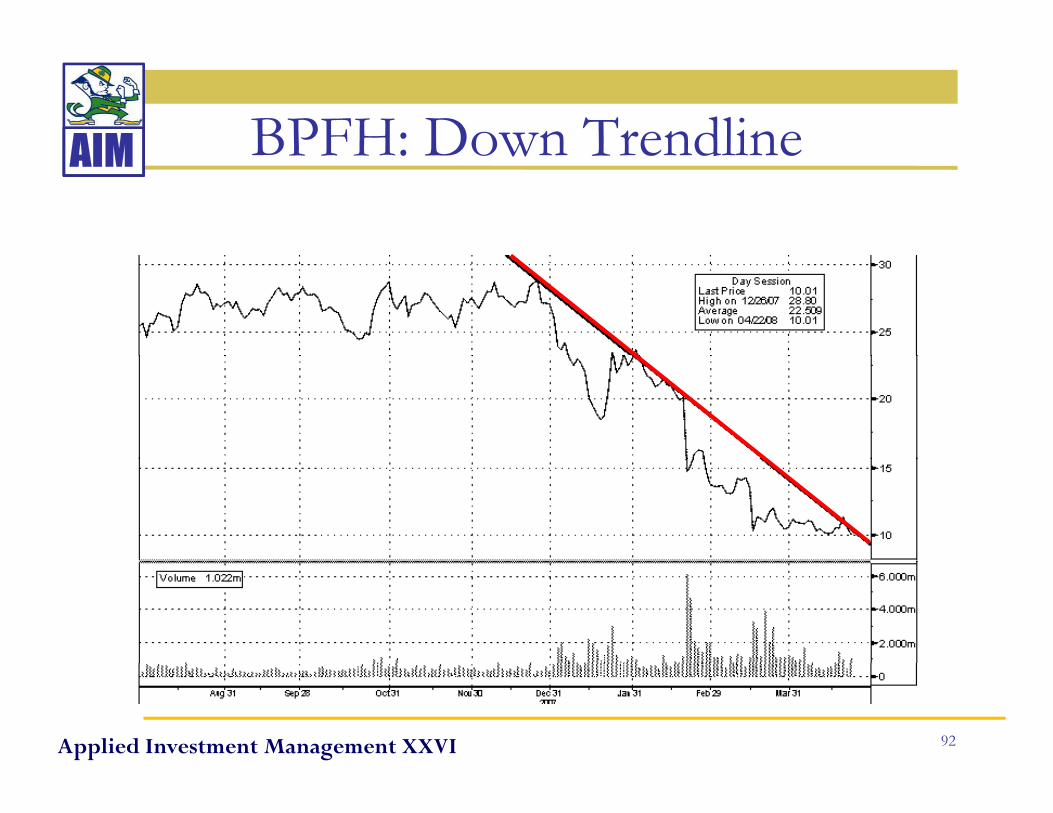
AIM BPFH: Down TrendlineAIM BPFH: Down Trendline
Applied Investment Management XXVI 92

AIM BPFH: $10.00 Support LevelAIM PFH: $ 0.00 Support Level
Applied Investment Management XXVI 93
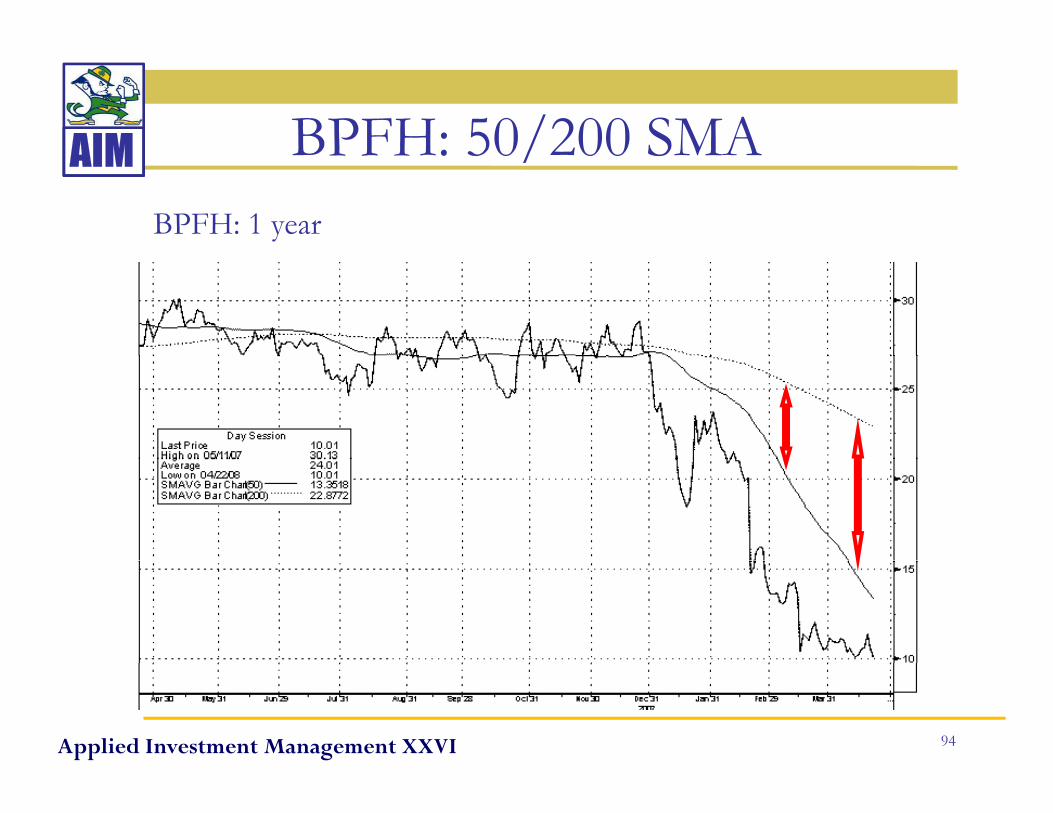
AIM BPFH: 50/200 SMAAIM BPFH: 50/200 SMABPFH: 1 year
Applied Investment Management XXVI 94

AIM BPFH: MACDAIM BPFH: MACD
MACD CrossoverLong @ $10.80
Applied Investment Management XXVI 95

AIM BPFH: Head & ShouldersAIM BPFH: Head & Shoulders
Neckline break$21.20
Applied Investment Management XXVI 96

AIM BPFH: Recommendation-- BUYAIM BPFH: Recommendation BUYMethod Value Weight
Weighted Value
Discounted FCF $ 16.30 33% $ 5.43P/E Multiplier (12x) $ 16.52 33% $ 5.51 P/B M l i li (1 ) $ 18 04 33% $ 6 01P/B Multiplier (1x) $ 18.04 33% $ 6.01
Intrinsic Value $ 16.95
4/21/08 Stock Price $ 10.01
Upside 69.3%
Applied Investment Management XXVI 97Applied Investment Management XXVI

AIMAIM
Portfolio PerformanceCourse
O i
Portfolio
P f
General
I f ti
Security
A l i
Economic
O tl kOverview Performance InformationAnalysisOutlook
Applied Investment Management XXVI 98

AIM AgendaAIM Agenda
Hi i l f• Historical performance• Risk adjusted performance measures• Attribution analysis• Best & worst performersBest & worst performers• Portfolio transactions
O i f fi l f li• Overview of final portfolio
Applied Investment Management XXVI 99

AIM Historical PerformanceAIM Historical PerformanceAIM Portfolio Returns against S&P500 as of 3/31/08
(all returns annualized)
10 00
15.00
(all returns annualized)
5.00
10.00
ange
-5.00
0.00% c
ha
-10.001 year 3 year 5 year Inception
Applied Investment Management XXVI 100
AIM S&P 500
Applied Investment Management XXVI

AIM Historical PerformanceAIM Historical Performance AIM Portfolio Performance vs Russell2000 and HBI
(all returns annualized)
15 00
20.00
5.00
10.00
15.00
ange
-5.00
0.00% c
ha
-15.00
-10.00
1 year 3 year 5 year Inception
Applied Investment Management XXVI 101
AIM Russell 2000 HBI
Applied Investment Management XXVI

AIM Historical PerformanceAIM Historical Performance $1 Investment Since Inception
$4 00$4.50$5.00
$2.50$3.00$3.50$4.00
$1.00$1.50$2.00$
$0.50
1/1/
96
1/1/
97
1/1/
98
1/1/
99
1/1/
00
1/1/
01
1/1/
02
1/1/
03
1/1/
04
1/1/
05
1/1/
06
1/1/
07
1/1/
08
Applied Investment Management XXVI 102
AIM Russell 2000 S&P 500 HBI
Applied Investment Management XXVI

AIM Historical PerformanceAIM Historical Performance $1 Invested 1/1/2003
$2.00
$2.50
$1.50
$1.00
$0.50
Jan-
03
Apr
-03
Jul-0
3
Oct
-03
Jan-
04
Apr
-04
Jul-0
4
Oct
-04
Jan-
05
Apr
-05
Jul-0
5
Oct
-05
Jan-
06
Apr
-06
Jul-0
6
Oct
-06
Jan-
07
Apr
-07
Jul-0
7
Oct
-07
Jan-
08
Applied Investment Management XXVI 103
AIM HBI
Applied Investment Management XXVI
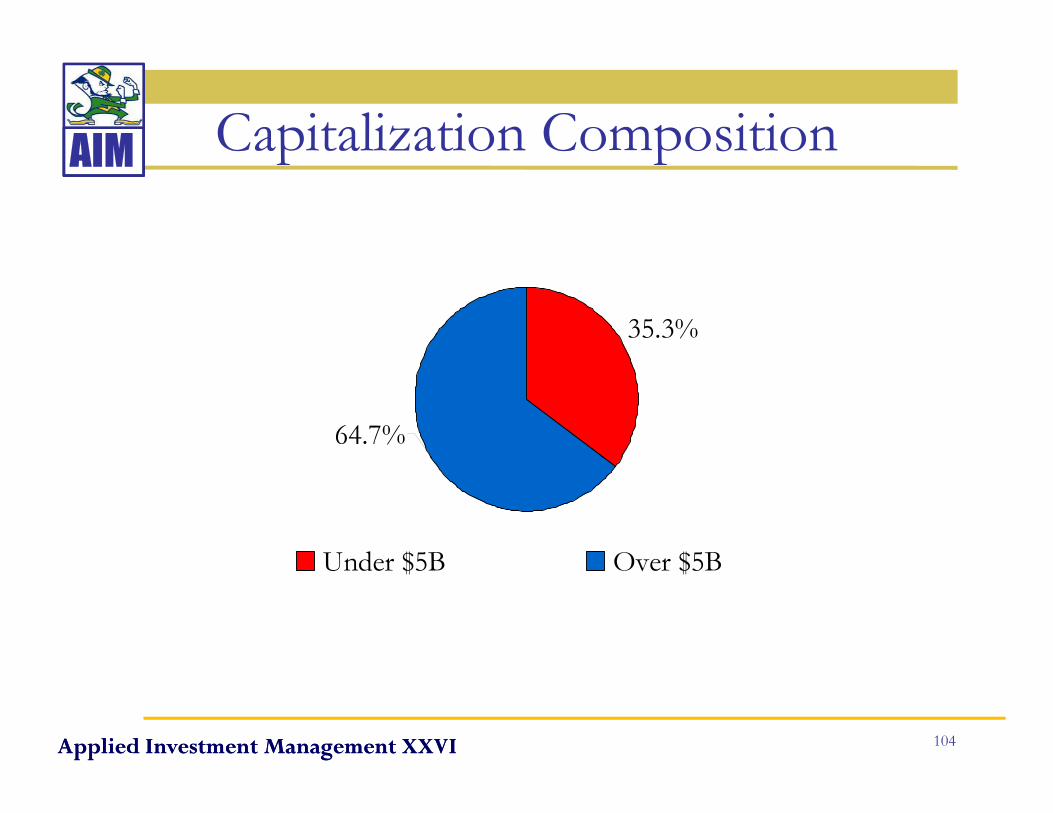
AIM Capitalization Composition AIM Capitalization Co position
35.3%
64.7%
Under $5B Over $5BUnder $5B Over $5B
Applied Investment Management XXVI 104Applied Investment Management XXVI

AIM Risk-adjusted PerformanceAIM Ris adjusted Per or ance
• MeasuresMeasures– Sharpe Ratio
Treynor Ratio– Treynor Ratio– Jensen’s Alpha
• Considerations– Annualized monthly returns– Risk-free rate: 1 month T-Bill rate
Applied Investment Management XXVI 105
AIM Sharpe RatioAIM Sharpe Ratio• Sharpe Ratio- how much excess return you are p y
receiving for the extra volatility that you endure for holding a riskier asset over a risk-free assetg
• Greater ratio, better risk-adjusted performancej p
• Formula: Portfolio return - Risk-free rate
Portfolio standard deviation
Applied Investment Management XXVI 106

AIM Sharpe RatioAIM Sharpe Ratio
3.854 00
5.00
3.39
1.88 1 74
3.00
4.00
1.74
1.00
2.00 AIM Portfolio
S&P 500 Index 1-Yr
-1.00
0.00 Russell 2000 Index
HBI5-Yr Since Inception
-2.63 -2.54-3.00
-2.00
Applied Investment Management XXVI 107
-4.00

AIM Treynor RatioAIM Treynor Ratio• Treynor Ratio- a risk-adjusted measure of return y j
per unit of systemic risk
• Major difference with Sharpe Ratio is the use of beta instead of standard deviation
• Formula:Portfolio return - Risk-free rate
Portfolio beta
Applied Investment Management XXVI 108

AIM Treynor RatioAIM Treynor Ratio
11.53 11.88
15.00
8.817.56
5 00
10.00
0.00
5.00AIM Portfolio
S&P 500 Index
Russell 2000 Index 1-Yr
-5.00
ss d
HBI5-Yr Since Inception
-10.31
-8.64-10.00
Applied Investment Management XXVI 109
-15.00

AIM Jensen’s AlphaAIM Jensen s lpha
• Jensen’s Alpha- represents the average returnJensen s Alpha represents the average return on the portfolio over and above the required rate of return given the portfolio's beta and therate of return, given the portfolio s beta and the average market return.
• If positive, portfolio is earning excess returns
• Formula: Port. Return-[Rf +Bp(RM -Rf)]
Applied Investment Management XXVI 110

AIM Jensen’s AlphaAIM Jensen s lpha2.29
2 00
3.00
1.47
0.75
0.481.00
2.00
-0.38
-1.00
0.00 AIM Portfolio
S&P 500 Index
Russell 2000 Index-1.41
-1.59 -1.48
3 00
-2.00
Russell 2000 Index
1-Yr 5-Yr Since Inception
-4.16
-4.00
-3.00
Applied Investment Management XXVI 111
-5.00

AIM Risk-adjusted PerformanceAIM Ris adjusted Per or ance• Since inceptionp
– Outperformed all comparable indices– Positive Alpha
• Last 1 year & last 5 years• Last 1 year & last 5 years– Underperformed HBI & S&P 500– Negative AlphaNegative Alpha
Applied Investment Management XXVI 112
AIM Attribution AnalysisAIM ttribution nalysis
• ComponentsComponents– Allocation
Selection– Selection– Net management
I t ti ( it )– Interaction (composite)• Relative to benchmark
Applied Investment Management XXVI 113

AIM Industry Attribution – 5 yearAIM ndustry ttribution 5 year2.0
Financials
Consumer Disc.
1.0
1.5
IndustrialsHealthcare
Utilities
Materials
TelecomConsumer Staples
Energy IT
0.5%
Energy
-0.5
0.0
-1.5
-1.0
Allocation Selection Net management
Applied Investment Management XXVI 114

AIM Industry Attribution – 1 yearAIM ndustry ttribution year5.0
Financials
3.0
4.0
Healthcare
Utilities Telecom MaterialsConsumer Staples
Energy Industrials IT Consumer Disc.0.0
1.0
2.0
%
-2.0
-1.0
-5.0
-4.0
-3.0
Allocation Selection Net management
Applied Investment Management XXVI 115

AIM Composite Attribution AnalysisAIM Co posite ttribution nalysis
6
2
4
0
2
1�YEAR 3�YEAR 5�YEAR
Allocation
Selection
�4
�2 Net�Management
�8
�6
Applied Investment Management XXVI 116
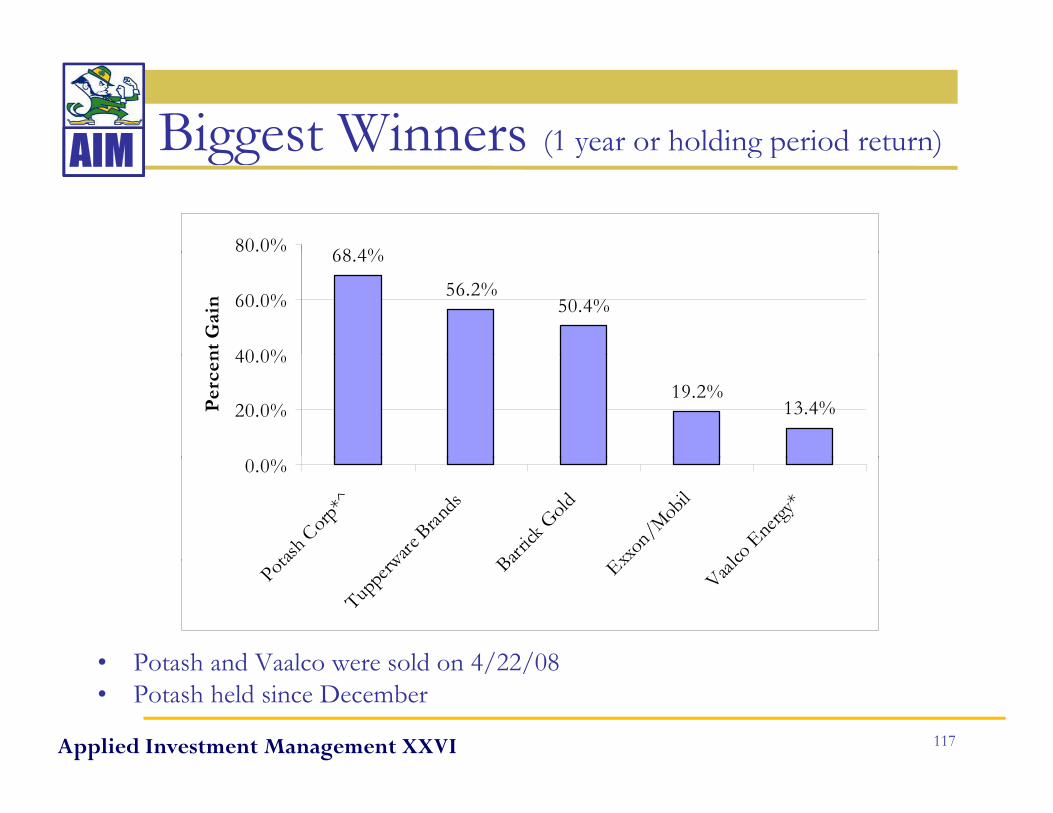
AIM Biggest Winners (1 year or holding period return)AIM iggest Winners ( yea o ho d g pe od etu )
68 4%80.0% 68.4%
56.2%50.4%
40 0%
60.0%
nt
Gai
n
19.2%13.4%20.0%
40.0%
Per
cen
0.0%
tash C
orp*^
ware Bran
ds
Barrick
Gold
Exxon/M
obil
lco E
nergy
*
• Potash and Vaalco were sold on 4/22/08
Pota
Tuppe
rw Ba Ex
Vaalc
Applied Investment Management XXVI 117
• Potash and Vaalco were sold on 4/22/08• Potash held since December

AIM Biggest Losers (1 year or holding period return)AIM iggest Losers ( yea o ho d g pe od etu )
NutriSystems PMI United Health G
McGraw-Hill
Getty I
20 0%
-10.0%
0.0%
yGroup Hill Images
40 2% 39 9%-37.6%-40.0%
-30.0%
-20.0%
-40.2% -39.9%
-60.0%
-50.0%
• NutriSystems PMI Getty sold 4/22
-66.0% -65.6%-70.0%
Applied Investment Management XXVI 118
NutriSystems, PMI, Getty sold 4/22

AIM BuysAIM uys
Stock TickerCurrent
Price (4/24)Intrinsic
Value Upside( ) p
FCStone Group, Inc FCSX $41.66 $45.22 8.5%Boeing Co BA $78.97 $87.24 10.5%
Stocks Added to Portfolio
EMC Corp EMC $15.94 $18.22 14.3%Progress Energy Inc PGN $41.77 $48.00 14.9%Service Corp Intl SCI $10.53 $12.97 23.2%
$ $Goldman Sachs Group GS $181.20 $227.00 25.3%Republic Services Inc RSG $31.08 $39.00 25.5%Boston Private Financial BPFH $10.64 $15.40 44.7%Zh i I HOGS $10 85 $15 85 46 1%
• FCStone – Commodity risk management company• Progress Energy – Electricity utility focused in Southeast
Zhongpin, Inc HOGS $10.85 $15.85 46.1%
Applied Investment Management XXVI 119
g gy y y• Republic Services – Waste management

AIM SellsAIM SellsCurrent Intrinsic
Stock Ticker Price (4/24) Value Upside
Weyerhaueuser WY $63.47 $52.60 -17.1%G $ $ %
Stocks Removed from Portfolio
Vaalco Energy EGY $6.47 $5.48 -15.3%Potash Corp POT $208.05 $198.00 -4.8%Getty Images GYI $32.50 $31.52 -3.0%PMI Group PMI $5 40 $5 25 2 8%PMI Group PMI $5.40 $5.25 -2.8%Apple AAPL $165.96 $167.00 0.6%Pepsico PEP $69.91 $71.65 2.0%LOOPNet LOOP $11 07 $12 47 13 0%LOOPNet LOOP $11.07 $12.47 13.0%Nutri Systems NTRI $20.72 $23.80 15.0%
Applied Investment Management XXVI 120
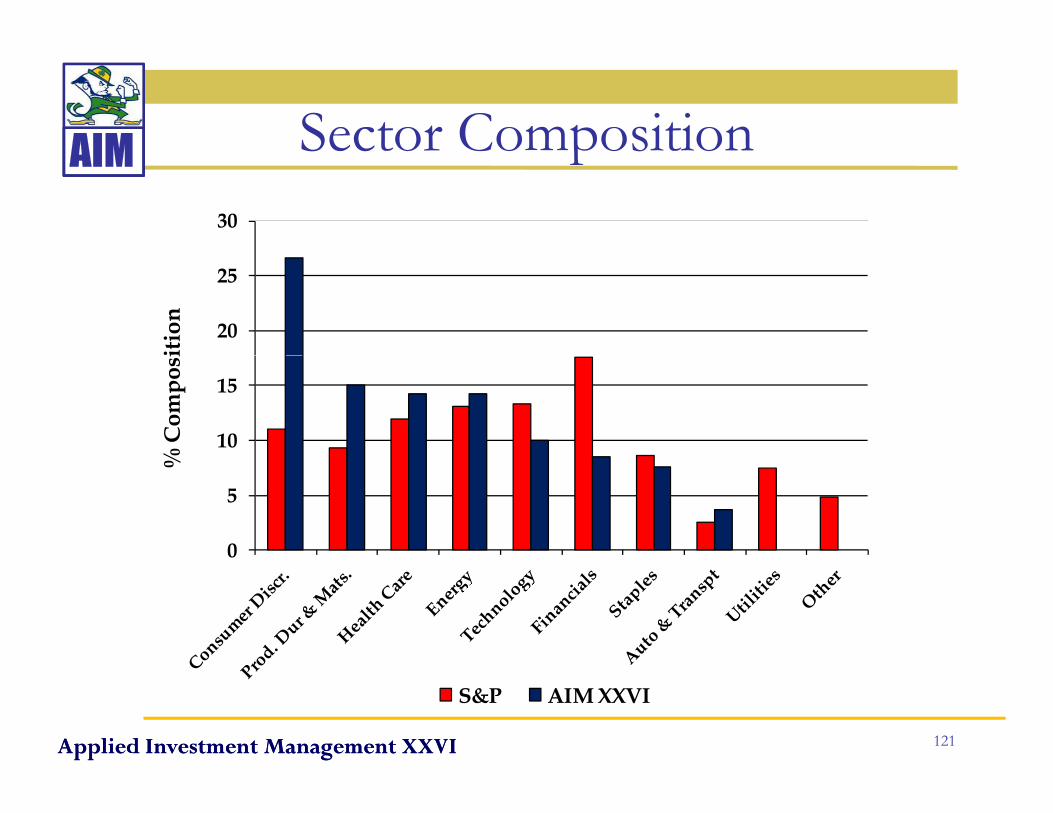
AIM Sector CompositionAIM
30
Sector Co position
20
25
ition
10
15
% C
ompo
si
0
5
%
Applied Investment Management XXVI 121
S&P AIM XXVI
Applied Investment Management XXVI

AIM Our ObjectivesAIM Our Objectives
• Increase our holdings in financialsIncrease our holdings in financials
Add ili di if• Add a utility to diversify
• Decrease our exposure to consumer discretionaryy
Applied Investment Management XXVI 122

AIM Percentage Change In HoldingsAIM Percentage Change n Holdings
144%Financial
100%
100%
144%
Other
Utilities
Financial Services
7%
14%Auto & TransTechnology
H lth C
-20%
4%
4%Health Care
Consumer Staples
Prod. Durables &
-51%
-44%
20%MaterialsConsumer Discretionary
Energy
Applied Investment Management XXVI 123
-100% -50% 0% 50% 100% 150% 200%y

AIM New Portfolio AllocationsAIM New Portfolio Allocations
20
25
on
10
15 S&P
AIMCom
posi
tio
0
5% C
Applied Investment Management XXVI 124

AIMAIM
General InformationCourse
O i
Portfolio
P f
General
I f ti
Security
A l i
Economic
O tl kOverview Performance InformationAnalysisOutlook
Applied Investment Management XXVI 125

AIM SpeakersAIM Spea ers
• Professor Ed TrubacProfessor Ed Trubac– Current economic overview
– Key point for 2008: watch the Fed
– Important economic trends for AIM portfoliop p
Applied Investment Management XXVI 126

AIM Cleveland Research CompanyAIM Cleveland Research Co pany
• Tom Mahoney (AIM Alum) and Jason WhitmerTom Mahoney (AIM Alum) and Jason Whitmer • An independent investment research firm• Concentrates on 4 sectors:Concentrates on 4 sectors:
– Consumer, Industrial, Technology, and Healthcare.
• Research methodology: case studyResearch methodology: case study – Kroger Co., examine fundamentals; Cleveland’s research
approach.
Applied Investment Management XXVI 127

AIM Express-1 Expedited Solutions, Inc. AIM p p ,
• CEO Michael Welch and CFO Mark PattersonCEO Michael Welch and CFO Mark Patterson
B d i B h MI• Based in Buchanan, MI– Concentrates on timely transportation of freight – Critical shipments in US, Mexico, and Canada
Applied Investment Management XXVI 128

AIM Cross River PartnersAIM Cross River Partners
• Richard Murphy (AIM Alum) and MikeRichard Murphy (AIM Alum) and Mike McCartan
• Private investment partnership– Concentrate on small companiesp– Specialize in exhaustive, bottom-up research
• Their investment thesis on Express-1
Applied Investment Management XXVI 129

AIM Boston TripAIM oston Trip
• Sankaty Advisors y– Distressed debt, mezzanine debt, leveraged loans
and high-yield bond investing
• Bain Capital– Private equity funds
• BNY Mellon Evolution of theory: CAPM and technology
Applied Investment Management XXVI 130
– Evolution of theory: CAPM and technology

AIM Boston TripAIM oston Trip
• Summit PartnersSummit Partners– Private equity funds and venture capital funds
Cold calls to generate leads– Cold calls to generate leads
G l i R• Geologic Resources – Real assets metals and mining– Long/short equity fund focused on the natural
resource sector
Applied Investment Management XXVI 131

AIM NewsletterAIM Newsletter• Objectivesj
– Allows AIM Alumni to stay up to date – Provides quarterly overview of present portfolio
• Current newsletter points of interest:New portfolio– New portfolio
– AIM Alumni updates– Boston trip review– Quick economic snapshots– Current AIM analysts’ future plans
Applied Investment Management XXVI 132

AIM AIM WebsiteAIM AIM WebsiteAreas of Interest–Analysts and Alumni–Publications–Portfolio–News
Applied Investment Management XXVI 133

AIM AIM on FacebookAIM AIM on Facebook
Applied Investment Management XXVI 134

AIM AIM Contact InformationAIM AIM Contact Information
Websitehttp://aim nd eduhttp://aim.nd.edu
M il AddE-Mail Addressaim@nd [email protected]
Applied Investment Management XXVI 135Applied Investment Management XXVI

AIM Thank YouAIM Than You
AIM Advisory BoardAIM Advisory BoardThe Notre Dame Investment Office
Scott MalpassScott Malpass
Professor Frank Reilly Rachel KarnafelProfessor Frank Reilly Rachel KarnafelProfessor Jerry Langley Professor Ed TrubacPr f ss r Bill M D n ldProfessor Bill McDonald
Please join us for pizza and a question and answer panel in a few moments
Applied Investment Management XXVI 136
Please join us for pizza and a question and answer panel in a few moments