Agriculture - Planning Commissionplanningcommission.gov.in/hackathon/Agriculture.pdf · 4 Twelfth...
50
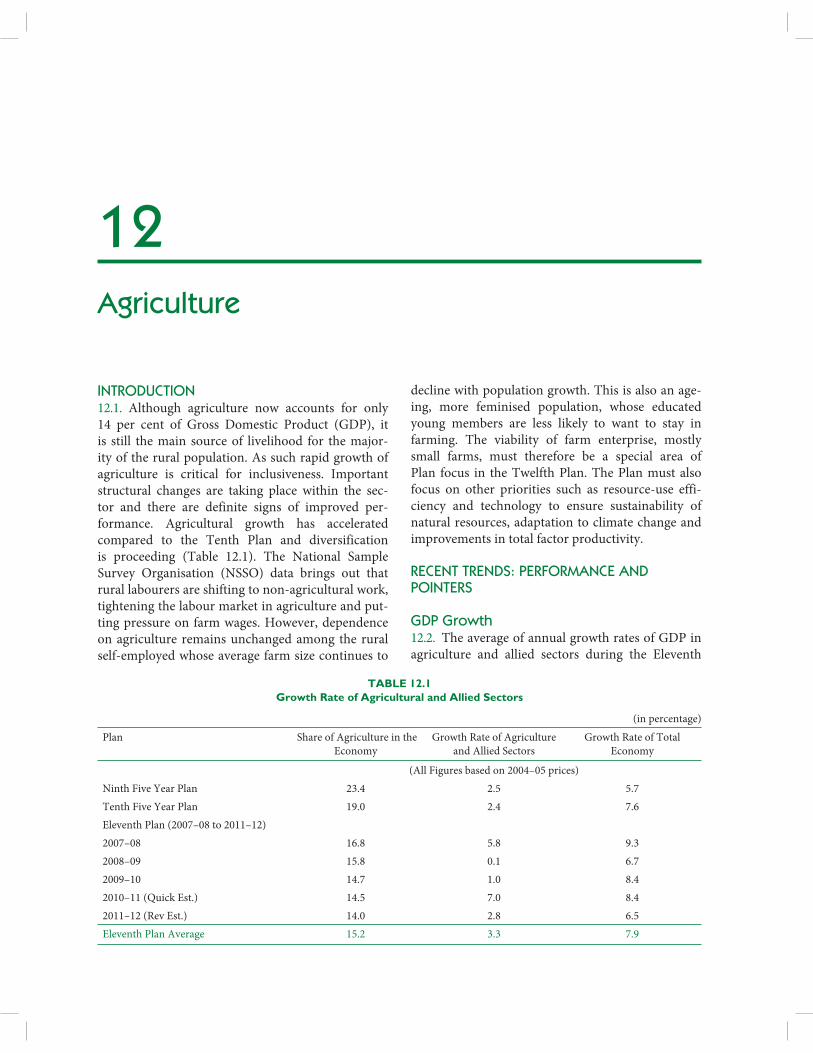
INTRODUCTION 12.1. Although agriculture now accounts for only 14 per cent of Gross Domestic Product (GDP), it is still the main source of livelihood for the major- ity of the rural population. As such rapid growth of agriculture is critical for inclusiveness. Important structural changes are taking place within the sec- tor and there are definite signs of improved per- formance. Agricultural growth has accelerated compared to the Tenth Plan and diversification is proceeding (Table 12.1). The National Sample Survey Organisation (NSSO) data brings out that rural labourers are shifting to non-agricultural work, tightening the labour market in agriculture and put- ting pressure on farm wages. However, dependence on agriculture remains unchanged among the rural self-employed whose average farm size continues to 12 Agriculture decline with population growth. This is also an age- ing, more feminised population, whose educated young members are less likely to want to stay in farming. The viability of farm enterprise, mostly small farms, must therefore be a special area of Plan focus in the Twelfth Plan. The Plan must also focus on other priorities such as resource-use effi- ciency and technology to ensure sustainability of natural resources, adaptation to climate change and improvements in total factor productivity. RECENT TRENDS: PERFORMANCE AND POINTERS GDP Growth 12.2. The average of annual growth rates of GDP in agriculture and allied sectors during the Eleventh TABLE 12.1 Growth Rate of Agricultural and Allied Sectors (in percentage) Plan Share of Agriculture in the Economy Growth Rate of Agriculture and Allied Sectors Growth Rate of Total Economy (All Figures based on 2004–05 prices) Ninth Five Year Plan 23.4 2.5 5.7 Tenth Five Year Plan 19.0 2.4 7.6 Eleventh Plan (2007–08 to 2011–12) 2007–08 16.8 5.8 9.3 2008–09 15.8 0.1 6.7 2009–10 14.7 1.0 8.4 2010–11 (Quick Est.) 14.5 7.0 8.4 2011–12 (Rev Est.) 14.0 2.8 6.5 Eleventh Plan Average 15.2 3.3 7.9
Transcript of Agriculture - Planning Commissionplanningcommission.gov.in/hackathon/Agriculture.pdf · 4 Twelfth...
INTRODUCTION12.1. Although agriculture now accounts for only 14 per cent of Gross Domestic Product (GDP), it is still the main source of livelihood for the major-ity of the rural population. As such rapid growth of agriculture is critical for inclusiveness. Important structural changes are taking place within the sec-tor and there are definite signs of improved per-formance. Agricultural growth has accelerated compared to the Tenth Plan and diversification is proceeding (Table 12.1). The National Sample Survey Organisation (NSSO) data brings out that rural labourers are shifting to non-agricultural work, tightening the labour market in agriculture and put-ting pressure on farm wages. However, dependence on agriculture remains unchanged among the rural self-employed whose average farm size continues to
12Agriculture
decline with population growth. This is also an age-ing, more feminised population, whose educated young members are less likely to want to stay in farming. The viability of farm enterprise, mostly small farms, must therefore be a special area of Plan focus in the Twelfth Plan. The Plan must also focus on other priorities such as resource-use effi-ciency and technology to ensure sustainability of natural resources, adaptation to climate change and improvements in total factor productivity.
RECENT TRENDS: PERFORMANCE AND POINTERS
GDP Growth12.2. The average of annual growth rates of GDP in agriculture and allied sectors during the Eleventh
TABLE 12.1Growth Rate of Agricultural and Allied Sectors
(in percentage)
Plan Share of Agriculture in the
Economy
Growth Rate of Agriculture
and Allied Sectors
Growth Rate of Total
Economy
(All Figures based on 2004–05 prices)
Ninth Five Year Plan 23.4 2.5 5.7
Tenth Five Year Plan 19.0 2.4 7.6
Eleventh Plan (2007–08 to 2011–12)
2007–08 16.8 5.8 9.3
2008–09 15.8 0.1 6.7
2009–10 14.7 1.0 8.4
2010–11 (Quick Est.) 14.5 7.0 8.4
2011–12 (Rev Est.) 14.0 2.8 6.5
Eleventh Plan Average 15.2 3.3 7.9

2 Twelfth Five Year Plan
Five Year Plan is now placed at 3.3 per cent. This is short of the target of 4 per cent but is significantly better than the achievement of 2.4 per cent in the Tenth Plan. Failure to reach the target growth is one reason for the high inflation in prices of food and other primary commodities that persist despite the recent slowdown in overall GDP growth. Consequently, although the overall GDP growth tar-get of the Twelfth Plan has been revised down since the Approach Paper, the growth target for agricul-ture is maintained at 4 per cent.
12.3. A natural question which arises is whether the target of 4 per cent is attainable in view of past short-falls. Although growth trends and targets are subject to high errors due to weather variability (for exam-ple, the Eleventh Plan average was pulled down by two successive bad harvests in 2008–09 and 2009–10), there is reason for cautious optimism because the turn-around that began after 2004 appears to be maintaining its momentum. Figure 12.1 plots aver-ages and standard deviations of annual growth rates over moving five-year periods, a trend of the growth averages and also annualised five-year growth rates based on five-year moving averages. All these show growth still trending up and variability reducing. The Eleventh Plan growth rate based on five-year moving averages is at 3.6 per cent, the highest for any
five-year period ever and, significantly, growth vari-ability has also reduced to lowest ever.
12.4. The reduction in variability is important since claims of acceleration or deceleration make sense only when variability is low. Also, it is a measure of how well the system is able to cope with inevita-ble bouts of aberrant weather and yet maintain the growth momentum. It should be noted that agri-cultural growth was positive in 2009–10 despite the worst drought in nearly 40 years. More generally, whereas earlier periods saw at least one and normally two years of negative growth in every five year, there has not been a single year of negative growth of agri-culture and allied sectors after 2002–03.
12.5. The magnitude of secular decline in growth variability over the last 30 years is also important. This is now less than a third of its peak. A major role must have been played by the increase in irriga-tion from about 20 per cent of arable area in 1981 to 35 per cent today, based mainly on groundwa-ter. However, since water tables have fallen and temperatures risen, the extent of variability decline is surprisingly large. Even assuming zero variabil-ity on irrigated land, this implies that variability on rain-fed land must have reduced very substantially. Clearly factors such as a more diversified agriculture,
1.0
2.0
3.0
4.0
5.0
6.0
1976
–77
1981
–82
1986
–87
1991
–92
1996
–97
2001
–02
2006
–07
2011
–12
2.0
4.0
6.0
8.0
10.0
12.0
Average of annual growth rates 5 yr MA Std dev of annual growth rates (axis 2)
FIGURE 12.1: Growth and Fluctuations in GDP Agriculture and Allied

Agriculture 3
extended information reach and investments both on-farm and in watershed development, appear to have enabled better responses to depleting natural resources and weather risk. Although there is con-siderable scope to improve each of these factors fur-ther, it is a matter of satisfaction that developments in these areas are having a positive effect.
The Climate Challenge12.6. The climate challenge facing agriculture needs to be taken seriously. Table 12.2 shows a distinct trend towards both drier and warmer weather, par-ticularly during the last three Plan periods. Rainfall in context of agriculture has traditionally been discussed in terms of the monsoon (that is, June–September) but annual precipitation is probably much more relevant now since the dominance of Kharif crops has reduced. Viewed in this perspec-tive, it is noteworthy that each of the last three Plan periods has recorded lower mean rainfall and higher rainfall variability compared to the immediately pre-vious period. Three (2008, 2009 and 2011) of the five Eleventh Plan years had annual rainfall below 95 per cent of long period average, as compared to only five in the previous 15 years. Temperature conditions have deteriorated even more. Periods prior to 1997 can be considered normal, but warm-ing has increased at an accelerating pace since then. The Eleventh Plan period contained the two warm-est years (2010 and 2009) ever recorded since 1900.
Even the coolest year (2008) during these five years was the thirteenth warmest in the last 110 years.
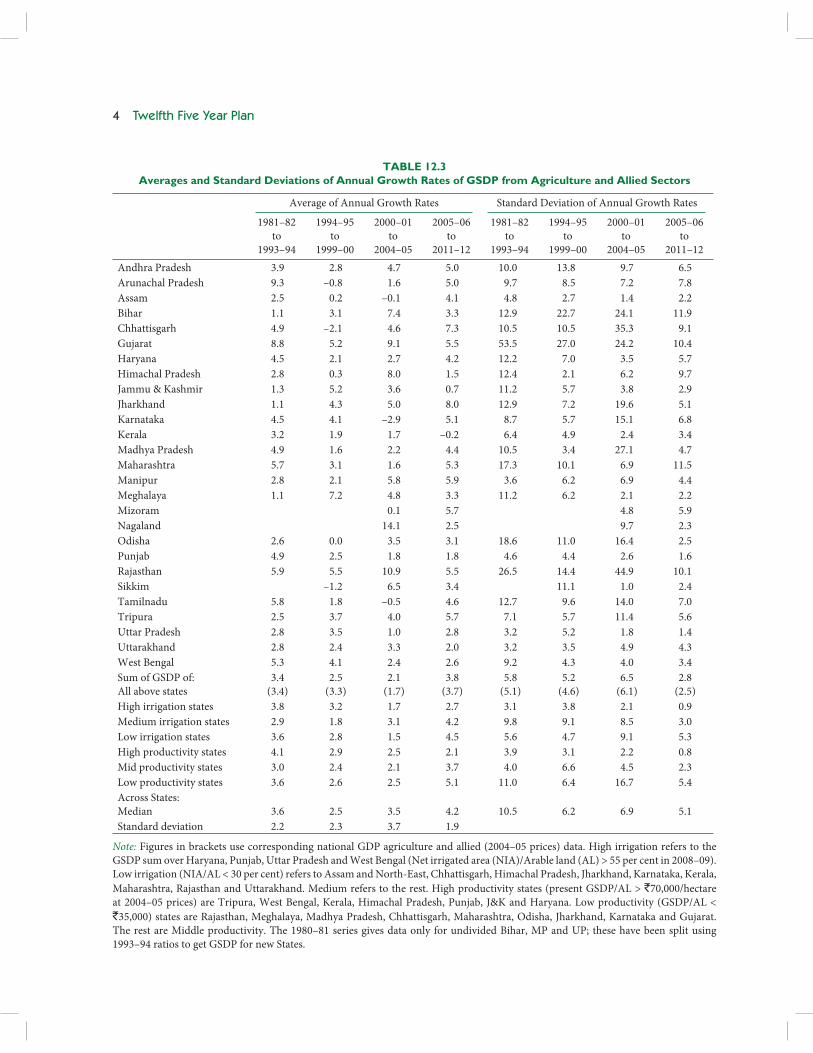
State-wise performance12.7. The Mid-term Appraisal of the Eleventh Plan (MTA) had noted that the recovery in agriculture after 2004 was associated with clear signs of renewed dynamism in rain-fed areas. Table 12.3, presents state-wise averages and standard deviations of annual growth rates of Gross State Domestic Product (GSDP) from agriculture and allied activities for four separate periods since 1981–82. It clearly shows the following:
1. The all-States average and median growth rates of GSDP recovered beyond levels before mid-1990s, to reach near 4 per cent in the period after 2004–05, this also happened individually in many states, particularly those with large rain-fed areas. The states with best performance were Jharkhand, Chhattisgarh, Manipur, Tripura, Mizoram, Rajasthan, Gujarat, Maharashtra, Karnataka and Andhra Pradesh, all with above 5 per cent growth.
2. Despite more difficult weather conditions, all except few hill states managed substantial reduc-tion of growth variability (measured by standard deviation of annual growth rates) during 2005–12 as compared to the past.
TABLE 12.2Some Weather Details
1951/52 to
1967/68
1968/69 to
1980/81
1981/82 to
1990/91
1991/92 to
1996/97
1997/98 to
2001/02
2002/03 to
2006/07
2007/08 to
2011/12
Annual Rainfall (cm)
Mean 122.5 118.7 120.1 121.0 118.5 113.7 111.7
Standard Deviation 12.5 10.2 11.5 7.2 8.3 9.4 10.0
Monsoon Rainfall (cm)
Mean 91.9 88.8 88.8 90.0 87.8 83.9 86.6
Standard Deviation 10.1 9.6 11.0 6.5 5.5 7.9 9.7
Annual Temperature anomaly from normal (°C)
Mean 0.04 –0.03 0.09 0.19 0.34 0.56 0.65
Standard Deviation 0.28 0.24 0.03 0.10 0.22 0.11 0.26
Source: Climate bulletins and other publications of the India Meteorological Department.
4 Twelfth Five Year Plan
TABLE 12.3Averages and Standard Deviations of Annual Growth Rates of GSDP from Agriculture and Allied Sectors
Average of Annual Growth Rates Standard Deviation of Annual Growth Rates
1981–82
to
1993–94
1994–95
to
1999–00
2000–01
to
2004–05
2005–06
to
2011–12
1981–82
to
1993–94
1994–95
to
1999–00
2000–01
to
2004–05
2005–06
to
2011–12
Andhra Pradesh 3.9 2.8 4.7 5.0 10.0 13.8 9.7 6.5
Arunachal Pradesh 9.3 –0.8 1.6 5.0 9.7 8.5 7.2 7.8
Assam 2.5 0.2 –0.1 4.1 4.8 2.7 1.4 2.2
Bihar 1.1 3.1 7.4 3.3 12.9 22.7 24.1 11.9
Chhattisgarh 4.9 –2.1 4.6 7.3 10.5 10.5 35.3 9.1
Gujarat 8.8 5.2 9.1 5.5 53.5 27.0 24.2 10.4
Haryana 4.5 2.1 2.7 4.2 12.2 7.0 3.5 5.7
Himachal Pradesh 2.8 0.3 8.0 1.5 12.4 2.1 6.2 9.7
Jammu & Kashmir 1.3 5.2 3.6 0.7 11.2 5.7 3.8 2.9
Jharkhand 1.1 4.3 5.0 8.0 12.9 7.2 19.6 5.1
Karnataka 4.5 4.1 –2.9 5.1 8.7 5.7 15.1 6.8
Kerala 3.2 1.9 1.7 –0.2 6.4 4.9 2.4 3.4
Madhya Pradesh 4.9 1.6 2.2 4.4 10.5 3.4 27.1 4.7
Maharashtra 5.7 3.1 1.6 5.3 17.3 10.1 6.9 11.5
Manipur 2.8 2.1 5.8 5.9 3.6 6.2 6.9 4.4
Meghalaya 1.1 7.2 4.8 3.3 11.2 6.2 2.1 2.2
Mizoram 0.1 5.7 4.8 5.9
Nagaland 14.1 2.5 9.7 2.3
Odisha 2.6 0.0 3.5 3.1 18.6 11.0 16.4 2.5
Punjab 4.9 2.5 1.8 1.8 4.6 4.4 2.6 1.6
Rajasthan 5.9 5.5 10.9 5.5 26.5 14.4 44.9 10.1
Sikkim –1.2 6.5 3.4 11.1 1.0 2.4
Tamilnadu 5.8 1.8 –0.5 4.6 12.7 9.6 14.0 7.0
Tripura 2.5 3.7 4.0 5.7 7.1 5.7 11.4 5.6
Uttar Pradesh 2.8 3.5 1.0 2.8 3.2 5.2 1.8 1.4
Uttarakhand 2.8 2.4 3.3 2.0 3.2 3.5 4.9 4.3
West Bengal 5.3 4.1 2.4 2.6 9.2 4.3 4.0 3.4
Sum of GSDP of:
All above states
3.4
(3.4)
2.5
(3.3)
2.1
(1.7)
3.8
(3.7)
5.8
(5.1)
5.2
(4.6)
6.5
(6.1)
2.8
(2.5)
High irrigation states 3.8 3.2 1.7 2.7 3.1 3.8 2.1 0.9
Medium irrigation states 2.9 1.8 3.1 4.2 9.8 9.1 8.5 3.0
Low irrigation states 3.6 2.8 1.5 4.5 5.6 4.7 9.1 5.3
High productivity states 4.1 2.9 2.5 2.1 3.9 3.1 2.2 0.8
Mid productivity states 3.0 2.4 2.1 3.7 4.0 6.6 4.5 2.3
Low productivity states 3.6 2.6 2.5 5.1 11.0 6.4 16.7 5.4
Across States:
Median 3.6 2.5 3.5 4.2 10.5 6.2 6.9 5.1
Standard deviation 2.2 2.3 3.7 1.9
Note: Figures in brackets use corresponding national GDP agriculture and allied (2004–05 prices) data. High irrigation refers to the
GSDP sum over Haryana, Punjab, Uttar Pradesh and West Bengal (Net irrigated area (NIA)/Arable land (AL) > 55 per cent in 2008–09).
Low irrigation (NIA/AL < 30 per cent) refers to Assam and North-East, Chhattisgarh, Himachal Pradesh, Jharkhand, Karnataka, Kerala,
Maharashtra, Rajasthan and Uttarakhand. Medium refers to the rest. High productivity states (present GSDP/AL > `70,000/hectare
at 2004–05 prices) are Tripura, West Bengal, Kerala, Himachal Pradesh, Punjab, J&K and Haryana. Low productivity (GSDP/AL <
`35,000) states are Rajasthan, Meghalaya, Madhya Pradesh, Chhattisgarh, Maharashtra, Odisha, Jharkhand, Karnataka and Gujarat.
The rest are Middle productivity. The 1980–81 series gives data only for undivided Bihar, MP and UP; these have been split using
1993–94 ratios to get GSDP for new States.
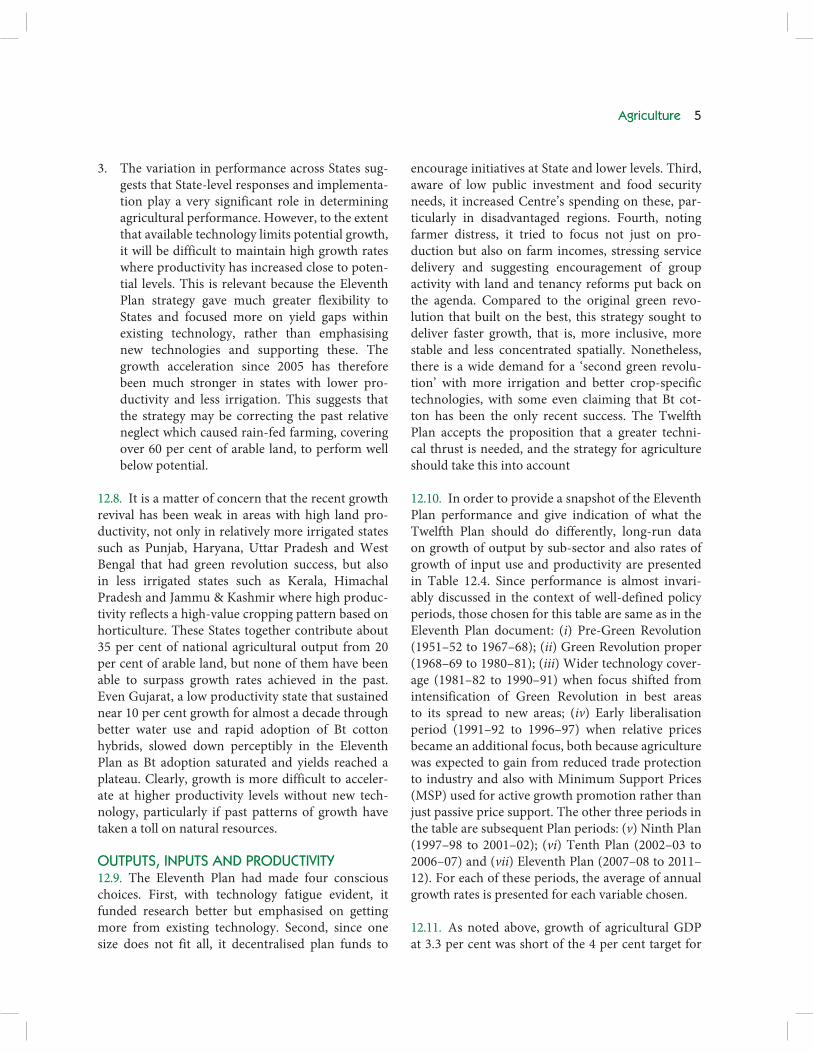
Agriculture 5
3. The variation in performance across States sug-gests that State-level responses and implementa-tion play a very significant role in determining agricultural performance. However, to the extent that available technology limits potential growth, it will be difficult to maintain high growth rates where productivity has increased close to poten-tial levels. This is relevant because the Eleventh Plan strategy gave much greater flexibility to States and focused more on yield gaps within existing technology, rather than emphasising new technologies and supporting these. The growth acceleration since 2005 has therefore been much stronger in states with lower pro-ductivity and less irrigation. This suggests that the strategy may be correcting the past relative neglect which caused rain-fed farming, covering over 60 per cent of arable land, to perform well below potential.
12.8. It is a matter of concern that the recent growth revival has been weak in areas with high land pro-ductivity, not only in relatively more irrigated states such as Punjab, Haryana, Uttar Pradesh and West Bengal that had green revolution success, but also in less irrigated states such as Kerala, Himachal Pradesh and Jammu & Kashmir where high produc-tivity reflects a high-value cropping pattern based on horticulture. These States together contribute about 35 per cent of national agricultural output from 20 per cent of arable land, but none of them have been able to surpass growth rates achieved in the past. Even Gujarat, a low productivity state that sustained near 10 per cent growth for almost a decade through better water use and rapid adoption of Bt cotton hybrids, slowed down perceptibly in the Eleventh Plan as Bt adoption saturated and yields reached a plateau. Clearly, growth is more difficult to acceler-ate at higher productivity levels without new tech-nology, particularly if past patterns of growth have taken a toll on natural resources.
OUTPUTS, INPUTS AND PRODUCTIVITY12.9. The Eleventh Plan had made four conscious choices. First, with technology fatigue evident, it funded research better but emphasised on getting more from existing technology. Second, since one size does not fit all, it decentralised plan funds to
encourage initiatives at State and lower levels. Third, aware of low public investment and food security needs, it increased Centre’s spending on these, par-ticularly in disadvantaged regions. Fourth, noting farmer distress, it tried to focus not just on pro-duction but also on farm incomes, stressing service delivery and suggesting encouragement of group activity with land and tenancy reforms put back on the agenda. Compared to the original green revo-lution that built on the best, this strategy sought to deliver faster growth, that is, more inclusive, more stable and less concentrated spatially. Nonetheless, there is a wide demand for a ‘second green revolu-tion’ with more irrigation and better crop-specific technologies, with some even claiming that Bt cot-ton has been the only recent success. The Twelfth Plan accepts the proposition that a greater techni-cal thrust is needed, and the strategy for agriculture should take this into account
12.10. In order to provide a snapshot of the Eleventh Plan performance and give indication of what the Twelfth Plan should do differently, long-run data on growth of output by sub-sector and also rates of growth of input use and productivity are presented in Table 12.4. Since performance is almost invari-ably discussed in the context of well-defined policy periods, those chosen for this table are same as in the Eleventh Plan document: (i) Pre-Green Revolution (1951–52 to 1967–68); (ii) Green Revolution proper (1968–69 to 1980–81); (iii) Wider technology cover-age (1981–82 to 1990–91) when focus shifted from intensification of Green Revolution in best areas to its spread to new areas; (iv) Early liberalisation period (1991–92 to 1996–97) when relative prices became an additional focus, both because agriculture was expected to gain from reduced trade protection to industry and also with Minimum Support Prices (MSP) used for active growth promotion rather than just passive price support. The other three periods in the table are subsequent Plan periods: (v) Ninth Plan (1997–98 to 2001–02); (vi) Tenth Plan (2002–03 to 2006–07) and (vii) Eleventh Plan (2007–08 to 2011–12). For each of these periods, the average of annual growth rates is presented for each variable chosen.
12.11. As noted above, growth of agricultural GDP at 3.3 per cent was short of the 4 per cent target for

6 Twelfth Five Year Plan
TABLE 12.4Growth of Output, Inputs and Productivity
(period averages of annual growth rates)
Pre-Green
Revolution
Green
Revolution
Wider
Coverage
Early
Liberalisation
Ninth Plan Tenth Plan Eleventh
Plan
1951/52 to
1967/68
1968/69 to
1980/81
1981/82 to
1990/91
1991/92 to
1996/97
1997/98 to
2001/02
2002/03 to
2006/07
2007/08 to
2011/12
I. Value of Output (2004–05 prices)
Cereals 4.2 3.4 3.5 2.4 1.5 1.0 3.0
Pulses 3.0 0.7 3.4 0.8 0.3 1.8 4.2
Oilseeds 3.2 1.8 7.4 4.4 –2.5 7.4 4.5
Sugars 3.3 4.1 4.2 2.4 9.4 1.7 2.2
Fibres 4.4 2.5 5.3 6.5 –5.6 15.1 10.7
Non-horticulture crops 3.2 2.7 3.0 2.1 1.7 2.1 2.8
Horticulture 2.6 4.2 3.1 5.7 3.8 2.6 4.7
All Crops 3.0 3.0 3.0 3.1 2.3 2.1 3.4
Livestock 1.0 3.3 4.8 4.0 3.6 3.6 4.8
Crops and Livestock 2.5 3.0 3.3 3.3 2.6 2.5 3.8
Fishing 4.7 3.1 5.7 7.1 2.7 3.3 3.6
Forestry 1.7 –0.2 0.3 0.3 2.7 1.3 2.3
Agriculture and allied 2.3 2.4 3.0 3.1 2.6 2.4 3.6
II. Value of Intermediate Inputs (2004–05 prices)
Seed 1.5 1.1 2.3 1.6 –0.6 1.4 4.1
Feed of livestock 1.9 4.0 0.1 0.9 3.9 0.7 3.3
Organic manure 0.0 1.3 0.7 0.5 1.6 2.9 3.3
Fertilisers and pesticides 18.2 9.3 8.7 2.0 3.9 4.8 6.7
Diesel oil 26.0 13.1 8.7 4.3 5.1 5.1 5.8
Electricity 18.5 15.2 12.9 14.4 –4.1 2.6 8.0
All inputs crops and
livestock
2.4 4.5 2.2 1.9 3.0 2.5 4.4
Inputs for fishing 4.6 3.3 5.4 6.5 2.7 1.5 3.5
Inputs for forestry 1.7 –0.2 0.1 0.3 2.6 1.3 2.3
All inputs Agriculture and
allied
2.3 3.9 2.1 1.9 3.0 2.4 4.3
III. Gross Value Added (2004–05 prices)
Crops and Livestock 2.7 2.7 3.7 3.7 2.5 2.5 3.5
Fishing 4.7 3.0 5.8 7.2 2.7 3.6 3.7
Forestry 1.7 –0.2 0.4 0.3 2.8 1.3 2.3
Agriculture and allied 2.5 2.4 3.5 3.7 2.5 2.4 3.3
IV. Factor Inputs into Agriculture
Land (Gross cropped area) 1.3 0.4 0.8 0.3 –0.1 0.6 0.3
Labour 1.8 1.1 0.5 2.3 0.3 0.5 –1.5
Net Fixed Capital Stock 2.3 3.6 2.8 3.1 3.4 4.7 6.0
Of which: Public 3.9 2.0 1.4 2.3 3.6
Private 1.4 4.3 5.1 6.6 7.5
V. Partial Factor Productivities (2004–05 prices)
Land productivity 1.2 2.0 2.7 3.3 2.6 1.8 3.1
Labour productivity 0.7 1.4 3.0 1.4 2.2 1.8 4.8
Capital productivity 0.2 –1.1 0.7 0.6 –0.9 –2.4 –2.7
Note: Cropped Area from Ministry of Agriculture, Land use statistics; Labour is agricultural employment from Census till 1971 and
NSSO (weekly status) from 1972–73; all other data are from Central Statistical Organisation (CSO): National Accounts 2004–05 prices.

Agriculture 7
agricultural GDP but was faster than that in the Tenth or the Ninth Plan, though lower than the period from 1981–82 to 1996–97. The growth rates for individual crops shown in Table 12.4 are for gross value of output and not value added, but they present a valid basis for inter-period comparisons.
1. Growth of total value of output in agriculture proper (crops and livestock) during the Eleventh Plan averaged 3.8 per cent per year which was the highest among all seven periods considered.
2. Total non-horticulture crop output grew mar-ginally faster than target (2.8 per cent against 2.7 per cent target) mainly because of foodgrains (3.1 per cent actual against 2.3 per cent target), oilseeds (4.5 per cent against 4 per cent) and fibres (10.7 per cent against 5 per cent).
3. Horticulture at 4.7 per cent was only marginally short of the 5 per cent target.
4. Growth of output from livestock (4.8 per cent) was again highest amongst all the periods consid-ered but this performance, and even more, so for fishing (3.6 per cent), fell short of the ambitious 6 per cent target set for these two sub-sectors.
5. Growth of forestry was expectedly slower, pull-ing down the growth of total value of output in agriculture and allied to 3.6 per cent, but this too was the highest among all the seven periods considered.
12.12. Growth in intermediate inputs has acceler-ated steadily reaching 4.3 per cent per annum dur-ing the Eleventh Plan, which was much higher than growth of output and over twice the growth rate of intermediate input use during 1981–97. The more rapid growth in input use explains why despite the faster growth of the gross value of output during the Eleventh Plan at 3.6 per cent than in the period 1981–82 to 1996–97 (about 3.0 per cent), GDP in agriculture (which is a value added concept) grew more slowly. In other words, agricultural growth became more input intensive in the Eleventh Plan. This suggests the need to re-look policies relating to inputs, especially fertiliser and power.
12.13. Policies towards input use need to distinguish between traditional inputs such as seed, feed and
organic manure and modern inputs such as chemical fertiliser, pesticides and farm power. With low seed replacement, underfed farm animals and soils short of organic carbon, projections by working groups for the Twelfth Plan suggest that past growth of these tra-ditional inputs should be improved upon. However, these working groups also project lower growth of ‘modern’ inputs than observed during the Eleventh Plan. For example, 2016–17 requirements of chemi-cal fertiliser and farm power are placed at levels that imply annual growth for both fertilisers and ‘mod-ern’ energy at about 4.5 per cent. These exceed cor-responding the Eleventh Plan projections but are much less than the Eleventh Plan actual. Reduced fer-tiliser and fuel subsidies would be consistent with the desired moderation in trend of these inputs. Restraint is also needed on pesticides use which rose sharply in the Eleventh Plan after years of being subdued.
12.14. In parallel with high growth of intermediate inputs, there was acceleration in growth of the net capital stock in agriculture and allied sectors during the Eleventh Plan. As shown in Table 12.4 (item IV), Net Fixed Capital Stock in agriculture expanded at 6.0 per cent per year, much faster than in the pre-vious two Plans. The public component of capi-tal stock increased by 3.6 per cent while the private component increased at 7.5 per cent per year, both showing acceleration compared to the previous two Plans. However, public investment in agricul-ture, which was stepped up very substantially in the last three years of the Tenth Plan, stagnated in the Eleventh Plan (Table 12.5). This was mainly because of a large shortfall in planned investment in irriga-tion. As a result a key part of the Eleventh Plan strat-egy to achieve 4 per cent agricultural growth which was to increase public investment in agriculture to 4 per cent of agricultural GDP and thereby achieve growth of public sector capital stock in agriculture at least equal to the required 4 per cent growth of total capital stock has not fructified. Clearly, to attain 4 per cent agricultural growth in the Twelfth Plan will require firmer commitment to ensure realisation of this unattained the Eleventh Plan objective.
12.15. Private investment in agriculture has accel-erated over the past three Plans. Private investment

8 Twelfth Five Year Plan
TABLE 12.5Gross Capital Formation (GCF) in Agriculture, Forestry and Fishing (2004–05 prices)
Year GDP from Agriculture
and Allied
2004–05 Prices
GCF in Agriculture and Allied at
2004–05 Prices
GCF in Agriculture as Per Cent of
GDP from Agriculture
Public
Sector
Private
Sector
Total Public
Sector
Private
Sector
Total
1 2 3 4 5 6 7 8
Tenth Plan
2002–03 5,17,559 10,299 63,215 73,514 2.0 12.2 14.2
2003–04 5,64,391 12,683 57,238 69,921 2.3 10.1 12.4
2004–05 5,65,426 16,187 59,909 76,096 2.9 10.6 13.4
2005–06 5,94,487 19,940 66,664 86,604 3.5 11.2 14.6
2006–07 6,19,190 22,987 69,070 92,057 3.7 11.2 14.9
Eleventh Plan
2007–08 6,55,080 23,257 82,484 1,05,741 3.6 12.6 16.1
2008–09 6,55,689 20,572 1,06,555 1,27,127 3.1 16.3 19.4
2009–10 6,62,509 22,719 1,08,420 1,31,139 3.4 16.4 19.8
2010–11 7,09,103 21,500 1,20,754 1,42,254 3.0 17.0 20.1
Source: Central Statistical Organisation National Accounts Division.
averaged 15.6 per cent of agricultural GDP in the first four years of the Eleventh Plan as against expected 12 per cent. The main driver of this was a large relative price shift in favour of agriculture, show-ing that farmers respond to price incentives. If cal-culated in current price terms rather than constant, private investment averaged 13 per cent of agri-cultural GDP—only slightly higher than expected. Nonetheless, total capital stock in agriculture grew more than expected. While private investment in irrigation and water-saving devices did increase, the largest increase was in labour-saving mechanisation. This was a natural response to growing labour scar-city which is reflected in rising wages.
12.16. Table 12.4 also shows growth rates of the two other factors of production in agriculture: land and labour. Not unexpectedly, while capital stock has grown quite rapidly throughout, the other two factors have not. As far as labour is concerned, the measure shown is employment in agriculture by usual sta-tus estimates of the National Sample Survey (NSS), which is available almost annually since 1987–88 but requires interpolation for earlier years. Combined with Census data, these show continuous increase of
agricultural employment till 1994, although at vary-ing rates of growth and at a particularly sharp rise in early 1990s when there was slow-down in rural non-agricultural employment. Agricultural employment fluctuated in the next decade, but has clearly declined after 2004–05. NSS employment data for 2007–08 and 2009–10 show clear evidence of an accelerated shift of rural labourers to non-agricultural work, which in itself is not an undesirable development. For land, the measure shown is gross cropped area which, despite the loss of nearly 3 million hectares of arable land to non-agricultural uses since 1990–91, has increased in all periods excepting a slight dip in the Ninth Plan. This is because cropping inten-sity has increased almost continuously. However, cropped area growth which averaged 0.9 per cent per annum till 1990–91 has averaged only 0.2 per cent subsequently.
12.17. Table 12.4 also shows growth rates of partial productivity of land, labour and capital taking GDP agriculture and allied as numerator. Labour produc-tivity growth has historically been low, averaging 2 per cent per annum or less except during 1981–90 when it reached 3 per cent. Labour productivity

Agriculture 9
jumped to nearly 5 per cent during the Eleventh Plan. The accelerated shift of rural labour to non-agricul-ture caused real wages to rise at about 5 per cent annually between 2004–05 and 2009–10, according to the NSS, and latest reports of the Commission of Agricultural Costs and Prices (CACP) suggest even faster growth of real wages in the last three years of the Eleventh Plan at almost 8 per cent per year. The trend in real wages in 2011–12 prices, as estimated by CACP, is shown in Figure 12.2.
12.18. Labour saving mechanisation, a significant contributor to the sharp increase of private invest-ment in the Eleventh Plan period, was a natural response to tighter labour markets and rising wages. But, while mechanisation helped farmers to cope with labour scarcity, it exacerbated a decline in capi-tal productivity. Private capital stock in agriculture has increased twice as fast as agricultural GDP since the Ninth Plan and, although mitigated by terms of trade gains and a debt write-off, continued invest-ment with declining capital productivity may not be sustainable.
12.19. While greater private investment in farm-ing is desirable where it reflects both an ability to invest and a desire to increase farm productivity, the same phenomenon can become a source of distress if farmers keep investing to cope with shrinking natu-ral resources, more frequent adverse weather and less assured labour supply, and do not get adequate
returns for this investment. The Eleventh Plan had tried to address this in two ways: first, increase pub-lic investment to lessen the private burden and add economies of scale; and second, rework architecture of the Plan spending on agriculture to make it more decentralised and flexible but also more coordi-nated locally to improve total productivity of private resources by better service delivery in all areas from extension to input supply and marketing. However, as noted earlier, public investment did not increase. And, although combined Plan expenditure of Centre and States in agriculture did increase from 1.9 per cent of agricultural GDP in the Tenth Plan to 2.9 per cent in the Eleventh, this was relatively small and left research, education and extension under-funded, leaving much to be desired in the quality of service delivery.
12.20. Nonetheless, growth of land productivity did increase significantly (Tables 12.4 and 12.6). Having climbed from about 1 per cent per annum before Green Revolution to over 3 per cent during 1991–97, land productivity growth had decelerated to below 2 per cent. This rebounded to over 3 per cent during the Eleventh Plan.
12.21. Total factor productivity (TFP) improved during the Eleventh Plan. Individual factor produc-tivity data in Table 12.4, weighted by a range of factor shares suggest that TFP growth during the Eleventh Plan was back to around 1980s level. For example,
160.00
150.00
140.00
130.00
120.00
110.00
100.00
` p
er d
ay
Year
2000
–01
2001
–02
2002
–03
2003
–04
2004
–05
2005
–06
2006
–07
2007
–08
2008
–09
2009
–10
2010
–11
2011
–12
Average Real Daily Wage Rage at 2011–12 Price (` per day)
FIGURE 12.2: All India Average Real Daily Wage Rate at 2011–12 Prices (` Per Day)

10 Twelfth Five Year Plan
applying factor shares of 30 per cent land, 40 per cent labour and 30 per cent capital give the following averages of annual TFP growth: 0.7 per cent in pre-Green Revolution period, 0.8 per cent during Green Revolution period, 2.2 per cent during the wider cov-erage period, 1.8 per cent during early liberalisation, 1.4 per cent during the Ninth Plan, 0.6 per cent dur-ing the Tenth Plan and 2.0 per cent in the Eleventh Plan. Although these estimates must be treated as tentative since data on factor shares is not robust, it does suggest that the deceleration of TFP in agricul-ture observed in the previous two Plans, which had caused widespread apprehension, may have been reversed in the Eleventh Plan. In other words, the Eleventh Plan architecture, with the Rashtriya Krishi Vikas Yojana (RKVY) as core, appears to have deliv-ered despite adverse weather, a public investment shortfall and implementation gaps. The strategy of spreading known technology wider had paid.
SUB-SECTOR-WISE PERFORMANCE AND ISSUES
Crop Sector12.22. In addition to above, two indicators worth highlighting in the crop sector are the pace and pat-tern of crop area diversification and trends in yields/
hectare of important individual crops. There has been gradual but sustained shift in cropping pat-tern away from coarse cereals and pulses towards other crops over the last four decades. Area under coarse cereals had declined by 18 million hectares and that under pulses by nearly 2 million hectares from earlier peaks to end of the Tenth Plan. During the Eleventh Plan, there was further decline of 2 mil-lion hectares in area under coarse cereals but area under pulses reversed earlier decline to reach a new peak in 2010–11. Noting, that technology and price policy had neglected pulses earlier despite their importance as source of protein, special atten-tion was given to pulses in both the National Food Security Mission (NFSM) and RKVY, the two major schemes launched during the Eleventh Plan. Cotton gained most area, followed by fruits and vegetables, with rice area steady, an increase in wheat area and decline in area under oilseeds and sugarcane.
12.23. Although area under coarse cereals and oil-seeds declined during the Eleventh Plan, both these crop groups averaged over 4 per cent output growth. This was because growth of yields per hectare accel-erated across almost all crop groups, especially those mainly rain-fed (Table 12.6). Not only did coarse cereals and oilseeds yields increase faster during the
TABLE 12.6Average Annual Growth Rates in Yields Per Hectare
Pre-Green
Revolution
Green
Revolution
Wider
Coverage
Early
Liberalisation Ninth Plan Tenth Plan
Eleventh
Plan
1951/52 to
1967/68
1968/69 to
1980/81
1981/82 to
1990/91
1991/92 to
1996/97
1997/98 to
2001/02
2002/03 to
2006/07
2007/08 to
2011/12
Wheat 3.7 3.3 3.6 2.8 0.7 –0.3 3.0
Rice 3.2 2.7 3.0 1.4 2.1 1.2 2.2
Jowar 3.4 2.9 3.2 1.3 0.2 2.1 3.1
Bajra 2.6 6.3 8.8 6.2 4.9 7.3 8.4
Maize 4.8 1.7 4.1 2.6 3.1 –0.2 6.5
Coarse cereals 2.6 1.5 3.1 4.3 1.3 1.7 7.3
Pulses 2.3 –0.2 2.3 1.9 –0.3 0.6 2.7
Oilseeds 1.3 0.8 4.8 3.3 0.4 3.5 5.4
Cotton 3.0 2.6 5.3 3.1 –6.2 19.4 3.9
Sugarcane 1.6 3.1 1.3 0.4 0.3 0.7 0.5
Note: Data is up to fourth advance estimate for 2011–12, Ministry of Agriculture.

Agriculture 11
Eleventh Plan than in any of the earlier periods, so did pulses yields. Apart from hybrids in case of maize, and to less extent in bajra, these yield increases came mainly from better seed quality, higher seed replace-ment and better practice rather than from new crop technology or more irrigation.
12.24. Yield growth of cotton, another largely rain-fed crop, was also respectable although it was down sharply from a spectacular performance during the Tenth Plan following adoption of Bt hybrids. With more than 90 per cent of cotton area now under Bt hybrids, and cotton yields more than doubling over the last decade, there is no doubt either about general farmer acceptance or its being a clear case of technological transformation unlike other rain-fed crops. But disagreements continue about the extent to which Bt contributed to this yield increase and on wisdom of India’s total dependence on Bt hybrids rather than the Bt varieties used in the rest of the world. There are also legitimate complaints of non-availability of non-Bt seeds, for example in Vidharbha. Genetically modified organisms (GMOs) therefore remain controversial, as was evident in case of Bt Brinjal. Nonetheless, since significant break-throughs in production technologies are required to cope with increasing stress, particularly for rain-fed crops, it is necessary to remain abreast with lat-est advances in biotechnology. It is, therefore, time to put in place scientifically impeccable operational protocols and a regulatory mechanism to permit GMOs when they meet rigorous tests that can out-weigh misgivings, while simultaneously noting that many feasible advances in biotechnology do not in fact involve GMOs.
12.25. Moreover, the Eleventh Plan experience is that continuous less-visible efforts by farmers to adapt and improve can be made effective. The NFSM, which aimed to reduce gaps between potential and actual yields, was designed to aid farmers in their own efforts by demonstrating and supporting a wide range of interventions. This seems to have worked. For example, growth in wheat yields nationally was negligible during the Ninth and the Tenth Plans but increased to 3 per cent in the Eleventh Plan. Even in Punjab, where it was believed that wheat yields
had reached a plateau below 4.5 tonnes per hectare, yields increased steadily during the Eleventh Plan to reach 4.9 tonnes, accompanied by wider use of con-servation practices such as laser levelling, zero tillage and raised beds. Rice yield growth was also higher in the Eleventh Plan than in any period after 1991, with Assam, Bihar, Chhattisgarh, East Uttar Pradesh and West Bengal contributing 80 per cent of this, again with growing awareness of conservation practices. For example, many States are now using RKVY to mainstream the System of Rice Intensification (SRI) that was not officially accepted till 2004 and was only small part of NFSM.
Livestock and Fishery12.26. Livestock contributes 25 per cent of gross value added in the agriculture sector and provides self-employment to about 21 million people. Rapid growth of this sector can be even more egalitarian and inclusive than growth of the crop sector because those engaged in it are mainly small holders and the landless. Growth of livestock output averaged 4.8 per cent per annum during the Eleventh Plan recovering from an average of 3.6 per cent in the Ninth and the Tenth Plans.
12.27. Growth, of dairying, which is the main con-stituent of livestock sector though slightly higher than the 4 per cent averaged since 1990, was short of demand. With over 75 per cent of cattle located in rain-fed areas, the major issue is access to feed, fodder and drinking water which is becoming increasingly scarce. The problems of the sector are compounded by growing numbers of unproductive male cat-tle. Developing a strong fodder base needs inten-sive effort and innovation in institutional aspects of pasture protection and management and usufruct sharing. There is little concerted effort in this area at present as it is too fragmented across various depart-ments to be able to provide the technical inputs, insti-tutional designs and adequate investments to make a meaningful impact. Richer farmers with access to groundwater irrigation can grow irrigated fod-der and increase herd size. Poorer livestock owners, dependent mainly on commons and agriculture resi-dues, end up underfeeding the animals. This problem raises questions about the present breeding strategy

12 Twelfth Five Year Plan
that focuses almost exclusively on induction of breeds that are high yielding, but are much less tolerant to adverse conditions in extensive livestock systems.
12.28. These issues, which also affect owners of small ruminants, poultry and even those involved in inland fishery, came to the fore during the Eleventh Plan following the drought of 2009. The consequent high inflation in feed and fodder, that also led to high inflation in prices of livestock products, revealed a need for much greater coordination not only between agencies responsible for livestock and those responsible for crops that sustain livestock, but also with other policies, for example, trade policies that influence feed and livestock product prices. RKVY provided a window which cut across departments to allow States to focus on fodder shortages and restored growth of livestock output much quicker than in earlier droughts. Nonetheless, underlying problems remain, as does so called protein inflation. The Twelfth Plan must address these problems by involving dairy cooperatives in breed and feed issues, revisit breeding strategies and make fodder develop-ment higher priority in both animal husbandry and crop programmes.
12.29. India produces about 65 billion eggs annually and production growth has accelerated from around 4 per cent per annum during the 1990s to over 5 per cent during the Tenth and the Eleventh Plan. This acceleration has been achieved despite new chal-lenges such as periodic outbreaks of avian influenza and the biofuels effect on international prices of maize, the main poultry feed, which has now transmit into the domestic economy. One reason for this vital-ity has been the growth of a large and vibrant com-mercial poultry sector with adequate economies of scale and fairly good backward and forward linkages. Besides eggs, this commercial poultry sector also pro-duces over 2 million tonnes of broiler meat which is an increasing part of total meat production of about 5 million tonnes. Meat, with production growth at over 5.5 per cent per annum during the Eleventh Plan, is the fastest growing segment in the livestock sector.
12.30. The performance of the fisheries sub-sec-tor has been impressive on the whole, with growth
more than 5 per cent per annum during the 1980s and 1990s, but growth in this sub-sector has been decelerating since mid-1990s. The main reason for this has been stagnation of marine fishery, a phe-nomenon which is expected to continue. The major growth in fisheries in recent years has come from the inland fisheries, with particularly rapid develop-ment of brackish water aquaculture. This has been linked to prawn cultivation for export, although there is also strongly growing domestic demand for fresh water fish. Fish prices more than doubled dur-ing the Eleventh Plan, a higher inflation than either crops or any other livestock segment, despite a small acceleration in production growth compared to the Tenth Plan. A problem in this sector is that although a National Fisheries Development Board was set up, responsibilities are still not clearly defined between this and the Department of Animal Husbandry, Dairying and Fisheries. This has in particular meant an inability to realise the vast potential of inland fresh water fishery. Fish production can be enhanced 2 to 4 times in rain-fed water bodies, whether irrigation reservoirs, natural wetlands or ponds and tanks cre-ated by watershed development or Mahatma Gandhi National Rural Employment Guarantee Scheme (MGNREGS). If fully harnessed, these can secure over 6 per cent fishery growth in the Twelfth Plan.
EMERGING IMBALANCES12.31. Although the discussion so far suggests that agricultural performance did improve during the Eleventh Plan, experience of the Eleventh Plan also points to emerging imbalances in agriculture which call for a long-term strategic reorientation.
Subsidies vs Public Investment12.32. The Eleventh Plan document had highlighted that public investment in agriculture as per cent of agricultural GDP had halved between the 1980s and in the end of the Ninth Plan while, simultaneously, budgetary subsidies to agriculture had doubled as proportion of agricultural GDP. The tendency for subsidies to increase much faster than public invest-ment was checked to some extent during the Tenth Plan, but it reappeared again during the Eleventh Plan (Table 12.7). Budgetary subsidies to agriculture (excluding food subsidy, which should be treated as

Agriculture 13
a consumer subsidy) increased from an average of 4.1 per cent of agricultural GDP during the Tenth Plan to average 8.2 per cent in the first four years of the Eleventh Plan. Actual subsidies to agriculture were higher in both periods since CSO books bud-geted subsidy on domestic urea manufacture entirely to industry and because part of the power subsidy received by agriculture is not budgeted but borne by utilities. Compared to these numbers, public invest-ment in agriculture averaged only about 3 per cent of agricultural GDP during both Plan periods.
12.33. The imbalance between subsidy expendi-ture and expenditure on public investment raises the issue whether a shift away from subsidies and towards greater public investment would not be ben-eficial. The usual argument for reducing subsidies is that it will improve the fiscal deficit, but that is not the relevant point in this context, there is a need to shift from subsidies to public investment aimed at increasing land productivity on the grounds that
this would produce better agricultural outcomes and would also be more inclusive. This is particularly important in the context of strategies for combating the effect of climate change where public investment in conservation and management of water resources will be crucial.
12.34. There are also other uses of resources in agri-culture which could be promoted if agricultural sub-sidies are restrained. The Eleventh Plan document had pointed to trade-offs that subsidies might have with other non-Plan revenue expenditures, particu-larly staffing of essential farm support systems such as extension. Moreover, capacity and skill short-ages have made upgrading agricultural universi-ties an urgent need. The Eleventh Plan had aimed to increase spending on agricultural education and research from 0.6 to 1 per cent of agricultural GDP, but this remains less than 0.7 per cent—a large gap in a very important area that is miniscule in relation to subsidies.
TABLE 12.7Public Sector Capital Formation and Subsidies to Agriculture (Centre and States)
(in ` crore and as per cent to GDP from agriculture and allied at current prices)
Public GCF
Agriculture and
Allied
Budgetary
Subsidies (CSO)
Food Subsidy Total Fertiliser
Subsidy
Subsidy on
Indigenous Urea
All other
Agriculture
Subsidies
Tenth Plan
2002–03 9,563 2.0 43,597 9.0 24,176 5.0 11,015 2.3 7,790 1.6 16,196 3.3
2003–04 12,218 2.2 43,765 8.0 25,181 4.6 11,847 2.2 8,521 1.6 15,258 2.8
2004–05 16,187 2.9 47,655 8.4 25,798 4.6 15,879 2.8 10,243 1.8 16,221 2.9
2005-06 20,739 3.3 51,065 8.0 23,077 3.6 18,460 2.9 10,653 1.7 20,181 3.2
2006–07 25,606 3.5 59,510 8.2 24,014 3.3 26,222 3.6 12,650 1.7 21,924 3.0
Eleventh Plan
2007–08 27,638 3.3 85,698 10.2 31,328 3.7 32,490 3.9 12,950 1.5 34,830 4.2
2008–09 26,692 2.8 1,56,823 16.6 43,751 4.6 76,603 8.1 17,969 1.9 54,438 5.8
2009–10 33,237 3.1 1,39,248 12.9 58,443 5.4 61,264 5.7 17,580 1.6 37,121 3.4
2010–11 34,548 2.7 1,50,170 11.8 63,844 5.0 62,301 4.9 15,081 1.2 39,106 3.1
Note: Public sector agricultural GCF and GDP are from CSO, National Accounts Division; budgetary subsidies, are also from CSO
and are based on the economic and purpose classification of Government expenditure. Food and Fertiliser subsidies are from budget
documents of the Central Government. ‘All other agriculture subsidies’ in the table are defined as budgetary subsidies (CSO) plus
subsidy on indigenous urea minus food subsidy. This is because CSO classifies food subsidy as subsidy to agriculture but classifies
subsidies on indigenous urea as subsidy to industry.

14 Twelfth Five Year Plan
12.35. Another, very important reason why subsidies should be rationalised and restrained is that some of these subsidies could actually be doing harm. A case for subsidies exists if there is clear evidence that some input is being underused. Conversely, when with there is clear evidence of overuse of a subsidised input, there is a case to reduce or even eliminate the subsidy. Today, there is clear evidence of overuse. Data from all over India, especially from the prime green revolution areas, show that high use of chemi-cal fertilisers and power is causing excessive mining of other soil nutrients and of groundwater, and that this is also leading to loss of quality of both soil and water. There is of course about 20–25 per cent of the country’s arable area, located largely in North-East, East and Central India, where use of these inputs is so low that further intensification is desirable per se. But with nearly 90 per cent of fertilisers and 95 per cent of farm electricity currently being used outside this area, there can be no doubt that the present sub-sidies are actually encouraging practices that need to be discouraged.
12.36. Any proposal for reducing subsidies will be opposed by farmers on the grounds that output will fall if the subsidy cut reduces input use. This is true unless other investments are made simultane-ously but such investments would indeed be facili-tated by the resources released. Efforts were made in the Eleventh Plan to encourage more efficient practices without actually reducing the quantum of subsidy. For example, many States have undertaken separation of feeders so that electricity supply for agricultural use can be treated differently from that for rural non-agricultural use, and stricter schedul-ing imposed on the former while maintaining its lower price. Similarly, the Centre introduced a new scheme, the ‘National Project on Management of Soil Health & Fertility’ (NPMSH&F) to promote soil test-ing and issue of soil health cards to farmers, aimed particularly to spread awareness of micronutrient deficiencies resulting from excessive and unbalanced fertiliser use and to encourage balanced and judi-cious use of chemical fertilisers in conjunction with organic manures to maintain soil health and fertility. Moreover, in order to rationalise fertiliser subsidies, a nutrient-based subsidy (NBS) system was adopted
to subsidise fertiliser products uniformly on basis of nutrient content, rather than set product-wise sub-sidies and separate maximum retail prices (MRPs) for each product. The objective was to reduce dead-weight of the fertiliser control order, set nutrient-specific subsidies that maintain desirable NPK balance, and evolve a subsidy protocol to encourage both development of new complex fertiliser products (including micronutrients) and more investment in the sector.
12.37. These initiatives have had some success in particular regions, but they do not as yet show up in national data in terms of higher additional output per unit additional use of these inputs. Moreover, NBS roll-out was seriously flawed since urea was kept out of its ambit. Urea prices remain controlled with only a 10 per cent rise at the time of adoption of the NBS in 2010. Meanwhile prices of decon-trolled products doubled. The fixity of the urea price naturally worsened the NPK balance. Also, there has been very little product innovation. The subsidy bill has increased because resulting higher urea demand has been met entirely by imports at a unit subsidy twice that on domestic output, with little incentive to expand domestic capacity. The NBS as rolled out has been counterproductive because urea has not been included.
12.38. As may be seen from Table 12.6, the fertiliser subsidy is now much higher than all other subsi-dies to agriculture put together. While this is partly because fertiliser consumption rose over 30 per cent during the Eleventh Plan, the main reason is that world prices of all fertilisers and feedstock have doubled since 2006. With world fertiliser prices very sensitive to demand from India, which is not only the world’s largest importer of fertilisers but also dependent almost entirely on imports for feedstock, improving efficiency of fertiliser use must be a the Twelfth Plan focus, almost as important as the issue of water use efficiency taken up in another chapter.
A New Road Map for Fertiliser Policy
12.39. A broad idea of what is necessary is evident from a few key indicators about the price of urea, the most important and politically sensitive fertiliser

Agriculture 15
in India. At the world level, urea prices had aver-aged about 80 per cent of world wheat price during the 25 years before 2005. Since then, they have been fluctuating wildly at much higher levels and world urea prices are now over 150 per cent of world wheat price. In comparison, the price of urea in India has been declining continuously in relation to wheat MSP—from over 150 per cent during the 1980s, to 75 per cent in 2005, to only 41 per cent currently. While MSP of wheat for 2012 was 90 per cent of April–June average of world reference price of wheat, the MRP for urea was only 21 per cent of world reference price of urea.
12.40. Similarly, achieving the recommended national 4:2:1 NPK balance has proved elusive, again partly because urea (main source of N) is priced cheap relative to other fertilisers. World prices of DAP (main source of P) and MOP (main source of K) have fluctuated around 150 per cent and 100 per cent of world urea price over the last 30 years with no obvious trend. Relative prices of P to N were similar in India as globally, and K much cheaper, till decon-trol in 1992 made these more expensive. The MRP for DAP and MOP in India were 194 per cent and 92 per cent of urea MRP before NBS, after which these have risen sharply again. Voluntary MRP for these are now 380 per cent and 230 per cent of urea MRP. Unless corrected soon, this large distortion in NPK prices is bound to reduce crop productivity.
12.41. One way out of the present conundrum is to bring urea into NBS and decontrol its prices. But this has not been possible so far and fertiliser decontrol both in 1992 and again in 2010 excluded urea with counterproductive effect. The reason for this is not just opposition to rise in urea prices, but also issues related to domestic urea industry. For example, sub-sidy provided to N for decontrolled fertilisers in the present NBS formula is based on the weighted average of subsidies on imported (around $320/tonne) and indigenous (around $160/tonne) urea. Three consequences would follow if urea prices were decontrolled fully with the subsidy on both imported and domestic urea equated to this (around $200/tonne). First, the domestic urea industry as a whole would get a windfall gain, and there may
be consequent audit objections, since average unit subsidy on domestic urea is presently half that on imported. Second, notwithstanding this, that part of urea industry which uses feedstock other than gas would complain that they could become unviable since their present subsidy is more than the weighted subsidy. Third, since post-subsidy price of urea would tend to settle at import cost less the weighted subsidy; this would, with world urea prices now about $420/tonne, not only double from the present MRP of `5,310 per tonne but also be subject to the very large fluctuations in world urea prices that have been evident since 2005.
12.42. Although political opposition to decontrol is mainly on the third point above, the other points, which relate to differences in costs of production between different Indian producers and between Indian costs and world prices, have historically been at least equally important impediments to reform in this sector. This is unfortunate since India’s fer-tiliser industry, although at disadvantage on feed-stock, is largely efficient and can play a key role both in ensuring future nutrient supply and in the effort to increase fertiliser-use efficiency. However, with more than half of its revenues coming from subsidies and with Government also allocating scarce feed-stock cheaply, industry effort currently is more to meet pre-set requirements and lobby, rather than to either secure long-term feedstock sources or develop new products and services for its customer base. This needs to change, and one way that this can be done is by reducing industry’s dependence on Central subsidies, allowing greater space for it to set prices. The industry’s present cost structure is such that no subsidy would be required on over 70 per cent of domestic urea production if urea MRP was allowed to rise to MSP for wheat or paddy. This level of urea MRP would reduce subsidy by about `15,000 crore annually and bring domestic NPK price parities in line with corresponding world parities while still leaving absolute fertiliser prices in India at about half international levels.
12.43. Of course, if this were all, urea prices would more than double with all its negative consequences. It would be politically unpopular even with the

16 Twelfth Five Year Plan
5–10 per cent extra increase in MSP that would be required to compensate increases in cost of produc-tion. There would definitely be some loss of output as result of lower urea use and farmers unable to avail MSP increase would suffer loss of income. But these negatives can be neutralised and a win-win outcome ensured if the saving in subsidy is ploughed back to develop suitable location and crop-specific packages with adequate price incentives so that farmers do not suffer income loss and yet are encouraged to use appropriate combinations not only of NPK but also organic matter and required micronutrients.
12.44. However, for this, the architecture for pub-lic intervention will need to go well beyond NBS. Designing and contracting suitable packages will require stability in prices of basic NPK in relation to crop MSPs and also considerable location-specific input, both scientific and operational. The Centre will need to ensure some insulation of domestic prices of straight fertilisers from their large world price fluc-tuations and devolve many functions and most of the savings from reduced urea subsidy to States. States, in turn, will need to involve universities and local bodies to design suitable local packages of products and sub-sidies and then contract directly with industry.
Cereals Production and Build up of Stocks12.45. Another major imbalance that emerged dur-ing the Eleventh Plan was between production and consumption of cereals, particularly rice and wheat on the one hand which led to rising stocks and rising consumption of edible oils and pulses which led to imports. Cereals production increased by 37 million tonnes (8 million tonnes coarse cereals, 11 million tonnes rice and 18 million tonnes wheat) between 2006–07 and 2011–12. This was the result of sev-eral factors, including the NFSM, an Eleventh Plan initiative to increase production, combined with remunerative prices and an expanding and effec-tive procurement machinery in Madhya Pradesh for wheat and Chhattisgarh for paddy. However, although NFSM exceeded targets and per capita production has bounced back beyond earlier highs, much of the increase has been absorbed by increase in Government stocks. There are lessons that need to be learnt from this for the Twelfth Plan.
12.46. The rapid accretion of stocks between 2006–07 and 2008–09 was because cereals output responded quickly to policy, both NFSM and MSP, rising from 203 million tonnes in 2006–07 to 220 million tonnes, accompanied by even larger increase in procurement, from 36 million tonnes to 59 mil-lion tonnes, while off-take from public stocks rose only from 37 to 39 million tonnes. Consequently, market availability declined during this period, increasing grain prices, the dominant source of food inflation till 2009–10 (Table 12.8). Availability con-tracted further in 2009–10 because of drought which caused output to fall back to 203 million tonnes. Rice and wheat relative prices eased somewhat in the subsequent two years because output increased even more rapidly than during 2006–09 to reach 240 million tonnes in 2011–12 and because this time rise in procurement (to nearly 73 million tonnes) was less than output and off-take increase (to 56 million tonne) was relatively much more. Nonetheless, pro-curement exceeded off-take throughout the Eleventh Plan, even during 2009 drought, and present stocks are clearly too high. Costing about `5 per kg per year to store, these are tying up huge resources that could have been put to better use.
12.47. One important point to emerge is that although food inflation is usually ascribed to pro-duction shortfalls, policy decisions on MSP and on pricing and quantum of PDS and open market sales can be even more important. This is of course true of rice and wheat prices that are directly affected by such policies, but there are indirect effects as well. For example, milk, eggs, fish and meat had almost no effect on food inflation from 2004–05 till 2008–09, but have contributed most to food inflation subse-quently (Table 12.8). As discussed earlier, much of this was due to feed and fodder shortages that the 2009 drought exacerbated. But the high build-up of rice and wheat stocks may in this context have con-tributed additionally. Substitution effects from lower availability of rice and wheat appear to have pushed up real prices of coarse grain to levels that compare with and most likely influenced inflation in livestock products. To maintain rapid agricultural growth, it will be necessary to continuously assess both MSP and trade policy in light of domestic production

Agriculture 17
trends, paying attention to such wider linkages, so as to minimise undue production imbalance and the inflationary pressures resulting from these.
12.48. Another important and related issue is the likely future demand for food. The Twelfth Plan Working Group on Crop Husbandry, Demand and Supply Projections, Agricultural Inputs and Agricultural Statistics has made projections for foodgrains and other food items by the terminal year of the Twelfth Plan, that is, 2016–17 (Table 12.9) which would suggest that present levels of cereals production already exceed likely demand at the end of the Twelfth Plan. These projections are based on actual past patterns of observed demand and the fact that cereals consumption per capita has declined since at least mid-1990s. However, it is also the case that India has very high levels of malnutrition and, although there are many reasons for this, deficiencies in calorie intake remain one of the most important. With cereals supplying over 50 per cent of total calo-rie intake even now, falling cereals consumption is the main reason why per capita calorie intake has not increased despite rising incomes. It is not just that the share of cereals in total food expenditure is falling; even poor people are reducing the share of income spent on all foods in order to meet other non-food
needs. In such a situation, where there is a disjunction between such a basic element of human development as nutrition and other demands in an increasingly consumerist society, there is need to ensure that min-imum nutrition requirements are actually met. This is the goal of the proposed National Food Security Act (NFSA) under which a majority of the popula-tion will be entitled to some very cheap cereals. This is likely to increase cereals demand from those pro-jected in Table 12.9, but nonetheless cereals demand is unlikely to rise much faster than population.
12.49. This means that agricultural production must diversify during Twelfth Plan so as to satisfy both tastes and nutrition. In particular, MSP policy should be more restrained for rice and wheat and made more effective in case of pulses and oilseeds where India is a net importer. Although MSP for pulses and oilseeds have been increased substan-tially in recent years, farmers are still not encouraged enough to put in the effort and resources required to substitute for current imports of these commodi-ties. This is primarily because procurement efforts in these commodities, which are currently not part of Public Distribution, simply do not offer farmers the certainty that they have from procurement effort in rice and wheat.
TABLE 12.8Real Prices of Agricultural Produce
(WPI commodity/WPI all commodities, 2004–05 base)
2004–05 2005–06 2006–07 2007–08 2008–09 2009–10 2010–11 2011–12
Rice 100 101 99 105 112 121 117 110
Wheat 100 101 112 115 117 127 120 108
Coarse Cereals 100 107 110 115 113 123 122 136
Pulses 100 108 134 124 124 146 137 129
Vegetables 100 109 103 118 113 124 128 115
Fruits 100 99 99 98 102 104 114 119
Milk 100 97 98 98 98 112 123 124
Eggs, Fish and Meat 100 102 101 100 99 116 133 137
Oilseeds 100 86 85 97 104 103 99 102
Sugarcane 100 96 91 87 80 81 109 107
Fibres 100 92 91 96 109 107 138 140
All Agriculture 100 99 101 104 106 115 123 122
Note: All agriculture comprises food and non-food primary articles.

18 Twelfth Five Year Plan
Public Distribution System12.50. The Eleventh Plan period witnessed sig-nificant improvements in administration of the Targeted Public Distribution System (TPDS). A nine-point action plan has been useful in elimina-tion of large number of ghost ration cards, reduction in leakages and greater transparency in the con-duct of TPDS operations. While carrying forward these initiatives with greater vigour, there is a need for rejuvenated approach towards the TPDS dur-ing the Twelfth Plan period. The foremost amongst those is the move towards facilitating rights-based approach under TPDS by enacting the National Food Security Bill (NFSB). The Bill has been intro-duced in the Parliament and is expected to provide food and nutritional security, in human life-cycle approach, by ensuring access to adequate quantity of quality food at affordable prices to people to live a life with dignity. This would require strengthening of existing infrastructure and taking up new initiatives
and schemes. Reforms in the TPDS would be crucial as it would bring about more efficiency in the sys-tem with enhanced transparency and accountability. Entitlements of foodgrains are expected to shift from per household basis to per capita basis. One of the important challenges for implementation of NFSB would be proper identification of beneficiaries which may be based on the ongoing Socio-economic and Caste Census. Another important initiative required during the Twelfth Plan is the end-to-end comput-erisation of the TPDS operations with the help of a comprehensive Plan scheme. This shouldnot only address current challenges but also facilitate proper tracking foodgrains and lifting by consumers using Aadhaar numbers or adopting innovative methods like smart cards.
12.51. The up-scaling of the TPDS for proper imple-mentation of NFSA is an opportunity to expand PDS coverage to include coarse cereals, pulses and edible
TABLE 12.9Demand and Supply of Food Commodities during the Twelfth Plan
(in million tonnes)
Crop/Group of Crops Projected Demand (million tonnes) Projected Supply
(million tonnes)
2016–17
Actual Production (million tonnes)
2016–17 2020–21 2006–07 2011–12
Rice 110 117 98–106 93 104*
Wheat 89 98 93–104 76 94*
Maize 19 22 15 22*
Coarse Cereals 36 38 42–48 34 42*
Cereals 235 253 240–251 203 240*
Pulses 22 25 18–21 14 17*
Foodgrains 257 277 258–272 217 257*
Oilseeds/Edible oils 59 71 33–41 24 30*
Sugarcane/Sugar 279 312 365–411 355 358*
Vegetables 161 189 116 147**
Fruits 97 124 59 75**
Milk 141 173 103 122**
Fish 11 14 6.9 8.3**
Meat, other than poultry 3.7 5.0 2.3 2.7**
Poultry Meat 3.3 4.3 2.2@
Source: Twelfth Plan Working Group on Crop Husbandry, Demand and Supply Projections, Agricultural Inputs and Agricultural
Statistics; *4th advance estimate for 2011–12; **Production for the year 2010–11; @Production 2010–11 for only commercial poultry
meat.

Agriculture 19
oils and thereby bring scale and certainty to their procurement. However, given that consumption and production patterns vary greatly from state to state, this is probably something that can be done better by the States themselves than by any Central agency. Nonetheless, as part of PDS reform, the Central Government could moot the idea not only of decen-tralised procurement but also the innovative meth-ods of transferring food subsidy. One option could be that, while the Centre continues to bear respon-sibility for delivering adequate quantities of cereals to every State, these may be priced close to market and food subsidy transferred to the States as recom-mended by the High Level Committee on Long Term Grain policy in 2002. Alternatively, subsidy could be credited directly to the bank accounts of the benefi-ciaries or the FPS dealers using authentication mech-anism of Aadhaar numbers. Other option could be to have a comprehensive electronic benefit trans-fer system whereby subsidy is loaded on to a smart card and consumers have a choice of commodities or fair price shops. These initiatives are expected to bring down leakages significantly as there would be little incentive left for intermediaries to divert the PDS foodgrains into the open market. While imple-menting these measures, it would be pertinent to address the issue of viability of FPS and improve their functioning. The Gross Budgetary Support for the Department of Food and Public Distribution is `1,523 crore for the Twelfth Five Year Plan.
Consumer Welfare and Protection12.52. Consumer welfare has been one of the core concerns of the Government since the post-Inde-pendence period. Policies have been designed and legislations enacted to protect the interests of con-sumers and grant them the rights of choice, safety, information and redressal. For the Twelfth Plan period, it would be apposite to expedite formula-tion of a comprehensive National Consumer Policy in conformity with the UN guidelines on consumer protection. Secondly, there would be a need to revisit existing legislations administered by the Department of Consumer Affairs so as to bring the provisions in line with the changes in the economy, trade, business and consumer expectations. This, inter alia, includes amendments in Bureau of Indian Standards Act and
Forward Contracts (Regulation) Act. There is also a need to conceptualise a National Policy for Quality Infrastructure covering standardisation, testing and legal metrology so as to provide the infrastructure for development of definitive standards, systems of legal metrology and conformity assessment. The commodity futures markets need to be strengthened to enable it to serve the dual purpose of price dis-covery and risk management. Besides, a structured system of information, counselling and mediation need to be put in place with emphasis on rural con-sumers. The data analysis and price monitoring also need to be more comprehensive and structured so as to make informed decisions on market intervention. The Gross Budgetary Support for the Department of Consumer Affairs is `1,260 crore for the Twelfth Five Year Plan.
MAJOR CHALLENGES AND PRIORITIES DURING THE TWELFTH PLAN12.53. The main lesson from the performance in the Eleventh Plan is that while there has been a wel-come turn-around from the deceleration that was evident in the decade to 2005, and while several indicators have shown marked improvement and potential to build upon, several policy imbalances exist that can prove to be major handicaps. There are also other formidable challenges, for example, a shrinking land base, dwindling water resources, the adverse impact of climate change, shortage of farm labour, and increasing costs and uncertainties associated with volatility in international markets. The Twelfth Plan will need to face these challenges boldly.
12.54. The key drivers of growth will remain:
1. viability of farm enterprise and returns to invest-ment that depend on scale, market access, prices and risk;
2. availability and dissemination of appropriate technologies that depend on quality of research and extent of skill development;
3. Plan expenditure on agriculture and in infra-structure which together with policy must aim to improve functioning of markets and more effi-cient use of natural resources; and

20 Twelfth Five Year Plan
4. governance in terms of institutions that make possible better delivery of services like credit, animal health and of quality inputs like seeds, fertilisers, pesticides and farm machinery.
12.55. In addition, certain regional imbalances must be clearly addressed. A national priority from view of both food security and sustainability is to fully extend Green Revolution to areas of low pro-ductivity in the eastern region where there is ample ground water, and thereby help reduce water stress elsewhere. Rain-fed areas continue to be at a disad-vantage, and their development still requires some mindset changes.
FARM VIABILITY: SECURING ECONOMIES OF SCALE AND BETTER MARKET ACCESS AND RETURNS12.56. Farm profitability is central to achieving rapid and inclusive agricultural growth. Improved agricul-tural prices (Table 12.8) were an important driver in success of the Eleventh Plan. But slower growth of demand in some major sub-sectors (Table 12.9), combined with higher input costs due to world price trends, could cause this driver to be more muted in Twelfth Plan unless offset by increase in productiv-ity. The reports of the Commission on Agricultural Costs and Prices show low net farm revenue for many crops, particularly rain-fed. Diversification towards higher value crops and livestock remains the best way not only to improve farm incomes and accelerate growth, but also to reduce stress on natu-ral resources which form farmers’ production base. This needs better infrastructure and emphasis on integrated farming systems, combining crops and livestock, including small ruminants, for different location-specific endowments. This also requires innovative institutional and contractual arrange-ments so that smallholders have the requisite tech-nology and market access.
(A) The Centrality of Smallholdings12.57. Small farms typify Indian agriculture and this predominance continues to increase. Agriculture Census 2005–06 reported the average size of an operational holding at only 1.23 hectare, with farms less than 2 hectares comprising 83 per cent of all
holdings and 41 per cent of area. No agricultural development Plan can be credible unless it is relevant to this vast majority of farmers. Also, 12 per cent of rural households are now female headed with even smaller holding, and the feminisation of agriculture poses special problem.
12.58. An important step that would help small and marginal farmers is to reform the tenancy laws. These were originally meant to help small and marginal farmers but now operate against them. Even limited legalisation of agricultural tenancy and freeing the land lease market with proper record of ownership and tenancy status will help such farmers. Some small farmers may lease out land to shift to other occupa-tions, provided they were assured that they could resume the land if they wished. Some large farms may lease in land and even employ the small owner on his own farm to grow specific crops under supervision. Moreover, a stark reality of India’s farm situation today is that while land hunger continues unabated amongst the poor and uneducated, especially female, educated young men in richer households are leaving agriculture. The rapid rise of wages for rural casual labour during the Eleventh Plan period has further increased the relative cost of cultivating with hired labour. Many large and absentee owners are leaving land under-cultivated which could be leased out if they were assured of retaining ownership.
12.59. The Eleventh Plan had set out in detail the key elements necessary to make land policy effective for equity and efficiency. These are:
1. Modernisation of land records must be both time-bound and comprehensive. Full digitisa-tion of land records, including GIS maps, should be completed with required survey/settlement by end of the Twelfth Plan, during which pilots should also be initiated to enable movement towards a Torrens system in the Thirteenth Plan.
2. Although there is no strong case to change existing ceiling laws, there are several pending implementation issues that can and should be addressed as land records are modernised.
3. Land issues in tribal areas require urgent and special attention.

Agriculture 21
4. Although no major new redistribution of agri-cultural land is likely, it is possible to ensure that all rural households have at least homestead-cum-garden plots.
5. Tenancy should be legalised in a ‘limited’ man-ner. Prescribed rents, if any, should allow a band wide enough for rents to be contracted mutually over contract periods long enough to encourage investment by tenants while protecting owner-ship rights so that landowners have incentive to lease out land rather than keep this underutilised or fallow.
6. Small and marginal farmers, particularly women, lack adequate access to credit, extension, insur-ance and markets. While every effort should be made to strengthen delivery of public services in their favour, the intervention likely to be most potent is support to group action by farmers themselves. It was suggested that subsidies in Government schemes give preference to group activity.
12.60. Most of these issues, as well as the associ-ated matter of consolidating fragmented holdings in course of survey/settlement, are in the State domain and progress is uneven. Ongoing efforts of Ministry of Rural Development (particularly, Department of Land Resources) and Ministry of Tribal Affairs also address some of these issues, although not necessar-ily related directly to agriculture. However, there was little progress during the Eleventh Plan on the sug-gestion to redesign schemes so that subsidies favour group activity among small and marginal farmers. In fact, a criticism of the Eleventh Plan schemes has been that these diluted earlier specific support for such farmers.
12.61. Almost all the Twelfth Plan working groups set up by the Agriculture Division of Planning Commission have strongly recommended that the Twelfth Plan should put special focus on building capacity that encourages group formation and col-lective effort by small, marginal and women farm-ers, rather than simply provide additional subsidy to individuals in these categories. Existing group activ-ity takes many forms depending on purpose. From lower tiers of formal cooperative structures in credit,
marketing, dairy and fishery, extending to self-help groups (SHGs), farmer clubs, joint liability groups (JLGs) and, more recently, to producer compa-nies. For simplicity, these can all be termed Farmer Producer Organisations (FPOs).
12.62. The Twelfth Plan Working Group on Disad-vantaged Farmers, including women has provided evidence-based assessment of the ground situation. New insecurities of tenure from urbanisation and industrialisation are impacting small farms which are efficient but lack adequate access. Its main rec-ommendation is that a collective approach should be promoted in agriculture for small and women farmers at all points of the value chain. It cites many successful examples that stretch from the Gambhira farmer’s collective in Gujarat, initiated in 1953 and still going strong, to several initiatives of women’s group farming in Andhra Pradesh such as one ini-tiated by Deccan Development Society in 1989 and another initiated by a UNDP-GoI project in 2001 and sustained since 2005 by the Andhra Pradesh Mahila Samakhya (APMSS). The most recent suc-cess story is the collective farming initiative launched in 2007 under Kudumbashree jointly by Kerala Government and NABARD. Success of these in increasing production and empowering women point to a need for States to experiment with (i) channelising NGO strength in mobilising people to encourage small holders to shift from an individual to a group-oriented approach; and (ii) facilitating land access by groups of disadvantaged farmers with appropriate arrangement for provision of inputs, including credit. Financing such experiments should be permissible under RKVY.
12.63. Since land access was the most difficult part in all the above efforts, the Working Group has sug-gested that, except distribution of homesteads to the homeless which should have the highest priority, future Government land distribution should be to groups of landless and women farmers rather than to individuals. This could take the form of long-term lease which would expire if the group broke down, for which it would be necessary to legalise tenancy at least for this purpose. Moreover, an innovative suggestion of both this Working Group and the

22 Twelfth Five Year Plan
Working Group on Marketing is to set up Public Land Banks (PLB) at Panchayat level. Landowners could ‘deposit’ uncultivated land and receive regular payments from the PLB varying by period of deposit and rents actually obtained with the guarantee that this ‘deposit’ can be withdrawn with suitable notice. The PLB could then lease out to small and women farmers or their collectives. A form of ‘limited’ ten-ancy aimed at fuller agricultural use of available farm land and to slow down speculation in such land for future non-agricultural use, this idea excludes leas-ing to corporate entities. However, to set up PLBs will require some initial seed capital and a clear legal framework. If States provide the legal framework and the necessary guarantees, the seed capital could also be permissible under RKVY.
12.64. Access to finance, especially by small hold-ers, is crucial for improved agricultural performance. Credit flow doubled in the Eleventh Plan but mainly by credit deepening, with little increase in farmer coverage and still leaving 60 per cent of farmers without institutional credit. There are several ways in which credit access can be widened. Primary Agricultural Co-operative Societies (PACS) still have the widest coverage and must be made more member-driven and less dependent on higher tiers. Joint Liability Groups (JLGs) are still the most appropri-ate mechanisms for farmers and livestock owners who have productive assets but cannot access credit because they have no land records, are located too far from banks or have last mile problems. The SHG-Bank Linkage programme is still the most appropri-ate financial mechanism to extend credit to marginal and dry land farmers as this allows better income smoothing since SHGs provide space for diversity in loan purposes and sizes, enabling financing of a variety of activities that such families select as part of livelihood strategies when income from agriculture is low.
12.65. Commercial banks have not supported JLGs or SHGs as much as they could have, preferring instead to comply with priority sector requirements by offering bulk finance through Non-Banking Financial Companies (NBFC) and Micro-Finance Institutions (MFI). However, NBFC–MFI lending
is mainly individual and based on standard prod-ucts imposing short repayment schedules which did not dovetail with cash flows from agriculture. This caused multiple borrowings, increased risk to borrowers and led to a backlash. The solution is to restore the principle of group decisions by bor-rowers both in the borrowing process and in use of borrowed resources. This need not exclude NBFC–MFI so long as shortcuts are avoided. For example, NABFINS, a NBFC promoted by NABARD, lends only to groups and uses a Business Correspondent (BC) Model that also provides working capital to sec-ond level institutions like cooperatives and producer companies which aggregate, add value and market commodities. The SHGs have a stake in these second level institutions which help expand their livelihood base.
12.66. Small and marginal farmers face problems not only with shrinking land assets and with credit; they have difficulty in accessing critical inputs for agriculture such as quality seeds and timely techni-cal assistance. In this situation, FPOs offer a form of aggregation that leaves land titles with individual producers and uses the strength of collective plan-ning for production, procurement and marketing to add value to members’ produce through pooled resources of land and labour, shared storage space, transportation and marketing facilities. These also improve bargaining power of small farmers and, most importantly, reduce transactions costs of banks and buyers to deal them. Investing in such group efforts has strong externalities.
12.67. The Twelfth Plan Working Group on Agri-cultural Marketing, Infrastructure, Secondary Agriculture and Policy for Internal and External Trade has in fact suggested that an institutional development component, along lines of NABARD’s farmer club scheme, be introduced in all Centrally sponsored schemes to specifically target FPO for-mation among small producers, especially tribals, dalits and women. It notes that a majority of FPOs that are likely to emerge as a result of such an inter-vention will remain focused on addressing issues of crop planning, technology infusion, input supply and primary marketing. But, with adequate support

Agriculture 23
for business development, about one fourth to a third would seek to leverage presence further up the value chain, most likely at the lower end (for exam-ple, setting up pack houses, grading centres, small cold stores, drying or quick freezing plants). Larger FPOs, for example, existing cooperatives could pro-vide this support and in fact could aim bigger, but issues may be different. For example, the National Dairy Development Board’s SAFAL has had only limited success although the wide network and logis-tics of milk cooperatives make these obvious incuba-tors for village-level aggregation of other perishable products. Therefore, the Twelfth Plan must try to mainstream support for FPO formation and capac-ity building using all credible agencies for the pur-pose: existing cooperatives, NABARD and the Small Farmers’ Agribusiness Consortium (SFAC).
(B) Issues in Expanding Agricultural Marketing and Processing
12.68. A major problem facing cultivators is that they do not get remunerative prices because of uncer-tainties caused by inadequate market information, unnecessary controls, lack of physical infrastruc-ture and price volatility—both domestic and global. In order to provide adequate incentives to farmers, the Twelfth Plan will have to focus on leveraging the required private investment and also policies that make markets more efficient and competitive.
12.69. Reforming the Agricultural Produce Market-ing Committee (APMC) Acts should therefore have priority as emphasised in the Eleventh Plan and the Mid-term Appraisal. The introduction of the Model Act in 2003 was directed towards allowing private market yards, direct buying and selling, and also to promote and regulate contract farming in high-value agriculture with a view to boost private sector invest-ment in developing new regularised markets, logistics and warehouse receipt systems, and in infrastructure (such as cold storage facilities). This is particularly relevant for the high-value segment that is cur-rently hostage to high post-harvest losses and weak farm-firm linkages. While many States have moved towards adoption of the Model Act, actual progress has been limited. Often the permissions given are subject to unacceptable restrictions which make
them ineffective. Vested interests in maintaining the existing mandi system intact are very strong. In view of the slow progress, the Ministry of Agriculture set up a Committee of State Ministers in-charge of agricultural marketing. The Committee submitted a ‘First Report’ in September 2011 which has been circulated to all States and UTs. The report calls for ‘speedy reforms’ of Agricultural Produce Market Committees (APMC) Act across different States along with ‘time-bound development’ of marketing infrastructure. Calling for a ten-year perspective plan to improve infrastructure of backward and forward linkages for agriculture production and marketing, the report has suggested that agricultural marketing be given access to priority sector lending. Thus, the process to secure necessary amendments in APMC Acts and thus create the enabling legal environment is still ongoing. The Twelfth Plan will need to fast-track modernisation of mandi infrastructure, with adequate provision of communication and transpor-tation, and also empower small producers through their organisations and marketing extension.
12.70. Post-harvest losses, probably average 10 to 25 per cent, being particularly high in horticul-ture, livestock and fisheries. Very large investments are required in developing agricultural markets, grading and standardisation, quality certification, warehouses, cold storages and other post-harvest management of produce to address this problem. Such large investments are possible only with the participation of the private sector which, in turn, require freedom from controls on sales/purchase of agricultural produce, its movement, storage and pro-cessing. Many new initiatives were taken up during the Eleventh Plan, including both terminal markets under Public–Private Partnership (PPP) mode in the National Horticulture Mission (NHM) and a model of public sector investment combined with profes-sional management by stakeholders as exemplified by NDDB’s fruit and vegetable wholesale market at Bengaluru and APEDA’s Modern Flower Auction Houses.
12.71. The Twelfth Plan Working Group on Horti-culture and Plantations which studied the matter in detail has observed that participation by traders,

24 Twelfth Five Year Plan
wholesale buyers, exporters and processors has actu-ally been very low in all these new initiatives because of reluctance to be subject to transparent operating procedures. It has come to the conclusion that the present model of Market Sector Reforms which is trying to create space for a new set of modern mar-kets in coexistence with much less transparent pro-cedures in APMC regulated markets is unlikely to result in any major private investment in modern marketing infrastructure. In its view, to break the barrier of reluctance to participate in business of modern markets it is necessary as part of marketing reforms to define and introduce a common Standard Operating Procedure (SOP) for all markets: both the new modern markets envisaged as well as exist-ing regulated markets under APMC Acts. Therefore, it proposes that managements of existing regulated markets must be made to adopt the modern market-ing model: that is, undertake the auction function themselves and all payments to sellers ensured by the Market Committee through a system of bank credit limits of the buyers. This would involve redefining the role of APMC management with introduction of SOP and an open policy of registering buyers; permitting setting up of private markets in APMC areas; removal of interstate barriers to allow an uni-fied national market, either by using entry 42 of the union list or at least for sealed container cargo; and single point levy at first point of sale.
12.72. While this entire area of regulation of agri-cultural product markets is thus in some flux and movement is still slow, an important initiative in the Eleventh Plan involved setting up a Warehouse Regulatory and Development Authority (WRDA) to set standards and modernise warehousing. The aim is enlarged use of negotiable warehouse receipts that can be linked to e-trading, both spot and future, so that farmers have an alternative to mandis. However, so far less than 300 warehouses have been registered and there is yet no effective coverage of perishable products. Cold storages have recently been brought under WRDA but minimum standards are yet to be set. This may be as difficult as meeting the require-ment of cold storage additional capacity estimated at around 32 million tonnes over the next decade. Present cold storages are of inadequate quality, most
domestic component manufacturers do not have certified performance ratings, BIS standards do not exist for many critical components of cold chain infrastructure and critical storage conditions pre-scribed internationally for cold chain structures have yet to be validated for many Indian agro-climatic conditions or cultivars.
12.73. Although India ranks second in world pro-duction of fruits and vegetables, only 6–7 per cent of this is processed, compared to 65 per cent in US and 23 per cent in China. A well-developed food process-ing industry is expected to increase farm-gate prices, reduce wastage, ensure value addition, promote crop diversification, generate employment opportunities and boost exports. Further, issues concerning food processing industry are dealt with in Chapter 9.
12.74. The private sector needs to invest much more in creation of warehousing capacity, cold storages and supply chains. In this context, the Planning Commission had also set up a Committee on Encouraging Investments in Supply Chains includ-ing provision for cold storages for more efficient distribution of farm produce, which submitted its report in May 2012. The Committee has indicated that with regard to foodgrains, the Department of Food and Public Distribution has initiated steps for creation of 17 million tonnes of additional stor-age capacity including 2 million tonnes in the form of silos. This additional capacity is expected to take care of public sector’s warehousing requirement dur-ing the Twelfth Plan. The Committee has recom-mended to exempt perishables from the purview of APMC, provide freedom to farmers and make direct sales to aggregators and processors, introduce elec-tronic auction platforms for all the mandis where daily transaction is above `10 crore, and replace licensees of APMC markets with open registration backed by bank guarantees to ensure wider choice to growers and to prevent cartelisation by traders. The Committee has recommended encouraging large-scale private investments in the cold chain sector using PPP Model with Viability Gap Funding besides providing budgetary support and capitalising on schemes such as Rural Infrastructure Development Fund (RIDF). An Inter-Ministerial Group on Cold

Agriculture 25
Chain Infrastructure and Allied Sectors has been set up by the Government to facilitate implementation of these recommendations.
12.75. There is merit in planning part of such invest-ment as infrastructure to reduce waste and enlarge markets rather than wait for corporate investment in processing or retail. The extent of wastage is not eas-ily ascertainable and new research suggests that some of the older estimates were quite likely exaggerated, especially if quality loss leading to lower prices is not counted as waste. Also, the experience so far is that corporate entrants have not fared very well in the competition with incumbent traders since existing trading margins, although high, are in fact much less than, for example, in the USA. However, there is no doubt that modern storage and logistics do reduce waste. If such infrastructure also improves farm shares, social returns could exceed the private and justify subsidies. Subsidy rates, increased recently to 25–50 per cent, are now quite high and policy should be clear on whether the goal is just capacity targets or wider market access and improved mar-keting efficiency. If the latter, eligibility criteria need to be specified and also linked clearly with market-ing reform. Social returns to subsidy will be more if access to both the infrastructure and to markets is more open. The real test is whether these can spawn and sustain enterprise in aggregation, grading and processing at the bottom, preferably by FPOs, but also by lead farmers and even by existing commis-sion agents.
12.76. The recent decision to open up debate on FDI in retail must be seen in this context. With multi-brand retail already open to the domestic corpo-rate sector, FDI in retail should not be viewed as an entirely new disruptive factor affecting traditional retail. It will only add depth and competition to the present situation. Deeper pockets and technology, and the compulsions to invest in supply chain devel-opment which is not there for domestic modern retail may accelerate investment in logistics, quicken consolidation of retail trade and create new pro-prietary supply chains. It must be emphasised that FDI alone will not resolve back-end issues related to modernising agricultural markets that have so
far muted the domestic corporate effort and invest-ment. FDI has an added potential to link farmers to wider markets by expanding exports. However, the Eleventh Plan had also noted the legitimate concern that if front-end investment outpaces backward linkage, the outcome could instead be more imports and lower farm prices. The introduction of FDI will increase, not lessen, the importance of priorities identified above: marketing reforms, aggregation at the bottom and public funding of stand-alone infrastructure.
12.77. With less than 40 per cent of farm produce presently consumed in urban areas and much less processed, use of public funds to improve market efficiency will have a positive effect on farm growth. There are benefits in coordinating this effort with other steps to encourage corporate investment in this area. For example, the NHM was designed based on a concept of adequately sized area clus-ters so that processors could plan capacities based on anticipated future fruit production that would in turn ensure markets for farmers when trees finally bore fruit. But processors have preferred to wait and watch while farmers, not sure of adequate market for any single crop, have usually chosen to diversify their production basket. Most clusters have therefore not developed in the manner intended. A larger thrust to modernise processing and retail will require bringing more synergy between corporate actors and farmers, particularly in infusion of technology and capital at the farm end.
12.78. The Ministry of Agriculture has proposed a RKVY window for Public–Private Partnership for Integrated Agricultural Development (PPPIAD) for States to facilitate ‘large scale integrated projects led by private sector players with a view to aggregating farmers and integrating agricultural supply chains.’ The idea is to leverage corporate interest and mar-keting solutions to part-finance mobilisation of expertise to form FPOs and infuse technology and capital to enhance farm production and value addi-tion. This is in line with views of various working groups, and needs to be piloted. But since this will in effect be public subsidy to contract farming, it is necessary to be clear on what should and should

26 Twelfth Five Year Plan
not be subsidised. First, project selection should go beyond where contract farming would normally occur; that is, give priority to proposals involv-ing FPOs composed mainly of small and marginal farmers in less accessible and rain-fed locations. Second, tangible assets that are property of the cor-porate partner cannot be subsidised by RKVY. Only stand-alone assets of farmers or their FPOs should be subsidised. Third, a transparent project selection mechanism will be required to rank proposals, for example, by assigning marks based on States’ priori-ties to deliverables offered, with outcome indicators for subsequent monitoring. If this works, it might be a game changer, not only to form FPOs and widen farm-industry linkage but also to fast-track desir-able changes in cropping patterns.
(C) Credit and Cooperatives12.79. The Twelfth Plan Working Group on Institutional Finance, Cooperatives and Risk Management has projected the demand for credit during Twelfth Plan at between `31,24,624 crore and `42,08,454 crore, depending on the methodol-ogy used. At the higher end of these estimates, that is, assuming agriculture growth at 4 per cent and ICOR at 4.5, the size of the credit requirement in the Twelfth Plan period translates into about double the flow during the Eleventh Plan, that is, `8 lakh crore per year, as against the level of `4.68 lakh crore achieved during 2010–11.
12.80. This projected level of credit appears feasible in view of the Eleventh Plan achievement. As against credit flow of `2,29,401 crore in agriculture during 2006–07, the total institutional credit flow to agri-culture in 2011–12 was `5,11,029 crore. But despite this very robust growth, many issues continue to confront agricultural credit, particularly in the area of financial inclusion necessary for ensuring inclu-sive growth. Agricultural credit continues to neglect certain sub-sectors, the flow of term lending is dwin-dling and there is inordinate increase in the share of indirect finance. Credit dispensation by institutions to small and marginal farmers has been disappoint-ing, including by the Cooperative Credit Structure (CCS) which has traditionally catered to relatively smaller farmers.
12.81. On these issues, the working group has pointed to the need for more objective assessment of credit requirements for direct and indirect financ-ing of agriculture and also to redefine the priority lending sectors. It has suggested updating of KCC databases with priority analysis of KCC percent-age provided to the small and marginal farmers and more intensive use of ICT applications to track the flow of credit and transmission losses, with refer-ence to such farmers.
12.82. Some ongoing and emerging changes appear to hold promise of triggering off better financial inclusion for banking activity:
1. The Core Banking Platform provides seamless connectivity which, with the telecom infrastruc-ture, brings a new architecture to access financial services.
2. The BC model, together with mobile phones, can along with post offices provide significant last-mile connectivity.
3. Mandating payments (for example, of wages under the National Rural Employment Guarantee Act, pension dues and so on) through formal channels, including post offices, is help-ing to reach financial services to those so far not reached.
4. The enormous economies of scale generated by SHG Federations (each of 150–200 SHGs) is enabling banks to give larger loans for housing and health facilities for their members. A variety of insurance services are also being made avail-able, including life, health, livestock and weather insurance.
5. The UID project of the GoI with biometric identity may facilitate easier opening of bank accounts, although this has yet to happen.
12.83. The financial health of the Long-term Cooperative Credit Structure (LTCCS) continues to deteriorate with accumulated losses of `5,275 crore by March 2010, resulting in erosion of 59 per cent in owned funds. A quick decision is warranted on the implementation of the revival package for the LTCCS too on the lines of the Short-term Cooperative Credit Structure (STCCS).

Agriculture 27
12.84. Notwithstanding, the relatively improved financial health of the STCCS following implemen-tation of the revival package, its share in total insti-tutional credit continues to show a declining trend. The package for STCCS was conditional to radical restructuring of coops into autonomous, democratic and self reliant institutions without intrusion of politics and bureaucracy. The States have not imple-mented these recommendations with full serious-ness. Therefore, Cooperative Sector Reforms should continue to be insisted upon during the Twelfth Plan.
12.85. In the interest of strengthening of the ground level tier, there is also need for considering disci-plined refinancing of PACS as stand-alone institu-tions, provided that these are member driven. PACS still have the widest coverage and the recent develop-ment of financing PACS through commercial banks needs to be widened, deepened and strengthened, especially in cases where higher tiers of the STCCS are weak and not in a position to fund them.
(D) Farm Income Variability: Managing World Price Volatility and Climate Risk
12.86. The Eleventh Plan document had noted that farmers are now subject to much greater risk than what Indian farmers have been used to in the past. The frequency and severity of risks in agriculture have increased on account of climate variability and this has been accompanied by much greater variabil-ity of world prices and their quicker transmission into the domestic economy. On price variability, it had recommended much greater co-ordination between MSP and trade policies and for putting in place a system whereby tariffs on imports and exports of farm products could be varied quickly in response to world price movements rather than having to take recourse to outright bans which hurt both farmers and trade. On climate variability, it had recommended going beyond current insurance mea-sures and to put in place a tertiary mechanism for management and assessment through climate fore-casting and mapping of agricultural losses.
12.87. World agricultural prices rose sharply dur-ing the Eleventh plan period, with inflation about
9 per cent per annum in US dollar terms and price volatility much higher than before, accompanied by even higher world inflation in fuels and fertiliser. It is now generally agreed that among the several factors that contributed to this were more frequent weather shocks, policies to promote biofuels and increased demand on commodity future markets as a result of speculation and portfolio diversification. There is also consensus that linkage between agri-cultural prices and price of oil is now very strong and may cause high volatility to persist. As com-pared to this, domestic Indian agricultural prices were much less volatile and domestic prices of fuel and fertiliser were increased much less than corre-sponding international prices. Indian farmers were thus relatively better protected against both higher price volatility and higher costs. However, this has involved repressing inflation in fuel and fertiliser and required bans on exports during world-price spikes. Co-ordination between MSP and tariff policy is still very weak. For example, while other aspects of a recent CACP suggestion for oil palm development can be met by ongoing schemes, the proactive tariff support required is a sticking point. These will need to be addressed during the Twelfth plan.
12.88. On the climate side, a number of initiatives taken by the Indian Space Research Organisation (ISRO) and the India Meteorological Department (IMD) during the Eleventh Plan have significantly improved the scope and quality both of climate data and of other remote sensing tools. Although IMD’s long-range forecasts of the monsoon still have a very large margin of error, its shorter-range prod-ucts not only have greater accuracy but cover an array of agro-meteorological variables with fairly high resolution. There is also much better co-ordi-nation today between ISRO and IMD on one hand and the Ministry of Agriculture, corresponding State departments and NARS on the other. For example, Department of Agriculture and Cooperation (DAC) has set up a Mahalanobis National Crop Forecasting Centre with ISRO collaboration to augment pre-sent crop forecasts and assessment with regular remote sensing, GIS and Global positioning System (GPS) data.

28 Twelfth Five Year Plan
12.89. With better satellite products, an Eleventh Plan innovation was the Integrated Agro-Meteorological Advisory Service (IAAS) which now issues regular weekly Agro-Met Advisory Bulletins up to district level on field crops, horticulture and livestock. This involves agricultural universities to collect and organ-ise soil, crop, pest and disease information and amal-gamate this with weather forecasts to assist farmers in their decisions. Though still of very variable qual-ity from district to district, and limited since dis-trict is too big a unit for useful advisory, a 2009–10 NCAER study concluded that this brought large sav-ings to farmers. In the Twelfth Plan, a Gramin Krishi Mausam Seva (GKMS) will be launched to extend IAAS to block level, initially on experimental basis. Also, IMD will implement the Monsoon Mission aimed at generating better seasonal monsoon rainfall forecasts in different spatial ranges.
12.90. In a parallel Eleventh Plan initiative, that took advantage of IMD experience with Automatic Weather Stations technology, Government launched a Weather Based Crop Insurance Scheme (WBCIS) through the Agricultural Insurance Corporation (AIC). Initiated as a pilot in Kharif 2007 in 70 hob-lis of Karnataka for 8 rain-fed crops, by 2010–11 the Scheme was being implemented in 17 States and covered more than 67 lakh farmers growing crops on 95 lakh hectares spread over 1,010 blocks in 118 districts.
12.91. At present WBCIS has about one-third the coverage of the National Agricultural Insurance Scheme (NAIS), the main crop-insurance vehicle. Based on results of crop-cutting experiments, this has been in operation since 1999–2000. Although a useful device, especially for farmers growing rela-tively risky crops, the main problem with NAIS is that it is not actuarial insurance. Premiums for most important crops are fixed at all-India level irrespec-tive of risk and Central and State Governments pay for the entire excess of claims over premium received. Moreover, being compulsory for all bor-rowers from banks in States where it is in force, and with relatively few non-loanee farmers involved, it mainly insures banks against default following poor harvest. Further, its popularity with farmers is
limited since crop-cutting experiments delay claims/payments until well after harvest and risk covered is only of yield shortfalls at the block level.
12.92. For these reasons AIC is also piloting a Modified National Agricultural Insurance Scheme (MNAIS) since 2010 that aims to (i) reduce the insur-ance unit from block to village panchayat with higher indemnity as proportion of threshold yield, (ii) move to actuarial premiums supported by upfront subsi-dies instead of NAIS practice of Government paying the entire excess of claims over premium, and (iii) extend insurance cover to situations such as failed sowing, cyclonic rains and localised calamities, such as hailstorms and landslides. The main problem is lowering insurance unit which although good for farmers increases the cost and effort on crop-cutting experiments exponentially.
12.93. As a result, the Government of India is cur-rently implementing four schemes, that is, NAIS, MNAIS, WBCIS and another pilot Coconut Palm Insurance Scheme (CPIS). Only NAIS is being implemented as a full-fledged scheme and the other three are being implemented on pilot basis. The pilot programmes will be evaluated early in the Twelfth Plan for future revisions/modifications to evolve a National Agricultural Insurance Programme. For this, the following will be necessary. First, define what should be the core programme which Government should set up and what should be left to companies to devise their own insurance products. Second, to examine the trade-off between competi-tion and benefits of risk pooling, that is, a centralised reinsurance system. Third, arrive at an optimum mix between weather-based insurance and those depend-ent on yield measurements whether by crop-cutting experiments or remote sensing.
12.94. Some suggestions, based mainly on the Twelfth Plan Working Group on Institutional Finance, Cooperatives and Risk Management, are:
1. Taking as core the ongoing NAIS, modifications being made through the pilot MNAIS should be continued. The high cost of lowering the insur-ance unit should be dealt with progressively in

Agriculture 29
consultation with States. Centre may share part of the cost of crop-cutting experiments in the short-run but should shift to new technologies such as satellite imagery in the long run.
2. The issue of private-sector involvement in agri-cultural insurance can be creatively addressed, for example, through a system of co-insurance under which the AIC is lead insurer (with under-writing responsibilities and contacts with mul-tiple agencies).
3. Weather-based insurance should continue, again focused on customisation and innovation such as double trigger (weather and yield) and index-plus products, with State Governments choos-ing what to subsidise. Roll-out of AWS can be demand-led and private sector also involved but with mandatory accreditation from a com-petent third-party designated by Government to ensure consistent and high-quality weather data. Further, Terrestrial Observation and Prediction Systems (TOPS) platforms need to be pilot tested.
4. Other innovative products such as community-based mutual insurance, savings-linked insur-ance, a properly designed product fort contract farming arrangement and so on can help estab-lish insurance culture, especially if linked to FPO formation.
5. Agriculture insurance, being specialty insur-ance with huge Governmental intervention should be seen more as a social instrument of the Government rather than a commercial instru-ment, hence is unlikely to be effectively adminis-tered unless backed by a statute.
6. To protect non-insured farmers from extreme financial distress, Government may con-sider ‘Catastrophe Protection.’ A blanket Life Insurance cover could be devised for at least small/marginal farmers (including tenant farm-ers) to meet liabilities to banks or other RFIs in the unfortunate eventuality of death and to secure some financial support to families of the deceased. Premia on such group/blanket insur-ance could be funded by Central/State Govern-ments and financing banks, in full or in part.
7. Crop losses arising out of natural calamities are presently compensated by Government funding
or concessions like loan/interest waivers/defer-
ments. This practice is fraught with inefficiency,
besides crippling repayment ethics. It is, there-
fore, necessary that dealing with loan losses
should be internalised within the banking system
through the constitution of Relief and Guarantee
Funds and Stabilisation Funds (set up partly with
Government funding, by diversion of subsidies
for loan repayments and so on).
AGRICULTURE RESEARCH AND EDUCATION12.95. Agricultural research has played a vital role in
agricultural transformation and in reducing hunger
and poverty and its role in the Twelfth Plan will be
crucial. The Eleventh Five Year Plan had noted that
research in the past had tended to focus mostly on
increasing yield potential by more intensive use of
water and biochemical inputs, paying less attention
to either the long-term environmental impact of this
approach or to methods and practices for efficient
use of inputs and natural resources (Table 12.10). But
now that limitations of this approach were evident,
there appeared to be lack of any clear agricultural
research strategy or to assign definite responsibili-
ties and prioritise the research agenda rationally. It
had proposed that ICAR institutes undertake basic,
strategic and anticipative research, focusing particu-
larly on problems of rain-fed agriculture, while SAUs
concentrate on generating required manpower and
on applied and adaptive research to address local
problems. It had emphasised that research should
shift from a commodity based approach to a farm-
ing systems approach through convergent efforts of
R&D agencies within each agro-climatic region to
address local problems identified by stakeholders,
including development agencies. It had also stressed
the need to enhance spending on NARS and pro-
posed to raise this to 1 per cent of agriculture GDP
by end of the Plan period.
12.96. As it turns out, research spending at 2006–07
prices, although reaching nearly 0.9 per cent in 2010–
11, averaged only 0.7 per cent during the Eleventh
Plan. At current prices, it was even less, averaging
only 0.64 per cent during the Eleventh Plan. Part of
the reason was a shortfall of about 20 per cent in the

30 Twelfth Five Year Plan
Centre’s Plan expenditure from that originally tar-geted, but the main reason was inadequate spending by States. While Centre’s expenditure (non-Plan and Plan, including RKVY) increased 68 per cent in real terms between the Tenth and the Eleventh Plan peri-ods, corresponding States expenditures increased only 22 per cent. In particular, non-Plan spending on SAUs increased less than 17 per cent, less than required to meet the pay commission awards in most States. Consequently, most SAUs are understaffed and underfinanced. This is undoubtedly the most serious problem confronting NARS.
12.97. Nonetheless, new SAUs continue to be cre-ated, especially in animal husbandry, which lack ade-quate staff, have little infrastructure and are grossly underfunded. Emphasis has to be laid on arresting proliferation and improvement, especially in core disciplines like modern biology, to ensure a steady supply of quality human resources. ICAR should specify minimum standards, and meeting these standards could be an eligibility condition for States to get RKVY funding.
12.98. Significant contributions of public-sec-tor research during the last decade have included
breakthroughs in basmati varieties, improved wheat varieties resistant to rust including race ug99, improved varieties of soybean, Bengal gram, mus-tard, chickpea and single cross hybrid maize; which have led to higher growth in these crops. Similarly, although most Bt cotton hybrids that are commer-cially successful are from private producers, these are based mostly on public material. With respect to nat-ural resource management, public research claims significant contribution in developing resource conservation technologies like integrated farming, micro-irrigation, laser levelling, zero tillage and agri-cultural practices to improve efficiency of nutrients and water, including in situ rain water harvesting. In fruits and vegetables, better varieties and hybrids, disease management and multiplication of planting material and in livestock and fisheries, disease man-agement technologies (vaccines and diagnostics), feed and fodder management, improving reproduc-tive health and production of fisheries seed.
12.99. Broadly, although NARS has yet to respond to changes suggested in the Eleventh Plan, there are signs of some new research priorities and agendas. As example of new collaborative research, ICAR launched the ‘National Initiative on Climate Resilient
TABLE 12.10Expenditure on Agricultural Research and Education
(` crore at 2006–07 prices)
Tenth Plan 2007–08 2008–09 2009–10 2010–11 2011–12 Eleventh Plan
States Plan 4,151 694 965 1,070 1,289 1,382 5,401
Non-Plan 6,477 1,464 1,315 1,497 1,755 1,599 7,629
Total 10,629 2,158 2,279 2,567 3,044 2,981 13,030
Centre Plan 4,977 1,210 1,418 1,402 1,909 1,998 7,938
Non-Plan 4,125 852 1,040 1,235 2,168 1,512 6,808
Total 9,102 2,063 2,458 2,636 4,077 3,510 14,745
RKVY Plan 55 197 63 100 160 576
Centre and
States
Plan 9,128 1,961 2,580 2,534 3,298 3,540 13,914
Non-Plan 10,603 2,316 2,355 2,732 3,923 3,111 14,437
Total 19,732 4,277 4,935 5,266 7,221 6,652 28,351
GDP Agriculture and
Allied (2006–07 prices)
33,40,648 7,64,890 7,65,601 7,73,565 8,27,969 8,50,812 39,82,837
Research/Education
as % GDP Ag
0.59% 0.55% 0.61% 0.67% 0.86% 0.76% 0.70%

Agriculture 31
Agriculture (NICRA)’ in February 2011 as a network project with several collaborating institutions with a view to enhance resilience of Indian agriculture to climate vulnerability through strategic research and technology demonstration. The research on adapta-tion and mitigation covers crops, livestock, fisher-ies and natural resource management. The project aims to enhance resilience through development and application of improved production and risk-management technologies. It plans to demonstrate site-specific technology packages on farmers’ fields for adapting to current climate risks and to enhance the capacity of scientists and other stakeholders in climate resilient agricultural research and its applica-tion. This will be continued during the Twelfth Plan.
12.100. For the Twelfth Five Year Plan, the ICAR has proposed a number of new initiatives in its man-ner of functioning, such as extramural funding for research, creation of funds for agri-innovations and agri-incubation and setting up of an Agriculture Technology Forecast Centre (ATFC). To improve staff strength and quality it has proposed an Adjunct Professor Scheme, Agriculture Sciences Pursuit for Inspired Research Excellence (ASPIRE), e-courses and more post-doctoral fellowships. Modernisation of SAU farms is also contemplated. In particular, it has proposed the following new thrusts:
• Conceived Research Platforms: Research con-sortia platforms are proposed for focused, time bound multi-disciplinary research in areas of ‘Agro Biodiversity Management; Genomics; Seed; Hybrids; GM Foods; Biofortification; Plant Borers; High Value Compounds/Phytochemicals; Nanotechnology; Diagnostics and Vaccines; Conservation Agriculture; Waste Management; Water Management; Natural Fibre; Health Foods; Precision Farming, Farm Mechanisation and Energy; Secondary Agriculture and Agri-incubators.’ These will involve partnership of ICAR with R&D organisations inside and out-side NARS. Inter-departmental platforms for research in these priority areas and also capacity building in basic sciences, remote sensing and medium range agri-advisory services will be fos-tered involving CSIR, DBT, ICMR, DRDO, DST
research institutes as well as general universities and Ministries of Environment, Space and Earth Sciences.
• National Agricultural Education Project: A National Agricultural Education Project for Systemic Improvement in Higher Agricultural Education and Institution Development is pro-posed to be undertaken as an externally-funded project to improve education quality in State Agricultural Universities.
• National Agriculture Entrepreneurship Project: Another externally-funded project is proposed in order to build an ecosystem for nurturing entre-preneurship development through translational research for technology commercialisation, man-agement of technologies for commercialisation, research for breakthrough technologies for accel-erated growth and higher-economic impact.
• Farmer FIRST: In order to make technology deliv-ery process more effective through the existing 630 Krishi Vigyan Kendras, this new initiative will enhance farmers–scientist contact through multi-stakeholders’ participation to move beyond production and productivity to privilege the com-plex, diverse and risk prone reality faced by most farmers.
• Student READY: A one-year composite pro-gramme, the Rural Entrepreneurship and Awareness Development Yojana (READY) is pro-posed with the objective to develop professional skills for entrepreneurship: knowledge through meaningful hands-on experience in project mode; confidence through end to end approach in prod-uct development; and enterprise management capabilities including skills for project develop-ment and execution, accountancy and national/international marketing.
• Attracting and Retaining Youth in Agriculture (ARYA): This initiative will be implemented with a youth-centric approach, targeting areas of agri-culture research which can be converted into via-ble economic enterprises and build capacities to attract rural youth to agriculture.
12.101. The Twelfth Plan allocation for ICAR is of a size that will allow spending on NARS to reach 1 per cent of agriculture GDP by end of the Plan provided

32 Twelfth Five Year Plan
States fund SAUs similarly. The above ICAR propos-als can have priority if defined in terms of delivera-bles, rather than areas. Also, NARS should address the following issues on priority basis during the Twelfth Five Year Plan:
• Strengthening soil organic carbon (SOC) research, particularly on the quality of organic matter and microbial activity, physical properties of SOC, validation and refinement of models and SOC dynamics under different land uses and manage-ment regimes.
• Developing Models and technology interventions on rational use of inputs, especially nutrients and irrigation water, under diverse agro-ecologies through interdisciplinary and farmer participa-tory mode in order to enhance their use efficiency, as also farm profits.
• The Expert Group on Pulses has been critical of NARS. Efforts to enhance the yield potential of pulses, by analysing physiological and biochemi-cal limitations of the current crop and designing more efficient types, is a priority which should also involve improving the nutritional quality of pulses and reducing various anti-nutritional factors.
• Another priority continues to be the development of heat resistant varieties of wheat.
• Greater thrust needs to be given to post-harvest management, secondary agriculture and value addition, along with by-products and waste man-agement. The agricultural technologies which have been developed and matured in the Eleventh Plan should be taken for commercialisation in the Twelfth Plan. Accordingly, the human resource development including para-technicians should be emphasised.
• Private agriculture input and seed companies use the research products of public system to generate profits. The public research system should seek a share in such profits which is possible if the pub-lic research system takes due care in protecting its intellectual property rights under the Protection of Plant Variety and Farmers’ Rights Authority (PPVFRA). This requires development of an appropriate pricing mechanism and preparing a suitable licensing system.
NATIONAL MISSION ON EXTENSION AND TECHNOLOGY MANAGEMENT12.102. The extension system of State agricultural departments is the weakest link in the chain between research and the farmer. Large number of vacan-cies of extension workers in the State Agriculture Department was one of the gravest concerns expressed by the Eleventh Plan document. During the Eleventh Plan, efforts were initiated to improve extension services by extending Central support to State extension reforms. This has resulted in 604 Agriculture Technology Management Agencies (ATMAs) to be established across the country with 21,000 new posts sanctioned with Central assistance at State, district and block levels. Also, since a con-tinuous problem plaguing extension has been lack of organic link between the research system and the extension machinery, R&D linkage guidelines were jointly brought out by the DAC and ICAR and sent to all States and SAUs. The basic thrust of these guidelines were to get ATMAs and KVKs to work together at the district level and below, keep-ing in view the priorities reflected in Comprehensive District Plans. Although neither has delivered full results, there is now much greater acceptance that things must be done together.
12.103. Seed is also an area where NARS made much greater effort than in previous recent Plan periods.
12.104. Along with seeds, farm mechanisation was also highlighted earlier as a source of the Eleventh Plan labour productivity gains. In view of emerging labour shortages in many states, there is demand to expand custom hiring services, as well as for new implements. During the Twelfth Five Year Plan it is proposed to give a co-ordinated thrust on seeds, farm mechanisation and extension through a new Mission on Extension and Technology Management. This should also have a component to fund ICAR research platforms to find solutions to problems thrown up by extension and requiring expertise beyond SAU.
(A) Seeds and Planting Material12.105. Three major yield successes during the last decade relate to cotton, maize and basmati rice.

Agriculture 33
These were driven by new seeds of which cotton and maize hybrids were mainly from private sector while basmati rice varieties were almost entirely public. Increased adoption of hybrids in cross-pollinated crops like cotton, maize, pearl millet and sorghum has been led largely by the private sector, which accounts for three-fourths of hybrids developed so far in the country. But there is discernable change in role of public sector in development of hybrids after 2001–02. Till 2001–02, private sector devel-oped 150 hybrids of cotton compared to 15 by pub-lic sector; 67 hybrids of maize compared to three in public sector. In the next seven years, public sector increased its share from 8 per cent to 19 per cent in cotton, from 4 per cent to 40 per cent in maize and from 25 per cent to 58 per cent in rice, with similar changes in other crops. In parallel, public production of quality seeds of varieties have increased rapidly in recent years, expanding the public share in total seed use. Production of quality seed doubled from 140 lakh quintals in 2004–05 to 280 lakh quintals in 2009–10, contributing significantly to the Eleventh Plan yield performance. Private sector accounted for 39 per cent of this seed production. Nonetheless, the ratio of quality seed to total seed use by farmers is still much lower than norm and there is considerable scope to raise crop productivity by raising this ratio.
12.106. There are several pending issues regarding seeds. For example, at present there is no regulatory mechanism to protect farmers against non-perfor-mance, say poor seed germination rate. The Seeds Bill, 2004, introduced in Parliament in 2004, is still under consideration of the Parliamentary Standing Committee on Agriculture. It aims to regulate the quality of seeds and planting material of all agricul-tural, horticultural and plantation crops to ensure availability of true to type seeds to Indian farmers; curb the sale of spurious, poor quality seeds; pro-tect the rights of farmers; increase private partici-pation in seed production, distribution and seed testing; liberalise import of seeds and planting mate-rials while aligning with World Trade Organization (WTO) commitments and international standards. Comprehensive and authentic databases on seed production and trade in India by public and private sectors as required under the seed and plant variety
laws need to be built up. The seed chain and the norms for quality control should be followed with-out any compromises or shortcuts.
12.107. At present, the public sector is responsi-ble for most valuable germplasm while private seed agencies concentrate on more remunerative high value seed segment. Under the circumstances, clear protocols need to be developed for sharing precious germplasm with the private sector on payment of royalty, while ensuring their conservation and pre-venting possible erosion of the national interest in the context of international agreements on plant variety and intellectual property rights. If this can be done, there is vast scope to expand linkages between the private seed industry and public research institu-tions to take advantage of the positive aspects of both the segments for the benefit of farmers.
12.108. ICAR needs to revisit procedures for variety identification, release and notification to cover pri-vate and farmers’ varieties and also to avoid bias in favour of varieties evolved by the testing institutions. The number of seed testing centres in the coun-try should be expanded rapidly, if necessary in PPP mode and with third party oversight, to reduce the time taken in assessment and refinement of varie-ties and hybrids and technologies for production and protection of crops. There is also a need for ‘Phytosanitary’ certification, especially for export/import of seeds. The State Seed Corporations may establish at least one such certification centre in each major State.
12.109. The DAC made the present assessment of seed requirement during the Twelfth Plan for its proposed Seed Mission with respect to some of the major crops which brings out that even excluding requirements arising from possible shift to hybrids, seed production of varieties will need to increase by about a third to meet the projected increase in seed replacement rates. Since seed-production planning should be done with a long-term perspective (con-sidering the viability of the seed) and also to keep buffer stock of seed to meet eventualities of natural calamities that require replanting, the actual pro-duction requirements may be higher. To meet the

34 Twelfth Five Year Plan
seed demand for 45 major crops produced within the country and required under diverse conditions, seed hubs need to be identified to produce seed and supply the same to the farmers in each area. This will save cost of transportation. Public agencies will also need to strengthen infrastructure for seed process-ing, storage, transportation and distribution.
12.110. Adequate availability of quality seeds is a par-ticular challenge for farmers in rain-fed areas where rainfall risks are high and productivity depends cru-cially on timely sowing within a short rainfall win-dow. The seed system must be capable of providing seeds of contingency or alternative crops during prolonged dry spells. With protection of crop diver-sity important in rain-fed areas, strengthening and improving local-seed systems and linking these to NARS is a necessity for productivity enhancement.
12.111. An important part of the new Mission will therefore be to better integrate farmers with produc-tion and distribution of quality seeds through, for example, seed village programmes and by encour-aging NGOs to help FPOs take up seed production. Therefore, capacity building will be vital to success. Fodder seeds that are presently neglected and scarce will need to be emphasised. Equally, the Mission must be enabled to convey to NARS accurate feed-back from farmers on seed suitability.
(B) Farm Machinery12.112. Wages have increased significantly in recent years and with labour accounting for more than 40 per cent of variable cost, many farm organisations report that shortage of labour is obstructing opera-tional efficiency. Animal power is also declining, with commercial banks reluctant to extend loans for bullocks. This has naturally led to an increase in farm mechanisation. However, farm mechanisation has so far been biased in favour of tractors and been concentrated in irrigated-command areas paying lit-tle attention to the needs of farmers in dryland areas and the scope for introducing small machines that might be useful to meet their needs.
12.113. Considering the farm sizes and prevailing skills, farm mechanisation penetration would have
to be enhanced through promotion of custom hir-ing models as well as individual ownership. While draft animal power based implements and manual tools should be owned by individual farmers (with appropriate financial incentives, for example, off season employment for animal power by integrat-ing some services such as ‘manure transport’ with MGNREGS), expensive machinery should be pro-moted thorough custom hiring. This could be done by promoting machinery service centres involving existing FPOs or by groups of farm youth trained in machinery operation and maintenance.
12.114. Greater impetus is needed to develop need-based and regionally differentiated farm machin-ery. Ongoing efforts by NARS need to be suitably strengthened with appropriate participation of com-mercial agricultural machinery manufacturers. Financial incentives could be linked to require-ments thrown up by extension experience from dif-ferent locations or from FPO demand. The Mission should identify and convey to NARS the critical mechanisation gaps and, in particular, specific local requirements related to machinery for soil and water conservation and gender-friendly implements.
(C) Strengthening Extension12.115. During the Eleventh Plan, the task of strengthening and restructuring agricultural exten-sion was approached through a wide mix of differ-ent initiatives. The context for this was that while public sector extension arrangements have weak-ened, the number and diversity of private exten-sion service providers have increased in the last two decades. These include the media, NGOs, producers associations, input agencies and agri-business com-panies. Many provide better and improved services to farmers, but their effective reach is limited and most poor producers are served neither by public nor private sector in many distant and remote areas. Notwithstanding the important role being played by private sector extension, there are also concerns with regard to wholesomeness of information, given equity and long-term implications.
12.116. Although setting up ATMAs in almost all districts was the single most important achievement,

Agriculture 35
this went hand-in-hand with efforts to enhance qual-ity through domain experts and regular capacity building. Other efforts included interactive ways of information dissemination, public–private partner-ships and pervasive and innovative use of ICT/Mass Media. Efforts were also made to involve agri-entre-preneurs, agri-business companies and NGO experts to bolster public extension. Most of these efforts will have to continue in the Twelfth Plan since exten-sion is a continuous process. But, in view of the ini-tial broken down condition, there are considerable gaps even after the subsequent effort. For example, an evaluation of ATMAs by the Agricultural Finance Corporation in 2009–10 found that although 52 per cent of respondent farmers said that they gained knowledge of new practices and technologies from this, only 25 per cent felt that this had helped to increase production. It is perhaps time to conduct a country-wide extension census to identify exten-sion resources (manpower, infrastructure, expertise) available in public and private sectors.
12.117. It is also necessary to continue with experi-mentation. There are number of models which have been successfully implemented in several States and countries which can be tried as pilots by ATMA and then expanded. Many civil society organisations have successfully experimented with community managed extension systems with members of the local com-munity acting as agents of agricultural extension. In the Community Managed Sustainable Agriculture (CMSA) model of Andhra Pradesh, members of the village community have been trained and developed as Community Resource Persons (CRPs). CRPs adopt elements of sustainable and eco-friendly agri-cultural practices in their own farms and are in a bet-ter position to motivate and convince other farmers than normal extension workers. Working with agri-cultural scientists and extension personnel under the broad ATMA umbrella, CRPs can help technology transfer and diffusion.
12.118. Agricultural extension covering crops and allied sectors is primarily the responsibility of the States and it is expected that States should drive the extension reforms process. Any national effort in this regard can only support States’ efforts. Moreover,
as noted by the Twelfth Plan Working Group on Agricultural Extension, while public policy in agri-culture increasingly recognises importance of pub-lic–private partnership in extension, the experience so far is that PPPs have been the exception rather than the rule. States must adopt PPP, but this is not substitute for strengthening the public extension sys-tem. Future collaboration between public and pri-vate players will have to focus more on the public sector’s ability to set standards and monitor progress so that these standards are enforced on all players, including public extension agents, while providing institutional training and support.
12.119. An important task of the new Mission should therefore be to consult with States so as to evolve a standards and regulatory framework for cer-tifying and validating extension activities by all play-ers, including public extension agents. MANAGE and SAMETIs should take the leading role in driv-ing extension reforms at the National and State levels respectively. The corporate sector should be encour-aged to involve itself in this effort and in agricultural extension in general, if only as part of their Corporate Social Responsibility (CSR). Even more important than funding under CSR, the corporate sector can support by providing adequate extension training to their extensive promotion network of distributors and dealers so as to meet required standards.
12.120. The Twelfth Plan Working Group on Agricultural Extension has noted that although ATMAs exceeded targets on training, demonstra-tions and exposure visits, the number of farm schools set up was well below target and that matters were lagging also on strengthening and extending Farmer Advisory Committees at every level. Since active involvement of farmers in planning and executing extension reforms was a key ATMA goal, the new Mission must concentrate on this and on feedback, particularly on technology and on agricultural plans at district and lower levels. A critical aspect of this will be ATMA–KVK coordination and more inten-sive ICT use.
12.121. Extension services must also be gender-sensi-tised, and this will require joint efforts, involving the

36 Twelfth Five Year Plan
Mahila Kisan Sashaktikaran Pariyojana component of the National Rural Livelihood Mission (NRLM) under MoRD, the Project Directorate for Women in Agriculture of ICAR and National Gender Resource Centre in Agriculture (NGRCA) of Ministry of Agriculture (MoA). Further, since the present exten-sion system does not pay adequate attention to live-stock, fishery and fodder and separate extension machinery for animal husbandry and fishery is not feasible in many states, this function will need to be integrated with ATMA with suitable KVK and NGO backstopping. Indeed, convergence should be a basic goal of the new Mission, both on the side of technol-ogy dissemination and feedback as well as for plan-ning integrated agricultural development.
12.122. The ultimate objective of the Mission should be to upgrade ATMA from a society operating as an adjunct to line agricultural departments to an inde-pendent entity with technical capability to offer local solutions and deliver feedback to NARS on location-specific technology needs. The larger trends of pub-lic policy point towards decentralised governance of natural resources and the promotion of growth with increasing emphasis on district (and lower) level planning. It is necessary to see decentralised planning as an iterative planning—doing—learn-ing—planning cycle rather than as simply a one-time activity. The challenge is to institutionalise this process and ensure that the agency facilitating plan-ning also has accountability in the overall outcome. ATMAs are a natural choice for such an agency in the present context.
SPECIFIC PLANS AND OBJECTIVES FOR THE MAJOR SUB-SECTORS
(A) Livestock12.123. For achieving growth rate of 5–6 per cent per annum the animal husbandry sector would need to address important challenges during the Twelfth Plan. These include delivery of services, short-age of feed and fodder and frequent occurrence of deadly diseases. Compared to its contribution in the economy livestock sector has received much less resources and institutional support. Livestock exten-sion remains grossly neglected. The country still lacks
adequate facilities and the infrastructure for disease diagnosis, reporting, epidemiology, surveillance and forecasting. Livestock markets are underdeveloped, which is a significant barrier to commercialisation of livestock production. Besides, the sector is also coming under significant pressure of increasing glo-balisation of agri-food markets. Although there is demand for Indian meat products in international markets, lack of international processing standards is a hindrance. Unfortunately, schemes on moderni-sation of slaughterhouses and by-product utilisation have not been effectively implemented. In the animal husbandry sector, the major priority areas during Twelfth Five Year Plan will be breed improvement, enhancing availability of feed and fodder and pro-vision of better health services, including proper breeding management. Conservation and perpetua-tion of diverse local germplasm, which are adaptable to Indian climate conditions and resistant to various endemic diseases, will be another important area, with clearer focus on sub-sectors such as small rumi-nants that have so far been neglected.
12.124. An important Twelfth Plan initiative is the National Dairy Plan (NDP), which has already been launched as a central sector scheme with credit support from the International Development Association (IDA). To be implemented by the National Dairy Development Board (NDDB) through a network of End Implementing Agencies (EIAs), mainly dairy cooperatives and producer companies, this aims to (i) increase productivity of milch animals and thereby increase milk production and (ii) provide rural milk producers with greater access to the organised milk-processing sector. These objectives would be pursued through adoption of focused scientific and systematic processes in provi-sion of technical inputs, supported by appropriate policy and regulatory measures.
12.125. An important sub-component of (i) above will be scientific progeny testing and pedigree selec-tion of bulls for semen required in artificial insemi-nation (AI) services. It is planned to make available about 900 high genetic merit bulls for replacement of bulls maintained at all ‘A’ and ‘B’ graded semen sta-tions and thereby achieve 100 per cent high genetic

Agriculture 37
merit bull replacement at these semen stations by end of the Twelfth Plan. It is estimated that this would produce some 100 million high-quality dis-ease-free semen doses annually.
12.126. Taking NDP into account and, with RKVY incentives for States to substantially enhance pub-lic sector investment in agriculture and allied sector during the Eleventh Plan, the Department of Animal Husbandry, Dairying and Fisheries (DAHDF) has also decided to redesign its schemes. It aims to pro-vide more flexibility to States while reducing the number of Centrally Sponsored Schemes (CSS) and reorientating these to secure better programmatic focus.
12.127. On genetic improvement in bovines, the current major programme is the ‘National Project for Cattle and Buffalo Breeding (NPCBB)’ which is being implemented since October 2000. Unlike NDP, which aims to provide breeding services from the dairy side, NPCBB is administered as part of States’ veterinary services. DAHDF proposes to con-tinue NPCBB in this present form since the DAHDF target is to expand the artificial insemination pro-gramme from present coverage of about 25 per cent of breedable population to 50 per cent, which will require an expansion of AI services beyond the about 35 per cent coverage planned for under NDP. This is because NDP will not cover all States and there are likely to be farmers not covered by dairy-led breeding services even in States covered by NDP. Moreover, States have already established Livestock Development Boards (LDBs) in the present format to implement bovine breeding programmes with a stated focus on development and conservation of important indigenous breeds. The critical require-ment is that NPCBB and States’ efforts through LDBs share common standards and protocols with NDP in progeny testing, pedigree selection and to improve conception rates. If so, resources are suffi-cient to achieve 5 per cent growth of milk production in the Twelfth Plan
12.128. Since standards and protocols will be the key to success on the breeding side and basic commonal-ity will have to be brought between NDP, LDBs and
NPCBB, there is need for some architectural rede-sign during the Twelfth Plan. Therefore, although NPCBB will continue, this will be as a component of a new National Programme for Bovine Breeding and Dairy (NPBBD) which will subsume all DADF existing schemes on dairy development. Thus, NPBBD will have two main components, namely National Programme for Bovine Breeding (NPBB) and Dairy Development. The component for Dairy Development will mainly focus on States/areas not covered under NDP and, in addition to existing support areas, convergence will be attempted in a phased manner so that dairy cooperatives which are not part of NDP also offer breeding and extension services. It is hoped that such combined activities in respect of dairying with breeding will be more effec-tive in extension of artificial insemination services, feed management and marketing of good quality of milk which are essential for improving productivity and income of farmers. In the meantime, NPBB will continue existing NPCBB functions through LDBs and the veterinary side with two areas of focus: first, to harmonise breeding standards and protocols; and, second, to achieve the so far unrealised stated focus on development and conservation of important indigenous breeds.
12.129. The main programme on the veterinary side will be an expanded scheme for Livestock Health and Disease Control. Such an expansion is necessary because occurrence of diseases like foot and mouth disease (FMD), hemorrhagic septicemia (HS), bru-cellosis, mastitis, blood protozoon and so on, have been accentuated with introduction of exotic breeds. Taking into account the economic losses from these diseases, and also those of small ruminants (PPR or peste-des-petits ruminants), particularly to small, marginal and landless farmers including women farmers, it is necessary to have a strong focus on national control programmes for all major animal diseases, backed by epidemiological analysis and assessment of the animal diseases in different agro-climatic regions. Unrestricted movement of live-stock, as well import of germplasm, and changes in ecosystems due to climate change are adding to occurrence of diseases. The availability of improved, potent and efficacious vaccines meeting international

38 Twelfth Five Year Plan
standards against major prevalent diseases can ena-ble better management, containment and control of the diseases. The new programme will associate all ICAR institutes specialising in animal diseases and, in consultation with the State Governments, formu-late and implement more effective strategies for con-trol of different diseases.
12.130. The third major programme of DADF will be the National Livestock Mission (NLM). Apart from bovine breeding, dairying and livestock health schemes, DADF runs a plethora of other schemes relating small ruminants, poultry, piggery and fod-der development which although of extreme impor-tance, especially to small, marginal, landless and women farmers, have so far not received focused attention. The multiplicity of small schemes in these livestock sectors has been a major constraint since this limits the capability of states to effectively access funding under various schemes. In order to provide greater flexibility to states in formulating and imple-menting various projects, it is proposed to merge these schemes with the main objective of achieving sustainable development and growth of the livestock sector.
12.131. The NLM will have an important mini-mis-sion of feed and fodder, with an objective to sub-stantially reduce the gap between availability and demand. The deficit of dry fodder (10 per cent), concentrates (33 per cent) and green fodder (35 per cent) continues to be high, although availability of feed resources has improved somewhat. The forage and fodder seed need varietal and quality improve-ment alongside better availability. The NLM will encourage seed companies and SAUs to take up for-age seed production on a priority basis. Developing common property resources, including grazing land and wasteland, and better utilisation and enrichment of crop residues/agricultural by-products is the other priority. Ration balancing, which is being promoted under NDP, will also be promoted under this mini-mission on feed and fodder.
12.132. The NLM will also have an additional mini-mission relating particularly to development of small ruminants, but also covering poultry, piggery
and other minor livestock species. While subsum-ing some of the existing Central Sector Schemes for poultry, small animals and fodder development, the objective will be fuller development of the animal biodiversity available in our country, which is a rich treasure of germplasm. NLM will also focus on pre-dominantly non-descript pig populations, concen-trated in NE region and eastern region there have poor productivity. Indian poultry industry is well equipped and organised to achieve target growth rate of 11 per cent for commercial broilers and 7 per cent for layers although it failed to diversify in favour of duck, quail, turkey and emu production. Need-based import of grandparent stock of reputed international brands may be continued with strict enforcement of bio-security measures. Rural poultry sector however, needs financial, infrastructure and technological support to raise the present 2 per cent growth rate to 3 per cent. All these, including the conservation of threatened breeds, will be covered by NLM in a flex-ible but more focused programmatic manner.
12.133. Other issues that NLM will address include livestock insurance and extension and any innovative initiative proposed by states for development of the livestock sector, for example, to deal with unhygienic slaughtering and processing. If State Governments notify minor veterinary services accordingly, short-age of human resources of veterinary staff could also be supplemented by recruitment of para-vets, similar to that of ASHA, to provide minor veterinary ser-vices and supplement the livestock-extension activ-ity in the States. In this context, it might be noted that as public-sector spending is enhanced for devel-opment of livestock, there is need for continuous assessment of the efficacy of AI and of animal health programmes in terms of success rates, lactating effi-ciency and of potential and actual yield per animal.
(B) Fisheries12.134. Potential of fisheries sector in providing quality food and nutrition, creating rural livelihoods, advancing socio-economic development in the rural and far flung areas is widely demonstrated and glob-ally recognised as a powerful tool for poverty reduc-tion and fostering rural development. Annual fish production has reached to the level of 8.30 million

Agriculture 39
tonnes during 2010–11 (P). Annual export earning has also touched record US$2.9 billion mark con-tributing about 17 per cent to national agricultural export. About 14.5 million people are engaged in fishing, aquaculture and other allied activities of which about 75 per cent are in inland fisheries and the remaining in marine fisheries.
12.135. In marine fisheries, uncontrolled fishing capacity has led to over-exploitation of the coastal resources. The estimated potential of the offshore waters offers opportunities which calls for upgra-dation of the fleet as well as skills and capacities of the fishers and incentives to promote diversified fishing in the offshore waters. Implementation of Monitoring, Control and Surveillance (MCS) as a new programme in the ensuing Plan is expected to bring more discipline and regulate the activities so as to maintain the growth rate in a sustainable manner. There is a need of additional infrastructure and also upgradation of facilities infrastructure for landing and berthing facilities of marine fishing fleet and for domestic marketing that have been the main reasons for post-harvest losses.
12.136. Freshwater aquaculture, which contributed to the ‘Blue Revolution’ in the country in late 1970s, is now almost stagnating in terms of species diversi-fication and yield rates due to less focus on sustain-able development of inland capture fisheries in past Plans; increasing pressure on the resources, includ-ing habitat degradation; and multiple use of inland water bodies with least priority to fishery require-ments. Average yield rates are around 1,000 kg/ha/yr, against potential of 3–4 thousand kg/ha/yr. The efforts to raise productivity should, however, be accompanied by formulating guidelines and regula-tory measures for the judicious use of critical inputs keeping in view the principles of the FAO Code of Conduct for Responsible Fisheries.
12.137. Quality fish seed is the most critical input to enhance the productivity and production of fishes. But, there are no organised brood-stock production and management facilities in the country. Therefore, there is need to set up brood banks in each State with one at the Central level. There is need to promote
commercial fish feed mills and indigenously formu-lated fish feeds with locally available ingredients by supporting the private players with enhanced capi-tal subsidy especially in the States where there are no feed mills.
12.138. Adequate infrastructure is not available for disease diagnosis and treatment for fish disease man-agement. There is a strong need for capital invest-ment as well as support for the State Governments in capacity building and managing the disease diag-nostic laboratories. There is also a need for creating a disease surveillance and communication agency/mechanism at National level along with its wings at suitable regional locations to build awareness and send alerts to the stakeholders. This agency shall have adequate regulatory powers to ensure the dis-ease control.
12.139. The gradual decline of Freshwater Fish Farmer’s Development Agencies (FFDAs) and Brackish water Farmer’s Development Agencies (BFDAs) and their resultant poor performance coupled with weak extension services has impacted the overall growth of aquaculture in the country. Rejuvenation and consolidation of the two field-level agencies (FFDA and BFDA) into a single agency—Fisheries and Aquaculture Development Agency or can undertake extension of technologies, promote networking of farmers and fishers (mainly from reservoirs) and provide effective liaison between the farmers and developmental and other extension agencies such as the Krishi Vigyan Kendras and the ATMAs as well as sourcing the public finance for fishers.
12.140. An important initiative of Government of India for development of fisheries sub-sector has been to launch ‘National Fisheries Development Board’ (NFDB) as a Special Purpose Vehicle (SPV) in the year 2006 for implementing fishery develop-mental schemes in an integrated manner. The scope of NFDB would be expanded to include manage-ment of fish diseases and creation of related infra-structure which is a gap in the present scenario. During the Twelfth Plan, the existing CSS on inland and marine fisheries (except welfare of fishers) will

40 Twelfth Five Year Plan
be merged with NFDB to facilitate expansion of fish-eries through integration of a wide array of activities, but with its main focus on inland fresh water fishery. The schemes will be implemented under the aegis of NFDB removing any duplication or overlap of efforts. This clear demarcation of work, it is hoped will enable the growth rate of the sector to rise to 6 per cent during the Twelfth Plan.
12.141. DADF would focus its efforts on policy, reg-ulation and welfare of fishers, and will implement the scheme relating to welfare of inland and marine fish-ers. The DADF will also handle the strengthening of fisheries data base, implementation of the proposed scheme on Monitoring, Control and Surveillance (MCS), all fisheries policy and legal matters, coordi-nation with the sister Ministries/Departments at the Centre and the States to make the sector’s founda-tion more robust and sustainable and build stronger linkages between research and development. Future course of fisheries management will have to work at two fronts—sustainable utilisation of healthy resources and rehabilitation of threatened resources by habitat restoration and appropriate conservation measures. Climate change and its possible impact on fisheries and fishers is again an additional challenge. Thus, the future course of management will require highest level of compliance of acts and regulations, extensive adoption of BMP and implementation of CCRF (Code of Conduct for Responsible Fisheries introduced by FAO) which would be possible only through the cooperation and active participation of resource user communities as partner in the devel-opment and management process.
(C) Horticulture12.142. With increasing per capita income, Indians are consuming more of fresh and processed horticul-tural products indicating growing scope of horticul-ture by improving crop productivity and efficiency in the value chains. The initiatives taken in the hor-ticulture sector during the Tenth Five Year Plan have helped in achieving high growth in produc-tion. During the Eleventh Five Year Plan, the growth rate of horticulture is expected to be 4.7 per annum, slightly short of the projected 5 per cent. There has been a marked push to the expansion in area under
horticulture crops since taking up of a number of ini-tiatives for horticulture development through NHB, TMNE (NE) and then NHM in 2005–06.
12.143. However, in quest for area-expansion efforts, the states have neglected due thrust on increasing productivity of existing orchards through technol-ogy infusion or by capital investment in fertigation, input management, plant protection and farm mech-anisation. The area expansion programmes have also lacked the proper backward linkage with supply of quality seed and planting material. Even where Nursery Act exists, it has not been enforced effec-tively. A proper system of accreditation and rating of nurseries, with clearly defined protocols, is the most important priority and will have to be put in place during the Twelfth Plan.
12.144. Adequate attention to post-harvest manage-ment and market development and processing has yet to pick up and is the weakest aspect of diversifi-cation towards high-value products resulting in fre-quent and sharp fluctuations in prices of fruits and vegetables in domestic market. As discussed earlier, marketing sector reforms implemented by States have so far not resulted in efficient marketing of per-ishables, or put in place transparent system of auc-tion and price discovery. There are huge logistic gaps between production clusters and marketing centres, often at long distance, and private sector investment in post-harvest management and in marketing infra-structure has not come forward to the desired extent. There is also lack of proactive steps to enhance export competitiveness for high-end export desti-nations. The availability of adequate regular, unin-terrupted, affordable power supply for setting up infrastructure like tissue culture labs, seed process-ing plants, bio control labs and post-harvest manage-ment units like cold storages, ripening chambers and so on is a constraint which needs to be addressed at least in and around horticulture clusters. Since hor-ticulture operations are cost intensive and hi-tech, horticulture growers need to be provided affordable credit with higher ceiling and insurance against risk.
12.145. The horticulture development missions depend on a loose set-up of Technology Support
Agriculture 41
Groups for technology inputs. This has proved inad-equate. Many States do not have adequate techni-cal trained manpower to implement programmes. Unless State Governments fill up vacant posts and create additional posts to provide necessary technical input, it should be deemed that they are uninterested and the mission wound up in those States.
12.146. During the Twelfth Five Year Plan the National Horticulture Mission will integrate the several existing schemes in this sector and aim at holistic growth of horticulture sector, including bamboo, through area-based regionally differenti-ated strategies, which include research, technology promotion, extension, post-harvest management, processing and marketing, in consonance with comparative advantage of each State/region and its diverse agro-climatic features. The Mission will also facilitate marketing reforms discouraging payment of unnecessary market levies and encouraging pri-vate investment for setting up horticulture produce markets. While continuing existing efforts, and aim-ing at 5 per cent growth of horticulture production during the Twelfth Plan, the main objective will be to build required capacities at State level, and assess their seriousness, so that the horticulture develop-ment related activities can be transferred fully to States by end of the Twelfth Plan.
12.147. Another objective will be to improve horti-culture statistics which continue to be weak, lacking both a validated methodology for data collection of horticulture crops and adequate machinery to col-lect such data. Generation and dissemination of quality data can also help in averting frequent situ-ations of gluts and shortages and exploitation of such situations by the middlemen and speculators. DAC needs to take up a one-time horticulture cen-sus with the objective of generating reliable base line data. Further, as recommended by NSSO commit-tee on improvement horticulture statistics, there is need to set up an extensive network of Horticulture Information Systems (HIS) with proper data units in all relevant districts and at State and Centre level covering all relevant aspects. To facilitate this, at least 3 per cent of Mission funds should be earmarked for this purpose.
(D) Food Grains and Oil Seeds12.148. Since cultivated land is limited, with poten-tial for only marginal future increase through higher cropping intensity or development of cultivable wasteland, future increase in production will have to come mainly from yield improvement. Declining average annual growth of food grains yields from 3.2 per cent in 1980s to 1.6 per cent in 1990s and further to only 0.6 per cent during the Tenth Plan, taking this well below population growth, had led to widespread concern about future food security. The issue was, therefore, analysed fully with several alternatives considered and the National Food Security Mission (NFSM) was formulated for the Eleventh Plan. This was based on an assessment of yield gap data then available, and was focused on increasing yields in low-yield districts using a variety of known interven-tions, with particular attention to availability of qual-ity seeds. Although this has paid off, with food grains yield growth increasing to 3.3 per cent during the Eleventh Plan, a valid question regards continuation of NFSM is whether yield gaps are still large?
12.149. A committee set up under Chairmanship of Chief Minister of Haryana has recently examined the issue and suggested continuing with the strategy to bridge the gap between real and potential yields. The analysis of gap between potential and achieved yields presented to this committee suggests that there is considerable potential of increasing yields even in high productivity irrigated areas with the current technology. For these areas, the strategies will need to concentrate on propagation of balanced use of fer-tilisers and application of micro-nutrients, water and soil-saving technology. In case of wheat, however, there is need to step up research to develop varieties resistant to temperature. The major yield gaps are due to management practices. Other reasons for this gap need to be ascertained through specific studies and addressed through appropriate interventions.
12.150. In addition to enhancing productivity of food grains in the low productivity areas, it is equally important to stabilise the productivity gains in these areas as well as in areas where productivity levels are comparatively high. With these issues in mind, the National Food Security Mission (NFSM)
42 Twelfth Five Year Plan
will be revamped during the Twelfth Plan. While the Eleventh Plan approach of focused attention on identified districts and crops in a location specific, target-oriented manner will continue, greater atten-tion will be put in most areas to shift from exclusive focus on individual crops to the cropping system/farming system approach. In particular, the Mission will be extended to cover coarse cereals and fodder, in addition to wheat, rice and pulses as at present. The Mission contemplates that promotion of pack-age of practices in compact blocks in a hand hold-ing approach would not only help in enhancing the production and productivity of a region but also help in changing mindsets of farmers due to its positive large-scale impact. This approach will ensure inclu-sion of all farmers in the compact block irrespec-tive of their size of holding or social status and will be compatible with other efforts that encourage strengthening of institutions, including building of farmers organisations and FPOs. The Mission will also build upon the Eleventh Plan experience regard-ing conservation agriculture.
12.151. However, the main way in which NFSM will be extended during the Twelfth Plan is through greater emphasis on strategic-area development. The two programmes that were started as RKVY sub-components in the Eleventh Plan namely, the 60,000 pulses village programme and the inten-sive millets production programme will largely be shifted into NFSM. On another sub-component of RKVY—Bringing Green Revolution in Eastern India (BGREI)—a view will be taken by DAC in consul-tation with States regarding format of its continua-tion during the Twelfth Plan. Also, some additional districts in Himachal Pradesh, Uttarakhand and the north-eastern region will be included to provide a specific thrust on foodgrains cultivation in hill areas.
12.152. Such restructuring of RKVY and NFSM will address the problem of bridging the existing large gap between potential and realised rice yields in eastern States and the challenge of increasing pulses production. Since BGREI allows components which are not part of NFSM, and since development of the eastern region requires significant investments in power and marketing infrastructure, the final design
of how to proceed on the relative contributions of RKVY and NFSM will need to be decided in con-sultation with the States. Also, since a counterpart of expanding rice production in eastern States is to reduce rice area and resulting groundwater stress in the North-West, a decision will have to be taken on what components of the latter effort should be stressed in NFSM/RKVY.
12.153. Preliminary targets under the NFSM for the Twelfth Plan are enhancing production by addi-tional 25 million tonnes of foodgrains consisting of 10 million tonnes of rice, 10 million tonnes of wheat, 3 million tonnes of pulses and 2 million tonnes of millet. Also it aims to expand fodder production to meet the demand both of green and dry fodder. In all probability, the requirement of sufficient quantity of dual purpose feed and fodder will require rais-ing this target to 30 million tonnes, with additional production of coarse cereals put at 7 million tonnes. All these targets are less than was actually achieved during the Eleventh Plan and are consistent with demand forecasts. This would amount to targeting 2–2.5 per cent increase in foodgrains production in the Twelfth Plan.
12.154. Another consequence of the expanded scope of NFSM will be to absorb the pulses and maize components presently in the Integrated Scheme for Oilseeds, Oil palm, Pulses and Maize Development. During Twelfth Five Year Plan, it is proposed to replace this scheme with a new Mission on Oilseeds and Oil Palm which will be launched with a prelimi-nary target to increase the production of oilseeds by at least 4.5 per cent per annum, that is, the same rate of growth as actually achieved during the Eleventh Plan. The core of this Mission will therefore be to continue past efforts with a clearer focus on oil-seeds. However, since production of oilseeds has not been able to match the increasing demand of edible oils, resulting in persistence of a huge gap between demand and production of edible oils in the country, the Mission will also aim to expand area under oil palm to realise the latent potential of the oil palm in the country. This part of the Mission will fully con-sider a proposal made recently by CACP and incor-porate whatever is feasible.
Agriculture 43
NATURAL RESOURCES
(A) Water12.155. The water resource potential of India is assessed as 186.9 million hectare meter, mostly from rainfall. With annual availability still more than utilisation and with its uneven spatial and tempo-ral distribution leading to floods/droughts in some or other parts of the country every year, there is a strong demand to fully utilise this potential as soon as possible. The total States proposals on investment in Irrigation and Flood Control for the Twelfth plan add up to about `4,00,000 crore, which alone would amount to over the 4 per cent of cumulative GDP from agriculture and allied sectors being targeted as total public investment in this sector during the plan. Recognising both the criticality of irrigation for agricultural growth and the potential available, the Centre’s Twelfth plan gross budgetary support for development of water resources (including on AIBP) is being stepped up to `1,09,552 crore from the Eleventh plan actual expenditure of `41,427 crore.
12.156. However, the performance in respect of creation and utilisation of irrigation facilities during the Eleventh Five Year Plan was not satisfactory. The original Eleventh Five Year Plan target for creating irrigation potential was 16 million ha. This was sub-sequently revised to 9.5 million ha, which has been achieved. However, utilisation out of the created potential is expected to be only 2.7 million ha. The ever increasing gap between created potential and its utilisation is an issue that is a Twelfth Plan prior-ity, steps to address which are discussed in another chapter.
12.157. In recent decades irrigation facilities have increasingly been created through exploitation of groundwater deployment. However, non-judicious exploitation of groundwater for irrigation purposes in India is already showing signs of crisis in many parts of country. Studies report that more than 26 cubic miles of groundwater has already disap-peared from underground aquifers in large areas of Haryana, Punjab, Rajasthan and Delhi, between 2002 and 2008 (NASA 2009). Global Runoff Data Centre, University of Hampshire and International Earth
Science Information Networks have projected that around 30 per cent area of India falls in the extreme water scarce zone having less than 500 m3/person/year supply of renewable fresh water. The informa-tion from the Central Ground Water Board reveals that situation has worsened in most of the states since 2004. The groundwater level has been declin-ing annually by about 4 cm during the past decade, often resulting in drying of rivers and wetlands and contamination with arsenic, fluoride and other toxic substances. This requires effective regulatory framework and participatory watershed develop-ment, especially because groundwater extraction is often highly unfavourable to the small farmers who cannot keep investing to tap deeper aquifers. Apart from developing appropriate regulatory framework, and people’s participation, the need of water saving devices and crop planning cannot be overempha-sised. Micro-irrigation coverage will be given pri-ority both in irrigated and rain-fed areas, as part of comprehensive local planning.
(B) Watershed Development12.158. Watershed development has long been one of the major channels directing public investment to natural resource base and production systems in rain-fed agriculture. From their earlier empha-sis on soil and water conservation, the focus in case of watershed projects is shifting towards livelihood security and income generation. It is also now gen-erally accepted that to be effective, the watershed development and soil conservation investments have to be complemented with farming systems invest-ments in a watershed-plus framework that takes into account the diversity of rain-fed agriculture.
12.159. However, despite considerable emphasis on this in the Eleventh Plan design and development of common guidelines, actual performance in regard to watershed development was poor during the Eleventh Plan. The details of the Eleventh Plan had target and achievement may be seen in the Chapter on Water. Since all watershed development pro-grammes have been transferred to the Department of Land Resources, the Ministry of Agriculture has to redefine its initiatives for rain-fed farming and sus-tainable agriculture.

44 Twelfth Five Year Plan
12.160. The National Rainfed Area Authority was constituted with the specific objective of inte-grating schemes/programmes and activities of various Departments of the Centre and the State Governments with regard to dryland farming as well as providing technical back stopping for water-shed development in a comprehensive manner. The authority was expected to play a major role in training of the officials associated with the water-shed development projects and also take a lead role in social mobilisation which is critical in the suc-cess of the watershed development programmes. It was also expected to take up studies for evaluation of the implementation of projects by the States. So far Departments both at the Central and State level has not taken much interest in associating NRAA either in evaluation of the programmes or for pro-viding technical input for these. NRAA expertise will be better utilised during the Twelfth Plan.
(C) Land and Soil Health Management12.161. Land is the prime natural resource of which 140.02 million hectares are net sown area. Since 1990–91 there is gradual but sustained decrease in net sown area from 143 million hectare to 140 mil-lion hectares with corresponding increase in fallow land. The demand from non-agricultural uses like industrial and urban requirement as well as specula-tive demand on account of rising land value is put-ting pressure on availability of land for agricultural use. There is an urgent need for State Governments to lay out clear policies to protect productive agricul-tural land and provide specific guidelines on pres-ervation of commons and their protection. There are also other important institutional and policy issues concerning land: proper recording of land titles, easing tenancy rigidities, computerisation of land records as well as addressing declining size of holdings.
12.162. An important aspect of land is its degrada-tion in terms of mechanical, chemical and biologi-cal. Widespread and continuing erosion of country’s natural resource base is threatening the sustenance of agriculture sector’s growth rate. Over 120 mil-lion ha have been declared degraded or problem soils (NAAS 2010). Conservation agriculture (CA),
integrated nutrient management, carbon sequestra-tion, erosion control, saline and alkaline soils man-agement, legislation for soil protection, development of remote sensing and GPS-based Decision Support System (DSS) and amelioration of polluted soil are required to rejuvenate deteriorated soils.
(D) Use of Fertilisers and Pesticides12.163. Fertiliser consumption in the country has been increasing over the years and now India is the second largest consumer of fertilisers in the world, after China, consuming about 26.5 million tonnes of NPK. However, imbalanced nutrient use coupled with neglect of organic matter has resulted in multi-nutrient deficiencies in Indian soils. These deficien-cies are becoming more critical for sulphur, zinc and boron. As nutrient additions do not keep pace with nutrient removal by crops, the fertility status of Indian soils has been declining rapidly under inten-sive agriculture and is now showing signs of fatigue, especially in the Indo-Gangetic plain. Potassium is the most mined nutrient. Sulphur deficiencies are also showing up in all parts of the country especially in the southern region. In a comprehensive study carried out by ICAR through their Coordinated Research Project on Micronutrients, Toxic and Heavy metals, based on an analysis of 2,51,547 soil samples from different states, it was found that 48 per cent of these samples were deficient in zinc, 33 per cent in boron, 13 per cent in molybdenum, 12 per cent in iron, 5 per cent in manganese and 3 per cent in copper. The micronutrient deficiency is a limiting factor lowering fertiliser response and crop productivity. As a result of over-emphasis on chemi-cal fertilisers and imbalanced fertiliser use, efficien-cies have become abysmally low: hardly 35 per cent for N, 15–20 per cent for P and only 3–5 per cent for micronutrients like zinc, resulting not only in high cost of production but also causing serious environ-mental hazards. At this rate, the National Academy of Agricultural Sciences has estimated that for meet-ing the food needs of the country by 2025, India may have to increase NPK supply to over 45 million tonnes from the current level of 26.5 million tonnes and of organic manures from 4 to 6 million tonnes. The Twelfth Plan envisages NPK demand at 34–36 million tonnes by 2016–17, but the more important
Agriculture 45
priority should be to give much greater empha-sis than hitherto on fertiliser use efficiency and soil health.
12.164. Restoration of soil health requires initiatives for continuous monitoring of soil health, measures to arrest decline of soil health, creating adequate facili-ties for soil testing, fertilisers testing, developing and upgrading testing protocols, ensuring judicious and efficient use of fertilisers and pesticides. Judicious use of fertiliser requires adequate soil testing facili-ties. By 2010–11 there were 1,049 soil tests labs in the country with a soil analysis capacity of 106 lakh soil samples per annum. The State Governments have issued 40.8 million soil health cards to the farmers by October 2011. Although a massive achievement in fairly short time, this remains far below the require-ment of soil testing capacity. To augment the capac-ity the State Governments need to utilise resources from Rashtriya Krishi Vikas Yojana and also engage State Agricultural Universities, Agricultural Produce Marketing Committee and other institutions. There is need for widespread awareness creation for soil-test–based fertiliser use by involving State Agricultural Universities and KVKs and NGO and other stakeholders.
12.165. Measures to soil health improvement need to be comprehensively centred on addition of soil organic matter in substantial quantities over time. The efforts for production and use of available bio-logical sources of nutrients like bio-fertilisers, organic manure, bio-compost for sustained soil health and fertility and improving soil organic carbon and so on as alternative inputs have been inadequate so far. For promotion of these inputs in conjunctive use with chemical fertlisers, and to promote organic farm-ing we need to formulate and define standards for unregulated organic and biological inputs and bring them under quality control mechanism and define/upgrade standards and testing protocols.
12.166. Similarly, use and availability of safe and efficacious pesticides and their judicious use by the farming community is critical to a sustained increase in agricultural production and productiv-ity. Quality of pesticides is monitored by the Central
and State insecticide inspectors who draw samples
of insecticides from the market for analysis in the
68 State Pesticide Testing Laboratories (SPTLs)
that have a total annual capacity of 68,110 samples
in 23 States and one Union Territory. However,
sale of low quality/spurious pesticides by dealers is
widespread and is an issue that States need to han-
dle with seriousness. Further, since use of synthetic
pesticides needs to be confined to target control in
the right quantity and at the right time, presence of
pesticides residue in food commodities is becom-
ing a serious food safety matter. DAC implements
a scheme for monitoring pesticide residues and
sharing outcomes of the sample analysis with State
Governments as well as advising States to take nec-
essary action including promotion of the Integrated
Pest Management (IPM) approach, which empha-
sises a safe and judicious use of pesticides. Many
NGOs, however, represent that sporadic promotion
of IPM is not helping in establishment of sustain-
able agriculture practices and that Non-Pesticidal
Management (NPM) of pests is the only sustainable
answer.
NATIONAL MISSION FOR SUSTAINABLE AGRICULTURE12.167. A major new mission that will be launched
during the Twelfth Plan is the National Mission for
Sustainable Agriculture (NMSA). Conceived origi-
nally as part of the National Action Plan on Climate
Change (NAPCC), this aims at transforming Indian
Agriculture into a climate-resilient production sys-
tem through adoption and mitigation of appro-
priate measures in the domains of both crops and
animal husbandry. Since a number activities relat-
ing to sustainable agriculture are already parts of
other proposed missions, NMSA as programmatic
intervention, will primarily focus on synergising
resource conservation, improved farm practices
and integrated farming for enhancing agricul-
tural productivity especially in rain-fed areas. Key
deliverables under this mission will be develop-
ing rain-fed agriculture, natural resource manage-
ment, enhancing water and nutrient use efficiency,
improving soil health and promoting conservation
agriculture.
46 Twelfth Five Year Plan
12.168. Nonetheless, since sustaining agricultural productivity through climate and other challenges to the natural resources base is the focus of this mis-sion, it will have to go beyond its programmatic interventions to bring mind-set changes required in transiting from the past focus on irrigated, chemi-cal intensive agriculture. The recent ICAR network project on National Initiative on Climate Resilient Agriculture (NICRA) provides some insights on requirements of adaptation. NMSA can collaborate with ICAR on specific matters regarding adapta-tion to climate change. The key to this is a paradigm shift that moves towards a knowledge-based, farmer centric and institutionally supported system where the Government is prime mover and facilitator to demonstrate at scale the overall strength and impact of rain-fed agriculture packages that have slowly emerged through several years of grass-roots work by Government and civil society organisations and have shown the strength of combining water and other interventions at a micro-level. The starting point of NMSA must be an accurate assessment of the natural resource, comprising water, land, climate and biodiversity, which determine the opportunities for livelihoods of the people.
(E) Design of NMSA12.169. While the decision to launch the National Mission for Sustainable Agriculture (NMSA) is quite historical, there are design issues both in view of the fact that the Ministry of Agriculture no longer has a watershed development component in its pro-grammes and because there are strong differences on the matter of fertiliser and pesticides use. While the current National Mission on Micro-Irrigation, the National Project on Management of Soil Health and Fertility and the Rainfed Areas Development Programme (RADP) window in RKVY can be merged with NMSA, none of these address fully the issues that have been raised by the Twelfth Plan Working Group on Natural Resources Management and Rainfed Farming. Its main recommendation is to observe the following:
1. Focus on stabilising and securing diverse crop-ping by bringing a focus on ‘Rainfall Use Efficiency’ as central to policy as against mere
use efficiency of applied water. This shift calls for two major focal areas:
a. Promote measures for in-situ conservation and efficient use of rainwater
b. Invest in shared and protective/supportive irrigation
2. Harness the inclusive growth potential in the so far untapped Agronomic and Management Innovations that are aligned to enhancing sus-tainability of natural resources, reducing costs, increasing efficiency of resource use and improv-ing total factor productivity. System of Rice Intensification and non-pesticidal management (NPM) of pests as mentioned in the Approach Paper and options evolving in conservation agri-culture are some examples.
3. Strengthen the extensive livestock systems depending wholly or partly on commons and agriculture residues through intensive efforts in improving health care, feed, fodder, drink-ing water, shelter, institutions and so on. The domain of public policy and intervention must shift to these from the present almost exclusive focus on high yielding breeds.
4. Invest in decentralised and local institutional capacities that enable a shift away from one-time Planning to ‘iterative Planning—imple-mentation—learning cycles’ anchored by local institutions.
5. Enhance institutional capacities in local gover-nance and resource management, particularly related to Commons and strengthen Panchayat Raj, cooperatives and other stakeholder institu-tions. Such institutional base is a prerequisite for evolving location and agro-ecology specific mechanisms of programme designing, credit access, filling in infrastructure gaps, marketing and so on.
12.170. The specific recommendations of this work-ing group, including the setting up of a National programme on rain-fed farming, could be another component of NMSA, financed by resources cur-rently expended under the scheme of Macro-management in agriculture which housed the
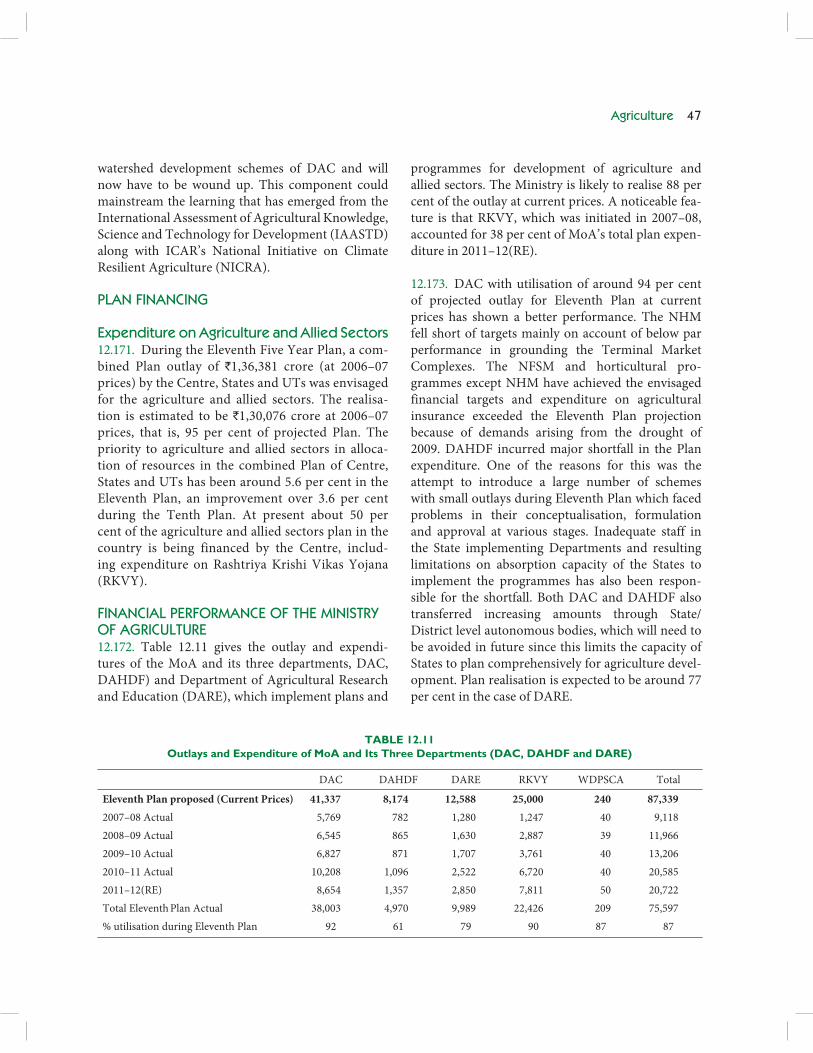
Agriculture 47
watershed development schemes of DAC and will now have to be wound up. This component could mainstream the learning that has emerged from the International Assessment of Agricultural Knowledge, Science and Technology for Development (IAASTD) along with ICAR’s National Initiative on Climate Resilient Agriculture (NICRA).
PLAN FINANCING
Expenditure on Agriculture and Allied Sectors12.171. During the Eleventh Five Year Plan, a com-bined Plan outlay of `1,36,381 crore (at 2006–07 prices) by the Centre, States and UTs was envisaged for the agriculture and allied sectors. The realisa-tion is estimated to be `1,30,076 crore at 2006–07 prices, that is, 95 per cent of projected Plan. The priority to agriculture and allied sectors in alloca-tion of resources in the combined Plan of Centre, States and UTs has been around 5.6 per cent in the Eleventh Plan, an improvement over 3.6 per cent during the Tenth Plan. At present about 50 per cent of the agriculture and allied sectors plan in the country is being financed by the Centre, includ-ing expenditure on Rashtriya Krishi Vikas Yojana (RKVY).
FINANCIAL PERFORMANCE OF THE MINISTRY OF AGRICULTURE12.172. Table 12.11 gives the outlay and expendi-tures of the MoA and its three departments, DAC, DAHDF) and Department of Agricultural Research and Education (DARE), which implement plans and
programmes for development of agriculture and allied sectors. The Ministry is likely to realise 88 per cent of the outlay at current prices. A noticeable fea-ture is that RKVY, which was initiated in 2007–08, accounted for 38 per cent of MoA’s total plan expen-diture in 2011–12(RE).
12.173. DAC with utilisation of around 94 per cent of projected outlay for Eleventh Plan at current prices has shown a better performance. The NHM fell short of targets mainly on account of below par performance in grounding the Terminal Market Complexes. The NFSM and horticultural pro-grammes except NHM have achieved the envisaged financial targets and expenditure on agricultural insurance exceeded the Eleventh Plan projection because of demands arising from the drought of 2009. DAHDF incurred major shortfall in the Plan expenditure. One of the reasons for this was the attempt to introduce a large number of schemes with small outlays during Eleventh Plan which faced problems in their conceptualisation, formulation and approval at various stages. Inadequate staff in the State implementing Departments and resulting limitations on absorption capacity of the States to implement the programmes has also been respon-sible for the shortfall. Both DAC and DAHDF also transferred increasing amounts through State/District level autonomous bodies, which will need to be avoided in future since this limits the capacity of States to plan comprehensively for agriculture devel-opment. Plan realisation is expected to be around 77 per cent in the case of DARE.
TABLE 12.11Outlays and Expenditure of MoA and Its Three Departments (DAC, DAHDF and DARE)
DAC DAHDF DARE RKVY WDPSCA Total
Eleventh Plan proposed (Current Prices) 41,337 8,174 12,588 25,000 240 87,339
2007–08 Actual 5,769 782 1,280 1,247 40 9,118
2008–09 Actual 6,545 865 1,630 2,887 39 11,966
2009–10 Actual 6,827 871 1,707 3,761 40 13,206
2010–11 Actual 10,208 1,096 2,522 6,720 40 20,585
2011–12(RE) 8,654 1,357 2,850 7,811 50 20,722
Total Eleventh Plan Actual 38,003 4,970 9,989 22,426 209 75,597
% utilisation during Eleventh Plan 92 61 79 90 87 87
48 Twelfth Five Year Plan
RASHTRIYA KRISHI VIKAS YOJANA12.174. The National Development Council (NDC), in its meeting held on 29 May 2007 resolved to ini-tiate a special Additional Central Assistance Scheme viz. Rashtriya Krishi Vikas Yojana (RKVY). The pur-pose behind this programme was to encourage States to draw up District and State agricultural plans and also increase their own spending on the sector so as to reorient agricultural development strategies for rejuvenating Indian agriculture during the Eleventh Plan (2007–12). RKVY is preferred by States for its inbuilt flexibility in selecting interventions and set-ting State specific targets.
12.175. One objective of RKVY during the Eleventh Five Year Plan was incentivising States to increase expenditure on agriculture and allied sectors. State plan expenditures (excluding RKVY receipts) as per-centage of GDP in agricultural and allied increased from 1.0 per cent in the Tenth Plan to 1.4 per cent in the Eleventh Plan. State plan expenditures on agri-culture and allied sectors (excluding RKVY) have also increased as percentage total plan spending by States, from about 5 per cent during the Tenth Plan to over 6 per cent during the Eleventh Plan. RKVY was therefore successful in motivating States to pay greater attention to agriculture, besides providing increased Central assistance for the sector.
12.176. RKVY as assistance was particularly use-ful for the funds-starved animal husbandry, dairy-ing and fisheries sectors. Projects amounting to over `5,000 crore were sanctioned under RKVY for these sectors during the Eleventh Plan, about 20 per cent of the total sanctioned RKVY projects, and more than spending on DAHDF’s schemes. This has provided a substantial push to these sectors which account for a significant contribution to the agricultural GDP.
12.177. However, preparation of Comprehensive District Agriculture Plans (C-DAPs) has been a weak area in many states, partly due to lack of capacity at District/State level. Although there are reservations regarding quality and effective capability of district level planning and project design, this was an origi-nal NDC intention and must be fully implemented during the Twelfth Plan. At least 25 per cent of pro-jects sanctioned by SLSCs should originate from
the district level, preferably approved by District Planning Committees. For the purpose, suitable units will have to be formed involving ATMA/KVK/SAU and any other technical support unit that States may specify. As mentioned earlier, it is necessary to see decentralised planning as an iterative planning—doing—learning—planning cycle rather than simply a one-time activity. The challenge is to institutional-ise this process and ensure that the agency facilitat-ing planning is also accountable for the outcome.
12.178. Further, while there is very strong anecdo-tal evidence of the early success of RKVY, a detailed impact assessment of the scheme is needed for fur-ther experience and learning. Moreover, two modi-fications are desirable in the present practice. First, there should be a proper committee to examine and vet all projects proposed to the SLSC. Second, that at least this vetting committee or even the SLSC work closely with, and preferably be coterminous with, State level bodies that select MoRD projects, particu-larly for watershed development. This would permit better convergence and better project selection.
12.179. Many States have requested changes in the allocation criteria of RKVY and some have objected to opening of new windows within the RKVY. A decision has been taken that no more than 20 per cent of RKVY funding will be in such windows of national importance. A decision has also been taken that at least 40 per cent of RKVY spending should be on hard infrastructure spending. A meeting of all States will be held to discuss proposals for changes in allocation criteria.
12.180. Finally, future RKVY design needs to be seen in the context of many pending key reforms. Despite efforts by the Central Government, progress in agricultural marketing, extension and cooperative reforms continue to be sluggish. Delivery of services has not been efficient due to lack of staff at various levels. State Agricultural Universities (SAUs) need greater funding support from the State Governments. Inadequacy of agricultural infrastructure hampers achievement of growth potential of the agriculture sector. During the Twelfth Plan RKVY will need to be reoriented to facilitate such market reforms, higher expenditure on SAUs and for infrastructure

Agriculture 49
development, besides emphasising effective formu-lation and implementation of District Agriculture Plans. These could be incorporated by changing the current eligibility conditions and allocation formula for RKVY. The proposed meeting of all States as mentioned above will need to be held before these changes in RKVY are proposed to Cabinet.
AGRICULTURAL STATISTICS12.181. Statistics are the hard input into planning. There are numerous gaps in agricultural statistics hampering the agricultural development planning some of which include reliable and timely avail-ability of forecasts of agricultural crops especially foodgrains, reliable statistics for small areas like blocks and Panchayats, estimates of agricultural production losses due to pests, diseases, floods and drought, good estimates of production of minor crops including spices, condiments, medicinal plants, floriculture and so on, estimates of require-ment of foodgrains for seed, feed and industrial use, harvest and post-harvest losses in agricultural pro-duction and estimates of meat production. Further, the available estimates generated through sample surveys suffer from organisational and operational problems bringing in inconsistency in these surveys.
12.182. The Vaidyanathan Committee has rec-ommended setting up a National Centre for Crop Statistics, independent of the present system, for pro-viding reliable quick estimates at the National and State level. This should have high priority since not only are there strong doubts about quality of present data among experts, the large increase in number of crop-cutting experiments for insurance purposes may further vitiate the system. An independent source of high-quality data is vital for improving the quality of agricultural statistics in India.
12.183. The existing database relating to horticul-ture sector needs to be strengthened as mentioned earlier in the horticulture section. Cost of produc-tion data for animal husbandry products also needs improvement. Development of appropriate meth-odology for estimation of feed consumed by live-stock will help in updating ratios currently used by the National Accounts Division. Similarly, the
existing methodology for generation of fishery statis-tics needs fine tuning.
12.184. For ascertaining the reliability of land use statistics in the context of diversion of agriculture land to other uses for residential, industrial, urbani-sation, roads and so on, there is a need for conduct-ing a study for checking the land records through khasra registers/other records of those villages where the area have come under diversion of agriculture land to non-agriculture uses particularly in the vicin-ity of the metropolitan cities.
12.185. Pilot studies need to be undertaken for per-fecting remote sensing techniques and GIS/GPS tools to develop reliable estimates of area under agro-for-estry area under crop production, land-use planning, land development and precision farming and so on.
12.186. All in all, the Twelfth Plan objective is to continue with the decentralisation thrust of RKVY, while reducing number of Centrally Sponsored Schemes. As discussed in relevant sections above, this vision on decentralisation could extend to fer-tiliser and food subsidies also. While doing this, the main Twelfth plan foci are:
• Bringing scale through development of Farmer Producer Organisations
• Emphasising technology, both on the research and development sides
• Stressing standards and protocols and standard operating procedures in every scheme
• Improving statistics and evaluation• Initiating a shift towards sustainable and climate-
resilient agriculture, not only through NMSA but more generally by laying emphasis on rain-fed areas and bringing about shifts of water-intensive rice cultivation from water-stressed North-West India to Eastern India.
• Preparing for faster growth through a more diversified agriculture, with investment in the necessary modern infrastructure required for per-ishable products.
12.187. As shown in Table 12.13, States have indi-cated that they will more than double their plan

50 Twelfth Five Year Plan
expenditure on agriculture and allied sectors from `1,11,824 crore during the Eleventh plan to `2,26,500 crore during the Twelfth Plan. The Centre shall also more than double its plan expenditure. The alloca-tion for RKVY is being raised to `63,246 crore for the Twelfth Plan from actual expenditure of `22,426
during the Eleventh Plan. The indicative Twelfth Plan Gross Budgetary Support (GBS) for all other schemes of the MoA is ̀ 1,11,232 crore. This is against corresponding the Eleventh Plan actual expenditure of `53,171 crore. Refer to Table 12.12 for depart-ment-wise break-up, excluding RKVY:
TABLE 12.12Gross Budgetary Support (Department-wise)
Department Gross Budgetary Support (GBS) (` Crore)
Department of Agriculture and Cooperation (DAC) 71,500
Department of Agriculture and Research Education (DARE) 25,553
Department of Animal Husbandry, Dairying and Fisheries (DAHDF) 14,179
TABLE 12.13Comparison of States Outlay and Expenditure for Eleventh and Twelfth Plan
(` in crore at current prices)
Name of Sate Eleventh Plan Outlay Eleventh Plan Expenditure Twelfth Plan Outlay Increase in
Twelfth Plan
over Eleventh
Plan Expdr. (%)
Agriculture
and Allied
Sector
% of Total
Plan
Agriculture
and Allied
Sector
% of Total
Plan
Agriculture
and Allied
Sector
% of Total
Plan
Andhra Pradesh 3,487.44 2.4 9,510.46 6.0 17,138 5.0 80
Arunachal Pradesh 752 9.5 617.71 5.7 1,114 5.3 80
Assam 877.86 2.1 2,335.56 7.8 3,272 5.9 40
Bihar 3,672.73 4.8 4,805.33 6.3 15,613 6.0 225
Chhattisgarh 4,613 8.6 5,637 12.7 8,284 6.9 47
Goa 211.76 2.5 325.39 3.6 1,046 3.9 221
Gujarat 9,092.94 0.7 8,879.8 6.9 19,712 7.8 122
Haryana 1,638.82 4.7 2,733.02 5.7 6,288 5.4 130
Himachal Pradesh 1,470.08 10.7 1,642.82 12.1 2,174 9.7 32
Jammu & Kashmir 1,818.21 7.0 892.98 3.5 2,843 9.7 218
Jharkhand 3,130.53 7.8 2,319.85 5.9 4,157 3.8 79
Karnataka 8,426.85 8.3 10,484.4 7.7 19,824 8.9 89
Kerala 2,649.11 7.8 2,931.54 7.6 8,831 11.5 201
Madhya Pradesh 3,408.18 4.8 6,057.09 7.3 17,076 8.5 182
Maharashtra 9,507.64 5.9 10,636.4 7.3 19,325 7.03 82
Manipur 386.55 4.7 234.04 3.2 643 3.1 175
Meghalaya 735.52 8.0 845.2 9.8 2,114 10.7 150
Mizoram 536.31 9.6 387.86 7.1 346 2.8
Orissa 1,230.29 3.8 3,580.37 8.2 8,387 7.4 134
Nagaland 434.31 8.3 725.08 11.3 1,795 13.8 148
Punjab 1,309.13 4.5 1,410.77 4.0 1,524 2.9 8
Rajasthan 2,919.07 4.1 5,990.67 6.2 7,255 5.6 21
Sikkim 260.43 6.9 228.27 6.4 469 4.1 106
Tamil Nadu 7,831.57 9.2 8,170.01 8.8 20,680 10.0 153
Tripura 798.51 9.0 858.79 11.3 980 6.8 14
Uttar Pradesh 19,146.37 10.6 14,164.8 7.8 24,354 8.5 72
Uttarakhand 2,478.5 8.4 2,079.25 10.0 2,673 5.9 29
West Bengal 1,846.50 2.9 3,339.26 5.1 8,583 5.5 157
Total States 94,670.21 3.6 1,11,824 7.2 2,26,500 7.1 103