Agriculture 2016 Market Intelligence Report - GreenCape · Global market for pesticides 40 Table...
60
Agriculture – 2016 Market Intelligence Report –
Transcript of Agriculture 2016 Market Intelligence Report - GreenCape · Global market for pesticides 40 Table...

Agriculture – 2016Market Intelligence Report–

2 Agriculture: Market Intelligence Report 2016

18 Roeland Street, Cape Town, 8001, South Africa
Editorial and review: Cathy Pineo, Leann Cloete-Beets, Maloba Tshehla and Pieter Janse van VuurenImages: GreenCape, Western Cape Department of AgricultureCover: Western Cape Department of AgricultureLayout and design: Deep Design
GreenCapeGreenCape is a non-profit organisation that supports and promotes the green economy - low carbon, resource efficient and socially inclusive - in the Western Cape, South Africa. We assist businesses and investors focusing on green technologies and services to remove barriers to their establishment and growth.
AcknowledgementsWe thank Inge Kuschke and Jannie Geyer for the time and effort that went into compiling this Market Intelligence Report.
DisclaimerWhile every attempt was made to ensure that the information published in this report is accurate, no responsibility is accepted for any loss or damage that may arise out of the reliance of any person or entity upon any of the information this report contains.
Copyright © GreenCape 2016
This document may be downloaded at no charge from www.greencape.co.za. All rights reserved.
Subscribe to receive e-mail alerts or GreenCape news, events and publications by registering as a member on our website: www.greencape.co.za
Agriculture: Market Intelligence Report 2016 3

Acronyms 5List of figures 6List of tables 7Executive summary 81. Introduction and purpose 102. Sector overview 122.1. Physical geography 122.2. Economic overview 152.2.1. South African agriculture 152.2.2. Agriculture commodities in South Africa 162.2.3. Production trends in South African agriculture 172.2.4. Western Cape agriculture 192.3. Key players 202.4. Drivers of green technologies and approaches in agriculture 212.4.1. Climate change and water scarcity 212.4.2. Environmental degradation 222.4.3. Market pressure and limited resources 222.4.4. Electricity cost and supply 233. Policies and regulations 253.1. Agriculture 253.2. Water 263.3. Land reform 263.4. Carbon tax 264. Opportunities and barriers 274.1. Energy efficiency in the Western Cape’s agricultural sector 274.2. Solar PV in the Western Cape’s agricultural sector 304.3. Conservation agriculture 344.4. Precision agriculture 364.4.1. Water efficiency 364.4.2. The growing market for drone technology in agriculture 394.5. Biological control 404.6. Bioenergy Biogas from agricultural waste 425. Funding and incentives 435.1. Manufacturing incentives 466. The Western Cape: Africa’s growing greentech hub 477. GreenCape’s support to businesses and investors 49Appendix A: Key role players 51References 54
Contents
4 Agriculture: Market Intelligence Report 2016
List of acronymsAD Anaerobic DigestionARC Agriculture Research CouncilCA Conservation AgricultureCAGR Compound Annual Growth RateCCA Customs-controlled areaCSIR Council for Scientific and Industrial ResearchDAFF Department of Agriculture, Forestry and FisheriesDFI Development Finance Institutions DWA Department of Water AffairsEE Energy EfficiencyEEPACS Energy Efficient Packhouse and Cold StoresEIA Environmental Impact AssessmentETI Employment Tax IncentiveFAO Food and Agriculture Organisation of the United Nations GDP Gross Domestic ProductGHG Greenhouse GasGIZ Deutsche Gesellschaft für Internationale ZusammenarbeitGW GigawattGWh Gigawatt-hourHa HectaresIDC Industrial Development CorporationIGDP Integrated Growth and Development PathIPM Integrated Pest ManagementkW KilowattkWh Kilowatt-hourkWp Kilowatt peakLED Light-emitting diode MW Megawatt MWe Megawatt electricMWp Megawatt peakNBI National Business InitiativeNDP National Development PlanNDVI Normalized Difference Vegetation IndexNERSA National Energy Regulator South AfricaNGP National Growth PathNWA National Water ActNWRS2 National Water Resource Strategy 2nd EditionPA Precision AgriculturePQRS Power Quality and Renewable ServicesPSEE Private Sector Energy EfficiencyPV PhotovoltaicR&D Research and DevelopmentRE Renewable EnergyREIPPP Renewable Energy Independent Power Producer ProcurementRHFA Relatively Homogeneous Farming Areas ROC Remote Operating CertificateRPA Remotely Piloted Aircraft
Agriculture: Market Intelligence Report 2016 5

Figure 1Agricultural production value chain 10Figure 2South Africa biomes 12Figure 3Broad Relatively Homogenous Farming Areas in the Western Cape 13Figure 4Top ten South African commodities in tonnes produced (2012) 16Figure 5 Top ten South African commodities in production value (2012) 17Figure 6Gross value of agriculture production for select commodities 18Figure 7Expenditure on certain intermediate products 18Figure 8Range of commodities in the Western Cape 19Figure 9Increases in the real-term cost of electricity in South Africa 23Figure 10Electricity breakdown on the average fruit and vegetable farm 28
List of figures
RPAS Remotely Piloted Aircraft System RPL Remotely Piloted LicenceSSEG Small Scale Embedded GenerationSA South AfricaSANAS South African National Accreditation SystemSARS South African Revenue ServiceSEBAL Surface Energy Balance Algorithm for LandSPDAFF Strategic Plan for the Department of Agriculture, Forestry and FisheriesStats SA Statistics South Africa TAI Tax Allowance IncentiveTWh Terawatt-hourUAV Unmanned Aerial VehiclesUSA United States of AmericaUSD United States DollarWC Western Cape WCDoA Western Cape Department of AgricultureWCDEA&DP Western Cape Department of Environmental Affairs & Development PlanningWSA Water Services ActWWF World Wide Fund for NatureZAR South African Rand
6 Agriculture: Market Intelligence Report 2016

Table 1Summary of crop / livestock commodities for each agro-climatic zone in the Western Cape 14Table 2Number of farms and farm turnover 2007 16Table 3Western Cape exports by sector 20Table 4Key role players in agriculture 21Table 5Arable land cover in South Africa 23Table 6Selected acts and plans relevant to the agricultural sector 25Table 7Number of agri sector facilities in the Western Cape 30Table 8Municipalities (WC) that have PV rules, regulations and tariffs 32Table 9Small scale embedded generation (SSEG) residential tariffs 33Table 10Potential value of adopting PA 37Table 11Possible cost saving and investment feasibility 38Table 12Global market for pesticides 40Table 13List of funding solutions 43Table 14Key role players 51
List of tables
Figure 11Electricity use in cold stores, cooling and drying of fruit 29Figure 12The cost of PV over time 31Figure 13Percentage of arable land under CA 2011 35Figure 14Proportion water use per main economic sector 36Figure 15Value of expenditure on dips and sprays over time in South Africa 41Figure 16Major market opportunities in the Western Cape (2015 – 2020) 47Figure 17GreenCape’s focus areas 50
Agriculture: Market Intelligence Report 2016 7

This agriculture sector market intelligence report focuses on opportunities for greening primary agriculture production. It is written for investors, businesses and farmers and focuses on conservation agriculture, water and energy efficiency, renewable energy, biological control and
precision agriculture.
Executive summary
The biggest drivers for the uptake of green technologies and practices in South African agriculture are rising input costs, limited natural resources (particularly arable land and water) and increasing consumer demand for more sustainable products.
Rising input costs involve conventional products like fertilisers, pesticides, energy (mostly diesel and electricity) and water. Thedemand for these inputs (and the associated cost) are rising in order to increase, or at least sustain, yields. Also, the prices of conventional products typically exclude the additional cost of the harmful effects on the environment. This drives the economic and environmental necessity for green technology and sustainable agricultural practices.
Another green driver concerns arable land and water availability. In the Western Cape, both of these are affected by the climate and the way land is farmed. Conventional agriculture often adds to the existing strain on limited natural resources and results in a decline in the availability of arable land. Low average (and irregular) rainfall, exacerbated by climate change, makes water the biggest limiting factor to production.
Pollution and soil degradation affect farmers’ profits over time and reduce their resilience to external risks such as droughts and climate change.
A third driver for green technology and sustainable agricultural practices relates to consumer demand. Even though South Africa’s demand for pesticide-free products is relatively low, pressure from international markets affect South African exports. In order to participate globally, growth in green technology and sustainable agricultural practices will need to increase.
These challenges, coupled with declining costs of new technologies, tax and other incentives, make it economically feasible for farmers to adopt certain green technologies, especially those that improve resource efficiencies. This, in turn, creates opportunities for investors and businesses in the green agriculture space.
8 Agriculture: Market Intelligence Report 2016

During the course of our engagement with stakeholders in the agriculture and other green economy sectors, a number of opportunities in energy, water and the use of chemical inputs have been identified. These include:
■ Alternative energy sources and energy efficiency technologies are becoming more affordable and more necessary due to rising energy costs. Opportunities for farming operations include solar PV and biogas.
■ Water use efficiency technologies in irrigation to address water scarcity and save electricity used to pump water.
■ Precision agriculture techniques which reduce agricultural inputs – including water and fertiliser – resulting in lower costs and fewer environmental impacts.
■ Environmentally-friendly alternatives to chemical inputs to increase soil health and biodiversity and to reduce pollution. This should include attention to opportunities arising from greater consumer awareness of harmful effects of chemical inputs and from stringent environmental regulations by export markets. Investment opportunities lie in the research and development (R&D) of such products.
General barriers to the uptake of green technologies and sustainability measures in South African agriculture include:
■ A lack of awareness about the importance and benefits of sustainable production and how to go about realising it.
■ Regulatory hurdles, for instance, on timeliness of Environmental Impact Assessments (EIAs) and registration of new products.
■ Insufficient support for farmers to access information and advice on best practice.
■ Weak exchange rate and low profit margins make importing technologies too expensive for farmers.
■ Lack of funding for R&D – the performance of R&D expenditure is also much higher for businesses than for government.
© GreenCape
Agriculture: Market Intelligence Report 2016 9

This market intelligence report (MIR) was compiled by GreenCape’s agriculture sector desk. It is written for investors, businesses and farmers and focuses on conservation agriculture, water and energy efficiency, renewable energy,
biological control and precision agriculture.
1–Introduction and
purpose
Agriculture is a new focus area for GreenCape and this report is the result contains some of our key insights from 2015 and early 2016. It provides an overview of the agriculture sector in South Africa and the Western Cape Province and our initial insights on barriers and opportunities in the green agriculture1 space. The report focuses on primary agriculture production and highlights opportunities related to technologies and practices that increase production efficiency - producing more with
fewer inputs, while simultaneously benefitting the environment by conserving resources and reducing negative impacts such as pollution.
Agricultural production is a highly integrated system as can be seen in the typical agriculture-production value chain in Figure 1 (Boye & Areand 2012). While investment opportunities can be found throughout the value chain, this MIR will focus mostly on primary agriculture production.
Figure 1: Agricultural-production value chain
1 Green agriculture refers to farm practises and technologies that form part of sustainable agriculture, by ensuring sustainable ecosystem services, reducing negative externalities and rebuilding ecological resources.
SUPPLY of materials, resources and energy (e.g. chemicals, water, diesel, electricty)
WASTE MANAGEMENT (eg. wastewater, organic residues, packaging residues)
1. Raw MaterialsProduction
2. Food Processing
Packaging materials
Cropproduction, fruits and
vegetablesfarming
RefrigerationFreezingCooking
3. Distribution 4. Use
Fertilizer, herbicides and pesticides manufacturing
Cattlefarming
PrimaryProcessing
eg. sugar refining,milling,
slaughtering
SecondaryProcessingeg. yoghurt,
breakfast cereals, soft drinks
PackagingPackaging
Wholesale
Retail
Consumer
Animal feed
10 Agriculture: Market Intelligence Report 2016
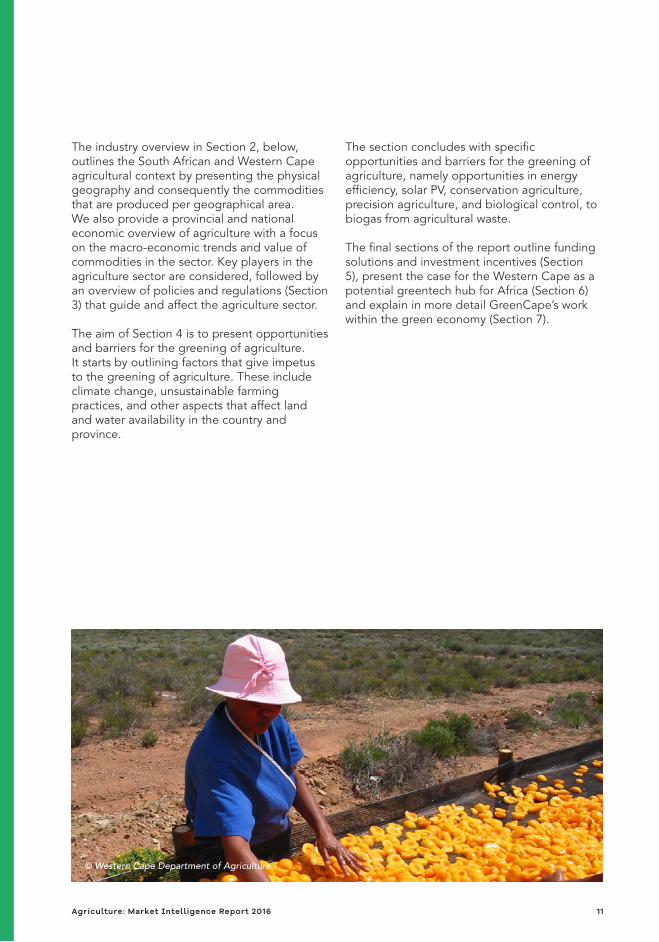
The industry overview in Section 2, below, outlines the South African and Western Cape agricultural context by presenting the physical geography and consequently the commodities that are produced per geographical area. We also provide a provincial and national economic overview of agriculture with a focus on the macro-economic trends and value of commodities in the sector. Key players in the agriculture sector are considered, followed by an overview of policies and regulations (Section 3) that guide and affect the agriculture sector.
The aim of Section 4 is to present opportunities and barriers for the greening of agriculture. It starts by outlining factors that give impetus to the greening of agriculture. These include climate change, unsustainable farming practices, and other aspects that affect land and water availability in the country and province.
The section concludes with specific opportunities and barriers for the greening of agriculture, namely opportunities in energy efficiency, solar PV, conservation agriculture, precision agriculture, and biological control, to biogas from agricultural waste.
The final sections of the report outline funding solutions and investment incentives (Section 5), present the case for the Western Cape as a potential greentech hub for Africa (Section 6) and explain in more detail GreenCape’s work within the green economy (Section 7).
© Western Cape Department of Agriculture
Agriculture: Market Intelligence Report 2016 11

2–Sector overviewThis section focuses on the South African
and Western Cape agricultural context.
It provides an overview of the physical geography, commodities produced per area, macro-economic trends and the value of commodities. We discuss key players, followed by drivers of green technology and approaches in agriculture that give impetus to investment in the green agriculture space.
2.1. Physical geographySouth Africa is a semi-arid country. This enables the production of a wide range of agricultural commodities. In terms of its physical geography, the country has a range of geomorphological settings resulting in a great variety of soil and climate conditions. Climatic regions in South Africa include mediterranean, subtropical and semi-desert.
Figure 2: South African biomes
12 Agriculture: Market Intelligence Report 2016

Figure 3: Broad relatively homogenous farming areas in the Western Cape
Figure 2 (Basson 2015) illustrates the diversity in biomes – the result of the physical landscape and variety in rainfall distribution across SA. As a result, the country has a very diverse agriculture sector, with a clear regional distribution of commodities. For instance, approximately 70% of South Africa’s cereals and 90% of its commercially grown maize is mainly rain-fed on the Highveld2 (Blignaut et al 2014). By land surface area, livestock is by far the largest agricultural sector in South Africa as 69% of the land surface is suitable for grazing (WWF 2010). Cattle production is practiced mostly in the eastern areas of the country where higher rainfall is recorded.
As the Western Cape is a winter rainfall region, its agriculture sector is unique in South Africa. The province is also known for its production stability, supported by well-developed infrastructure.
Figure 3 (Wallace 2015) illustrates the diversity of agro-climatic zones in the Western Cape which allows for a variety of agricultural commodities. Table 1 (WCDoA & WCDEA&DP 2015) provides an overview of crop and livestock commodities for each agro-climatic zone.
2 The interior of South Africa is on a high-lying plateau, known as the Highveld. The area has grassland as its predominant vegetation.
Agriculture: Market Intelligence Report 2016 13

Name Main crops Livestock
Bokkeveld Pome fruit, wheat, stone fruit, onions, potatoes
Cattle
Bo-Langkloof-Outeniqua Pome fruit, hops, wheat, stone fruit, flowers, honeybush
Cattle, sheep, goats
Breede Wine and table grapes, wheat, stone fruit, pome fruit, olives, citrus, vegetables, flowers
Broilers, egglaying chickens
Cape Town winelands Wine and table grapes, wheat, stone fruit, vegetables, olives, canola, citrus, flowers, berries
Broilers, egglaying chickens, pigs
Cederberg Rooibos, wheat, citrus, wine grapes, stone fruit, vegetables, potatoes, flowers
Cattle
Grabouw-Villiersdorp-Franschhoek Pome fruit, wine grapes, wheat, barley, stone fruit, flowers, berries
GrootBrak-Plett Wheat, barley, vegetables, nuts, berries, flowers, honeybush
Cattle, dairy, egg-laying chickens
Hardeveld/Sandveld-north Wheat, wine grapes, rooibos, potatoes, vegetables
Cattle, sheep
Hex Table grapes, citrus
Knersvlakte Wheat, wine and table grapes, rooibos
Cattle, goats, sheep
Koup Olives, vegetables and vegetable seed, stone fruit
Cattle, game, goats, sheep
Little-Karoo Wheat, vegetables, wine grapes, stone fruit, olives, nuts
Cattle, dairy, goats, ostriches, pigs, sheep
Montagu-Barrydale Stone fruit, wheat, barley, wine grapes, pome fruit, citrus, olives, flowers, nuts
Sheep
MosselBay-Herbertsdale Wheat, barley, canola, flowers Cattle, dairy, ostriches, pigs, sheep
Nelspoort Olives Cattle, goats, ostriches, sheep
Olifants irrigation Citrus, wheat, wine & table grapes, rooibos, tomatoes, potatoes
Piketberg Pears, fynbos flowers, stone fruit, wheat, citrus, herbs/essential oils, wine grapes, Cape rush, rooibos
Cattle, sheep
Table 1: Summary of crop/livestock commodities for each agro-climatic zone in the Western Cape
14 Agriculture: Market Intelligence Report 2016

Rooikaroo-Aurora Wheat, canola, rooibos, table & wine grapes, potatoes, olives, flowers
Cattle, sheep
Rûens-east Wheat, barley, canola, citrus, olives, herbs/essential oils, Cape rush, berries, honeybush
Cattle, dairy, ostriches, pigs, sheep
Rûens-west Wheat, barley, canola, wine grapes, pome fruit, flowers, vegetables, olives, citrus, herbs/essential oils, berries
Cattle, dairy, sheep
Sandveld-south Wheat, potatoes, rooibos, canola, citrus, flowers
Cattle, sheep
Swartland Wheat, wine and table grapes, canola, olives, citrus, vegetables, stone fruit, berries, flowers
Cattle, dairy, pigs, sheep
Tankwa-Vanwyksdorp Wheat, stone fruit, wine & table grapes, vegetables, olives, nuts
Cattle, dairy, game, goats, ostriches, pigs, sheep
3 USD value calculated by using the average annual exchange rate for 2012 of 8.553:1 (ZAR:USD)
2.2. Economic overviewThis section provides an overview of the agricultural economy in South Africa and the Western Cape, with a focus on the sector’s economic contribution, value of commodities and production trends.
2.2.1. South African agricultureSouth Africa’s primary agriculture sector contributes significantly to the country’s economy - approximately R58.2 billion ($6.8 billion3) or 2% to Gross Domestic Product (GDP) in 2012. The sector plays a critical role as an employer and accounted for approximately 7% of formal employment in 2013, of which a significant share is unskilled labour (Department of Agriculture, Forestry and Fisheries (DAFF) 2013b). Elementary workers make up 77% of the agricultural workforce; of those 22% are considered unskilled. The agricultural sector is also important for ensuring the country’s food security. In addition to commercial-scale
production, small holders and subsistence farmers make further economic contributions, although these are harder to quantify.
Although the production area for maize, wheat and dairy has decreased over the last 20 years, production remains relatively constant (Stats SA 2007). This is mainly due to increased use of fuel, irrigation and fertiliser, which is economically unsustainable (due to rising costs and limited availability) and environmentally unsustainable (mainly due to depleted soil health). Added to these strains is a highly competitive global market. For example, wheat can be imported at lower cost than local producers can supply. South African farmers do not benefit from subsidies, and therefore struggle to compete with heavily subsidised farmers in other countries. However, there are numerous tax benefits and incentives for farmers wishing to improve the sustainability of their operations (these are presented in Section 5).
Agriculture: Market Intelligence Report 2016 15

According to the Census of Commercial Agriculture published by Statistics South Africa (Stats SA) , the number of commercial farms in South Africa fell by more than 13% from 45 800 in 2002 to 39 900 in 2007 (Table 2 below). This is a decline of about 30% from an estimated 58 000 commercial farms 20 years ago (Stats SA n.d.). While farm numbers have dropped, average farm size has increased - farmers have increased production to reach better economies of scale. Overall production increases can largely be attributed to increased irrigation and synthetic fertiliser use.
–Overall production increases can largely be attributed to increased irrigation and synthetic fertiliser use.
2.2.2. Agriculture commodities in South Africa
South Africa’s top ten agriculture commodities are shown below in Figure 4 in million tonnes produced (FAO 2012) and Figure 5 (by value) (FAO 2012). While maize and sugar cane are the commodities most produced by tonnage, grapes and meat products are of higher value. As the only province suited for wine production, the Western Cape makes an important econom-ic contribution given the higher value of grapes on international markets.
Number of farms Annual turnover
22 500 < R500 000
12 300 R500 000 - R3 million
2 200 R3 million - R5 million
2 900 >R5 million
Table 2: Number of farms and farm turnover (2007)
Figure 4: Top ten South African commodities in tonnes produced (2012)
Top 10 SA commodities (million tonnes)
Sugar cane (17.3)
Milk, whole fresh cow (3.4)
Wheat (1.9)
Oranges (1.6)
Apples (0.8)
Maize (11.8)
Potatoes (2.3)
Grapes (1.8)
Meat indigenous, chicken (1.5)
Meat indigenous, cattle (0.8)
16 Agriculture: Market Intelligence Report 2016
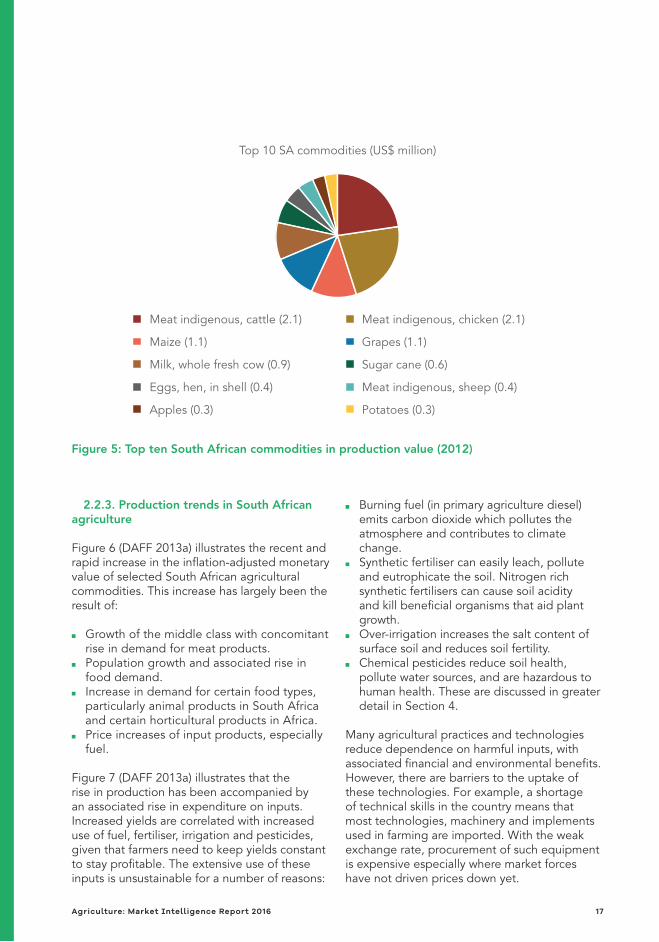
Figure 5: Top ten South African commodities in production value (2012)
2.2.3. Production trends in South African agriculture
Figure 6 (DAFF 2013a) illustrates the recent and rapid increase in the inflation-adjusted monetary value of selected South African agricultural commodities. This increase has largely been the result of:
■ Growth of the middle class with concomitant rise in demand for meat products.
■ Population growth and associated rise in food demand.
■ Increase in demand for certain food types, particularly animal products in South Africa and certain horticultural products in Africa.
■ Price increases of input products, especially fuel.
Figure 7 (DAFF 2013a) illustrates that the rise in production has been accompanied by an associated rise in expenditure on inputs. Increased yields are correlated with increased use of fuel, fertiliser, irrigation and pesticides, given that farmers need to keep yields constant to stay profitable. The extensive use of these inputs is unsustainable for a number of reasons:
■ Burning fuel (in primary agriculture diesel) emits carbon dioxide which pollutes the atmosphere and contributes to climate change.
■ Synthetic fertiliser can easily leach, pollute and eutrophicate the soil. Nitrogen rich synthetic fertilisers can cause soil acidity and kill beneficial organisms that aid plant growth.
■ Over-irrigation increases the salt content of surface soil and reduces soil fertility.
■ Chemical pesticides reduce soil health, pollute water sources, and are hazardous to human health. These are discussed in greater detail in Section 4.
Many agricultural practices and technologies reduce dependence on harmful inputs, with associated financial and environmental benefits. However, there are barriers to the uptake of these technologies. For example, a shortage of technical skills in the country means that most technologies, machinery and implements used in farming are imported. With the weak exchange rate, procurement of such equipment is expensive especially where market forces have not driven prices down yet.
Top 10 SA commodities (US$ million)
Meat indigenous, cattle (2.1)
Maize (1.1)
Milk, whole fresh cow (0.9)
Eggs, hen, in shell (0.4)
Apples (0.3)
Meat indigenous, chicken (2.1)
Grapes (1.1)
Sugar cane (0.6)
Meat indigenous, sheep (0.4)
Potatoes (0.3)
Agriculture: Market Intelligence Report 2016 17

Figure 6: Gross value of agriculture production for select commodities
Figure 7: Expenditure on certain intermediate products
180000
160000
140000
120000
100000
80000
60000
40000
20000
0
30000
25000
20000
15000
10000
5000
0
1970
1970
1975
1975
1980
1980
1985
1985
1990
1990
Year
Year
Total
Field Crops
Horticulture
Animal products
Total
Fuel
Fertilizer
Dips & Sprays
R m
illio
nR
mill
ion
1995
1995
2000
2000
2005
2005
2010
2010
18 Agriculture: Market Intelligence Report 2016

Figure 8: Range of commodities in the Western Cape
It follows that efficient use of resources is essential to the future of the industry in South Africa – on the one hand, for sustainability due to land and water issues and, on the other hand, for profitability due to limited economies of scale.
2.2.4.Western Cape agricultureAgriculture contributes 2% to the national GDP in 2013, of which the Western Cape agricultural sector contributed 22.6% (Basson 2013). The Western Cape is a key contributor because it produces high-value export crops such as wine grapes. Figure 8 (Provincial Treasury 2013) illustrates the range of commodities in the Western Cape.
Table 3 (Wesgro 2014) highlights that (1) agriculture is a very important part of the Western Cape economy, and (2) the province dominates much of SA’s agricultural export production – especially wine and fruit. These export markets are a key driver of sustainable agricultural practices.
In addition to the contribution of primary agriculture, agro-processing (which has been identified as a key growth sector for the Western Cape Province) adds further value. If the entire agricultural value chain is taken into account, the total contribution to GDP is almost 12% (DAFF 2013).
–If the entire agricultural value chain is taken into account, the total contribution to GDP is almost 12% (DAFF 2013).
The drop in the number of farms and increase in farm size mentioned earlier is particularly evident in the Western Cape’s fruit sub-sector, where 30% of the farmers produce as much as 80% of the fruit (Hortgro 2015). Small-scale and emerging farmers are struggling to compete and developing an inclusive rural economy is highly challenging.
Other (mainly) forestry & fishing) 1.0%
Horticulture50.5%
Horticulture
Field crops6.9%
Animals41.6%
39.89%
28.2%
11.7%
8.7% 5.8% 5.8%
Gross value added: R14.7 billion (2011)
Apples, pears & peaches
Table grapes
Citrus
Wine
Potatoes & onions
Other veggies
4 Agro-processing can be defined as processing the raw material or transforming products that originate from agriculture.
Agriculture: Market Intelligence Report 2016 19

Rank Top 10 exports Value 2013 (ZARbn)
% Growth 2012-2013
% Share SA exports 2013
1 Oils petroleum, bituminous, distillates, except crude 8.39 -5.32 59.00
2 Grape wines (including fortified), alcoholic grape 7.80 33.26 98.27
3 Citrus fruit, fresh or dried 6.58 22.70 70.54
4 Apples, pears and quinces, fresh 5.59 53.52 94.34
5 Grapes, fresh or dried 4.02 22.27 80.76
6 Hot-rolled products, iron/steel 3.11 7.47 79.00
7 Liquid, gas centrifuges, filtering, purifying machines 2.01 -6.23 10.75
8 Maize (corn) 1.83 44801.31 29.51
9 Fruit, nut, edible plant parts (not elsewhere specified), prepared/preserved
1.60 16.90 90.25
10 Liqueur, spirits and undenatured ethyl alcohol 1.28 66.28 90.34
Total export 74.87 16.06 9.49
Table 3: Western Cape exports by sector
2.3. Key playersKey players in the agriculture sector can be divided into four broad categories: producers, research/academia, input suppliers and industry associations .
Table 4 shows a simplified value chain with key role players involved.
■ Producers/farmers produce commodities and in most cases do their own harvesting, storage and transport.
■ Research institutions like universities investigate all aspects of the value chain.
■ Input suppliers research and produce inputs such as fertiliser, seeds, pesticides and machinery. Suppliers of green technology, like conservation agriculture equipment and solar PV manufacturers also fall into this category.
■ Industry associations, involved in all aspects of the value chain, support farmers and provide them with reliable and relevant information regarding regulations, logistics, cultivar development, etc.
The South African Government’s DAFF governs the whole industry.
A detailed list of role players can be found in Appendix A.
20 Agriculture: Market Intelligence Report 2016

R&D Inputs Production Harvesting Storage Transport Processing Wholesale, retail & exports
Waste
Government
Producer
Research institutions
Input suppliers
Industry associations
Table 4: Key role players in agriculture
2.4. Drivers of green technologies and approaches in agriculture
A range of factors provide impetus for a transition to sustainable production in South African agriculture. These include water scarcity and climate change, decreasing soil health, the high cost of energy and other inputs and increasing food demand. These are coupled with consumer awareness about pesticide residues, ecosystem degradation, pollution and declining nutritional value in food.
2.4.1. Climate change and water scarcity Climate change and associated water scarcity is a significant driver of greening of agriculture as it forces the sector to adopt practices and technologies that conserve water and improve soil health for better water retention and improved yields.
Low average (and irregular) rainfall, exacerbated by climate change, result in water shortage, which is the biggest limiting factor to production. The Council for Scientific and Industrial Research (CSIR) estimates that by 2025 there will be a water deficit in South Africa (Talk Radio 2015). While agriculture production in South Africa contributes a relatively small percentage (5%) to the country’s greenhouse gas emissions (GHGs) compared to South
Africa’s other sectors (such as the energy sector and industrial processes) (Partdrige et al. 2014), it is the sector most directly affected by climate change impacts.
–Agriculture’s contribution to climate change is relatively small, but it is the sector most directly affected by climate change impacts, such as water scarcity
In the case of the Western Cape, climate models predict a slow-onset drying trend, with declines and more variability in rainfall (UCT 2014). The Swartland area provides evidence of this trend. As one of the largest grain producing areas in the country, the area has experienced year-on-year declines in rainfall and has just experienced one of the driest winters in the past 75 years. Such climatic effects affect the productivity of local farms and the surrounding rural economy, exerting pressure on farmers to operate more sustainably.
In addition to climate change impacts, water will become even more scarce because of population growth, urbanisation and industrialisation. It is estimated that the Western Cape will experience water-related constraints to development as early as 2019 (Department of Water Affairs (DWA) 2011).
Agriculture: Market Intelligence Report 2016 21
2.4.2. Environmental degradationConventional farming methods are unsustainable, mostly due to their negative impacts on natural resources and the environment:
■ Chemicals in pesticides reduce biodiversity above and below ground (for instance, up to 75% (FOA n.d.) of crop genetic diversity has already been lost). Heavy reliance on chemicals in conventional farming also pollutes water, negatively affects other natural resources and can be harmful to human health. Studies from the 40s to the 90s indicate that widespread increased exposure to synthetic pesticides greatly reduce trace elements in vegetables.
■ Tillage, which is a conventional farming method, is the leading cause of soil degradation (WWF 2010). According to the United Nation’s Food and Agriculture Organisation (FAO) one third of global farmland is degraded (2014).
■ Fossil fuel burning, as in coal-fired electricity generation and diesel, emits carbon dioxide that contributes to climate change and pollutes the air.
2.4.3. Market pressure and limited resourcesA number of other pressures and constraints contribute to the necessity for sustainable agriculture. These include:
■ rising costs and demand for agricultural inputs: fertiliser, pesticides, energy (mostly diesel and electricity) and water
■ energy shortages ■ population growth ■ availability of arable land ■ consumer demand for sustainably-
produced products.
Table 5 illustrates the shortage of arable land5 for agriculture in South Africa. Notably, 69% of all arable land is suitable for grazing, while only 12% is suitable for rain-fed agriculture. These constraints can be further understood by comparing South Africa’s arable surface area, in hectare per person, to other countries’. South Africa has 0.25 hectares of arable land per person compared to Russia (0.85), Argentina (0.93) and Australia (2) (World Bank 2013). These countries, therefore, have a competitive edge over South Africa as some commodities, such as livestock, wheat and maize production, overlap.
For agriculture to be sustainable it needs to meet the needs of present and future generations, while conserving resources and ensuring profitability. These pressures are particularly problematic in light of the need to double food production by 2050 from 2009 levels (UN 2009). Consequently, South Africa’s farmers have little choice but to revert to innovative and sustainable farming practices, if they are going to remain competitive nationally and globally, conserve the environment and contribute to food security.
–South Africa has 0.25 hectares of arable land per person compared to Russia (0.85), Argentina (0.93) and Australia (2)
5 Arable land (in hectares) includes land defined by the FAO as land under temporary crops (double-cropped areas are counted once), temporary meadows for mowing or for pasture, land under market or kitchen gardens, and land temporarily fallow. Land abandoned as a result of shifting cultivation is excluded.
22 Agriculture: Market Intelligence Report 2016

Suitable for rain-fed crops
High potential Irrigated crops Suitable for grazing
Total
Ha (million) 14.4 3.6 1.3 82.8 120
% of total 12 3 1 69 85
Table 5: Arable land cover in South Africa
Figure 9: Increases in the real-term cost of electricity in South Africa
2.4.4. Electricity cost and supplyThe South African agriculture sector consumes approximately 3% of the total electricity produced in the country (NERSA 2006). In the context of rising electricity costs and the supply crisis, energy efficiency has become increasingly important for all sectors, including agriculture.
–The South African agriculture sector consumes approximately 3% of the total electricity produced in the country
Figure 9 (Chehore 2014) below shows the real-term rise in the cost of electricity between 2006/7 and 2013/14. According to the Department of Energy the rural electricity tariffs approved by NERSA increased by 12.69% during 2015/16 (2015a). The business case for investment into energy efficiency is strong and there are considerable opportunities for suppliers of greentech and services in this space.
Real electricity cost, 2006/7 - 2013/14 (June 2013 Rands)
R700,00
R600,00
R500,00
R400,00
R300,00
R200,00
R100,00
R0,002006/7
R71, 28Low (150 kWh)
Low (150 kWh)
Medium (350 kWh)
Medium (350 kWh)
High (450 kWh)
High (450 kWh)
R178, 19
R320, 74 R316, 25 R369, 81 R478, 23 R555, 92 R608, 47 R628, 66 R634, 47
R175, 69 R178, 62 R185, 08 R216, 91 R230, 54 R239, 71 R247, 22
R70, 28 R71, 45 R74, 03 R76, 95 R77, 53 R77, 88 R80, 91
2007/8 2008/9 2009/10 2010/11 2011/12 2012/13 2013/14
Agriculture: Market Intelligence Report 2016 23
For instance, for some farmers, recent load shedding has represented a major challenge. Diesel generators have represented a short-term solution, at a cost. Most farms are equipped with backup generators, but in recent years farmers have been buying bigger units for more frequent and sustained use. While attempts have been made to manage load shedding, the uncertainty of schedules can harm the industry. For example:
■ Dairy industry: The dairy industry needs a constant feed of electricity throughout the year for the heating and cooling processes of milk. Specific temperatures need to be maintained for certain periods in order to ensure milk quality and safety (Mavuso 2015).
■ Cold-chain management: With many foods going to export markets, cold-chain management is key to producing quality products. In peak production, processing is typically operating full time. Load shedding, and inconsistencies in load shedding schedules are particularly disruptive as prior to predicted load shedding, equipment needs to be switched off and the process halted. This results in losses within the process, particularly as machines need to be cleaned before process can continue.
© Western Cape Department of Agriculture
24 Agriculture: Market Intelligence Report 2016

3–Policies and regulations
Many of these have specific relevance to the sustainability of the sector as they aim to protect natural resources such as land and water. These are therefore also relevant to suppliers of greentech or green services within the agriculture sector.
3.1. AgricultureThe DAFF is primarily responsible for legislation related to the sector. A number of acts and policy documents (Table 6) speak to the conservation of agricultural resources while promoting economic and social development.
Name Selected objectives/purpose
The Conservation of Agricultural Resources Act 43 of 1983
■ Controlling use of natural agricultural resources ■ Conservation of soil ■ Conservation of water sources ■ Combating weeds and invader plants
The National Development Plan 2030 (NDP 2012)
■ Elimination of poverty ■ Reduction of inequality ■ Highlighting the importance of initiatives that link
agriculture to the green economy
The Agriculture Integrated Growth and Development Plan (IGDP 2012)
■ Equitable, productive, competitive, profitable and sustainable agriculture, forestry and fisheries sectors
■ Emphasises that the sector needs to benefit all South Africans
The Agriculture Policy Action Plan (APAP 2014)
■ A programmatic response to key policy documents including the National Development Plan (NDP) and the New Growth Path (NGP)
Strategic Plan for the Department of Agriculture, Forestry and Fisheries (SPDAFF 2013)
■ Providing an effective framework to address various challenges facing the sectors
■ Setting targets for the departmental programmes from 2012 to 2017
■ Building a leading, dynamic, united, prosperous and people-centred sector
Table 6: Selected acts and plans relevant to the agricultural sector
With a complex agricultural sector and many commodities produced in the Western Cape, there is a range of policies and regulations that directly and indirectly relate to
agriculture.
Agriculture: Market Intelligence Report 2016 25

3.2. WaterThe following acts regulate the water sector (DWA 2013):
■ National Water Act (NWA, Act 36 of 1998) redefines water rights in South Africa to stimulate inclusive growth.
■ Water Services Act (WSA, Act 108 of 1997) defines the role of the Department of Water Affairs as a regulator; the role of water boards as bulk providers, and the role of municipalities as service providers.
■ The National Water Resource Strategy 2nd Edition (NWRS2 2013) assists in the implementation of the NWA whilst protecting, developing and controlling water resources in a sustainable and equitable manner.
More information on water governance issues and investment opportunities in the water sector can be found in GreenCape’s Water Sector Market Intelligence report, which can be downloaded from www.greencape.co.za.
3.3. Land reformThe White Paper on South African Land Policy (1997) addresses the injustices and land inequalities that came about during pre-colonial and colonial rule and apartheid.
This has had some implications for investors, particularly regarding uncertainty in the sector over land rights and fears of unconstitutional land expropriation.
There are broader implications, such as losses in the sector if arable production land is given to inexperienced farmers without training. Lengthy distribution processes affect land productivity – original owners may stop investing in the land during the process and the land can become too degraded to be restored. New farmers require adequate support and development, not just in cultivation but also in post-settlement (like market access) which is currently lacking, resulting in unsustainable farming practices.
3.4. Carbon taxThe South African Government has committed to reducing GHG emissions by 34% by 2020 and 42% by 2025. Part of the strategy to drive this includes a carbon tax. The implementation of the first phase of the tax (focusing on scope 1 GHG emissions) has been delayed from 2015 – 2020 to 2016 – 2021. Primary agriculture will mostly be exempted from the carbon tax, but will still be affected by it indirectly as it filters through to input costs.
© Western Cape Department of Agriculture
26 Agriculture: Market Intelligence Report 2016

4–Opportunities and barriers
There are opportunities in energy, water and the use of chemical inputs:
■ Alternative energy sources and energy efficiency technologies are becoming more affordable and more necessary due to increasing energy costs. Opportunities for farming operations covered in this report include solar photovoltaic (PV) and biogas.
■ Water use efficiency technologies in irrigation address water scarcity and save electricity used to pump water. We will focus on precision agriculture.
■ Environmentally friendly alternatives to chemical inputs improve soil health, enhance biodiversity, reduce pollution, address consumer concerns about the harmful effects of chemicals, and adhere to stringent environmental regulations by export markets. Investment opportunities lie in the R&D of alternatives to chemical products.
Before discussing these opportunities in more detail, it is important to briefly consider some barriers to the uptake of green technologies and sustainability in South African agriculture. These include:
■ A lack of awareness surrounding the importance and benefits of sustainable production and what is available (in terms of advice and technologies).
■ Regulatory hurdles include complicated processes and delays in obtaining EIA’s, and for the registration of new products.
■ Lack of support for farmers to help them access relevant information and advice on best practice.
■ Weak exchange rate and low profit margins mean that importing technologies is too expensive for farmers.
■ A lack of funding for R&D is another barrier to the growth of green agriculture. As an international benchmark, R&D expenditure as a percentage of GDP should be 1% and is currently <0.8% in SA. Moreover, the performance of R&D expenditure is much higher for businesses than government (i.e. R&D funding is spent to better effect by business, compared to government).
Specific opportunities and barriers are discussed below.
4.1. Energy efficiency in the Western Cape’s agricultural sector
Due to energy cost and supply issues (as discussed in section 2.4.4.), the business case for investment into energy efficiency is strong and there are considerable opportunities for suppliers of greentech and services in this space. Significant energy savings are possible if farmers consider the advice of an independent third party energy expert6 before investing in equipment such as water pumps, piping, or motors for irrigation. For instance, the correct sizing of motors is particularly important to maximising the potential for efficient energy use.
6 GreenCape has an energy sector desk which is able to provide free information and contact details.
This section focuses on opportunities identified this year during the course of engagement with stakeholders in the
agriculture and other green economy sectors.
Agriculture: Market Intelligence Report 2016 27
–The business case for investment into energy efficiency is strong and there are considerable opportunities for suppliers of greentech and services in this space
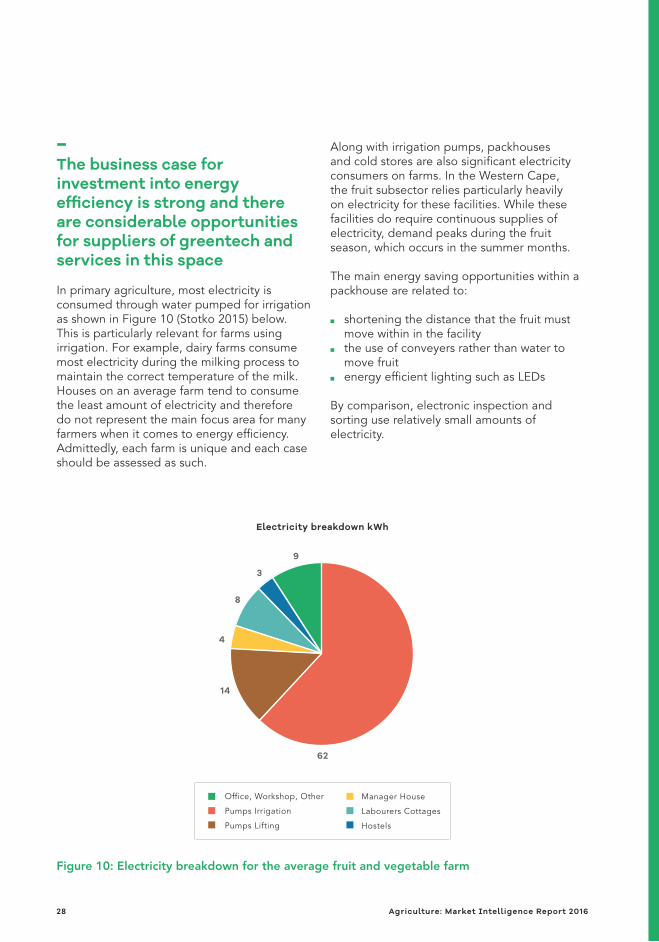
In primary agriculture, most electricity is consumed through water pumped for irrigation as shown in Figure 10 (Stotko 2015) below. This is particularly relevant for farms using irrigation. For example, dairy farms consume most electricity during the milking process to maintain the correct temperature of the milk. Houses on an average farm tend to consume the least amount of electricity and therefore do not represent the main focus area for many farmers when it comes to energy efficiency. Admittedly, each farm is unique and each case should be assessed as such.
Along with irrigation pumps, packhouses and cold stores are also significant electricity consumers on farms. In the Western Cape, the fruit subsector relies particularly heavily on electricity for these facilities. While these facilities do require continuous supplies of electricity, demand peaks during the fruit season, which occurs in the summer months.
The main energy saving opportunities within a packhouse are related to:
■ shortening the distance that the fruit must move within in the facility
■ the use of conveyers rather than water to move fruit
■ energy efficient lighting such as LEDs
By comparison, electronic inspection and sorting use relatively small amounts of electricity.
Figure 10: Electricity breakdown for the average fruit and vegetable farm
62
9
3
8
4
14
Office, Workshop, Other
Pumps Irrigation
Pumps Lifting
Manager House
Labourers Cottages
Hostels
Electricity breakdown kWh
28 Agriculture: Market Intelligence Report 2016

In cold stores, cooling and drying of fruit represents the major energy demand. Compressors, extractor fans and evaporator fans are significant electricity consumers as shown in Figure 11 (EEPACS 2012).
Apart from spending electricity on produce, many facilities have additional heating and ventilation equipment to provide a suitable environment for workers. Traditional equipment that consists of heaters and fans consume a significant amount of electricity, usage within packhouses and cold stores can be reduced by almost 50% by using natural ventilation, enabled and supported by good building and roofing designs (Koos Bouwer Consulting 2014).
The design of a new building is therefore an important consideration because windows and doors that seal properly contribute significantly to energy efficiency. For this reason, GreenCape compiled a green building materials catalogue to assist business owners with a list of building materials that are energy efficient. This catalogue is available on the GreenCape website.
In the Western Cape there are numerous agricultural facilities that use electricity (Table 7, Basson 2015). Some have already implemented certain energy efficiency measures, but there is significant potential for growth in the rate of uptake within the sector. Recognising the benefits, most farmers are already actively looking for expert advice to improve energy efficiency.
Figure 11: Electricity use in cold stores, cooling and drying of fruit
49
115
3
2
5
25
Compressors
Extractor Fans
Lightning
Condenser Pumps
Condenser Fans
Evaporator Fans
Other
Electricity consumptions
Agriculture: Market Intelligence Report 2016 29

Table 7: Number of agri sector facilities in the Western Cape
Type Number
Abattoirs (red meat) 55
Abattoirs (white meat) 25
Agro processing plants 261
Chicken batteries 57
Chicken broilers 170
Chicken layers 140
Chicken hatcheries 2
Cool chain facilities 21
Dairies 760
Fruit packers 44
Fruit cool chains 29
Homestead 5565
Homestead-labour 13860
Pack houses 613
Piggeries 75
Silos (commercial) 44
Tunnels 853
Total 22574
4.2. Solar PV in the Western Cape’s agricultural sectorRising energy costs, uncertainty of supply and the impact of load shedding have acted as drivers for the agriculture sector to adopt renewable energy solutions, especially once all energy efficiency opportunities have been realised. In addition to the South African Government’s Renewable Energy Independent Power Producer Procurement (REIPPP) programme, the agricultural sector has seen an increase in the uptake of renewable energy (RE). Some farmers have benefited financially by partnering on land rental agreements with Independent Power Producers (IPPs) on this programme.
The increase in solar PV installations across all sectors has been partly the result of falling costs, as illustrated in Figure 12 (Tshehla 2015). In 2013 the cost of solar panels without battery storage was just under R40 000 for a system of 10kw and smaller. At the current rate of installations, the projection shows the cost will almost be cut in half by 2018.
–The agricultural sector has seen an increase in the uptake of renewable energy. Some farmers have benefited financially by partnering on land rental agreements with Independent Power Producers on this programme
30 Agriculture: Market Intelligence Report 2016
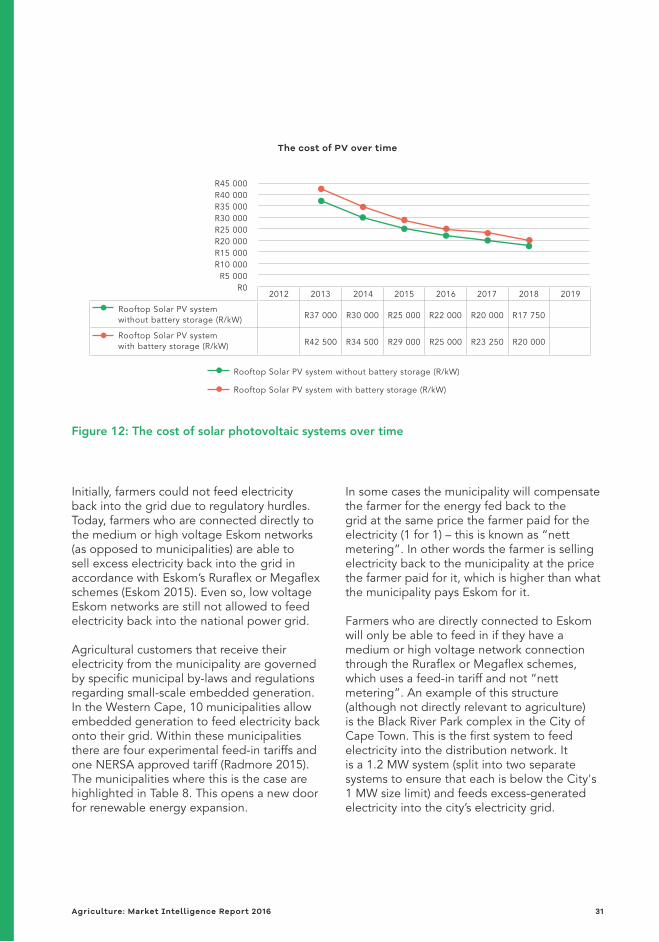
Initially, farmers could not feed electricity back into the grid due to regulatory hurdles. Today, farmers who are connected directly to the medium or high voltage Eskom networks (as opposed to municipalities) are able to sell excess electricity back into the grid in accordance with Eskom’s Ruraflex or Megaflex schemes (Eskom 2015). Even so, low voltage Eskom networks are still not allowed to feed electricity back into the national power grid.
Agricultural customers that receive their electricity from the municipality are governed by specific municipal by-laws and regulations regarding small-scale embedded generation. In the Western Cape, 10 municipalities allow embedded generation to feed electricity back onto their grid. Within these municipalities there are four experimental feed-in tariffs and one NERSA approved tariff (Radmore 2015). The municipalities where this is the case are highlighted in Table 8. This opens a new door for renewable energy expansion.
In some cases the municipality will compensate the farmer for the energy fed back to the grid at the same price the farmer paid for the electricity (1 for 1) – this is known as “nett metering”. In other words the farmer is selling electricity back to the municipality at the price the farmer paid for it, which is higher than what the municipality pays Eskom for it.
Farmers who are directly connected to Eskom will only be able to feed in if they have a medium or high voltage network connection through the Ruraflex or Megaflex schemes, which uses a feed-in tariff and not “nett metering”. An example of this structure (although not directly relevant to agriculture) is the Black River Park complex in the City of Cape Town. This is the first system to feed electricity into the distribution network. It is a 1.2 MW system (split into two separate systems to ensure that each is below the City's 1 MW size limit) and feeds excess-generated electricity into the city’s electricity grid.
Figure 12: The cost of solar photovoltaic systems over time
R45 000R40 000R35 000R30 000R25 000R20 000R15 000R10 000
R5 000R0
2012 2013
R37 000Rooftop Solar PV system without battery storage (R/kW)
Rooftop Solar PV system without battery storage (R/kW)
Rooftop Solar PV system with battery storage (R/kW)
Rooftop Solar PV system with battery storage (R/kW) R42 500 R34 500 R29 000 R25 000 R23 250 R20 000
R30 000 R25 000 R22 000 R20 000 R17 750
2014 2015 2016 2017 2018 2019
The cost of PV over time
Agriculture: Market Intelligence Report 2016 31

Municipality District Seat Allow PV to feed into the grid
Approved PV tariffs
Beaufort West Local Municipality
Central Karoo Beaufort West Yes Experimental tariff
Bergrivier Local Municipality
West Coast Piketberg Yes No
Bitou Local Municipality Eden Plettenberg Bay Unknown Unknown
Breede Valley Local Municipality
Cape Winelands Worcester Unknown Unknown
Cape Agulhas Local Municipality
Overberg Bredasdorp Unknown Unknown
Cederberg Local Municipality
West Coast Clanwilliam Unknown Unknown
City of Cape Town Metropolitan
Cape Town Yes Yes
Drakenstein Local Municipality
Cape Winelands Paarl Yes Experimental tariff
George Local Municipality
Eden George Yes Experimental tariff
Hessequa Local Municipality
Eden Riversdale No No
Kannaland Local Municipality
Eden Ladismith Unknown Unknown
Knysna Local Municipality
Eden Knysna Unknown Unknown
Laingsburg Local Municipality
Central Karoo Laingsburg No rules No
Langeberg Local Municipality
Cape Winelands Ashton Yes No
Matzikama Local Municipality
West Coast Vredendal No rules In progress
Mossel Bay Local Municipality
Eden Mossel Bay No No
Oudtshoorn Local Municipality
Eden Oudtshoorn Yes In progress
Overstrand Local Municipality
Overberg Hermanus No No
Prince Albert Local Municipality
Central Karoo Prince Albert No rules No
Saldanha Bay Local Municipality
West Coast Vredenburg Yes In progress
Table 8: Municipalities (WC) that have PV rules, regulations and tariffs
32 Agriculture: Market Intelligence Report 2016

Stellenbosch Local Municipality
Cape Winelands Stellenbosch Yes No
Swartland Local Municipality
West Coast Malmesbury Yes Experimental tariff
Swellendam Local Municipality
Overberg Swellendam Unknown Unknown
Theewaterskloof Local Municipality
Overberg Caledon No In progress
Witzenberg Local Municipality
Cape Winelands Ceres No rules No
SSEG Residential Tariffs 2015/16 Units Tariff excl VAT Tariff incl VAT
Service charge R/day 11,43 13,03
Energy charge - Consumption0 - 600 kWh
c/kWh 95,76 109,17
Energy charge - Consumption600.1 + kWh
c/kWh 187,63 213,19
Energy charge - Generation c/kWh 56,99 N/A
Table 9: Small scale embedded generation residential tariffs
The City of Cape Town’s small-scale embeddd generation (SSEG) conditions are that:
■ the user must be a net-consumer over a year ■ embedded generation capacity must be
< 1MVA ■ tariffs will be revised every 12 months by the
municipality
The agricultural sector has seen an increase in investment in renewable energy globally, with solar PV leading the way. In South Africa, more than 10% of solar PV installations are in the agriculture sector. The rise in large-scale solar installations on farms in the Western Cape recently indicates that they make business sense for farmers.
–In South Africa, more than 10% of solar PV installations are in the agriculture sector.
Installations vary from 0.5kW to 500kW and include various subsectors like poultry, game, mixed farming, fruit and wine. One of the biggest contributors is the installation of borehole solar pumps. According to the Power Quality and Renewable Services (PQRS 2015) roughly 45 000 systems have been installed in South Africa to date. If all the systems were combined it would have a project size of 22 500kW.
Agriculture: Market Intelligence Report 2016 33

In particular, the fruit and wine sub sectors of the Western Cape have seen significant uptake of solar PV. Average savings of 27% can be realised on packhouse or cold store electricity bills through installing solar PV (Yell 2014).
–Average savings of 27% can be realised on packhouse or cold store electricity bills through installing solar PV
To date, the five largest installations in the Western Cape agri sector have been:
■ Ceres Fruit Growers: installed a 1 MWp PV system generating approximately 1,690 MWh/year, covering 6% of their annual electricity usage (ESI Africa 2013).
■ Rooibos Ltd: installed a 511 kWp solar system generating around 875 MWh/year. This will produce 40% of the company’s electricity with a system lifespan of 25 years (Rooibos Limited n.d.).
■ Lourensford Wine Estate: installed a 500 kWp system generating about 750 MWh/year, with all electricity used by the estate (Lourensford 2014).
■ Arbeidsvreugd Fruit Packers: installed a 450 kWp system generating 3000 kWh/day in summer months, saving 55% on their electricity bill in the summer months with a payback period of 6 years (Yell 2014).
■ Stellenpak Fruit Packers: installed a 420 kWp system which generates 600 MWh/year. All the electricity is used by the facility; saving of 15% on their electricity bill (Jooste 2014).
In 2015 Nedbank introduced a funding model to help farmers invest in renewable energy technologies and energy efficiency projects. The goal is to match repayment terms to savings in electricity costs over the medium-term. This allows the farmer to have a shorter payback period. The loan also offers a 7% rebate to farmers that qualify (Hancock 2015).
Nedbank also worked with farmers in the industry to try and understand farmers’ challenges with moving to more sustainable practices. A full report compiled by Nedbank, WWF and the Western Cape Department of Agriculture will be available later this year. Furthermore, GreenCape is developing a brief overview of the business case for solar PV for fruit packhouses which will be publicly available from March 2016.
4.3. Conservation agricultureMaintaining soil health is crucial for sustainable agriculture production. However, conventional tillage is the leading cause of depletion of soil health. Conventional farming includes a sequence of soil tillage, such as ploughing and harrowing, mainly for seedbed preparation and weed control. Residue is burned or tilled back into the soil and either crop rotations or monoculture is practiced. This is unsustainable, because in the long term tillage destroys soil structure and contributes to a reduction in fertility and organic matter levels. This results in a need for higher levels of chemical fertiliser and energy use, with associated financial and environmental costs.
Increasingly, South African farmers are recognising that as an alternative to conventional agriculture, the long-term benefits of Conservation Agriculture (CA) can be realised through:
■ Minimum mechanical soil disturbance: Achieved by practicing no-till, zero-till or direct seeding. The degree of tillage is determined by the technology available, soil characteristics and type of crops being produced. The benefits include reduced fuel inputs and increased organic matter retention and water holding capacity.
■ Diverse rotation: Successively planting different crops, recognising that there is no single crop rotation system suitable for all production regions. Benefits include fewer diseases, a lower weed burden and greater soil fertility.
■ Permanent organic soil cover: Protects the soil from erosion and feeds soil biota.
34 Agriculture: Market Intelligence Report 2016

–Many farmers recognise that conservation agriculture is a viable alternative to conventional agriculture.
Having higher soil organic matter and using nitrogen-fixing crops (legumes) in rotation result in lower fertiliser requirements. In addition, improved water holding capacity results in greater water efficiency. Given the current drought situation in South Africa, this means that when it does rain, these soils can retain water for a longer period of time.
South Africa still lags behind some countries, as seen in Figure 13 (FAO Aquastat, cited by Knott 2014), but the practice of conservation farming is increasing.
According to Blignaut et al. (2014), 35% of cultivatable areas were under some sort of reduced tillage, and nearly 9% was under no-tillage in 2004. Data presented at the 3rd World Congress on Conservation Agriculture in Nairobi in 2005 showed an area of 300 000 ha under no-tillage in SA. According to experts, that area grew to 368 000 ha by 2010.
South Africa has excellent conditions for applying no-tillage technologies with adequate infrastructure and the presence of no-till clubs (Derpsch et al. 2010). In the Western Cape, almost all grain farmers (80%) have no-till machinery. However, experts at the Western Cape Department of Agriculture have highlighted that with the right investment, there are significant opportunities for farmers to further lower soil disturbance, thereby realising long-term benefits related to improved crop yields.
There are opportunities for greentech suppliers in the agricultural sector with the trend towards using conservation tillage systems and equipment. These are:
■ No-till planting: This form of tillage is the most practiced conservation agricultural method in South Africa. The planter is fitted with knife-point openers (tine planters) and press wheels that to some extent cultivate the soil during the planting process. Less than 20% of the soil should be disturbed. Currently, components of no-till planters are imported (mostly from Brazil) and then assembled locally to suit South African conditions. There are only a few local producers in the Western Cape. The lifetime of the equipment is 20 – 30 years and little maintenance is required.
Figure 13: Percentage of arable land under conservation agriculture (2011)
70
60
50
40
30
20
10
0
Argen
tina
Urugua
yFr
ance
Austra
liaCan
ada
Brazil
New Z
ealan
d
USA
Chile
Zam
bia
Spain
Zim
babwe
Sout
h Afri
caM
ozam
bique UK
China
Kenya
Ghana
Agriculture: Market Intelligence Report 2016 35

Irrigation Industrial Mining Municipal / Domestic Power Generation Livestock and Nature Conservation
■ Direct seeding: This method is similar to no-till, but stubble openers can also include discs and/or coulters that cause more than 20% of soil to be disturbed. In South Africa, this method is used more commonly in heavy stubble situations, such as under irrigation.
■ Zero till: Planters are equipped with only coulters and discs, without knife-point openers that penetrate the soil. Therefore, no mechanical loosening of the soil occurs during the planting process. However, this method has proved unsuitable for most soils of the Western Cape, due to high stone and gravel fractions. Nevertheless, there are some farms in the Western Cape that have implemented zero-till successfully. This method holds a key opportunity for technology improvement.
Barriers to the uptake of CA include: (1) high cost of imported equipment (although local production is now addressing this barrier to some extent), (2) a lack of skills to operate new equipment, (3) lack of suitable planters for local conditions (thick residue), and (4) a delay between investment and realisation of financial return through improved yields.
4.4. Precision agriculturePrecision Agriculture7 (PA), “satellite farming” or “site-specific crop management” is a way of farming as efficiently as possible in terms of the use of irrigation water, fertiliser and pesticides. Producers apply exactly what is required in production by monitoring certain variables, such as albedo, leaf-area index and vegetation index on their farms through remote sensing.
4.4.1. Water efficiencyA need for improved water efficiency is one of the major drivers for the use of PA. Water availability is set to be the single biggest factor in limiting agriculture production. In the Western Cape, allocations to the sector have already been capped – this means that water efficiency measures like PA will be crucial for any further agricultural expansion that requires irrigation.
–A need for improved water efficiency is one of the major drivers for the use of PA
Figure 14: Proportion water use per main economic sector
7 PA involves the observation, impact assessment and timely strategic response to fine-scale variation in causative components of an agricultural production process. This farming-management concept is based on observing and measuring spatial and temporal characteristics of a number of crop variables. The goal of PA is to have a management strategy that results in optimisation of returns on inputs, while preserving resources.
Proportion water use / Main economic sector
6027
34.3
3.3 2.5
36 Agriculture: Market Intelligence Report 2016

Agricultural irrigation accounts for up to 60% of water use in the country (Figure 14, Department of Water Affairs 2013). In the Western Cape this figure is lower, with 43% of available water resources used for irrigation.
The global precision farming market is estimated to grow at a Compound Annual Growth Rate (CAGR) of 13% from 2015 to 2022 to reach over US$6.43 billion by 2022. Farmers, especially in developing countries, are becoming increasingly aware of the benefits (and, indeed, the growing necessity) of utilising tools that help them manage their resources more efficiently.
The adoption of PA in South Africa has been relatively slow, mostly due to the cost of accessing the technology, but also due to a lack of knowledge and skills. However, the potential value of PA adoption that will result from the associated cost reductions (and indirect benefits) has been estimated at R1.2 billion, with the associated potential job creation of up to 2400 new jobs (Table 10).
–R1.2bn of savings, and the creation of 2400 new jobs are possible if South Africa’s farmers adopt precision agriculture
Market potential (2019) Net new jobs in Western Cape (by 2019)
Other positive impacts
■ Assuming reinvestment of savings:
− R450-900 m for WC market − R800-1200 m when
considering total impact on the economy (including indirect & induced impacts)
■ Assuming reinvestment of savings:
− 550-2400 new jobs in WC − Of these, 300-1500 are
unskilled jobs
■ Increased water efficiency (results in decreased water use and/or increased production)
■ Decreased run-off reduces soil erosion, improves river water quality, etc.
■ Job safeguarding
Table 10: Potential value of adopting precision agriculture8
8 Assumed 10% energy and water savings reinvested into agricultural crop sectors using 2014 multipliers developed by Conningarth Economists
Although there are strong drivers for using PA, including rising input costs such as electricity for pumping, and greater competition for water resources, there are also barriers to the uptake of PA:
■ A weakening Rand making imported technology more expensive.
■ A shortage of technical skills and knowledge. ■ Lack of appreciation by some farmers of
the detrimental effects of over and under irrigation.
■ Farmers’ perceptions that improved water efficiency may result in a reduction to their allocations, placing future possible expansion at risk.
Agriculture: Market Intelligence Report 2016 37

9 For more information contact: André Roux, at the Western Cape Department of Agriculture (DAFF 2015).
Table 11: Potential costs and cost savings associated with the application of precision agriculture
Case Study: An example of the application of PA in the Western Cape: Spotlight on Fruitlook
FruitLook (Department of Agriculture 2015) is an open-web portal for fruit and wine-grape growers, created by the Western Cape Department of Agriculture (WCDoA), to assist irrigators with optimising water use. Rising input costs (especially energy) and increased competition for water compelled the WCDoA to improve water-use efficiency in terms of agricultural yield per amount of water consumed.
FruitLook is a web-based tool that uses satellite-derived information to help farmers decide about optimal timing, extent and location of inputs such as water and fertiliser.
It uses the “Surface Energy Balance Algorithm for Land” (SEBAL) model to estimate aspects of the hydrological cycle and quantifies the energy balance using
satellite imagery (albedo, leaf area index, vegetation index) and meteorological data (wind, humidity, solar radiation and air temperature).
It maps a number of parameters such as evapotranspiration, biomass growth, water deficit and soil moisture. Farmers are thereby able to avoid over or under irrigation which results in greater water efficiency and lower production costs.
In a recent survey, 60% of respondents reported that FruitLook helped them manage their water efficiently by reducing consumption by between 10% and 30%. This translates to a significant electricity demand reduction (due to reduced pumping requirements) and associated cost savings. Table 11 below shows a hypothetical scenario of possible cost savings to farmers and feasibility of the venture to investors.
Expected benefits by 1) increasing revenues with 10% (yield); and 2) decreasing costs (water, fuel, fertiliser and chemicals) by 10%:
Wine grapes R4 130/ha
Table grapes R23 590/ha
Deciduous fruit trees R25 160/ha
Future purchasing cost of FruitLook R150/ha
Source: Calculations by Department of Agriculture, Western Cape (2015), based on 10% increase in yield and 10% decrease of water, fuel, fertiliser and chemical costs9
Currently, the service is free of charge and funded by the WCDoA. Not many farmers seem to be aware of this. A mere 10% of relevant land under cultivation is under
subscription, which means the potential for increased uptake of this tool is large. FruitLook can be accessed at www.fruitlook.co.za/
38 Agriculture: Market Intelligence Report 2016

4.4.2. The growing market for drone technology in agricultureNo longer limited to military uses, Unmanned Aerial Vehicles (UAVs, also known as drones) now find applications in various activities within filming, delivering of packages, setting up portable wireless connections in remote areas, and in the gathering of remotely sensed data for use in PA (MIT Technology Review 2014). In agriculture, drones can be used for a number of applications including aerial mapping, crop surveying, plant stress detection, and to conduct livestock censuses. Given the variety of possible applications, the potential for growth in the uptake of drone technology in South Africa’s agricultural sector is significant.
–In agriculture, drones can be used for a number of applications including aerial mapping, crop surveying, plant stress detection, and to conduct livestock censuses
Internationally, drones have already been successfully deployed in the agricultural sector to optimise agricultural production and to minimise input costs by collecting and analysing data to enable wiser decision making, much like the satellite-derived data in the case of FruitLook. Drone-derived data is different in that it enables rapid response from farmers. For example, orchard farmers are able to detect if a certain tree is under stress (before showing physical signs thereof), how much fertiliser to use according to tree volume, and how much water to use. Livestock farmers, with the use of a Normalized Difference Vegetation Index (NDVI) camera, are able to detect unusual body temperatures, and can attend to the animal in question before a livestock fatality occurs.
With drone technology now available in South Africa, a number of companies are already entering this new market. While companies have started developing and building their own drones designed for local conditions, some parts such as motors are still imported from China or the USA. One local company, based in Somerset West in the Western Cape, currently manufactures drone motors. Drone companies can provide customers with either a product or a service. In most cases they will also provide training and assistance with the licencing process, where required.
In South Africa, the agriculture sector represents a new market for this technology, and legislation and licencing processes have recently (July 2015) been established. Commercial operators (as opposed to hobbyists) will need to apply for a Remote Operating Certificate (ROC), which is valid for 12 months. The drone must be licenced as a Remotely Piloted Aircraft (RPA). The pilot operating the craft must be in possession of a licence – Remote Pilots Licence (RPL), as well as a letter of approval (RLA) for the Remotely Piloted Aircraft System (RPAS). All further information on regulations to operate a drone can be found at the Safe Drone website (2015).
–The agriculture sector presents a new market for drone technology with the establishment of legislation and licensing processes in 2015
Agriculture: Market Intelligence Report 2016 39

Since the introduction of the regulations in July 2015 there have been a number of applications. A breakdown is provided below by Drone News Update (2015):
■ 118 certification registrations ■ 10 RPA licenses issued ■ 29 RPA letters of approval ■ 1 RPA maintenance technician application ■ 72 ROCs ■ 10 RPA training organisation applications ■ 4 air service licensing applications
4.5. Biological controlBiological control (biocontrol) involves the use of a pest’s own natural enemies (parasites, predators and pathogens), whether introduced or otherwise manipulated, to suppress the pest population to an acceptable level. The word “pests” in this sense, includes diseases, insects, mites, nematodes and weeds and/or invasive alien plants.
Biopesticides are a sustainable alternative to synthetic pesticides (the harmful effects of which were discussed in Section 2.4.2. Despite this, global private sector investment in synthetic pesticides has increased significantly in recent years, and most South African farmers are dependent on synthetic pesticides for production. Even though local pesticide use has increased more than five times from 1994 to 2011 (Quinn et al 2011), it is neither a long-term solution for increasing yields on depleted soil, nor an incentive for farmers to invest in agro-ecological practices.
Trend analyses by various organisations show that governments are likely to continue applying strict safety criteria on synthetic pesticides, and this will result in fewer products on the market, thereby creating an opportunity for biopesticides companies to help fill the gap, as seen in Table 12 (BCC Research 2014).
–Partly due to consumer demand for organic food, the global biopesticide market has grew to $53.8bn in 2013 and is expected to reach US$83.7bn by 2019.
The global market for biopesticides was valued at US$54.8 billion in 2013 and is expected to reach US$83.7 billion by 2019, growing at a CAGR of 6% from 2014 to 2019 (BCC Research 2014). Reports attribute the main reason for growth in this market to consumer demand for pesticide-free food. However, in South Africa, the uptake of biopesticides has been much slower than in developed countries. North America dominates the market, with a 44% biopesticides use in Canada, Mexico and the United States Europe follows, and is expected to have the fastest growth due to increasingly stringent environmental regulations. Increasing pressure from international markets will affect South African exports, especially in the fruit and wine industry. This is a potential driver of growth in the South African biopesticides market.
Global market for pesticides
Type 2003 2004 2005
Synthetic pesticides 27 144 26 600 26 076
Biopesticides 468 562 672
Total 27 612 27 162 26 748
Table 12: Global market for pesticides
40 Agriculture: Market Intelligence Report 2016
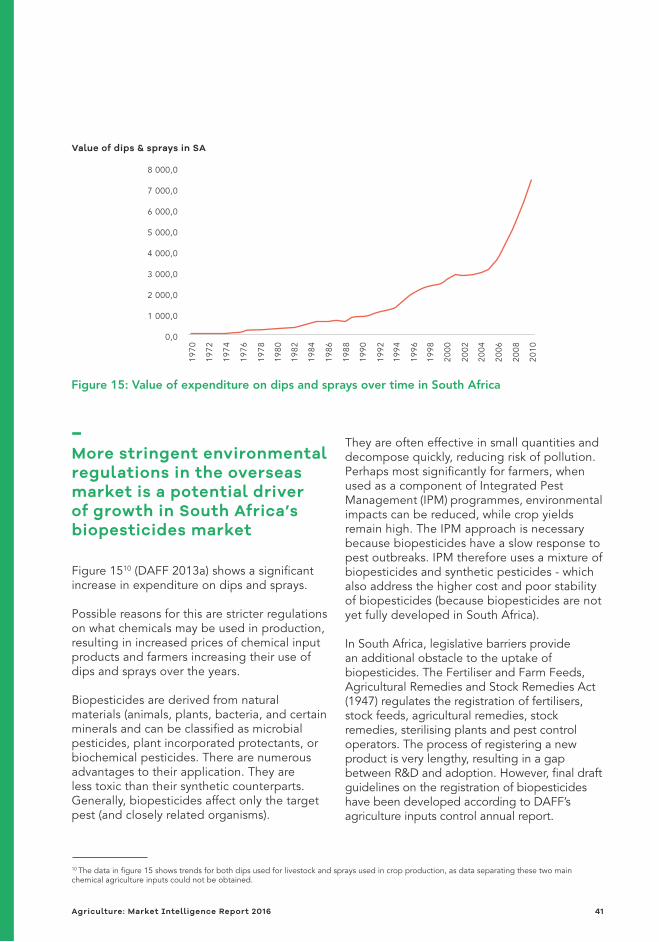
–More stringent environmental regulations in the overseas market is a potential driver of growth in South Africa’s biopesticides market
Figure 1510 (DAFF 2013a) shows a significant increase in expenditure on dips and sprays.
Possible reasons for this are stricter regulations on what chemicals may be used in production, resulting in increased prices of chemical input products and farmers increasing their use of dips and sprays over the years.
Biopesticides are derived from natural materials (animals, plants, bacteria, and certain minerals and can be classified as microbial pesticides, plant incorporated protectants, or biochemical pesticides. There are numerous advantages to their application. They are less toxic than their synthetic counterparts. Generally, biopesticides affect only the target pest (and closely related organisms).
They are often effective in small quantities and decompose quickly, reducing risk of pollution. Perhaps most significantly for farmers, when used as a component of Integrated Pest Management (IPM) programmes, environmentalimpacts can be reduced, while crop yields remain high. The IPM approach is necessary because biopesticides have a slow response to pest outbreaks. IPM therefore uses a mixture of biopesticides and synthetic pesticides - which also address the higher cost and poor stability of biopesticides (because biopesticides are not yet fully developed in South Africa).
In South Africa, legislative barriers provide an additional obstacle to the uptake of biopesticides. The Fertiliser and Farm Feeds, Agricultural Remedies and Stock Remedies Act (1947) regulates the registration of fertilisers, stock feeds, agricultural remedies, stock remedies, sterilising plants and pest control operators. The process of registering a new product is very lengthy, resulting in a gap between R&D and adoption. However, final draft guidelines on the registration of biopesticides have been developed according to DAFF’s agriculture inputs control annual report.
Figure 15: Value of expenditure on dips and sprays over time in South Africa
8 000,0
7 000,0
6 000,0
5 000,0
4 000,0
3 000,0
2 000,0
1 000,0
0,0
1970
1972
1974
1976
1978
1980
1982
1984
1986
1988
1990
1992
1994
1996
1998
2000
2002
2004
2006
2008
2010
Value of dips & sprays in SA
10 The data in figure 15 shows trends for both dips used for livestock and sprays used in crop production, as data separating these two main chemical agriculture inputs could not be obtained.
Agriculture: Market Intelligence Report 2016 41

4.6. Bioenergy- Biogas from agricultural wasteAccording to a recent study by the Energy Research Centre at the University of Cape Town (Du Preez 2015), the total potential electricity generation from biogas in South Africa is close to 2300 MWe. A key driver for using waste as a source of energy is the contribution to energy security and economic growth. Employing a waste-to-energy approach also diverts waste from landfills.
–The total potential electricity generation from biogas in South Africa is close to 2300 MWe
A recent report on the licencing process for bioenergy projects in South Africa, compiled by the Deutsche Gesellschaft für Internationale Zusammenarbeit (GIZ) (Steenkamp 2015) is a valuable document for potential investors in the bioenergy market. The report analyses the South African biogas licensing and permitting process, focusing on three existing biogas facilities and the processes that were followed to obtain their approvals. It may be useful for scoping, planning and development of other biogas projects as it highlights weaknesses and strengths of processes, identifies possible bottlenecks and suggests ways to improve the decision-making sequence for biogas projects.
Biogas from waste has been identified as a key opportunity for the agricultural sector. The sector can supply feedstock for anaerobic digestion (AD), such as manure from pigs, cattle and chickens. Commercial abattoirs, cheese factories, breweries, wine estates, processing plants, and fruit and vegetable-packaging plants also have potential feedstock. In addition to biogas, excess digestate coming out of the AD plant can be used as fertiliser for fruit or vegetable fields.
Also, should a plant fail to produce sufficient gas to generate electricity, the gas can be combusted for heat.
Leading researchers at Stellenbosch University highlight that the biggest opportunity for biogas production in South Africa is in the accumulated benefits of multiple decentralised small-scale plants on farms. In South Africa, there are as many as 300 biogas plants (Department of Energy 2015b), but local growth potential for the biogas industry is highlighted by the fact that China has 17 million plants, and India has 12 million.
–South Africa has 300 biogas plants but there is high growth potential when considerting that China and India have 17 million and 12 million plants respectively
South Africa’s biggest biogas plant is on a dairy farm near Darling in the Western Cape. This plant produces 1.5 GWh electricity per year, and reduced the farm’s electricity bill from R110 000 to only R12 000 per month (Creamer 2015).
The required capital expenditure (especially given a weakening Rand and the fact that much of the equipment is imported into South Africa) represents an additional barrier to the generation of biogas on many farms. By comparison, Germany has roughly 8000 biogas plants the size of the one near Darling in the Western Cape. This highlights the relative immaturity – and also the great potential for growth – of the biogas sector in South Africa.
42 Agriculture: Market Intelligence Report 2016
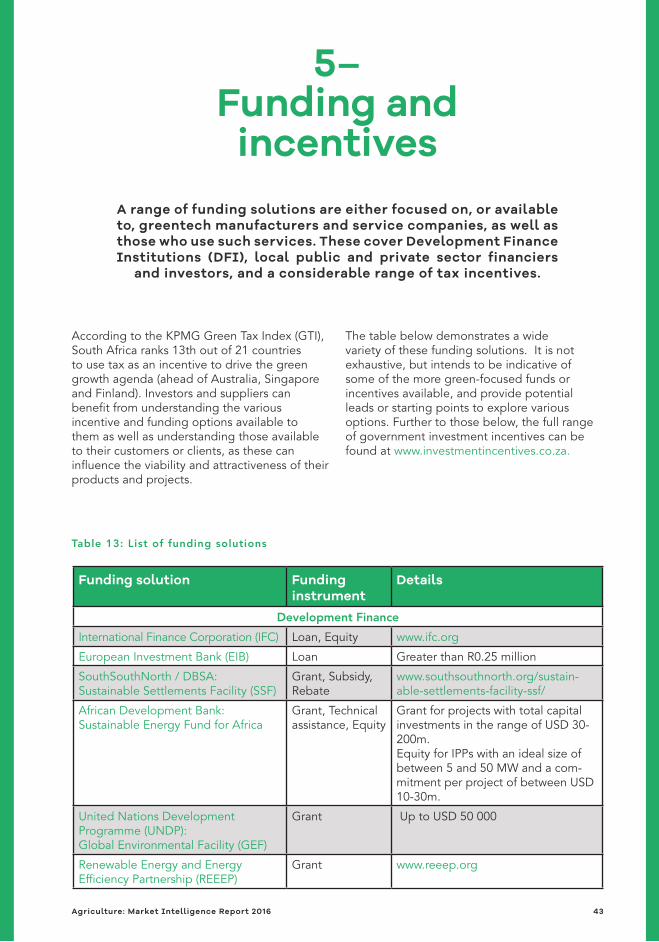
5–Funding and
incentivesA range of funding solutions are either focused on, or available to, greentech manufacturers and service companies, as well as those who use such services. These cover Development Finance Institutions (DFI), local public and private sector financiers
and investors, and a considerable range of tax incentives.
According to the KPMG Green Tax Index (GTI), South Africa ranks 13th out of 21 countries to use tax as an incentive to drive the green growth agenda (ahead of Australia, Singapore and Finland). Investors and suppliers can benefit from understanding the various incentive and funding options available to them as well as understanding those available to their customers or clients, as these can influence the viability and attractiveness of their products and projects.
The table below demonstrates a wide variety of these funding solutions. It is not exhaustive, but intends to be indicative of some of the more green-focused funds or incentives available, and provide potential leads or starting points to explore various options. Further to those below, the full range of government investment incentives can be found at www.investmentincentives.co.za.
Funding solution Funding instrument
Details
Development Finance
International Finance Corporation (IFC) Loan, Equity www.ifc.org
European Investment Bank (EIB) Loan Greater than R0.25 million
SouthSouthNorth / DBSA: Sustainable Settlements Facility (SSF)
Grant, Subsidy, Rebate
www.southsouthnorth.org/sustain-able-settlements-facility-ssf/
African Development Bank: Sustainable Energy Fund for Africa
Grant, Technical assistance, Equity
Grant for projects with total capital investments in the range of USD 30-200m.Equity for IPPs with an ideal size of between 5 and 50 MW and a com-mitment per project of between USD 10-30m.
United Nations Development Programme (UNDP): Global Environmental Facility (GEF)
Grant Up to USD 50 000
Renewable Energy and Energy Efficiency Partnership (REEEP)
Grant www.reeep.org
Table 13: List of funding solutions
Agriculture: Market Intelligence Report 2016 43
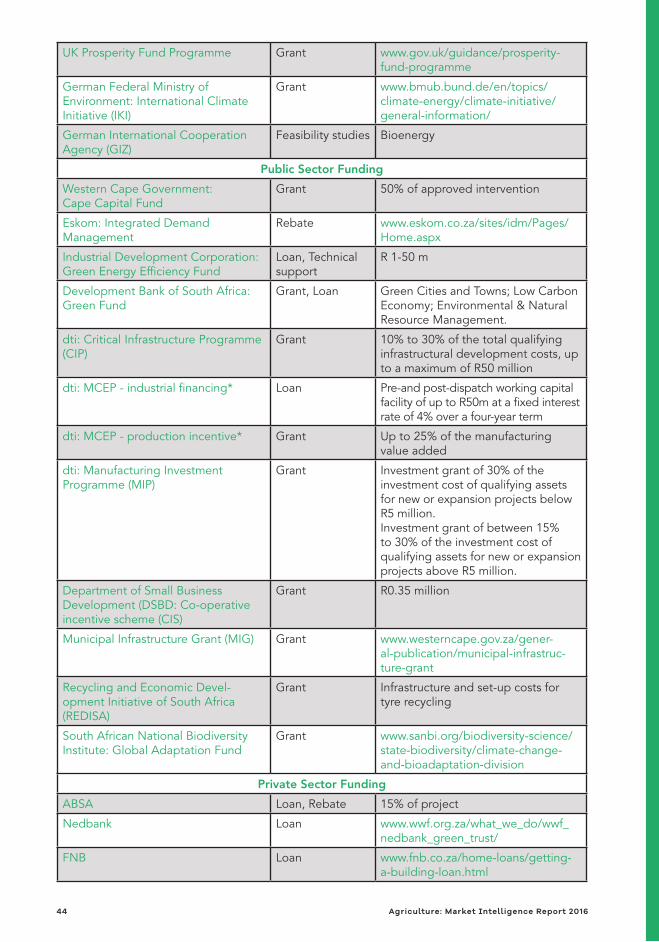
UK Prosperity Fund Programme Grant www.gov.uk/guidance/prosperity-fund-programme
German Federal Ministry of Environment: International Climate Initiative (IKI)
Grant www.bmub.bund.de/en/topics/climate-energy/climate-initiative/general-information/
German International Cooperation Agency (GIZ)
Feasibility studies Bioenergy
Public Sector Funding
Western Cape Government: Cape Capital Fund
Grant 50% of approved intervention
Eskom: Integrated Demand Management
Rebate www.eskom.co.za/sites/idm/Pages/Home.aspx
Industrial Development Corporation: Green Energy Efficiency Fund
Loan, Technical support
R 1-50 m
Development Bank of South Africa: Green Fund
Grant, Loan Green Cities and Towns; Low Carbon Economy; Environmental & Natural Resource Management.
dti: Critical Infrastructure Programme (CIP)
Grant 10% to 30% of the total qualifying infrastructural development costs, up to a maximum of R50 million
dti: MCEP - industrial financing* Loan Pre-and post-dispatch working capital facility of up to R50m at a fixed interest rate of 4% over a four-year term
dti: MCEP - production incentive* Grant Up to 25% of the manufacturing value added
dti: Manufacturing Investment Programme (MIP)
Grant Investment grant of 30% of the investment cost of qualifying assets for new or expansion projects below R5 million.Investment grant of between 15% to 30% of the investment cost of qualifying assets for new or expansion projects above R5 million.
Department of Small Business Development (DSBD: Co-operative incentive scheme (CIS)
Grant R0.35 million
Municipal Infrastructure Grant (MIG) Grant www.westerncape.gov.za/gener-al-publication/municipal-infrastruc-ture-grant
Recycling and Economic Devel-opment Initiative of South Africa (REDISA)
Grant Infrastructure and set-up costs for tyre recycling
South African National Biodiversity Institute: Global Adaptation Fund
Grant www.sanbi.org/biodiversity-science/state-biodiversity/climate-change-and-bioadaptation-division
Private Sector Funding
ABSA Loan, Rebate 15% of project
Nedbank Loan www.wwf.org.za/what_we_do/wwf_nedbank_green_trust/
FNB Loan www.fnb.co.za/home-loans/getting-a-building-loan.html
44 Agriculture: Market Intelligence Report 2016

Standard Bank Loan www.standardbank.co.za/standardbank/
Old Mutual Infrastructural, Developmental and Environmental Assets Managed Fund (IDEAS)
Loan, Equity www.oldmutual.co.za/old-mutual-investment-group/boutiques/alternative-investments/our-capabilities1/infrastructure/our-products/ideas-managed-fund
Business Partners Equity, Loan R0.5-30 million
Edge Growth Equity, Loan R1-20 million
Inspired Evolution: Evolution One Fund
Loan >R10 million
Atlantic Asset Management Loan >R15 million
POLYCO Loan Infrastructure for plastics: high-density polyethylene (PE-HD), linear/low-density polyethylene PE-LD/LLLD) and polypropylene (PP)
PETCO Subsidy, Awareness and training, Equipment
Infrastructure for polyethylene terephthalate (PET). Category A: R30m-R40m per annum, Category B: R4m per annum.
Tax Rebates
12B accelerate depreciation incentive Tax rebate Accelerated depreciation of renewable energy investments at a rate of 50:30:20, as well as certain machinery, plants, implements, utensils and articles used in farming or production of renewable energy11.
12L energy efficiency incentive Tax rebate 95c/kwh deduction on energy saved
12i tax allowance incentive for manufacturing investments
Tax rebate 35-55% or R550-R900m for greenfield projects35-55% or R350--R550m for brownfield projects
Capital developmentexpenditure
Tax rebate Tax deduction for capital expenses incurred for farming operations (including game farming) which focus on sustainable agriculture.
37B environmental expenditure
Tax rebate Deduction in respect of environmental expenditure for assets related to environmental treatment and recycling, waste disposal, and post-trade environmental expenses.
37C environmental maintenance expenditure
Tax rebate Deduction in respect of environmental conservation and maintenance.
*Over R5 Billion was originally set aside for this programme and is now fully committed. A new application window will be opened in April 2016 pending availability of funds. All other incentives of the department will continue as normal.
11 This accelerated depreciation concession improves an investment’s cash flow, working to improve the business case for utility scale renewable energy projects. One suggested amendment to the incentive has been to include the support structures used in renewable energy projects, qualifying them for accelerated depreciation as well. Currently, the main technology components, such as PV panels or wind turbines, qualify, while such an amendment would also include components such as mounting structures, wind turbine tower internals and other peripheral components (The Green Business Guide 2015). The incentive is open to projects of all sizes.
Agriculture: Market Intelligence Report 2016 45

5.1. Manufacturing incentivesThe dti’s special economic zone (SEZ) programme aims to increase industrialisation, economic development and job creation around the country. More specifically, the proposed Upington Solar Corridor SEZ (Northern Cape) and Atlantis Greentech SEZ (Western Cape) focus on solar energy generation and greentech manufacturing respectively. They provide significant incentives to manufacturers, IPPs, and other players in the relevant value chains.
These development zones make ideal locations for the manufacturing of components that contribute towards local content. An example of this is the Gestamp Renewable Industry (GRI) wind tower manufacturing facility set up in Atlantis, Cape Town. Atlantis has also seen companies such as Skyward Windows and Kaytech expand to include green product lines, and local manufacturing of wind tower internals is expected soon.
The dti has proposed a number of incentives to attract investors into the proposed SEZs, which include:
■ Reduced corporate income tax (CIT) rate: qualifying companies will receive a reduced corporate tax of 15%, instead of the current 28% headline rate.
■ Employment Tax Incentive (ETI): aimed at encouraging employers to hire young and less-experienced work seekers. It will reduce the cost to employers of hiring young people through a cost sharing mechanism with government.
■ Building allowance: qualifying companies will be eligible for an accelerated depreciation allowance on capital structures (buildings). This rate will equal 10% per annum over 10 years.
■ VAT and customs relief: companies located within a customs-controlled area (CCA) will be eligible for VAT and customs relief as per the relevant legislation (dti, 2015).
Other incentives available to investments into a designated SEZ will include:
■ 12i Tax Allowance Incentive (TAI) ■ One-stop-shop facility within designated SEZ
area ■ SEZ fund for infrastructure development
within the designated area.
Within Atlantis, the City of Cape Town has made vast tracts of land available at low cost for purchase or lease by greentech companies through an accelerated land disposal process. An application has now also been submitted by the Western Cape Provincial Government for the entire Atlantis Industrial area to be declared a Greentech SEZ, a decision on which is expected in the first quarter of 2016. GreenCape’s Atlantis SEZ team can assist with information, and facilitate access to permits, licenses, planning and development approvals, incentives and finance. It is also worth noting that the dti has been willing to assure investors that investing prior to SEZ designation will not disqualify them from receiving benefits once the zone is designated.
46 Agriculture: Market Intelligence Report 2016

6–The Western Cape:
Africa’s growing greentech hub
The Western Cape is a world-class investment destination offering prime locations, modern infrastructure, a skilled workforce, low operational costs and an abundance of natural resources. It is a sought-after place to live, with unrivalled natural beauty, vibrant culture, excellent schools and universities, and an outstanding quality of life. It is also a
prime location for green business.
The Cape Town area has emerged in the last five years as South Africa’s renewable energy and cleantech hub, with a critical mass of the leading local and global companies already present, including numerous original equipment manufacturers. The province has a strong local presence of major professional-services firms and financiers, as well as a supportive government that has made ease of doing business and the green economy key priorities.
Coupled with these, is a strong and rapidly growing market for green technology and services in South Africa and the region.
Some of the major market opportunity areas in the next five years are outlined in the figure below. Notably, on utility-scale wind and solar projects there is robust South African and African demand, with ±R200bn/US$20bn invested since 2011 and >1GW capacity procured per annum.
Figure 16: Major market opportunities in the Western Cape (2015 – 2020)
Renewable energy
■ utility scale wind and solar projects
■ rooftop solar PV ■ component
manufacture
Waste
■ bioenergy ■ secondary materials ■ value chains
Water
■ reuse ■ precision irrigation ■ resource recovery ■ advanced treatment ■ use efficiency
Energy efficiency
■ industrial ■ commercial ■ agricultural ■ government ■ residential
Agriculture: Market Intelligence Report 2016 47
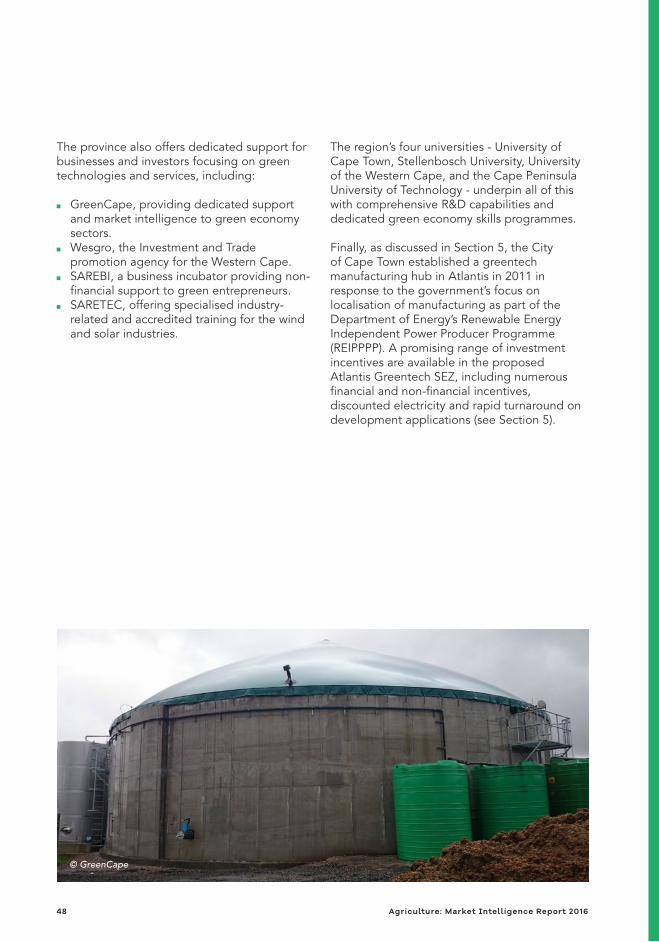
The province also offers dedicated support for businesses and investors focusing on green technologies and services, including:
■ GreenCape, providing dedicated support and market intelligence to green economy sectors.
■ Wesgro, the Investment and Trade promotion agency for the Western Cape.
■ SAREBI, a business incubator providing non-financial support to green entrepreneurs.
■ SARETEC, offering specialised industry-related and accredited training for the wind and solar industries.
The region’s four universities - University of Cape Town, Stellenbosch University, University of the Western Cape, and the Cape Peninsula University of Technology - underpin all of this with comprehensive R&D capabilities and dedicated green economy skills programmes.
Finally, as discussed in Section 5, the City of Cape Town established a greentech manufacturing hub in Atlantis in 2011 in response to the government’s focus on localisation of manufacturing as part of the Department of Energy’s Renewable Energy Independent Power Producer Programme (REIPPPP). A promising range of investment incentives are available in the proposed Atlantis Greentech SEZ, including numerous financial and non-financial incentives, discounted electricity and rapid turnaround on development applications (see Section 5).
© GreenCape
48 Agriculture: Market Intelligence Report 2016

7–GreenCape’s support
to businesses and investors
We assist businesses in this space to remove barriers to their establishment and growth by providing our members with:
■ free, credible and impartial market information and insights
■ access to networks of key players in government, industry, finance and academia
■ an advocacy platform to help create an enabling policy and regulatory environment for green business
Since inception in 2010, GreenCape has grown to a multi-disciplinary team of over 40 staff members, covering finance, engineering, environmental science and economics. We have facilitated and supported R13.7 billion of investments in renewable energy projects and manufacturing. From these investments, more than 10 000 jobs have been created.
Our Market Intelligence Reports form part of a working body of information generated by sector desks and projects within GreenCape’s three main programmes – energy, waste and resources. Figure 17 below shows the different focus areas within each of our programmes.
More about GreenCape’s work in the agriculture sectorThe green economy is a dynamic space and opportunities may be limited by legislation and policy, and a lack of credible market information, funding and skills. GreenCape’s agriculture team works to understand these shifting dynamics to provide useful and relevant support. We provide all our stakeholders with relevant market information on sustainable agriculture, with a focus on the Western Cape.
The agriculture team also help farmers reduce their input costs and environmental impacts by providing advice on the uptake of green technologies, better efficiencies and on sustainable farming practises. We also link farmers, investors and suppliers so that farmers have access to expert advice and the right equipment and to help develop the market for green technologies. For investors and suppliers that receive support from GreenCape, this means access to a growing market in the province’s agricultural sector. We also engage with farmers through means such as the recently launched “GreenAgri” website (www.greenagri.org.za) that provides essential information to make informed investment decisions.
GreenCape is a non-profit organisation that was established by the Western Cape Government and City of Cape Town to support the accelerated development of the local green economy – low carbon, resource efficient and socially inclusive – and help position the Western Cape as the green
economic hub of Africa.
Agriculture: Market Intelligence Report 2016 49

1
5
6 2
4
Our focus areas
3Reduced
WA
STE
Cle
an &
Effic
ient
EN
ERG
Y
Sustainableuse of naturalRESOURCES
Western Cape Industrial Symbiosis Programme (WISP)
Free facilitation service that networks companies to exchange under-utilised resources (materials, energy, assets, logistics and expertise).
Water
Water provision and economic development; greentech opportunities for water use efficiency, treatment and reuse.
Agriculture and Bio-Based Value Chains
Sustainable agriculture, valorisation of wastes to high value bio-products, including bio-energy.
Renewable Energy
Utility-scale projects, small-scale embedded generation, and localisation of component manufacture.
Energy Efficiency
Energy efficient buildings and equipment, demand side management and financing contracting models.
Alternative Waste Treatment
Municipal decision-making and policy and legislative tools on alternative waste treatment options; small-scale biogas, recycling and reuse (dry recyclables, construction and demolition waste).
1
2
3
4
5
6
Benefits of becoming a GreenCape memberWe currently have over 600 members, and offer free membership. Becoming a member of GreenCape will give you access to the latest information regarding developments in the various sectors; access to tools, reports, and project information; and offer you the
opportunity – through our networking events – to meet and interact with various stakeholders in the green economy.
To register as a member, please visit our website, www.greencape.co.za
Figure 17: GreenCape’s focus areas
50 Agriculture: Market Intelligence Report 2016

Appendix A: Key role players
Opportunity Company
Biological control Agro Organics Agriculture
Agro-Hytech
Cannon Pest Control
Eagle Eye
Ecolab Ltd
FruitFly Africa
Conservation agriculture Equalizer
Monosem
Piketberg Implements
Rovic Leers
Valtrac
Energy EnerGworx
MLT Drives
Renenergy
Renewable energy design
Solairedirect
Sustainable Power Solutions
Precision agriculture Aerobotics
Aerovision
Agri-Solutions
Agrista
Crosscape Precision
DFM Software Solutions
Effective Farming Solutions
EnviroMon
IrriCheck
Government departments Agriculture, Forestry and Fisheries
Economic Development and Tourism
Energy
Environmental Affairs and Development Planning
Home Affairs
Human Settlements
Labour
Mineral Resources
Table 14: Key role players
Agriculture: Market Intelligence Report 2016 51

Public Works
Rural Development and Land Reform
Science and Technology
Small Business Development
Statistics South Africa
Trade and Industry
Transport
Water and Sanitation
Western Cape Department of Agriculture
Industry associations Agri Western Cape
Bureau for Food and Agricultural Policy (BFAP)
Biodynamic Association of South Africa (BDAASA)
Blue North
Cape Nature
Cape Agency for Sustainable Integrated Development in Rural Areas (Casidra)
Citrus Growers Association of SA (CGA)
Confronting Climate Change (CCC)
Endangered Wildlife Trust (EWT)
Grain SA
Green Choice Alliance
HORTGRO
Milk Producers Association (MPO)
National Wool Growers Association (NWGA)
National Energy Regulator South Africa (NERSA)
No-Till Association of the Western Cape
No-Till Club of KwaZulu-Natal
Potato SA
Protea Producers Association of SA (PPSA)
Red Meat Abattoir Association (RMAA)
Red Meat Producers Asociation (RPO)
SA Bee Industry Organisation (SABIO)
SA Flower Growers Association (SAFGA)
SA Fruit & Vegetable Canners Association (SAFVCA)
SA Fruit Juice Association (SAFJA)
SA Honeybush Tea Association (SAHTA)
52 Agriculture: Market Intelligence Report 2016

SA Olive Industry Association (SAOLIVE)
SA Olive Industry Association (SAOLIVE)
SA Pork Producers Association (SAPPO)
SA Poultry Association (SAPA)
SA Rooibos Council (SARC)
SA Table Grape Association (SATI)
SA Wine Industry Trust (SAWIT)
Southern African Wildlife Management Association (SAWMA)
South African Milk Processors' Organization (SAMPRO)
South African Mohair Growers Association (SAMGA)
VinPro
Winetech
Research institutions and universities
Agriculture Research Institute (ARC)
Bureau for Food and Agricultural Policy (BFAP)
Blue North
Cape Nature
Cape Peninsula University of Technology (CPUT)
Confronting Climate Change (CCC)
Council for Scientific and Industrial Research (CSIR)
Green Choice Alliance
University of the Western Cape’s Institute for Poverty, Land and Agrarian Studies (PLAAS)
South African National Biodiversity Institute (SANBI)
Southern African Wildlife Management Association (SAWMA)
University of Cape Town
Stellenbosch University
World Wildlife Fund (WWF)
University of Cape Town
Stellenbosch University
University of the Western Cape
World Wildlife Fund (WWF)
Agriculture: Market Intelligence Report 2016 53
8– References
Agriculture Policy Action Plan (APAP) 2014. Avail-able from: <http://www.agrisa.co.za/wp-content/up-loads/2014/10/011-APAP-Agri-SA.pdf> Accessed on 14 December 2015].
Agriculture Research Coun-cil.2014. Guideline production of small grains in the winter rainfall area, 2014. Avail-able from: <http://www.arc.agric.za/arcsgi/Product%20Catalogue%20Library/Guide-line%20for%20production%20of%20small%20grains%20in%20the%20winter%20rain-fall%20area.pdf>. [17 July 2015].
Basson, F.C. 2015. Re: cape farm mapper info. E-mail from F. Basson ([email protected]) to J. Geyer ([email protected]), 26 August.
BCC Research 2014. Global Markets for Biopesticides. Available from: <http://www.bccresearch.com/market-re-search/chemicals/biopesti-cides-chm029e.html Accessed on> [15 December 2015].
Blignaut, J.N., De Wit, M.P., Knot, J., Midgley, S., Crookes, D.J., Drimie, S. & Nkam-bule, N.P. 2014. Sustainable agriculture: A viable option for enhanced food and nutrition-al security and a sustainable productive resource base in South Africa: An investigation. Baseline Review. Prepared for the Development Bank South-ern Africa. Pretoria: ASSET Research.
Boye Joyce, Areand Yves 2013. Current Trends in Green Technologies in Food Production and Processing. Available from: < http://link.springer.com/arti-cle/10.1007%2Fs12393-012-9062-z#page-1> [Accessed 29 October 2015].
Chehore, Thembie 2014. South Africa: Electricity pric-ing paralysing the poor, 18 September. Available from: <http://www.ee.co.za/article/south-africa-electricity-pric-ing-paralysing-poor.html> [Accessed 8 October 2015].
Conservation of Agriculture Resources Act, 1983 (Act No. 43 of 1983). Available from: <http://www.nda.agric.za/docs/act43/eng.htm> Ac-cessed on [http://www.nda.agric.za/docs/act43/eng.htm].
Creamer, Terence 2015. Cape biogas power plant breaches 1.5 GWh milestone, but far more possible. Engi-neering News, 14 August. Available from: <http://www.engineeringnews.co.za/article/cape-biogas-power-plant-breaches-15-gwh-mile-stone-but-far-more-possi-ble-2015-08-14> [Accessed 21 September 2015].
Department: The Presiden-cy 2012. Integrated Growth and Development Plan (IGDP 2012). Available from: <http://www.daff.gov.za/docs/Policy/IGDP121.pdf> accessed [14 December 2015].
Department: The Presidency 2012. National Development Plan (NDP) 2030 Out Future make – make it work – Execu-tive Summary. Available from: <http://www.gov.za/sites/www.gov.za/files/Executive%20Summary-NDP%202030%20-%20Our%20future%20-%20make%20it%20work.pdf> Ac-cessed [14 December 2015].
Department of Agriculture 2015. Fruitlook 2014-15 Sum-mary Report. Western Cape, South African Government.
Department of Agriculture Forestry and Fisheries (DAFF) 2013a. Abstract of Agricultural Statistics. Republic of South Africa.
Department of Agriculture Forestry and Fisheries (DAFF) 2013b. Economic Review of South African Agriculture. Available from: <http://www.nda.agric.za/docs/statsinfo/EcoReview1213.pdf > [Ac-cessed 14 September 2015].
Department of Agriculture, Forestry and Fisheries (DAFF) 2014. The Agriculture Hand-book for South Africa 2013/14. Republic of South Africa.
Department of Energy 2015a. Tariffs and Charges. Available from http://www.eskom.co.za/CustomerCare/TariffsAnd-Charges/Pages/Tariffs_And_Charges.aspx [Accessed on 8 October 2015].
54 Agriculture: Market Intelligence Report 2016
Department of Energy 2015b. Biogas Overview. Available from http://www.energy.gov.za/files/biogas/presenta-tions/2013-NBC/2013-Over-view-of-biogas-mar-ket-in-South-Africa.pdf [Accessed on 23 September 205].
Department of Trade and Industry (dti) 2015. Industrial Development Financial Assis-tance (Incentives). Available from: <https://www.thedti.gov.za/financial_assistance/finan-cial_incentive.jsp?id=59&sub-themeid=25> [Accessed on 10/11/2015]
Department of Water Affairs 2013. National Water Re-source Strategy: Water for an Equitable and Sustainable Future. Available from <http://cer.org.za/wp-content/up-loads/2013/07/NWRS2-Final-email-version.pdf> [Accessed on 13 October 2015].
Derpsch Rolf, Friedrich Theo-dor , Kassam Amir , Hongwen Li 2010. Current status of adoption of no-till farming in the world and some of its main benefits. Int J Agric & Biol Eng Vol. 3 No.1. Available from: <http://www.fao.org/ag/ca/CA-publications/China_IJABE.pdf> Accessed on [4 Augustus 2015].
Drone News Update 2015. Re: SACAA comments on RPAS legislation. E-mail from Drone News Update ([email protected]) to J. Geyer ([email protected]), 18 September.
ESI Africa 2013. Ceres installs largest agricultural sector rooftop PV system in SA. ESI Africa, 7 August. Available from: <http://www.esi-africa.com/ceres-in-stalls-largest-agricultural-sec-tor-rooftop-pv-system-in-sa/> [Accessed 25 August 2015].
Energy Efficient Packhouse and Cold Stores (EEPACS) 2012. A benchmark study of energy usage in export fruit production, packhouse and cold store operations. Avail-able from: <http://eepacs.co.za/Content/Downloads/Benchmarking.pdf> [Accessed 12 August 2015].
Erasmus, Denene 2013. Solar energy use on the rise in SA. Farmer's Weekly, 09 Septem-ber. Available from: <http://www.farmersweekly.co.za/arti-cle.aspx?id=44593&h=Solar-energy-use--on-the-rise-in-SA> [Accessed 27 August 2015].
Eskom 2015. Megaflex Gen and Ruraflex Gen. Available from: <http://www.eskom.co.za/CustomerCare/TariffsAnd-Charges/WhatsNew/Pages/Genflex.aspx> [Accessed 16 November 2015].
Food and Agriculture Or-ganisation (FAO) n.d. What is happening to agrobio-diversity? FAO. Available from: http://www.fao.org/docrep/007/y5609e/y5609e02.htm [Accessed on 11 Novem-ber 2015].
Green Business Guide 2013. Environmental financial incentives in South Africa. Available from <http://www.greenbusinessguide.co.za/environmental-financial-incen-tives-in-south-africa-2013/> [Accessed 21 October 2015].
Hancock, Tracy 2015. Nedbank offers SA farmers financial in-centive to convert to solar and alternative energy. Engineering News, 29 July. Available from: <http://www.engineeringnews.co.za/article/nedbank-of-fers-sa-farmers-financial-incen-tive-to-convert-to-solar-and-al-ternative-energy-2015-07-29/searchString:nedbank+solar> [Accessed 20 August 2015].
Hortgro Science 2015. Hortgro Crop Protection Seminar 2015. Available from: <http://www.hortgro-science.co.za/wp-content/uploads/2015/09/CROP-PROTECTION-Semi-nar-BLURB.pdf> [Accessed on 14 December 2015].
Jooste, Kristy 2014. Greener future for Stellenpak with solar power. Cape Business News, 18 December. Available from: <http://www.cbn.co.za/news/services/power-solutions-en-ergy-efficiency/greener-fu-ture-for-stellenpak-with-so-lar-power.html> [Accessed 25 August 2015].
Koos Bouwer Consulting 2014. Fruit and vegetable farm. Available from: <http://kbcin-dustrial.co.za/fruit-and-veg-etable-farm/> [Accessed 12 August 2015].
Agriculture: Market Intelligence Report 2016 55

Knott, Stuart C 2015. An analy-sis of the financial implications of different tillage systems within different crop rotations in the Swartland area of the Western Cape, South Africa. MSc (Agric) thesis, Stellen-bosch University, South Africa.
Lourensford 2014. Lourensford launched massive Solar instal-lation. Lourensford, 1 October. Available from: <http://www.lourensford.co.za/Gallery.aspx?ALBUMID=1396&CLIEN-TID=4777&Title=> [Accessed 25 August 2015].
Mavuso, Zandile 2015. Uncer-tain load-shedding schedules prove costly for food pro-duction. Engineering News, 21 August. Available from: <http://www.engineeringnews.co.za/article/uncertain-load-shedding-schedules-prove-costly-for-food-production-in-the-country-2015-08-14/searchString:load+shedding+-dairy> [Accessed 27 August 2015].
MIT Technology Review 2014. Agricultural Drones. Available from: <http://www.technologyreview.com/fea-turedstory/526491/agricultur-al-drones/> [Accessed 22 July 2015].
National Energy Regulator of South Africa (NERSA) 2015. National Energy Regulator of South Africa (NERSA). Avail-able from <http://www.nersa.org.za/> [Accessed 4 August 2015].
National Water Act (NWA) 1998. Available from: http://www.dwaf.gov.za/Documents/Legislature/nw_act/NWA.pdf [Accessed 14 December 2015].
Nedbank 2013. Is bigger really better for South African agriculture?, 9 April. Available from <http://blog.nedbank-capital.co.za/index.php/is-big-ger-really-better-for-south-afri-can-agriculture/> [Accessed on October 29 2015].
Nick Yell 2014. Fruit facility turns to the sun for cold stor-age power. RED Engineering, 25 February. Available from: <http://www.redengineering.co.za/RedEngWeb/down-loads/press/20140225_TWK_Gazettte_RED_Engineering.pdf> [Accessed 25 August 2015].
Partdrige Andrew, Cloete-Beets Leann, Barends Vanessa 2014. The Effect of a Carbon Tax on Agriculture: An Impact Assessment of South Africa’s Proposed Carbon Tax with an Application to the South African Agricultural Sector. Western Cape, Republic of South Africa, Department of Agriculture.
Power Quality & Renewable Services 2015. S.A Solar PV List. Available from: <http://pqrs.co.za/> [Accessed 13 November 2015].
Provincial Treasury 2013. Pro-vincial Economic Review and Outlook 2013. Available from: https://www.westerncape.gov.za/assets/departments/treasury/Documents/2013_pero_to_printers_11_octo-ber_2013_final.pdf [Accessed on 19 November 2015].
Quinn L.P., de Vos B.J., Fer-nandes-Whaley M., Roos C., H. Bouwman. Kylin H., Pieters R. & van den Berg J. (2011). Pes-ticide Use in South Africa: One of the Largest Importers of Pesticides in Africa. Available from: <https://www.environ-ment.gov.za/sites/default/files/docs/pesticide_usein_sa.pdf> [Accessed 2 October 2015].
Radmore, Jack 2015. Re: infor-mation on SSEG. E-mail from J. Radmore ([email protected]) to J. Geyer ([email protected]), 19 August.
Rooibos Limited. Rooibos Ltd cuts costs with solar panels. Available from: <http://www.rooibosltd.co.za/rooibos-cuts-costs-with-solar-panels.php> [Accessed 25 August 2015].
Safe Drone 2015. Operat-ing Drones in South Africa. Available from: <http://www.safedrone.co.za/> [Accessed 22 July 2015].
Statistics South Africa. Census of Commercial Agriculture 2008. Available from: <http://www.statssa.gov.za> [Accessed 26 November 2015].
56 Agriculture: Market Intelligence Report 2016

Steenkamp, Elise-Marie 2015. Biogass Developments in South Africa, 14 February. Available from: http://www.hortgro-science.co.za/bio-gas-developments-in-south-af-rica/ [Accessed 27 November 2015].
Stotko, Oliver 2015. Re: green-agri. E-mail from O. Stotko ([email protected]) to J. Geyer ([email protected]), 10 November.
Strategic Plan for the Depart-ment of Agriculture, Forest-ry and Fisheries (SPDAFF 2013/14 – 2017/18. Available from: <http://www.daff.gov.za/doaDev/topMenu/DAFF%20Strategic%20Plan%202013.pdf> Accessed on 14 Decem-ber 2015].
Talk Radio 702 2015. South Africa my face inadequate water supply by 2025 says CSIR. Available from <http://www.702.co.za/articles/4261/sa-may-face-inadequate-wa-ter-supply-by-2025-says-csir> [Accessed on 7 November 2015].
The World Bank 2013. Arable Land (hectares per person). Available from <http://data.worldbank.org/indicator/AG.LND.ARBL.HA.PC> [Ac-cessed 26 November 2015].Tshehla, Maloba. 2015. Renew-able Energy at the local level. [PowerPoint slides]. Presented at East African Power Industry Convention.
United Nations 2009. Food Production Must Double by 2050 to Meet Demand from World’s Growing Population, Innovative Strategies Needed to Combat Hunger, Experts Tell Second Committee. Avail-able from <http://www.un.org/press/en/2009/gaef3242.doc.htm> [Accessed on 26 Novem-ber 2015].
Wallace, Mike 2015. Re: Map of Homogeneous Farming Areas. Email from M. Wallace ([email protected]) to I. Kuschke ([email protected]), 1 December.
Water Services Act, 1997. Available from: <http://www.gov.za/sites/www.gov.za/files/36958_rg10040_gon813.pdf> Accessed on [14 Decem-ber 2014].
WCDoA & WCDEA & DP 2015. A Status Quo Review of Climate Change and the Agri-culture Sector of the Western Cape Province. Chapter 1: Introduction. Available from <http://acdi.uct.ac.za/sites/de-fault/files/filesattached/Smar-tAgri%20Review%20Ch1%20Ch2%20Introduction%20%26%20background.pdf> [Ac-cessed on 5 October 2015].
Wesgro 2014. Overview of the Western Cape. Available from: <https://www.westerncape.gov.za/sites/www.westerncape.gov.za/files/wesgro_-_over-view-of-the-western-cape.pdf> [Accessed on 7 November 2015].
White Paper on South Afri-can Land Policy April 1997. Available from: <http://www.gov.za/sites/www.gov.za/files/whitepaperlandreform.pdf> Accessed on [14 December 2015].
WWF 2010. Agriculture: Facts &Trends South Africa. Avail-able from: <http://awsassets.wwf.org.za/downloads/facts_brochure_mockup_04_b.pdf> [Accessed on 5 October 2015].
Agriculture: Market Intelligence Report 2016 57

Aquarista 2014. Cape Town water demand below peak level. Available from <http://www.capewatersolutions.co.za/tag/water-scarcity/> [Accessed on 24 September 2015].Department of Energy 2015. National Biogas Conferences. Available from: <http://www.energy.gov.za/> [Accessed 15 September 2015].
Du Preez, Willem 2015. Effective exploitation of the real value of biogas gener-ated electricity due to its full dispatchability. South African Biogas Industry Association. Available from: <http://bio-gasassociation.co.za/website/wp-content/uploads/2015/03/Presentation-to-2nd-Nation-al-Biogas-Conference-2015.pdf> [Accessed 23 September 2015].
Farmer’s Weekly 2014. No-till in SA – The message spreads, 10 Augustus. Available from: <http://www.farmersweekly.co.za/article.aspx?id=65368&h=-No-till-in-SA---The-message-spreads>. [Accessed on 15 July 2015].
Food and Agriculture Organ-isation (FOA) of the United Nations. 2009 Scaling up conservation agriculture in Afri-ca: Strategy and approaches,. Available from: <http://www.fao.org/ag/ca/doc/conserva-tion.pdf>. [21 July 2015].
Genis, Amelia 2015. Droogte kring uit na plaaslike ekon-omieë. Landbouweekblad, 7 October. Available from: <http://landbou.com/nuus/droogte-kring-uit-na-plaaslike-ekonomiee/> [Accessed on 7 October 2015].
Goslin Melanie & Moolla Yusuf 2011. South Africa’s ever-shrinking farmers, 21 October. Available from: <http://www.iol.co.za/mercury/south-africa-s-ever-shrink-ing-farmers-1.1167943#.Vk7KN3YrK1s> [Accessed on 6 November 2015].
GreenAgri. Agriculture and Conservation.n.d. Available from: < http://www.greenagri.org.za/action-plans-and-poli-cies/national/conservation/> [Accessed on 5 October 2015].
MD Accountants and auditors 2015. 2014/2015 South African Tax Guide. Available from: < http://www.mdacc.co.za/wp-content/uploads/2015/03/Tax-Guide-2014-2015.pdf> [Accessed on 2 September 2015].
SAinfo 2012. South African agriculture. Available from: <http://www.southafrica.info/business/economy/sectors/ag-ricultural-sector.htm#.Vk7CjXY-rK1t> [Accessed on 8 October 2015].
SANEDI 2013. 12L EE TAX In-centive. Available from: http://www.sanedi.org.za/12l-ee-tax-incentive/ [Accessed on 2 September 2015].
Trading Economics. n.d. Research and development ex-penditure (% of GDP) in South Africa. Available from: < http://www.tradingeconomics.com/> [Accessed on 5 November 2015].
UNEP 2013. Green Economy and Trade: Agriculture. Avail-able from <http://www.unep.org/greeneconomy/Portals/88/GETReport/pdf/Chapitre%202%20Agriculture.pdf> [Ac-cessed 4 November 2015].
Bibliography/further reading
58 Agriculture: Market Intelligence Report 2016

Agriculture: Market Intelligence Report 2016 59


![L Benke - Counterfeit Pesticides on the Hungarian Market [Kompatibilitätsmodus]](https://static.fdocuments.us/doc/165x107/55cf8ea7550346703b9442b5/l-benke-counterfeit-pesticides-on-the-hungarian-market-kompatibilitaetsmodus.jpg)


