Water 2017 Market Intelligence Report - GreenCape · Water services market value chain 21 ... IV...
52
Water – 2017 Market Intelligence Report –
Transcript of Water 2017 Market Intelligence Report - GreenCape · Water services market value chain 21 ... IV...

Water – 2017Market Intelligence Report–

18 Roeland Street, Cape Town, 8001, South Africa
Editorial and review: Salomé Bronkhorst, Claire Pengelly, Helen SeylerImages: Raymond Siebrits, GreenCapeLayout and design: Deep Agency
GreenCapeGreenCape is a non-profit organisation that drives the widespread adoption of economically viable green economy solutions from the Western Cape. Our vision is for South Africa to be the green economic hub of Africa.
We work with businesses, investors, academia and government to help unlock the investment and employment potential of green technologies and services, and to support a transition to a resilient green economy.
AcknowledgmentsWe thank Raymond Siebrits and Bridget Fundikwa for the time and effort that went into compiling this Market Intelligence Report (MIR).
DisclaimerWhile every attempt was made to ensure that the information published in this report is accurate, no responsibility is acceptedfor any loss or damage that may arise out of the reliance of any person or entity upon any of the information contained in this report.
GreenCape does not endorse or directly support any one company, brand or enterprise. We provide free market intelligence, an advocacy platform and networking opportunities for all our stakeholders across several sectors.
Copyright © GreenCape 2017
This document may be downloaded at no charge from www.greencape.co.za. All rights reserved.
Subscribe to receive e-mail alerts or GreenCape news, events and publications by registering as a member on our website: www.greencape.co.za.
Image courtesy of: Western Cape Department of Agriculture
Water: Market Intelligence Report 2017Water: Market Intelligence Report 2017 IIIII

List of figures VList of tables VIList of acronyms and abbreviations VIIExecutive summary 101. Introduction and purpose 122. Sector overview 14
2.1. South African context 142.2. Use by sector 152.3. Western Cape context 182.4. Key private sector players 212.5.Drought and agriculture 22
3. Policies, regulation and programmes 243.1. Laws and management 243.2. Water services authorities 283.3. Water pricing 283.4. DWS drop programmes 293.5. Demand management 29
4. Opportunities 314.1. Industrial water reuse, recycling and resource recovery 334.2. Water and energy 384.3. Smart water use 424.4. Water-sensitive design for rain, greywater and stormwater harvesting 464.5. Groundwater and managed aquifer recharge 494.6. Desalination 524.7. Reducing municipal non-revenue water 54
5. Funding and incentives 575.1. Market activity 575.2. Green Finance Database 575.3. Manufacturing incentives and the Atlantis Greentech Special Economic Zone 62
6. The Western Cape: Africa’s green economy hub 647. GreenCape’s support to businesses and investors 688. References 709. Appendices* 73
9.1. Appendix A: List of drought, climate monitoring and forecasting resources 739.2. Appendix B: The business of Water Services Authorities (WSAs) 759.3. Appendix C: Water pricing 789.4. Appendix D: DWS Drop Programmes 799.5. Appendix E: Potable reuse barriers 809.6. Appendix F: Reuse technology types 89.7. Appendix G: Private sector risk, tools, and stewardship 89.8. Appendix H: Energy use in municipal water services 99.9. Appendix I: Smart water applications 99.10. Appendix J: Decentralised domestic wastewater treatment 99.11. Appendix K: Efficient water use beyond the meter 99.12. Appendix L: Desalination projects in South Africa and Australia 9
Contents List of figuresFigure 1Water value chain 12Figure 2Water stress by country in 2040 14Figure 3South Africa’s strategic Water Source Areas 15Figure 4South Africa’s water resources by numbers 16Figure 5Financial value of water sales by sector 17Figure 6Water use in South Africa by sector 17Figure 7Water use by type for the two Western Cape water management areas 17Figure 8Overview of WCWSS allocations by type 18Figure 9WCWSS planning scenario reconciliation of supply and demand 19Figure 10Water services market value chain 21Figure 11Key water governance and management organisations in South Africa 26Figure 12Designated catchment management agencies in South Africa 2Figure 13Strategic focus of the National Water Resources Strategy 2 28Figure 14Tariffs and charges along the water value chain 29Figure 15City of Cape Town 2016/17 domestic potable water tariffs 30Figure 16City of Cape Town 2016/17 domestic sanitation tariffs 30Figure 17Green economy opportunities along the water value chain 31Figure 182016/17 City of Cape Town industrial water tariffs 35Figure 19Costs related to industrial water risks 36Figure 20Interdependencies between water and energy 38Figure 21Average electricity prices 2006-2018 (c/kWh) 39Figure 22Cellular water meter market in the USA 42Figure 23Results screenshot from the rainwater harvesting toolkit 47
* Available only in the electronic version of this report, available on our website, www.greencape.co.za/market-intelligence
Water: Market Intelligence Report 2017Water: Market Intelligence Report 2017 VIV
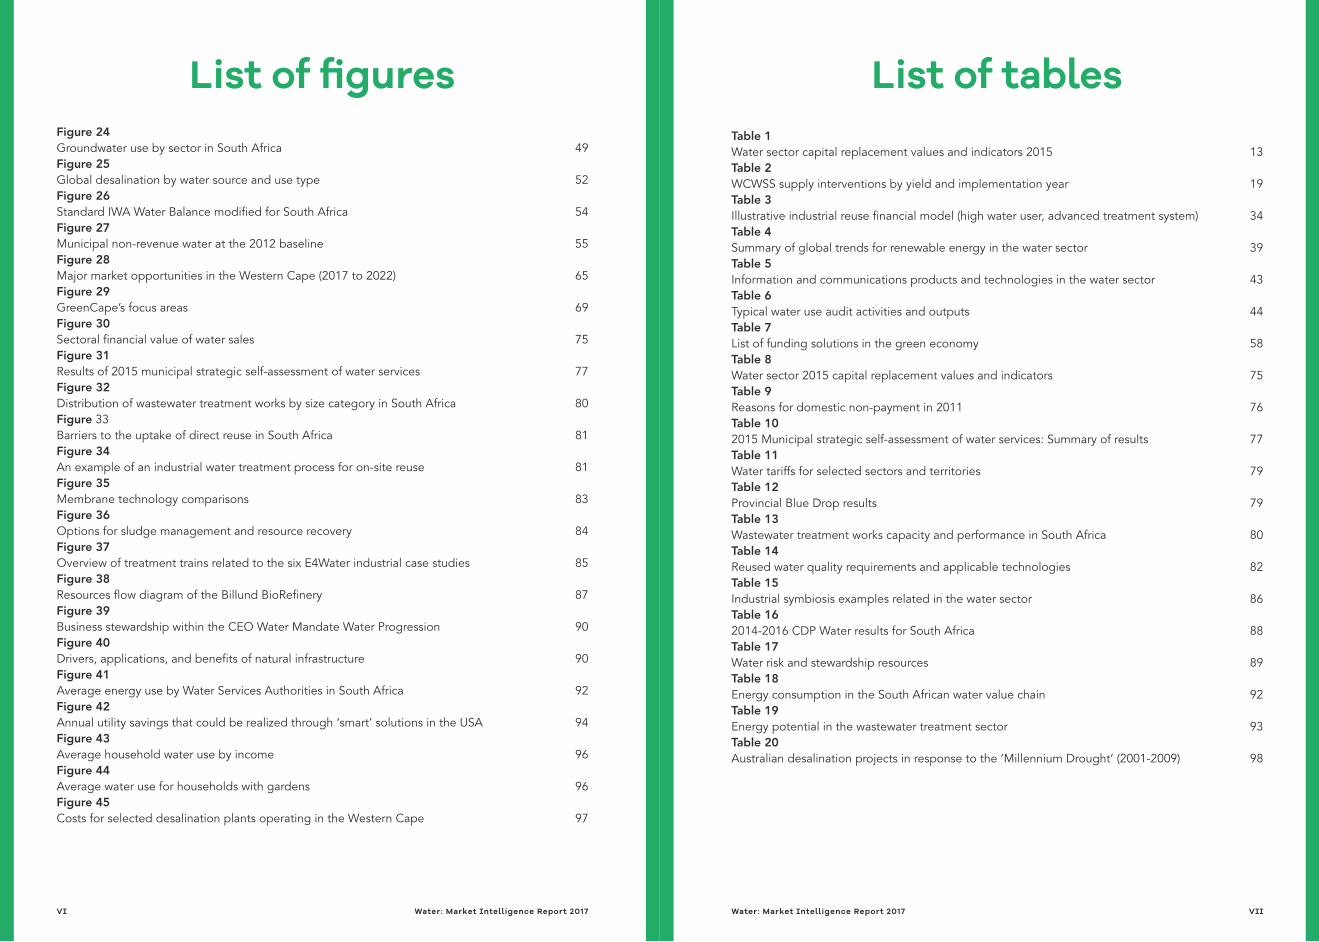
Figure 24Groundwater use by sector in South Africa 49Figure 25Global desalination by water source and use type 52Figure 26Standard IWA Water Balance modified for South Africa 54Figure 27Municipal non-revenue water at the 2012 baseline 55Figure 28Major market opportunities in the Western Cape (2017 to 2022) 6Figure 29GreenCape’s focus areas 69Figure 30Sectoral financial value of water sales 75Figure 31Results of 2015 municipal strategic self-assessment of water services 77Figure 32Distribution of wastewater treatment works by size category in South Africa 80Figure 33Barriers to the uptake of direct reuse in South Africa 81Figure 34An example of an industrial water treatment process for on-site reuse 81Figure 35Membrane technology comparisons 83Figure 36Options for sludge management and resource recovery 84Figure 37Overview of treatment trains related to the six E4Water industrial case studies 85Figure 38Resources flow diagram of the Billund BioRefinery 87Figure 39Business stewardship within the CEO Water Mandate Water Progression 90Figure 40Drivers, applications, and benefits of natural infrastructure 90Figure 41Average energy use by Water Services Authorities in South Africa 92Figure 42Annual utility savings that could be realized through ‘smart’ solutions in the USA 94Figure 43Average household water use by income 96Figure 44Average water use for households with gardens 96Figure 45Costs for selected desalination plants operating in the Western Cape 97
Table 1Water sector capital replacement values and indicators 2015 13Table 2WCWSS supply interventions by yield and implementation year 19Table 3Illustrative industrial reuse financial model (high water user, advanced treatment system) 34Table 4Summary of global trends for renewable energy in the water sector 39Table 5Information and communications products and technologies in the water sector 43Table 6Typical water use audit activities and outputs 44Table 7List of funding solutions in the green economy 58Table 8Water sector 2015 capital replacement values and indicators 75Table 9Reasons for domestic non-payment in 2011 76Table 102015 Municipal strategic self-assessment of water services: Summary of results 77Table 11Water tariffs for selected sectors and territories 79Table 12Provincial Blue Drop results 79Table 13Wastewater treatment works capacity and performance in South Africa 80Table 14Reused water quality requirements and applicable technologies 82Table 15Industrial symbiosis examples related in the water sector 86Table 162014-2016 CDP Water results for South Africa 88Table 17Water risk and stewardship resources 89Table 18Energy consumption in the South African water value chain 92Table 19Energy potential in the wastewater treatment sector 93Table 20Australian desalination projects in response to the ‘Millennium Drought’ (2001-2009) 98
List of figures List of tables
Water: Market Intelligence Report 2017Water: Market Intelligence Report 2017 VIIVI

BOO Build-own-operate modelCMA Catchment Management AgencyCoCT City of Cape TownDBO Design, build, operate modelDWS Department of Water and SanitationEPC Engineering Procurement Contractors ESCO Energy Service Companykl Kilolitre (1000 litres)m3 Cubic meter (equivalent to 1000 litres)Ml Megalitre (1000 x1000 or 1 million litres)NRW Non-revenue water SEZ Special economic zoneSIPS Strategic infrastructure projectWaSCo (sometimes WETCo) Water Service CompanyWC/WDM Water conservation and water demand managementWCWSS Western Cape Water Supply SystemWMA Water management areasWPC Water Performance Contracting WRC Water Research CommissionWSA Water services authorityWSC Water Supply ContractingWSD Water-sensitive designWSP Water service providerWUA Water user association
List of acronyms and abbreviations
Water: Market Intelligence Report 2017Water: Market Intelligence Report 2017VIII

The GreenCape 2017 Water MIR highlights business opportunities for water in the Western Cape’s green economy. It is aimed at investors and entrepreneurs
with an interest in the business of water.
Executive summary
The biggest drivers behind the uptake of green water technologies and practices in South African are rising water resource and utility costs; growing resource scarcity (intensified by environmental change); increased business risks and compliance requirements; and increasing consumer demand for more sustainable and environmentally sensitive products.
Every year, South Africa uses approximately 15 billion m3 from natural resources. If development trends continue, population growth and business expansion will leave a 1-3 billion m3, or a 7-22%, water deficit per year by 2030, depending on which new supply systems are developed (WWF-SA 2016).
These challenges, combined with the declining cost of new technologies, tax and other incentives, make it economically feasible for water users to adopt certain green technologies, especially those that improve resource and productive efficiencies and encourage recycling. This, in turn, creates opportunities for investors and businesses in the green water sector.
On average, drinking water costs R7.50 per m3, making the total addressable market for unlocking water resources worth between R7.5 and R22.5 billion per year (GreenCape analysis).
OpportunitiesDuring our engagement with stakeholders in water technology, management and use along with other areas of the green economy, we identified several opportunities. These include:
■ Water reuse, recycling and resource recovery is becoming increasingly understood and adopted, especially by water-intensive industrial and commercial users. Advanced treatment technologies are developing rapidly, while increased competition and demand are providing more solutions that make business sense. There are opportunities for the manufacture, assembly and supply of treatment and reuse components and systems; and in services and products related to industrial symbiosis.
■ Energy used for water treatment and conveyance, and water used for energy generation present many opportunities for innovation and investment. Drivers include growing challenges to water and energy security; developments in renewable energy technology; and the rising cost of water and energy.
■ Understanding and managing consumption by utilities and end-users is the vital first step towards holistic water conservation and demand management. There is a rapidly expanding market for technical solutions that measure, report and control water consumption at all scales of use.
■ Regional surface water resources are almost fully allocated, driving investments into development of local water resources. These include rain, storm and greywater; new groundwater resources; managed aquifer recharge; as well as brackish and seawater desalination.
■ Reducing municipal water losses is a national priority, and significant resource and financial benefits can be realised at any urban and system scale.
General barriers to the uptake of green technologies in the South African water sector include:
■ A lack of awareness about the importance and business benefits of efficient water use and reuse.
■ Regulatory hurdles that include the slow pace of municipal procurement; and the difficulty that public-private-partnerships face in structuring long-term agreements, such as water offtakes from private systems.
■ Insufficient support for water users to access information and advice on best practice.
■ Capital requirements to invest in new green infrastructure, where water is often under-priced.
■ Technical capacity, especially in municipalities, to design and implement new systems for water saving or advanced treatment.
■ Lack of funding for research into and pilot development of new technology.
—On average, drinking water costs R7.50 per m3, making the total addressable market for unlocking water resources worth betweenR7.5 and R22.5 billion per year.
—The market for industrial water reuse in the Western Cape is R600 million and is expected to grow rapidly.
—The direct potable municipal reuse market is estimated at R4.5 billion in the Western Cape.
—In 2016 94% of companies reported water as a direct risk to their operations (the highest in the world).
Water: Market Intelligence Report 2017 1110 Water: Market Intelligence Report 2017
1 –Introduction and purpose
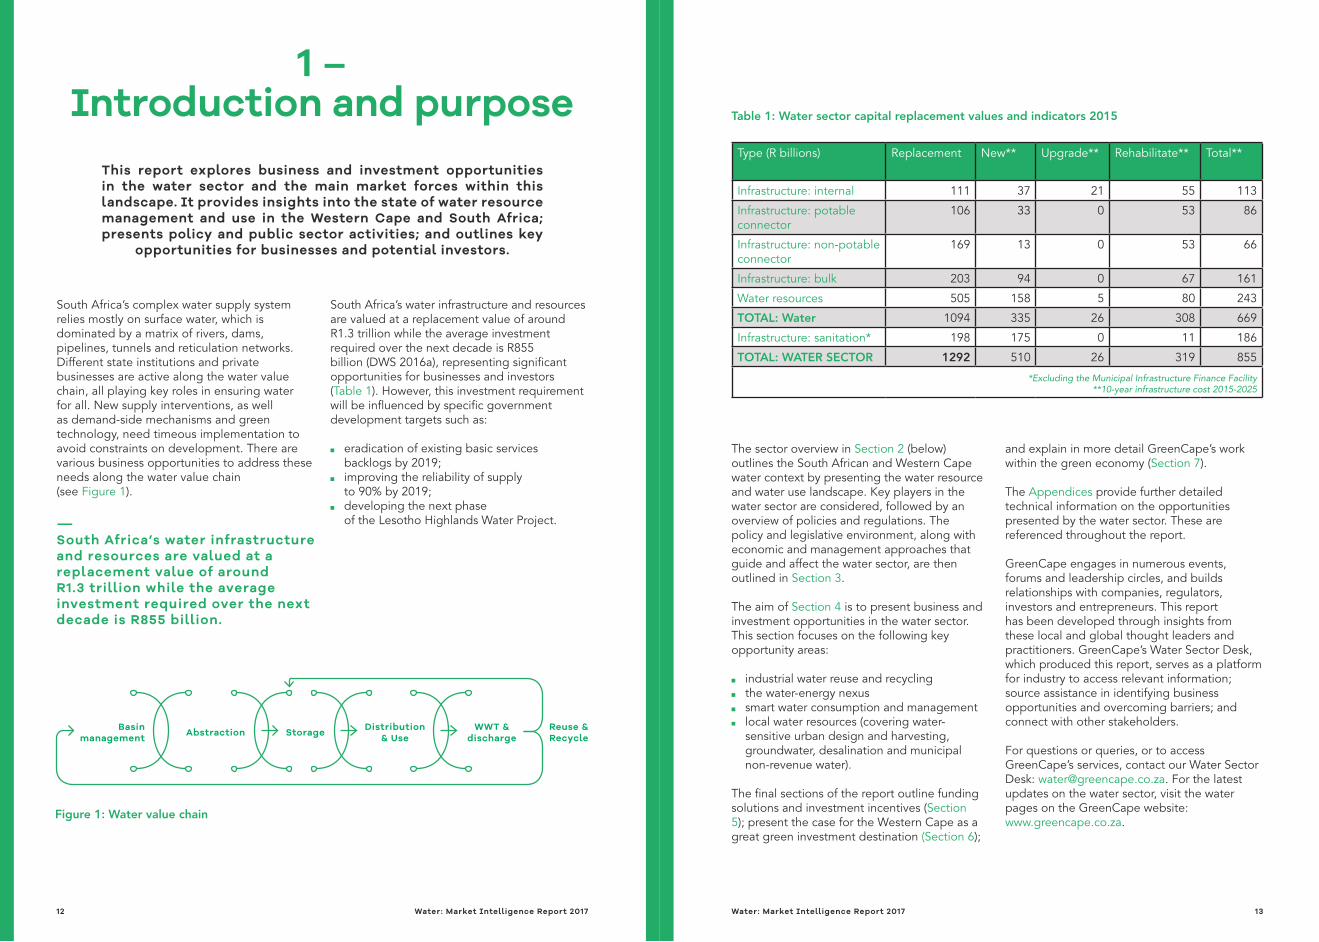
South Africa’s complex water supply system relies mostly on surface water, which is dominated by a matrix of rivers, dams, pipelines, tunnels and reticulation networks. Different state institutions and private businesses are active along the water value chain, all playing key roles in ensuring water for all. New supply interventions, as well as demand-side mechanisms and green technology, need timeous implementation to avoid constraints on development. There are various business opportunities to address these needs along the water value chain (see Figure 1).
—South Africa’s water infrastructure and resources are valued at a replacement value of around R1.3 trillion while the average investment required over the next decade is R855 billion.
South Africa’s water infrastructure and resources are valued at a replacement value of around R1.3 trillion while the average investment required over the next decade is R855 billion (DWS 2016a), representing significant opportunities for businesses and investors (Table 1). However, this investment requirement will be influenced by specific government development targets such as:
■ eradication of existing basic services backlogs by 2019;
■ improving the reliability of supply to 90% by 2019;
■ developing the next phase of the Lesotho Highlands Water Project.
The sector overview in Section 2 (below) outlines the South African and Western Cape water context by presenting the water resource and water use landscape. Key players in the water sector are considered, followed by an overview of policies and regulations. The policy and legislative environment, along with economic and management approaches that guide and affect the water sector, are then outlined in Section 3.
The aim of Section 4 is to present business and investment opportunities in the water sector. This section focuses on the following key opportunity areas:
■ industrial water reuse and recycling ■ the water-energy nexus ■ smart water consumption and management ■ local water resources (covering water-
sensitive urban design and harvesting, groundwater, desalination and municipal non-revenue water).
The final sections of the report outline funding solutions and investment incentives (Section 5); present the case for the Western Cape as a great green investment destination (Section 6);
and explain in more detail GreenCape’s work within the green economy (Section 7).
The Appendices provide further detailed technical information on the opportunities presented by the water sector. These are referenced throughout the report.
GreenCape engages in numerous events, forums and leadership circles, and builds relationships with companies, regulators, investors and entrepreneurs. This report has been developed through insights from these local and global thought leaders and practitioners. GreenCape’s Water Sector Desk, which produced this report, serves as a platform for industry to access relevant information; source assistance in identifying business opportunities and overcoming barriers; and connect with other stakeholders.
For questions or queries, or to access GreenCape’s services, contact our Water Sector Desk: [email protected]. For the latest updates on the water sector, visit the water pages on the GreenCape website: www.greencape.co.za.
This report explores business and investment opportunities in the water sector and the main market forces within this landscape. It provides insights into the state of water resource management and use in the Western Cape and South Africa; presents policy and public sector activities; and outlines key
opportunities for businesses and potential investors.
Figure 1: Water value chain
Basin management Abstraction Storage Distribution
& UseReuse & Recycle
WWT & discharge
Type (R billions) Replacement New** Upgrade** Rehabilitate** Total**
Infrastructure: internal 111 37 21 55 113
Infrastructure: potable connector
106 33 0 53 86
Infrastructure: non-potable connector
169 13 0 53 66
Infrastructure: bulk 203 94 0 67 161
Water resources 505 158 5 80 243
TOTAL: Water 1094 335 26 308 669
Infrastructure: sanitation* 198 175 0 11 186
TOTAL: WATER SECTOR 1292 510 26 319 855
*Excluding the Municipal Infrastructure Finance Facility**10-year infrastructure cost 2015-2025
Table 1: Water sector capital replacement values and indicators 2015
Water: Market Intelligence Report 2017 1312 Water: Market Intelligence Report 2017

2 –Sector overview
This section focuses on the South African and Western Cape water context. It provides an overview of water availability and use. We discuss public sector activities and institutions that affect the
water sector. In addition it also covers the recent drought.
2.1. South African context‘Global water crises’ was ranked as the highest risk in 2016 by the World Economic Forum (WEF) and it is one of the biggest threats facing the planet over the next decade (WEF 2016). Within this context, South Africa is ranked as the 30th driest country in the world and is a high water-stressed country (Figure 2), with extreme climate and rainfall fluctuations (WRI 2015). South Africa’s water is drawn from a variety of sources. Typically, 77% is surface water, 9% is groundwater and 14% is drawn from reusing return flows (DWS 2013a). The Western Cape province, in the south-western corner of the country, is classified as a water-stressed region.
In terms of yield (volume over a given period), South Africa’s water resource base is dominated by surface water from our river systems. Yet only 8% of South Africa’s land produces 50% of the runoff in our river systems. This 8% has been defined as Water Source
Areas (Figure 3), and these are arguably our most important natural national assets (WWF 2013). Research is also underway to update, delineate and add groundwater to these source areas.
Under current planning scenarios, it is projected that water demand will surpass supply by 2020 in the regional water resource network. Known as the Western Cape Water Supply System (WCWSS), this network supplies greater Cape Town and the province’s west coast (DWS 2015a). The province’s water resources are also becoming increasingly vulnerable to climate variability, with climate models indicating that the Western Cape will become hotter and drier, leading to reduced water availability, while experiencing more intense rainfall events. Given its impact on the agricultural sector, this growing scarcity will have a negative effect on the country’s economy (IPCC 2014 and WCDoA & WCDEA & DP 2015).
Figure 4 provides an overview of South Africa’s physical water resource availability. If development trends continue, population growth and business expansion will leave a 1-3 billion m3, or 7-22%, water deficit per year by 2030, depending on what new supply systems are developed (WWF 2016).
2.2. Use by sectorRevenue from the sale of water and provision of sanitation services in South Africa in 2014/15 totalled R28 billion and R11.5 billion respectively (DWS 2016a). The distribution of this value among water users is shown in Figure 5 at national and municipal level. Of the municipal sales, about 58% typically comes from domestic residential use and 40% from commercial and industrial use.
Around two-thirds of South Africa’s water is used for agricultural purposes, specifically irrigation. Figure 6 shows the proportional differences of current water use in South Africa (DWS 2016a). In the Western Cape, irrigation to support agriculture is the major water use in each of the two water management areas (WMA) (Breede-Gouritz and Berg-Olifants), as shown in Figure 7 (StatsSA 2010). In the Berg-Olifants WMA, however, water supply
service to the metropolitan area of Cape Town is the dominant use for the sub-basin WCWSS (Figure 8).
Agricultural activity in the Western Cape covers an area of 11.5 million hectares. Although this accounts for only around 12.4% of the total agricultural land available in South Africa, the Western Cape produces between 55% and 60% of South Africa’s agricultural exports (WRC 2014).
Local factors that influence water and water supply in the Western Cape are:
■ population growth and economic development
■ growing urbanisation ■ changes to land-use policies and increasingly
impermeable surfaces ■ encroachment of invasive alien vegetation
and fauna ■ increasing pollution from agriculture, industry,
urban runoff, inadequate sanitation ■ over-use of riparian zones.
Figure 2: Water stress by country in 2040
Figure 3: South Africa’s strategic Water Source Areas
Water: Market Intelligence Report 2017 1514 Water: Market Intelligence Report 2017

Figure 4: South Africa’s water resources by numbers
Figure 5: Financial value of water sales by sector
Water: Market Intelligence Report 2017 1716 Water: Market Intelligence Report 2017
• IRRIGATION
• URBAN
• RURAL
• BULK INDUSTRY
• AFFORESTATION
Figure 7: Water use by type for the two Western Cape water management areas
Berg-Olifants WMA Breede-Gouritz WMA
Figure 6: Water use in South Africa by sector
• IRRIGATION
• URBAN
• MINING
• RURAL
• AFFORESTATION
• POWER GENERATION
• TRANSFERS OUT
67%
18%
5%
4%
3%
2%
1%
• MUNICIPAL WATER SERVICES
• MINING
• TRADE
• FOOD,BEVERAGES, TOBACCO
• BUSINESS
• MANUFACTURING
• AGRICULTURE
• FINANCIAL & OTHER SERVICES
• GOVERNMENT SERVICES
• HEALTH & OTHER
58%
11%
8%
7%
5%
4%
2%
2%
2%
1%

2.3. Western Cape contextThe WCWSS supplies a region that produces 86% of the province’s gross domestic product and is, therefore, one of the most important water systems in the country. Its catchment includes part of certain sub-basins of the Berg-Olifants and Breed-Gouritz WMAs. At its core are the dams located in the upper regions of the Berg and Breede Rivers catchments. The system supplies water for the:
■ City of Cape Town (CoCT); ■ West Coast District Municipality for domestic
supply to the Swartland Local Municipality, Saldanha Bay Local Municipality and Bergrivier Local Municipality;
■ Stellenbosch Local Municipality to augment the supply to Stellenbosch;
■ agricultural users downstream of the Berg River Dam, Voëlvlei Dam and Theewaterskloof Dam.
As shown in Figure 8, the total water consumption from the WCWSS in 2015 was about 575 million m3, based on releases from the dams and the capped allocation for the agricultural sector). Two-thirds (391 million m3) was for urban and industrial use, and the remainder was allocated for irrigation (DWS 2015a).
Demand on the WCWSS is growing and current demand is close to available yield.
In 2007, a Department of Water and Sanitation (DWS) study projected the future demand-supply gap for the WCWSS and developed a strategy of interventions to reconcile the gap by developing new water resources (DWS 2007). This strategy is routinely updated by the WCWSS Steering Committee.
Figure 9 presents different water supply-demand or reconciliation scenarios for the WCWSS under the ‘planning scenario’1. Future supply-demand planning and associated development of reconciliation strategies are carried out for each major water supply system in South Africa. Solid lines show different water demand projections based on various growth scenarios and years of calculation. Solid fills show the planned water supply interventions, along with actual yields for the different interventions.
Under the current planning scenario, it is projected that water demand will surpass supply by 2020 unless further effective measures are taken to manage water supply and demand. Table 2 describes the interventions being considered and planned for the WCWSS. Raising the Voëlvlei Dam, an off-channel dam located next to the Berg River, by two meters will provide further supply by 2021 and is the only confirmed project being undertaken at the time of writing. Other interventions are at various planning and feasibility study stages.
Figure 9: WCWSS planning scenario reconciliation of supply and demand
Table 2: WCWSS supply interventions by yield and implementation year
1 The ‘planning scenario’ assumes that the City of Cape Town achieves 50% of its WCWDM strategy, that climate change does not impact water availability, and that the ecological reserve has not been implemented.
Intervention selection Yield(million m3/year)
Earliest implementation
1 Voëlvlei phase 1 23 2021
2 Reclamation option 1 40 2022
3 Table Mountain Group aquifer scheme 1
20 2024
4 Reclamation option 2 40 2024
5 Table Mountain Group aquifer scheme 2
30 2026
6 West Coast aquifer storage 14 2027
7 Desalination phase 1 50 2028
8 Desalination phase 2 50 2031
9 Desalination phase 3 50 2033
10 Voëlvlei phases 2 and 3 110 2035
AN
NU
AL
REQ
UIR
EMEN
TS (M
ILLI
ON
M3 P
ER Y
EAR)
1000
10
9
8
7
5
4
3
2
800
600
900
700
500
400
2010
2012
2014
2016
2018
2020
2022
2024
2026
2028
2030
2032
2034
2036
2038
EXISTING SYSTEM YIELD
Water: Market Intelligence Report 2017 1918 Water: Market Intelligence Report 2017
10 - Voëlvlei Phases 2 & 39 - Desalination Phase 3 8 - Desalination Phase 2 7 - Desalination Phase 1
6 - Artificial Groundwater Recharge5 - Table Mountain Group Aquifer 24 - Re-Use Phase 23 - Table Mountain Group Aquifer 1
2 - Re-Use Phase 11 - Voëlvlei Phase 1
HIGH-GROWTH SCENARIO (3.38%/A)
LOW-GROWTH SCENARIO (2.3%/A)
ACTUAL WATER USE
Figure 8: Overview of WCWSS allocations by type
• AGRICULTURAL (CAPPED)
• URBAN: CITY OF CAPE TOWN
• URBAN: WEST COAST
• URBAN: OVERBERG WATER
• URBAN: STELLENBOSCH
• URBAN: DRANKENSTEIN
• URBAN: PIKETBERG
• OTHER
216
358
23
4
3
2
2
2
M3/YEAR

An oversight committee has been setup to support the implementation of the reconciliation strategy. The WCWSS Strategy Steering Committee is led by the DWS and includes representatives from all provincial government departments and other key stakeholders involved in water resources management. They include organised agriculture, the Berg-Olifants proto-Catchment Management Agency (CMA), the CoCT, relevant district and local municipalities and the DWS regional and national offices. The committee is responsible for coordinating strategy updates and is responsible for keeping institutions and the public informed. Minutes and strategy documents can be accessed online2.
The WCWSS Decision Support System uses a management dashboard3 to monitor the system and informs operational decisions. The work of the committee and the WCWSS Decision Support System are critical to the entire network’s operational sustainability.
—Water reuse, groundwater development (new resources and artificial recharge) and desalination are key supply options being pursued within the WCWSS. There is also a strong focus on protecting water quality, resolving license applications in the region, and enabling municipal water conservation and water demand management (WC/WDM) activities.
2.4. Key private sector playersAn increasing number of water technology companies that are trying to enter the utility-scale market with innovative, capital-intensive technologies are considering how to structure a business model in the same way as an Energy Service Company (ESCO) would (GreenCape analysis). This would typically be called a build-own-operate (BOO) model, where water is considered a service and sold at a volumetric rate within certain quality parameters and supply assurances.
It is helpful to classify different groups of service providers based on their services rendered over the course of project development and implementation. Four main groups of service providers play a role in the water market (Figure 10), as follows:
■ Consultancy (service) providers such as water auditors, planning engineers, certified measurement and verification personnel, accountants, lawyers and others who provide advice.
■ Technology suppliers, which provide hardware, such as filters and treatment systems, pumps and piping, or systems; software, such as water accounting or management packages; and related operation and maintenance services, such as servicing membranes, technology maintenance services or software updates.
■ Water Service Companies (WaSCos, sometimes referred to as WETCos), which typically provide performance-based water contracting, also referred to as WaSCo or water efficiency services. The two basic business models are (1) Water Supply Contracting (WSC), which delivers units of water measured in kilolitres (kl); and (2) Water Performance Contracting (WPC), which provides water savings measured in comparison to a previous water cost or use baseline.
■ Engineering Procurement Contractors (EPC), which provide the detailed engineering design for a project, procure all the equipment and materials necessary, then construct and deliver a functioning facility or asset to their clients.
2 https://goo.gl/N3D9TM3 https://goo.gl/x9iDXP
Figure 10: Water services market value chain
Consultants: Water auditors, Planning engineers, Measurement professional, Other professional (legal, accounting)WaSCos: Water Services Companies
© Image courtesy of GreenCape, 2016
Water: Market Intelligence Report 2017 2120 Water: Market Intelligence Report 2017
Water ServicesValue Chain
Service Providers
Legend
Audit Technicaldesign
WaSCos
Consultants Consultants
Banks
EPCs
Private Equity Funds
Installation Operation &Maintenance
Measurement & Verification Finance

All four groups of service providers are needed to develop a water services market. At the same time, there are notable variations in their role in the value chain, scope of service, degree of risk acceptance, business models and remuneration schemes.
2.5. Drought and agricultureIn 2015/16, South Africa recorded its worst drought since 1904 and its impact was felt nationwide. Typical South African droughts are caused by the cyclical El Niño weather pattern, and the country has always had variable rainfall. However, the effects of climate change mean the country will continue to experience increasing water scarcity and rainfall variability. This will require active adaptation management and resilience strengthening.
(Appendix A provides several resources on short-term forecasts concerning future climate, water resources and forecasts for resource and production management.)
In seasonally adjusted terms, agriculture contracted by almost 15% from R78 billion in the fourth quarter of 2014 to R66 billion in the second quarter of 2016. Most of this decline is attributed to the recent drought (TIPS 2016). The 2015 maize crop, at just under 10 million tons, was the lowest in South Africa since 2007, when it fell to 7 million tons.
No new water allocations for agriculture in South Africa are likely to occur and there is a consensus that the National Development Plan's 500 000 ha of new agricultural production is unrealistic due to water
availability, with studies coming in at around 180 000 ha (GreenCape analysis).
New agricultural production will, therefore, be unlocked through:
■ efficiency gains elsewhere or on farms ■ investment in irrigation scheme
infrastructure ■ groundwater extraction.
Business opportunities are presenting themselves for small-scale brackish or wastewater treatment solutions on farms. The technology solutions themselves depend on the incoming water quality, where a suite of treatment systems are designed (see Sections 4.1 and 4.6). Business models that are increasingly popular include design, build and operate (DBO). Here, a long-term water supply contract is secured and water is sold at a kl rate to the client, who takes no capital risk. Key drivers are that primary producers are struggling with lower quality resources or want to access marginal water that previously had less value.
The GreenCape 2017 Agriculture Market Intelligence Report4 covers many water-related opportunities for agriculture.
4 www.greencape.co.za/resources
Water: Market Intelligence Report 2017 2322 Water: Market Intelligence Report 2017© Image courtesy of GreenCape, 2016

3 –Policies, regulation
and programmesThis section introduces water sector-related regulatory frameworks and public sector activities. These are expected to inform or affect investment decisions made by potential
investors and businesses in the sector.
3.1. Laws and managementManaging water resources involves contributions from various stakeholders at different points along the value chain. The DWS formulates and implements policies to regulate the water sector and provides strategies for sector support. It does this by operating across the water value chain as a national government entity. However, the DWS does not execute all functions. In line with the National Water Act (Act 36 of 1998), some functions are delegated to appropriate sector institutions, such as CMA. Figure 11 describes the institutional structure and relationships in the South African water sector (DWS 2013b).
Water services authorities (WSAs) are typically municipal departments. Of the 278 municipalities in the country, 152 are designated WSAs, including all 24 local municipalities in the Western Cape.
Some local municipalities contractually delegate Water Boards as WSAs or in some areas, such as the Eastern Cape, the district municipalities are WSAs.
As provided for in the National Water Act, CMAs are responsible for water resource management within the defined boundaries.
They are arguably the most important institutions in the South African water sector. Establishing CMAs has been slow, and the latest updates can be found online5. The Western Cape will have two CMAs: the Berg-Olifants, currently managed by the DWS as a temporary or proto-CMA (read the CMA business case online6); and the established Breede-Gouritz (read the CMA strategy online7). Figure 12 shows South Africa’s designated CMAs.
Some local municipalities contractually delegate Water Boards as WSAs or in some areas, such as the Eastern Cape, the district municipalities are WSAs.
As provided for in the National Water Act, CMAs are responsible for water resource management within the defined boundaries. They are arguably the most important institutions in the South African water sector. Establishing CMAs has been slow, and the latest updates can be found online. The Western Cape will have two CMAs: the Berg-Olifants, currently managed by the DWS as a temporary or proto-CMA (read the CMA business case online); and the established Breede-Gouritz (read the CMA strategy online). Figure 12 shows South Africa’s designated CMAs.
Access to water in society is determined by the following legal rights and strategies:
■ International law affirms that water and sanitation are human rights according to a resolution adopted by the United Nations Human Rights Council in 2010;
■ Constitution of South Africa enshrines the basic right to adequate, safe water;
■ National Water Act of 1996 is the primary legislation that regulates and protects water resources;
■ Water Services Act of 1997 focuses on the right to a basic supply of water and sanitation services, and water services institutions that take reasonable measures to realise these rights.
The National Water Resources Strategy 2 (NWRS2) outlines the institutional structure of the water sector, and highlights the roles played by WSAs, water services providers (WSP), regional water utilities, CMAs, catchment management forums and water user associations (WUA) through the water value chain. The NWRS2’s objectives, strategic themes and execution focus areas can be seen in Figure 13 (DWS 2013b).
The Medium-Term Strategic Framework (MTSF) (Phase 1 2014-2019) sets out actions and targets to achieve the commitments set out in the 2012 National Development Plan. It is structured around 14 strategic areas and creates opportunities for the private sector in public water and sanitation, water leak management and water demand management. A National Infrastructure Plan was developed in 2012, comprising18 strategic infrastructure projects (SIPS), to be implemented over a 15-year period at an estimated cost of R4 trillion (DWS 2016a). Two SIPS cover water and sanitation, as follows:
■ SIP 6 will address backlogs and upgrades to municipal water, sanitation and electricity bulk infrastructure.
■ SIP 18 will address water and sanitation backlogs, as well as the maintenance and construction of waste water treatment works. It will also consolidate water services institutions and implement water leak management and water demand awareness programmes.
5 https://goo.gl/AGDllg6 https://goo.gl/AGDllg7 https://goo.gl/jqza7N
Figure 12: Designated catchment management agencies in South Africa
Limpopo
Vaal
Orange
Berg
Breede
Olifants
Gouritz
Pongolo
Inkomathi
Mzimvubu -
Mzimkulu
Usuthu
Tsitsikamma
Olifants
Water: Market Intelligence Report 2017 2524 Water: Market Intelligence Report 2017

Water: Market Intelligence Report 2017 2726 Water: Market Intelligence Report 2017
Figure 11: Key water governance and management organisations in South Africa
Dept of Water Affairs NWRS; national WR planning
national monitoring and information systems; national
norms, standards and targets (quality, quantity,
reserve etc.); ensures CMAs comply with national policy and NWRS; allocated water between WMAs; dam safety
regulation; authorisation of water use; enforcement of compliance; economic
regulation; regulation of water management institutions.
Cabinet Develops legislation reviews implementation of legislation
Strategic WaterUsers (Eskom)
Water Users
CourtsAdjudicate cases
Water TribunalAdjudicate cases
Investigate and advise on the protection, use, development,
conservation, management and control of water resources
in its water management area; co-ordinating activities
of water users and water management institutions.
Local Govt as WaterServices Authority
Regulates local water supply and sanitation; develops and
enforces by-laws
Dept of Environmental Affairs Sets national norms and
standards and regulates solid waste management, wetland
protection, biodiversity/conservation protection, etc.
Approves EIAs for major projects, including dams.
Provincial Depts of Environment
Set provincial norms and standards; approve EIAs
Dept ofAgriculture
Regulates land-use alien
invasive plants
Dept of TransportRegulates
water-basedtransport
Parliament
Catchment Management Agency
Develops CMS; sets WMA targets, objectives, norms and standards; regulates water use in WMA (quality and quantity);
compliance monitoring
Regulates local government Dept of Co-operative
Government and Traditional Affairs
Provincial Depts of Cooperative Government
and Traditional AffairsRegulate local government;
intervene when needed
SANSSets drinking water
standards etc.

3.2. Water services authoritiesWSAs regulate local water supply and develop by-laws. They also delegate functions to WSP, most often municipal departments, to deliver water services to users, and plan and manage infrastructure. Appendix B provides further details and insights covering:
■ the value of water infrastructure and resources
■ municipal revenue from water and sanitation
■ municipal financial stability ■ the vulnerability and risk of WSAs ■ staff skill levels and capacity.
3.3. Water pricingThis report considers the business opportunities along the water sector value chain, presented in Figure 14. The National Water Act makes provision for a pricing strategy for water use charges to promote financial sustainability and economic efficiency in water use. The Act also makes provision for financial assistance to water users in the form of grants, loans or subsidies. While this report focuses largely on the economic value of water, it also acknowledges that water has broader social and ecological values.
Appendix C provides further details and insights covering:
■ water use categories ■ principles regarding water pricing; ■ different types of water charges along
the value chain ■ differences in water charges for selected
catchments.
3.4. DWS drop programmesIn 2008, the DWS introduced the Blue Drop and Green Drop certification programmes for auditing and managing drinking water and wastewater quality respectively. WSAs are audited and receive a score for their overall performance. The No Drop certification programme was recently introduced to assess and report on water losses and non-revenue water (NRW) for WSAs. These programmes and associated data can allow businesses to target areas where the need for improvements or assistance may be greatest, almost down to plant or facility level.
Appendix D provides further details and insights covering results and the distribution of treatment works by performance.
3.5. Demand managementDue to the need to conserve water, especially during drought, many WSAs have implemented
water restrictions in line with their local demand management regulations and by-laws. CoCT imposed Level 3 restrictions in November 2016. In addition to numerous behavioural restrictions (e.g. how and when irrigation can take place), these restrictions introduced a large increase in water use tariffs for all water-use types8.
Figure 15 and Figure 16 show drinking water and sanitation tariffs for domestic (standalone house) consumers in Cape Town. CoCT’s water restrictions are in line with the WC/WDM programme, which minimises water loss and promotes the efficient use of water. CoCT’s WC/WDM programme was awarded the C40 Cities Award for climate change adaptation at the COP21 conference in Paris in December 2015 (CCT 2015).
Figure 13: Strategic focus of the National Water Resources Strategy 2
Figure 14: Tariffs and charges along the water value chain
8 https://goo.gl/cGdf28
Basin management Abstraction Storage Distribution
& UseReuse & Recycle
WWT & discharge
Water: Market Intelligence Report 2017 2928 Water: Market Intelligence Report 2017
Resource management
chargeBulk water tariff Retail water tariff Sanitation charge Water discharge
charge
Water contributes to the economy and job creation
OBJECTIVES
EXECUTION
Water supports development and elimination of poverty and inequality
Institutional arrangements
Financing the water sector
Monitoring & information
management
Research and innovation
Water sector skills & capacity
Water is protected, used, developed, conserved, managed and controlled
sustainability and equitably
VISION OF NWRS2Sustainable, equitable and secure water for a better life and environment
GOALWater is efficiently and effectively managed for equitable
and sustainable growth and development
Wat
er r
esou
rces
pla
nnin
g,
dev
elop
men
t an
d in
fras
truc
ture
m
anag
emen
t
Stra
teg
ic t
hem
es
Wat
er r
esou
rces
pro
duc
tion
Equi
tab
le w
ater
use
Reg
ulat
ion
of t
he w
ater
sec
tor
Wat
er c
onse
rvat
ion
and
w
ater
dem
and
man
agem
ent
Inte
rnat
iona
l tra
ns-b
ound
ary
wat
er
reso
urce
man
agem
ent
Man
agin
g w
ater
res
ourc
es
for
clim
ate
chan
ge

4 –Opportunities
This section focuses on opportunities identified during engagement with stakeholders in the water
and other green economy sectors.
These opportunities are emphasised in this report along different areas of the value chain (Figure 17).
Figure 17: Green economy opportunities along the water value chain
Basin management Abstraction Storage Distribution
& UseReuse & Recycle
WWT & discharge
Water: Market Intelligence Report 2017 3130 Water: Market Intelligence Report 2017
0
12,56
0
13,2413,98
20,3423,39
27,47
22,23
28,15
35,29
23,34
36,48
0
4.1 Industrial water reuse and resource recovery
4.2 Water and energy
4.3 Smart water use
4.4 Water sensitive design for rain, grey, and stormwater harvesting
4.5 Groundwater and managed aquifer recharge
4.6 Desalination
4.7 Reducing municipal non-revenue water
CAPE TOWN 2016/17 DOMESTIC POTABLE WATER TARIFFS
• LEVEL 1 RESTRICTIONS • LEVEL 2 RESTRICTIONS • LEVEL 3 RESTRICTIONS
• LEVEL 1 RESTRICTIONS • LEVEL 2 RESTRICTIONS • LEVEL 3 RESTRICTIONS
Figure 16: City of Cape Town 2016/17 domestic sanitation tariffs
Figure 15: City of Cape Town 2016/17 domestic potable water tariffs
MONTHLY DISCHARGE* | *CALCULATED AS 70% OF THE POTABLE CONSUMPTION VOLUME**SANITATION CHARGED TO A MAXIMUM OF 35 KL
STEP 1(0-4.2 KL)
STEP 2(4.2-7.4 KL)
STEP 3(7.4-14 KL)
STEP 4(14-24.5 KL)
STEP 5**(24.5-35 KL)
R/K
L (IN
CL.
VAT
)
0
20
30
10
40
50
MONTHLY CONSUMPTION
1517
26
32
42
1620
33
49
93
0 0 0
17
24
41
66
STEP 1(0-6 KL)
STEP 2(6-10.5 KL)
STEP 3(10.5-20 KL)
STEP 4(20-35 KL)
STEP 5(35-50 KL)
STEP 6(<50 KL)
R/K
L (IN
CL.
VAT
)
0
20
40
60
80
100
200
48,65

There are significant opportunities within water reuse and recycling, energy and water, smart management and local water resource development, as follows:
■ Water reuse, recycling and resource recovery is becoming increasingly understood and adopted, especially by water-intensive industrial and commercial users. Advanced treatment technologies are developing rapidly, while increased competition and demand are providing more solutions that make business sense. There are opportunities for the manufacture, assembly and supply of treatment and reuse components and systems; and in services and products related to industrial symbiosis.
■ Energy used for water treatment and conveyance, and water used for energy generation are areas rich in opportunities for innovation and investment. Drivers include growing challenges to water and energy security, renewable energy technology developments and rising prices for both water and energy.
■ Understanding and managing consumption by utilities and end-users is the vital first step towards holistic water conservation and demand management. There is a rapidly expanding market for technical solutions that measure, report and control water consumption at all scales of use.
■ Regional surface water resources are almost fully allocated, driving investments into development of local water resources. These resources include rain, storm and greywater; new groundwater resources; managed aquifer recharge; and brackish and seawater desalination.
■ Reducing municipal water losses is a national priority, where significant resource and financial benefits can be realised at any urban and system scale.
Before discussing these opportunities in more detail, it is important to briefly consider some headline barriers to the uptake of new water technologies and practices. These include:
■ A lack of awareness about the importance and business benefits of water use efficiency and reuse.
■ Regulatory hurdles including the slow pace of municipal procurement and difficulty that public-private-partnerships face in structuring long-term agreements such as water offtakes from private systems.
■ Insufficient support for water users to access information and advice on best practice.
■ Capital requirements to invest in new green infrastructure, where water is often under-priced.
■ Technical capacity to design and implement new systems for water saving or advanced treatment, especially at municipalities.
■ Lack of funding for research and pilot development of new technology.
The DWS and other authorities are motivating strongly for local water resources to be exploited and optimised before any large-scale bulk systems are explored. This has led to increased investment in developing groundwater (private small-scale and municipal well field); storm and rainwater; and desalination (utility and small-scale). Realistically, all indications are that there are going to be few to no large-scale bulk surface water development schemes for the Western Cape or the WCWSS within the next decade.
4.1. Industrial water reuse, recycling and resource recoveryThe average capital investment required for a medium-high intensity water user is R40 million per megalitre/day for a highly-advanced treatment and reuse system. There are approximately 15 industrial sites in the Western Cape where the business case and need exist that could benefit immediately from such a system. The immediately addressable market size of the industrial water reuse industry in the Western Cape is, therefore, estimated at R600 million and it is expected to grow rapidly as scarcity increases. Implementation of these technologies could result in total collective savings of approximately R192 million annually. There are opportunities for technology and services providers, many of which are already tapping into this market with a wide range of innovative and readily available products for water reuse (GreenCape analysis).
—The market for industrial water reuse in the Western Cape is R600 million and is expected to grow rapidly.
OpportunitiesEffluent reuse: Effluent from different process units or stages can often be used on-site or for other process stages without the effluent having to go through a treatment process first. For example, the water used to clean raw products in the food and beverage industry can be used for certain cleaning processes or on-site irrigation. Optimum use of wastewater between process stages, however, would have to be considered at the design phase of an industrial plant.
Products recovered from wastewater: Alternatively, an industrial user might be more concerned with product that could be recovered from the wastewater and, therefore, might be willing to purchase or transport the wastewater from another industrial company. An example of such a scenario would involve a biogas generation company purchasing wastewater from a food and beverage company.Potable reuse: The area of municipal drinking (potable) water reuse is also growing rapidly. Cape Town is considering various direct potable reuse options of up to 100 Ml/day, delivered by up to 10 advanced treatment schemes. This could result in investments of around R4.5 billion, which will be outlined in a 2017 feasibility study. The scheme would possibly become available in 2025. Potable reuse, however, faces substantial barriers, as discussed in Appendix E.
Business caseA typical high industrial water user business case for an advanced treatment and reuse system is shown in Table 3. Considerations include capital and operational expenditure, monetary and resource savings, as well as fines and other operating costs (e.g. energy for pumping, servicing water equipment, etc.).
—The direct potable reuse market is estimated at R4.5 billion in the Western Cape.
Water: Market Intelligence Report 2017 3332 Water: Market Intelligence Report 2017

Case Study
The Durban Water Recycling Plant is an excellent reuse and industrial symbiosis reference. It provides considerable benefits to the municipality and industries in the form of lower tariffs compared to the normal potable industrial tariff.
The two largest customers are the Mondi paper mill and the Sapref refinery (owned by Shell and BP). The recycling plant was built in 2001 at a cost of R75 million and treats around 10% of the city’s wastewater effluent. Around 50 Ml/day of treated municipal effluent is purchased from the municipality and treated to near-potable water standards. The process includes further activated sludge, Lamella settling, Polyaluminium chloride dosing, dual media filtration, ozonation, granular activated carbon and chlorination.
The total project cost was significantly less than current advanced systems as there were certain existing civil structures in place on the site, and the treatment process does not require any high-pressure membrane or filtration stages.
It was the first large-scale, privately developed water recycling project in South Africa and operates on a 20-year build-own-operate-transfer (BOOT) contract. The facility enables a 7% reduction in overall municipal demand, a 24% reduction in marine outfall and a 60% saving in water input costs for industry. It has also resulted in a dampening of municipal water price escalations (eThekwini Municipality 2016, Gliscon et al. 2002 and GreenCape analysis).
Appendix F provides further details and insights covering:
■ a typical treatment process for industrial water treatment and possible reuse;
■ reused water quality requirements and applicable technologies;
■ options for sludge management and resource recovery;
■ membrane technology comparisons; ■ selected industrial water reuse and
symbiosis examples and case studies. and other operating costs (e.g. energy for pumping, servicing water equipment, etc.).
Table 3 illustrates savings on the municipal water bill of R8 million, with the system paying for itself within five years (GreenCape analysis). This represents an increasingly compelling business case, especially if scarcity, operating risks and tariffs continue to increase. These systems not only allow for a reduced water footprint, but also increase the climate resilience of a facility due to the internalisation of a primary input. The wastewater treatment process is, however, highly dependent on the desired quality of the water to be reused or discharged, as well as the initial components of the wastewater.
DriversThe main drivers of these opportunities in water reuse, recycling and resource recovery are:
■ Rising water tariffs, with industrial water reuse becoming more attractive and feasible for companies.
■ Compliance requirements and an urgent need to reduce demand on municipal wastewater treatment works’ infrastructure.
■ Increased understanding of water risks by business as well as the adoption of water stewardship programmes. Appendix G provides further details and insights covering Carbon Disclosure Project water results; the business approach towards water stewardship; and resources and tools to manage water risk.
—In 2016 94% of companies reported water as a direct risk to their operations (the highest in the world) (NBI 2016b).
Rising water tariffs have become an important motivation for companies to save money on their water bill. During water-scarce periods, municipalities often reduce consumption by increasing tariffs through water conservation by-laws. Figure 18 shows how industrial water tariffs have increased with different restrictive stages for the CoCT9.
Table 3: Illustrative industrial reuse financial model (high water user, advanced treatment system)
Description Amount
Industrial water tariff R25.35/kl
Industrial sanitation tariff R19.48/kl
Daily water consumption 1 Ml/d or 1000 kl/d
Annual water consumption
365 000 kl/year
Annual water and sanitation cost
R16.01m/year
Treatment and reuse system CAPEX
R40m
Treatment and reuse system OPEX
R10.00/kl
Treatment system operating cost
R2.37m/year
Recovered water reused on site
65%
New municipal water and sanitation bill
R5.60m/year
New annual water and sanitation cost
R7.98m/year
Annual savings R8.03m/year
Capital payback period 4.98 years
9 https://goo.gl/LdtHhc
Figure 18: 2016/17 City of Cape Town industrial water tariffs
Water: Market Intelligence Report 2017 3534 Water: Market Intelligence Report 2017
18,77
14,42
21,82
16,76
LEVEL 1 RESTRICTIONS(NORMAL YEARS)
LEVEN 2 RESTRICTIONS(SINCE 01/2016)
LEVEL 3 RESTRICTIONS(SINCE 12/2016)
R/K
L (IN
CL.
VAT
)
0
10
15
5
20
25
• POTABLE (FY 2016/17) • SANITATION (FY 2016/17)
25,3519,48

—The total financial impacts relating to water reported by 10 companies in 2015 was R841 million.
Figure 19 shows a stylised set of impacts and likelihoods that summarise some of the main risk drivers towards adopting advanced treatment and reuse systems (Veolia Water Technologies 2016).
The need to meet compliance requirements when disposing of wastewater to a wastewater treatment works or directly to the environment is another driver. When discharging to municipal systems, failing to meet set standards is often penalised by the WSA with fines. Environmental discharge can often be more stringent, with operations suspended and financial and criminal penalties imposed. Once an industrial user has treated its effluent to an acceptable disposal standard, it might realise it meets its water quality criteria for certain process stages and opt to reuse it on-site.
Other drivers include:
■ advanced technology availability; ■ increased competition among suppliers,
which lowers costs and allows for business model innovation;
■ reputational risk of industrial water users among their customers;
■ operational risk due to water shortages; ■ adoption of water stewardship principles
and approaches. BarriersThe barriers to the growth of the treatment and reuse market:
■ negative perceptions about reused/recycled water;
■ large upfront capital requirements; ■ policy and regulation on implementing
water reuse technologies on-site in certain processes (e.g. product contact for food and beverages)
■ limited incentives for industry to invest in water treatment and reuse systems beyond the price mechanisms.
Water: Market Intelligence Report 2017 3736 Water: Market Intelligence Report 2017
30
25
20
15
10
5
0
Figure 19: Costs related to industrial water risks
0% 20% 40% 60% 80% 100%
IMPA
CT
($/M
3 )
LIKELIHOOD (%)
Temporary loss of licnse to operate
Penalties due to water
pollution
Strengthening of discharge regulation
Plant shutdown
due to water shortage
© Image courtesy of GreenCape, 2016
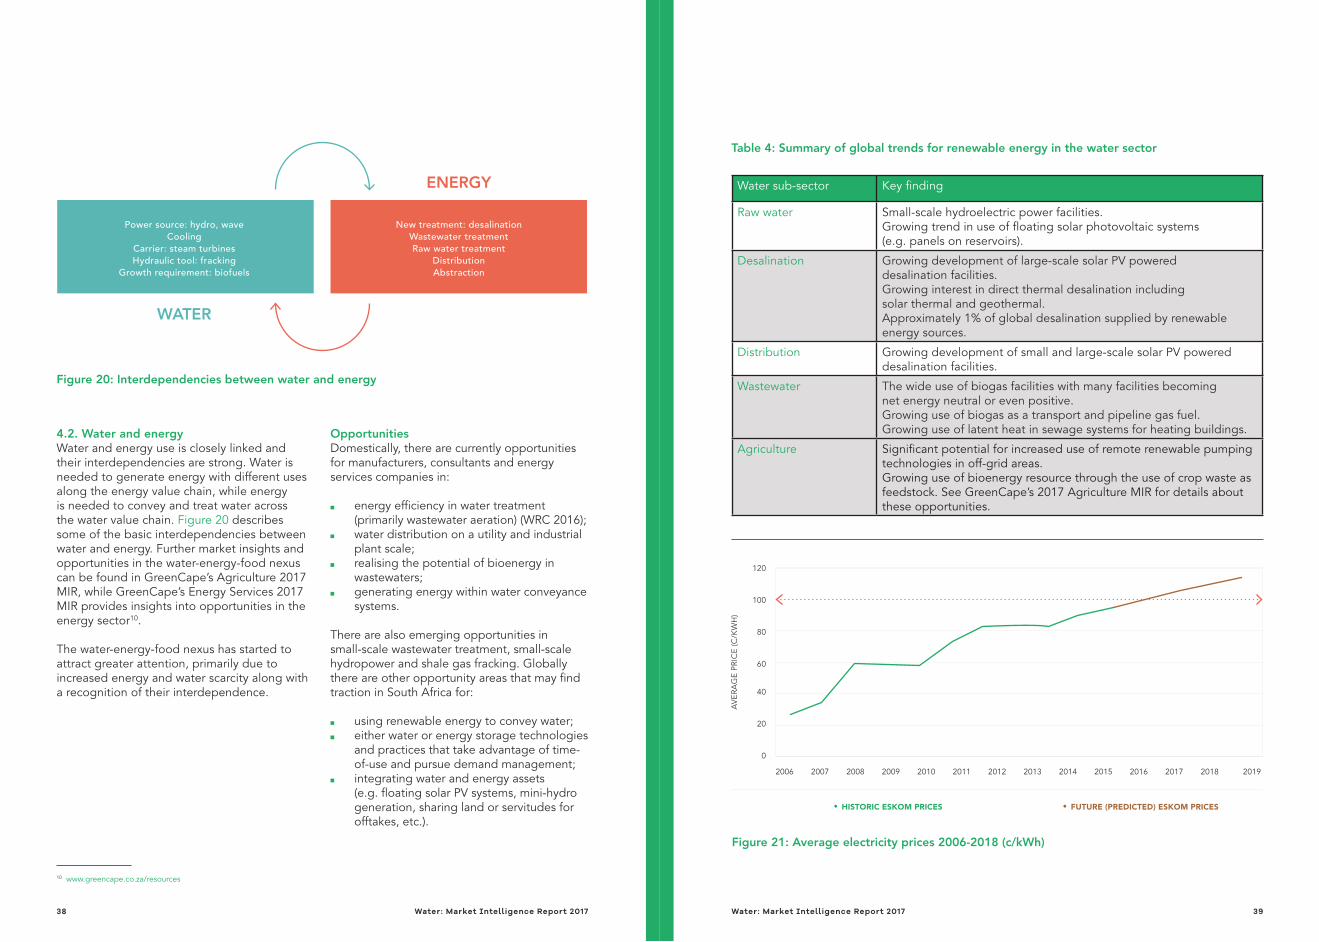
4.2. Water and energyWater and energy use is closely linked and their interdependencies are strong. Water is needed to generate energy with different uses along the energy value chain, while energy is needed to convey and treat water across the water value chain. Figure 20 describes some of the basic interdependencies between water and energy. Further market insights and opportunities in the water-energy-food nexus can be found in GreenCape’s Agriculture 2017 MIR, while GreenCape’s Energy Services 2017 MIR provides insights into opportunities in the energy sector10.
The water-energy-food nexus has started to attract greater attention, primarily due to increased energy and water scarcity along with a recognition of their interdependence.
OpportunitiesDomestically, there are currently opportunities for manufacturers, consultants and energy services companies in:
■ energy efficiency in water treatment (primarily wastewater aeration) (WRC 2016);
■ water distribution on a utility and industrial plant scale;
■ realising the potential of bioenergy in wastewaters;
■ generating energy within water conveyance systems.
There are also emerging opportunities in small-scale wastewater treatment, small-scale hydropower and shale gas fracking. Globally there are other opportunity areas that may find traction in South Africa for:
■ using renewable energy to convey water; ■ either water or energy storage technologies
and practices that take advantage of time-of-use and pursue demand management;
■ integrating water and energy assets (e.g. floating solar PV systems, mini-hydro generation, sharing land or servitudes for offtakes, etc.).
10 www.greencape.co.za/resources
Table 4: Summary of global trends for renewable energy in the water sector
Water sub-sector Key finding
Raw water Small-scale hydroelectric power facilities.Growing trend in use of floating solar photovoltaic systems (e.g. panels on reservoirs).
Desalination Growing development of large-scale solar PV powered desalination facilities.Growing interest in direct thermal desalination including solar thermal and geothermal.Approximately 1% of global desalination supplied by renewable energy sources.
Distribution Growing development of small and large-scale solar PV powered desalination facilities.
Wastewater The wide use of biogas facilities with many facilities becoming net energy neutral or even positive.Growing use of biogas as a transport and pipeline gas fuel.Growing use of latent heat in sewage systems for heating buildings.
Agriculture Significant potential for increased use of remote renewable pumping technologies in off-grid areas.Growing use of bioenergy resource through the use of crop waste as feedstock. See GreenCape’s 2017 Agriculture MIR for details about these opportunities.
Figure 21: Average electricity prices 2006-2018 (c/kWh)
Figure 20: Interdependencies between water and energy
• HISTORIC ESKOM PRICES • FUTURE (PREDICTED) ESKOM PRICES
2006 2007 2008 2009 2010 2011 2012 2013 2014 2015 2016 2017 2018 2019
0
20
40
80
60
120
100
AVE
RAG
E PR
ICE
(C/K
WH
)
Water: Market Intelligence Report 2017 3938 Water: Market Intelligence Report 2017
Power source: hydro, waveCooling
Carrier: steam turbinesHydraulic tool: fracking
Growth requirement: biofuels
New treatment: desalinationWastewater treatmentRaw water treatment
DistributionAbstraction
ENERGY
WATER

A recent investigation into renewable energy opportunities for the water sector identified key global trends, as shown in Table 4 (ARENA 2015).
There are numerous green technology opportunities in the water and shale gas interface, from treatment and reuse technology; and drilling and hydraulic efficiencies; to efficient operational water usage. There is a greater understanding of the water risks that need to be mitigated, as well as the sources of reused water that will be supplied as production inputs. If shale gas is extracted in South Africa, then this may present a major opportunity for green water technology companies in around five to 10 years.
DriversEnergy efficiency measures have not been a priority in the South African water industry due to the relatively low cost of electricity. Over the past decade, this situation has been changing
due to increased energy demand, lack of generating infrastructure and the subsequent increase in electricity costs (Figure 21). Energy will remain a high-cost item for municipalities and utilities, which operate and maintain energy intensive water and wastewater systems and facilities.
Water and sanitation departments account for around 30% of overall urban energy use. Most of this energy is used for conveying water and treating wastewater. Energy efficiency audits and pump and systems upgrades (mainly aeration technology) should be performed at all water treatment facilities. Average payback periods for upgrades to municipal works are currently around four to five years (WRC 2013a).
Appendix H provides more detail on energy use and opportunities in municipal water services.
Water: Market Intelligence Report 2017 4140 Water: Market Intelligence Report 2017© Image courtesy of GreenCape, 2016

4.3. Smart water useWater use audits and smart technologies play an important role in the effective and efficient management, distribution and use of water resources. Measuring, monitoring, metering and controlling water infrastructure can be done at a lower cost and with greater precision using these technologies. There is a strong case for developing WaSCos with business models that incorporate audits and monitoring, shared savings, capital investment solutions for technology and smarter utility management.
There are opportunities for well-established technologies including satellite remote sensing, cloud computing, sensor webs and geographical information systems (GIS) (ITU 2015). Other opportunities include laser technologies that stream flow data on rivers; smart metering technologies; and digital geographical data can be used to create topographical models.
—There are opportunities for well-established technologies including satellite remote sensing, cloud computing, sensor webs and geographical information systems.
OpportunitiesThere are opportunities in all urban markets for smart meters in utilities and households. The water meter industry has seen substantial development in the last two decades, with many new capabilities added to water meters. Many are now able to communicate with the municipality or user, monitor consumption patterns, dispense prepaid water and provide leakage alerts (WRC 2011a and 2015b).
Many electricity meter businesses, local and international, are now beginning to move into the domestic water meter market due to increasing demand for smart devices, as well as saturation in the electricity market. There are opportunities for local manufacturing in areas such as plastic moulding, telemetry breakthroughs and product assembly. At present, however, most of the market leaders import products or most of their components (WRC 2015a).
Cellular meters have a particularly relevant place in the African market, providing metering opportunities without traditional network infrastructure or traditional manual reading. Figure 22 shows how around 10% of USA water meters shipped in 2016 were using cellular telemetry technology (Metering & Smart Energy International 2015).
Table 5 lists relevant products and technologies for the water sector (ITU & UNESCO 2014).
Appendix I provides further details and insights on opportunities in agriculture and utility savings that could be realised with smart solutions.
Figure 22: Cellular water meter market in the USA
Table 5: Information and communications products and technologies in the water sector
Field Product or technology Use and benefit
Weather forecasting Remote sensing from satellitesWireless sensor networksGeographical information systemsSensor networks and the internet
Improvement in weather forecasting
Mapping water resources, water supply and distribution
Geographical information systemsBuried asset identification and electronic tagging Smart pipes, smart hand pumps, smart river meters and smart meteringReal-time risk assessment Supervisory control and data acquisition
Improving the management of water distribution networksReducing water losses by active leakage control Reducing network damage and deteriorationReducing the risk of infection in the water system Increase in revenueImprovements in customer relations
Water demand forecasting
Geographical information systemsGround penetrating radarsOptical and pressure sensorsCloud computing Supervisory acquisition
Rain/stormwater harvestingManaged aquifer rechargeProcess knowledgeImprovements in water resource management
Early-warning systems Geographical information systemsSensor networksEarly-warning websitesMobile and mobile network digital data
Reservoir flood management and mappingQuick data acquisition and data processing and analysis Quick and easy data dissemination to warn the public
Agricultural irrigation Geographical information systemsSensor networksMobile and mobile networksSubsidiary communications authorisation and radio systems
Reduction of water consumptionImprovements in enterprise and resource planning
Water: Market Intelligence Report 2017 4342 Water: Market Intelligence Report 2017
0
300
400
100
200
500
700
600
0%
6%
8%
2%
4%
10%
16%
12%
14%
• UNIT SHIPMENTS ('000s) - SMART METER SHIPMENTS THAT ARE CELLULAR (%)
2013 2014 2015 2016 2017 2018 2019 2020

DriversOverall, water audits and assessments provide the baseline data for further investments and interventions. More water users should be investing in these processes and systems to inform data-driven decision making. After all, to measure is to manage.
Water use audits are an important first step toward understanding water use and what can be done to improve it. All organisations embarking on water use optimisation and sustainable use in households, industry and government entities need to conduct a water use audit or assessment. Table 6 details the different levels of water audit complexity, supported by smart technologies and systems (Piper 2008).
In 2017, the National Cleaner Production Centre is launching an industrial water efficiency project based on its industrial energy efficiency methodology. This will significantly increase demand for water use assessments and smart technologies.
The Water Research Commission (WRC) is also leading research into reviewing information and communications technology in the market (WRC 2013b) and publishing key work on smart metering for municipal systems in 2011 (WRC 2011a). A recent report provides an evaluation framework for advanced water metering projects and encourages an holistic approach to adopting metering technology (WRC 2015b).
Table 6: Typical water use audit activities and outputs
Level 1Desktop analysis
Level 2Site audit and analysis
Level 3Detailed site analysis (investment-grade)
Audit focus Building use and square footage Demographics Rough estimate of savingsNo/low-cost measures
Water consumption by end-use More rigorous estimate of savings potentialNo/low-cost and capital measures
Detailed analysis of water use by subsystem Investment-grade estimates of savings potential Identify capital measures
Inputs Utility bills Site drawings Aerial imaging Phone interviews
Identification of water-using equipmentDetermine water use for equipment, appliances, operations and fixtures
Measurement of all non-domestic equipment As-built listing of all water-using equipment
Outputs Checklists Engineering estimates of savings potential Spreadsheet calculations
More complex spreadsheet calculationsComputer water modelsDomestic savings potential based on actual flow measurementsPreliminary benefit/cost estimate
Financial evaluation of estimated capital investment and projected savingsDetailed construction-grade listing of all productsDetailed summary report
Water: Market Intelligence Report 2017 4544 Water: Market Intelligence Report 2017© Image courtesy of GreenCape, 2016

4.4. Water-sensitive design for rain, greywater and stormwater harvestingThere are opportunities for the design, manufacture, installation and maintenance of local water harvesting systems for rainwater, greywater or stormwater. The increased adoption of water-sensitive design (WSD) has also created increased opportunities for green infrastructure planners and installers.
Commissioned in 2014, the commercial retail rooftop rainwater harvesting system at the Bayside Mall in Cape Town, which provides on-site capture and flushing and irrigation functions, has exhibited an internal investment rate of return of 20%. It captures approximately 400 kl of water during an average Cape Town rainfall event.
OpportunitiesThere are opportunities for commercial rainwater harvesting where large roof sizes exist. Malls, warehouses or factories often provide bankable case-specific opportunities, depending on water use requirements. Stormwater harvesting on a neighbourhood or multi-erf scale (by private commercial developers or at utility scale) also exhibits commercially viable returns.
Most permeable pavements appear to be poorly designed at present, and their efficacy at storm-water treatment is misunderstood. There are increasing business opportunities in the geotextile market for permeable pavements as these systems are becoming more widely adopted.
Domestic rainwater harvesting and greywater reuse systems can easily be installed by suppliers or homeowners themselves, but often show limited business cases in winter rainfall climates.
Decentralised domestic wastewater treatment is seeing growing demand among homeowners and developers, especially where water can be reused for irrigation and safely discharged into the environment, and where municipal services are not available. Appendix J describes the opportunities and drivers for the application of decentralised domestic wastewater treatment.
DriversRising consumer demand for resource-conscious and green solutions is driving growth in the available range of water technologies and green solutions for residential property developments. Appendix K provides further details and insights on efficient water use beyond the meter.
There is also growing interest from urban planners, designers and landscape architects (especially in Cape Town and Johannesburg) in local harvesting and water-sensitive design solutions. Some municipalities have requirements for on-site treatment technology to limit water quality volumes if a development’s footprint is over a certain size. Cape Town requires new developments to maintain infiltration at pre-development levels. For example: greenfield sites must use permeable paving or natural infrastructure.
The central Water-Sensitive Design website (www.wsud.co.za) is becoming the focal point for resources and case studies in South Africa11. The Climate Systems Analysis Group, together with the Water Research Commission, have also recently developed an online tool for planning and decision-making on rainwater harvesting systems for many different roof types. A typical results screenshot for an average Cape Town suburban family is shown in Figure 2312.
11 https://goo.gl/UuTGgj12 https://goo.gl/ytHR2o Figure 23: Results screenshot from the rainwater harvesting toolkit
Water: Market Intelligence Report 2017 4746 Water: Market Intelligence Report 2017

BarriersOnly permeable paving, treatment swales and constructed wetlands are currently being used regularly for water-sensitive design in South Africa. There is an information gap between technology and solution providers, as well as developers and planners for local harvesting and water-sensitive design systems. Ideas can come from Australia, which is a world-leader in developing these approaches. Here, many councils now use integrated planning and design tools to assess and approve plans13. Other global leaders include Singapore and the USA (WERF 2009).
Additionally, the engineering planning and design guidelines known as the Red Book need updating to include water-sensitive design and
local water harvesting systems. Practitioners want to include and consider urban stormwater harvesting, green technology in civil systems and sustainable urban drainage systems but the different lexicons used by professionals are inhibiting implementation.
Recent studies have shown that there is still a limited business case for the standard domestic direct rainwater harvesting marketplace in winter rainfall environments. Most investments or installations are for large garden owners or for supply assurance and subjective purposes. The investment requirements are currently still too high and the use and collection patterns do not suit household consumption. Summer rainfall areas show vastly improved business cases for households.
13 http://ewater.org.au/products/music
4.5. Groundwater and managed aquifer rechargeIncreasingly, water authorities are emphasizing groundwater as a priority supply option. The total estimated yield of available, renewable groundwater in South Africa is between 7 and 10 billion m3/year, while between 2 and 4 billion m3/year is currently being used. Therefore, there is the potential to considerably increase groundwater supplies, especially in agriculture, because this is the major sector-user of groundwater (Figure 24) (WRC 2013c).
—The total estimated yield of available, renewable groundwater in South Africa is between 7 and 10 billion m3/year, while between 2 and 4 billion m3/year is currently being used.
The WCWSS also shows promising groundwater development potential, especially for Cape Town and the West Coast District Municipality. The last study on groundwater availability for Atlantis showed a safe yield of 18 million m3/year while the currently registered
extraction is 7.5 million m3/year (of which 5.9 million m3/year is for agriculture). The Cape Flats aquifer exhibits a safe yield of more than 17 million m3/year while the Langebaan Road wellfield can increase current abstraction to 3.5-5.5 million m3/year (WISA 2016).
The Atlantis Water Resource Management Scheme is an artificial groundwater recharge system that uses a series of constructed surface recharge basins. This scheme has been running for over 30 years and is managed by the CoCT. It is estimated that, on average, approximately 7 500 m3/day of stormwater and wastewater is recharged at a higher gradient of the extraction well field, augmenting the water supply by more than 2.7 million m3/year. Approximately 25-30% of Atlantis’s groundwater supply is augmented through artificial recharge (DWS 2010).
OpportunitiesArtificial recharge can be implemented in many places, on a large or small scale: Groundwater development companies and technologies coupled with advanced water treatment solutions are of interest to private equity investors. Areas potentially suitable for artificial recharge in South Africa have been identified using a geographic information system process and are presented on WMA scale maps14.
Cost, compared to new resource developments like desalination: No commercial pumped (forced injection) recharge schemes have been implemented in the Western Cape by the private sector. However, artificial recharge is working in some contexts and can be used to ensure water availability for later use. In Plettenberg Bay, the cost is one-fifth; and in Sedgefield, a quarter of the desalination capital cost (GreenCape analysis).
14 https://goo.gl/uLtFI3
Water: Market Intelligence Report 2017 4948 Water: Market Intelligence Report 2017
Figure 24: Groundwater use by sector in South Africa
• IRRIGATION
• WATER SUPPLY
• MINING
• OTHER
• LIVESTOCK
59%
13%
13%
9%
6%
© Image courtesy of GreenCape, 2016

—Artificial recharge is 70-80% cheaper than desalination. Artificial groundwater recharge has received increasing research attention in the past two years: Groundwater resources in the Western Cape are sustainably managed overall, while certain recharge opportunities are underexploited. If investors are considering artificial recharge, immediate level monitoring is essential. This will give a good indication of the aquifer’s potential to accept water. Electronic data loggers are easy to use and affordable. Other important time-series data include quality, reliability and yield of water available for recharge and groundwater abstraction from the aquifer.
The groundwater harvest potential map is the first attempt to provide quantitative information on sustainable rates of groundwater abstraction in South Africa on a countrywide basis. The main map depicts the maximum yield of groundwater that may be abstracted per square kilometer per annum without depleting the aquifers. Harvest potential was determined from groundwater recharge and groundwater storage. It includes data on factors restricting available harvest, mean borehole yields and electrical conductivity15.
Aquifer recharge schemes in Langebaan, Prince Albert, Plettenberg Bay and Calvinia are being discussed or explored as pilots or feasibility studies. A research project to determine the impact and feasibility of various groundwater abstraction and artificial recharge methods in Cape Town has recently been completed (Seyler et al. 2016). Furthermore, new agricultural production will be unlocked through (a) efficiency gains elsewhere or on farms; (b) investment in irrigation scheme infrastructure; and (c) groundwater extraction.
BarriersMarket-wide misunderstanding of groundwater resources and opportunities is the most significant barrier to the growth of groundwater companies. This barrier is not easily overcome, despite the increasing scarcity of surface resources. Contamination concerns for artificial recharge have also been mentioned as emerging barriers.
Western Cape groundwater levels generally follow normal seasonal fluctuations over the medium term. However, levels in parts of the Breede Water Management Area and Great Karoo are lower than the previous 3-4 years and a gradual long-term groundwater level decline is evident in the West Coast primary aquifers. Municipal wellfields need to be carefully monitored to provide early warning of impending supply problems to adapt operations and ensure sustainability (DWS 2016b).
15 https://goo.gl/v50mo6
Water: Market Intelligence Report 2017 5150 Water: Market Intelligence Report 2017© Image courtesy of GreenCape, 2016

4.6. DesalinationThere are immediate opportunities for small-scale, on-site desalination component manufacturers and developers, and water services companies for various applications. These range from brackish groundwater desalination for housing developments and industry to seawater desalination for coastal villages. Large-scale desalination opportunities will emerge in the next five years for coastal towns and cities, as well as for the treatment and reuse of mine and other industrial waters, including acid mine drainage.
—The desalination market has seen around 6.5% compound growth over past three decades, compared with 1.2% population growth and 3% economic growth.
Global cumulative investment in desalination plants reached around USD 21.4 billion during 2015. This is estimated to grow to USD 48 billion by 2020, at a
compound annual growth rate of 17.6% (WDR 2016). Overall, the desalination market has seen around 6.5% compound growth over past three decades, compared with 1.2% population growth and 3% economic growth (TCTA 2016).
OpportunitiesMunicipal desalination: CoCT is completing its feasibility study for seawater reverse osmosis desalination of 164 million m3 per year. Costs will be around R15 billion in capital costs and R1.2 billion in annual operational cost (GreenCape analysis and personal communications). Desalination will primarily be developed by metros, with Cape Town, Durban and Nelson Mandela Bay all exploring their options for large-scale plants. The private sector will have a significant role to play, with almost all plants being developed and operated by a consortium of private companies that hold long-term offtake agreements with utilities or municipalities.
Local manufacturing: Specialised filtration, metals and plastic products to be manufactured locally for this market may show competitive advantage and economies in the next few years.
16 https://goo.gl/n5ICX2
Figure 25: Global desalination by water source and use type
Beyond seawater: Globally, 98% of desalinated water is used in urban environments and is still mainly marine-sourced. But as Figure 2516 shows, desalination can also apply to many other source types — such as brackish ground, municipal, river and industrial. Lower quality waters in South Africa can also be desalinated.
DriversResilience to climate change and certainty of supply: Desalination is a future certainty for many countries, including South Africa’s. It improves resilience when adapting to climate change, especially where water demand is overtaking effective supply augmentation options. One local water master planner has even indicated that ‘it’s not a question of if, but when’. Desalination is often identified as the ‘ultimate endless resource’, providing the highest assurance of supply — assuming the energy, capital, environmental and demand-side risks can be adequately addressed.
Competitive pricing: Market studies indicate that South Africa can currently procure seawater reverse osmosis desalination at around USD 800-1500 kl/d in capital costs, with produced water costing between USD 0.6-1.2/kl in operating costs. Key variables are design, location, feed water quality, marine works, capacity, site selection and perceived risk (TCTA 2016).
Advances in process optimisation, control and energy recovery have allowed some plants to be designed for time-of-use energy sensitivity. The Hadera Desalination Plant is one of the world’s largest operating seawater reverse osmosis desalination plants. It has an innovative operating regime where the pressure centre design allows the water production rate to switch from 20 Ml/hour during the night power tariff to 8 Ml/hour during the day power tariffs. This change in operation regime minimises energy costs (Egozy and Faigon 2013).
Renewable energy is improving the business case: Renewable energy-powered desalination on a small scale is attracting growing interest and the business case is improving as water and energy costs rise.
BarriersProjects not addressing long-term water shortages: Numerous local and international case studies show that developing desalination as an emergency drought response can lead to significant unintended political and debt consequences. Unless a desalination project addresses a baseline water shortage in the longer term as part of a water supply mix, there is bound to be an element of demand-side risk. When desalination is used as a drought response in a region which is not perennially dry, the demand-side risk is especially acute. Australia’s Millennium Drought Response Desalination Programme, costing R153 billion in the last decade, has seen several plants not being used optimally, resulting in significant public financial implications. Appendix L provides further details and insights covering desalination project costs and sizes in South Africa and Australia.
Capital requirements of manufacturing: While the local market for reuse and desalination is growing, traditional reverse osmosis membrane manufacturing opportunities are limited because of the extremely high manufacturing sophistication and capital requirements involved.
Brine discharge from advanced water treatment or desalination is being considered as a resource with further extractable value, but remains a large environmental barrier to desalination projects.
Water: Market Intelligence Report 2017 5352 Water: Market Intelligence Report 2017
• SEAWATER
• BRACKISH WATER
• RIVER WATER
• PURE WATER
• WASTEWATER
• OTHER
59,2%
20,9%
9,5%
4,3%
5,7%
0,4%
• UTILITY
• INDUSTRIAL
• OTHER
55,2%
42,5%
2,4%
74.7 million m3 /dGlobal online capacity (2015)
74.7 million m3 /dGlobal online capacity (2015)

4.7. Reducing municipal non-revenue waterThe reduction of municipal NRW is a national priority. Municipalities currently use about 4 500 million m3/year, of which 37% is non-revenue water (WRC 2012), representing an estimated R7 billion in potential revenue (DWS 2014). There are opportunities for designers, consultants and planners of water loss reduction systems, as well as companies that manufacture, assemble and install components that help utilities understand and manage water losses. Opportunities range from metering and billing
systems, bulk meter calibration and assessment, pressure management and optimisation as well as leak detection, monitoring and repair.
NRW is water lost through physical leaks, commercial losses through meter under-registration, billing errors, theft and unbilled authorised consumption. The IWA Water Balance is a standard means of calculating and representing different types of water losses. South Africa’s water balance is shown in Figure 26.
Figure 26: Standard IWA Water Balance modified for South Africa
OpportunitiesWhile the Western Cape municipalities — specifically CoCT — lead the country in fixing leaks, numerous opportunities still exist in the province for the private sector. These opportunities lie particularly in the installation of leak detection systems and in leak repair. Only six Western Cape municipalities have adopted their WC/WDM plans, where the Council has voted and the required budget is in place. A further 13 municipalities have draft versions yet to be adopted.
There is definite scope for improvement given international NRW norms and benchmarks of 15-25% (FAO 2016). The most comprehensive national NRW levels in South Africa can be seen in Figure 27. However, NRW reduction programmes are capital-intensive. Cape Town's WC/WDM strategy budget for 2013-2022 is between R300-400 million annually, but payback periods for investments typically range between two and four years.
When making funding applications, key documents for analysis include the Bulk Water Master Plan, Water Services Development Plan, Integrated Development Plan, NRW or water conservation and demand management strategy and the Asset Management Plan. These are developed and published by Waster Services Authorities.
Budgets for municipal non-revenue water programmes can be sourced from:
■ internal municipal sources of finance ■ DWS (physical losses, available three times
annually) ■ Department of Cooperative Governance
and Traditional Affairs (commercial losses, available three times annually)
■ Department of Human Settlements ■ Department of Housing ■ Department of Energy ■ commercial loans ■ grant funding17.
Figure 27: Municipal non-revenue water at the 2012 baseline
17 See https://goo.gl/rbk3wq for examples
System Input Volume (100%):
1. Total water treated and measured at
treatment works outlet
2. Total water pumped directly from boreholes into reticulation
system
3. Total water purchased from bulk
water services provider
AuthorisedConsumption
(68.2%):
1. Billed metered water
2. Billed un-metered Water
3. Unbilled metered water
4. Unbilled un-metered water
Billed Metered:1. Water is billed for based on a
metered consumption(see further explanatory notes)
Revenue Water (63.2%):
1. Billed metered
2. Billed un-metered
Billed Un-metered: 1.Water is billed based on a flat
rate tariff (ie not based on a meter reading) based on a meter reading)
2. Free basic water used through unbilled unmetered
standpipes or yard connections (see further explanatory notes)
Unbilled Metered: 1. Usually very small in RSA can include government buildings or
parks that is metered but not billed.
Non Revenue Water (36.8%):
1. Unbilled metered
2. Unbilled un-metered
3. Apparent losses
4. Real losses
Unbilled un-metered: 1. Estimated water used for legitimate
purposes such as fire fighting. Also usage above free basic water for
unmetered unbilled standpipes and yard connection usage (see notes)
Total Losses (31.8%):
Total water not used for
legitimate purposes
1. Apparent losses
2. Real losses
Apparent Losses:1. Water used through illegal
connections2. Water used but not billed for because of inaccurate meters
3. Water used but not billed for because of data transfer errors, low estimated readings or any
administrative errors.
Real Losses:1. Water that leaks from the system
through pipesand connections or overflows from
reservoirs
Water: Market Intelligence Report 2017 5554 Water: Market Intelligence Report 2017

DriversThe National Development Plan assumes it is possible to achieve an average reduction in water demand of 15% below baseline levels (taken at 2012) in urban areas by 2030. A key factor in a NRW programme happening is political will and councillor awareness. The Auditor-General’s findings on water balances and losses are concentrating political and investor minds on addressing NRW. The DWS’s No Drop programme is also becoming a formal reporting requirement, standardising performance indicators across the country.
The DWS will not provide funding for water infrastructure if the municipal NRW rate is high. It should be below 20%. There are four major triggers for initiating a NRW reduction programme within a municipality:
■ water resource constraint (no water or not enough);
■ regulatory compliance (No Drop/Blue Drop status);
■ auditory compliance (Auditor-General’s findings on water losses);
■ revenue enhancement (more money for the municipality).
The DWS has developed an excellent web tool to search and understand the differences in NRW across the country18. This will hopefully help service providers and municipalities to understand where interventions are required most urgently.
The highest NRW rates are found in the smaller, more rural municipalities. Fortunately, their impact is not large because small municipalities only use about 17% of the national yield, whereas metros use about half. However, NRW is increasing fastest in the medium-sized municipalities. This is most probably because they still have relatively complex systems, but lack the skills and capacity to manage them.
GreenCape is developing a NRW technical guide focusing on:
■ The development of tools to assist municipalities in developing NRW programmes, including a technical guide for NRW reduction potential assessment;
■ Case study development of a successful municipal implementation non-revenue water reduction programme with associated business case; and
■ Assessment of financing sources for municipalities for non-revenue water reduction programmes.
BarriersSkills: Around 10% of qualified engineers in the water sector work for local government, while the ideal and sustainable percentage is around 30%. This has caused asset management, the municipal business of water, operations and maintenance in many municipalities to become severely neglected. At any given time, about half of South Africa’s municipalities cannot provide reliable water balance data, apparently because of a lack of water meters combined with inadequate skills and capacity.
Performance-based contracts are difficult to develop and are often seen as relationship breakers due to issues with network controls. There are also challenges in establishing savings baselines and definitions. Municipal capacity to develop bankable project proposals is also limited (to access funding for non-revenue water projects when off-budget financing is required).
Overall, there is currently a lack of political will to prioritise non-revenue water projects, as well as limited compliance and enforcement capabilities among authorities tasked to reduce commercial and physical water losses. Ring-fencing the water business in many municipalities is not adequately addressed. In other words, for example, revenue generated in the water business is not being used for dealing with water services. This is exacerbated by a lack of monitoring from the DWS on WC/WDM strategies they have helped implement.
18 See https://goo.gl/M3MSfk
5 –Funding and incentives
5.1. Market activitySouth Africa ranks 13th out of 21 countries to use tax as an incentive to drive the green growth agenda (ahead of Australia, Singapore, and Finland) according to the KPMG Green Tax Index. Investors and suppliers can benefit from understanding the various incentive and funding options available to them as well as understanding those available to their customers or clients, as these can influence the viability and attractiveness of their products and projects.
Investment interest in the water sectorInvestment interest in companies along the water value chain is steadily growing, driven by public sector challenges as well as increasing local and global water scarcity. Most of the green technology and investment business opportunities are currently in treatment technology, new resources, and certain water services, and not in municipal systems or infrastructure. Increasing water pricing will be the predominant driver for water tech innovation and investments in different solutions.
There is further interest from investors in the water sector, driven by drought (scarcity), rising prices, attractive returns for certain business models, and an appreciation of how the private sector can assist the government in water services. Water as a financed service will most likely become the greatest opportunity area for investors (as in the energy services marketplace), along with new water resources (reuse, groundwater, desalination, advanced treatment, etc.).
The greatest perceived barrier for investors is regulatory requirements to trading water, even on a small scale.
5.2. Green Finance DatabaseTable 7 below demonstrates a wide variety of these funding solutions. It is not exhaustive, but intends to be indicative of some of the most green-focused funds or incentives available, and provide potential leads or starting points to explore various options. Further to those below, the full range of government investment incentives can be found at www.investmentincentives.co.za.
A range of funding solutions is available to green technology manufacturers and service companies, as well as those who use or procure such goods and services. These cover Development Finance Institutions (DFI), local public and private sector financiers and
investors, and a considerable range of tax incentives.
Water: Market Intelligence Report 2017 5756 Water: Market Intelligence Report 2017

Table 7: List of funding solutions in the green economy
Entity Name Opportunity overview Product Website
Commercial Bank
GroFin Financing and supporting small and growing businesses across Africa and the Middle East.
Loan https://goo.gl/Iiynqq
Investec Power & Infrastructure Finance: Arranger and underwriter of debt for projects. Selectively develops and take equity in projects.
Loan Equity
https://goo.gl/CC4JJa
Old Mutual IDEAS fund: Invests in commercially viable developmental projects in SADC.
Equity https://goo.gl/UUl6nh
Nedbank Responsible lending that rejects transactions that do not meet the required- sustainability standards, and includes guidance to enable compliance.
Loan www.nedbank.co.za
Nedbank / WWF The Green Trust supports programmes with a strong community-based conservation focus in multiple areas, including climate change.
Grant https://goo.gl/DMSiHA
SCF Capital Solutions
Unsecured working capital based on invoice or supply contracts. R250k - R5m is offered with interest rates of 2-3% per month.
Loan http://www.scfcap.com/
Development Finance Institutions
German Investment Corporation
Amount ranging R4m-R30m for a duration of 4 years.
Loan Equity
www.deginvest.de
Development Bank of South Africa
For green initiatives related to the green economy.
Loan Equity Grant
www.sagreenfund.org.za
European Investment Bank
Direct and intermediated loans, minority investments in specialist private equity funds focussing on renewable energy and energy efficiency projects in emerging markets.
Loan www.eib.org
GEF Special Climate Change Fund
Worth, ~USD350m, the fund is designed to finance activities, programs and measures under the following four financing windows: Adaptation to climate change (top priority), technology transfer, mitigation in selected sectors including: energy, transport, industry, agriculture, forestry and waste management, and economic diversification.
Grant https://goo.gl/lQNu2i
German Bank for Reconstruction & Development (KfW)
For public entities focussing on energy and climate change
Loan https://goo.gl/RALjfZ
Global Environmental Facility
The Small Grants programme (SGP) invests in communities affected by environmental degradation.
Grant https://goo.gl/qwA6Ed
International Finance Corporation
Funds private sector development projects. May fund smaller businesses through financial intermediaries that on-lend.
Loan Equity
https://goo.gl/k4Br3Z
Overseas Private Investment Corporation
Private project development focussed on renewable resources (and less on technology, health care, food and people). Involvement of a US company preferred.
Loan Guaran-tee
www.opic.gov
The African Development Bank
Development projects in the public and private sectors.
Loan https://goo.gl/QnTCz4
Global Innovation Fund
Invests in social innovations that aim to improve the lives and opportunities of millions of people in the developing world.
GrantEquityLoan
www.globalinnovation.fund/
World Bank World Bank Green Bonds are an opportunity to invest in climate solutions through a high-quality credit fixed income product.
Loan https://goo.gl/RBZMGS
Government Department
Department of Higher Education and Training
National Skills Fund: Finances costs directly related to the delivery of learning – not infrastructure and/or ongoing operational costs of SETAs.
Grant www.dhet.gov.za/
Department of Science and Technology
11D Tax Incentive: Undertaking R&D in South Africa qualifies for a 150% tax deduction of operational R&D expenditure.
Rebate www.dst.gov.za/r-d
dti Industrial Financing Loan Facilities encourage manufacturers to upgrade production facilities.
Loan www.thedti.gov.za
dti 12I Tax Allowance Incentive supports capital investment and training. Application deadline: 31 December 2017
Rebate www.thedti.gov.za/
IDC Industrial financing loan facilities (the Working Capital Component) to promote competitiveness in manufacturing while ensuring job retention in the sector
Loan https://goo.gl/FySmGc
Department of Small Business Development
The Black Business Supplier Development Programme (BBSDP) is offered to small black-owned enterprises to improve their competitiveness and sustainability.
Grant http://bbsdpgrants.co.za
dti Black Industrialist Scheme: Unlocks industrial potential through targeted and financial and non-financial interventions, described in the IPAP and other government policies.
Grant www.thedti.gov.za
dti Strategic Partnership Programme (SPP) supports manufacturing and services supply capacity of suppliers with linkages to strategic partner’s supply chains, industries or sectors
Grant www.thedti.gov.za
dti The Capital Projects Feasibility Programme (CPFP) contributes to feasibility studies that lead to projects increasing local exports
Grant www.thedti.gov.za
Water: Market Intelligence Report 2017 5958 Water: Market Intelligence Report 2017

dti Critical Infrastructure Grant (CIG): A cost sharing grant for projects to improve critical infrastructure.
Grant http://www.thedti.gov.za
Department of Small Business Development
Co-operative incentive Scheme (CIS): A 100% grant for registered primary co-operatives.
Grant http://bbsdpgrants.co.za
Department of Small Business Development
The Shared Economic Infrastructure Facility (SEIF) provides an enabling environment to crowd in investment, mostly in townships, rural areas and the inner city.
Grant http://bbsdpgrants.co.za
dti Sector Specific Assistance Scheme (SSAS): A reimbursable 80:20 cost-sharing grant offering financial support to for-profit export councils, joint action groups and industry associations.
Grant http://www.thedti.gov.za
dti Export Marketing & Investment Assistance Scheme: Develops export markets for local goods and services, and recruits new foreign direct investment.
Other http://www.thedti.gov.za
National Research Foundation
Research/study funding for public tertiary institutions.
Grant http://www.nrf.ac.za
dti The Technology and Human Resources for Industry Programme (THRIP) is a research and development programme.
Grant http://www.thedti.gov.za
Small Enterprise Development Agency
Seda Technology Programme (STP) is responsible for the provision of technology transfer, business incubation and quality support services for small enterprise. Excludes R&D.
Grant www.seda.org.za
Small Enterprise Development Agency
Direct Lending where individuals apply directly to sefa. Direct Lending: R50k - R5m with tenors of 1-5yrs.
Loan Guaran-tee
www.seda.org.za
Small Enterprise Development Agency
Wholesale Lending where financial intermediaries (Joint ventures, funds, RFI, MFI) are used. R20m-R100m with tenors of 1-5yrs.
Loan Guaran-tee
www.seda.org.za
South African Revenue Services
37B and 37C: Deductions regarding environmental expenditure and environmental maintenance.
Rebate https://goo.gl/sC5Wos
South African Revenue Services
12K Clean Development Mechanisms (CDM) Tax Incentive (2009): South African businesses receiving CDM benefits are exempt from tax derived from such benefits, in Income Tax or Capital Gains Tax.
Rebate www.sars.gov.za
Western Cape Government - DEDAT
Cape Capital Fund: Grows small businesses in agri-processing and oil and gas sectors: supports purchase or new equipment and and improvement of business processes.
Grants https://goo.gl/OUHkJm
Technology Innovation Agency
Financial support to proposals based on merit. Includes R&D funding.
GrantsLoansEquity
http://www.tia.org.za
Private Equity
Atlantic Asset Management
Focus: Intermediaries or businesses creating new jobs with a record less than 5 years. Investment range of R15m-R60m with a duration of 3-5yrs.
Loan www.atlanticam.com
Business Partners
For: Businesses which actively develop, manufacture and provide goods and services by implementing measures and/or technology which reduce their adverse impact on the environment. Investment range: R500k-R30m.
Equity Loan
www.businesspartners.co.za
Adlevo Capital Investments available to the public and private sector with technology-enabled business models.
Equity www.adlevocapital.com
Treacle Private Equity
Equity capital to mid-market private and small cap listed companies in Southern Africa.
Equity www.treacle.co.za
Sovereign Funds
Entrepreneurial Development Bank of Netherlands (FMO)
Supports private sector entrepreneurship in developing countries: energy, agribusiness, food and water.
Loan Guaran-tee Equity
www.fmo.nl/home
French Agency for Development (AFD)
Development projects in energy, water, municipal sector support and biodiversity.
Loan Guaran-tee Grant
https://goo.gl/7QuiyH
German Federal Ministry for the Environment, Nature Conservation, Building and Nuclear Safety (BMUB)
International Climate Initiative (IKI), supports climate and biodiversity projects in developing countries. Fund size: EUR 120m, annually.
Grant https://goo.gl/9qJEEb
Ireland Development Cooperation
Projects across various sectors involving an Irish Partner company.
Grant www.idaireland.com
Japan Bank for International Cooperation
Focus areas: Energy & Natural Resources, Infrastructure & Environment and industry finance. Accessed through a Japanese business partner.
Loan Equity
www.jbic.go.jp/en/finance
Japan International Cooperation Agency
Intergovernmental work regarding technical cooperation.
Loan Grant
www.jica.go.jp/english
PROPARCO Private sector development projects (energy, infrastructure, agriculture, etc.).
EquityLoan
https://goo.gl/XQ7IOb
United Kingdom: Prosperity Fund Programme
Fund to tackle climate change, strengthen energy security and promote an open global economy in emerging economies.
Grant https://goo.gl/Rn4jLX
Embassy of Finland
Local Co-operation Fund: Supports initiatives in export and investment promotion, businesses and other groups.
Grant https://goo.gl/AmNv2P
Water: Market Intelligence Report 2017 6160 Water: Market Intelligence Report 2017

Venture Capital
4Di Capital An independent seed- and early-stage technology venture capital firm based in Cape Town.
Equity www.4dicapital.com/
AngelHub Ventures
Angel seed fund investing into lean start-ups with disruptive business models and technologies. Investment range: R500k-R5m
Grant www.angelhub.co.za/
Edge Growth Edge Growth has 2 funds to fund Green projects. Investment range: R1m-R20m. For: SMEs that have limited equity or don't qualify for credit from a bank.
Loan Equity
www.edgegrowth.com
Hasso Plattner Ventures Africa
Invests solely in fast-growing and IT-driven companies in seed stage or growth stage.
Equity www.hp-ventures.co.za/
Other
Anglo-American Zimele Green Fund
Targets opportunities that mitigate carbon, reduce energy and water consumption, and improve waste and emissions management in the Anglo-American value chain. The Fund provides funding of up to R10 million per project or business.
Grant https://goo.gl/wr4cPF
5.3. Manufacturing incentives and the Atlantis Greentech Special Economic ZoneThe dti’s special economic zone (SEZ) programme aims to increase industrialisation, economic development and job creation around the country. There are strong linkages between renewable energy projects in the Northern, Eastern and Western Cape with Atlantis providing a central hub focused on greentech manufacturing. This provides significant incentives to manufacturers, IPPs, and other players in the relevant value chains.
The Atlantis SEZ is an ideal location for the manufacturing of components that contribute towards local content. An example of this is the Gestamp Renewable Industry (GRI) wind tower manufacturing facility set up in Atlantis. Atlantis has also seen companies such as Skyward Windows expand to include green product lines.
The dti has proposed a number of incentives to attract investors into the proposed SEZs, which include:
■ Reduced Corporate Income Tax Rate: qualifying companies will receive a reduced corporate tax of 15%, instead of the current 28% headline rate.
■ Employment Tax Incentive (ETI): aimed at encouraging employers to hire young and less-experienced work seekers. It will reduce the cost to employers of hiring young people through a cost sharing mechanism with government.
■ Building Allowance: qualifying companies will be eligible for an accelerated depreciation allowance on capital structures (buildings). This rate will equal 10% per annum over 10 years.
■ VAT and Customs Relief: companies located within a customs-controlled area (CCA) will be eligible for VAT and customs relief as per the relevant legislation (dti, 2015c).
Other incentives available to investments into a designated SEZ will include:
■ 12i Tax Allowance Incentive (Application deadline: 31 December 2017)
■ One-stop-shop facility within designated SEZ area
■ SEZ fund for infrastructure development within the designated area.
■ Within Atlantis, the City of Cape Town has made vast tracts of land available at low cost for purchase or lease by greentech companies through an accelerated land disposal process. The SEZ application for the Atlantis Industrial Area to be declared an SEZ has been submitted by the Western Cape Provincial Government, a decision on which is expected in the first half of 2017.
GreenCape’s Atlantis SEZ team can assist with information, and facilitate access to permits, licenses, planning and development approvals, incentives and finance. It is also worth noting that the dti has been willing to assure investors that investing prior to SEZ designation will not disqualify them from receiving benefits once the zone is designated.
Water: Market Intelligence Report 2017 6362 Water: Market Intelligence Report 2017

6 –The Western Cape:
Africa’s green economy hub
The Western Cape is a world-class investment destination.
The province provides businesses and investors with prime locations, modern infrastructure, a skilled workforce, low operational costs and an abundance of natural resources. It is also a sought-after place to live, with unrivalled natural beauty, vibrant culture, excellent schools and universities, and an outstanding quality of life. Cape Town has been ranked among the top 21 global investment destinations by Foreign Direct Investment (fDi) Intelligence, a division of the Financial Times.
A great place for green businessThere are compelling reasons why the Western Cape Province is viewed by many as Africa’s green economic hub. Coupled with a strong and rapidly growing market for green technology and services in South Africa and beyond, the Western Cape offers:
■ Africa’s renewable energy and cleantech hub, with a critical mass of leading companies present.
■ Local presence of major professional services and financiers.
■ Significant market opportunities for businesses and investors in agriculture, energy services, utility scale solar and wind, waste, water, bioeconomy and resource efficiency.
■ A supportive government that has made ease of doing business and the green economy key priorities.
■ Five universities with comprehensive R&D capabilities and dedicated green economy skills programmes.
■ A range of investment incentives in proposed Atlantis Greentech Special Economic Zone (SEZ).
Supporting businesses and investorsThe province also offers dedicated support for businesses and investors focusing on green tech and services, including:
GreenCape: Provides dedicated support and market intelligence to green economy sectors
Wesgro: The official investment and trade promotion agency for the Western Cape
SAREBI: A business incubator providing non-financial support to green entrepreneurs
SARETEC: Offers specialised industry-related and accredited training for the wind and solar industries
Businesses and investors will soon be able to make use of a convenient one-stop-shop for investment support, offered by the Department of Trade and Industry (dti), the WCG and the City of Cape Town. Called the Cape Investor Centre, it will house various institutions with a permanent or semi-permanent presence at the centre.
Market opportunities in the province and South AfricaSome of the major market opportunity areas in the province and South Africa in the next five years are outlined in the graphic on the next page (see individual MIRs and the GreenCape website for more information).
Major market opportunities: Western Cape and South Africa
Agriculture
Energy services (SA-wide)
Utility scale renewable energy (SA-wide)
Solar irrigation R2.9 bn market (SA)
Controlled environment agricultureR600 m potential market; 15% growth p.a. (WC)
Conservation agricultureR114 m market, ~R1 bn potential market (SA)
Solar energy for packhousesR1 bn potential market (WC)
Sustainable agricultureTools, data analysis, machinery rentals, local manufacturing, financing
Precision agriculture Tech & services to improve water & energy efficiency
Solar PV systems & components 500 MWp installed capacity & R2 bn investments predicted (2016-2019)
Local manufacturing & assemblySolar PV systems and components – systems require compliance with local content regulations
Energy efficiency retrofitting 100 000+ public buildings require retrofitting
Independent power production Ministerial determination for 6.3 GWp more RE generation capacity: 1.1 GW (670 MW wind; 450 MW solar) p.a.
Local manufacturing Through REIPPPP local content requirements
Rest of Africa RE deployment in the rest of Africa, some programmes mirroring REIPPPP
Waste
Municipal PPPPublic-private partnership projects of R1.3 bn (WC)
Construction & demolition wasteGrowing reuse & recycling market
Secondary materials Robust & growing market for plastics, metals, e-waste, etc.
Water
Industrial water reuseRecycling & resource recovery; R600 m market: (WC)
Local resource developmentBrackish water desalination, ground, storm & grey water
Water & energy Opportunities for efficiency & use of renewables
Food value retention R600 m value through improved cold chain management & waste reduction (WC)
Biogas For LPG replacement, heating & electricity generation: >R450 m market, R18 bn potential market, 395 MW potential generation (WC)
Solar thermal>R100 m industrial-scale installations, R3.7 bn potential market for agri-processing (SA)
Bioeconomy & resource efficiency
64 Water: Market Intelligence Report 2017

R&D capabilities and skills The region’s five universities – University of Cape Town, Stellenbosch University, University of the Western Cape, the Cape Peninsula University of Technology and the George campus of the Nelson Mandela Metropolitan University – underpin all of this with comprehensive research and development (R&D) capabilities and dedicated green economy skills programmes.
Atlantis Greentech Special Economic Zone (SEZ): Investment incentivesThe City of Cape Town established a greentech manufacturing hub in Atlantis in 2011 in response to the government’s focus on localisation of manufacturing as part of the Department of Energy’s Renewable Energy Independent Power Producer Programme (REIPPPP).
The City has made tracts of land available at low cost for purchase or lease by greentech companies through an accelerated land disposal process. A number of other financial and non-financial incentives are also on offer, including discounted electricity and rapid turnaround on development applications.
An application has now been submitted by the Western Cape Provincial Government for the Atlantis Industrial area to be declared a Greentech SEZ, a decision on which is expected in 2017. GreenCape’s Atlantis SEZ team can assist with information, and facilitate access to permits, licenses, planning and development approvals, incentives and finance.
Water: Market Intelligence Report 2017 6766 Water: Market Intelligence Report 2017© Image courtesy of Western Cape Department of Agriculture, 2015

7 –GreenCape’s support to businesses and investors
GreenCape is a non-profit organisation that drives the widespread adoption of economically viable green economy solutions from the Western Cape. Our vision is for South
Africa to be the green economic hub of Africa.
We work with businesses, investors, academia and government to help unlock the investment and employment potential of green tech and services, and to support a transition to a resilient green economy.
We assist businesses by removing barriers to their establishment and growth and provide our members with:
■ free, credible and impartial market information and insights
■ access to networks of key players in government, industry, finance and academia
■ an advocacy platform to help create an enabling policy and regulatory environment for green business
We assist local, provincial and national government to build a resilient green economy by providing:
■ support on the development of standards, regulations, tools and policies
■ expert technical knowledge on key sectors in the green economy
■ access to networks of key players across business, academia, and internationally
Since inception in 2010, GreenCape has grown to a multi-disciplinary team of over 40 staff members, representing backgrounds in finance, engineering, environmental science and economics. We have facilitated and supported R17bn of investments in renewable energy projects and manufacturing.
From these investments, more than 10 000 jobs have been created. Through our WISP (Industrial symbiosis) programme, by connecting businesses with waste / under-used resources, we have to date diverted over 4360 tonnes of waste from landfill.
Our Market Intelligence Reports form part of a working body of information generated by sector desks and projects within GreenCape’s three main programmes – energy, waste and resources.
Figure 29 below shows the different focus areas within each of our programmes.
Benefits of becoming a GreenCape memberWe currently have over 800 members, and offer free membership. Becoming a member of GreenCape will give you access to the latest information regarding developments in the various sectors; access to tools, reports, and project information; and offer you the opportunity – through our networking events – to meet and interact with various stakeholders in the green economy.
Cross-border matchmaking through the International Cleantech NetworkGreenCape’s membership of the International Cleantech Network (ICN) gives our members access to international business opportunities in countries where other cleantech clusters are based (mainly Europe and North America).
1
5
6 2
4
Our focus areas
3Reduced
WASTE
Cle
an &
Effic
ient
EN
ERG
Y
Sustainableuse of naturalRESOURCES
Western Cape Industrial Symbiosis Programme (WISP)
The team matches businesses to share unused resources, cut costs and create value.
Water
Water provision and economic development; greentech opportunities for water use efficiency, treatment and reuse.
Agriculture and Bio-Based Value Chains
Sustainable agriculture, valorisation of wastes to high value bio-products, including bio-energy.
Renewable Energy
Utility-scale projects, small-scale embedded generation, and localisation of component manufacture.
Energy Services
Commercial, industrial and agricultural energy efficiency and embedded generation; incentives and financing options.
Alternative Waste Treatment
Municipal decision-making and policy and legislative tools on alternative waste treatment options; small-scale biogas, recycling and reuse (dry recyclables, construction and demolition waste).
1
2
3
4
5
6
For investors looking for opportunities in South Africa, GreenCape’s Cross-border Matchmaking Facility offers a business matchmaking facility for green firms and entrepreneurs.
The matchmaking team helps international inbound firms and entrepreneurs looking for South African partners in the green economy. The team assists with contacts, introductions and matches to South African businesses. They also offer matchmaking activities for trade offices, missions and other inbound interests. These services can be accessed via the ICN passport or directly with GreenCape.
To become a member or to get your ICN passport, please contact GreenCapeor visit our website: www.greencape.co.za
Figure 29: GreenCape’s focus areas
Water: Market Intelligence Report 2017 6968 Water: Market Intelligence Report 2017

8 –References
Australian Renewable Energy Agency (ARENA) 2015. Renewable energy opportunities in the Australian water sector. Available online: https://goo.gl/3MGZGs.
BlueTech Research 2016. Smart water. Available online: https://goo.gl/dLiVVI.City of Cape Town (CCT) 2015. Media release: Cape Town scoops major water award in Paris. Available online: https://goo.gl/uY12WK.
Department of Trade and Industry (DTI) 2015. Industrial development financial assistance (incentives). Available online: https://goo.gl/NoE6zS.
Department of Water and Sanitation (DWS) 2007. Reconciliation strategy for the Western Cape Water Supply System. Pretoria, South African Government. Available online: https://goo.gl/GAr2CG.
Department of Water and Sanitation DWS 2010. The Atlantis Water Resource Management Scheme: 30 years of artificial groundwater recharge. Available online: https://goo.gl/VQv1UD.
Department of Water and Sanitation (DWS) 2013a. Strategic overview of the water sector in South Africa. Pretoria, South African Government.
Department of Water and Sanitation(DWS) 2013b. National water resources strategy: June 2013 (second edition). Pretoria, South African Government. Available online: https://goo.gl/RnvYLB.
Department of Water and Sanitation (DWS) 2014. Assessment of non-revenue water and water losses in South Africa: August 2014. Pretoria, South African Government.
Department of Water and Sanitation (DWS) 2015a. Support to the continuation of the water reconciliation strategy for the Western Cape water supply system: status report October 2015.
Prepared by Umvoto Africa in association with WorleyParsons RSA on behalf of the Directorate: National Water Resource Planning. Pretoria, South African Government. Available online: https://goo.gl/5ZSdLE.
Department of Water and Sanitation (DWS) 2015b. National pricing strategy for water use charges. Pretoria, South African Government. Department of Water and Sanitation (DWS) 2016a. Strategic overview of the water services sector in South Africa 2016. Pretoria, South African Government.
Department of Water and Sanitation (DWS) 2016b. Groundwater status report: Western Cape region, GH 4197 January 2016. Pretoria, South African Government.
Egozy Y and Faigon M 2013. The operation principle of the Hadera Seawater Desalination Plant and advantages of the pressure center design. Available online: https://goo.gl/tDd8W3.
eThekwini Municipality 2016. The Durban Water Recycling project. Available online: https://goo.gl/m8S3SH.
Food and Agriculture Organization of the United Nations (FAO) 2016. AQUASTAT website. Available online: https://goo.gl/LBbF8U.
Gisclon A, McCarley A and McNally K (2002). The Durban Water Recycling project - the vision becomes reality. Paper presented at the Biennial Conference of the Water Institute of Southern Africa (WISA) 19-23 May 2002, Durban.
International Water Association (IWA) 2012. Water - energy interactions in water reuse. Available online: https://goo.gl/pf2nct.
IPCC 2014. Summary for Policymakers. In: Climate Change 2014: Impacts, Adaptation, and Vulnerability. Part A: Global and Sectoral Aspects. Contribution of Working Group II to the Fifth Assessment Report of the Intergovernmental Panel on Climate Change.
Cambridge University Press, Cambridge. Available online: https://goo.gl/RoMnbr.ITU 2015. Smart water management. Available online: https://goo.gl/tdcYkV.
ITU & UNESCO 2014. Partnering for solutions: ICTs in smart water management. Available online: https://goo.gl/82ryHe.
Metering & Smart Energy International 2015. Cellular-enabled smart water meters gain traction in US. Available online: https://goo.gl/vCMcQd.Millson C 2016. Potable water from sewage: leadership for overcoming the Yuck Factor. Draft paper, July 2016.
National Business initiative (NBI) 2015. Surface tension: CDP South Africa water executive summary 2015. Available online: https://goo.gl/6Xjw1s.
National Business initiative (NBI) 2016a. Water risk and resilience in South Africa: presentation to GreenCape networking event 13 October 2016. Johannesburg, NBI.
National Business initiative (NBI) 2016b. CDP South Africa water executive summary 2016. Available online: https://goo.gl/6Xjw1s.Piper PE 2008. The role of water use audits. https://goo.gl/D9n3VP.
Seyler H, Bollaert M and Witthueser K 2016. Regional water-sensitive design scenario planning for Cape Town using an urban (Geo)hydrology model. October 2016 draft report.Statistics South Africa (StatsSA) 2010. Water management areas in South Africa: discussion document D0405.8. Available online: https://goo.gl/vQkFwI.
Trans Caledon Tunnel Authority (TCTA) 2016. Seawater desalination: why is it relevant, and how can it help us deal with climate extremes. Knowledge sharing session, 19 July 2016.
Trade and Industrial Policy Strategies (TIPS) 2016. The real economy bulletin - second quarter 2016. Briefing note: impacts of the drought. https://goo.gl/Vf8F6p.
Veolia Water Technologies 2016. The true cost of water. Available online: https://goo.gl/EYKuPX.Water Desalination Report (WDR) 2016. Seawater and brackish water desalination report 2016. Available online: https://goo.gl/bK0e7w.
Water Research Commission (WRC) 2011a. Introduction to integrated water meter management. Report number: TT490/11. Available online: https://goo.gl/VFdyFP.
Water Research Commission (WRC) 2012. The state of non-revenue water in South Africa. Report number TT522/12. Available online: https://goo.gl/VFdyFP.
Water Research Commission (WRC) 2013a. Energy efficiency in the South African water industry: a compendium of best practices and case studies. Report number TT565/13. Available online: https://goo.gl/VFdyFP.
Water Research Commission (WRC) 2013b. ICTs in the water sector – where do we stand? Report number TT571/13. Available online: https://goo.gl/VFdyFP.
Water Research Commission (WRC) 2013b. Press release: groundwater use potential for South Africa. Available online: https://goo.gl/6cgQuW.
Water Research Commission (WRC) 2014. Water in the Western Cape economy. Report to the Water Research Commission. Report number 2075/1/13. Available online: https://goo.gl/VFdyFP.
Water Research Commission (WRC) 2015a. Workshop on advanced water metering, 16 November 2016, Johannesburg.
Water Research Commission (WRC) 2015b. Evaluation framework for advanced water metering projects - user guide. Project number K5/2370, November 2015 draft.
Water: Market Intelligence Report 2017 7170 Water: Market Intelligence Report 2017

Water Research Commission (WRC) 2015c. Investigation into the cost and operation of Southern African desalination and water reuse plants: Volume III: best practices on cost and operation of desalination and water reuse plants. Report number TT638/15. Available online: https://goo.gl/VFdyFP.
Water Research Commission (WRC) 2016. Energy use reduction in biological nutrient removal wastewater treatment plants: A South African case study. Report number TT654/15. Available online: https://goo.gl/VFdyFP.
WCDoA & WCDEA & DP 2015. A status quo review of climate change and the agriculture sector of the Western Cape Province. Chapter 1: Introduction. Available online: https://goo.gl/Z9qFzO.
Water Environment Research Foundation (WERF) 2009. Using rainwater to Grow Livable Communities: Sustainable Stormwater Best Management Practices. Available online: https://goo.gl/yooXtp.
Water Institute of South Africa (WISA) 2016. WISA seminar: emerging water supply in times of drought, 7 June 2016. Stellenbosch.
World Economic Forum (WEF) 2016. Global risks report 2016. Available online: https://goo.gl/cyHfal.
World Resources Institute) (WRI) 2015. Aqueduct projected water stress country rankings. Available online: https://goo.gl/o4UrqN.
WWF 2013. An introduction to South Africa's Water Source Areas. Available online: https://goo.gl/yvE8B4.
WWF-SA 2016. Water: Facts & Futures. Available online: https://goo.gl/ihDGbP.
For readers of the electronic version of this MIR, appendices are included below. For readers of the printed version, visit www.greencape.co.za/market-intelligence to view or download the appendices.
9.1. Appendix A: List of drought, climate monitoring and forecasting resources
9 –Appendices
Name Details Link
Department of Water and Sanitation: National Integrated Water Information System (NIWIS)
■ Dam levels & trends ■ Rainfall trends ■ Drought status reports, alerts, and
warnings ■ Drought-related queries contacts
https://goo.gl/tE4LLf
Department of Agriculture, Forestry and Fisheries: National Agro-meteorological Committee (NAC) Advisory
■ Farming conditions ■ Provincial and SADC farming status ■ Agricultural markets ■ Monthly outlook for the coming season ■ Suggested strategies for farmers given
forecasts
https://goo.gl/sPTvdq
Water Research Commission: Knowledge Gateway
■ Links, downloads, and FAQs https://goo.gl/1DsXUX
University of Cape Town Climate Systems Analysis Group: Global Forecasting Centre for Southern Africa
■ Global and regional forecasts for rainfall and other variables
■ Multiple links to other seasonal climate forecasts for the region
https://goo.gl/Tayd2X
South African Weather Service: Seasonal Forecasts
■ Seasonal forecasts for South Africa https://goo.gl/0mwfYp
State of the country’s dams and other surface water
■ Data from the Hydrological Information System
■ Near real-time flows and rainfall in major rivers in South Africa
■ Daily flows, dam levels and rainfall information in the Vaal and Orange River systems
■ Weekly: state of ~180 dams in South Africa ■ Provincial rainfall trends
https://goo.gl/e4QGA2
Western Cape Government Climate Change Support Forum
■ Links to climate change resources related to the Western Cape
https://goo.gl/IqW4FM
Department of Environmental Affairs Climate Change Portal
■ Links to climate change resources related to South Africa
https://goo.gl/kKlbJK
Water: Market Intelligence Report 2017 7372 Water: Market Intelligence Report 2017

9.2. Appendix B: The business of Water Services Authorities (WSAs)WSAs regulate local water supply and develop by-laws. They also delegate functions to Water Service Providers (most often municipal departments) to deliver water services to users, and plan and manage infrastructure.
South Africa’s water infrastructure and resources are valued at a replacement value of ~R1.3 trillion (Table 8). The average investment needed over the next decade
is R85.5 billion, representing significant opportunities for businesses and investors (DWS 2016a). This opportunity will be influenced by government development targets such as to:
■ Eradicate the basic services backlogs by 2019
■ Improve reliability of supply to 90% by 2019 ■ Develop the next phase of the Lesotho
Highlands Water Project
In 2014/15, South Africa’s municipal revenue from the sale of water and from provision of sanitation services was R28 billion and R11.5 billion respectively. The distribution of this value among water users is shown in Figure 30 (national and municipal). Of the municipal sales, ~58% typically comes from domestic residential use and 40% from commercial and industrial use (DWS 2016a).
■ *Theoretical ■ **10-year infrastructure cost 2015-2025 ■ ***Excluding the Municipal Infrastructure Finance Facility
Table 8: Water sector 2015 capital replacement values and indicators
Figure 30: Sectoral financial value of water sales
Type Value (R billions)Replacement value*
New installation**
Upgrade existing**
Rehabilitate existing**
TOTAL real cost**
Infrastructure: internal 111 37 21 55 113
Infrastructure: potable connector 106 33 0 53 86
Infrastructure: non-potable connector
169 13 0 53 66
Infrastructure: bulk 203 94 0 67 161
Water resources 505 158 5 80 243
TOTAL: Water 1094 335 26 308 669
Infrastructure: sanitation*** 198 175 0 11 186
TOTAL: WATER SECTOR 1292 510 26 319 855
Water: Market Intelligence Report 2017 7574 Water: Market Intelligence Report 2017

Municipal revenue comes mainly from the payment for services. In the past decade, the increase in the percentage households with access to water has coincided with a decline in the percentage households paying, dropping from 66.9% in 2004 to only 43.7% in 2014. This negatively affects municipal financial viability.
Table 9 details the outcomes of a Stats SA survey, showing proportions and reasons for domestic non-payment, excluding free basic water (Stats SA 2011). Nationally, only 14% of customers said their water was unaffordable.
The following urgent contributions are needed to address municipal financial stability in water and sanitation services:
■ Reduce physical water losses: Urgent reduction of physical water losses and non-revenue water to reduce and delay capital needs for new supply augmentation.
■ Reduce demand: Water conservation, water use efficiency and related awareness programmes to reduce demand.
■ Additional Government grant funding to meet the 2019 targets for basic services and sustainable supply.
■ Special purpose funding for infrastructure refurbishment to address backlogs.
■ Additional loan funding by water boards, water service authorities and water user associations.
■ Tariff reviews and adjustments to establish affordable cost recovery for water supply and sanitation.
■ Improved operation and maintenance of existing infrastructure to extend its expected useful life.
■ Reinstatement and effective management of the capital replacement reserve (CRR) in terms of the MFMA.
Per the 2015 Municipal Strategic Self-Assessment of Water Services (MuSSA), only 5% of WSAs were rated as having a low operational vulnerability, while 34% showed high vulnerability and 38% were extremely vulnerable to operational failure (Figure 31 and Table 10).
Table 9: Reasons for domestic non-payment in 2011
Figure 31: Results of 2015 municipal strategic self-assessment of water services
Cross-checking with quantitative assessments (Blue Drop, Green Drop, non-revenue water etc.) shows a very high correlation. To address the municipal shortcomings identified, the DWS develops Municipal Priority Action Plans for selected municipalities. The key objective of these plans is to guide the WSAs to prioritise actions and allocate budget to address areas with greatest need for attention.
Staff skills levels and capacity are often cited as one of local government’s greatest challenges. A 2011 study found that although 72% of posts were filled, only 51% were budgeted for, and half of technical managers were under-qualified.
Civil engineering capacity in local government is too low to deliver, operate and maintain local government infrastructure in a sustainable manner. This ratio has dropped from 20 per 100 000 in 1994 down to 3 per 100 000 (DWS 2016a). Partnerships and assistance from the private sector are key to resolving this technical capacity challenge in South Africa. Organisations such as South African Local Government Association, the National Business Initiative and the South African Institute of Civil Engineers play a critical role in resolving this challenge and assisting municipalities.
Table 10: 2015 Municipal strategic self-assessment of water services: Summary of results
Status No of Water Services Authorities
%
Extreme Vulnerability 58 38%
High Vulnerability 57 38%
Moderate Vulnerability 28 18%
Low Vulnerability 7 5%
No Data 2 1%
Total 152 100%
Non-payment % in 2011 WC EC NC FS KZN NW GP MP LP RSA
Councillor says don't pay 7 22 44 15 44 29 9 4 39 24
No/non-functional meter 28 17 4 24 30 16 21 44 37 28
No bill received 19 15 16 14 8 22 10 24 14 14
Sub-total (within municipal control)
54 54 64 53 82 67 40 72 90 66
Can't afford 19 25 8 7 11 13 22 14 8 14
Other 28 22 28 40 7 20 39 14 2 20
Sub-total (possibly beyond municipal control)
47 46 36 47 18 33 61 28 10 34
Water: Market Intelligence Report 2017 7776 Water: Market Intelligence Report 2017

9.3. Appendix C: Water pricingThe DWS has gazetted a new pricing strategy for raw (untreated) water (DWS 2015b). This strategy replaces the previous strategy (from 2007) and is expected to come into effect in 2017. The draft strategy aims to reform the sector so that pricing is more transparent and predictable. It also seeks to ensure more effective and efficient management of our water resources.
Major changes from the previous strategy include an increase in the number of water use categories (for which there are different tariffs levied) and some changes to the actual water use charges. The water use categories now include:
■ agriculture ■ municipal ■ industry and mining ■ hydropower ■ high-assurance use (e.g. energy
generation) ■ stream flow reduction activities
Changes to the water use charges include the Future Infrastructure Build Charge for new infrastructure or the improvement of existing infrastructure; an Economic Regulator Charge to fund the activities of a proposed pricing regulator and; a hydropower charge for existing and planned hydropower plants.
The draft strategy has been published and is currently under consultation. It is not yet clear what the impact will be on water tariffs for water users. It is clear that there is a significant focus on improving water efficiency, water quality and the financial sustainability of water management. The pricing strategy will incentivise users to improve water
use efficiency and therefore may provide opportunities for businesses that operate in the WCWDM sector.
The list below describes relevant principles regarding water pricing in South Africa that drives business opportunities (DWS 2015b).
■ User pays and recovery of costs: The intent of the pricing strategy is to provide for the full recovery of costs associated with the management, use, conservation and development of water resources and the associated administrative and institutional costs. Users must pay for the costs of their water use, considering the need for targeted subsidies where, due to socio-economic conditions, users are not able to afford the costs resulting from the full application of these principles.
■ Polluter pays: Allied to the principle above, this principle sets out that polluters must pay for the costs of their water discharge or pollution.
■ Efficiency: The pricing strategy makes provision for an economic regulator to ensure that the water management charges are maintained at affordable levels.
■ Multi-year tariffs: The pricing strategy provides for multi-year tariff determination to facilitate longer term planning and greater levels of certainty for water institutions and users.
Differences in raw bulk water charges for selected catchments can be seen in Table 1119.
9.4. Appendix D: DWS Drop ProgrammesIn 2008, the DWS introduced the Blue Drop and Green Drop certification programmes for auditing and managing potable water and wastewater quality respectively. WSAs are audited and receive a score for their overall performance.
The No Drop certification programme was recently introduced to assess and report on water losses and non-revenue water for WSAs. These programmes and associated data allow for business to target where the greatest need for improvements or assistance may be, almost down to a plant or facility level.
Blue Drop assessments focus on the raw water treatment activities of a WSA. Table 12 shows provincial results for available years. The assessments consist of:
■ water safety planning which is a risk-based approach in potable water provision;
■ quality management dealing with associated risks and mitigation of risks;
■ infrastructure asset management (operation & maintenance and design capacity);
■ budgeting and finance; ■ technical skills availability for plant
operation; ■ management support; andhe
implementation of local regulation (by-laws)
In terms of DWS classifications20, 73% of South Africa’s wastewater treatment works are classified as micro, small or medium-sized (Figure 32). Sixty-seven percent (67%) of the national design capacity is however contained at macro-size plants, which are mostly located in the larger cities.
Province 2009 2010 2011 2012 2014
Gauteng 74% 86% 95% 98% 92%
Western Cape
60% 92% 94% 94% 89%
KZN 73% 66% 80% 92% 86%
Eastern Cape
54% 79% 77% 82% 72%
Limpopo 41% 55% 64% 79% 62%
North West 40% 66% 62% 79% 63%
Free State 40% 49% 64% 82% 75%
Northern Cape
28% 47% 62% 68% 68%
Mpumalanga 51% 65% 57% 61% 69%
19 For the latest updates on the water sector, visit the water pages on the GreenCape website.
Table 11: Water tariffs for selected sectors and territories
Table 12: Provincial Blue Drop results
20 https://goo.gl/M3MSfk
Raw water tariffs 2015/16 (ZAR) Domestic & Industrial Irrigation Forestry
Breede-Gouritz CMA 3,95 1,91 0,78
Berg-Olifants CMA 3,85 1,94 1,28
Consumer tariffs 2013/14 (ZAR) Residential (6-20 kl) Commercial (50-200 kl) Industrial (>600kl)
City of Cape Town 11,77 14,26 14,26
Western Cape average 7,63 11,23 11,60
South Africa average 7,96 10,70 11,48
Water: Market Intelligence Report 2017 7978 Water: Market Intelligence Report 2017

Table 13: Wastewater treatment works capacity and performance in South Africa
Wastewater works
Design capacity
Daily flow Remaining capacity
Green Drop score
Risk profile
Green Drops
Systems achieving >50%
Rank
Ml/d Ml/d
EC 123 15% 490 7% 345 7% 30% 67% 78% 3 26% 4
FS 95 12% 482 7% 198 4% 59% 32% 83% 0 12% 7
GT 56 7% 2595 39% 2579 49% 1% 79% 57% 5 68% 3
KZ 143 17% 1076 16% 716 14% 33% 82% 55% 11 66% 2
LP 67 8% 150 2% 123 2% 18% 24% 79% 0 15% 8
MP 76 9% 323 5% 159 3% 51% 56% 73% 1 41% 5
NC 71 9% 150 2% 93 2% 38% 23% 76% 0 13% 9
NW 35 4% 316 5% 144 3% 54% 50% 76% 1 17% 6
WC 155 19% 1031 16% 901 17% 13% 83% 62% 19 75% 1
821 6614 5258
9.5. Appendix E: Potable reuse barriersA significant amount of research is being done on the barriers to potable reuse, while numerous research activities are underway to address this potential supply source21.
Figure 33 shows that psychological perceptions along with municipal capacity are the two largest barriers to implementing potable reuse at municipal scale (Millson 2016).
Figure 33: Barriers to the uptake of direct reuse in South Africa
9.6. Appendix F: Reuse technology typesIn many cases, industrial plant wastewater needs to go through a treatment process before it can be reused again on-site or can be discharged. It is for this reason that different processes have been developed to cater for specific industries intending to reuse or treat water.
Figure 34 is a generalized process flow diagram of a typical treatment process for industrial water treatment and possible reuse (GreenCape analysis).
Figure 34: An example of an industrial water treatment process for on-site reuse
INDUSTRIAL EFFLUENT
Particle size >0.5 mm Particle size <0.5 mm
SCREENS BIOREACTOR
SETTLING
DISSOLVED AIR FLOAT
Good for fats and greases such as dairy processing systems
Drying beds, hydrocyclones or thermal heating can be used
Grit, stones, other solid particles which can be sent to landfill
Anaerobic and/or Aerobic digestion
DRYING
FURTHER PROCESSING
WATER FOR REUSE
SLUDGE
Optional depending on desired quality. Membrane technology can be used here.
SOLID WASTE
21 For a compendium of this work, visit https://goo.gl/9pMrY5
Figure 32: Distribution of wastewater treatment works by size category in South Africa
Water: Market Intelligence Report 2017 8180 Water: Market Intelligence Report 2017

Table 14 shows a summary of the different water requirements for selected industrial processing plants and the treatment technologies applicable to them (GreenCape analysis).
Table 14: Reused water quality requirements and applicable technologies
Industry Water uses Reused water considerations
Applicable water treatment technologies
Mining Mineral processing, metal recovery, cleaning, dust control
Should not reduce the efficiency of the mineral recovery process. Should not promote fouling or corrosion on the equipment.
Screening, metal recovery, membrane separation
Oil refining Cooling and boiler feed water
Should not promote fouling, corrosion on equipment. Should be appropriate pH and TDS concentration.
Membrane separation, desalination technologies
Pharmaceuticals and chemicals
Product water, raw material processing, general cleaning
Product and processing water should adhere to health standards. Absence of harmful chemicals/substances.
Screening, anaerobic treatment, biological treatment, chemical treatment, membrane separation
Food & beverage Product water, raw material processing, cleaning
Product and processing water should adhere to health standards. Absence of harmful chemicals/substances.
Screening, biological treatment, membrane separation
Power generation Cooling and boiler feed water
Should not promote fouling, corrosion on equipment. Should be appropriate pH needed for cooling.
Membrane separation, desalination
Depending on the desired quality of the water to be reused, the effluent might have to pass through membrane filtration before it can be used. The main types of membrane filtration include microfiltration, ultrafiltration, nanofiltration and reverse osmosis.
Figure 35 compares the different membrane technologies available and the particle sizes they can remove. Even though membrane technologies can be expensive compared to
other technologies, they are beneficial in that even if they malfunction or if the operator is not skilled enough, there is still assurance of a quality product due to the membrane barrier. If the membrane gets clogged or if there is inadequate pressure, there will simply be no product exiting the other side, which ensures the right quality of water and prevents contamination of the clean water.
Sludge remains in most cases after wastewater has gone through a treatment process and has been restored to a dischargeable or reusable quality. Depending on the industrial plant and wastewater characteristics, the sludge can be organic, inorganic (containing salts or metals) or a mixture of both. Often, the sludge would have to go through a drying process before it can be used or disposed of.
Regulation on the disposal of solid waste from wastewater treatment varies between municipalities, however, there are controls on inorganic solid waste such as brine or metals. Some municipalities allow the disposal of brine in the municipal system, while others do not allow this practice.
Figure 35: Membrane technology comparisons
Increasing CAPEX and
OPEX
Microfiltration
Ultrafiltration
Nanofiltration
Reverse Osmosis
Metal Ions
Monovalent Ions
(K+, Na+, Cl-)
Viruses Bacteria Suspended Solids
Divalent Ions
(Ca+2, Mg2+)
Elimination of suspended particles Pre-treatment for portable water Waste water treatment processes Primary disinfection
Reverse osmosis feed Pre-treatment for de-mineralized water production
Portable water treatment processes
Used to soften hard water Portable water treatment processes
Boiler feed water Pre-treatment for de-mineralized water
Wash and process water
Potable water
0.1-10 µm
0.01-0.1 µm
0.001-0.01 µm
0.0001-0.001 µm
Typical applications
Increasing hydrostatic pressure, pumping
requirements and risk of
fouling
Figure 35
Water: Market Intelligence Report 2017 8382 Water: Market Intelligence Report 2017

Figure 36: Options for sludge management and resource recovery
Several resources which can be converted to marketable products or used on-site can also be recovered from the sludge. A popular example is the recovery of biogas from an organic sludge which can be used to power a boiler or to generate electricity. Recovery of usable products requires implementation of additional technology which would prompt industrial plant owners to do a detailed cost-benefit analysis before pursuing the technologies. This can improve the business case for investing in a treatment and recovery system. Figure 36 unpacks the different general options available for sludge management and their associated products.
E4water22 is to date the largest globally funded research endeavour into the implementation of improved industrial water management and use (EUR17 million over 4 years). While focused on the chemicals industry, the main objectives are to develop, test and validate new integrated approaches, methodologies and process technologies for a more efficient and sustainable management of water industry. It aims to achieve an expected reduction of 20-40% in water use, 30-70% in wastewater production, 15-40% in energy use and up to 60% direct economic benefits at its industrial case study sites. Figure 37 describes the treatment technologies and resource uses from these case studies.
22 https://goo.gl/SnGsN9
Figure 37: Overview of treatment trains related to the six E4Water industrial case studiesIndustrial plants sharing wastewater
Dow
Ter
neuz
en;
Net
herla
nds;
C
hem
ical
site
INO
VY
N A
ntw
erp,
B
elgi
um;
Chl
orin
e pr
oduc
tion
site
; m
ultic
ompa
ny
site
INO
VY
N M
arto
rell,
Spa
in;
PV
C p
rodu
ctio
n si
te
Procte
r&
Gam
ble
, B
elg
ium
;
manufactu
rin
g s
ite
TOTA
L G
onfre
ville
, Fra
nce;
P
etro
chem
ical
site
Ele
ctro
Dia
lysi
s R
ever
sal (
ED
R)
Floc
cula
tor
Kal
undb
org
Kom
mun
e,
Den
mar
k; In
dust
rial
Sym
bios
is
Col
lect
ed ra
in/s
urfa
ce
wat
er
Trea
ted
proc
ess
was
tew
ater
Blo
w d
own
from
pro
cess
co
olin
g to
wer
s
Was
tew
ater
+ P
hrea
tic
wat
er
Bra
kish
sur
face
wat
er
conc
entra
ted
wat
er/
was
tew
ater
from
Com
pany
X
Mot
her w
ater
: com
plex
org
anic
lo
ad +
hig
h flo
w
Was
h w
ater
gen
erat
ed d
urin
g cl
eani
ng +
san
itiza
tion
in li
quid
de
terg
ent p
rodu
ctio
n
Was
tew
ater
Coo
ling
wat
er
Coo
ling
tow
er
blow
dow
n
orga
nic
was
tew
ater
st
ream
s co
min
g fro
m in
dust
rial
ferm
enta
tion
proc
esse
s
Lam
ella
Sep
erat
orU
ltraf
iltra
tion
(UF)
Nan
ofilt
ratio
n (N
F)
Dis
c Fi
lter
Ultr
afilt
ratio
n (U
F)R
ever
se o
smos
is (R
O)
Am
iad
Filte
rU
ltraf
iltra
tion
(UF)
S
ea w
ater
reve
rse
osm
osis
(SW
RO
)B
rack
ish
wat
er re
vers
e os
mos
is (B
WR
O)
Sat
urat
ion
Filtr
atio
nC
arbo
nate
R
emov
alIo
n E
xcha
nge
Ele
ctro
lyse
(3
mem
bran
es)
Phy
sico
-che
mic
al tr
eatm
ent
Coa
gula
tion/
Flo
ccul
atio
n/
Set
tling
mem
bran
e bi
orea
ctor
(M
BR
) aer
obic
or a
noxi
c +
aero
bic
Lab
scal
e m
embr
ane
bior
eact
or
(MB
R)
2-pa
ss-R
ever
se
osm
osis
(RO
)
segr
egat
ion:
tubu
lar
nano
filtr
atio
n
WW
pol
ishi
ng :
mem
bran
e bi
orea
ctor
(M
BR
) + a
ctiv
ated
ca
rbon
+ re
sins
or
Ozo
ne/A
OP
Pas
teur
izat
ion:
Ohm
ic
heat
ing
Ozo
natio
nB
iofil
tratio
nU
ltraf
iltra
tion
(UF)
San
dfilt
ratio
nU
V d
isin
fect
ion
Ozo
natio
n
Ultr
afilt
ratio
n (U
F)R
ever
se o
smos
is (R
O)
Per
mea
te
Buf
fer t
ank:
st
orag
e,
bala
ncin
g m
ediu
m
Ste
rilis
atio
n:
Mic
rofil
tratio
n (M
F)
Nut
rient
and
C
O2
upcy
clin
g (m
icro
alga
e bi
oext
ract
ion
and
biom
ass
prod
uctio
n)
Har
vest
ing:
(S
epar
atio
n of
w
ater
and
m
icro
alga
e by
M
F/U
F/
flocc
ulat
ion/
se
dim
enta
tion)
Rev
erse
Osm
osis
(RO
)
Rev
erse
osm
osis
(RO
)
treat
men
t
Per
mea
te (=
pro
cess
wat
er)
Con
cent
rate
Dilu
ate
(= p
roce
ss w
ater
)
Con
cent
rate
Pro
cess
wat
er
Con
cent
rate
treat
men
t of c
once
ntra
te
unde
r tes
ting
Pro
cess
wat
er
Con
cent
rate
Trea
tmen
t of
conc
entra
te
unde
r tes
ting
prod
uct:
caus
tic s
oda
32%
, ch
lorin
e ga
s,
hydr
ogen
gas
, dep
lete
d br
ine:
pr
oces
sed
whe
ther
in p
rodu
ctio
n or
was
teP
erm
eate
=
proc
ess
wat
er
RO
con
cent
rate
to
dis
char
ge
Coo
ling
tow
er fe
edR
ecyc
le b
ack
to ra
w w
ater
tank
Eva
pora
tor o
r dis
char
ge
recycli
ng o
f s
urfacta
nts
Wat
er fo
r rec
yclin
g
Wat
er fo
r rec
yclin
g
Con
cent
rate
s/C
ompl
ex s
tream
s
Wat
er fo
r rec
yclin
g
Con
cent
rate
s/co
mpl
ex s
tream
s
Con
cent
rate
Product:
alg
ae s
lurry
Wat
er fo
r rec
yclin
g
Dew
ater
ing:
C
entri
fuga
tion
Product:
alg
ae p
aste
Wat
er fo
r rec
yclin
g
E4Water
Figu
re 3
7
INORGANICSLUDGE
Tailings DamDewatering Process
LandfillMatal Recovery
Separated Salts/MetalsEutectic Freeze
ORGANICSLUDGE
ThermalDrying
Dewatering Beds
Landfill
Compost
Biogas
Water: Market Intelligence Report 2017 8584 Water: Market Intelligence Report 2017

WASTEWATER TREATMENT PLANT
INDUSTRY
HOUSEHOLDS
AGRICULTURE
HEAT
ELECTRICITY
ORGANIC FERTILISER
PHOSPOHORUS (FERTILISER)
BIOPLASTIC
ENVIRONMENT (Rivers, ocean,
dams)
SLUDGE
CLEAN WATER - Improved Quality
ENERGY FACTORY
THERMAL HYDROLYSIS
MANURE AND ORGANIC WASTE
BIOGAS
ORGANIC W
ASTE
SLUDGE
Billund BioRefinery (Denmark)
Figure 38There are also opportunities for industrial plants to share wastewater. For this to be realized, companies need to be near each other to minimize the complexity of the logistics associated with sharing the water (neighboring facilities present the greatest opportunities). An example would be the use of wastewater from cooling in oil refineries for dust suppression in mineral processing industries
or the use of steam from power generation plants by oil refineries. Table 15 provides selected industrial water symbiosis examples and case studies.
Figure 38 shows a resources flow diagram of the Billund BioRefinery23 in Denmark, where nothing is considered a waste product.
Table 15: Industrial symbiosis examples related in the water sector
Effluent type Effluent use Case studies Link
Treated municipal wastewater
Cooling water in oil refining
Durban Water Recycling facility in South Africa
https://goo.gl/VjIDpU
Treated municipal wastewater
Irrigation for recreational facilities
The use of treated municipal wastewater for irrigating golf courses in the United States
https://goo.gl/K2Wx1C
Untreated municipal wastewater
Phosphate recovery Phosphate recovery plant in Amsterdam
https://goo.gl/e3vQ4f
Brine Wastewater from fish processing industry
De-icing agent in roadworks
Brine is being considered for use as a de-icing agent in UK roadworks
https://goo.gl/LKoN9Y
Food and Beverage product wastewater
Starch recovery for biogas production from organic wastewater
Food processing plant in Canada considering this option
https://goo.gl/1l1oGW
Yeast slurry from the production of insulin
Biogas production industry
Utilisation of Novo Nordisk's yeast slurry by Novozymes in the UK
https://goo.gl/9cUAvS
Used cooling water from oil refining
Power generation processes
Utilisation of Satoil's used cooling water by DONG power generation plant in the UK
https://goo.gl/vKXxsW
Process wastewater from enzyme production
Raw material for the manufacture of algae
Utilisation of Novozymes process wastewater by Kalundborg Algae plant in the UK
https://goo.gl/rUrZyY
23 https://goo.gl/o8xsvH
9.7. Appendix G: Private sector risk, tools, and stewardshipThe World Business Council for Sustainable Development and the National Business Initiative (NBI) are promoting the risk minimisation approach and methodology when it comes to water resources. Their intention is to get their members (mostly multi-national corporations or top-listed JSE companies) to start the water stewardship journey. This involves beginning to address risks within their operations and then moving to shared risks within their basins of operations or trade. This is a natural continuation of the CDP Water Disclosure promotion and initiatives that companies are leading.
Several products, tools, and decision support systems have been developed by the WBCSD
to address water risks, most of which are interactive and web-based24. Their Global Water Tool is also beginning to develop tools for assessing different business cases for green technology and infrastructure investments.
Of the approximately 600 global corporations that reported into CDP Water in 2013, 48% do not conduct consumption monitoring of their water within their operations, and only 24% require key suppliers to report their water impacts and risks. Of the 173 Sustainability Reports that the WBCSD assessed in 2013, 120 had identified water as a material input and risk, 72 set targets for how to understand water in their value chain and operational usage, and 8 had set targets for water usage reduction (NBI 2016a).
Figure 38: Resources flow diagram of the Billund BioRefinery
24 https://goo.gl/JXMxpn
Water: Market Intelligence Report 2017 8786 Water: Market Intelligence Report 2017

Table 16: 2014-2016 CDP Water results for South Africa
Approximately 40 South African companies currently report globally via CDP on their water use, risks, opportunities and management practices. Drought and water stress is the biggest reported impact in 2015 and 2016 (Table 16). In 2016, 75% of companies reported detrimental impacts related to water (up from 50% in 2014).
In 2016, 94% of companies reported water as a direct risk to their operations (the highest in the world) (NBI 2016b).
An expert group convened by the NBI in 2015 concluded that while the drought is a serious short-term risk, there are more critical systemic issues in the water sector that need to be addressed. It is arguable that companies focus narrowly on their operational risks and not on the risks that will manifest through social and economic systems. The top expert risks identified for 2016 were consistently inadequate infrastructure, rising water costs, declining water quality and regulatory uncertainty in water licensing (NBI 2016a).
Financial institutions (banks and insurers especially) are beginning to understand water resource management and risks and are beginning to consider products for their clients that address the drivers and trends. Financing models that work in a resource management environment (for example project finance for green infrastructure) and associated impact analysis are also being increasingly called for. Institutional investors are concerned about long-term company resilience. They typically ask whether a company has:
■ undertaken a water risk assessment; ■ developed a water policy and strategy
to implement this policy; and ■ put performance metrics in place and
is reporting.
The concept of water stewardship has gathered traction as businesses have recognised the risk that water may have on their profitability and long-term viability. Water is a shared resource that requires businesses to look beyond their ‘factory fences’ and collaborate with a variety of different stakeholders to secure their water resources. The types of water risk that businesses typically face include:
■ physical risk: water quantity and quality issues that affect production;
■ regulatory risk: the enforcement of regulatory powers that may result in changes in water pricing, supply, rights, standards and license to operate;
■ reputation risk: the impacts on the company brand from public perceptions of water resource and pollution management.
Key organisations that provide support, and further insights and tools in water risk and stewardship can be found in Table 17.
Top impacts Top risks reported
2014 2015 2016 2014 2015 2016
Drought, water scarcity and/or water stress
20% 30% 52% 67% 67% 77%
Flooding 23% 23% 23% 37% 30% 26%
Inadequate infrastructure 3% 17% 10% 20% 27% 26%
Declining water quality 17% 7% 13% 40% 23% 29%
Total financial impacts reported by companies in 2016 R1,100m
Table 17: Water risk and stewardship resources
Name and description Link
World Wide Fund for Nature (WWF) https://goo.gl/k8IWlv
International Water Stewardship Programme of the GIZ
https://goo.gl/OBO5fT
Alliance for Water Stewardship https://goo.gl/hPWjSa
United Nations Global Compact: CEO Water Mandate
https://goo.gl/BfEuIX
Strategic Water Partners Network https://goo.gl/ZZPvh9
National Business Initiative https://goo.gl/Z8OYBv
Water Stewardship for Agriculture in the Western Cape
https://goo.gl/HMM4wU
WWF Water Risk Filter https://goo.gl/SHN74F
Water Stewardship Toolbox https://goo.gl/F69nJo
United Nations Water Action Hub https://goo.gl/pBlQF6
The business approach towards water stewardship begins at a basic level, where water awareness and internal action occurs. At a more advanced stage, collective action and governance influence occur through strategic engagement (Figure 39). Effective and targeted communication is a crucial requirement within this journey.
Capacity building programs for business to understand green infrastructure investments are growing in demand. The WBCSD25 has lead the development of an excellent information portal for references, business cases and tools to assist companies on their investment journey. These also show key motivators for natural infrastructure investments, as well as applications and benefits (Figure 40).
25 https://goo.gl/yVhIWd
Water: Market Intelligence Report 2017 8988 Water: Market Intelligence Report 2017

Figure 39: Business stewardship within the CEO Water Mandate Water Progression
Figure 40: Drivers, applications, and benefits of natural infrastructure
Water awareness
Knowledge of impact
Internal action
Collective action
Influence governance
Operations
WASH services in workplace Measure and monitor water Drive efficiency and reduce pollution
Context
Understand water-stressed and high-risk basins Asses risks and impacts in value chain
Strategy
Integrate water management into business strategy
Engagement
Advance sustainable management and collective action
Communication Achieve meaningful and inclusive dialogue with stakeholders
DRIVERS
Resource limitations
Regulatory requirements
Changing climate and severe weather events
Stakeholder concerns
APPLICATIONS
Treat industrial process wastewater
Rehabilitate degraded land
Remediate contaminated areas
Build more resilient infrastructure
Manage stormwater
Secure access to water
BENEFITS
Direct financial benefits
Operational, financial and reputational gains from environmental benefits
Social reputational gains
Water: Market Intelligence Report 2017 9190 Water: Market Intelligence Report 2017

9.8 Appendix H: Energy use in municipal water servicesMunicipalities should be using the guidelines for energy conservation and energy generation in their strategic planning processes, and include specific targets for energy efficiency in their operations in the Water Services Development Plans (WSDPs). Energy efficiency should form a major criterion when planning new water supply and sanitation projects, and funding programs should use specific targets in the decision-making process. Figure 41 shows the proportional breakdown of energy use in municipal water services.
The recently published South African Energy Efficiency Compendium focuses on the development of best practice in the energy efficient design and operation of water industry
assets. It acts as a benchmarking tool and identifies tools and technologies available for use. Its overall aim is to assist water asset managers to increase energy efficiency, and to reduce use, cost and the overall carbon footprint of the water sector.
Most opportunities for energy efficiency within water and sanitation are in the wastewater reticulation and waste treatment domain (Table 18). As an example, it is estimated that by 2020 the cost of electricity for the treatment of wastewater in Johannesburg will have risen from R97 million per annum in 2010 to more than R300 million per annum in real terms, making the existing wastewater treatment operation possibly unaffordable.
Figure 41: Average energy use by Water Services Authorities in South Africa
Table 18: Energy consumption in the South African water value chain
Cape Town’s energy demand is even more skewed to the wastewater side. Most of the City’s bulk supply, potable treatment, and potable treatment systems are gravity powered due to the storage reservoirs being higher than the consumption points.
Wastewater peak flows are like energy load profiles where peak consumption is around 07h00 and 20h00. Peak load shifting is already done at wastewater treatment works using equaliser basins to keep process inflows regular, given that works' inflows are heavily peaked. Peak-load shifting opportunities exist for such basin optimisation, expansion or upgrading. This will allow a utility to consume energy at off-peak times and tariffs.
Waste water treatmentEnergy saving or production opportunities in wastewater treatment can be seen in Table 19 (IWA 2012) creating opportunities for technology suppliers, energy service companies and project developers. For example, WWT facilities larger than 90 Ml/day exhibit strong business cases for anaerobic digestion energy recovery investments. Public-private partnership models are the most preferred where a service provider onsite purchases sludge, produces energy using their preferred technology and sells it back to the facility. Most facilities in operation can produce approximately 50% of a WWT energy requirements.
Table 19: Energy potential in the wastewater treatment sector
Process Min (kWh/Ml) Max (kWh/Ml)
Process Min Max
Abstraction 0 100
Distribution 0 350
Water treatment 150 650
Reticulation 0 350
Wastewater treatment 200 1 800
ENERGY USE IN THE WATER SECTOR
Drinking Water 45%
Watewater 55%
Pumping 70%
Treatement 30%
Aeration 60%
Pumping 30%Other 10%
ENERGY SAVINGS: 10-20%fine bubble controlled aeration, energy efficient motors and pumps
RENEWABLE ENERGIES: 5-10%wind power, photovoltaic, solar thermal power, geothermal power
SEWAGE FLOWS: 2-10%hydro-turbines, in-sewer heat exchangers
SLUDGES: 40-100%anaerobic sludge digestion, pre-treatment to increase digestibility
Water: Market Intelligence Report 2017 9392 Water: Market Intelligence Report 2017
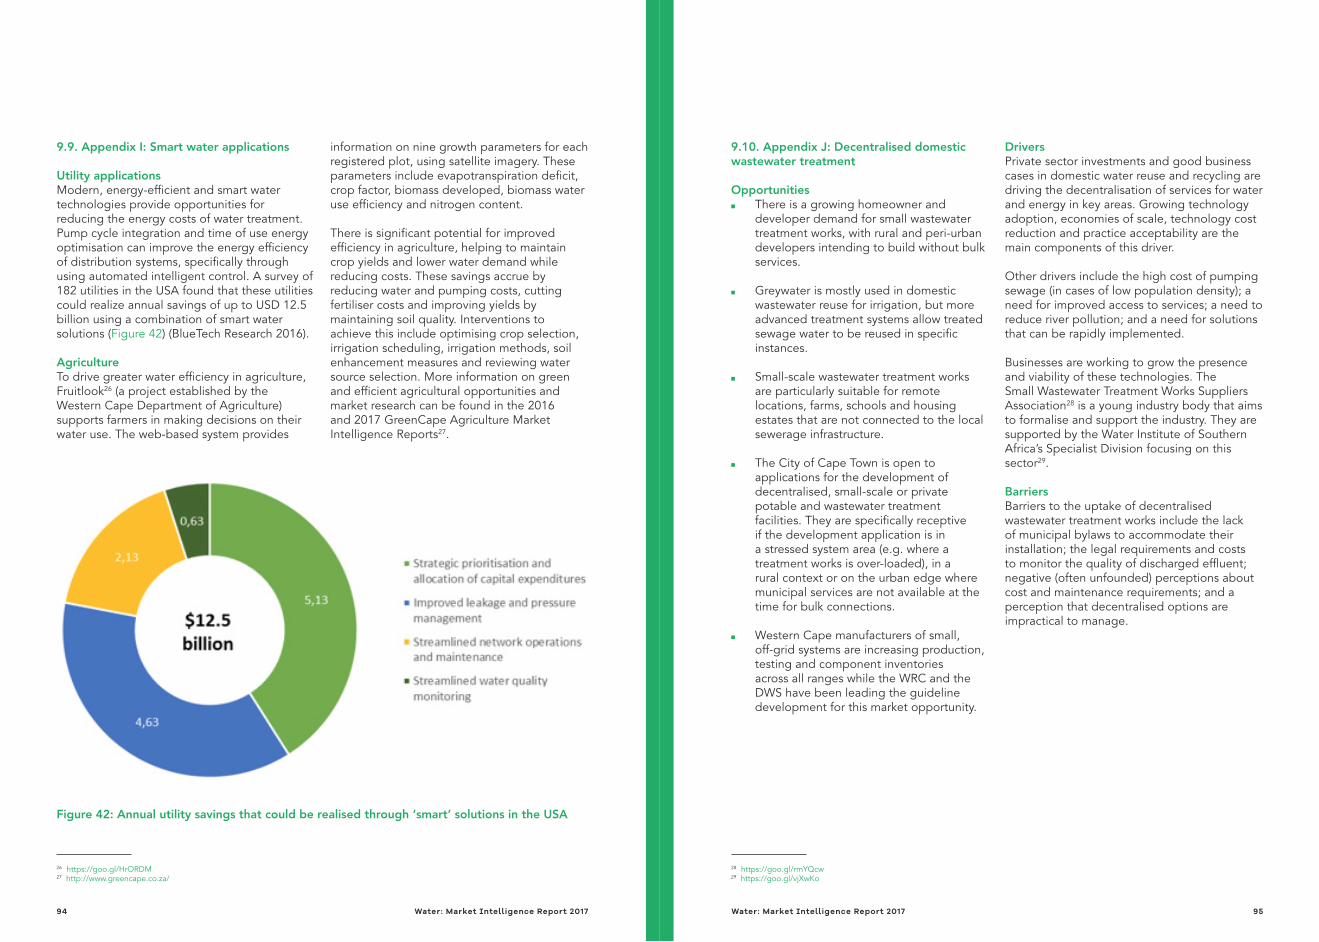
Figure 42: Annual utility savings that could be realised through ‘smart’ solutions in the USA
9.9. Appendix I: Smart water applications
Utility applicationsModern, energy-efficient and smart water technologies provide opportunities for reducing the energy costs of water treatment. Pump cycle integration and time of use energy optimisation can improve the energy efficiency of distribution systems, specifically through using automated intelligent control. A survey of 182 utilities in the USA found that these utilities could realize annual savings of up to USD 12.5 billion using a combination of smart water solutions (Figure 42) (BlueTech Research 2016).
AgricultureTo drive greater water efficiency in agriculture, Fruitlook26 (a project established by the Western Cape Department of Agriculture) supports farmers in making decisions on their water use. The web-based system provides
information on nine growth parameters for each registered plot, using satellite imagery. These parameters include evapotranspiration deficit, crop factor, biomass developed, biomass water use efficiency and nitrogen content.
There is significant potential for improved efficiency in agriculture, helping to maintain crop yields and lower water demand while reducing costs. These savings accrue by reducing water and pumping costs, cutting fertiliser costs and improving yields by maintaining soil quality. Interventions to achieve this include optimising crop selection, irrigation scheduling, irrigation methods, soil enhancement measures and reviewing water source selection. More information on green and efficient agricultural opportunities and market research can be found in the 2016 and 2017 GreenCape Agriculture Market Intelligence Reports27.
26 https://goo.gl/HrORDM 27 http://www.greencape.co.za/
9.10. Appendix J: Decentralised domestic wastewater treatment
Opportunities ■ There is a growing homeowner and
developer demand for small wastewater treatment works, with rural and peri-urban developers intending to build without bulk services.
■ Greywater is mostly used in domestic wastewater reuse for irrigation, but more advanced treatment systems allow treated sewage water to be reused in specific instances.
■ Small-scale wastewater treatment works are particularly suitable for remote locations, farms, schools and housing estates that are not connected to the local sewerage infrastructure.
■ The City of Cape Town is open to applications for the development of decentralised, small-scale or private potable and wastewater treatment facilities. They are specifically receptive if the development application is in a stressed system area (e.g. where a treatment works is over-loaded), in a rural context or on the urban edge where municipal services are not available at the time for bulk connections.
■ Western Cape manufacturers of small, off-grid systems are increasing production, testing and component inventories across all ranges while the WRC and the DWS have been leading the guideline development for this market opportunity.
DriversPrivate sector investments and good business cases in domestic water reuse and recycling are driving the decentralisation of services for water and energy in key areas. Growing technology adoption, economies of scale, technology cost reduction and practice acceptability are the main components of this driver.
Other drivers include the high cost of pumping sewage (in cases of low population density); a need for improved access to services; a need to reduce river pollution; and a need for solutions that can be rapidly implemented.
Businesses are working to grow the presence and viability of these technologies. The Small Wastewater Treatment Works Suppliers Association28 is a young industry body that aims to formalise and support the industry. They are supported by the Water Institute of Southern Africa’s Specialist Division focusing on this sector29.
BarriersBarriers to the uptake of decentralised wastewater treatment works include the lack of municipal bylaws to accommodate their installation; the legal requirements and costs to monitor the quality of discharged effluent; negative (often unfounded) perceptions about cost and maintenance requirements; and a perception that decentralised options are impractical to manage.
28 https://goo.gl/rmYQcw 29 https://goo.gl/vjXwKo
Water: Market Intelligence Report 2017 9594 Water: Market Intelligence Report 2017

9.11. Appendix K: Efficient water use beyond the meter The City of Cape Town’s Greener Living30 portal provides excellent resources for water efficiencies in the built environment. Also, a minimum-viable-product mobile application (app) has been developed by the University of Cape Town for domestic water monitoring, learning and issue reporting. The trial group in the research project showed positive consumption trends and behaviour change.
The Drop Drop31 application has the potential to become a central domestic water demand management tool, helping users understand consumption, technology alternatives and incentives for saving.
Beyond the meter, there are opportunities for water efficiency devices and tools in households and businesses (depending on the use profile of the household as seen in Figure 43 and Figure 44).
The greatest savings and technology opportunities are in toilet flushing, greywater reuse and non-potable garden irrigation.
The main technology applications when considering efficient use are:
■ Water-wise gardens and landscaping along with water efficient irrigation systems.
■ Grey, rain and groundwater harvesting systems.
■ Trigger nozzles and automatic shut-offs for hosepipes.
■ Waterless car washing systems. ■ Pool covers backwash recycling systems
and to prevent water loss through evaporation.
■ Water-efficient washing machines and dishwashers.
■ Water efficient and low flow toilets, taps and showers.
30 https://goo.gl/acQRy8 31 https://goo.gl/qhsAev
Figure 43: Average household water use by income
Figure 44: Average water use for households with gardens
9.12. Appendix L: Desalination projects in South Africa and AustraliaFigure 45 shows the actual or planned operational costs for selected desalination plants operating in the Western Cape (WRC 2015c). These highlight some of the modelled and actual costs of desalination at different scales that have been implemented (these were all drought-response installations).
When desalination is used as a drought response in a region which is not perennially dry, the demand-side risk is especially acute. Australia’s ‘Millennium Drought’ response desalination program of R153 billion in the last decade has seen several plants not being used optimally, resulting in significant public financial implications (Table 20).
Figure 45: Costs for selected desalination plants operating in the Western Cape
50%
45%
40%
35%
30%
25%
20%
15%
10%
5%
0%Energy
Mossel Bay (15.00 MIday) Capex: R266m Opex: R6.81kl
Sedgefiel (1.50 MI/day) Capex: R22m Opex: R7.16/kl
Albany Coast (1.66 MI/day) Capex: R36m Opex: R8.47/kl
Chemicals Staff Laboratory SafetyMaintanance
Water: Market Intelligence Report 2017 9796 Water: Market Intelligence Report 2017
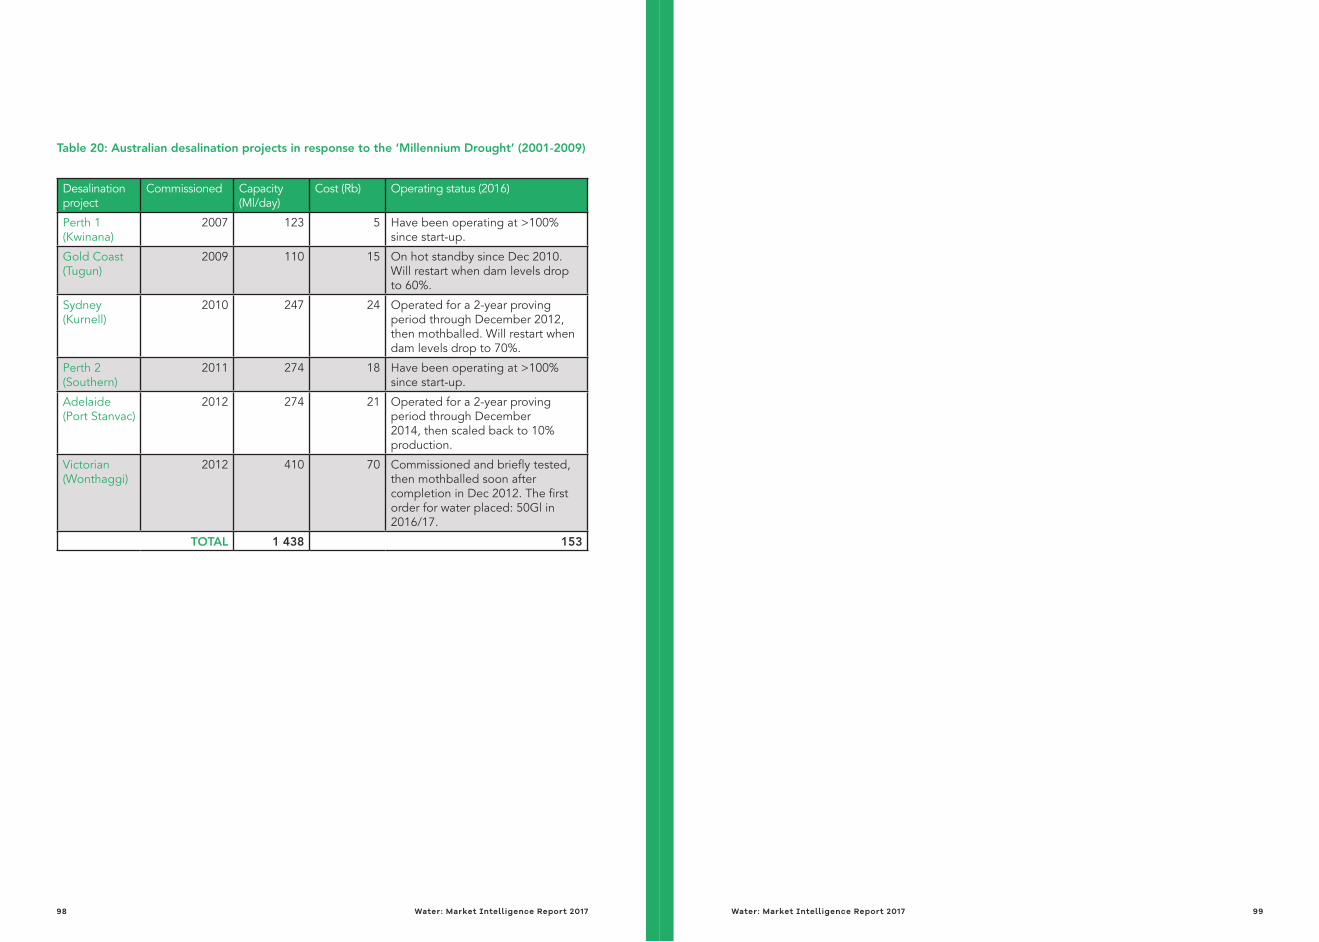
Table 20: Australian desalination projects in response to the ‘Millennium Drought’ (2001-2009)
Desalination project
Commissioned Capacity (Ml/day)
Cost (Rb) Operating status (2016)
Perth 1 (Kwinana)
2007 123 5 Have been operating at >100% since start-up.
Gold Coast(Tugun)
2009 110 15 On hot standby since Dec 2010. Will restart when dam levels drop to 60%.
Sydney(Kurnell)
2010 247 24 Operated for a 2-year proving period through December 2012, then mothballed. Will restart when dam levels drop to 70%.
Perth 2(Southern)
2011 274 18 Have been operating at >100% since start-up.
Adelaide(Port Stanvac)
2012 274 21 Operated for a 2-year proving period through December 2014, then scaled back to 10% production.
Victorian(Wonthaggi)
2012 410 70 Commissioned and briefly tested, then mothballed soon after completion in Dec 2012. The first order for water placed: 50Gl in 2016/17.
TOTAL 1 438 153
Water: Market Intelligence Report 2017 9998 Water: Market Intelligence Report 2017

Water: Market Intelligence Report 2017 101100 Water: Market Intelligence Report 2017© Image courtesy of GreenCape, 2016

![Director WATER REUSE PROMOTION CENTER · Water reuse market trends According to research by Global Water Intelligence (GWI),[2] in 2016, the reuse market will become a market that](https://static.fdocuments.us/doc/165x107/6015fe8bdbaad16dbd2ac2b3/director-water-reuse-promotion-center-water-reuse-market-trends-according-to-research.jpg)