AGRICULTURAL SECTOR DEVELOPMENT STRATEGY - II …faolex.fao.org/docs/pdf/tan160643.pdf · 2.4...
95
UNITED REPUBLIC OF TANZANIA AGRICULTURAL SECTOR DEVELOPMENT STRATEGY - II 2015/2016 – 2024/2025
Transcript of AGRICULTURAL SECTOR DEVELOPMENT STRATEGY - II …faolex.fao.org/docs/pdf/tan160643.pdf · 2.4...
UNITED REPUBLIC OF TANZANIA
AGRICULTURAL SECTOR DEVELOPMENT STRATEGY - II
2015/2016 – 2024/2025

ii
ASDS-II: Agricultural Sector Development Strategy 2015/15-2025/26
ii
TABLE OF CONTENTS
List of Figures ............................................................................................................................ v
List of Tables ............................................................................................................................. v
CHAPTER ONE ........................................................................................................................ 1
1.0 INTRODUCTION ..................................................................................................... 1
1.1 Rationale of the Strategy ............................................................................................ 1
1.2 National Guiding Policies .......................................................................................... 1
1.3 Background of the Sector Development up to 2015 .................................................. 2
1.4 Implementation arrangement ..................................................................................... 3
CHAPTER TWO ....................................................................................................................... 5
2.0 SITUATION ANALYSIS ......................................................................................... 5
2.1 Key Features of the Sector ......................................................................................... 5
2.2 Economic Contribution of the Sector ........................................................................ 6
2.3 Status of Growth Drivers in the Sector ...................................................................... 8
2.3.1. Water Resource Management and Irrigation ..................................................... 8 2.3.2. Mechanization ................................................................................................... 9
2.3.3. Rural Road and Electrification ........................................................................ 10 2.3.4. Research and Extension Service ...................................................................... 10 2.3.5. Financial Services ............................................................................................ 11
2.3.6. Private Sector development and trade ............................................................. 12 2.3.7. Markets and Marketing Infrastructure ............................................................. 14
2.4 Agricultural Sector’s SWOT Analysis ..................................................................... 15
2.4.1. Strengths and Opportunities ............................................................................ 15 2.4.2. Weaknesses and Threats .................................................................................. 16
CHAPTER THREE ................................................................................................................. 18
3.0 VISION, MISSION AND GOAL ............................................................................ 18
3.1 VISION (of the Agriculture Sector) ........................................................................ 18
3.2 MISSION (of the Agriculture Sector Ministries) .................................................... 18
3.3 SECTOR GOAL AND OBJECTIVE ...................................................................... 18
3.3.1 Sector Goal ...................................................................................................... 18
3.3.2 Strategic Objectives ......................................................................................... 18 3.3.4 Summary of Agricultural Sector Constraints .................................................. 19
CHAPTER FOUR .................................................................................................................... 19
4.0 ASDS II – STRATEGIES ........................................................................................ 19
4.1 Strategic Areas for Intervention ............................................................................... 20
SO1: Expanded Sustainable Water and Land Use Management ................................. 20
IR 1.1 Water Use for Irrigation, Livestock and Fishery Made More Efficient
and Inclusive ........................................................................................................... 20 IR 1.2 Land Use Planning and Watershed Management Improved ................. 21
IR 1.3 Climate Change Mitigation and Adaptation Increased .......................... 22 SO 2 Improved Agricultural Productivity and Profitability ........................................ 23
IR 2.1 Agricultural Research Improved .............................................................. 23 IR 2.2 Agricultural Extension Service Improved ..................................................................... 23
IR 2.3 Access to Farm Inputs Increased .............................................................. 24 Increased Fertilizer and Improved Seed Application .............................................. 24
iii
ASDS-II: Agricultural Sector Development Strategy 2015/15-2025/26
iii
Promoted Artificial Insemination and Other Livestock Technologies ..................................... 24 Enhanced Aquaculture and Access to Fingerlings .................................................................. 25 IR 2.4 Access to Agricultural Mechanization Service Increased ............................................. 25
SO 3 Strengthened and Competitive Value Chain t ........................................... 26 IR 3.1 Farmer Organizations Empowered ............................................................................... 26 SO 3.2 Agribusiness and Value Addition Promoted ............................................................... 26 Value Addition ........................................................................................................................ 26
Agribusiness and Private Sector Development ............................................................ 27 IR 3.3 Access to Markets and Rural Infrastructure Improved ......................... 27
Market Access .......................................................................................................... 27 Trade: Domestic, Regional and International ......................................................... 28
IR 3.4 Access to Agricultural Finance Expanded ..................................................................... 31
SO4 Strengthened Institutions, Enablers and Coordination Framework ..................... 32
IR 4.2 Institutional Capacity Building and Coordination ............................................ 32
Food Security ........................................................................................................... 33 Nutrition Security ..................................................................................................... 33
IR 4.4 Disaster Management and Resilience Improved............................................... 34 4.2 Key Priorities among the Strategic Areas of Intervention ....................................... 36
4.2.1 Important Considerations for Selecting Priorities ........................................... 38
4.2.1.1 Poverty Reduction and Improved Nutrition .......................................... 38 4.2.1.2 Women and Youth Participation in Modernization ............................. 38
4.2.1.3 Climate Change......................................................................................... 39 4.2.1.4 Current Growth Rate ............................................................................... 39 4.2.1.5 Farm Size Classes ..................................................................................... 40
4.2.1.6 Government Expenditure on Agriculture .............................................. 43 4.2.2 Key Priorities ................................................................................................... 43
4.2.2.1 The Role of Science and Technology and Consequent Priority ........... 44 (i) Research ........................................................................................................................ 44 (ii) Extension ....................................................................................................................... 45
4.2.2.2 Fertilizer Use by the Small Commercial Farmers ................................. 46
4.2.2.3 A Set of Further Priorities ....................................................................... 48 (i) Irrigation ........................................................................................................................ 48 (ii) Finance .......................................................................................................................... 49 (iii) Mechanization ............................................................................................................... 50 (iv) Agro-Processing and Improved Access to Markets ....................................................... 51 (v) BIG RESULTS NOW (BRN) and Southern Agricultural Growth Corridor of Tanzania (SAGCOT) ................................................................................................................................ 52
CHAPTER FIVE ..................................................................................................................... 54
5.0 MONITORING AND EVALUATION ................................................................... 54
5.1 Monitoring and Evaluation of the Growth Priorities ............................................... 54
5.1.1 Six Percent Rate of Growth of Agricultural Output .................................. 54 5.1.2 Ten Percent of Government Expenditure on Agriculture ......................... 55
5.1.3 Targeted Expansion of the Agricultural Research System ....................... 55
5.1.4 Targeted Expansion of the Agricultural Extension and Farmer Training
Systems ........................................................................................................................ 56 5.1.5 Growth Rate of Fertilizer Use ...................................................................... 56 5.1.6 Growth Rate of Irrigation ............................................................................ 57 5.1.7 Mechanization ................................................................................................ 57
5.1.8 Big Results Now ............................................................................................. 57
5.1.9 A Cautionary Note on Monitoring ............................................................... 57
iv
ASDS-II: Agricultural Sector Development Strategy 2015/15-2025/26
iv
5.2 Monitoring and Evaluation of the Seven Strategic Areas ........................................ 58
5.2.1 Major instruments of monitoring and evaluation ............................................ 58 5.2.1.1 National Sample Census of Agriculture ................................................. 58 5.2.1.2 Annual Agricultural Sample Survey....................................................... 58 5.2.1.3 Routine Data Collections.......................................................................... 58
5.2.1.4 Joint Sector Review .................................................................................. 59 CHAPTER SIX ........................................................................................................................ 60
6.0 COST ESTIMATES ................................................................................................ 60
6.1 Cost Estimates for Priorities ................................................................................. 60
6.2 Sources of Funds .................................................................................................... 61
CHAPTER SEVEN ................................................................................................................. 62
7.0 IMPLEMENTATION ARRANGEMENT .............................................................. 62
7.1 Institution Framework .............................................................................................. 62
7.1.1 Coordination of ASDS .................................................................................... 62 7.1.2 Implementation Organs of ASDS .................................................................... 63
7.2 Roles of Actors ........................................................................................................ 64
7.2.1 Planning Commission ...................................................................................... 64 7.2.2 Agricultural Sector Lead Ministries (ASLMs) ................................................ 64
7.2.3 Regional Secretariats ....................................................................................... 65 7.2.4 Local Government Authorities ........................................................................ 65
7.2.5 Commodity Boards and Other Parastatals ....................................................... 65 7.2.6 Civil Society, Farmer Organizations and Cooperatives .................................. 66
7.2.7 Development Partners ..................................................................................... 66 Annex 1: Results Framework................................................................................................... 67
Annex 2: Policy Gap Analysis ................................................................................................. 78
Bibliography ............................................................................................................................ 86
v
ASDS-II: Agricultural Sector Development Strategy 2015/15-2025/26
v
List of Figures
Figure 1: Aggregate Economic (GDP) Growth by Sector ...... Error! Bookmark not defined.
Figure 2- Summary of TAFSIP Cost Estimates by Program Tanzania Mainland (TZS
000,000) ................................................................................... Error! Bookmark not defined.
List of Tables
Table 1Trends of Mechanisation with Tractors in Tanzania ... Error! Bookmark not defined.
Table 2- Thematic Area 1-Bi-Annual Outcome Indicators for Irrigation, Water and Land
Management .................................................................................................................................
Table 3- Thematic Area 2-Bi-Annual Outcome Indicators for Productivity and
Commercialisation .......................................................................................................................
Table 4- Thematic Area 3-Bi-Annual Outcome Indicators for Rural Infrastructure, Market
Access and Trade .........................................................................................................................
Table 5- Thematic Area 4-Bi-Annual Outcome Indicators for Private Sector Development ......
Table 6- Thematic Area 1-Bi-Annual Outcome Indicators for Food and Nutrition Security ......
Table 7- Thematic Area 6-Bi-Annual Outcome Indicators for Disaster Management and
Climate Change ............................................................................................................................
Table 8- Thematic Area 7-Bi-Annual Outcome Indicators for Policy and Institutional Reform
and Support ..................................................................................................................................
Table 9: Summary of Programme Cost Estimates (in million TZS) – Mainland Component
.................................................................................................. Error! Bookmark not defined.
1
ASDS-II: Agricultural Sector Development Strategy 2015/15-2025/26
1
CHAPTER ONE
1.0 INTRODUCTION
1.1 Rationale of the Strategy
Agricultural Sector Development Strategy is an important guiding tool for
implementation of the sectoral policies for the next ten years (2015/16 – 2024/25). It
aims at operationalizing transformation of the agricultural sector into modern,
commercial, highly productive, resilient, competitive in the national and international
market which leads to achieving food security and poverty reduction, contributing to
realization of Tanzania Development Vision 2025 (TDV) that envisages raising the
general standard of living of Tanzanians to the level of a typical medium-income
developing country by 2025.
After the launching of the Agricultural Sector Development Strategy (ASDS I, 2001),
this Strategy is a revision of ASDS I based on the review of implementation of the
Agriculture Sector Development Program (2006-2014) and other various development
efforts during the past period. In practical terms, the Strategy clarifies the issues that
constrain the performance of agricultural sector and provides effective guidance on
the public interventions that will coincide with private sector development to meet the
sector development goals by 2015.
1.2 National Guiding Policies
For realization of TDV, both the Long Term Perspective Plan (2011-2025) and the
First Five Year Development Plan (2011-2015) provide guidelines and targets to be
achieved by the agricultural sector in its contribution to the overall development plans
of the country. The second phase of the National Strategy for Growth and Reduction
of Poverty (NSGRP II), popularly known as MKUKUTA II, also provides the targets
up to 2015.
The LTPP provides guiding principles that include: (i) developing strong forward and
backward linkages between agriculture sector and other sectors in the economy; (ii)
creating favorable environments for the private sector to engage profitably in activities
in the sector; (iii) developing effective training and research programmes to benefit
key stakeholders; (iv) ensuring sustainable production based on available resources
2
ASDS-II: Agricultural Sector Development Strategy 2015/15-2025/26
2
and the environment; and (v) good governance of resources, and especially land, water
and forests.
For the country to reach a middle-income status by 2025, agriculture must achieve
annual GDP growth rate of six percent as described in FFYD, MKUKUTA II, and the
Comprehensive Africa Agriculture Development Program (CAADP). High level of
productivity and growth in key economic sectors are paramount factors for a strong
and competitive economy. The FYDP I focuses on potential growth drivers including
agriculture because of their overriding importance in terms of comparative and
competitive advantages, significant impact on poverty reduction and strong synergies
with other key sectors in the development process. The FYDP I sets the goal as
modernization, commercialization, and productivity enhancement and targets of GDP
growth 5.6 percent for agriculture, 5.0 percent for livestock, and 7.0 percent for
fishery by 2015.
1.3 Background of the Sector Development up to 2015
At sector level efforts, the Government of Tanzania embarked the Agricultural Sector
Development Strategy (ASDS) in 2001 to address the constraints and challenges in the
sector in a holistic manner. The overall goal of the ASDS was to achieve an
agricultural growth rate of at least 5 percent by 2007, with the five strategic areas of:
(i) strengthening the institutional framework; (ii) creating a favorable environment for
commercial activities; (iii) enhancing public–private roles in improving supporting
services; (iv) strengthening marketing efficiency for inputs and outputs; and (v)
mainstreaming planning for agricultural development in other sectors.
In 2006, the GoT established a basket fund, called the Agricultural Sector
Development Programme (ASDP) aiming to coordinate development partner funding
in the pursuit of the objectives laid out in the ASDS. This seven year commitment
initially targeted two objectives; (i) to enable farmers to have better access to, and use
of, agricultural knowledge, technologies, marketing systems and infrastructure, all of
which contribute to higher productivity, profitability, and farm incomes; (ii) to
promote private investment based on an improved regulatory and policy environment.
In line with the GoT’s commitment to decentralization, the ASDP provided two levels
of programming: (i) National Level Support and (ii) Local Level Support – through
District Agricultural Development Plan (DADP).
Notable achievements have been realized in pursuit of the vision of the ASDS, which
was to have a modernized agricultural sector by year 2025. These include
improvement in crop and livestock production and productivity in certain areas,
expanded small scale irrigation projects, livestock dipping, charco dams, shallow

3
ASDS-II: Agricultural Sector Development Strategy 2015/15-2025/26
3
wells and feeder roads. Other positive interventions recorded include strengthening of
extension services (e.g. farmer field schools, Ward Agricultural Resource Centres),
supply of farm power, small scale agro-processing, and building human capacity
among farmers, farmer organizations, private sector service providers, extension
personnel and national level staff.
In addition, a number of policy and institutional changes have taken place recently in
the agricultural sector and sub-sectors. There is a multiplicity of agricultural projects
outside, but congruent with the ASDP. These include: the Feed the Future programme
(USAID), the Bread Basket Initiative (AGRA), and the Marketing Infrastructure
Value Addition and Rural Finance Support Programme (IFAD). For livestock sector,
the Livestock Sector Development Programme has been in place since 2008 aiming at
improving the livelihoods of the livestock farmers (including pastoralists) by
enhancing delivery of livestock inputs and services to livestock farmers and by
improving its marketing systems for livestock products. Furthermore, the Government
of Tanzania endorsed initiatives that specifically link agriculture with food and
nutrition security so that further progress can be made in addressing the challenges of
under-nutrition (e.g. joining the Scaling Up Nutrition (SUN) Movement, endorsement
of National Nutrition Strategy with an Implementation plan). However, most
development partners are still funding unique sets of projects, some through
government channels and some outside the government. There are a growing number
of non-governmental organizations with funding for their own special projects.
Meanwhile, the basket fund underlying the original ASDP is closing: a new
framework for the coordination of public sector investment and better coordinating the
multiplicity of project funding in the sector is needed.
One foundation point for this new coordination framework is the Tanzania Agriculture
and Food Security Investment Plan (TAFSIP) launched in November 2011 in the
context of the Comprehensive Africa Agriculture Development Programme
(CAADP). The TAFSIP identifies seven Thematic Program Areas for priority
investment and has a strong emphasis on involving private sector in agricultural
investment and policy reform. The Government of Tanzania also recently embarked
on the implementation of Big Results Now (BRN) initiatives in 2013/14 to transform
the economy aimed at achieving sustainable economic growth and inclusive wealth
creation. Agricultural BRN aims at the delivery of: (i) improvement of smallholder
irrigation schemes; (ii) improvement of collective warehouse based maize marketing
system; and (iii) promotion of commercial farming.
1.4 Implementation arrangement
4
ASDS-II: Agricultural Sector Development Strategy 2015/15-2025/26
4
Agriculture sector is defined in this strategy as the sub-sectors that include crop,
livestock, and fishery. The implementation of the strategy will be the responsibility of
all Agricultural Sector Lead Ministries (ASLMs)1 at the national level, while the
PMO-RALG will oversee the implementation at local level and the rest of the ASLMs
extend advisory and backstopping role to local level. The involvement of all (ASLMs)
requires coordinated direction from the Inter-Ministerial Coordinating Committee
(ICC) for multi-sectoral involvement in implementation of the Strategy with particular
emphasis on creating environments conducive to participation of the private sectors.
The private sector is expected to provide feedback through established forums to the
public sector on the issues that hinder effective transformation to commercialized
agriculture in the country.
Considering the various ongoing programmes and initiatives described above, all
these important interventions in the agricultural sector need stronger national
coordination in order to maximize the outcomes and results, minimize any overlaps
and duplications, and use the limited resources towards achieving the sector goals.
They also need stricter prioritization to assure a critical mass of resources is
committed to meet key sectoral goals. The required coordinated framework involves
the ASLMs and other related ministries, local government authorities, private sector,
civil societies, community-based organizations and all types of donors, with a clear
monitoring and evaluation.
1 The responsible ministries are called “Agriculture Sector Lead Ministries (ASLMs)” that include the Ministry
of Agriculture Food Security and Cooperatives(MAFC), the Ministry of Livestock and Fisheries
Development(MLFD), the Ministry of Industry and Trade(MIT), and the Prime Minister’s Office- Regional
Administration and Local Governments (PMO-RALG).
5
ASDS-II: Agricultural Sector Development Strategy 2015/15-2025/26
5
CHAPTER TWO
2.0 SITUATION ANALYSIS
2.1 Key Features of the Sector
Tanzania has a rich natural resources for agricultural development. The country has
94.5 million hectares of land of which 44 million hectares are classified as arable, but
only 24% of the arable land is under cultivation. Of the 50 million hectares, suitable
for livestock, only 26 million hectares is under use while the rest cannot be accessed
mainly due to tsetse fly infestation2. It has the third largest livestock population in
Africa after Sudan and Ethiopia.
About 29.4 million hectares are assessed as potential for irrigation, of which 2.3 and
4.8 million hectares are regarded as high and medium potential, respectively.
Although it has been on the increase and has doubled over the past 10 years, the area
under irrigation by 2013 was 450,392 hectares which is less than 20 percent of the
high potential area for irrigation and less than five percent of the cultivated land.
Though the country is well endowed with a high potential base for agriculture
development, there is only a small quantity of large-scale commercial farms in the
sector. Agricultural production is dominated by smallholders. They represent most of
the rural families, however notably, half of them are commercial, not subsistence, in
that they sell from a minimum of one-quarter of their output to typically half or more
in the local community.
Fetching good market prices of the agricultural product, i.e. farm gate prices, is crucial
for the smallholders. However, most of the agricultural products fetch low market
prices due to low quality resulting from low adoption of improved technology
including improved variety, nutrients (fertilizer), pest management, and under-
recognition of market requirements. Limited amount of production mainly due to low
productivity and limited cultivated area also significantly affects the farm gate prices
offered by middle-men at the farm gate. Weak mechanism for accreditation, testing,
quality monitoring, grades and standards of agricultural products also affects the price
determination.
2 These data are from ASDS1. The sources are (i) URT/WB. Tanzania Agriculture: Performance and Strategies
for Sustainable Growth, February 2000. (ii) MWLD. Livestock Subsector Memorandum, 2000.
6
ASDS-II: Agricultural Sector Development Strategy 2015/15-2025/26
6
Value addition through processing of agricultural crops would not only create more
employment opportunities and income but also reduce rural-urban migration,
especially if processing industries are established in rural areas. However, agro-
processing industries in Tanzania are underdeveloped, as result of multiple effects of
inadequate availability and accessibility such as rural roads, electrification, water,
communication, rural finance and market infrastructure.
2.2 Economic Contribution of the Sector
Sector Growth
The agricultural sector on average contributes about 24 per cent of GDP compared to
about 30 percent a decade ago; and it contributes about 24 percent of exports, down
from about 45 percent ten years earlier, mostly due to the growth of alternative foreign
exchange earning opportunities from minerals and tourism services.
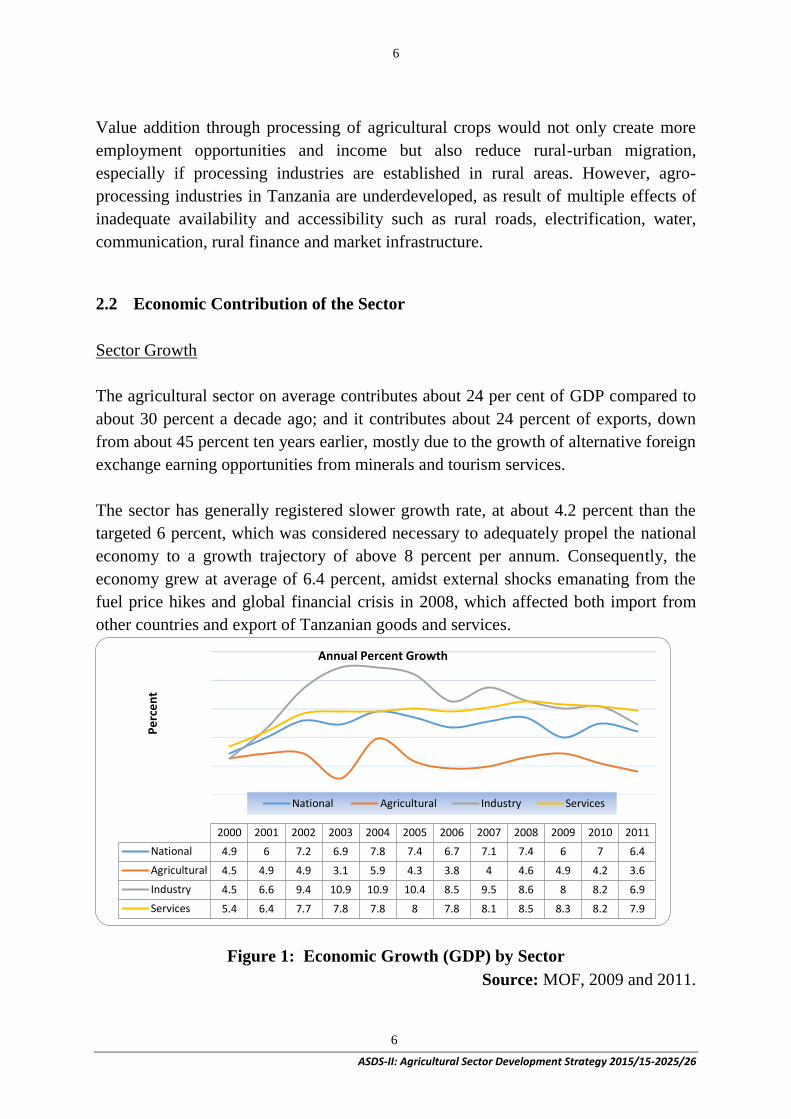
The sector has generally registered slower growth rate, at about 4.2 percent than the
targeted 6 percent, which was considered necessary to adequately propel the national
economy to a growth trajectory of above 8 percent per annum. Consequently, the
economy grew at average of 6.4 percent, amidst external shocks emanating from the
fuel price hikes and global financial crisis in 2008, which affected both import from
other countries and export of Tanzanian goods and services.
Figure 1: Economic Growth (GDP) by Sector
Source: MOF, 2009 and 2011.
2000 2001 2002 2003 2004 2005 2006 2007 2008 2009 2010 2011
National 4.9 6 7.2 6.9 7.8 7.4 6.7 7.1 7.4 6 7 6.4
Agricultural 4.5 4.9 4.9 3.1 5.9 4.3 3.8 4 4.6 4.9 4.2 3.6
Industry 4.5 6.6 9.4 10.9 10.9 10.4 8.5 9.5 8.6 8 8.2 6.9
Services 5.4 6.4 7.7 7.8 7.8 8 7.8 8.1 8.5 8.3 8.2 7.9
Pe
rce
nt
Annual Percent Growth
National Agricultural Industry Services
7
ASDS-II: Agricultural Sector Development Strategy 2015/15-2025/26
7
Performance of Agricultural Sub-sectors
Sector performance between 2001 and 2011 varied between sub-sectors, with all crops
contributing up to 71 percent to agricultural GDP, and growing at a rate of 4.6 percent
per annum, whereas livestock sub-sector growth rate averaged 3.2 percent (against 4.2
percent for the whole sector). Cattle population increased at an average rate of 1.4
percent. Poultry recorded an impressive growth rate of 9.6 percent to reach 58 million
chickens.
The relative contribution to agricultural GDP by crop, livestock, forestry and hunting,
and fisheries in recent years averaged 18, 5, 3 and 1.4 percent, respectively.
Among crops, the best performance was recorded in export crops such as sugar, tea
and tobacco, which have recorded growth rates of almost 10 percent per annum.
However, these crops are concentrated in specific regions and amongst commercial
large scale farmers. Although they occupy only about 10 percent of cultivated land,
they contribute 70 percent of export earnings. Fisheries have been growing at around 5
percent per annum.
Poverty, Prices and Food Production
The low performance of the agriculture sector has impeded efforts to increase
household incomes and their livelihoods such that the incidence of rural poverty was
only marginally reduced from 35.7 percent in 2001 to 34.4 percent in 20073. It has
declined somewhat more rapidly since then to 28.2 percent in 2012.
The country had fared well in containing headline inflation rate, which was around 5
percent for most part between 2000 and 2007. Unfortunately, the sudden surge in fuel
prices in 2007-08, which was immediately followed by the Global Financial and
Economic Crises, forced inflation rate to rise above 10 percent such that by mid-2011
it had reached 19 percent, before stabilizing and gradually reducing towards 10
percent mark by the end of 2012, then to around six percent in 2014.
Despite the food self-sufficiency ratio being within the comfort zone which is beyond
110 percent over a decade, there is a group of 50-60 districts scattered across more
than 10 regions of Tanzania Mainland, which regularly report food shortages even in
years of overall surplus in the country, mainly due to adverse climatic conditions,
3 The most recent poverty headcount of 28.2% based on the 2011/12 HBS cannot be compared to the previous
series due to differences in the underlying poverty estimation methodology and survey instrument. However,
re-estimation of the 2007 poverty figures using a methodology that is more comparable to 2011/12 delivers a
poverty headcount estimate of approximately 34.4% in 2007.
8
ASDS-II: Agricultural Sector Development Strategy 2015/15-2025/26
8
cultivation of unsuitable crops in the respective agro-ecological zones, poor husbandry
practices, among other factors.
2.3 Status of Growth Drivers in the Sector
The ASDS I (2001) has identified the followings as required specific interventions:
improving water supply management and irrigation, introducing farm mechanization,
use of improved seeds, fertilizers, vaccines and agro-chemicals, rangeland
management. Some of the required facilitating factors include market information,
marketing infrastructure, research and extension, private sector business environment,
and financial services. The sector’s constant growth rate of about 4.2 percent per
annum over the past ten years appears to have been driven mainly by area expansion
rather than by productivity increase in response to increasing demand for food and
non-traditional cash crops. The following sections explain about the current status of
the key-subsectors and issues.
2.3.1. Water Resource Management and Irrigation
In terms of irrigation potential, there are about 7.1 million hectares classified as high
(2.3 million ha) and medium (4.8 million ha) along numerous rivers, lakes, wetlands
and aquifers. Out of the 2.3 million hectares classified as high potential, the irrigated
area with improved irrigation infrastructure reached to 450,392 hectares by 2013 (with
average annual increase of 15,000 to 25,000 hectares), which is less than five percent
of the cultivated land. Only 40% of rangelands is currently available for livestock
grazing, the rest is inaccessible due to tsetse fly infestation or lack of adequate water
resources. The continued shrinking of land for grazing due to population pressure and
conversion of traditional grazing areas to other land uses greatly constrain the
sustainability of extensive livestock production system.
In terms of productivity from the irrigated farms, the average yield of paddy in
irrigated areas is about 2.0-3.8 tons per hectare, compared to about 1.8 hectares in
non-irrigated areas.
Although the implementation of irrigation development at local is well-structured
through ASDP I, the local capacity, especially that of Irrigators Organizations requires
significant improvement. Environmental and social management also requires more
awareness among the stakeholders and further assistance from Zonal Irrigation
Technical Service Units of MAFC.
9
ASDS-II: Agricultural Sector Development Strategy 2015/15-2025/26
9
(i) Extension Service
Tanzanian farmers use only 9 kg/ha of fertilizer while the average for SADC countries
is 16 kg/ha (China is 279 kg/ha). Likewise, the annual supply of improved seeds is
around 12,000 tons or 10 percent of total estimated requirements of 120,000 tons per
year.
Since 2008/9, approximately TSh480 billion has been invested in the National
Agricultural Input Voucher System (NAIVS) programme. A joint study was
conducted by MAFC, REPOA and the World Bank to establish whether NAIVS met
its intended goals. The impact evaluation suggests that the NAIVS program did
improve productivity. It contributed approximately 2.5million tonnes of additional
maize and paddy to national food supplies over the 2009/10-2012/13 period.
Participating farmers achieved an average yield gain of 433kg per acre for maize and
263kg per acre for paddy. This also helped Tanzania maintain food self-sufficiency
even in the face of regional drought. There was also some long-term improvement in
the adoption rate of improved seeds and fertilizers. Of those who had not previously
tried inputs prior to NAIVS, 47 percent bought improved seed and 19 percent fertilizer
after they graduated from the NAIVS. There are also associated effects of
strengthened agro-dealers network in the country. Furthermore, fertilizer business is
becoming more active than before, i.e. various demonstrations are being done by
private companies, smaller bags of fertilizers (e.g. 5 kg, 25 kg apart from usual 50kg)
which are affordable and easy to start for many small holders are now available in the
market.
2.3.2. Mechanization
The level of farm mechanization is still low that majority of the implements found on
farming households on the Mainland are hand hoes (97.8%) and swords (93.5%).
Relatively a small number of households used other farming implements such as ox-
plough (14.4%), castrated bulls (13.7%), hand sprayers (11.7%) and cows (10.2 %).
Other farm machinery (tractors, power-tillers) are nearly 1 %4. Farm mechanization,
especially for land preparation, planting and harvesting, is one of the elements for
commercialization of the sector.
The Government’ efforts for promoting mechanization include tax exemption for
importation of farm machinery and spare parts. In response, the business by private
companies engaged in agricultural machinery is steadily increasing. The public
finance from AGITF and TIB-Agricultural window and commercial banks are
4 National Sample Census of Agriculture 2007-08
10
ASDS-II: Agricultural Sector Development Strategy 2015/15-2025/26
10
extending loans for purchase of for tractor, power-tiller, and combine-harvester. There
are also active SACCOS that provide loans to its members for purchasing agricultural
machinery.
2.3.3. Rural Road and Electrification
Rural road development including feeder road is the responsibility of PMO-RALG.
Direct investment from agriculture sector is very limited. The Road Fund has been
established. However, the budget allocation for rural road, especially its development
budget (only 10% allocation for new construction), is extremely inadequate. The
actual achievement of 2013/14 was total maintenance of 30,575km and construction
of 108km new rural road and 5 bridges. The investment efforts require further
acceleration.
The Rural Energy Agency (REA) has also made some progress in extending electric
power to rural areas. However, rural electrification is still very low as household
lighting and cooking by electricity is only 20.7% and 1.7%, respectively5.
2.3.4. Research and Extension Service
Agricultural growth, or increased productivity, is based on application of improved
technologies. This is a continuous cycle that involves technology renovation and
adoption. In this sense, research and extension service play major roles to increase the
productivities.
(ii) Research
The government has worked closely with development partners to revive research
stations and research activities, which were drastically scaled down during the 1980s
and 1990s. The country’s 16 agriculture research stations are strategically located and
spread across the country based on agro-ecological zones to cater for different farming
systems. Some of the research centres such as Ukiliguru and Uyole are multi-
enterprises focused, while some dedicated to a single enterprise such as tea (TRIT),
coffee (TACRI), and tobacco (TORITA), which have performed better than those
dealing with multiple commodities. There are several livestock research centers, e.g.
Tanzania Livestock Research Institute, Tanzania Veterinary Livestock Agency, and
Tanzania Fisheries Research Institute for fisheries. There are also many local
institutions such as the Livestock Training Agency, and Fisheries Training Agency.
Among the key successes in the coffee sector by TACRI is the replacement of most of
5 Population and Housing Census 2012
11
ASDS-II: Agricultural Sector Development Strategy 2015/15-2025/26
11
the coffee trees with new high yielding cultivars in the coffee growing areas. Uyole
Centre also succeeded to produce two different varieties of Irish potatoes, one for
cooking and another for fried chips, such that it is among the thriving commercial
crops in Iringa, Njombe and Mbeya, whose combined surplus constitute 60 percent of
potatoes in the market6.
(iii) Extension Service
The Government has pursued efforts to improve the ratio of extension agents to
farmers through recruitment and training of new extension officers. The extension
service policy aims at least one extension agent per village and there are 9,139 field
extension officers spread across the country in 168 LGAs in 2014. Due to this
accelerated assignment, there are some certificate holders as well as diploma holders
among the existing extension agents. Therefore, continuous technical backstopping
and upgrading of these extension agents is an urgent and important task of ASLMs.
To provide more effective extension services, approaches such as farmer field schools
(FFS)7, farmer-to-farmer extension, study tours and utilization of Ward Agricultural
Resource Centers (WARC) have been promoted.
Toward commercialized agriculture, there is a shortage of specialized extension
agents for marketing and value chain approach so as to advise farmers on business
skills (business planning, market survey, negotiations, etc.), market demand
(production volume, timing, quality, etc.) among others.
2.3.5. Financial Services
The number of commercial banks is increasing and now is over 50. Some of them
extend services to agricultural sector and agro-processing. Agricultural financing
(including livestock) from commercial banks in terms outstanding lending is gradually
increasing and equivalent to 10% of the total, reaching to 1 trillion TSh. The public
financial service includes TIB-agricultural window and AGTIF under MAFC. The
Government is also in process of operationalizing the Tanzania Agricultural
Development Bank. Private Agriculture Sector Support (PASS) Trust established in
2000 and funded by DANIDA through CRDB Bank Ltd. has been providing support
for business planning and guarantees.
Formal and informal MFIs, financing to SACCOS, also support the agricultural
economy of the smallholders in rural areas. The initiative of National Financial
6 ESRF, 2011. Njombe Region Bankable Projects and Socio-Economic Profile.
7 64,460 FFS were established. MAFSC, 2011. Evaluation of the performance and achievements of ASDP. June
2011
12
ASDS-II: Agricultural Sector Development Strategy 2015/15-2025/26
12
Inclusion Framework by MOF intends an implementation plan targeting 50% of adult
population to have access to formal financial services by 2016.
2.3.6. Private Sector development and trade
Private investment has the potential to generate employment, raise productivity,
transfer skills and technology, increase competitiveness, enhance exports and
contribute to the long-term economic development of the country. However, the FDI
to agricultural sector remains low despite its huge potential; inflow of FDI to
agricultural sector was 21.2mUS$ in 2008 and 31.4mUS$ in 2011 equivalent to 2-3%
of the total FDI8.
Rapid urbanization and rising incomes have been contributing to increased demand
for value added products such as cheese, butter, etc. However, on the supply side,
underdeveloped agro-processing industry has so far failed to provide import
substitution for urban food market. The mismatch between demand and supply for
value added food products has resulted in an increased import of food commodities.
The food import bill has nearly tripled from $ 273.9 million in 2006 to $963.9 million
in 2013. There needs to be concerted efforts to create enabling environment for private
sector to invest in agriculture including agro-processing.
The pattern of growth of the economy is influenced by the transformation of the
agricultural sector through value addition of primary products, thereby influencing
investments in industry and service sectors. Following improvement in business
environment, the number of plants for processing hides and skins (blue wet stage)
increased from 3 to 6 between 2001 and 2009, with the capacity to meet 52 percent of
the total production. The number of tanneries processing plants has increased from 5
in 2001 with the capacity of 38.3 million square feet to 7 in 2009 with the capacity of
48.2 million square feet per year. In 2006/2007, hides and skins worth TZS 16.2
billion were exported, but its value dropped to TZS 12.8 billion in 2008/2009 due to
the global financial crisis.
In meat processing, the government has supported the private sector to invest in
modern abattoirs and slaughter houses in Sumbawanga, Dodoma, Arusha, Morogoro
and Coast regions; and has sold some of its shares in previously wholly government
owned companies such as NARCO and Dodoma Abattoir. Milk processing plants
increased from 22 in 2001/2002 to 39 in 2008/2009. There is also resumption of milk
processing through private companies in Musoma, Arusha, Tanga, Dar es Salaam,
Morogoro, Iringa, Mbeya and Njombe. There is still a huge potential to expand the
8 Tanzania Investment Report 2012
13
ASDS-II: Agricultural Sector Development Strategy 2015/15-2025/26
13
industry given that out of 1.3 billion litres of milk produced per year, only 20 percent
is collected and processed.
In fisheries, the industry is dependent on natural waters (lakes and the Indian Ocean).
Fisheries product from Lake Victoria, especially Nile perch, is exported widely to
international markets and the export earning is increasing. Total export value of fish
and fisheries product is over 150 million US$ in 2013. For commercial fish farming,
very little is undertaken currently.
14
ASDS-II: Agricultural Sector Development Strategy 2015/15-2025/26
14
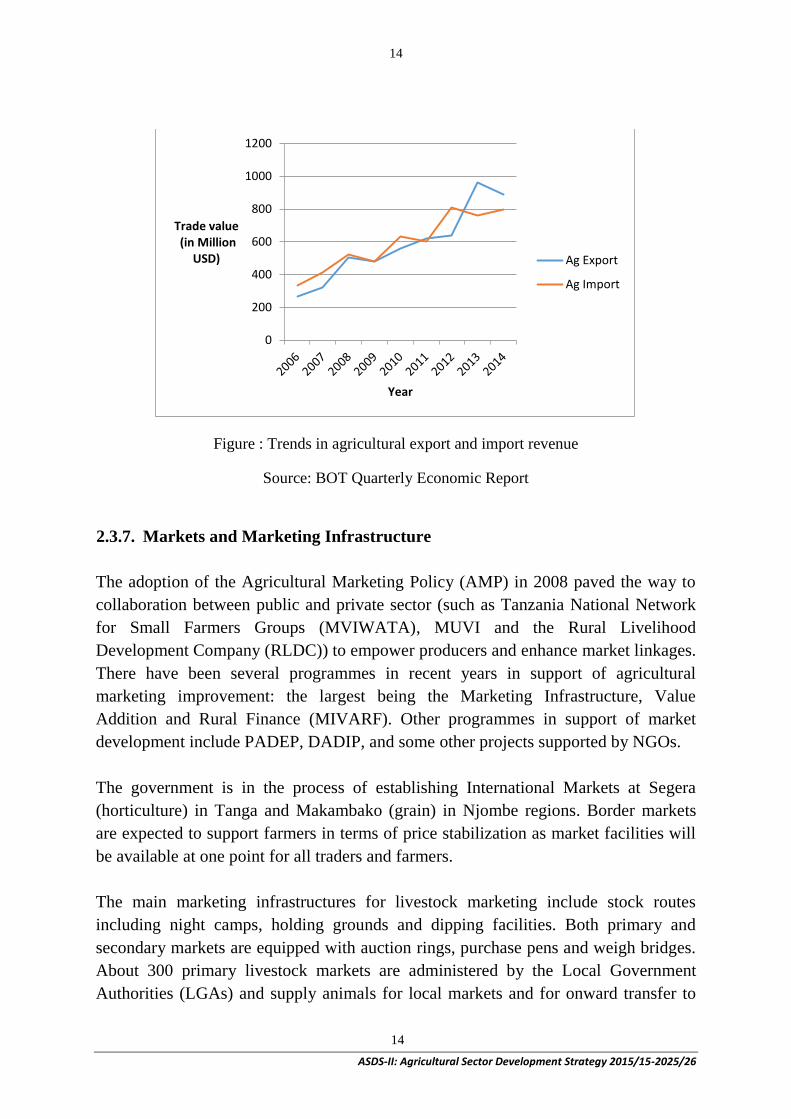
Figure : Trends in agricultural export and import revenue
Source: BOT Quarterly Economic Report
2.3.7. Markets and Marketing Infrastructure
The adoption of the Agricultural Marketing Policy (AMP) in 2008 paved the way to
collaboration between public and private sector (such as Tanzania National Network
for Small Farmers Groups (MVIWATA), MUVI and the Rural Livelihood
Development Company (RLDC)) to empower producers and enhance market linkages.
There have been several programmes in recent years in support of agricultural
marketing improvement: the largest being the Marketing Infrastructure, Value
Addition and Rural Finance (MIVARF). Other programmes in support of market
development include PADEP, DADIP, and some other projects supported by NGOs.
The government is in the process of establishing International Markets at Segera
(horticulture) in Tanga and Makambako (grain) in Njombe regions. Border markets
are expected to support farmers in terms of price stabilization as market facilities will
be available at one point for all traders and farmers.
The main marketing infrastructures for livestock marketing include stock routes
including night camps, holding grounds and dipping facilities. Both primary and
secondary markets are equipped with auction rings, purchase pens and weigh bridges.
About 300 primary livestock markets are administered by the Local Government
Authorities (LGAs) and supply animals for local markets and for onward transfer to
0
200
400
600
800
1000
1200
Trade value (in Million
USD)
Year
Ag Export
Ag Import
15
ASDS-II: Agricultural Sector Development Strategy 2015/15-2025/26
15
secondary and terminal markets located at Themi (Arusha), Weruweru (Moshi),
Korogwe (Tanga), Lumecha (Songea) and Pugu (Dar es Salaam) which then supply to
urban and export markets served by 10 border markets.
Since its inception in 2007, the Warehouse Receipt System has played an important
role in improved marketing for some agricultural products (cotton, coffee, cashew,
maize, rice, sunflower, sesame). A Commodity Exchange System is in preparation
under the coordination of the Capital Market Security Authority (CMSA).
2.4 Agricultural Sector’s SWOT Analysis
2.4.1. Strengths and Opportunities
Domestic market
With 45 million populations and 2.7% of annual increase rate, Tanzania has a huge
domestic demand for agricultural products including livestock and fishery products.
The national economy has been growing steadily at around six percent for more than a
decade.
Regional market
In addition to the domestic market, the East African Community (EAC) which
includes Kenya, Uganda, Rwanda, Burundi and Tanzania with population of more
than 100 million offers a huge market opportunity for producers and investors.
Beyond the EAC, the Southern African Development Community (SADC) with its
215 million consumers is also another market. Staples and food commodities have
higher potential for intra-regional trade as most countries in EAC and SADC are net
importers of food commodities.
Trade initiatives by developed countries
The trade promotion initiatives such as Everything But Arms (EBA) for EU and the
African Growth and Opportunity Act (AGOA) for USA have been opportunity for
exporting Tanzanian products.
Newly discovered gas resource
The recent discovery of natural gas reserves in the south of the country presents new
opportunities in near future, most directly stable power distribution in the country
which is one of the preconditions of attracting new investments including agriculture.
Gas revenue could help to enhance fiscal balance and reduce dependency on external
financing of infrastructure such as rural roads and irrigation systems.

16
ASDS-II: Agricultural Sector Development Strategy 2015/15-2025/26
16
Large crop production and irrigation development
Higher agricultural productions for some commodities (rice, cassava, maize, cashew,
etc.) in Tanzania among the region and the continent are the strength of Tanzanian
agriculture. Relatively stable and favorable rainfall and well organized irrigation
development which support paddy production in Tanzania is strength.
Capacity of Local Government Authorities
The enhanced capacity of Local Government Authorities together with well-
established DADP system through implementation of ASDP I will be a firm basis for
expanding public and private investment in the sector.
2.4.2. Weaknesses and Threats
Low productivity
The most common weakness for almost all the commodities is the slow pace of
productivity increase. Productivity is a result of multiple factors starting from seed,
input like fertilizer and pesticide, watering, harvesting, drying and other processing by
farmers themselves and other stakeholders including traders and processors.
Low investment in service delivery
Agricultural service delivery through public research, extension, and training are still
inadequate both in terms of manpower and budget allocation despite of Government’s
effort. This leads to low access to new knowledge and technology by farmers, and
poor adoption rate of improved technology.
Weak rural infrastructures
Weak rural infrastructures including rural road, electrification, market facilities and
others have discouraged investments in agricultural production and agro-industries by
private sector.
Policy environment for export and import
As agricultural production continues to increase, export market, especially to regional
one, needs to be explored. Despite of these circumstances, the stakeholders in the
sector have been suffering from unpredictable and unclear policy environment
especially on export and import as well as its enforcement capacity. Coherent and
predictable policies are crucial for sustainable sector development.
Data availability
17
ASDS-II: Agricultural Sector Development Strategy 2015/15-2025/26
17
Reliable and timely data availability have been one of the major shortcomings of the
sector. According to the Agricultural Statistics Strategic Plan (2014), National Sample
Census of Agriculture, Annual Agricultural Sample Survey, and routine data
collection systems need to be improved toward the evidence-based decision-making.
Degradation of natural environment
As the development and human activity enhances, degradation of natural environment
such as land degradation, siltation in the river, change of river course, eventually
affect the agricultural activities. Observation of environmental laws and regulations at
local level is generally weak.
Increasing resource competition
Along with climate changes, water demand by multiple sectors (agriculture, energy,
human life consumption, watershed and wildlife conservation, etc.) is becoming more
and more competitive. There is no assurance of continuous water allocation for
agricultural sector that is the largest user of water resources.
Increasing human and livestock populations are putting pressure on land use.
Increasing conflicts between farmers and livestock keepers is a hindrance to the sector
development. Promotion of land use plans and their enforcement is critical for
sustainability of the sector.
Emerging oil and gas
Tanzania is estimated to have over 45 trillion cubic meters of natural gas that could
generate over $25 billion revenue, annually. Tanzania also has coal and iron reserve
that could earn the country $1.7 billion annually on export. Massive export of natural
resources could make the economy vulnerable to the “Dutch disease” and hence
render the agricultural sector uncompetitive. The Dutch disease is characterized by
appreciation of the local currency emanating from increased inflow of foreign
currency. Unless policies are in place to sterilize the export revenue boom, agriculture
could become uncompetitive.
18
ASDS-II: Agricultural Sector Development Strategy 2015/15-2025/26
18
CHAPTER THREE
3.0 VISION, MISSION AND GOAL
3.1 VISION (of the Agriculture Sector)
As an important contribution to realization of TDV (2025), the ASDS II envisages an
agricultural sector in the year 2025 being modernized, commercial, market-oriented,
highly productive and profitable, resilient, utilizing natural resources in an sustainable
manner, securing food security throughout the country, expanding its export to
regional and international markets and contributing to improved livelihood in rural
and urban area of the country.
3.2 MISSION (of the Agriculture Sector Ministries)
The mission of agricultural sector ministries, within their mandates, will be to
facilitate the growth and development of the agricultural sector to meet the medium-
and long-term targets. This will enable the sector to contribute fully to ensure food
security and poverty reduction through increased volume of competitive crops and
livestock products, increased income especially of smallholder farmers who are more
commercial and involved in agricultural market.
3.3 SECTOR GOAL AND OBJECTIVE
3.3.1 Sector Goal
Contribute to Tanzania’s national economic growth and poverty reduction (Vision
2025/LTPP) by:
Promoting inclusive and sustainable agricultural growth (at a rate of 6 percent
per annum);
Reducing rural poverty (i.e. reduce the percent of rural population below the
poverty line from 33.3% in 2011/12 to 24% by 2025/26);
Improving food and nutrition security (e.g, reduce % of rural HHs below food
poverty line: 11.3% in 2011/2012 to 5 % by 2025/26).
3.3.2 Strategic Objectives
19
ASDS-II: Agricultural Sector Development Strategy 2015/15-2025/26
19
i. Create enabling policy and institutional environment for enhancing
modernized, commercial, competitive and value-added agriculture sector,
driven by inclusive and strengthened private sector participation;
ii. Achieve sustainable increases in production, productivity, profitability and
competitive value chain development in the agricultural sector (crops,
livestock, fisheries), driven by smallholders; and
iii. Strengthen institutional performance and effective coordination of relevant
public and private sector institutions in the agriculture sector at national and
local levels, enabled by strengthened resilience.
3.3.4 Summary of Agricultural Sector Constraints
i. Inadequate policy environment and uneven policy implementation for
achieving sustained and inclusive agricultural growth targets
ii. Low productivity levels and growth trends, including inadequate and
sustainable access to key inputs (especially fertilizers and seeds, animal AI,
fingerlings)
iii. Weak delivery of agricultural services (for crops, livestock, fisheries), coupled
by inadequate public and private resources
iv. Inadequate and lack of prioritized and quality public investments, and low
private sector investments, reflecting the early stages of private sector
development; this includes inadequate rural infrastructure (e.g., irrigation, rural
roads, storage facilities, rural energy)
v. Constraints to efficient and competitive agricultural marketing, including
limited value-chain development
vi. Limited access to sustainable rural finance
vii. Weak capacities to respond to climate change challenges
viii. Weak institutional and human resource capacities and inadequate coordination
among diverse stakeholders, at national and local levels, including weak
agricultural statistical system
3.3.5 Strategic “Drivers” of Inclusive Agric. Growth and Reduced Rural Poverty
i. Policy and Regulatory Framework: Promoting the effective multi-stakeholder
formulation, consensus and effective implementation of key policy reforms
which can enable key productivity and value chain drivers of the sector
transformation process, especially expanded access to and efficient utilization
of improved seeds, fertilizer (organic and inorganic), complying with sound
phytosanitary/zoosanitary grades and standards for ensuring competitive
exports, marketing policies and regulations, enhanced value chain
development, sustainable incentive structure, consistent with Tanzania’s
market and competitive advantage;
ii. Production/Productivity and Trade: Increasing sustainable productivity of crop,
livestock and export commodities which would improve household nutrition
20
ASDS-II: Agricultural Sector Development Strategy 2015/15-2025/26
20
and food security, especially of smallholder families, and vulnerable rural
families; this would be enabled by productivity-enhancing technology research
and extension coverage, facilitated through strengthened research-extension
linkages, effective extension models, responsive to climate change trends;
expanded and inclusive private sector role, and stronger and more effective
farmer cooperatives and organizations’ which also would support and
incentivize expanded marketed production, enabled by expanded and
sustainable access to rural finance;
iii. Private Sector: Stimulating expanded and inclusive private sector-driven value
chain development and integration, facilitated by expanded models of land-use
and effective and viable public-private partnerships, and expanded rural
infrastructure (especially small-scale irrigation, post-harvest facilities and rural
feeder roads); this would contribute to much needed expanded off-farm
employment opportunities;
iv. Institutional Capacities and Coordination: Strengthening institutional
development and effectiveness, including: results-focused capacity
development of key actors at central and local levels; more efficient, responsive
transparent and accountable decentralization of key agricultural services and
implementation; more effective and evidenced-based planning, budgetary and
M&E systems at various levels, enhanced nutrition and food security support
services; and enhanced processes and mechanisms for more effective
coordination within Agricultural Sector Lead Ministries (ASLMs), other sector
Ministries/agencies, private sector and other key stakeholders
19
ASDS-II: Agricultural Sector Development Strategy 2015/15-2025/26
19
CHAPTER FOUR
4.0 ASDS II – STRATEGIES
Chapter Four is divided into two parts.
Sub-chapter 4.1 treats five strategic areas for intervention based on the Strategic
Objectives -SO (articulating the LTPP, TAFSIP) listed in Chapter Three. The SO are
broken further into Intermediate Results (IR). They are all essential and require
actions from ASLMs, often with participation of the private sector. They aim at
stimulating forward and backward linkages to enhance economic activities and
income generation necessary for poverty reduction and the several other objectives in
the vision for agriculture. The described efforts will need to be prioritized among the
ASLMs along with the increased budget allocation to agriculture sector towards the
ten percent target. Even after achieving the ten percent, a major task of setting
priorities within these strategic areas will be required.
Sub-chapter 4.2 focuses on a small set of priorities chosen to ensure that the targeted
six percent growth rate is achieved quickly and maintained. A few of those priorities
will have immediate impact, some will continue to have impact on the growth rate.
Others need to start being developed, given their long gestation periods, so that they
will come into force as the first elements are declining in their impact.
It must be clear, in the context of a focus on priorities for achieving the six percent
growth rate, that the six percent growth rate is only a means to the ends of agricultural
development as stated in Chapter Three and its statement of vision, mission, and
goals. This indicates that a significant shortfall from the six percent growth rate will
make it virtually impossible to ensure attainment of that vision, mission and goals.
That is why CAADP focuses on that growth rate.
20
ASDS-II: Agricultural Sector Development Strategy 2015/15-2025/26
20
4.1 Strategic Areas for Intervention
SO1: Expanded Sustainable Water and Land Use Management
Appropriate use of natural resources that includes land, water and forest would
enhance productivity and profitability in the agricultural sector as well as conserve the
environment. Despite having numerous and diverse water resources in the form of
rivers, lakes, wetlands and aquifers, the country still faces challenges in attaining good
management and utilization of the resources for sustainable agriculture. Furthermore,
land degradation is substantial, due to inappropriate farming and grazing methods, and
most importantly, lack of comprehensive land use plans and demarcation and
associated laws to adequately protect land and water resources.
IR 1.1 Water Use for Irrigation, Livestock and Fishery Made More
Efficient and Inclusive
The following strategic interventions are therefore expected during the next 10 years,
with some innovations suggested to do business differently:
a) Mobilize resources for investment in irrigation (including new development,
expansion, rehabilitation) to increase productivity by targeting the prioritized
areas where high return is expected through double or triple cropping, high
value cash crop production.
b) Strengthen Irrigators Organizations as functional farmers’ organizations for
better operation and management of the constructed irrigation infrastructures.
Required capacity development includes organizational management, financial
management, water management, minor maintenance skills among others.
c) Further improve the established institutional structure of irrigation development
at all level, especially in focus of backstopping services for LGAs and IOs.
d) Implement coordinated water resource planning and management, targeting
water catchment and wetlands and enforcing national guidelines on water and
wetlands management through better coordination with the relevant ministries
and authorities.
e) Enhance efficiency of water utilization by diversifying from the over reliance
on surface river water abstractions for gravity-fed irrigation schemes, ensuring
adequate investments in water storage infrastructure and improving drainage
system.
f) Encourage private sector to invest in irrigation development so as to reduce the
burden of government funding for every project including sub-contracting of
scheme surveys, architectural plans and construction supervision.
21
ASDS-II: Agricultural Sector Development Strategy 2015/15-2025/26
21
g) Enact and enforce laws and regulations which protect irrigation potential and
irrigation developed areas; coupled with rewards and penalties for observing
regulations.
h) Continued efforts to ensure sustainable water resources management and
utilization are required through the following interventions:
a) Enhance observation of the existing ESMF and implementing capacity of
formulated ESMPs by IOs that will include measures to prevent or
minimize degradation of both surface and ground water resources.
b) Build capacity at national and local levels on watershed management.
c) Improve coordination of Integrated Water Resources Planning among
different sector ministries and local level governance structures including
possible water use by multi-sectors at local level.
IR 1.2 Land Use Planning and Watershed Management Improved
This strategic area requires multi-stakeholder approach for sustainable land use that
includes pasture and rangeland:
a) Sound National and Village Level Plans
ASLMs will continue to collaborate with Ministry of Land, Housing and
Settlements (MLHS) and Office of the Vice-President’s
(Environmental), PMO-RALG and donors to roll out the land use
planning and management throughout the country.
Work closely with Tanzania Investment Centre (TIC) to establish a land
bank for investors and pilot land for equity as PPP between investors
and villages.
b) Sustainable Pasture and Range Management
Enhance observation of the existing ESMF and implementing capacity
of formulated ESMPs by farmers and livestock keepers that will include
measures to prevent or minimize land degradation and desertification.
Set up and strengthen a mechanism for resolving land use disputes
between stakeholders, especially between crop farmers and livestock
keepers.
c) Soil Fertility Management
Promote proper tillage of land and use of fertilizers and other chemicals
so as to safeguard soil health.
Enhance collection of soil analysis data focusing on the prioritized areas
for better selection of fertilizer application.
d) Fish Farming
22
ASDS-II: Agricultural Sector Development Strategy 2015/15-2025/26
22
Enhance, integrate and sustain inland aquaculture as part intensified farming
systems
IR 1.3 Climate Change Mitigation and Adaptation Increased
In response to a growing threat of climate change, the ASLMs will collaborate with
the related ministries and take mitigation and adaptation measures without delay.
The required interventions include:
a) Undertake research and exchange information with other research institutions
(regional and international) on introduction of new crops/varieties and farming
systems that have characteristics such as drought-resistance, short-maturity,
heat tolerance.
b) Improve water use efficiency (irrigation and others) by improving water
distribution planning, drainage system, reducing conveyance loss, rainwater
harvesting facility, on-farm water storage, and by introducing new technology
like drip irrigation in places where feasible.
c) Promote water catchment management, and land and soil management
(including monitoring of salinity) through coordinated efforts from both crop
and livestock sectors.
d) Enhance observation of the existing ESMF and implementing capacity of
formulated ESMPs by farmers and livestock keepers that will include measures
to prevent or minimize land degradation and desertification in catchment areas.
e) Develop and coordinate a campaign using ICT to raise awareness and
disseminate targeted climate and weather information to the stakeholders.
23
ASDS-II: Agricultural Sector Development Strategy 2015/15-2025/26
23
SO 2 Improved Agricultural Productivity and Profitability
This strategy aims to increase and sustain productivity of priority commodities (crops,
livestock and fishery). The priority should be to enhance agricultural productivity
growth rate in the small commercial farmer sub-sector, which for the past decade has
been sluggish for most of the commodities. The increased productivity is a
prerequisite for food security and agricultural commercialization. There is a need to
accelerate the adoption of yield-enhancing technologies such as fertilizer and
improved seeds, improve access to credit, reduce on-farm and post-harvest losses,
improve livestock health services and increase the pace of mechanization.
IR 2.1 Agricultural Research Improved
a) Improve technology generation delivery systems responsive to farmer needs
and market requirements which will contribute to increased and sustained
production and productivity of priority commodities (crops, livestock, fishery)
b) Improve technology dissemination delivery systems which will contribute to
increased and sustained production and productivity of priority commodities
(crops, livestock, fishery)
IR 2.2 Agricultural Extension Service Improved
The services including extension, research, and training play pivotal roles in linking
farmers to new technologies, information and knowledge that are central in enhancing
agricultural productivity.
The required public interventions include:
a) To assign at least one agricultural extension worker per village and provide
necessary working tools for extension services.
b) Employ diverse and lower cost extension methodologies by village and ward
agricultural extension workers with supports from district extension workers
and subject matter specialists.
c) Enhance effective utilization of Ward Agricultural Resource Centres (WARC).
d) Enhance technical backstopping to local level extension workers from MATIs,
academic institutions, and central ministries to upgrade their knowledge and
skills and to assure the quality of provided services.
e) Continue to improve extension methodologies including participatory
approaches, gender mainstreaming, commodity-specific extension service.

24
ASDS-II: Agricultural Sector Development Strategy 2015/15-2025/26
24
f) Build capacity of research institutes in human and financial resources,
infrastructure and equipment.
g) Continue participatory research and enhance participation of a wide spectrum
of stakeholders in identifying research priorities.
h) Enhance collaboration with foreign research institutes including CGIAR and
private sector to upgrade the level of research and researchers as well as raising
fund.
i) Enhance linkage between research and extension through effective mechanism
at all levels.
IR 2.3 Access to Farm Inputs Increased
Increased Fertilizer and Improved Seed Application
Introduction of improved seeds or improved variety which is more responsive to
fertilizer application is a proved approach for achieving higher productivity. The
Government’s effort through NAIVS for increased use of improved seed and fertilizer
and for increased network of agro-dealers at local level has succeeded in some aspects
and requires follow-up. The required interventions include:
a) Provide smart input subsidy to enhance utilization of improved seeds and
fertilizer by smallholders.
b) Design agricultural credit package appropriate to smallholder farmers
c) Facilitate private traders and agro-dealers to enhance the business network so
that access to input by smallholders is improved in the rural areas.
d) Implement effective extension services and trainings that will accelerate
adoption of new technology in focus of improved seed and fertilizer.
e) Enhance use of organic fertilizer along with livestock activity, especially in the
areas where mixed husbandry is in place.
f) Strengthen the national seed system that includes all the stakeholders, i.e.,
Agricultural Research Institutes, ASA, TOSCI, private seed producers and
distributers, QDS producers, including enhancement of breeding capacity of
Agricultural Research Institutes.
Promoted Artificial Insemination and Other Livestock Technologies
a) Increased access to Artificial Insemination for upgrading of local breeds
b) Improving animal health through interventions for controlling and eradicating
diseases and pests. Activities include strengthening existing and increasing
veterinary check points along marketing routes, and surveillance and control of
25
ASDS-II: Agricultural Sector Development Strategy 2015/15-2025/26
25
communicable diseases. Establishment of border markets and disease free zone
for the export markets.
c) Improving livestock marketing infrastructure such as trekking routes, holding
grounds, night camps, primary and secondary markets, cattle dips and spray
races, etc
d) Improving rangeland such as seed dissemination for improved pasture varieties,
controlled burning for eradication of pests, prevention of erosion, etc.
e) Institutional strengthening would entail capacity building to local government
in managing livestock infrastructure and administration of livestock revenue.
Enhanced Aquaculture and Access to Fingerlings
Productivity could be enhanced by:
a) supporting research on certified fingerlings and feed production,
b) establishing public–private partnerships in fish seed and feed production,
c) developing an aquaculture policy and legislation,
d) developing an aquaculture master plan and investment plan, and
e) supporting fisheries participatory extension services.
f) Promoting fish quality assurance and safety, value addition and access to
markets
IR 2.4 Access to Agricultural Mechanization Service Increased
The mechanization issue is treated more fully in Sub-chapter 4.2. In the longer run,
increased mechanization will break labor bottlenecks and contribute to increased labor
use. The mechanisms for realizing this are complex. Private sectors dealing with
agricultural machinery needs to be grown in small towns and farmers should take up
mechanization only when it is profitable. These also require adequate credit so some
farmers can purchase machinery and hire it out to others, grouping farmers for joint
ownership. The required interventions include:
a) Collaborate with private sector on promotion of mechanization through
demonstrations of modern technology (tractors, power-tillers, harvesters, etc.).
b) Collaborate with private sector on promotion of simple farming implements
and tools such as weeder, seed-distributor, etc.
c) Facilitate agricultural financing services for agricultural mechanization.
d) Facilitate with educational institutes for producing qualified mechanical
engineers needed in the sector.
e) Create favorable business environment for importing agricultural machinery
and spare-parts and for domestic marketing.
26
ASDS-II: Agricultural Sector Development Strategy 2015/15-2025/26
26
SO 3 Strengthened and Competitive Value Chain t
IR 3.1 Farmer Organizations Empowered
Group formation and adoption of collective approach are indispensable steps for
realizing agricultural commercialization. The capacity of farmers organizations, as a
key private sector player, requires significant improvements from the current status.
The required public interventions include:
a) Continue to build organizational and technical capacity of farmers
organizations through public extension and training services and collaboration
with private services including the supports from non-state actors.
b) Enhance entrepreneurship and competitiveness of farmers organizations
through capacity building in organizational management, leadership, financial
management, basic business skills (e.g. business planning, market survey,
contracting, access to finance service).
c) Promote wide-ranged participation among women and young farmers into
farmers organizations.
d) Provide a clear framework for establishment and operation of farmers
organizations.
SO 3.2 Agribusiness and Value Addition Promoted
Value Addition
Agro-processing and value addition are important elements of increased agricultural
commercialization. These activities can generate additional employment in rural areas.
They also have strong forward linkages such use of by-product in agro-processing for
animal feed.
The required public interventions include:
a) Promote agro-processing for reducing post-harvest loss.
b) Promote agro-processing for value addition such as grading, milling, canned,
juiced, etc. For livestock, promote dairy industry (milk, yogurt, cheese)
including cold chain, meat processing, especially in focus of small commercial
farmers in the rural areas.
c) Promote improvement on packaging, handling, transporting agricultural
products.
d) Ensure that agro-processing undertakes an environmentally responsible
technology and hygiene measures based on the relevant laws and regulations.
27
ASDS-II: Agricultural Sector Development Strategy 2015/15-2025/26
27
e) Create favorable business environment for needed medium- and long-term
investment including import of agro-processing equipment and spare-parts.
Agribusiness and Private Sector Development
A diverse, competitive and robust private sector to spearhead the development of the
agricultural sector is envisaged by way of increased flows of private investment and
services in the sector. This will be achieved with the improved conditions and systems
in which the private sector operates.
The required interventions include:
a) Promote private sector investment to agriculture sector especially through on-
going efforts of SAGCOT initiative and commercial farm component of the
Agricultural Big Result Now while assuring the participation of smallholders in
the investment areas.
b) Continue improvement of business environment including trade policy,
procedures and regulations on export and import, investment, taxation, and
other related issues in collaboration with relevant organizations such as TIC.
c) Establish and strengthen dialogue forum among the key stakeholders from
public and private sectors to discuss on the improvement of business
environment.
d) Expand agricultural finance services through TIB-Agricultural window,
AGTIF, Tanzania Agricultural Development Bank and commercial banks for
medium and long-term investment in the sector.
e) Continue current efforts to improve infrastructure such as feeder roads,
electricity, and communication network as well as technical support to
smallholders in the area through extension services and trainings.
IR 3.3 Access to Markets and Rural Infrastructure Improved
Market Access
Marketing of the agricultural products requires efficient and well regulated marketing
systems. The ASLMs will therefore collaborate with various stakeholders to
implement policies, enforce laws and regulations, and create a favourable environment
for marketing activities.
The required interventions include:
28
ASDS-II: Agricultural Sector Development Strategy 2015/15-2025/26
28
a) Establish and operationalize the Agricultural Commodity Exchange to further
facilitate the trade on the selected commodities, targeting higher prices for
primary producers.
b) Capacity building among producers and traders, and raise their awareness on
the required standards and quality as demanded by domestic, regional and
international markets.
c) Oversee the implementation of recommended grading and standard protocols
for different commodities to enable penetration to domestic, regional and
international markets.
d) Continue to review and improve the existing legal and regulatory framework of
agricultural marketing system for domestic and export market.
e) Widely publish renewed legal and regulatory framework including removal of
trade barriers (administrative and taxes/charges) which limit market access,
especially with the regional market.
f) Improve the market information system (including price) and promote
awareness among stakeholders on its utilization to support commercial
decision-making by producers, processors and traders.
g) Strengthen the systems for enforcing food safety controls based on traceability
and proper handling along the value chains of crops, fish and animal products.
h) Promote the introduction of barcodes for both domestic and exported
agricultural products to enhance accountability and traceability.
i) Innovatively prepare a programme for training and awareness creation among
law enforcement agents (the police, immigration and magistrates) on the
regulations and procedures for appropriate treatment of agricultural traders and
transporters to minimize non-tariff barriers.
Trade: Domestic, Regional and International
The government will continue to promote domestic, regional and international trade
for agricultural commodities including a market for food commodities in the EAC and
SADC trading blocks.
The required interventions include:
a) Promote internal and external trade under the Tanzania Trade Development
Authority (TANTRADE).
b) Promote local products by campaign to use “Made in Tanzania” products such
as cooking oil(sun flower oil, sesame oil) sugar, milk and other dairy products,
meat and other meat processed product, and fruit juices and wines/liquor.
29
ASDS-II: Agricultural Sector Development Strategy 2015/15-2025/26
29
c) Further strengthen the key traditional cash crop exports including tobacco,
coffee, tea, cashew nut, cotton. Increasing the proportion of processed
commodity like cashew nut, cotton, tobacco are the key issues among others.
d) Further promote recently increasing export of fish and horticulture. In addition,
promote strategically export of maize and rice whose production has been
increasing in recent years and the demand from neighboring countries are
continuously high.
e) Expand well-functioning export processing zones in the prioritized regions,
especially those along the border so as to take advantage of the proximity to
regional markets.
f) Reinforce the current system of regular consultations with private sector
stakeholders, through best utilization of commodity-specific stakeholder
associations, to identify and remove constraints related to unfavorable taxes,
tariffs and interest rates, and other related procedures and regulations which
have implications on trade benefits and profitability.
Rural and Marketing Infrastructure
Rural infrastructure, in the form of rural roads, marketing infrastructure, private and
public storage facilities, telecommunication networks and electricity, are
indispensable for agricultural products produced in rural areas to flow into the market,
i.e., domestic, regional and international market. They are also the preconditions and
provide incentives for setting up of businesses such as agro-industries, trade and
transportation, thus creating employment opportunities.
Government, through the ASLMs, will work closely with private sector and the
development partners to continue its efforts to undertake the followings:
(1) Rural Roads:
a) Work closely with the responsible ministries and authorities to improve
transportation infrastructure, specifically linking rural roads to district roads.
b) Take measures to strengthen the management of the Rural Roads Fund and
improve the system for allocation of funds for new investment and
maintenance.
c) Strategically link rural roads to feed into existing railway system such as the
Tanzania-Zambia Railway and the Central line.
d) Promote private investment by providing tax incentive for private companies to
invest in rural road maintenance in their areas of operations as tea and
sugarcane production companies in Amani and Kilombero have been doing.
30
ASDS-II: Agricultural Sector Development Strategy 2015/15-2025/26
30
(2) Warehouses and Storage
a) Roll out the operations of Warehouse Receipt System for appropriate
commodities by empowering farmers organizations and collaborating with
commercial banks and financial institutes.
b) Support increasing storage capacity for grains along with promotion of WRS.
c) Promote improved household level and village level storage of grains (e.g.
granaries and mini-silos) to minimize post-harvest loss.
d) Support establishment of network of milk collections and cooling centres,
building on already registered successes in Tanga, Iringa, Kibaha and Musoma.
e) Support increasing the number and capacity of cold storage and cold chain to
service dairy and fish products, building on successes such as that Lake
Victoria through the Lake Victoria Fisheries Organization (LVFO) for fresh
water products.
(3) Rural Electricity:
Although the provision of electricity is not under the direct jurisdiction of the ASLMs,
the ASLMs will work closely with the Ministry responsible for energy and the Rural
Energy Agency (REA).
(4) Market Facilities
a) Establish and improve market facilities at village, ward and district level after
going through consultation with all the stakeholders and clarifying the
responsibilities of the parties.
b) Strengthen the wholesale markets in the country that require strategic locations
and commodity-specific interventions in view of smooth distribution within
domestic market and accelerated export of strategic commodities.
c) Establish border market places to encourage trade with neighboring countries.
d) Complete the construction of international produce market places at Kibaigwa
(maize, sorghum and beef), Segera (horticultural products) and Makambako
(multi-purpose).
e) Strengthen the support for management and operation of the market facilities
through extension services and trainings (e.g. setting up rules and regulations,
financial management).
(5) Veterinary Services
a) Strengthen existing plans to establish more Veterinary Service Centres to cater
for types of livestock suitable in each administrative division.
b) Encourage investments by the private sector, by innovative use of tax
incentives and special grants, to complement government’s efforts in providing
livestock husbandry and veterinary services at ward and village level so as to
31
ASDS-II: Agricultural Sector Development Strategy 2015/15-2025/26
31
increase the number of cattle dips, artificial insemination centres, vaccination
facilities and hatcheries (poultry).
c) Promote the establishment of Community Cells to share facilities for poultry
hatcheries, sharing of improved bulls, and also maintenance of cattle dips,
insemination and vaccination facilities.
IR 3.4 Access to Agricultural Finance Expanded
Inadequate financial service for small commercial farmers is a major constraint to
agricultural growth. Sub-chapter 4.2 treats these issues in the priorities context.
The required public interventions include:
a) Promote services of existing community banks and start-up of new ones at
local level.
b) Provide support to establish stronger and well capitalized grassroots-level
micro-finance institutions such as SACCOS and Village Community Banks
(VICOBA) as first-line of financial service for small commercial farmers.
c) Update the National Micro-Finance Policy in collaboration with other
ministries to take into account recent developments in technology such as the
use of mobile banking, pension schemes and insurance schemes, which are
useful to rural households entering into commercial farming.
d) Strengthen overseeing functions of the Cooperative Department at local level
as part of promotion of MFIs.
e) Accelerate efforts to expand agricultural finance services through TIB-
Agricultural window, AGTIF, the establishment of the Tanzania Agricultural
Development Bank, for medium and long-term investment in production and
processing.
f) Promote agricultural lending from commercial banks.
32
ASDS-II: Agricultural Sector Development Strategy 2015/15-2025/26
32
SO4 Strengthened Institutions, Enablers and Coordination Framework
IR 4.1 Policy, Regulatory and Institutional Framework Enhanced
Effective policy formulation and institutional reforms necessary for policy
implementation are the foundations for realizing the Strategic Objectives 4.1 to 4.6
described in the above. It is also one of the most important functions of the
Government.
The required interventions include the followings:
a) Whilst Tanzania’s policy framework for agricultural and rural development is
comprehensive and stable, there are a number of areas where reviews,
adjustments, and refinements may be beneficial. The ASLMs in collaboration
with relevant ministries will work on the improvements of policies assuring
participation of stakeholders.
b) Considering the diverse stakeholders involved in the sector activities including
private sector, sector coordination needs to be strengthened as important part
of institutional arrangement. Coordination includes (i) sharing the sector goals
and its priorities in the implementation program, (ii) joint monitoring
(evidence based), and (iii) enhanced stakeholder dialogue for reviewing the
sector performance against the set goal and discussing prioritized issues
including policy reforms.
c) For this, the ASLMs will strengthen its thematic working groups in the
selected important thematic areas in the capacity of planning, monitoring and
supervision, analysis, policy formulation among others. Thematic working
groups will also coordinate with the corresponding stakeholder groups.
IR 4.2 Institutional Capacity Building and Coordination
Agriculture is the major occupation for the majority of Tanzania’s population and
accounts for about a quarter of GDP. The sector therefore involves many stakeholders
and institutions at national and Local Government Authorities (LGAs) to deliver
various services required by farmers. Therefore, it is imperative to ensure coordination
to avoid duplication of effort and wastage of resources. Capacity building of various
institutions is also important to ensure efficient and effective in service delivery. To
strengthen institutional capacity and coordination, the following activities would be
implemented:
a) Strengthen the capacity of LGAs in overseeing implementation of agricultural
activities including improvement of Public Financial Management (PFM).
b) Enhance coordination of activities at National and Local Government level by
enhancing engagement of Regional Administration as a link between the
Ministry and LGAs
33
ASDS-II: Agricultural Sector Development Strategy 2015/15-2025/26
33
c) Restructure some of the institutions for improved coordination, efficiency and
effectiveness of service delivery in agriculture
d) Strengthen public–private partnerships in agriculture investment and service
delivery such as greater engagement of private sector in extension service
e) Build the capacity of human resource in Agriculture Sector Line Ministries
(ASLM) through short courses, coaching and mentoring.
f) Leverage ICT and mobile phone technology to improve administration and
management of human resource and activities
IR 4.3 Food and Nutrition Security Improved
Food security aims at promoting sustainable food availability and accessibility to all
people at all levels throughout the year. This will be achieved through ensuring food
production, stocks and trade, improved market and market structures, and adaptive
measures against negative effects of climate change.
Food Security
Policy measures to mitigate effects of possible food price spikes and food insecurity
for vulnerable segments of the society will be increasingly important for stable social
and economic development.
The government will collaborate with different stakeholders to adopt some of the
possible measures to improve food accessibility.
The required interventions include:
a) Strengthen and improve the quality of Crop Forecast and Early Warning
systems including the associated periodical surveys through supports from
Development Partners within the overall framework of agricultural statistics.
b) Strengthen food reserve and distribution system by the National Food Reserve
Agency including expansion and improvement of storage facilities while
effectively working with the private sector.
c) Regulate according to necessity food imports including its tariff with careful
considerations on the food demand and supply.
d) Establish an active link with member countries in the EAC and SADC for
monitoring regional food security situation given that Tanzania’s food would
be traded or distributed as emergency operation in the region.
Nutrition Security
34
ASDS-II: Agricultural Sector Development Strategy 2015/15-2025/26
34
The prevalence of stunting, wasting, high infant and under five mortality rates, and
maternal malnutrition affects negatively the consequent educational achievement and
improved productivity in adulthood. Therefore, malnutrition is often inherited from
one generation to next. The effects of malnutrition are also magnified by unsafe
drinking water, poor hygiene, and lack of information and education on good nutrition
and sanitation. Achieving nutrition security requires concerted multi-sector efforts.
The required interventions include:
a) Promote awareness among rural households, especially focusing on child and
maternal malnutrition (including increased attention to “1,000 days” of
pregnancy and lactating period), on good nutrition and sanitation through
collaborative activities with related sector ministries.
b) Particular attention is on more effective use of Nutrition Officers at local level
who can be part of agricultural extension service and training on nutrition
aspect under the District Facilitation Teams.
c) Enhance collaboration with related ministries to strengthen and scale up food
fortification of micronutrient.
d) Provide effective social safety net programmes for vulnerable groups who are
chronically weak and require protection against shocks, especially draught,
including such as food for work, conditional cash transfers and micro-finance
are necessary for such populations left out of the market. Programs such as
TASAF (Tanzania Social Action Fund) need to be aligned with agricultural
interventions for sustainability.
e) Enhance collaboration with related ministries on the school feeding programme
in rural areas where such assistance is needed.
IR 4.4 Disaster Management and Resilience Improved
Natural disasters in the country include drought, heavy rain followed by flood,
migration of disease and pests for crops and livestock, deforestation, soil degradation,
among others. As a consequence, crop and livestock production are directly affected
and negative impact on social and economic activities are evident. This will easily
bring down majority of smallholders into acute and/or chronic food insecurity and
poverty. Climate change is already in place and expected to become more significant
in the future. Therefore, immediate actions are required toward increased resilience in
agriculture.
To respond to natural disaster described in the above, the ASLMs will collaborate
with the related ministries to improve the quality of disaster management.
The required interventions include:
35
ASDS-II: Agricultural Sector Development Strategy 2015/15-2025/26
35
a) Improve the Crop Forecast and Early Warning system as well as pest and disease
surveillance system for early detection of disasters.
b) Coordinate with the country’s meteorological information collection and sharing
system
c) Respond effectively to the warnings by providing appropriate guidance to the
stakeholders (especially farmers) through I mproved communication.
d) Improve the preparedness for emergency disasters and act effectively through
better coordination with related ministries and agencies.
e) On migratory diseases and pests from neighboring countries, strengthen the
collaboration with relevant organizations in UN, regional organizations, and
neighboring countries for early detection of disasters, and respond effectively in
a coordinated manner.
IR 4.5 Monitoring and Evaluation and Agricultural Statistics Strengthened
a) Monitoring and Evaluation: Strengthen M&E so as to enhance evidence based
strategy development and design of programs and projects
b) Agriculture Statistics: Improve the quality, cost effectiveness and timeliness of
agriculture statistics
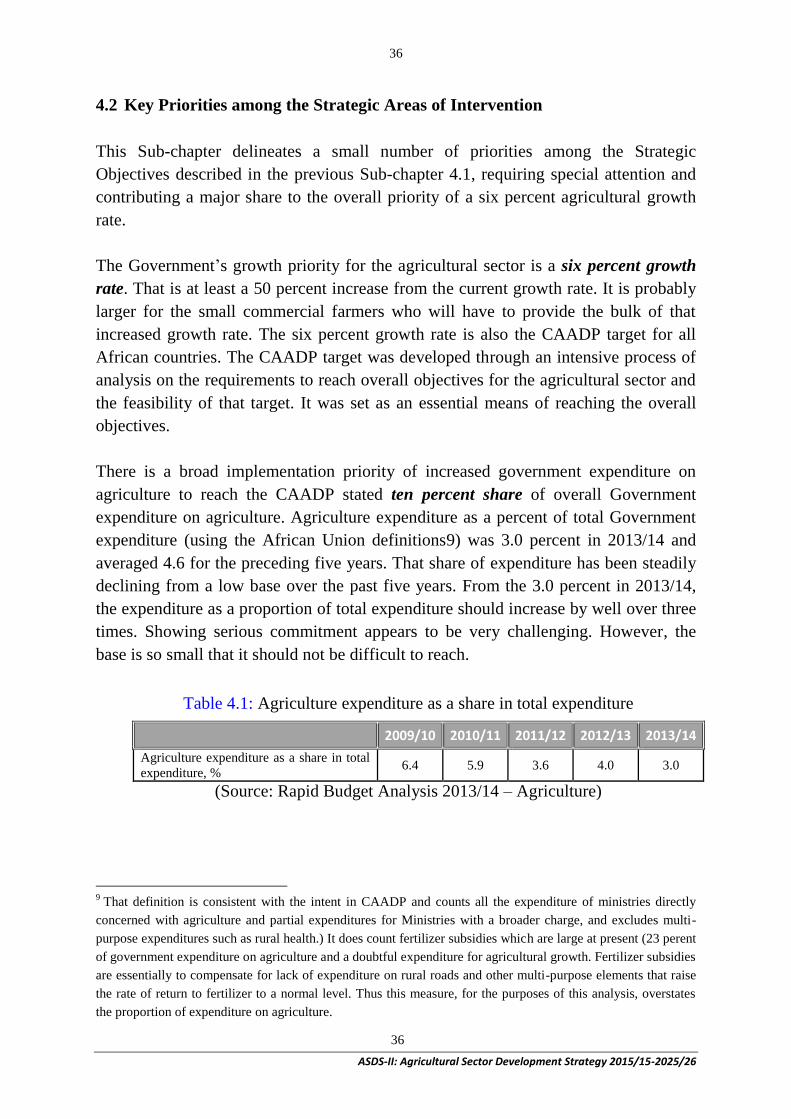
36
ASDS-II: Agricultural Sector Development Strategy 2015/15-2025/26
36
4.2 Key Priorities among the Strategic Areas of Intervention
This Sub-chapter delineates a small number of priorities among the Strategic
Objectives described in the previous Sub-chapter 4.1, requiring special attention and
contributing a major share to the overall priority of a six percent agricultural growth
rate.
The Government’s growth priority for the agricultural sector is a six percent growth
rate. That is at least a 50 percent increase from the current growth rate. It is probably
larger for the small commercial farmers who will have to provide the bulk of that
increased growth rate. The six percent growth rate is also the CAADP target for all
African countries. The CAADP target was developed through an intensive process of
analysis on the requirements to reach overall objectives for the agricultural sector and
the feasibility of that target. It was set as an essential means of reaching the overall
objectives.
There is a broad implementation priority of increased government expenditure on
agriculture to reach the CAADP stated ten percent share of overall Government
expenditure on agriculture. Agriculture expenditure as a percent of total Government
expenditure (using the African Union definitions9) was 3.0 percent in 2013/14 and
averaged 4.6 for the preceding five years. That share of expenditure has been steadily
declining from a low base over the past five years. From the 3.0 percent in 2013/14,
the expenditure as a proportion of total expenditure should increase by well over three
times. Showing serious commitment appears to be very challenging. However, the
base is so small that it should not be difficult to reach.
Table 4.1: Agriculture expenditure as a share in total expenditure
2009/10 2010/11 2011/12 2012/13 2013/14
Agriculture expenditure as a share in total
expenditure, % 6.4 5.9 3.6 4.0 3.0
(Source: Rapid Budget Analysis 2013/14 – Agriculture)
9 That definition is consistent with the intent in CAADP and counts all the expenditure of ministries directly
concerned with agriculture and partial expenditures for Ministries with a broader charge, and excludes multi-
purpose expenditures such as rural health.) It does count fertilizer subsidies which are large at present (23 perent
of government expenditure on agriculture and a doubtful expenditure for agricultural growth. Fertilizer subsidies
are essentially to compensate for lack of expenditure on rural roads and other multi-purpose elements that raise
the rate of return to fertilizer to a normal level. Thus this measure, for the purposes of this analysis, overstates
the proportion of expenditure on agriculture.
37
ASDS-II: Agricultural Sector Development Strategy 2015/15-2025/26
37
It is notable that 75 percent of the development expenditure in the agriculture budget
is from foreign assistance – and that excludes many large off-budget expenditures,
such as the USAID Feed the Future.
The set of priorities stated in this chapter is built on recognition, as in CAADP, that
rapid agricultural growth is based on modern scientific advances adapted to
Tanzania’s agriculture and applied by massive numbers of small commercial farmers.
There is therefore an immediate priority to national science and technology capacity.
That requires a large increase in expenditure on research and extension and a large
absolute increase in the annual rate of increase in fertilizer and improved seed
application. These will provide the core of the six percent growth rate for the first
several years of the effort. Longer run priorities, with possible delays in impact due to
the need for institutional building, are stated for agricultural finance for the small
commercial farmer, irrigation, mechanization, and marketing.
A priority is stated to the small commercial farmer who produces 75 percent of
output. A regional priority needs to be given to the high rainfall potential areas. The
livestock sector is large enough initially and the potentials for growth sufficient that it
receives a priority that will increase greatly over time. In the long run, the livestock
sector will grow to provide the largest component to a high agricultural growth rate.
Each of these priorities is discussed in some detail below while the monitoring of
those priorities is discussed in the next chapter.
It must be clear that setting priorities is a positive exercise- a statement of a small
number of items requiring special attention. It is not an exercise in stating or implying
items that are unimportant or unnecessary. As will be stated more fully below, the
Ministries covering the crop and livestock sector have many departments, each of
which has an important role to play. It is an important task for the Ministries to
prioritize the budget amongst those activities. That exercise is based on detailed
analyses of the role of each department. The increase of budget share to agriculture
will offer ample opportunity to enhance the role of each of these departments with the
priorities decided on within the Ministries. The priorities stated here have a special
role over the next five to ten years and every effort must be made to ensure, through
budget, institutional building, personnel development, and policy that they fully play
the role specified with detailed monitoring and consequent adjustment of their
development and impact.
The growth objective for the sector is to achieve the six percent growth rate specified
in various Government and CAADP documents. That objective has been closely
examined and found important in its impact and achievable in Tanzania. All the
38
ASDS-II: Agricultural Sector Development Strategy 2015/15-2025/26
38
components of the strategy are appropriately judged by their contribution to achieving
that growth rate. In each case, the question must be asked – what share of the six
percent growth rate will be provided by that effort and then the effort continuously
monitored and evaluated from that point of view. It is important to recognize that
several objectives of agricultural development are most efficiently pursued under the
heading of the six percent growth rate. That is why the Government and CAADP
could focus so clearly on that growth objective.
4.2.1 Important Considerations for Selecting Priorities
4.2.1.1 Poverty Reduction and Improved Nutrition
Whenever countries have achieved a six percent growth rate, the poverty level has
declined sharply. It is agricultural growth that has the dominant role in rural poverty
reduction. One should expect a six percent growth rate in 10 to 15 years to take 15
percentage points or more from the proportion of the rural population under the World
Bank $1.25 per day poverty line. That will bring rural poverty down to a hardcore that
requires explicit treatment beyond the growth efforts.
For the 30 percent of the rural population under the poverty line, calorie deficiency is
the most important nutrition problem. The six percent growth rate should result in a
three to four percent annual rate of increase in calorie consumption. In a ten year
period, that should remove the bulk of calorie deficiency amongst the poor, opening
the potentials for improvement of other components of good nutrition. The increased
income allows diversion of small amounts of land to a home garden and income
potentials for purchase of components of good nutrition.
4.2.1.2 Women and Youth Participation in Modernization
Rapid agricultural growth requires technological change in agriculture, based on
modern science and technology. That process principally derives from extension and
demonstrations. Those can be organized in a manner that women participate broadly
in those processes, thereby strengthening their role in farm family decision making
and opening opportunities for rural leadership positions. A special effort is required to
make this happen. Explicitly including female headed households and farmers wives
in demonstrations of modern science based agriculture ushers them into the modern
world and opportunities to be influential not only in the family but for some more
broadly in their rural life and leadership in various institutions as well.
39
ASDS-II: Agricultural Sector Development Strategy 2015/15-2025/26
39
Obviously major expansion in employment is helpful to young people as well as old.
However, there is a special problem for rural youth employment - they tend to have
primary and perhaps secondary education10
. It appears that considerable expenditure
from rising farm income is spent on services with an education component. Transport
has a particularly high income elasticity of demand in rural areas and that requires bus
drivers, bus conductors, and repair station operators with formal education. Similarly,
market towns boom when agricultural incomes grow rapidly with large numbers of
jobs created in retail establishments also requiring education. There is some evidence
that in the context of rising expenditure on the rural non-farm sector, employment of
people with lower levels of formal education is elastic (grows faster than overall
employment) with respect to the overall employment growth rate.
4.2.1.3 Climate Change
The two most important elements of agricultural adaptation to climate change are
research and irrigation. They are also priority elements of a high growth rate, so the
one reinforces the potentials for the other. In addition, adjustment to climate change
will be easier from the higher farm income base that accompanies the six percent
growth rate.
4.2.1.4 Current Growth Rate
For the last several years, agriculture has been growing at about 4.2 percent. However,
the proportion of the rural population under the poverty line has only declined
marginally as in the below Table 4.2. Normally, a 4.2 percent growth rate in
agriculture would cause a much larger decline in poverty.
10
The improvement in the education attainment levels was observed from 2002 to 2012 Censuses.
The proportion of population that had attained secondary education (urban and rural) increased
from 9.7 percent to 14.4 percent and for primary school decreased from 88.5 percent to 81.7
percent.
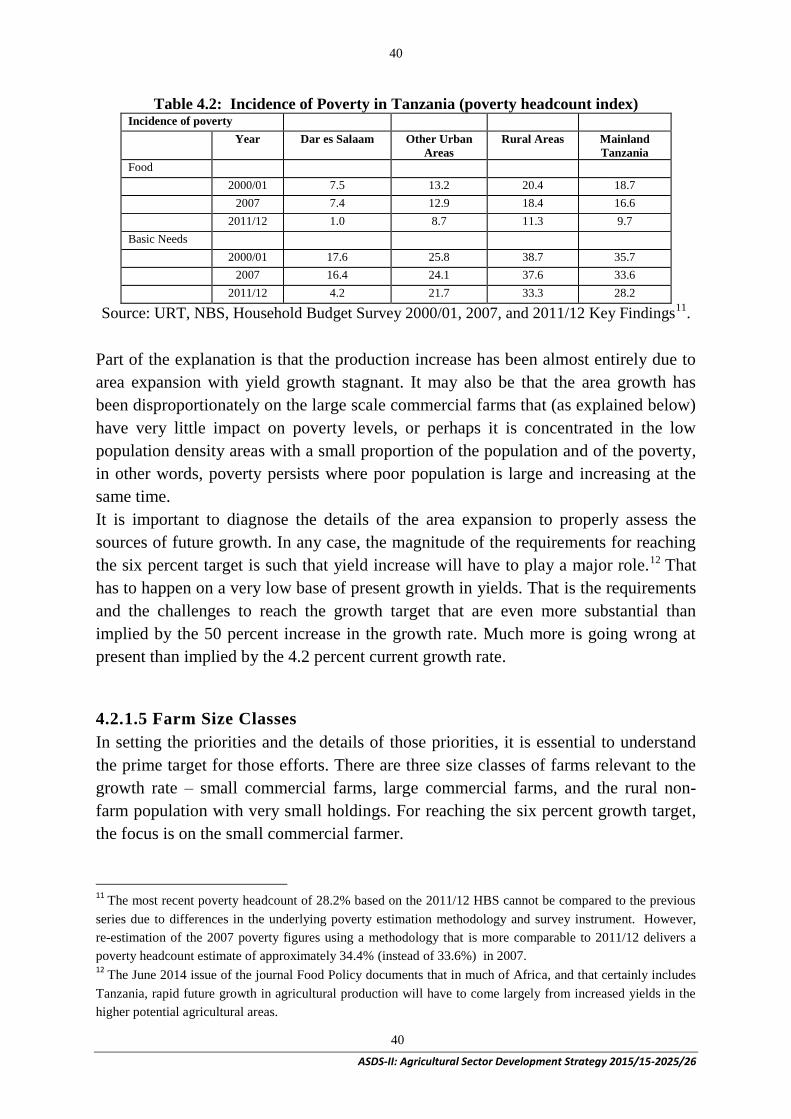
40
ASDS-II: Agricultural Sector Development Strategy 2015/15-2025/26
40
Table 4.2: Incidence of Poverty in Tanzania (poverty headcount index) Incidence of poverty
Year Dar es Salaam Other Urban
Areas
Rural Areas Mainland
Tanzania
Food
2000/01 7.5 13.2 20.4 18.7
2007 7.4 12.9 18.4 16.6
2011/12 1.0 8.7 11.3 9.7
Basic Needs
2000/01 17.6 25.8 38.7 35.7
2007 16.4 24.1 37.6 33.6
2011/12 4.2 21.7 33.3 28.2
Source: URT, NBS, Household Budget Survey 2000/01, 2007, and 2011/12 Key Findings11
.
Part of the explanation is that the production increase has been almost entirely due to
area expansion with yield growth stagnant. It may also be that the area growth has
been disproportionately on the large scale commercial farms that (as explained below)
have very little impact on poverty levels, or perhaps it is concentrated in the low
population density areas with a small proportion of the population and of the poverty,
in other words, poverty persists where poor population is large and increasing at the
same time.
It is important to diagnose the details of the area expansion to properly assess the
sources of future growth. In any case, the magnitude of the requirements for reaching
the six percent target is such that yield increase will have to play a major role.12 That
has to happen on a very low base of present growth in yields. That is the requirements
and the challenges to reach the growth target that are even more substantial than
implied by the 50 percent increase in the growth rate. Much more is going wrong at
present than implied by the 4.2 percent current growth rate.
4.2.1.5 Farm Size Classes
In setting the priorities and the details of those priorities, it is essential to understand
the prime target for those efforts. There are three size classes of farms relevant to the
growth rate – small commercial farms, large commercial farms, and the rural non-
farm population with very small holdings. For reaching the six percent growth target,
the focus is on the small commercial farmer.
11
The most recent poverty headcount of 28.2% based on the 2011/12 HBS cannot be compared to the previous
series due to differences in the underlying poverty estimation methodology and survey instrument. However,
re-estimation of the 2007 poverty figures using a methodology that is more comparable to 2011/12 delivers a
poverty headcount estimate of approximately 34.4% (instead of 33.6%) in 2007. 12
The June 2014 issue of the journal Food Policy documents that in much of Africa, and that certainly includes
Tanzania, rapid future growth in agricultural production will have to come largely from increased yields in the
higher potential agricultural areas.
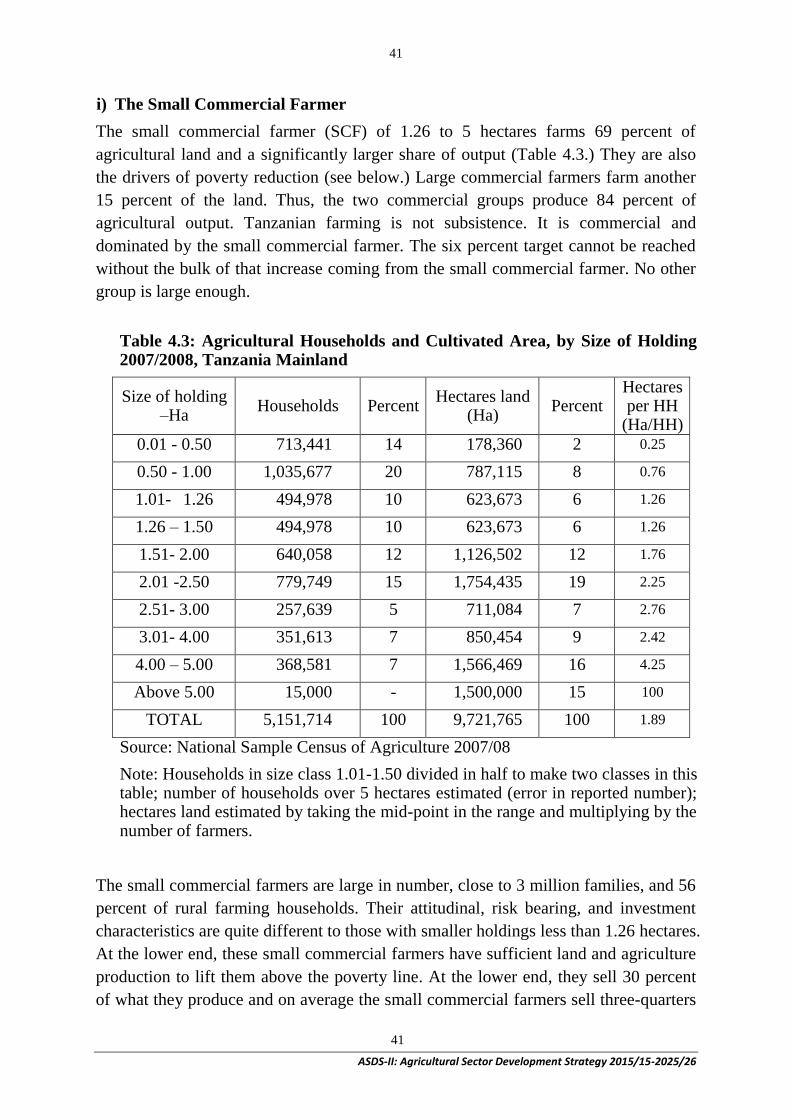
41
ASDS-II: Agricultural Sector Development Strategy 2015/15-2025/26
41
i) The Small Commercial Farmer
The small commercial farmer (SCF) of 1.26 to 5 hectares farms 69 percent of
agricultural land and a significantly larger share of output (Table 4.3.) They are also
the drivers of poverty reduction (see below.) Large commercial farmers farm another
15 percent of the land. Thus, the two commercial groups produce 84 percent of
agricultural output. Tanzanian farming is not subsistence. It is commercial and
dominated by the small commercial farmer. The six percent target cannot be reached
without the bulk of that increase coming from the small commercial farmer. No other
group is large enough.
Table 4.3: Agricultural Households and Cultivated Area, by Size of Holding 2007/2008, Tanzania Mainland
Size of holding –Ha
Households Percent Hectares land
(Ha) Percent
Hectares per HH
(Ha/HH)
0.01 - 0.50 713,441 14 178,360 2 0.25
0.50 - 1.00 1,035,677 20 787,115 8 0.76
1.01- 1.26 494,978 10 623,673 6 1.26
1.26 – 1.50 494,978 10 623,673 6 1.26
1.51- 2.00 640,058 12 1,126,502 12 1.76
2.01 -2.50 779,749 15 1,754,435 19 2.25
2.51- 3.00 257,639 5 711,084 7 2.76
3.01- 4.00 351,613 7 850,454 9 2.42
4.00 – 5.00 368,581 7 1,566,469 16 4.25
Above 5.00 15,000 - 1,500,000 15 100
TOTAL 5,151,714 100 9,721,765 100 1.89
Source: National Sample Census of Agriculture 2007/08
Note: Households in size class 1.01-1.50 divided in half to make two classes in this table; number of households over 5 hectares estimated (error in reported number); hectares land estimated by taking the mid-point in the range and multiplying by the number of farmers.
The small commercial farmers are large in number, close to 3 million families, and 56
percent of rural farming households. Their attitudinal, risk bearing, and investment
characteristics are quite different to those with smaller holdings less than 1.26 hectares.
At the lower end, these small commercial farmers have sufficient land and agriculture
production to lift them above the poverty line. At the lower end, they sell 30 percent
of what they produce and on average the small commercial farmers sell three-quarters
42
ASDS-II: Agricultural Sector Development Strategy 2015/15-2025/26
42
of what they produce. They are not poor and they look for opportunities to increase
their farm income. The small commercial farmer differs from those with less land in
being more focused on farming, requiring far more credit - for larger quantities of
fertilizer and even farm machinery - they can take some risk, and they are very much
profit oriented. Most are probably cautious about trying untested ideas. Of course,
some among them are leaders and some followers.
An important feature is that they spend half of incremental income on the rural non-
farm sector - for example, improving their house, local furniture, some local clothing,
a wide range of services, retail stores, and transport13. It is that expenditure on labor
intensive goods and services for which the market is entirely local (called non-
tradable) that increases employment, the incomes of the rural non-farm families, and
the basis for increasing calorie consumption and food security of the poor in the rural
area.
ii) Large Commercial Farmers
The large commercial farmers, defined as those with over 5 hectares produce about 15
percent of total output. Some of these farmers are small commercial farmers, but the
bulk of the land is in large holdings. They had little impact on poverty reduction. That
is because they are more urban oriented, often living in cities and their expenditure
patterns are more towards capital-intensive and import intensive goods and service
and less towards the rural produced non-tradable. In general, they can provide much
of the support services required for productive agriculture, in contrast to the small
commercial farmer who requires substantial support from government institutional
structures in order to grow and prosper. When that support for the small commercial
farmer is lacking, as in contemporary Tanzania, then the growth will be concentrated
with the large scale farms.
iii) Rural Non-Farm Population
Those with less than 1.26 hectares cannot reach the poverty line on agricultural
production alone, more so as the size of holdings declines to half, and one quarter and
less hectares of land. They produce only 16 percent of agricultural output, even
though they represent 44%, nearly half of all rural farming households. In agriculture,
they are subsistence farmers, producing less than they consume. They are focused on
off-farm employment (including on-farm labor for small commercial farmers) and less
on increasing farm production (on their own land). Much of their employment comes
from labor intensive, non-tradable activities for which the market comes from
expenditures by the small commercial farmer. The focus on rural non-farm activities
13
There is a large literature corroborating these expenditures and quantifying them. For a recent paper reviewing
that expenditure and providing a wide range of references, see Dorosh and Mellor 2012
43
ASDS-II: Agricultural Sector Development Strategy 2015/15-2025/26
43
leads to calling them rural non-farm families even though many of them do farm for a
portion of their income.
Farming improvements can contribute to some increase in income especially for those
with half to one and a quarter hectares of land but it requires a far more intensive
extension effort with a somewhat different package than for the small commercial
farmer. They have less capital to invest and less capacity to take risk compared to the
small commercial farmers. Their contribution to the six percent growth rate is small.
4.2.1.6 Government Expenditure on Agriculture
There are only two consequential numbers in CAADP - the six percent growth rate
and the ten percent of government expenditure on agriculture. These are both key
numbers in the Governments thinking about agricultural growth. On the latter, there is
an implied categorization of expenditure items - those with direct impact on
agricultural growth, not those that are as much for other purposes as agriculture. By
that accounting, Tanzania allocates about three percent of government expenditure on
agriculture. The CAADP target was very carefully thought out in principle and in
quantity. Meeting that target is a show of commitment14
.
In principle the ten percent target is based on the assumption that farming is a private
sector activity, but of relatively small firms (farms) that cannot provide many critical
services, particularly research and extension themselves and thus must rely on the
Government. Of course, the private sector provides many services, but the critical core
for technological advance comes from the Government sector. The focus on an
aggregate national target (the six percent) of agriculture growth rate, spread over large
areas, and the large numbers involved (three million small commercial farmers)
requires that Government provides a few key services and monitor the coverage by the
private sector. Agriculture is the epitome of private public partnership - the small
commercial farmer is private, the Government provides a few critical services, and
especially in the early stages of modernization of agriculture monitors and from that
assists or supplements the private sectors servicing in agriculture. The heavy burden
on the Government to provide essential services means that it must constantly avoid
taking on activities that will be efficiently and competitively provided by the private
sector.
4.2.2 Key Priorities
The following sections state a small number of priorities for intensive attention,
financing, and institutional development. The first set of priorities is to the science and
14
For example, Ethiopia has consistently met the CAADP target, at times exceeding it to 15 percent. Rwanda
has traditionally been well under but has recently exceeded the target.

44
ASDS-II: Agricultural Sector Development Strategy 2015/15-2025/26
44
technology system including research and extension and the second is to achieving a
fast build-up in the base of fertilizer use by the small commercial farmer and then
rapid growth from that base. An integral part of the fertilizer priority is massive
expansion of the improved seed production capability - but fertilizer alone will have to
carry the growth rate for the first few years as the seed capacity is built. These three
priorities will define achievement of the six percent growth rate in the next five years
and will remain important throughout. However, as fertilizer use moves up to the level
of more advanced countries, a set of further priorities will be required and the base
must be developed immediately for their rapid growth and large impact. These are
irrigation, finance, mechanization, and marketing.15
4.2.2.1 The Role of Science and Technology and Consequent Priority
Rapid agricultural growth is based on application of a steady stream of new science
based innovations. It is a constant process, not a once and for all shot. Because
agriculture faces a fixed land constraint, rapid agricultural growth comes largely from
increased yields16. At a slow growth rate, farmers themselves come up with a steady
flow of small innovations, but to have the rapid six percent growth rate, systematic
analysis based on scientific principles and institutional structures are required on a
large scale.
Because of the overriding importance of science and technology in achieving the six
percent agricultural growth rate the first priority is to the research and extension
system. They are taken up separately below but they must operate as a completely
integrated unit and so the most important institutional issue is how that integration
should be brought about.
(i) Research
The research system in Tanzania is grossly underfunded. A good rule of thumb is 3
percent of agricultural production. A low target of one percent calls for a tripling of
the research budget.
Agriculture is based on highly diverse land resources to which biological innovation
must be adapted. That is particularly true of Tanzania – a very diverse set of
agricultural conditions represented by seven agro-ecological zones. The potential for
transfer across large areas is very limited. Thus, the extent of pulling of research
results from elsewhere depends on the size of the national and regional systems. The
15
This document is deficient in many details for lack of necessary statistical information. Some of that deficiency will be
pointed out in the following text. However, as pursuit of the priorities proceeds, the effort must be accompanied by
systematic development of facts on each element of the effort. That requires large expansion of the statistics gathering
functions. 16
See the special issue of Food Policy, June 2014 on this point.
45
ASDS-II: Agricultural Sector Development Strategy 2015/15-2025/26
45
national and the international are complements not substitutes for each other. The
national researchers will see the innovations from outside and the outsiders, e.g. the
CGIAR will inevitably put in more effort where there are national researchers to work
with in adaptation and application and even basic science.
Tanzania needs a larger than average size research system because of the diversity of
its physical conditions and the potential for a wide range of commodities. Research
will tend to be somewhat specialized and limited in breadth so strong research leads to
some reduction in the range of commodities produced but Tanzania will still produce
a wider than average range of commodities. That will be particularly true as the
horticultural sector rises.
A wide range of conditions for agriculture calls for a system of a central station and a
set of field stations. Tanzania now has 16 public Agricultural Research Institutes and
several autonomous and private institutions. They cover geographic diversity in
production conditions and regionally specialized crops. As the system expands, the
need for additional sub-stations will require regular attention.
There are two salient criticisms of the current research system. First, that it is
insufficiently integrated with the farmer stakeholders. That is best solved by full
integration of research and extension, which is discussed below. The second is that the
researchers and research systems are ineffective for reasons other than lack of
financial support. That can only be diagnosed and solved when the support budgets
are adequate. They are now completely inadequate.
(ii) Extension
Science adapted to the needs of farmers requires institutionalized means of bringing
farmer problems to the attention of researchers and testing of research results under
farm conditions. That inevitably calls for an extension system that not only carries
research results to farmers but farmer problems back to research.
The extension system in Tanzania is in a state of flux, with decentralization not yet
fully worked out, and interaction with research still inadequate including the
administrative and institutional structures to facilitate that. Tanzania also is
experimenting with various approaches to farmer training. There may be economies in
that effort. It needs to be analyzed with emphasis on demonstrations on farmers’ fields,
the organizational structure to bring farmers to those demonstrations, and integration
with the extension agents and with researchers.
Because of geographic diversity and the need for organized farmer input, most
successful countries decentralize extension down to the lowest administrative unit. At
present the concept is to place the extension agents at the village level. There are on
the order of 15,000 villages. One extension agent per village would call for nearly
doubling the current number of extension agents. Given the desirability of
46
ASDS-II: Agricultural Sector Development Strategy 2015/15-2025/26
46
specialization among extension agents – crops, livestock, soil management and
fertility etc., it might be sensible to group four or five extension agents together for
extension and administrative purposes and have them cover a set of four or five
villages, most probably at ward level. That would still be a small enough unit to allow
visits by walking or cycling to farms reducing the cost of transport. The complex
process of working out the appropriate institutional structure requires immediate and
intensive analysis and action.
The objective of decentralization is to get the agents into close interaction with
farmers - as pointed out above that is with the small commercial farmer. It is likely
that in the initial stages of decentralization, it is to a political unit that may not be
strongly based on the small commercial farmer. Therefore, attention must be given to
the issue of how to organize farmers so they can be the dominant stakeholders in the
extension system.
The discussion above suggests that the optimal solution to extension
institutionalization will call for increased expenditure on the system.
4.2.2.2 Fertilizer Use by the Small Commercial Farmers
The current level of inorganic fertilizer use, at 200,000 tons is a solid base for
accelerating growth. A 15 percent rate of increase at a reasonable ten to one ratio of
cereal equivalent output to fertilizer input would add 300,000 tons of cereal equivalent
production per year. In a context of 60 percent of production growth from yield
increase and 40 percent from area expansion - a reasonable division for Tanzania that
would account for 70 percent of the yield growth needed to reach the six percent
growth target. That share of growth would increase with increasing the size of the
base in the next several years. It is the rate of growth in inorganic fertilizer use that
will provide the bulk of the six percent growth rate and is the monitor of the extent to
which that growth rate is being achieved.
Not too long ago, the environmental movement leadership was concerned that high
rates of fertilizer use were bad for the environment. The production increase can no
longer come largely by expanding the farmed area into biologically fragile areas.
Growth must come from yield increase and that requires raising the nutrient level of
soils and replacing nutrients that are extracted. Inorganic fertilizer and organics are
complements and so increase in the one increases the returns and hence the input of
the other.
Having said this, it is important to recognize that farmers and the larger society both
benefit when inorganic fertilizer is used in an environmentally sound manner. That
requires a major emphasis on increasing the productivity and use of organic matter.
Organic matter is a complement to inorganic fertilizers that increases their
productivity and reduces the amount needed for a given level of output. There also
47
ASDS-II: Agricultural Sector Development Strategy 2015/15-2025/26
47
needs to be intensive extension efforts aimed at the timing and placement of fertilizer.
A large extension push on fertilizer needs to have a large component dealing with
effective use of fertilizer.
Three warnings are in order as the fertilizer growth is prioritized:
(1) First, the impact from fertilizer is not a return to fertilizer alone. The supply of
seed of improved varieties, hybrid for maize and open pollinated for most crops
must be increased rapidly. Perhaps for a year or two, the growth in fertilizer use
and impact can come with existing varieties, which are mostly at least somewhat
improved varieties, but soon it will be necessary for large scale increase in
improved seed. From the beginning, rapid uptake requires a vigorous program of
extension pressure, touching the bulk of the three million small commercial
farmers. In only a few years, credit will be a major constraining impediment to
continuous rapid growth in fertilizer use.
(2) Second is that the key target is the small commercial farmer and perhaps the base
of use amongst them is very small. Assuming one million hectares of land in the
large commercial farms and that they use 0.2 tons per hectare, all the fertilizer
would be used in those farms. Approached from the small commercial farmer side,
apparently only five percent of the area in small commercial farmer is receiving
fertilizer. At 0.2 tons per hectare that would take only 65,000 tons. Perhaps, they
are only using half that level per hectare. If that is the base, their needs to be a big
push to get started on fertilizer. Perhaps, a target of annual additions to use of
50,000 tons to the small commercial farmers. At 0.2 tons per hectare and an
average size of fertilizer responsive crops of two hectares that requires reaching
250,000 hectares, or 125,000 farmers each year. This is of course notional, perhaps
they would start with only 0.1 tons per hectare and so 250,000 farmers have to be
reached each year. That of course must be cumulative, year after year. Any way of
looking at it this is an immense task for which there is no substitute for reaching
the six percent growth target.
(3) Third, the preceding analysis raises question how able is the existing distribution
system to reach these large numbers of small commercial farmers. A priority is to
analyze the role and working of the private distributors to find out why they are
not selling more fertilizer to small commercial farmers when it is clear that
fertilizer is profitable to those farmers. Perhaps from that point of view, there
needs to be an initial regional and commodity focus - assured rainfall and
emphasis on maize. These are all difficult questions that call for a pragmatic
approach based on gathering of facts.
Three major steps are necessary to meet a target of an additional 50,000 tons of
fertilizer per year.
48
ASDS-II: Agricultural Sector Development Strategy 2015/15-2025/26
48
(a) To immediately form within the MAFC a fertilizer (or fertilizer and seed) growth unit with a modest staff, perhaps half a dozen professionals and strong leadership to develop a statistical base by geographic area and commodity, and monitor all aspects of the fertilizer chain from imports, to wholesale distribution, to the adequacy of retail outlets and all aspects of farmer use and the extension service and the out-grower schemes and from that to diagnose immediate actions and pragmatically determined follow-up needed to achieve the growth target. This unit would work out the details of the program to achieve the fertilizer growth target, monitor it and act pragmatically to respond to new knowledge.
(b) To perform an immediate analysis of the distribution network for inorganic fertilizer. Presumably, this is primarily the private sector. Are there dealers in all the market towns of at least the maize producing areas and all the moderately high rainfall areas? If not, ascertain immediately how to rectify the problem. Are the manufacturers or wholesale distributors mounting demonstrations? If not, why not? What can be done to improve the distribution system? Likewise for hybrid maize seed in maize areas and open pollinated seed in non-maize areas.
(c) To organize the extension system to focus on fertilizer use, including a massive number of demonstrations.
4.2.2.3 A Set of Further Priorities
A set of further priorities below will be required as gradually achieving improved
research and extension, and enhanced use of improved seed and fertilizer.
(i) Irrigation
At only 450,000 hectares, or nearly five percent of the agricultural area, the base of
irrigation is yet 1.25 million hectares within a several year period. At present, the
institutional base for analyzing the details of irrigation expansion, for example, the
weight of small scale compared to large scale schemes, and the institutional system of
managing large scale projects and providing credit, complementary inputs and
knowledge for small scale schemes is quite deficient. Thus, it may be difficult to reach
the short term target in time. However, reaching the fertilizer target over the next five
to ten years will make it difficult to maintain that growth rate and its large share in
output growth. At the outset, acceleration of the irrigation growth rate will be helpful
to meeting the other input targets. In the not distant future, irrigation will become the
dominant factor in constituting the high growth rate.
Four measures are necessary to be taken;
(a) There is already an institutional structure for expanding the irrigation system in
size and composition. That needs to be re-examined in the context of the overall
expansion of the agriculture related Ministries and the growing and soon
49
ASDS-II: Agricultural Sector Development Strategy 2015/15-2025/26
49
dominant role of irrigation in the growth rate. Particular attention must be given
to the institutional structure for growth in watershed management and other
small and medium scale irrigation investments.
(b) In that context, continue and monitor the several efforts such as Big Results
Now that have a major irrigation component. They contribute substantially to
reaching the targets and have important lessons to teach about how to proceed.
(c) Greatly increase analysis of the various types of irrigation and planning of the
relative expansion targets. It is likely that small scale irrigation schemes and
watershed-size schemes will be of considerable importance. Each requires
somewhat different approaches to planning and implementation.
(d) Ensure that development of the agricultural finance system is ready to
accommodate large scale lending to farmers for intensifying production with
irrigation and for financing small and medium scale projects.
(ii) Finance
The small commercial farmer, the backbone for achieving the six percent growth
target, is completely lacking in access to agriculture finance.
The large commercial farmers have access to commercial banks. All studies of
agricultural finance show that ease of access to agricultural finance is the number one
requirement of small commercial farmers. That in effect requires a very large number
of branches - in Tanzanian terms that probably means a branch for each half dozen
villages. That is more than 2000 branches. At one for a dozen villages, a bit too large
an areas, it is over 1000 branches. Commercial banks are reluctant to open such a
massive number of branches.
Micro credit institutions have been successful at operating the large number of
branches required, however, their loans are small compared to the needs of small
commercial farmers. They may lend to the lower size limit of the small commercial
farmers e.g. farms of one to one and half hectares, but rarely larger than that. More
importantly, the means of ensuring high repayment rates, intimate organization of
small numbers of relatively homogenous participants, tied to savings of a size
comparable to the loans and group guarantees work less well with the small
commercial farmers and the much larger size loans. There should be reluctance to
convert micro credit institutions into lending to the larger small commercial farmers
since that will lead them away from their present task of lending to the poor.
Tanzania is committed at present to introducing the Tanzania Agricultural
Development Bank. Such a bank is normally oriented towards the small commercial
farmer, thereby solving the problem of their present lack of coverage. However,
establishing such a bank at the scale and geographic coverage necessary will be
difficult.
50
ASDS-II: Agricultural Sector Development Strategy 2015/15-2025/26
50
Almost all high income countries have such a bank and the experience is universally
good. Repayment rates are high and loan losses low. In contemporary Asian countries
the experience has-been mixed. They have been subject to some abuse by political
systems that have reduced discipline on repayment. More importantly, they have
expanded very rapidly with consequently loose supervising of loans. There is a great
deal to learn from these perspectives17. Tanzania needs a commission to asses this
information as it presses ahead. In that context, it could examine the potential for
collaboration with commercial banks.
However, several points are clear from the existing record.
(a) Branches must be numerous to be convenient.
(b) Branches must have a loan officer who understands not only accounting and
lending procedures but technical agriculture as well to ensure that profitable
loans are made. When agricultural development banks are expanding, they are a
dominant employer of graduates of agricultural higher education. This helps
solve the problem of educated unemployed.
(c) The record for repayment of profitable loans is very high. The volume of
deposits to be mobilized in rural areas is very high and that activity increases
the volume needed to make a branch profitable.
As a final note, from the current base of fertilizer use, the small commercial farmer
can sustain several years of six percent growth in agricultural output without a major
source of agricultural finance. Thus, there is time to set up the system properly and to
expand at a rate that maintains discipline in the system including collateral issues that
are related to land title, Customary Certificate of Right of Occupancy, and movable
collaterals.
(iii) Mechanization
At present 63 percent to the land is cultivated by hoe agriculture - most of the rest is
cultivated by animal power. No more than five percent of the small commercial farms
use tractors. As the years of six percent growth accumulate, labor bottlenecks will
become increasingly important. That is particularly true in the context of hoe based
agriculture. Concerns with poverty reduction focus on the labor saving and
employment reducing aspect of mechanization. But increased timeliness of operation
will become more important as sensitive high yielding varieties are adopted and high
levels of nutrients taken up. In that context, breaking a labor bottleneck to greater
timeliness may increase employment at other seasons of the year.
Mechanization is complex in terms of what operations to mechanize and how the
mechanization is to occur. Although research needs to be done in this area, the
17
For example, see Desai and Mellor 1993 for a review of several hundred research reports on these systems.
51
ASDS-II: Agricultural Sector Development Strategy 2015/15-2025/26
51
capacity is yet low. Particularly in such circumstances, it is best to leave it to well
operating markets to determine the extent and the pattern of mechanization.
If well operating markets are to rule, then, the constraints to expansion of
mechanization at all levels need to be removed. The most substantial constraint is of
course large scale finance to small commercial farmers. There are some arguments for
large scale rental companies providing mechanization. But it may be that the larger of
the small commercial farmers will most efficiently provide mechanization for
neighbors, buying machinery, using it on their own farm and then doing custom work
for neighboring farmers. For that to occur, there must be a financing institution readily
available to make large loans. Thus, the first requisite of optimal mechanization is an
agricultural development bank with broad lending power and of course discipline on
repayment.
At present, the institutional systems of research and extension are small relative to the
long term need. Researches on the optimal mechanization schemes for the small
commercial farmer are needed and complementary systems of extension education.
Farm machinery suppliers would be an efficient part of that system and should be
taken into account by the research system.
Government department must monitor the mechanization situation of the small
commercial farmer with good data sets. The research system needs to expand research
in this area and integrate it with extension. The agricultural development bank needs
to monitor the situation geographically and prepare to make substantial loans where
mechanization of the small commercial farmer is beginning to take off. The farm
machinery importers and producers need to diagnose the geographic areas where the
small commercial farmer is ready to mechanize.
(iv) Agro-Processing and Improved Access to Markets
In the short run, the critical problem with respect to value added industries is the poor
physical infrastructure, particularly roads, but also electricity.
At present the dominant commodities for marketing are cereals. They are non-
perishable and normally the private traders are competitive. However, when roads are
poor there tends to be only one trader with high costs due to the poor road and no
competition leading to even higher margins. Thus, the most important priority for
improved marketing is the rural road expenditure. IFPRI studies are clear that it is all
weather roads that make the big difference.
Competition can also be increased by market centers that bring together traders in a
competitive context. That involves expenditure on physical facilities, being sure to
involve traders in the planning of location and the physical facilities. Such centers
often go wrong because of inappropriate choice of location.
52
ASDS-II: Agricultural Sector Development Strategy 2015/15-2025/26
52
In the longer run, there are major opportunities for adding value to agricultural
production, important in itself, and also increasing the incentives for agricultural
production by better prices. The institutional support services take time and thought to
be provided and so the effort needs to start now. Most of these activities will be
provided by private sector firms - diagnosing opportunities, making investments,
managing. Shift to high value perishables with export potential requires new
marketing channels and technical assistance to the private sector.
Following four measures are necessary to be taken;
(a) First, a yearly target that will bring the bulk of villages onto all-weather roads
in a ten year period. Inadequate expenditure on roads is not only neglecting
farmers, but the constantly growing, dominant rural population for social
services, medical clinics and education.
(b) Second, for the value added areas, there needs to be large scale finance
available.
(c) Third, the private sector will move more rapidly if substantial investments are
made on research to diagnose what value added activities are coming up,
diagnosing how to meet them, and publicizing the results.
(d) Fourth, analysis of the needs and potentials and timeframe for bringing rural
electrification to at least all the high productivity, high population density
villages.
Throughout, it is critical that government agencies concentrate on increasing
competition, research and analysis, and infrastructure investment. If all that is done
well the private sector will become competitive, perform, and expand.
(v) BIG RESULTS NOW (BRN) and Southern Agricultural Growth
Corridor of Tanzania (SAGCOT)
The Government has a special program titled Big Results Now(BRN). It is a large
effort designed to have aggregate impact. The following points place it in the larger
perspective.
(a) Increased Public Support for Agricultural Growth:
Success for BRN will have high visibility and will help convince the majority
of the country who are basically farmers that agriculture can grow radically and
that the small commercial farmer can play a significant role in that process.
(b) BRN, although largely is still a pilot project, can play an important role in
testing on a substantial-scale some critical areas discussed above as priorities,
particularly with respect to extension methods (out-growers) and irrigation.
(c) It would be useful to calculate the impact that success would have on achieving
the six percent growth rate. The increase in output, year by year, would
represent what percent of the incremental six percent targeted overall. It is of
53
ASDS-II: Agricultural Sector Development Strategy 2015/15-2025/26
53
course not a substitute to the broad based approach through the small
commercial farmers.
(d) SAGCOT: There is complementarity between BRN and SAGCOT in terms of
approach (public-private-partnership), value chain and geographical
prioritization. Both initiatives have plans for scaling up and replication based
on the successes from the initial (pilot) interventions.
54
54
CHAPTER FIVE
5.0 MONITORING AND EVALUATION
There will be a need to emphasize that the primary objective of any M&E system is to
enable the beneficiaries, starting with private sector operators (farmers, processors,
and traders) and the administration of LGAs appreciate the progress made in realizing
agreed development goals. This means stakeholders, in practical headed by ASLMs,
shall have to work closely, prepare reports indicating the progress made and agreed
remedial measures where implementation is slow, and share such information widely
among the sector stakeholders. The M&E of the sector-wide programmes (ASDP II)
will employ and strengthen the existing systems used to monitor and evaluate sector
performance.
The first section of the treatment of monitoring and evaluation deals with the small set
of growth priorities. These are the keys to reaching and maintaining the six percent
growth rate and are monitored and equated in terms of their reaching targets that in
turn reach that growth rate. The second section deals with the full set of activities
defined by the seven strategic areas. The priorities in the first section comprise a sub-
set of the seven strategic areas and reflect priority to a small sub-set of the
components of the strategic areas. These strategic areas include detailed components
among which short term priorities will have to be set as to their sequencing.
5.1 Monitoring and Evaluation of the Growth Priorities
The overarching objective of the growth priorities is the six percent growth rate. That
is the same growth rate stated by CAADP. In CAADP, the target for the Government
is ten percent of government expenditures to be allocated to the agricultural sector.
Following the overarching priorities are a whole set priorities for inputs, institutions
and output. They are all treated in Chapter Four. The following treats the
measurement of success (or failure) and the diagnosing of improvements.
5.1.1 Six Percent Rate of Growth of Agricultural Output
Monitoring the six percent growth rate is conceptually straight forward. The National
Bureau of Statistics calculates the agricultural GDP from various data including the
55
55
level of production. The data must be analyzed and interpreted using both linear
regressions to obtain trends and the Sen Method that at least in part helps manage
weather fluctuations. The underlying problem is that annual weather fluctuations are
large compared to the difference in growth rates to be detected. With care in analysis
and well informed judgments, the production growth for the preceding year should
give a rough idea of the progress and certainly the trends for five years and to some
extent even for three years will be reasonably representative. Thus, data are required
annually. Analysis must be done by commodity or groups of commodities and
judgments made as to the extent to which targets are reached. That provides the basis
for evaluating correctives.
5.1.2 Ten Percent of Government Expenditure on Agriculture
Monitoring the annual increase of the agriculture expenditures by the government is
straight forward. The African Union’s definitions of agricultural expenditure should
be used for these estimates. Evaluation should provide judgments as to the
effectiveness of the expansion of the various activities receiving the increments, with
judgments as to deficiencies, including those of leadership and effective action taken.
Presumably, the Ministry of Finance will monitor this objective with due attention to
the speed with which absorptive capacity is developed. However, slowness in
reaching this objective will be the most important cause of missing on the growth
target. Certainly, the doubling of the government outlay share from the current base
should be achieved in five years or less18
. The basic structures for absorbing that are
largely there. It is important to note that until that target is reached one cannot expect
to achieve the six percent growth rate.
5.1.3 Targeted Expansion of the Agricultural Research System
The targeted rate of growth is simply monitored by expenditure on research. The
problem here as in the overall expenditure is the speed with which absorptive capacity
is increased. Initially, a large increase can be managed given the tremendous
rehabilitation of research stations and equipment that is needed. As for the overall
agriculture budget, the funding should expand by 25 percent per year with evaluation
of the effectiveness of the expenditure with remedial action to increase effectiveness.
18
A moderate and realistic expenditure increase of 12 percent per year will triple it in ten years.
56
56
The measure of output should be the pace of adoption of new technology. That will be
an on-farm measure from sample surveys of farmer adoption.
5.1.4 Targeted Expansion of the Agricultural Extension and Farmer Training
Systems
The decision has to be made about the mix of extension agents and farmer training
programs and the relation between them. Once that decision is made, the first
monitoring should be on those numbers. The previous chapter recommended in effect
a doubling of the number of extension agents - a 15 percent growth rate. That could
occur over a five year period and, monitored as such. If that number is reduced in
favor of farmer training, the substitution effect needs to be measured and monitored
for effectiveness.
The impact on farmer up-take of innovations determined from sample surveys as
above is the ultimate objective. However, intermediate objectives should be
demonstration numbers and descriptions of the process from experiment station down
to large scale demonstrations. Targets need to be set for demonstrations.
5.1.5 Growth Rate of Fertilizer Use
Monitoring fertilizer growth rate is important not only for evaluating progress on that
priority and diagnosing needs for change, but it is also the most important single
indicator of the growth rate of output – whether or not the six percent target is met.
Increased fertilizer use will account for some 75 percent of the yield growth.
The small unit in the MAFC specified for fertilizer (or fertilizer/seed) must analyze
imports, stocks and from that annual utilization. Given the substantial number of
different fertilizers used in Tanzania, the measure should be in nutrient terms, not
amount of fertilizer that analysis must be monitored against the target figure - set
initially at 50,000 tons per year. Any shortfall needs to be evaluated in terms of
estimates of the geographic and commodity utilization and from that diagnosis of
actions including government actions. The analysis by this unit should utilize
appropriate data from the National Bureau of Statistics, the Tanzania Revenue
Authority, and the expanded Economic Analysis unit in the Research System,
Those data will facilitate evaluation of the progress and provide the basis for finding
lagging areas and crops and from those recommendations for dealing with shortfalls in
meeting the growth target.
57
57
Part of the monitoring of fertilizer should be by critical complements to fertilizer,
particularly improved seed. The output from seed companies should be monitored
with division into hybrid and open pollinated. The latter will be more difficult to
monitor because of the large number of small efforts. The extension system can be
mobilized to help in this monitoring.
5.1.6 Growth Rate of Irrigation
Irrigated area, by type and region, must be included in the national sample survey. The
data will show yield by irrigated and not irrigated as well as the irrigated area by
region and crop. From those data will come not only the extent to which targets are
reached, but also the composition of irrigated area and its impact on yields. However,
in the next five years, the most important monitoring will be of the institutional
development for which analysis will be required of what types of expansion are
occurring and what are the bottlenecks constraining each type of system with
ameliorative actions recommended. The rapid growth in irrigated area will come later.
5.1.7 Mechanization
The annual sample survey should also get information on plots analyzed as to the type
of mechanization if any carried out. Initially that will be so small as to be unreliable
given sample size, but as mechanization increases the basis for evaluation will be
available.
5.1.8 Big Results Now
BRN has its own monitoring and evaluation processes that should be integrated into
the overall picture.
5.1.9 A Cautionary Note on Monitoring
The monitoring stated here is sensible and modest in total requirements. Nevertheless
in a context of scarce institutional and personnel capacity, there may be conflict
between capacity to carry out the priority tasks and the monitoring. That should of
course be resolved in favor of the directly productive priority activities. The real
purpose of monitoring and evaluation is to adapt to changing conditions.
58
58
5.2 Monitoring and Evaluation of the Seven Strategic Areas
The results framework in Annex 1 outlines the activities and outcomes that are
expected under each of the seven strategic objectives (SOs) during the implementation
of ASDP II. It includes some milestone indicators, which can be used to monitor
progress towards each of the objectives. These indicators will be embedded in the
M&E systems. The scope of the ASDP II M&E frameworks will be expanded to
accommodate other stakeholders (linked Ministries/institutions, private sector, non-
state actors, civil societies) to become a sector-wide M&E system which tracks
performance of entire agriculture sector that is the aggregated results of various efforts
from various stakeholders in the sector.
5.2.1 Major instruments of monitoring and evaluation
The ASLMs will closely collaborate with NBS to improve the Agricultural Statics
under the Agricultural Statistics Strategic Plan within the framework of the Tanzania
Statistical Master Plan. Major instruments for monitoring and evaluation include the
followings:
5.2.1.1 National Sample Census of Agriculture
Basic data for designing, monitoring and evaluation of agricultural development
policies and programmes including production data is collected every five years by
NBS and ASLMs. This will continue to be most important agricultural statistics. The
data produced is at regional level.
5.2.1.2 Annual Agricultural Sample Survey
Introduction of this Annual Agricultural Sample Survey (AASS) is underway. Annual
data on major crop area, yield and livestock inventory for monitoring food security
and results of agricultural development programmes are expected to be collected. The
annual data collected through this survey will be an important monitoring of ASDS II
achievement. The critical indicators described in the above sections need to be
incorporated in the framework of the AASS. The data produced will be at regional
level.
5.2.1.3 Routine Data Collections
59
59
Routine data collections such as the Agricultural Routine Data System (ARDS),
surveys for Crop Forecast and Early Warning, Animal Disease surveys are also
important part of sector monitoring. Since these data are at district and ward level,
correlation between the above statistical surveys and these routine data are to be
examined to enhance the utilization of each other. These routine data collections will
be improved within the entire framework of Agricultural Statistics.
5.2.1.4 Joint Sector Review
The sector has been conducted the Agricultural Sector Review and Public Expenditure
Review under ASDP. This will be improved as Joint Sector Review promoted by
CAADP. The review will cover the progress of entire sector performance under ASDS
II. Some data will be obtained for the review from the above mentioned statistical
surveys and routine data collections. The Joint Sector Review will also serve as a
forum for policy dialogue among the wide range of sector stakeholders.
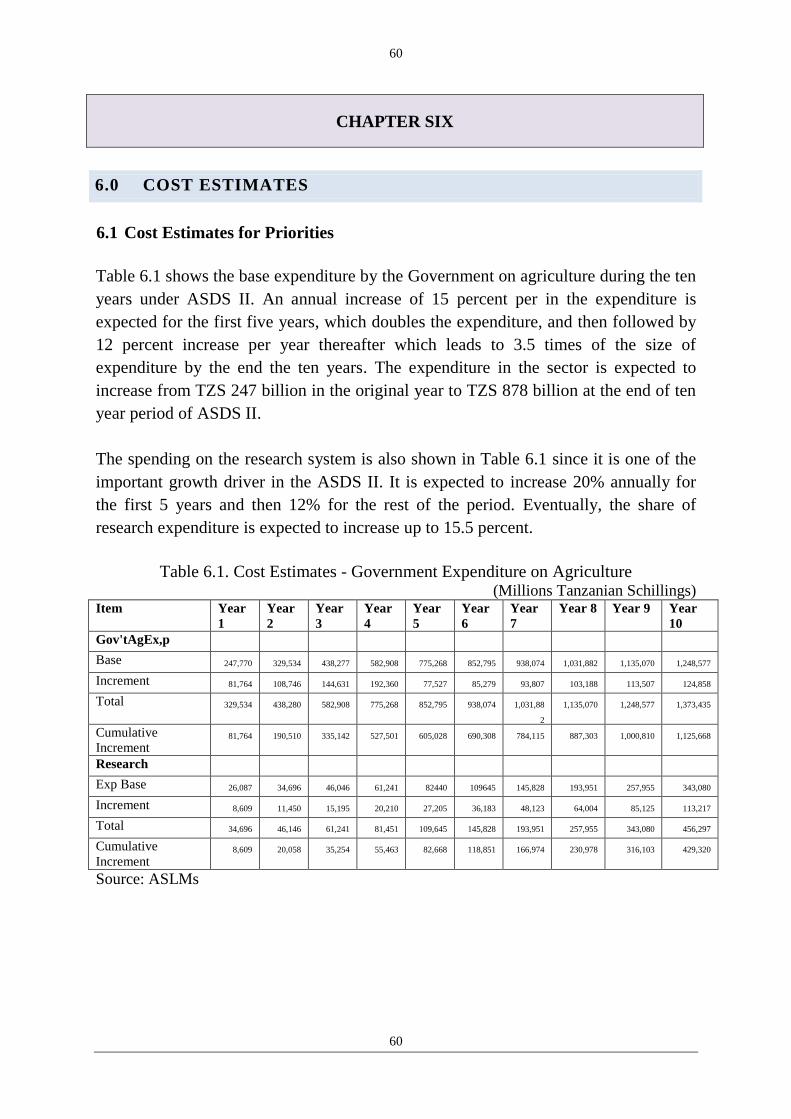
60
60
CHAPTER SIX
6.0 COST ESTIMATES
6.1 Cost Estimates for Priorities
Table 6.1 shows the base expenditure by the Government on agriculture during the ten
years under ASDS II. An annual increase of 15 percent per in the expenditure is
expected for the first five years, which doubles the expenditure, and then followed by
12 percent increase per year thereafter which leads to 3.5 times of the size of
expenditure by the end the ten years. The expenditure in the sector is expected to
increase from TZS 247 billion in the original year to TZS 878 billion at the end of ten
year period of ASDS II.
The spending on the research system is also shown in Table 6.1 since it is one of the
important growth driver in the ASDS II. It is expected to increase 20% annually for
the first 5 years and then 12% for the rest of the period. Eventually, the share of
research expenditure is expected to increase up to 15.5 percent.
Table 6.1. Cost Estimates - Government Expenditure on Agriculture (Millions Tanzanian Schillings)
Item Year
1
Year
2
Year
3
Year
4
Year
5
Year
6
Year
7
Year 8 Year 9 Year
10
Gov'tAgEx,p
Base 247,770 329,534 438,277 582,908 775,268 852,795 938,074 1,031,882 1,135,070 1,248,577
Increment 81,764 108,746 144,631 192,360 77,527 85,279 93,807 103,188 113,507 124,858
Total 329,534 438,280 582,908 775,268 852,795 938,074 1,031,88
2
1,135,070 1,248,577 1,373,435
Cumulative
Increment 81,764 190,510 335,142 527,501 605,028 690,308 784,115 887,303 1,000,810 1,125,668
Research
Exp Base 26,087 34,696 46,046 61,241 82440 109645 145,828 193,951 257,955 343,080
Increment 8,609 11,450 15,195 20,210 27,205 36,183 48,123 64,004 85,125 113,217
Total 34,696 46,146 61,241 81,451 109,645 145,828 193,951 257,955 343,080 456,297
Cumulative
Increment 8,609 20,058 35,254 55,463 82,668 118,851 166,974 230,978 316,103 429,320
Source: ASLMs
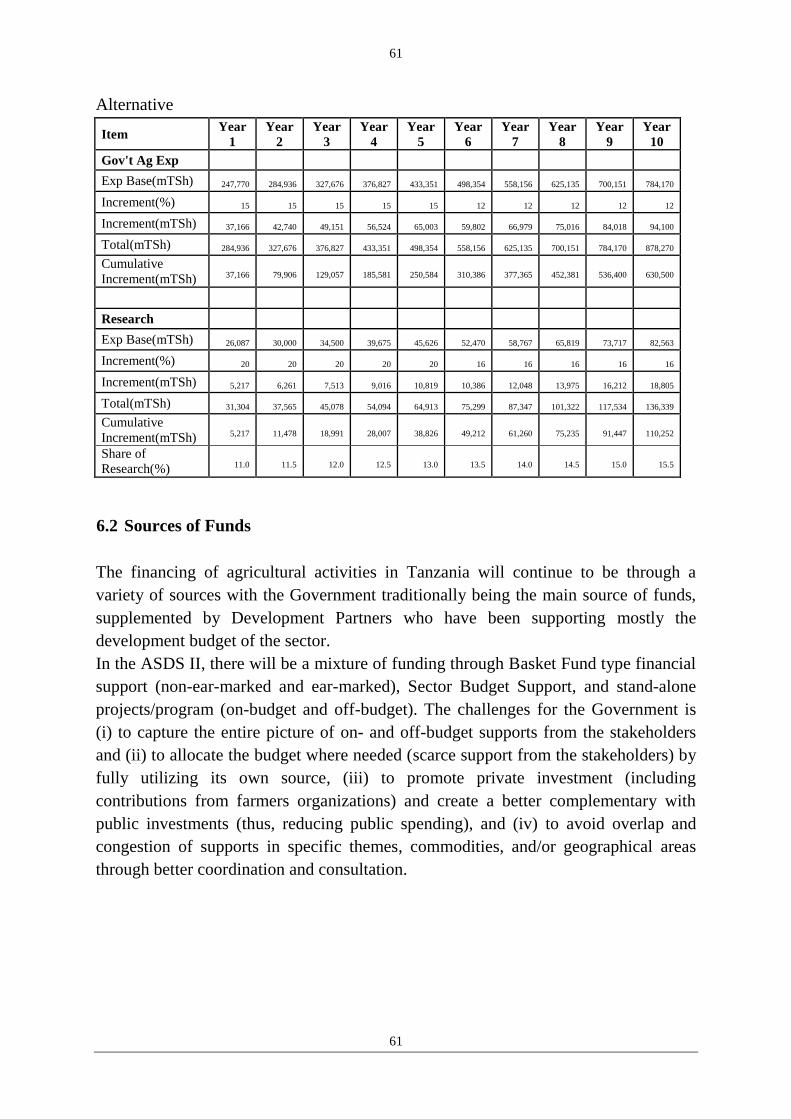
61
61
Alternative
Item Year
1
Year
2
Year
3
Year
4
Year
5
Year
6
Year
7
Year
8
Year
9
Year
10
Gov't Ag Exp
Exp Base(mTSh) 247,770 284,936 327,676 376,827 433,351 498,354 558,156 625,135 700,151 784,170
Increment(%) 15 15 15 15 15 12 12 12 12 12
Increment(mTSh) 37,166 42,740 49,151 56,524 65,003 59,802 66,979 75,016 84,018 94,100
Total(mTSh) 284,936 327,676 376,827 433,351 498,354 558,156 625,135 700,151 784,170 878,270
Cumulative
Increment(mTSh) 37,166 79,906 129,057 185,581 250,584 310,386 377,365 452,381 536,400 630,500
Research
Exp Base(mTSh) 26,087 30,000 34,500 39,675 45,626 52,470 58,767 65,819 73,717 82,563
Increment(%) 20 20 20 20 20 16 16 16 16 16
Increment(mTSh) 5,217 6,261 7,513 9,016 10,819 10,386 12,048 13,975 16,212 18,805
Total(mTSh) 31,304 37,565 45,078 54,094 64,913 75,299 87,347 101,322 117,534 136,339
Cumulative
Increment(mTSh) 5,217 11,478 18,991 28,007 38,826 49,212 61,260 75,235 91,447 110,252
Share of
Research(%) 11.0 11.5 12.0 12.5 13.0 13.5 14.0 14.5 15.0 15.5
6.2 Sources of Funds
The financing of agricultural activities in Tanzania will continue to be through a
variety of sources with the Government traditionally being the main source of funds,
supplemented by Development Partners who have been supporting mostly the
development budget of the sector.
In the ASDS II, there will be a mixture of funding through Basket Fund type financial
support (non-ear-marked and ear-marked), Sector Budget Support, and stand-alone
projects/program (on-budget and off-budget). The challenges for the Government is
(i) to capture the entire picture of on- and off-budget supports from the stakeholders
and (ii) to allocate the budget where needed (scarce support from the stakeholders) by
fully utilizing its own source, (iii) to promote private investment (including
contributions from farmers organizations) and create a better complementary with
public investments (thus, reducing public spending), and (iv) to avoid overlap and
congestion of supports in specific themes, commodities, and/or geographical areas
through better coordination and consultation.
62
62
CHAPTER SEVEN
7.0 IMPLEMENTATION ARRANGEMENT
7.1 Institution Framework
The involvement of many Ministries requires Permanent Secretary and Cabinet level
responsibility for the implementation of ASDS II. Toward the goals of the ASDS II,
the Government (central, regional and local) will be coordinating its efforts with
various stakeholders such as Development Partners, Non-state Actors, Researchers
from academic society and international organizations like the CGIAR who extend
their supports through different programmes, projects, researches, studies that are on-
and off-budget, area-focused and non-area-focused, commodity-specific and non-
commodity-specific, and so forth.
The specific roles of the public sector, private sector, communities and non-state
actors could be broadly defined as follows:
a) The public sector (ASLMs, PDB, other MDAs, Regional Administration and
LGAs) will be responsible for creating an enabling environment for
agricultural sector development, policy formulation, the legal and regulatory
framework, and for managing public investments in infrastructure, facilities
and services.
b) The private sector will actively identify and provide feedback through
established forums to public sector on factors that hinder effective
participation in the rural economy. This should allow the private sector to
effectively mobilize resources and invest in commercial activities and support
services either individually or through PPPs.
c) Communities will participate in planning, implementing and monitoring
community activities supported by government and other actors.
d) Non-state actors and civil society organizations will play a key role in poverty
reduction by building local capacity and empowering communities to take
responsibility for their own affairs. They will also participate in the sector
dialogue from different angles of viewpoints.
7.1.1 Coordination of ASDS
63
63
a) At the central level, the program will be coordinated and implemented by the
ASLMs and other Ministries responsible for Natural Resources and Tourism,
Land and Housing Infrastructure, Finance, Energy, Labour, Gender and
Children Affairs, and Health and Social Affairs.
b) At regional level, under the supervision of PMO-RALG, the Regional
Secretariats will facilitate coordination between the sectoral Ministries and the
LGAs. The Regional Secretariats will have four basic functions: (i) creating an
enabling environment for LGAs to operate efficiently; (ii) assisting LGAs in
capacity building; (iii) providing technical support to LGAs; and (iv)
monitoring the performance of LGAs.
c) At local level, LGAs have a critical role of undertaking all development
initiatives through the DADPs. The DADP is a key instrument in agricultural
and rural development employed by ASDP and will remain so under the ASDS
II. The LGAs will be responsible for; (i) designing and implementing DADPs;
(ii) promoting social and economic development; (iii) supervising the
implementation according to laws and regulations relevant to the sector; (iv)
supervising the delivery of extension services; (v) mobilizing resources for
local development programmes; (vi) improving administration of villages for
the purpose of stimulating sustained development; and (vii) improving land
administration and land use planning for effective and sustainable land
utilization.
7.1.2 Implementation Organs of ASDS
a) Annual National Coordination Meeting will be held once a year by wider
participation for the sector stakeholders. The meeting will be used to assess the
agricultural sector’s overall performance, including the key indicators of sector
performance, and to identify policy and other constraints for immediate action.
The National Coordination Meeting will also be used to set funding priorities
for subsequent year’s activities.
b) The Inter-Ministerial Coordinating Committee (ICC) will include the
Permanent Secretaries of the ASLMs and other related Ministries.
c) The Technical Committee of Directors (TCD) will meet periodically as an
advisory arm of the ICC. The TCD will comprise of Directors of ASLMs with
responsibility for preparing annual work plans and budgets for all the public
investments. The TCD will be chaired by the Director of Policy and Planning,
MAFC, supported by the sectoral Programme Technical Working Groups (P-
TWGs). The existing ASDP TWGs will be expanded to integrate the seven
64
64
strategic areas of ASDS II. The P-TWGs will draw members from the key
institutions implementing the seven programme areas. The current TCD will be
expanded for quarterly meeting to accommodate private sector and other non-
state actors as well as representatives of other stakeholders.
d) Development Partners’ Agriculture Working Group (A-WG) of the
Development Partners Group (DPG) will coordinate the allocation of donor
resources for the implementation of ASDS. The various DPs are expected to
continue using a range of aid modalities including general budget support,
sectoral basket funding, earmarked funding, discrete projects, and off-budget
activities. However, the projects and programmes that are funded through these
modalities will all be aligned and integrated with the ASDS II. The
development partners will also work towards a harmonized set of operational
procedures, including joint design and review missions, reporting procedures,
and sharing of information.
7.2 Roles of Actors
7.2.1 Planning Commission
The President’s Office- Planning Commission (PO-PC) is mandated to oversee
nationally coordinated medium and long term development plans and resource
allocation as instruments to realizing the Tanzania Development Vision 2025 goals. It
provides targets to be achieved by each sector based on the projected resource
environment and desired sector transformations. The institution will have to continue
reforming the way resources are allocated and provided to implementing agencies
based on national priorities. This includes ensuring that the CAADP target of
allocating at least 10 percent of the annual national budget to the agricultural sector
and setting aside one percent of the national GDP to supporting research and
development for the various sectors.
7.2.2 Agricultural Sector Lead Ministries (ASLMs)
The Agricultural Sector Lead Ministries (ASLMs) being the key ministries
responsible for policy and strategy development will have to strengthen their
coordinated actions with the country’s administrative regions, which were more than
25 in 2012 after the creation of new regions, all of which are divided into districts as
centres for a decentralized local government system linked to Ward Development
65
65
Councils and Village Assemblies, which in practice are responsible for the
implementation of agricultural plans and policies. The ASLMs are coordinated by the
Ministry of Agriculture Food Security and Cooperatives, which has a considerable
influence in policy formation and commitment to overseeing reforms in the
Agriculture Sector. ASLMs will also collaborate with other related Ministries
responsible for land, water, energy, transport, natural resources and tourism.
7.2.3 Regional Secretariats
Regional Secretariats receive directives from PS PMO-RALG and pass them to LGAs.
They give advice and provide monitoring and evaluation to all activities implemented
by LGAs. Although the structure of the Regional Secretariat is well defined and the
staff generally have a clear vision on what they are required to deliver, they are
usually under-utilized by the LGAs due to lack of resources to deploy their advisory
services.
7.2.4 Local Government Authorities
The LGAs are supposed to be epicenter of planning and implementation of
agricultural development programmes. Local Government usually ensures rules,
regulations and Acts prevailing in the districts are implemented accordingly.
However, some of local government authorities usually suffer from a number of
problems related mainly to (i) uncoordinated actions by ASLMs, development
partners, private sector and civil society operating outside the ASDS planning
framework, leading to accountability problems and disjointed results at the grass roots
(ii) limited local sources of tax and non-tax revenue to finance development
programmes (iii) delayed and inadequate deployment of funds from approved national
budgets. These weaknesses are known and the need to be addressed.
7.2.5 Commodity Boards and Other Parastatals
Crop Boards of traditional crops are responsible for regulating the industry, advice the
government on the policies, strategies and all other matters relating to the
development of the industry, provide for licensing of persons engaged in the
marketing and processing of products, assist directly or through financial support
research and development and extension services, protect the interests of farmers
against syndicate of buyers, regulate and control the quality of the product, collect,
refine, maintain or disseminate information or data relating to the industry, represent
66
66
the government in all international matters. The need to empower stakeholders in the
governance of Commodity Boards and Parastatals was listed in the ASDS 2001 and it
is still stands valid to date. A new board to deal with Cereal and Other Produce Board
has been created.
7.2.6 Civil Society, Farmer Organizations and Cooperatives
The Agricultural Council of Tanzania (ACT) and the National Network of Farmers
Groups in Tanzania also known in Kiswahili as “Mtandao wa Vikundi vya Wakulima
Tanzania” (MVIWATA) as well as the Non-State Actors Forum (ANSAF) are
emerging as national bodies for advocacy in the agricultural sector. These bodies and
other farmer institutions/organizations especially farmer cooperatives and farmers
Savings and Credit Cooperatives Societies (SACCOS) require support for capacity-
building to respond to the needs of their members and undertake advocacy and policy
dialogue. New services are appearing through farmer associations, professional
organizations, the private sector and rural microfinance institutions (MFIs). These
organizations also need to be supported in the creation of networks at the district and
national levels.
7.2.7 Development Partners
The contribution by Development Partners in modernizing and commercialization of
the agricultural sector will still be needed in the foreseeable future.
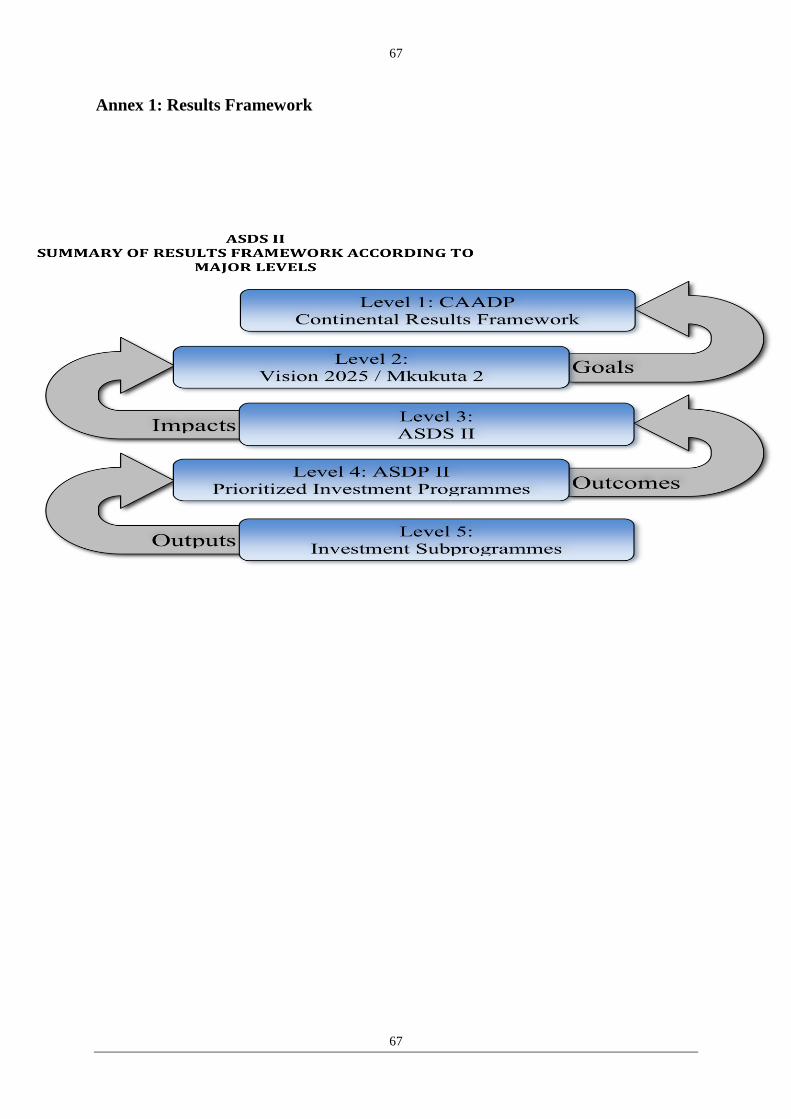
67
67
Annex 1: Results Framework
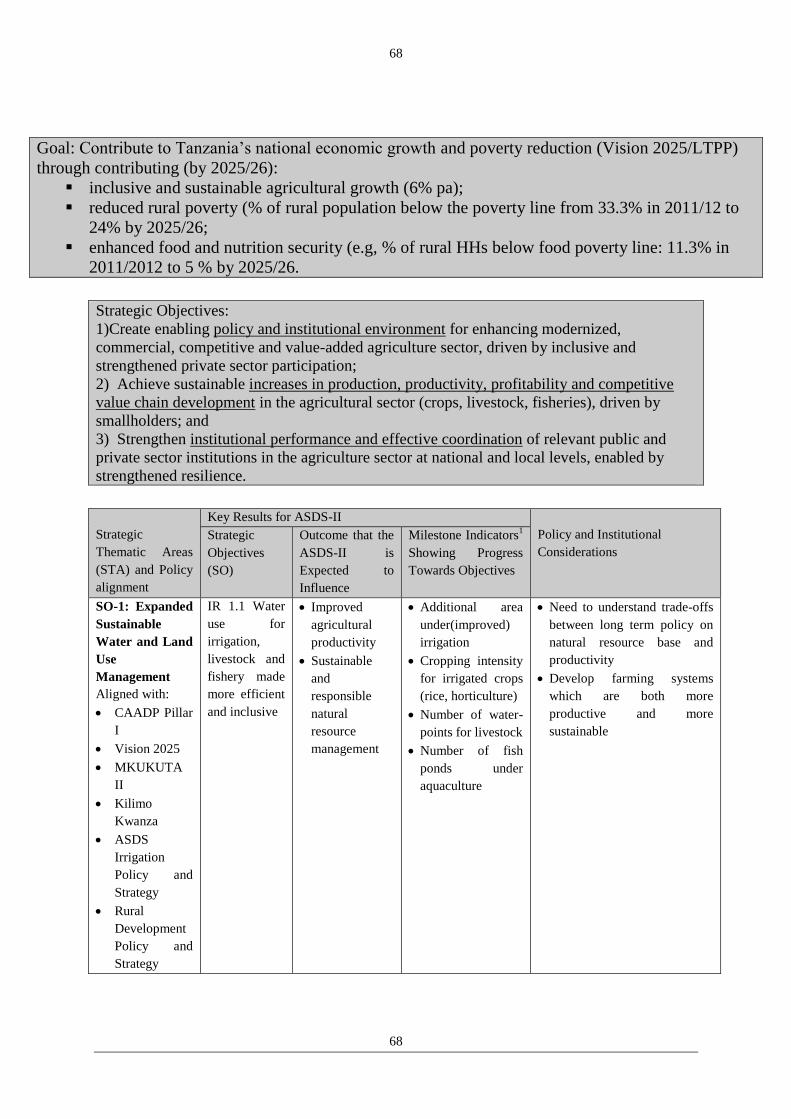
68
68
Goal: Contribute to Tanzania’s national economic growth and poverty reduction (Vision 2025/LTPP)
through contributing (by 2025/26):
inclusive and sustainable agricultural growth (6% pa);
reduced rural poverty (% of rural population below the poverty line from 33.3% in 2011/12 to
24% by 2025/26;
enhanced food and nutrition security (e.g, % of rural HHs below food poverty line: 11.3% in
2011/2012 to 5 % by 2025/26.
Strategic Objectives:
1)Create enabling policy and institutional environment for enhancing modernized,
commercial, competitive and value-added agriculture sector, driven by inclusive and
strengthened private sector participation;
2) Achieve sustainable increases in production, productivity, profitability and competitive
value chain development in the agricultural sector (crops, livestock, fisheries), driven by
smallholders; and
3) Strengthen institutional performance and effective coordination of relevant public and
private sector institutions in the agriculture sector at national and local levels, enabled by
strengthened resilience.
Strategic
Thematic Areas
(STA) and Policy
alignment
Key Results for ASDS-II
Policy and Institutional
Considerations
Strategic
Objectives
(SO)
Outcome that the
ASDS-II is
Expected to
Influence
Milestone Indicators1
Showing Progress
Towards Objectives
SO-1: Expanded
Sustainable
Water and Land
Use
Management
Aligned with:
CAADP Pillar
I
Vision 2025
MKUKUTA
II
Kilimo
Kwanza
ASDS
Irrigation
Policy and
Strategy
Rural
Development
Policy and
Strategy
IR 1.1 Water
use for
irrigation,
livestock and
fishery made
more efficient
and inclusive
Improved
agricultural
productivity
Sustainable
and
responsible
natural
resource
management
Additional area
under(improved)
irrigation
Cropping intensity
for irrigated crops
(rice, horticulture)
Number of water-
points for livestock
Number of fish
ponds under
aquaculture
Need to understand trade-offs
between long term policy on
natural resource base and
productivity
Develop farming systems
which are both more
productive and more
sustainable
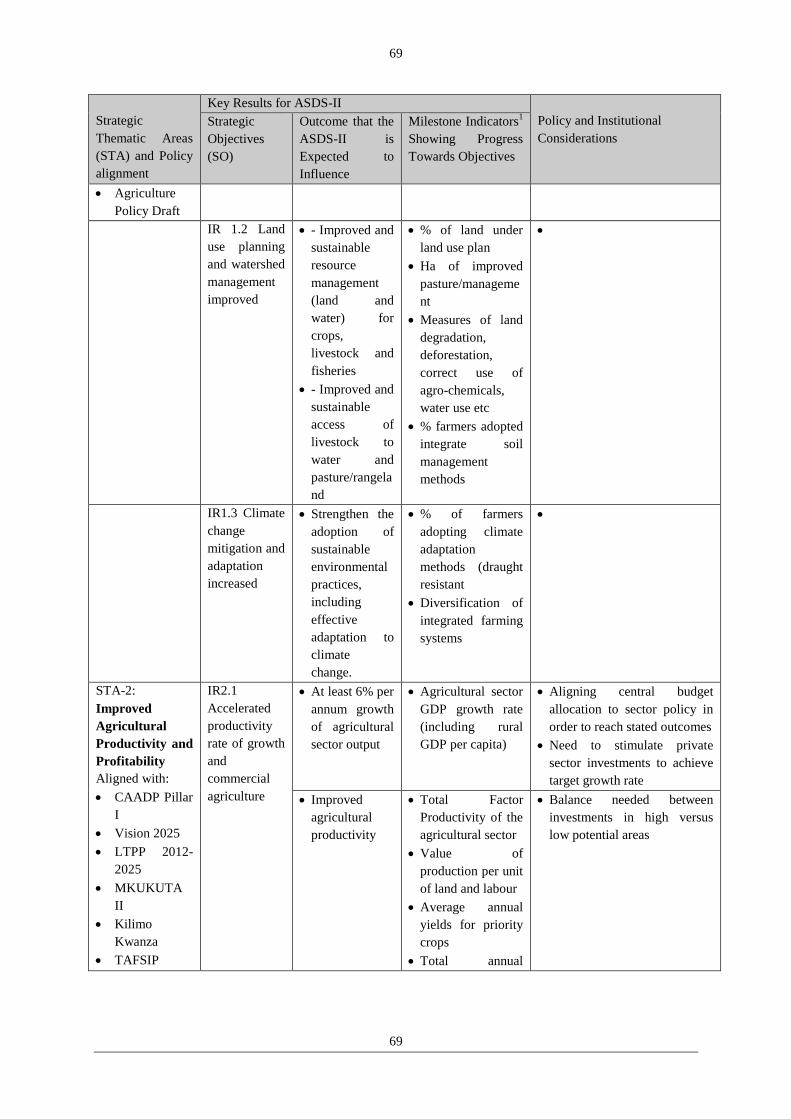
69
69
Strategic
Thematic Areas
(STA) and Policy
alignment
Key Results for ASDS-II
Policy and Institutional
Considerations
Strategic
Objectives
(SO)
Outcome that the
ASDS-II is
Expected to
Influence
Milestone Indicators1
Showing Progress
Towards Objectives
Agriculture
Policy Draft
IR 1.2 Land
use planning
and watershed
management
improved
- Improved and
sustainable
resource
management
(land and
water) for
crops,
livestock and
fisheries
- Improved and
sustainable
access of
livestock to
water and
pasture/rangela
nd
% of land under
land use plan
Ha of improved
pasture/manageme
nt
Measures of land
degradation,
deforestation,
correct use of
agro-chemicals,
water use etc
% farmers adopted
integrate soil
management
methods
IR1.3 Climate
change
mitigation and
adaptation
increased
Strengthen the
adoption of
sustainable
environmental
practices,
including
effective
adaptation to
climate
change.
% of farmers
adopting climate
adaptation
methods (draught
resistant
Diversification of
integrated farming
systems
STA-2:
Improved
Agricultural
Productivity and
Profitability
Aligned with:
CAADP Pillar
I
Vision 2025
LTPP 2012-
2025
MKUKUTA
II
Kilimo
Kwanza
TAFSIP
IR2.1
Accelerated
productivity
rate of growth
and
commercial
agriculture
At least 6% per
annum growth
of agricultural
sector output
Agricultural sector
GDP growth rate
(including rural
GDP per capita)
Aligning central budget
allocation to sector policy in
order to reach stated outcomes
Need to stimulate private
sector investments to achieve
target growth rate
Improved
agricultural
productivity
Total Factor
Productivity of the
agricultural sector
Value of
production per unit
of land and labour
Average annual
yields for priority
crops
Total annual
Balance needed between
investments in high versus
low potential areas
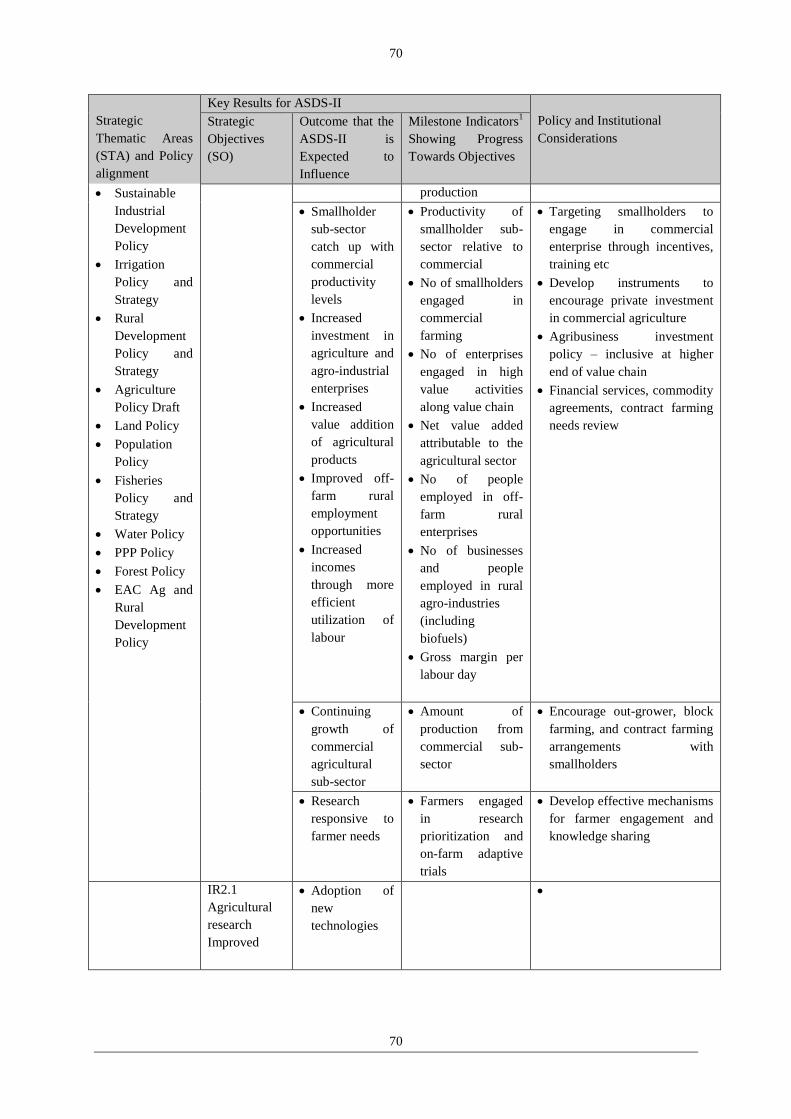
70
70
Strategic
Thematic Areas
(STA) and Policy
alignment
Key Results for ASDS-II
Policy and Institutional
Considerations
Strategic
Objectives
(SO)
Outcome that the
ASDS-II is
Expected to
Influence
Milestone Indicators1
Showing Progress
Towards Objectives
Sustainable
Industrial
Development
Policy
Irrigation
Policy and
Strategy
Rural
Development
Policy and
Strategy
Agriculture
Policy Draft
Land Policy
Population
Policy
Fisheries
Policy and
Strategy
Water Policy
PPP Policy
Forest Policy
EAC Ag and
Rural
Development
Policy
production
Smallholder
sub-sector
catch up with
commercial
productivity
levels
Increased
investment in
agriculture and
agro-industrial
enterprises
Increased
value addition
of agricultural
products
Improved off-
farm rural
employment
opportunities
Increased
incomes
through more
efficient
utilization of
labour
Productivity of
smallholder sub-
sector relative to
commercial
No of smallholders
engaged in
commercial
farming
No of enterprises
engaged in high
value activities
along value chain
Net value added
attributable to the
agricultural sector
No of people
employed in off-
farm rural
enterprises
No of businesses
and people
employed in rural
agro-industries
(including
biofuels)
Gross margin per
labour day
Targeting smallholders to
engage in commercial
enterprise through incentives,
training etc
Develop instruments to
encourage private investment
in commercial agriculture
Agribusiness investment
policy – inclusive at higher
end of value chain
Financial services, commodity
agreements, contract farming
needs review
Continuing
growth of
commercial
agricultural
sub-sector
Amount of
production from
commercial sub-
sector
Encourage out-grower, block
farming, and contract farming
arrangements with
smallholders
Research
responsive to
farmer needs
Farmers engaged
in research
prioritization and
on-farm adaptive
trials
Develop effective mechanisms
for farmer engagement and
knowledge sharing
IR2.1
Agricultural
research
Improved
Adoption of
new
technologies
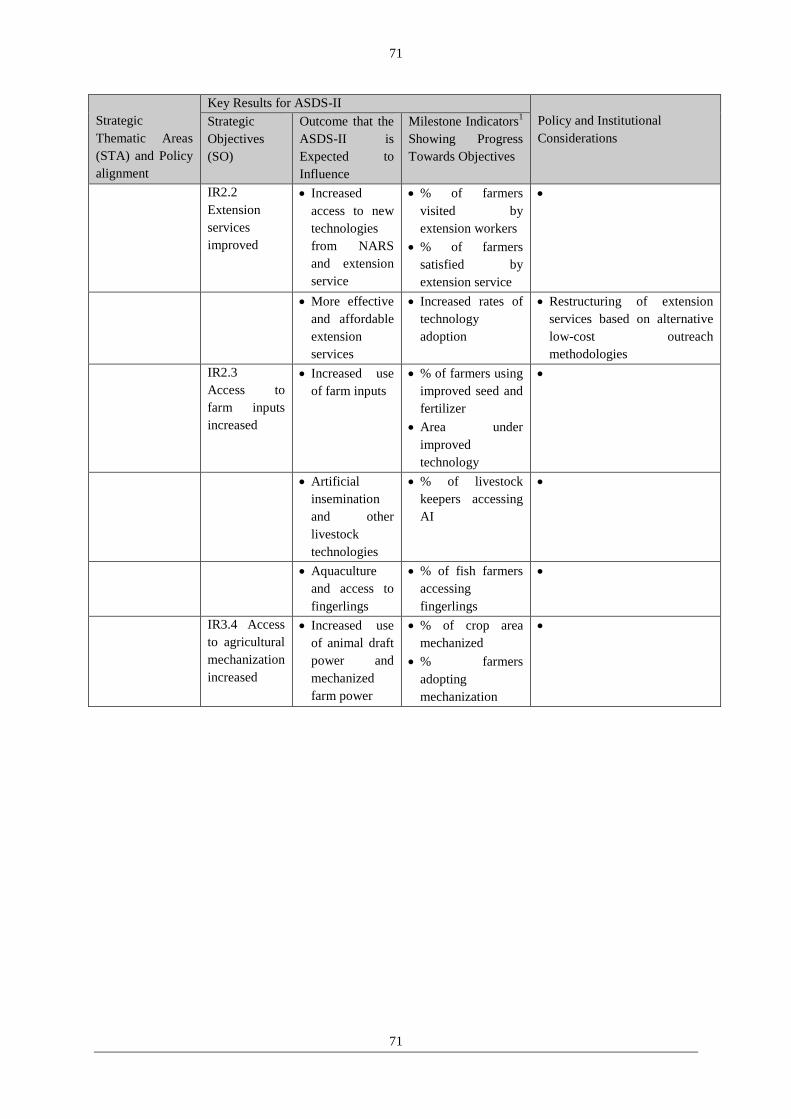
71
71
Strategic
Thematic Areas
(STA) and Policy
alignment
Key Results for ASDS-II
Policy and Institutional
Considerations
Strategic
Objectives
(SO)
Outcome that the
ASDS-II is
Expected to
Influence
Milestone Indicators1
Showing Progress
Towards Objectives
IR2.2
Extension
services
improved
Increased
access to new
technologies
from NARS
and extension
service
% of farmers
visited by
extension workers
% of farmers
satisfied by
extension service
More effective
and affordable
extension
services
Increased rates of
technology
adoption
Restructuring of extension
services based on alternative
low-cost outreach
methodologies
IR2.3
Access to
farm inputs
increased
Increased use
of farm inputs
% of farmers using
improved seed and
fertilizer
Area under
improved
technology
Artificial
insemination
and other
livestock
technologies
% of livestock
keepers accessing
AI
Aquaculture
and access to
fingerlings
% of fish farmers
accessing
fingerlings
IR3.4 Access
to agricultural
mechanization
increased
Increased use
of animal draft
power and
mechanized
farm power
% of crop area
mechanized
% farmers
adopting
mechanization
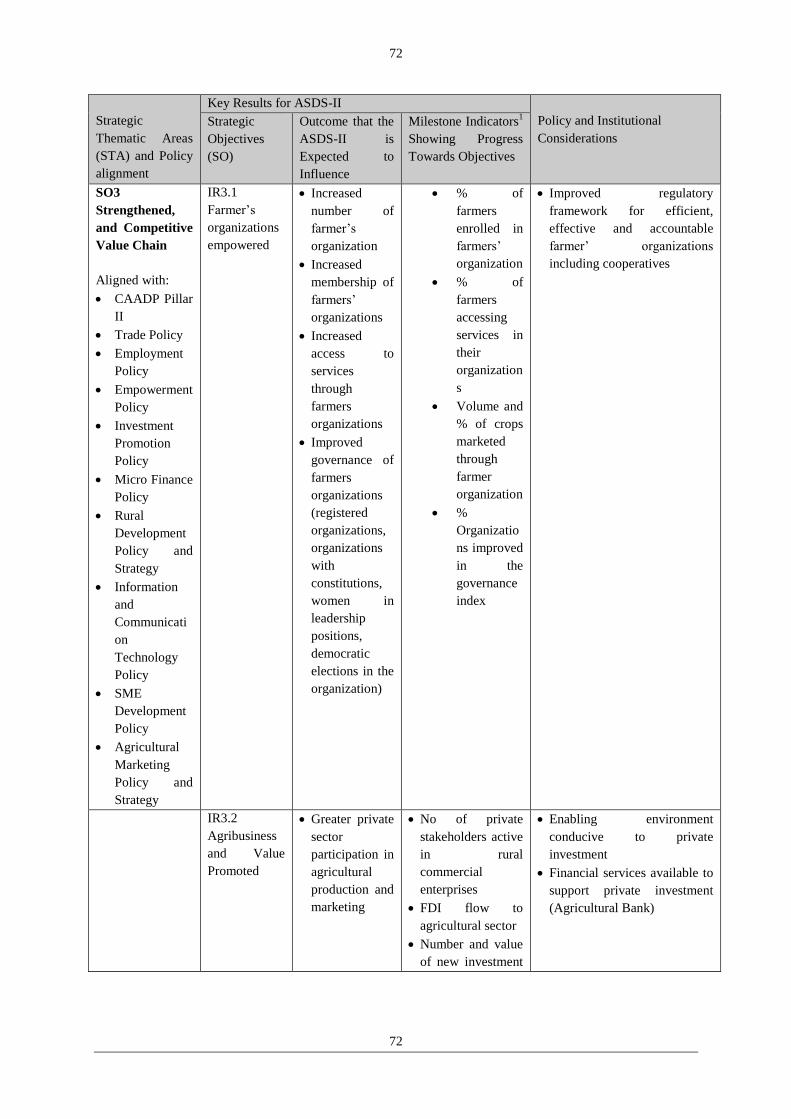
72
72
Strategic
Thematic Areas
(STA) and Policy
alignment
Key Results for ASDS-II
Policy and Institutional
Considerations
Strategic
Objectives
(SO)
Outcome that the
ASDS-II is
Expected to
Influence
Milestone Indicators1
Showing Progress
Towards Objectives
SO3
Strengthened,
and Competitive
Value Chain
Aligned with:
CAADP Pillar
II
Trade Policy
Employment
Policy
Empowerment
Policy
Investment
Promotion
Policy
Micro Finance
Policy
Rural
Development
Policy and
Strategy
Information
and
Communicati
on
Technology
Policy
SME
Development
Policy
Agricultural
Marketing
Policy and
Strategy
IR3.1
Farmer’s
organizations
empowered
Increased
number of
farmer’s
organization
Increased
membership of
farmers’
organizations
Increased
access to
services
through
farmers
organizations
Improved
governance of
farmers
organizations
(registered
organizations,
organizations
with
constitutions,
women in
leadership
positions,
democratic
elections in the
organization)
% of
farmers
enrolled in
farmers’
organization
% of
farmers
accessing
services in
their
organization
s
Volume and
% of crops
marketed
through
farmer
organization
%
Organizatio
ns improved
in the
governance
index
Improved regulatory
framework for efficient,
effective and accountable
farmer’ organizations
including cooperatives
IR3.2
Agribusiness
and Value
Promoted
Greater private
sector
participation in
agricultural
production and
marketing
No of private
stakeholders active
in rural
commercial
enterprises
FDI flow to
agricultural sector
Number and value
of new investment
Enabling environment
conducive to private
investment
Financial services available to
support private investment
(Agricultural Bank)
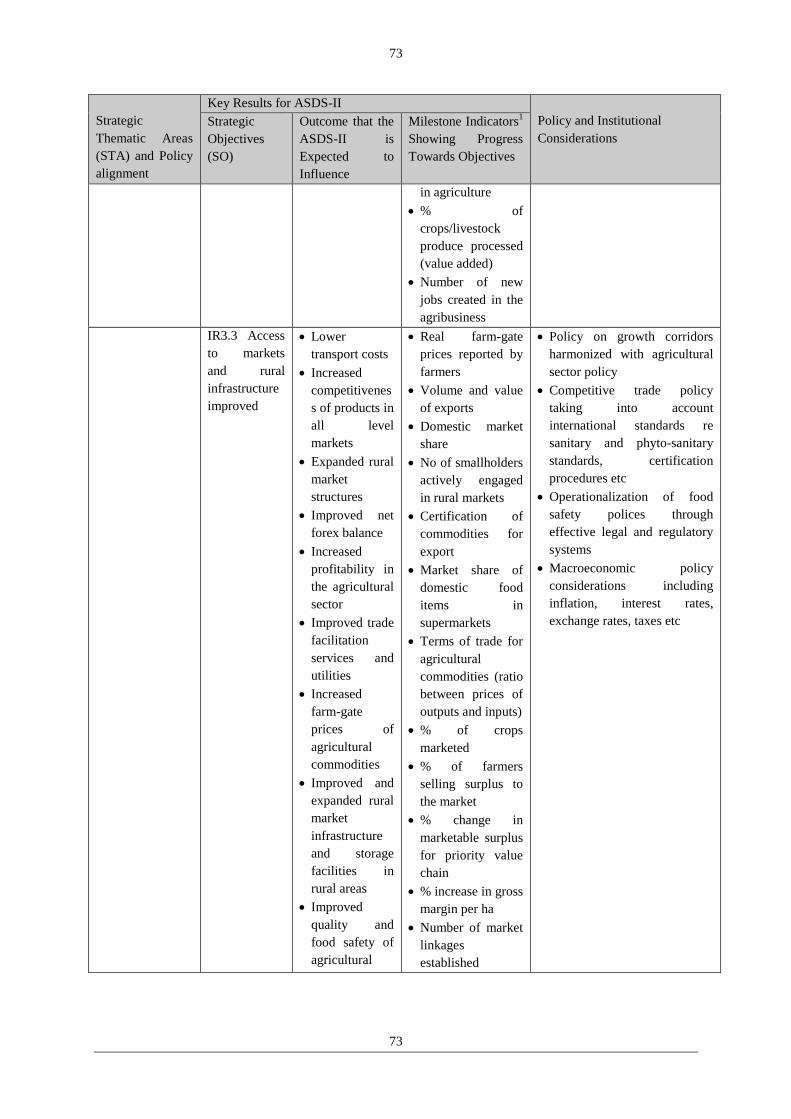
73
73
Strategic
Thematic Areas
(STA) and Policy
alignment
Key Results for ASDS-II
Policy and Institutional
Considerations
Strategic
Objectives
(SO)
Outcome that the
ASDS-II is
Expected to
Influence
Milestone Indicators1
Showing Progress
Towards Objectives
in agriculture
% of
crops/livestock
produce processed
(value added)
Number of new
jobs created in the
agribusiness
IR3.3 Access
to markets
and rural
infrastructure
improved
Lower
transport costs
Increased
competitivenes
s of products in
all level
markets
Expanded rural
market
structures
Improved net
forex balance
Increased
profitability in
the agricultural
sector
Improved trade
facilitation
services and
utilities
Increased
farm-gate
prices of
agricultural
commodities
Improved and
expanded rural
market
infrastructure
and storage
facilities in
rural areas
Improved
quality and
food safety of
agricultural
Real farm-gate
prices reported by
farmers
Volume and value
of exports
Domestic market
share
No of smallholders
actively engaged
in rural markets
Certification of
commodities for
export
Market share of
domestic food
items in
supermarkets
Terms of trade for
agricultural
commodities (ratio
between prices of
outputs and inputs)
% of crops
marketed
% of farmers
selling surplus to
the market
% change in
marketable surplus
for priority value
chain
% increase in gross
margin per ha
Number of market
linkages
established
Policy on growth corridors
harmonized with agricultural
sector policy
Competitive trade policy
taking into account
international standards re
sanitary and phyto-sanitary
standards, certification
procedures etc
Operationalization of food
safety polices through
effective legal and regulatory
systems
Macroeconomic policy
considerations including
inflation, interest rates,
exchange rates, taxes etc
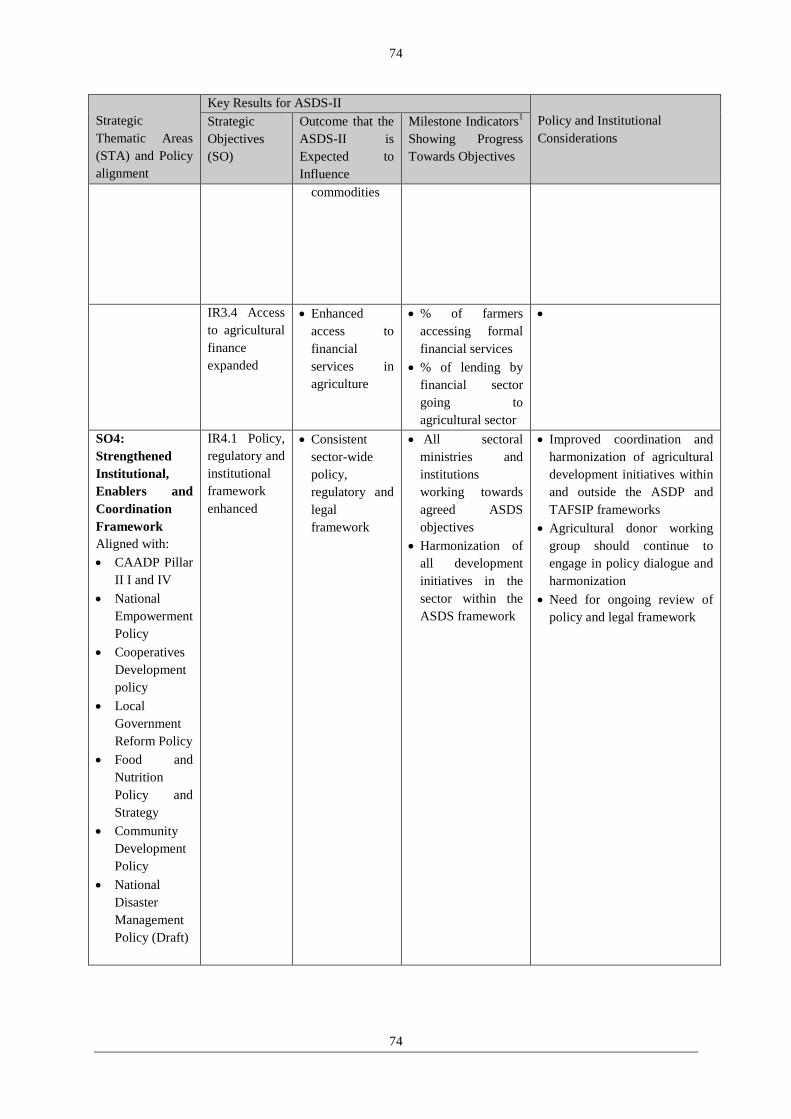
74
74
Strategic
Thematic Areas
(STA) and Policy
alignment
Key Results for ASDS-II
Policy and Institutional
Considerations
Strategic
Objectives
(SO)
Outcome that the
ASDS-II is
Expected to
Influence
Milestone Indicators1
Showing Progress
Towards Objectives
commodities
IR3.4 Access
to agricultural
finance
expanded
Enhanced
access to
financial
services in
agriculture
% of farmers
accessing formal
financial services
% of lending by
financial sector
going to
agricultural sector
SO4:
Strengthened
Institutional,
Enablers and
Coordination
Framework
Aligned with:
CAADP Pillar
II I and IV
National
Empowerment
Policy
Cooperatives
Development
policy
Local
Government
Reform Policy
Food and
Nutrition
Policy and
Strategy
Community
Development
Policy
National
Disaster
Management
Policy (Draft)
IR4.1 Policy,
regulatory and
institutional
framework
enhanced
Consistent
sector-wide
policy,
regulatory and
legal
framework
All sectoral
ministries and
institutions
working towards
agreed ASDS
objectives
Harmonization of
all development
initiatives in the
sector within the
ASDS framework
Improved coordination and
harmonization of agricultural
development initiatives within
and outside the ASDP and
TAFSIP frameworks
Agricultural donor working
group should continue to
engage in policy dialogue and
harmonization
Need for ongoing review of
policy and legal framework
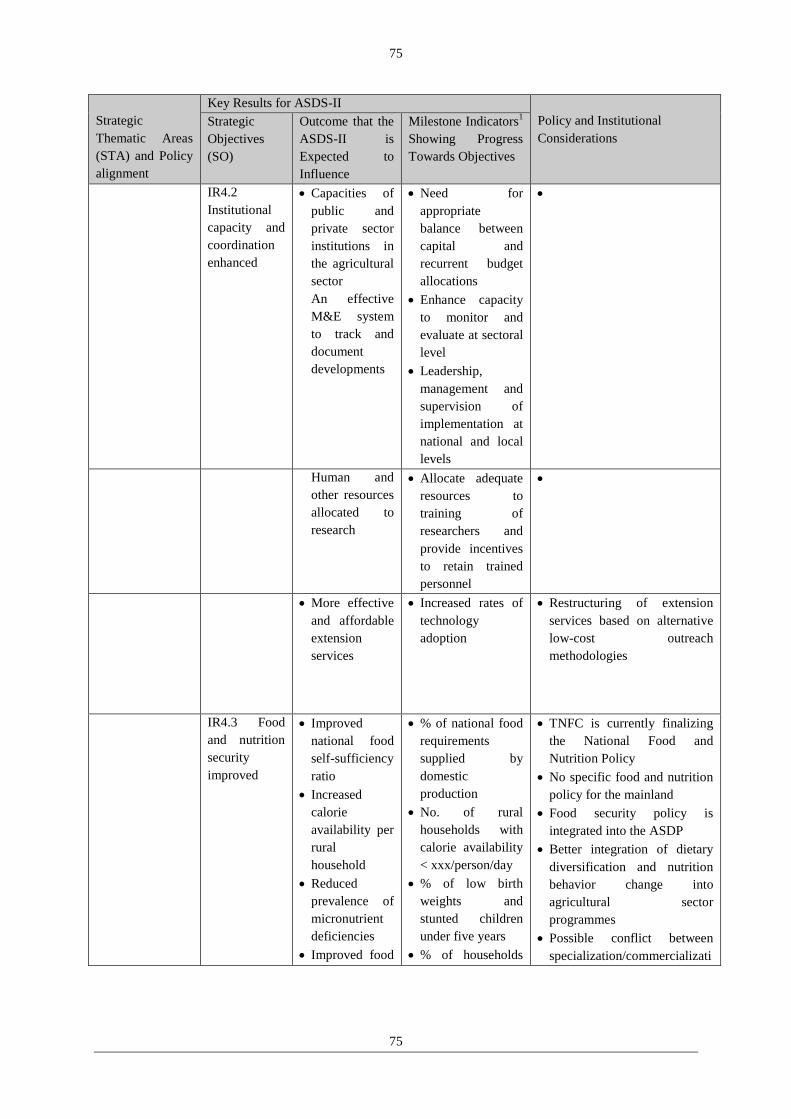
75
75
Strategic
Thematic Areas
(STA) and Policy
alignment
Key Results for ASDS-II
Policy and Institutional
Considerations
Strategic
Objectives
(SO)
Outcome that the
ASDS-II is
Expected to
Influence
Milestone Indicators1
Showing Progress
Towards Objectives
IR4.2
Institutional
capacity and
coordination
enhanced
Capacities of
public and
private sector
institutions in
the agricultural
sector
An effective
M&E system
to track and
document
developments
Need for
appropriate
balance between
capital and
recurrent budget
allocations
Enhance capacity
to monitor and
evaluate at sectoral
level
Leadership,
management and
supervision of
implementation at
national and local
levels
Human and
other resources
allocated to
research
Allocate adequate
resources to
training of
researchers and
provide incentives
to retain trained
personnel
More effective
and affordable
extension
services
Increased rates of
technology
adoption
Restructuring of extension
services based on alternative
low-cost outreach
methodologies
IR4.3 Food
and nutrition
security
improved
Improved
national food
self-sufficiency
ratio
Increased
calorie
availability per
rural
household
Reduced
prevalence of
micronutrient
deficiencies
Improved food
% of national food
requirements
supplied by
domestic
production
No. of rural
households with
calorie availability
< xxx/person/day
% of low birth
weights and
stunted children
under five years
% of households
TNFC is currently finalizing
the National Food and
Nutrition Policy
No specific food and nutrition
policy for the mainland
Food security policy is
integrated into the ASDP
Better integration of dietary
diversification and nutrition
behavior change into
agricultural sector
programmes
Possible conflict between
specialization/commercializati

76
76
Strategic
Thematic Areas
(STA) and Policy
alignment
Key Results for ASDS-II
Policy and Institutional
Considerations
Strategic
Objectives
(SO)
Outcome that the
ASDS-II is
Expected to
Influence
Milestone Indicators1
Showing Progress
Towards Objectives
quality,
diversity, and
reduced
prevalence of
malnutrition
Reduced
vulnerability to
acute food
shortages
Diversification
of farming
systems for
improved diets
eating < 2
meals/day
% of population
with anemia,
vitamin A and
iodine deficiency
% of pregnant
women and
children under 5
with specific
nutrient/micro-
nutrient
deficiencies
% of districts
reporting food
shortages
% of land used for
crops of high
nutritional value
on and diversification of
farming systems and diets
Food safety and quality policy
needed
Need to maintain adequate
food reserves at national level
and adequate distribution
systems in times of crisis
Develop policies and
procedures for dealing with
food price spikes
Promote awareness of dietary
diversity
IR4.4 Disaster
management
and resilience
improved
Adapt to
effects and
mitigate causes
of climate
change
No of households
potentially
requiring
emergency
assistance
% of affected
households
receiving
assistance
Uncertainties about the nature
and magnitude of changing
climate and appropriate
responses
Technologies need to be
considered in order to avoid
increased costs for farmers
Better
preparation
and response to
natural
disasters
No of households
potentially
requiring
emergency
assistance
% of affected
households
receiving
assistance
Balance investments between
disaster prevention/mitigation
and emergency response
capacity
IR4.5 M&E
and
agricultural
statistics
strengthened
Enhance
institutional
capacity to
effectively
plan,
implement and
Results based
performance,
participation and
accountability by
key actors
%DADP that meet
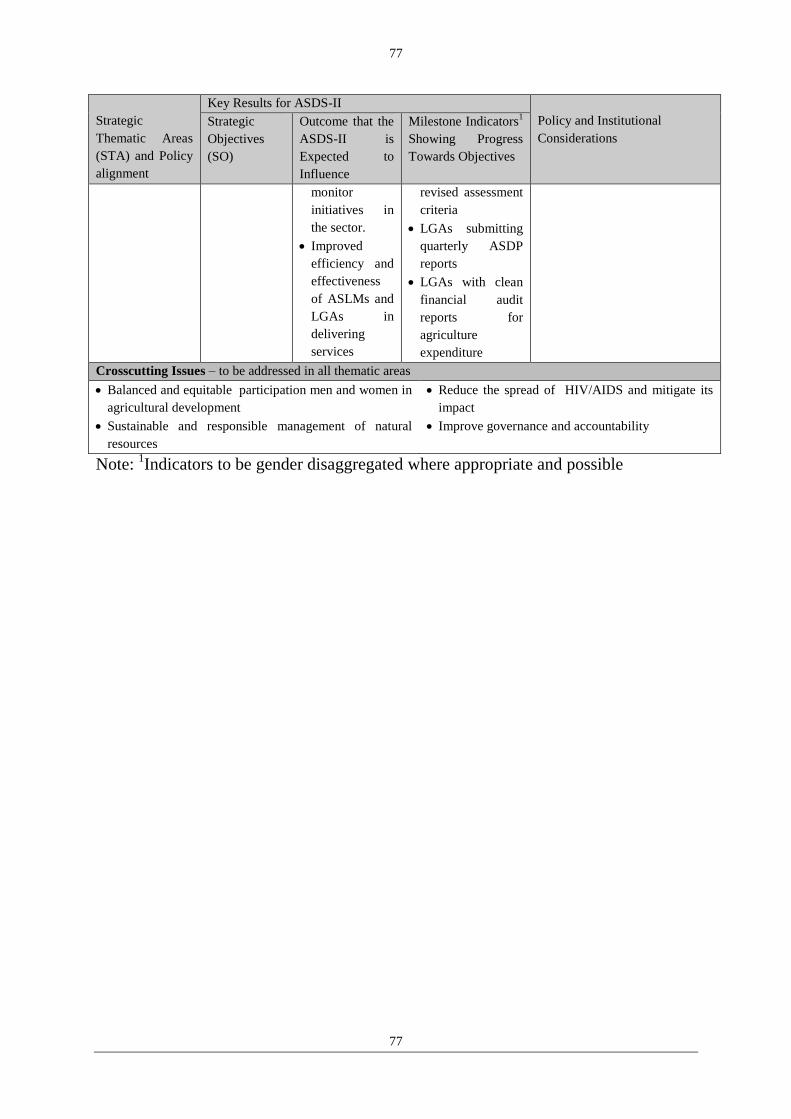
77
77
Strategic
Thematic Areas
(STA) and Policy
alignment
Key Results for ASDS-II
Policy and Institutional
Considerations
Strategic
Objectives
(SO)
Outcome that the
ASDS-II is
Expected to
Influence
Milestone Indicators1
Showing Progress
Towards Objectives
monitor
initiatives in
the sector.
Improved
efficiency and
effectiveness
of ASLMs and
LGAs in
delivering
services
revised assessment
criteria
LGAs submitting
quarterly ASDP
reports
LGAs with clean
financial audit
reports for
agriculture
expenditure
Crosscutting Issues – to be addressed in all thematic areas
Balanced and equitable participation men and women in
agricultural development
Sustainable and responsible management of natural
resources
Reduce the spread of HIV/AIDS and mitigate its
impact
Improve governance and accountability
Note: 1Indicators to be gender disaggregated where appropriate and possible
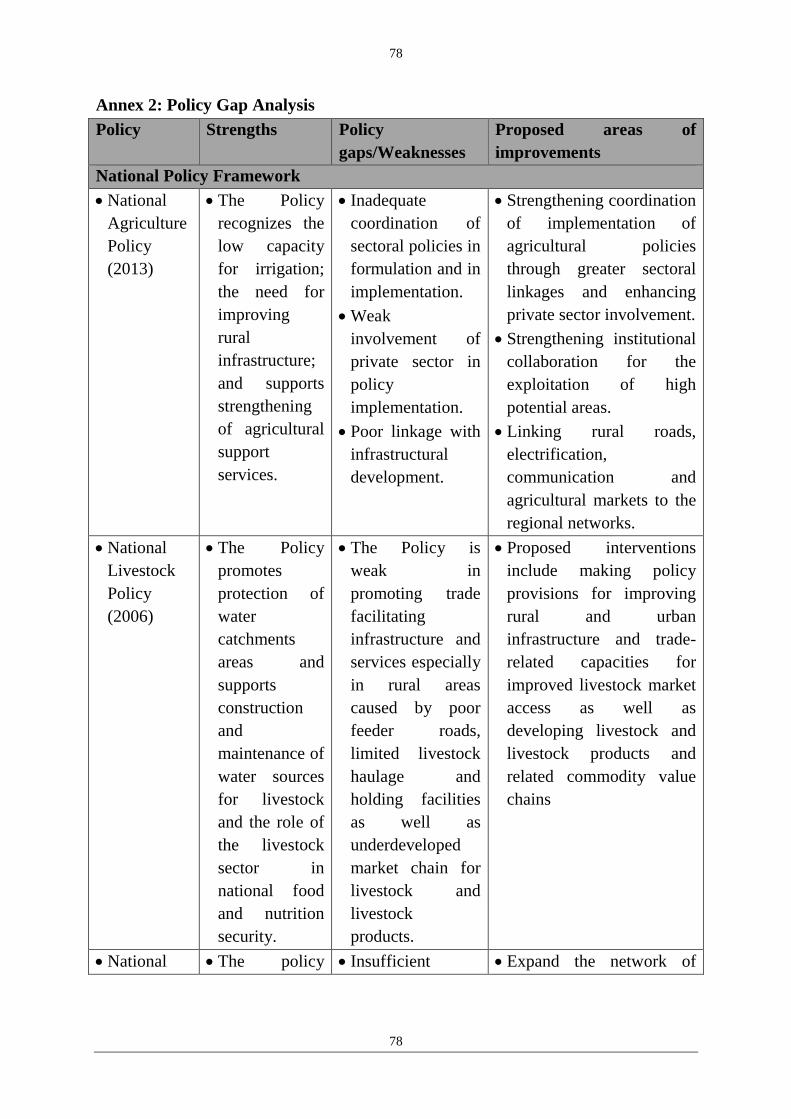
78
78
Annex 2: Policy Gap Analysis
Policy Strengths Policy
gaps/Weaknesses
Proposed areas of
improvements
National Policy Framework
National
Agriculture
Policy
(2013)
The Policy
recognizes the
low capacity
for irrigation;
the need for
improving
rural
infrastructure;
and supports
strengthening
of agricultural
support
services.
Inadequate
coordination of
sectoral policies in
formulation and in
implementation.
Weak
involvement of
private sector in
policy
implementation.
Poor linkage with
infrastructural
development.
Strengthening coordination
of implementation of
agricultural policies
through greater sectoral
linkages and enhancing
private sector involvement.
Strengthening institutional
collaboration for the
exploitation of high
potential areas.
Linking rural roads,
electrification,
communication and
agricultural markets to the
regional networks.
National
Livestock
Policy
(2006)
The Policy
promotes
protection of
water
catchments
areas and
supports
construction
and
maintenance of
water sources
for livestock
and the role of
the livestock
sector in
national food
and nutrition
security.
The Policy is
weak in
promoting trade
facilitating
infrastructure and
services especially
in rural areas
caused by poor
feeder roads,
limited livestock
haulage and
holding facilities
as well as
underdeveloped
market chain for
livestock and
livestock
products.
Proposed interventions
include making policy
provisions for improving
rural and urban
infrastructure and trade-
related capacities for
improved livestock market
access as well as
developing livestock and
livestock products and
related commodity value
chains
National The policy Insufficient Expand the network of

79
79
Policy Strengths Policy
gaps/Weaknesses
Proposed areas of
improvements
Fisheries
Sector
Policy and
Strategy
Statement
recognizes the
potential of the
fisheries sector
including fish
farming in
contribution to
the food
supply and
high quality
protein and
other nutrients;
and the
potential for
employment
creation
programmes to
address issues of
declining stock
and endangered
aquatic species.
Lack of proper
legal frameworks
to combat illegal,
unregulated and
unreported
fishing.
fisheries products by
investing in infrastructure
to support deep sea fishing
for local investors.
Improving fishing
techniques for artisanal
fishers to reduce post
harvest losses.
Strengthening regulatory
frameworks in the fisheries
sector.
The
National
Irrigation
Policy
(2010)
The Policy
recognizes the
potential of
irrigation to
promote
agricultural
productivity,
increase food
security and
stimulate
economic
growth.
Inadequate
integration of
water resources
management
systems and
limited material,
financial and
technical support
services for
irrigators.
Developing integrated
water resources
management systems for
agricultural production.
Providing backup support
for small-scale and
commercial private
irrigation developers
including promotional
activities, guidelines,
regulation, standards,
design and manuals, and
technical assistance.
Providing private
leverage/equity fund for
investment in irrigation.
Sustainable
Industrial
Developme
nt Policy
(1996)
The policy
recognizes
human
development
and creation of
Weak in
addressing
globalization
issues.
Prioritization of
investments in agro-
industries development to
enhance backward and
forward linkages between

80
80
Policy Strengths Policy
gaps/Weaknesses
Proposed areas of
improvements
employment
opportunities
to contribute to
economic
transformation
and sustainable
economic
growth.
agricultural and industrial
sectors.
Cooperative
Developme
nt Policy
(2002)
The policy
recognizes
cooperatives as
people owned
and controlled
institutions for
development
in the
agricultural
sector.
Poor resource
base for
developing
cooperatives into
viable business
entities.
Reorganize cooperatives
into economically viable
and service oriented
entities.
Institute risks protection
instruments as confidence
building measures for
members.
SME Policy
(2003)
The policy
recognize the
need for
development
of
infrastructure
such as road,
cold rooms,
warehouses,
power, water
and
communicatio
n on SMEs,
The commercial
farming activities
are not recognized
as part of SMEs
SMEs support services
should be improved and
extended to cover all
commercial agricultural
operators.
The business environment
should be improved to
foster profitability of SME
operations in agriculture.
National
Trade
Policy 2003
The policy
recognizes the
need for
harmonization
of trade
Weak
implementation of
the policy
especially in
participation in
Streamlining the trade
regime to address
agricultural commodity
trading locally and
internationally.
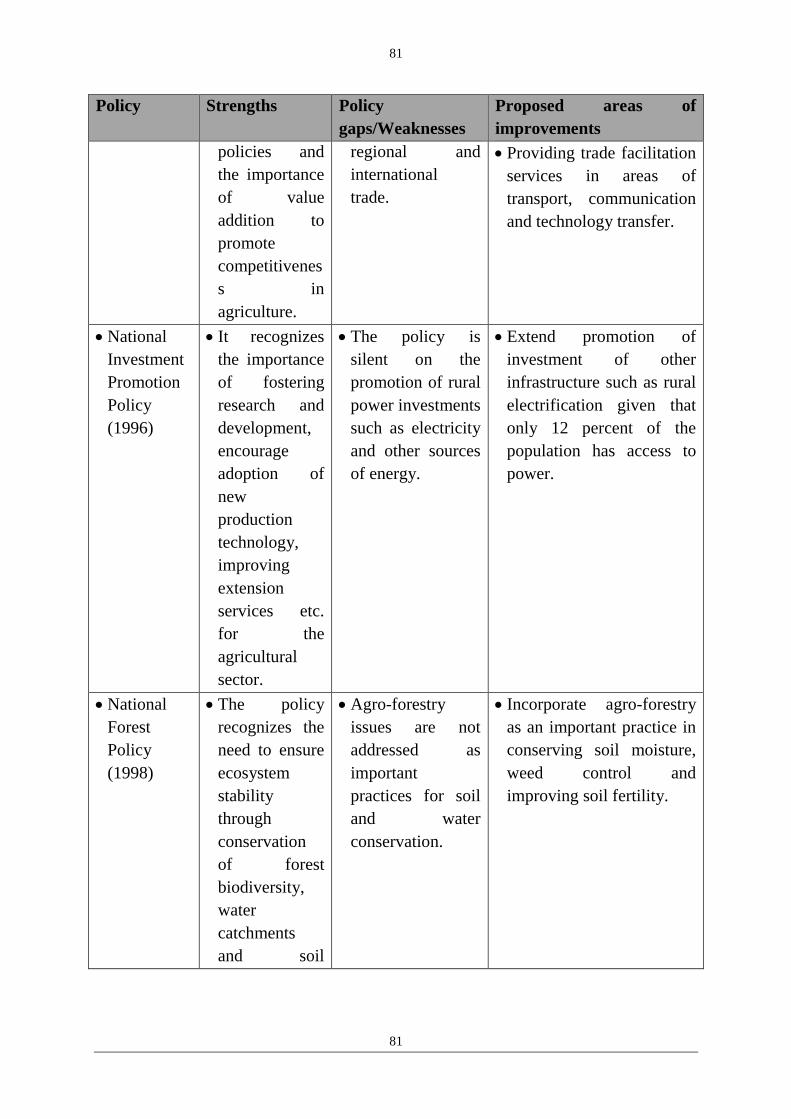
81
81
Policy Strengths Policy
gaps/Weaknesses
Proposed areas of
improvements
policies and
the importance
of value
addition to
promote
competitivenes
s in
agriculture.
regional and
international
trade.
Providing trade facilitation
services in areas of
transport, communication
and technology transfer.
National
Investment
Promotion
Policy
(1996)
It recognizes
the importance
of fostering
research and
development,
encourage
adoption of
new
production
technology,
improving
extension
services etc.
for the
agricultural
sector.
The policy is
silent on the
promotion of rural
power investments
such as electricity
and other sources
of energy.
Extend promotion of
investment of other
infrastructure such as rural
electrification given that
only 12 percent of the
population has access to
power.
National
Forest
Policy
(1998)
The policy
recognizes the
need to ensure
ecosystem
stability
through
conservation
of forest
biodiversity,
water
catchments
and soil
Agro-forestry
issues are not
addressed as
important
practices for soil
and water
conservation.
Incorporate agro-forestry
as an important practice in
conserving soil moisture,
weed control and
improving soil fertility.
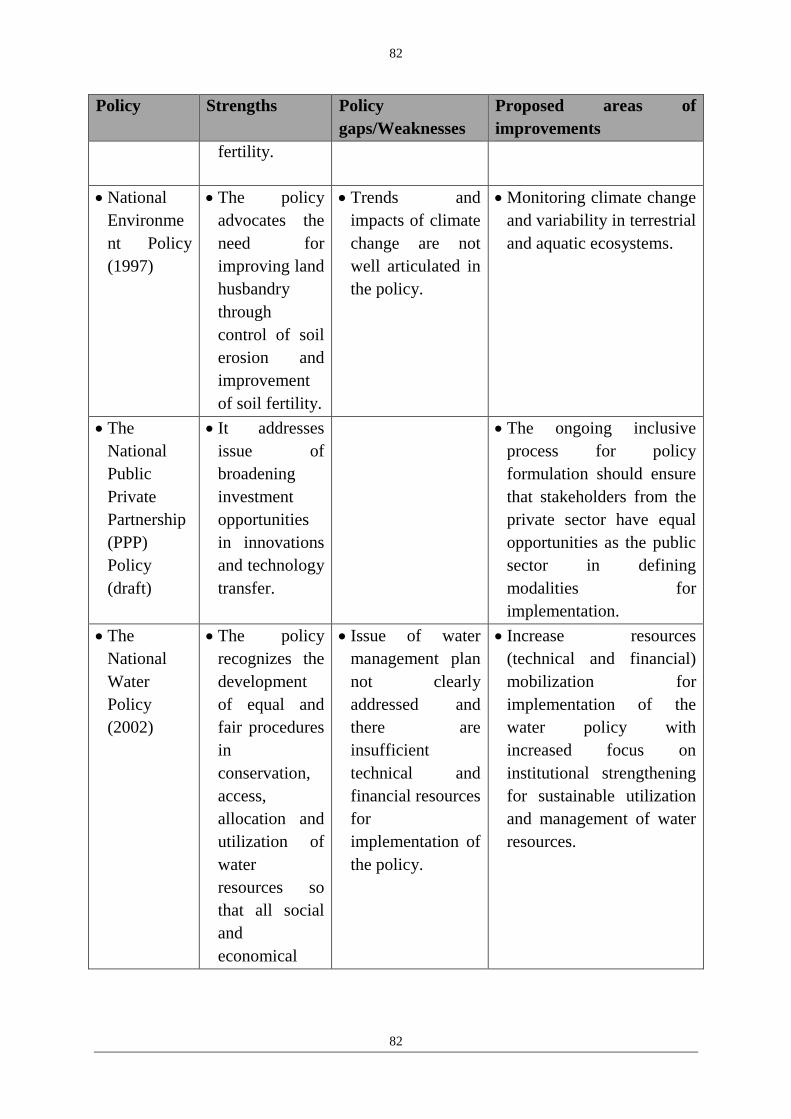
82
82
Policy Strengths Policy
gaps/Weaknesses
Proposed areas of
improvements
fertility.
National
Environme
nt Policy
(1997)
The policy
advocates the
need for
improving land
husbandry
through
control of soil
erosion and
improvement
of soil fertility.
Trends and
impacts of climate
change are not
well articulated in
the policy.
Monitoring climate change
and variability in terrestrial
and aquatic ecosystems.
The
National
Public
Private
Partnership
(PPP)
Policy
(draft)
It addresses
issue of
broadening
investment
opportunities
in innovations
and technology
transfer.
The ongoing inclusive
process for policy
formulation should ensure
that stakeholders from the
private sector have equal
opportunities as the public
sector in defining
modalities for
implementation.
The
National
Water
Policy
(2002)
The policy
recognizes the
development
of equal and
fair procedures
in
conservation,
access,
allocation and
utilization of
water
resources so
that all social
and
economical
Issue of water
management plan
not clearly
addressed and
there are
insufficient
technical and
financial resources
for
implementation of
the policy.
Increase resources
(technical and financial)
mobilization for
implementation of the
water policy with
increased focus on
institutional strengthening
for sustainable utilization
and management of water
resources.
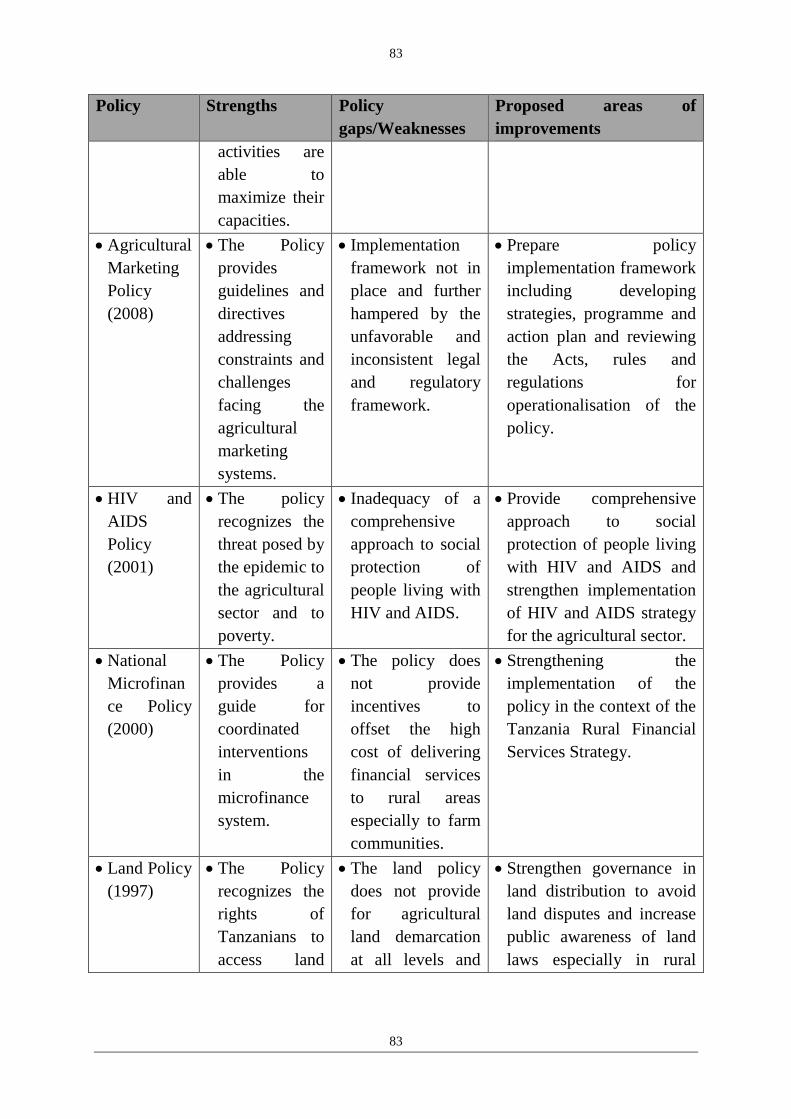
83
83
Policy Strengths Policy
gaps/Weaknesses
Proposed areas of
improvements
activities are
able to
maximize their
capacities.
Agricultural
Marketing
Policy
(2008)
The Policy
provides
guidelines and
directives
addressing
constraints and
challenges
facing the
agricultural
marketing
systems.
Implementation
framework not in
place and further
hampered by the
unfavorable and
inconsistent legal
and regulatory
framework.
Prepare policy
implementation framework
including developing
strategies, programme and
action plan and reviewing
the Acts, rules and
regulations for
operationalisation of the
policy.
HIV and
AIDS
Policy
(2001)
The policy
recognizes the
threat posed by
the epidemic to
the agricultural
sector and to
poverty.
Inadequacy of a
comprehensive
approach to social
protection of
people living with
HIV and AIDS.
Provide comprehensive
approach to social
protection of people living
with HIV and AIDS and
strengthen implementation
of HIV and AIDS strategy
for the agricultural sector.
National
Microfinan
ce Policy
(2000)
The Policy
provides a
guide for
coordinated
interventions
in the
microfinance
system.
The policy does
not provide
incentives to
offset the high
cost of delivering
financial services
to rural areas
especially to farm
communities.
Strengthening the
implementation of the
policy in the context of the
Tanzania Rural Financial
Services Strategy.
Land Policy
(1997)
The Policy
recognizes the
rights of
Tanzanians to
access land
The land policy
does not provide
for agricultural
land demarcation
at all levels and
Strengthen governance in
land distribution to avoid
land disputes and increase
public awareness of land
laws especially in rural

84
84
Policy Strengths Policy
gaps/Weaknesses
Proposed areas of
improvements
and have
security of
land tenure and
the promotion
of equitable
distribution of
land.
there is poor
follow up of the
implementation of
the policy
areas,
Food and
Nutrition
Policy
(1992)
The policy
raises the
importance of
food and
nutrition in
social
wellbeing and
national
development.
The policy does
not capture
emerging food
and nutritional
problems due to
changing lifestyles
in rural and urban
areas.
The policy is
outdated.
The policy needs to be
updated to take into
account current food
security and nutrition
problems including the
changing population
dynamics in rural and
urban areas.
Education
and
Training
Policy
(1995)
The Policy
allows for
equitable
access to
education for
boys and girls,
and for the
poor in rural
and urban
areas.
Inadequate
investment to
fully implement
the policy.
Review the policy to
incorporate issues raised in
education reforms and
programmes including
primary school feeding.
Policies Specific to Zanzibar
Regional Policies
Policy for
Managing
Migrant
Pests and
Larger
Grain Borer
in the
The Policy
promotes
improved
research into
use of low risk
pesticides.
Member States are
silent in policy
implementation.
Needs to be reviewed and
incorporated in the
Regional Agriculture
Policy which is being
developed.
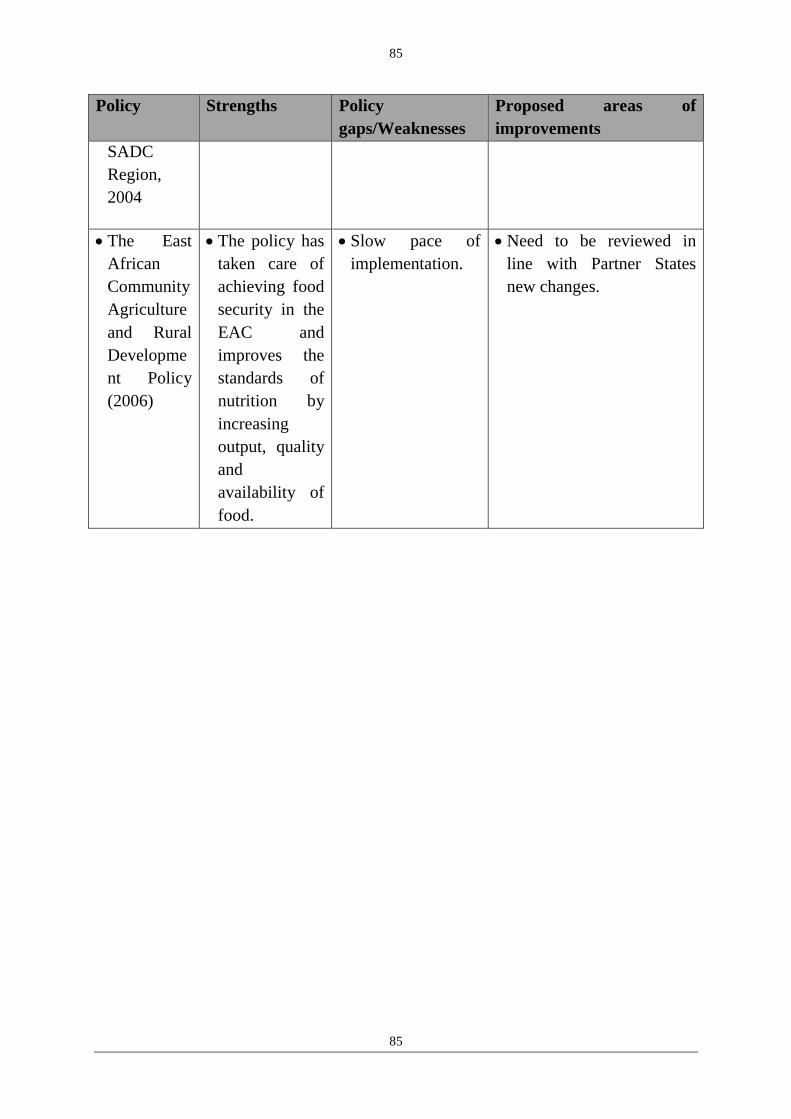
85
85
Policy Strengths Policy
gaps/Weaknesses
Proposed areas of
improvements
SADC
Region,
2004
The East
African
Community
Agriculture
and Rural
Developme
nt Policy
(2006)
The policy has
taken care of
achieving food
security in the
EAC and
improves the
standards of
nutrition by
increasing
output, quality
and
availability of
food.
Slow pace of
implementation.
Need to be reviewed in
line with Partner States
new changes.
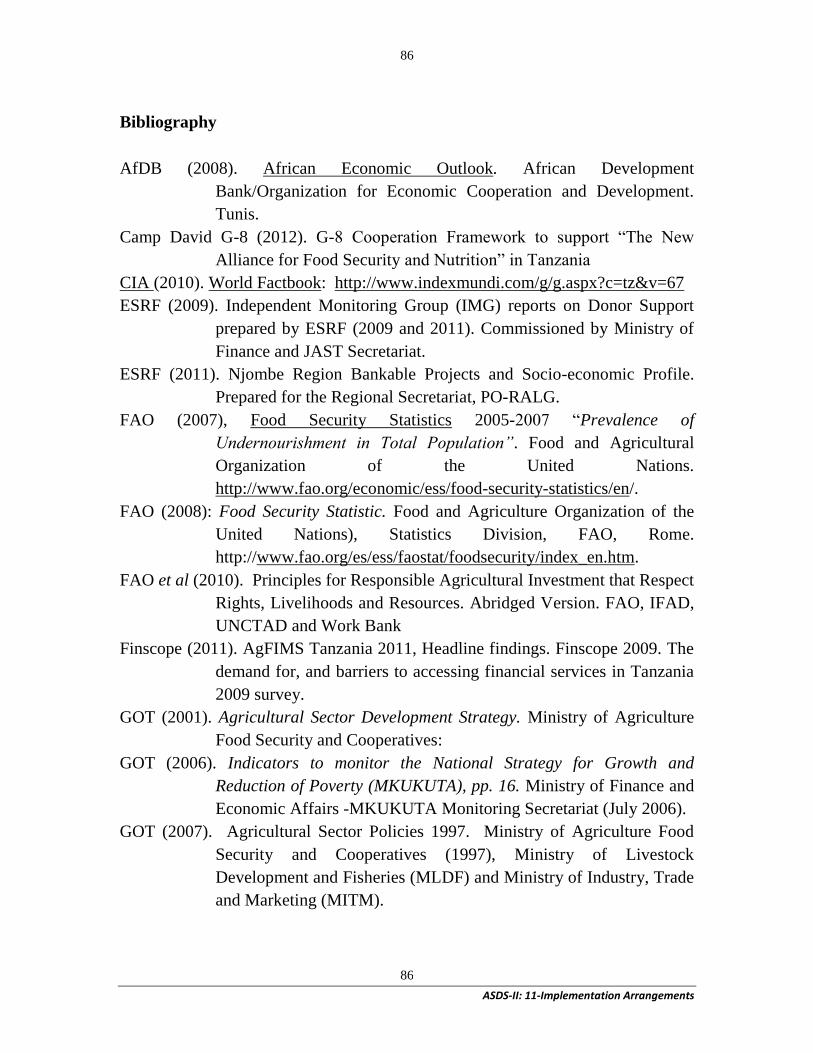
86
ASDS-II: 11-Implementation Arrangements
86
Bibliography
AfDB (2008). African Economic Outlook. African Development
Bank/Organization for Economic Cooperation and Development.
Tunis.
Camp David G-8 (2012). G-8 Cooperation Framework to support “The New
Alliance for Food Security and Nutrition” in Tanzania
CIA (2010). World Factbook: http://www.indexmundi.com/g/g.aspx?c=tz&v=67
ESRF (2009). Independent Monitoring Group (IMG) reports on Donor Support
prepared by ESRF (2009 and 2011). Commissioned by Ministry of
Finance and JAST Secretariat.
ESRF (2011). Njombe Region Bankable Projects and Socio-economic Profile.
Prepared for the Regional Secretariat, PO-RALG.
FAO (2007), Food Security Statistics 2005-2007 “Prevalence of
Undernourishment in Total Population”. Food and Agricultural
Organization of the United Nations.
http://www.fao.org/economic/ess/food-security-statistics/en/.
FAO (2008): Food Security Statistic. Food and Agriculture Organization of the
United Nations), Statistics Division, FAO, Rome.
http://www.fao.org/es/ess/faostat/foodsecurity/index_en.htm.
FAO et al (2010). Principles for Responsible Agricultural Investment that Respect
Rights, Livelihoods and Resources. Abridged Version. FAO, IFAD,
UNCTAD and Work Bank
Finscope (2011). AgFIMS Tanzania 2011, Headline findings. Finscope 2009. The
demand for, and barriers to accessing financial services in Tanzania
2009 survey.
GOT (2001). Agricultural Sector Development Strategy. Ministry of Agriculture
Food Security and Cooperatives:
GOT (2006). Indicators to monitor the National Strategy for Growth and
Reduction of Poverty (MKUKUTA), pp. 16. Ministry of Finance and
Economic Affairs -MKUKUTA Monitoring Secretariat (July 2006).
GOT (2007). Agricultural Sector Policies 1997. Ministry of Agriculture Food
Security and Cooperatives (1997), Ministry of Livestock
Development and Fisheries (MLDF) and Ministry of Industry, Trade
and Marketing (MITM).
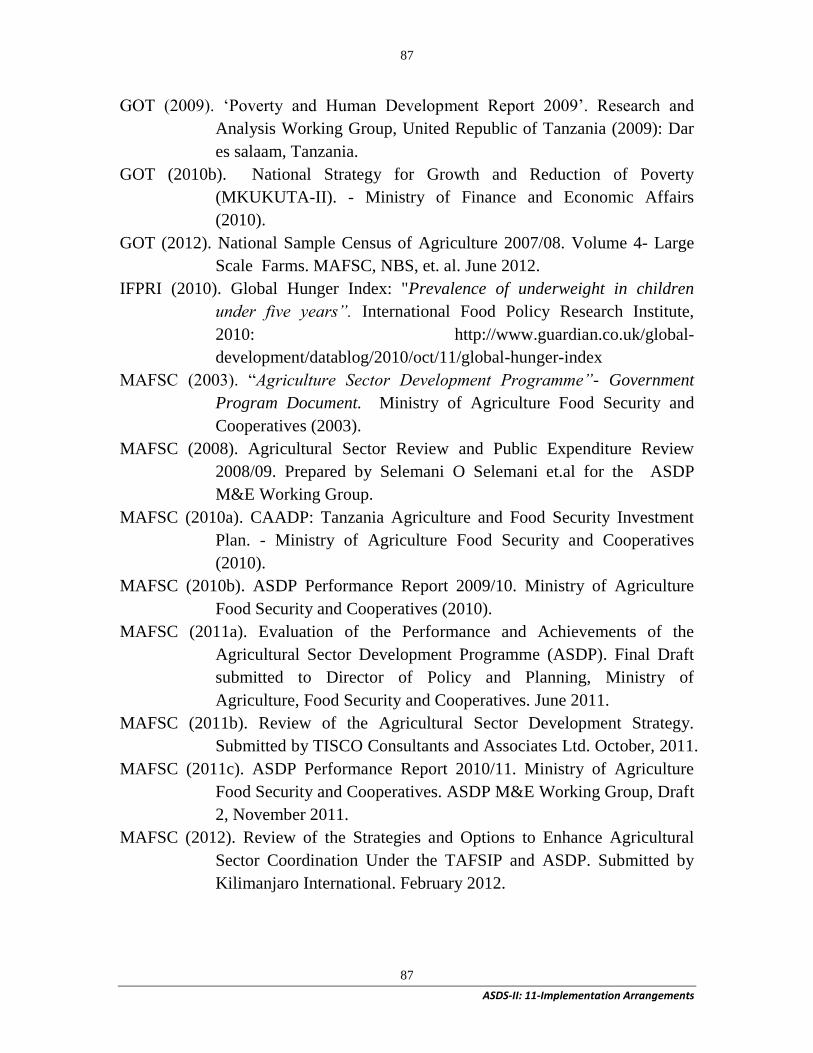
87
ASDS-II: 11-Implementation Arrangements
87
GOT (2009). ‘Poverty and Human Development Report 2009’. Research and
Analysis Working Group, United Republic of Tanzania (2009): Dar
es salaam, Tanzania.
GOT (2010b). National Strategy for Growth and Reduction of Poverty
(MKUKUTA-II). - Ministry of Finance and Economic Affairs
(2010).
GOT (2012). National Sample Census of Agriculture 2007/08. Volume 4- Large
Scale Farms. MAFSC, NBS, et. al. June 2012.
IFPRI (2010). Global Hunger Index: "Prevalence of underweight in children
under five years”. International Food Policy Research Institute,
2010: http://www.guardian.co.uk/global-
development/datablog/2010/oct/11/global-hunger-index
MAFSC (2003). “Agriculture Sector Development Programme”- Government
Program Document. Ministry of Agriculture Food Security and
Cooperatives (2003).
MAFSC (2008). Agricultural Sector Review and Public Expenditure Review
2008/09. Prepared by Selemani O Selemani et.al for the ASDP
M&E Working Group.
MAFSC (2010a). CAADP: Tanzania Agriculture and Food Security Investment
Plan. - Ministry of Agriculture Food Security and Cooperatives
(2010).
MAFSC (2010b). ASDP Performance Report 2009/10. Ministry of Agriculture
Food Security and Cooperatives (2010).
MAFSC (2011a). Evaluation of the Performance and Achievements of the
Agricultural Sector Development Programme (ASDP). Final Draft
submitted to Director of Policy and Planning, Ministry of
Agriculture, Food Security and Cooperatives. June 2011.
MAFSC (2011b). Review of the Agricultural Sector Development Strategy.
Submitted by TISCO Consultants and Associates Ltd. October, 2011.
MAFSC (2011c). ASDP Performance Report 2010/11. Ministry of Agriculture
Food Security and Cooperatives. ASDP M&E Working Group, Draft
2, November 2011.
MAFSC (2012). Review of the Strategies and Options to Enhance Agricultural
Sector Coordination Under the TAFSIP and ASDP. Submitted by
Kilimanjaro International. February 2012.

88
ASDS-II: 11-Implementation Arrangements
88
MOF (2009). Projection 2008-2012: Guideline for the Preparation of Medium
Term Plan and Budget Framework for 2009/10 – 2011/12, page 87.
Ministry of Finance, United Republic of Tanzania.
MOF (2010). National Economic Survey 2008-2009. - Ministry of Finance and
Economic Affairs (2010).
NBS (2002). Household Budget Survey Table 7.2, p. 80, and Table C30, p. 188.
National Bureau of Statistics, (2000/01, July 2002).
NBS (2006). Tanzania Demographic and Health Survey. National Bureau of
Statistics (NBS) (2004/05). ORC Macro Calverton, Maryland, USA.
NBS (2007). Household Budget Survey Chapter 7, Table 1.2, p. 3. National
Bureau of Statistics.
NBS (2010). Tanzania Demographic and Health Survey. National Bureau of
Statistics (2009/10).
POPC (2011a). Tanzania Long Term Perspective Plan: 2011/12 to 2025/26.
President’s Office Planning Commission.
POPC (2011b). Tanzania Medium Term Perspective Plan: Five Year Development
Plan, 2011/12 to 2015/16. President’s Office Planning Commission.
Weinberger, K. and J. Msuya. (2004): Indigenous Vegetables in Tanzania
“Significance and Prospects”. Shanhua, Taiwan: AVRDC—the
World Vegetable Centre, Technical Bulletin No. 31, AVRDC
Publication 04-600. pp 70.
World Bank (2010). Fortification Action Plan on Provision of Vitamin and
Minerals to the Tanzania Population. Prepared by Anna Verster and
Quentum (2009/10).
World Bank (2011). Country Assistance Strategy (CAS) for the United Republic
of Tanzania for the period 2012-2015. IDA, IFC and MIGA. Report
no. 60269-TZ. May 9, 2011.