Agricultural Risk Management* - UF/IFAS...
26
Agricultural Risk Management* Cynthia Rosenzweig NASA Goddard Institute for Space Studies Columbia University Center for Climate Systems Research Climate Information for Managing Risks University of Florida IFAS Southeast Climate Consortium May 25, 2011 1 *At Local, Regional, and Global Scales
Transcript of Agricultural Risk Management* - UF/IFAS...

Agricultural Risk Management*
Cynthia Rosenzweig
NASA Goddard Institute for Space Studies
Columbia University Center for Climate
Systems Research
Climate Information for Managing RisksUniversity of Florida IFAS
Southeast Climate ConsortiumMay 25, 2011
1
*At Local, Regional, and Global Scales

World Food Price Update
von Braun, IFPRI 2008
2
FAO, 2011
Food Prices 2000-2008 Food Prices 1990-2011
2000 2008 2011
Are ‘perfect storm’ conditions continuing . . .

Agricultural Risk Factors
• Poor harvests in major producing countries linked to extreme
weather events
• Declining food stocks – world stocks were at their lowest in
2008 since the 1970s
• High oil and energy prices raising the cost of fertilizers,
irrigation and transportation
• Lack of investment in the agricultural sector
• Subsidized production of bio-fuels that substitute for food
production
• Speculative transactions, including large commercial traders
hedging in futures markets and small traders hedging and
building up storage
• Export restrictions
• Longer-term issues: land availability; yield plateaus; yield
gaps; population growth; climate change

4
Agricultural Risk Factors
Poor harvests in major producing countries linked to extreme
weather events
• Declining food stocks – world stocks were at their lowest in
2008 since the 1970s under pressure
High oil and energy prices raising the cost of fertilizers,
irrigation and transportation
Lack of investment in the agricultural sector
Subsidized production of bio-fuels that substitute food
production
• Speculative transactions, including large commercial traders
hedging in futures markets and small traders hedging and
building up storage ???
Export restrictions
Longer-term issues: land availability; yield plateaus; yield
gaps; climate change; population growth
Update

Weather Extremes Update
2010 Extreme Heat wave Drought in Russia
Extreme Precipitation
Flooding in Australia
• 2010 failure of the Ukrainian grain
crop due to heatwave
• Russia froze wheat exports Aug. 15
2011 . . .
• Devastating drought in Niger
during summer of 2010.
• Central US floods May, 2011
• Back-to-back 100-year
floods in the Northern Great
Plains during 2009 and 2010
• Recent floods in Australia
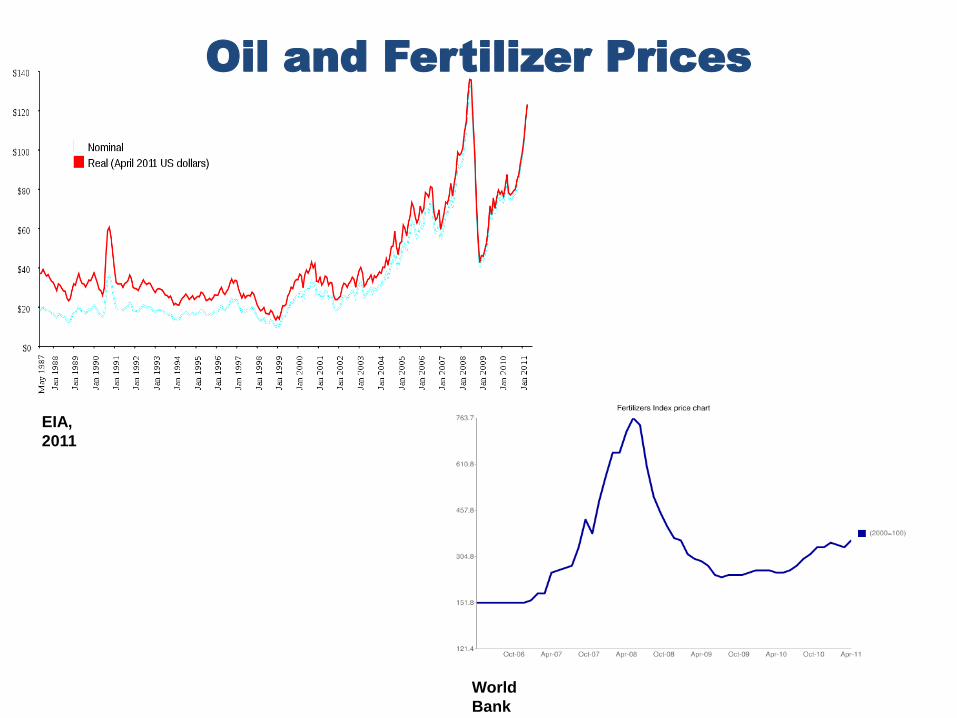
Oil and Fertilizer Prices
World
Bank
EIA,
2011

Biofuels
www.keetsa.com
Almost all of the increase in global maize production from 2004 to 2007 went to bio-fuels production (World Bank 2008)
In the United States, as much as one third of the maize crop goes to ethanol production, up from 5 percent a decade ago, and biofuel subsidies range between US$11-13 billion a year (IISD, 2007).
Increased biofuel demand in 2000-2007 is estimated to have contributed to ~30 percent of the weighted average increase of cereal prices.
US biofuel subsidies still in place, may change as priorities change
7

Longer Term Issues
Land Availability & Yield Plateaus
Cassman et al., 2011
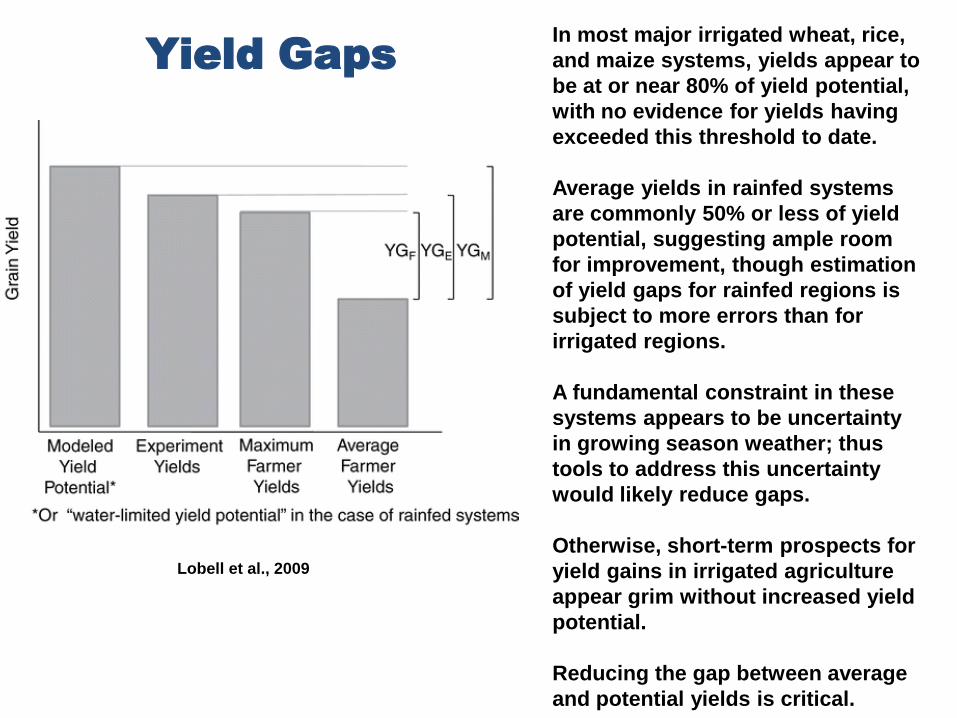
Yield Gaps
Lobell et al., 2009
In most major irrigated wheat, rice,
and maize systems, yields appear to
be at or near 80% of yield potential,
with no evidence for yields having
exceeded this threshold to date.
Average yields in rainfed systems
are commonly 50% or less of yield
potential, suggesting ample room
for improvement, though estimation
of yield gaps for rainfed regions is
subject to more errors than for
irrigated regions.
A fundamental constraint in these
systems appears to be uncertainty
in growing season weather; thus
tools to address this uncertainty
would likely reduce gaps.
Otherwise, short-term prospects for
yield gains in irrigated agriculture
appear grim without increased yield
potential.
Reducing the gap between average
and potential yields is critical.

2010 Tied with 2005 for
Warmest Year on Record
• The two years differed by less than 0.018 degrees Fahrenheit.• The difference is smaller than the uncertainty in comparing the temperatures of recent years, putting them into a statistical tie.• In the new analysis, the next warmest years are 1998, 2002, 2003, 2006, 2007 and 2009, which are statistically tied for third
warmest year.• The analysis found 2010 approximately 1.13°F warmer than the average global surface temperature from 1951 to 1980.• The temperature trend, including data from 2010, shows the climate has warmed by approximately 0.36°F per decade since the
late 1970s.• The analysis produced at GISS is compiled from weather data from more than 1000 meteorological stations around the world,
satellite observations of sea surface temperature and Antarctic research station measurements.• The record temperature in 2010 is particularly noteworthy, because the last half of the year was marked by a transition to strong
La Niña conditions, which bring cool sea surface temperatures to the eastern tropical Pacific Ocean.

Lobell et al., 2011
Efforts to anticipate how climate change will affect future food availability can benefit from understanding the impacts of changes to date.
Here we show that in the cropping regions and growing seasons of most countries, with the important exception of the United States, temperature trends for 1980-2008 exceeded one standard deviation of historic year-to-year variability.
Models that link yields of the four largest commodity crops to weather indicate that global maize and wheat production declined by 3.8% and 5.5%, respectively, compared to a counterfactual without climate trends.
For soybeans and rice, winners and losers largely balanced out. Climate trends were large enough in some countries to offset a significant portion of the increases in average yields that arose from technology, CO2 fertilization, and other factors.
Fig. 3. Estimated net impact of climate trends for 1980-2008on crop yields for major producers and for global production. Values are expressed as percent of average yield. Gray bars show median estimate and error bars show 5-95% confidence interval from bootstrap resampling with 500 replicates. Red and blue dots show median estimate of impact for T trend and P trend, respectively.
Effects of
Temperature Trends
on Crops

Earlier Emergence of Insects
In a six-decade long
study at a biological
research station in
Spain, increasing
earlier time of first
appearance for the
honey bee, cabbage
white butterfly, potato
beetle and olive fly were
found.
Gordon and Sanz, 2005; Gutierrez et al., 2010
12

Yield Effects with CO2, rainfed wheat
CSIRO A1B (DSSAT)
Potential changes (%) in national cereal yields for the 2050s (compared with 1990)
under the HadCM3 SRES A2a scenario with and without CO2 effects (DSSAT)
Parry et al., 2004
IFPRI 2011
13
Projected Yield Changes 2050s
Parry et al. -30% to +20%
IFPRI -25% to +25%
GAEZ -32% to +19%
GAEZ IIASA 2009 rain-fed cereals Hadley A2
North America -7 to -1%; Europe -4 to 3;
Central Asia 14-19%; Southern Africa -32 to -29
Schlenker & Lobel Africa multi GCMs
-22 to -2% statistical approach
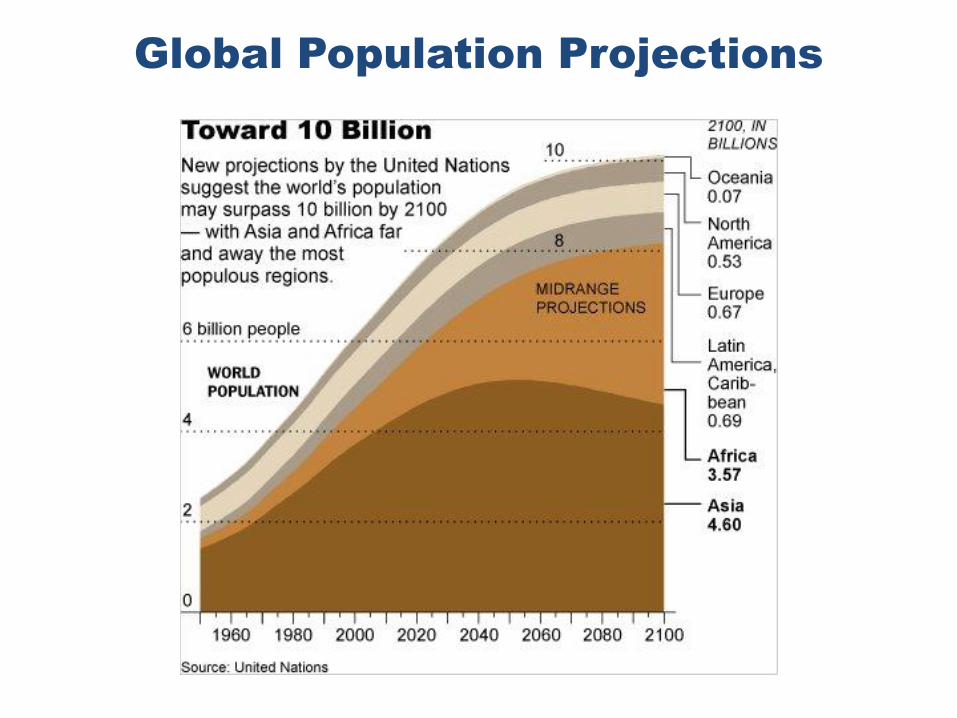
Global Population Projections

Howden 2010
Managing Risks to
the Global Agricultural System
Progressive Levels of Adaptation
Challenges and Opportunities
15

The Agricultural Model Intercomparison and Improvement Project (AgMIP)
Cynthia Rosenzweig, NASA Goddard Institute for Space Studies
Jim Jones, University of Florida
Jerry Hatfield, USDA Agricultural Research Service, Ames, IA
and the AgMIP Leadership Team
AgMIP Kick-off Workshop
October 28-30, 2010
Website, forum, and list-serve at
http://www.agmip.org 16

AgMIP Elements and Linkages
17

• Agricultural risks, food security and climate change– How will climate affect agriculture across major agricultural regions?
– Many studies assume declining food prices
– Recent food crises and extreme events question this assumption
• Consistent approach needed to enable agricultural sector analysis across relevant scales and disciplines– Great demand for assessment of model capabilities and uncertainties
– Build transdisciplinary community
Why AgMIP?
18Source: FAO
(2)
(2)
(57)
(49)
(22)
(25)
(5)
no data
less than -30%
-30 to - 10 %
-10 to 0%
0 to 10%
10 to 30%
more than 30%
Percent of change in yield
Based upon Rosenzweig and Parry, 1994

AgMIP Objectives • Improve scientific and adaptive capacity of major agricultural regions
in developing and developed world
• Collaborate with regional experts in agronomy, economics, and climate to build strong basis for applied simulations addressing key regional questions
• Develop framework to identify and prioritize regional adaptation strategies
• Incorporate crop and agricultural trade model improvements in coordinated assessment of future climate conditions
• Include multiple models, scenarios, locations, crops and participants to explore uncertainty and the impact of methodological choices
• Understand roles of land use and mitigation
• Link to key on-going efforts– CGIAR/ESSP, CCAFS, Global Futures, MOSAICC, IPCC AR5, others
19

Track 1: Model Inter-comparison and ImprovementTrack 2: Coordinated Future Scenario Simulations
AgMIP Cross-Cutting Themes Agricultural Pathways, Uncertainties, and Aggregation
AgMIP Two-Track Science Approach
20

• Model IntercomparisonProtocols
• Representative Agricultural Pathways linked to IPCC SES
• Set of consistent climate/crop model inputs for economic models
• Consistent multi-model results for integrated estimates of climate change effects on agriculture andfood security
• IT databases, interface
• Documented model improvements
• Research results on uncertainty, scaling, simulation of CO2 effects, regional assessments, global assessment
• Framework for extensions to grazing/livestock, water, pests and diseases, etc.
AgMIP Products
21
Timing: Contributions to AR5 WGII Continuing process

• Pilot Studies for crop modeling and climate scenarios– Wheat pilot
– Pilot intercomparison of weather generator methodologies
– CORDEX pilot for South African agriculture
– IT case studies and pilot database tools
• Annual Regional Workshops and Global Workshop– Brazil (Campinas; Aug 1-5, 2011), North America, Europe, Sub-Saharan
Africa, South Asia, China, Australia
– Conduct simulations according to AgMIP protocols
– Global Workshop just prior to ASA annual meeting
(San Antonio, October 13-15, 2011)
• Economic Model Intercomparison and Improvement– Global agricultural economic models and Integrated Assessment Models
– Following representative agricultural pathways
– Utilizing AgMIP regional crop model results
• Fast-track Global Assessment for IPCC AR5– France pilot study for regional aggregation
– Develop Representative Agricultural Pathways
– Test uncertainty analysis methods
Next Steps for AgMIP
22

23
Agricultural Risk Management
Conclusions 2008
• The world food crisis may be the harbinger of how climate change effects will be realized in agriculture, i.e., as one of multiple stresses (aka ‘the perfect storm’) that comes together to cause significant widespread problems.
• Rapid adoption of mitigation programs may bring unintended consequences. We must do better!
• Stationary is dead. Warming trends and trends in extremes are the new ‘normal.’
• Increasing production this year is critical: helping agsector/farmers to use climate information more effectively is an urgent challenge right now.
• We still need to improve projections of long-term risk.

24
Agricultural Risk Management
Conclusions 2011
• The recurring world food crisis may be the harbinger of how climate change effects will be realized in agriculture, i.e., as one of multiple stresses (aka ‘the perfect storm’) that comes together to cause significant widespread problems.
• Rapid adoption of mitigation programs may bring brought
unintended consequences. We must do better!• Stationary is continues to be dead. Warming trends and
trends in extremes are the new ‘normal.’• Increasing production this year is critical: helping ag
sector/farmers to use climate information more effectively is an urgent challenge right now. Still true!
• We still need to AgMIP is working to improve projections of long-term risk.

AgMIP
Goal is to entrain additional participants, regions, crops, and models in a continuing process
If interested in participating,Contact Cynthia Rosenzweig, Jim Jones, Jerry Hatfield,
[email protected]@ufl.edu
Alex Ruane, [email protected]
www.agmip.org 25

26