Integration of Ecosystem Services - UF/IFAS...
25
Transcript of Integration of Ecosystem Services - UF/IFAS...
Integration of Ecosystem Services
into a Decision Support Framework
Mark Judson, CEO
Environmental Monitoring Sensor Intelligence Corp (EIM SENSOR)12801 Worldgate Drive, Suite 500
Herndon, Virginia 20170
(703) 232-7111
http://eimsensor.com
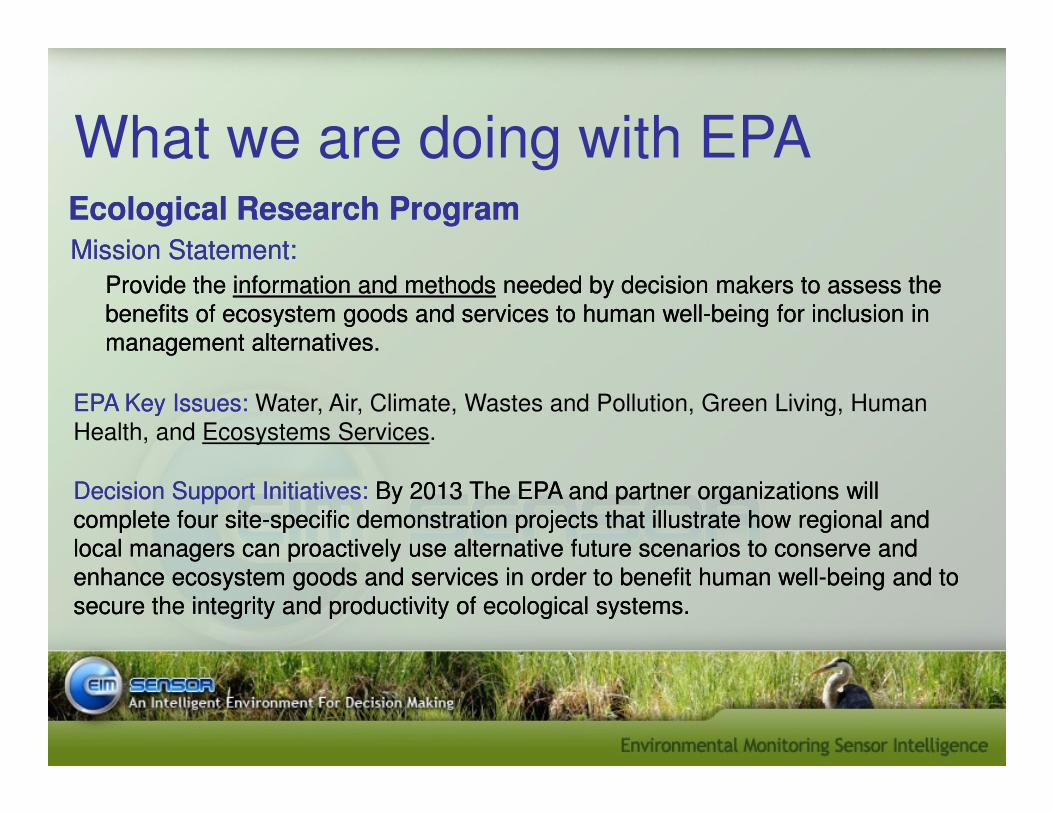
What we are doing with EPA
Mission Statement:Mission Statement:
Provide the Provide the information and methodsinformation and methods needed by decision makers to assess the needed by decision makers to assess the
benefits of ecosystem goods and services to human wellbenefits of ecosystem goods and services to human well--being for inclusion in being for inclusion in
management alternatives.management alternatives.
EPA Key Issues: EPA Key Issues: Water, Air, Climate, Wastes and Pollution, Green Living, Human
Ecological Research ProgramEcological Research Program
EPA Key Issues: EPA Key Issues: Water, Air, Climate, Wastes and Pollution, Green Living, Human
Health, and Ecosystems Services.
Decision Support Initiatives: Decision Support Initiatives: By 2013 The EPA and partner organizations will By 2013 The EPA and partner organizations will
complete four sitecomplete four site--specific demonstration projects that illustrate how regional and specific demonstration projects that illustrate how regional and
local managers can proactively use alternative future scenarios to conserve and local managers can proactively use alternative future scenarios to conserve and
enhance ecosystem goods and services in order to benefit human wellenhance ecosystem goods and services in order to benefit human well--being and to being and to
secure the integrity and productivity of ecological systems.secure the integrity and productivity of ecological systems.
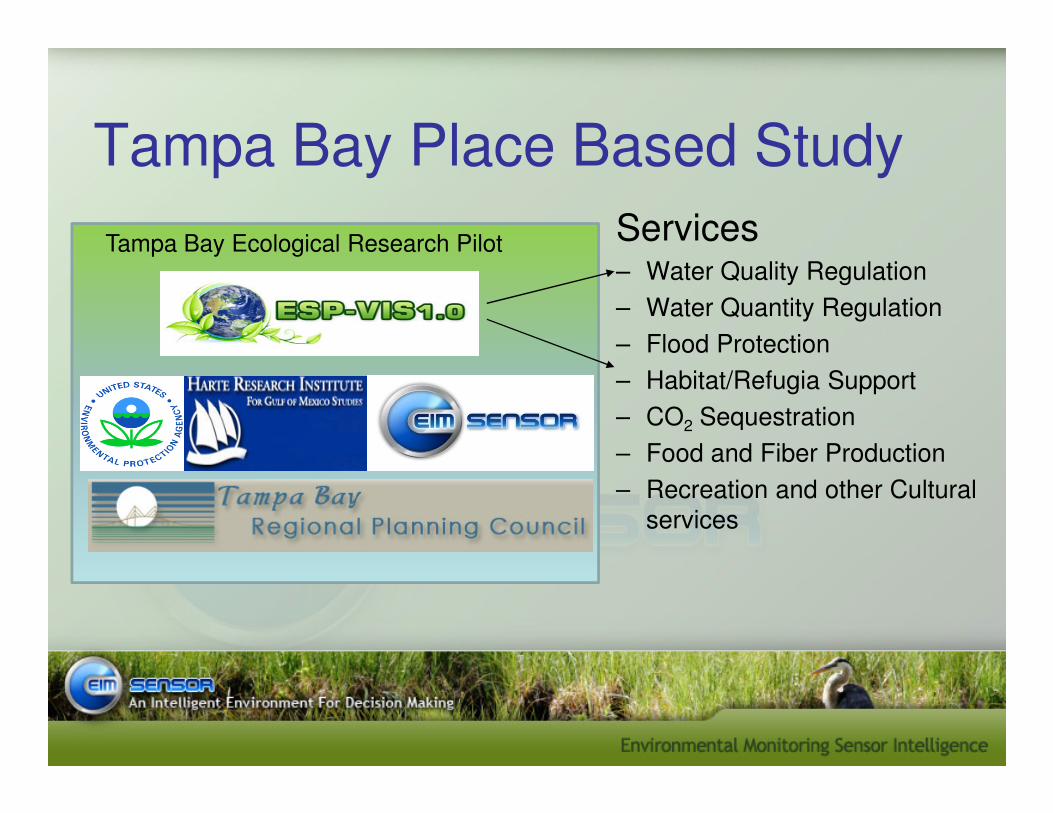
Tampa Bay Place Based Study
Services– Water Quality Regulation
– Water Quantity Regulation
– Flood Protection
– Habitat/Refugia Support
– CO Sequestration
Tampa Bay Ecological Research Pilot
– CO2 Sequestration
– Food and Fiber Production
– Recreation and other Cultural
services
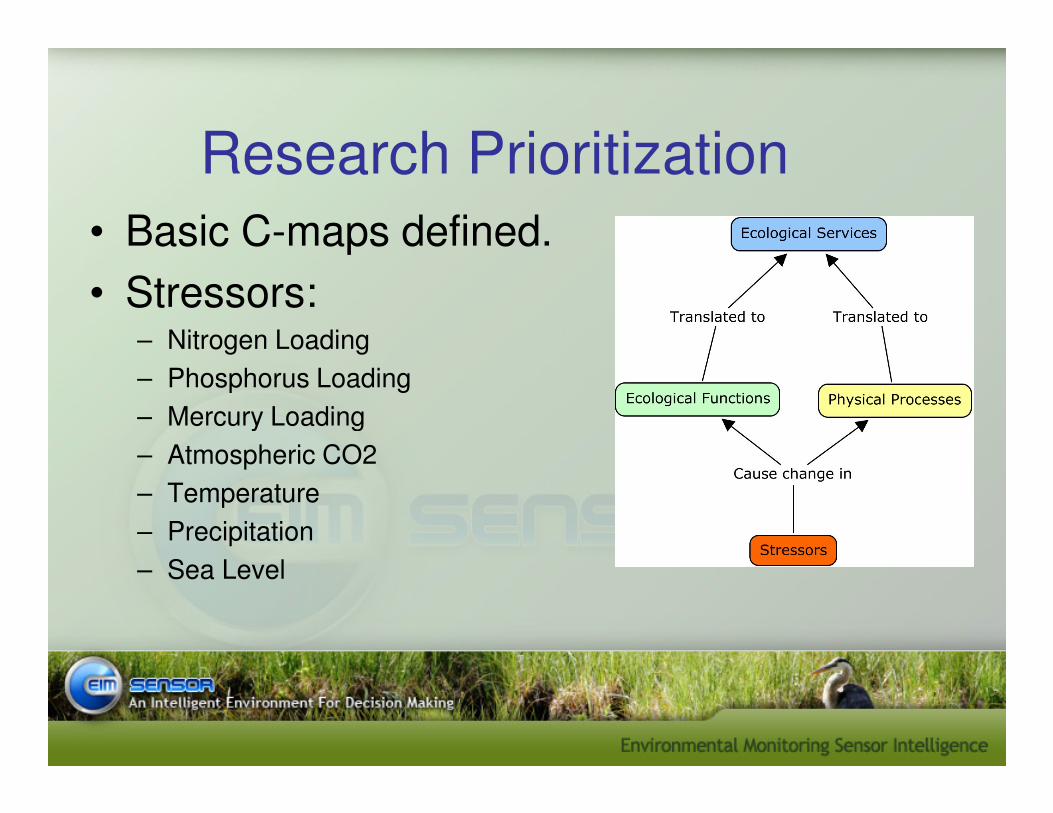
Research Prioritization
• Basic C-maps defined.
• Stressors:– Nitrogen Loading
– Phosphorus Loading
– Mercury Loading– Mercury Loading
– Atmospheric CO2
– Temperature
– Precipitation
– Sea Level
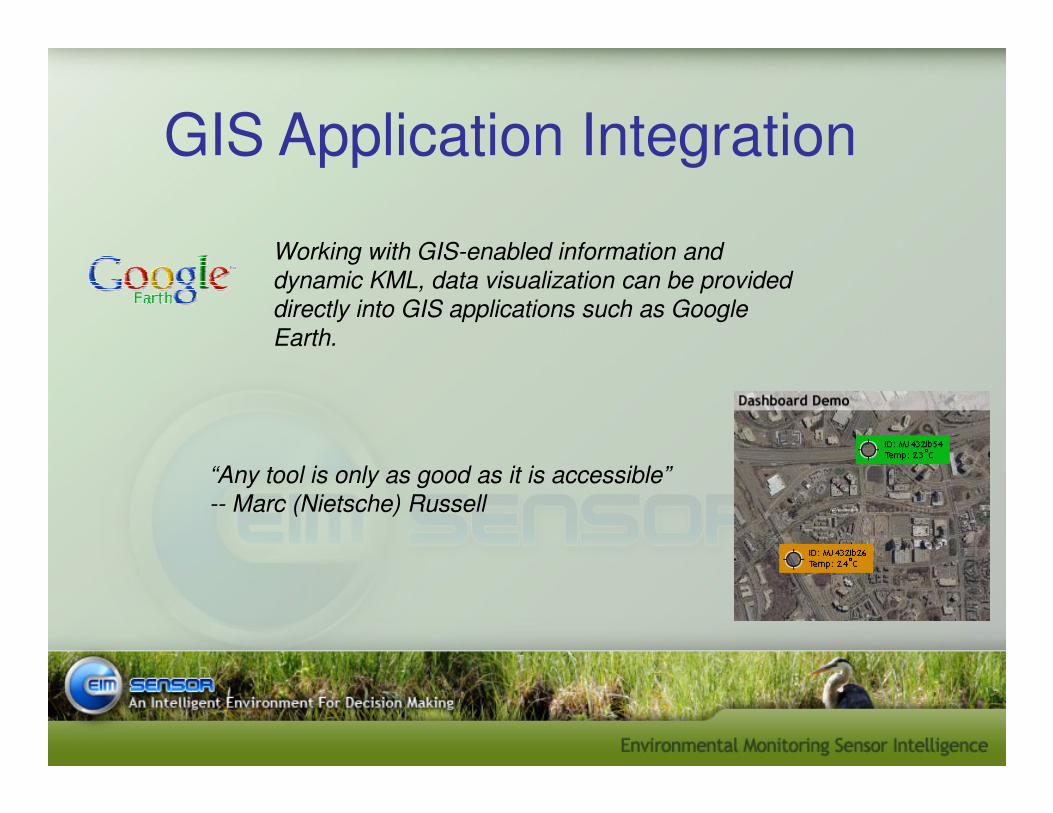
GIS Application Integration
Working with GIS-enabled information and
dynamic KML, data visualization can be provided
directly into GIS applications such as Google
Earth.
“Any tool is only as good as it is accessible”
-- Marc (Nietsche) Russell
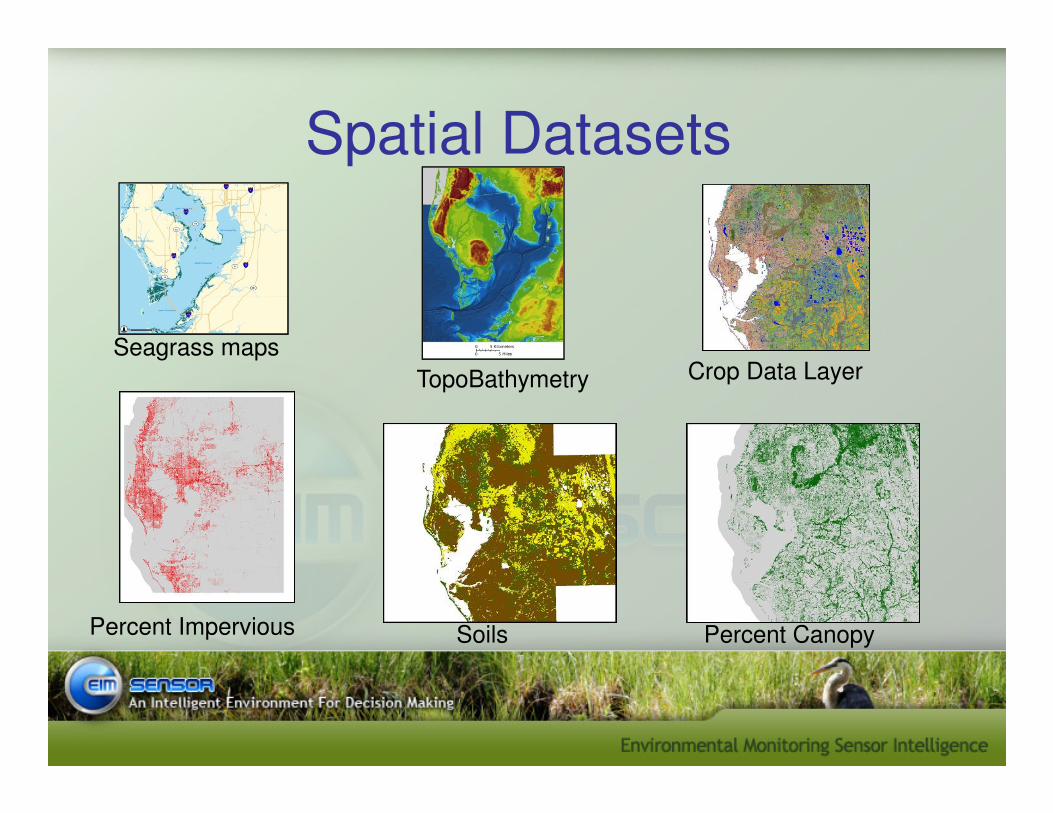
Spatial Datasets
Seagrass maps
TopoBathymetry Crop Data Layer
Percent Impervious Percent CanopySoils
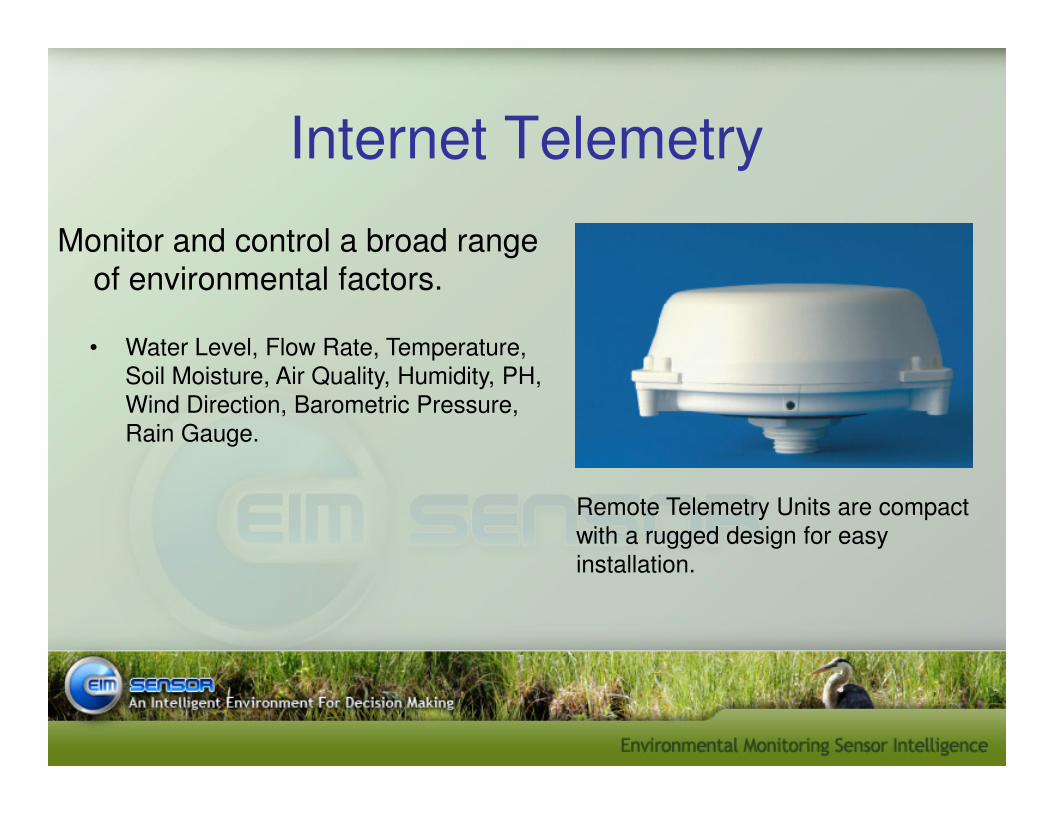
Internet Telemetry
Monitor and control a broad range
of environmental factors.
• Water Level, Flow Rate, Temperature,
Soil Moisture, Air Quality, Humidity, PH,
Wind Direction, Barometric Pressure, Wind Direction, Barometric Pressure,
Rain Gauge.
Remote Telemetry Units are compact
with a rugged design for easy
installation.
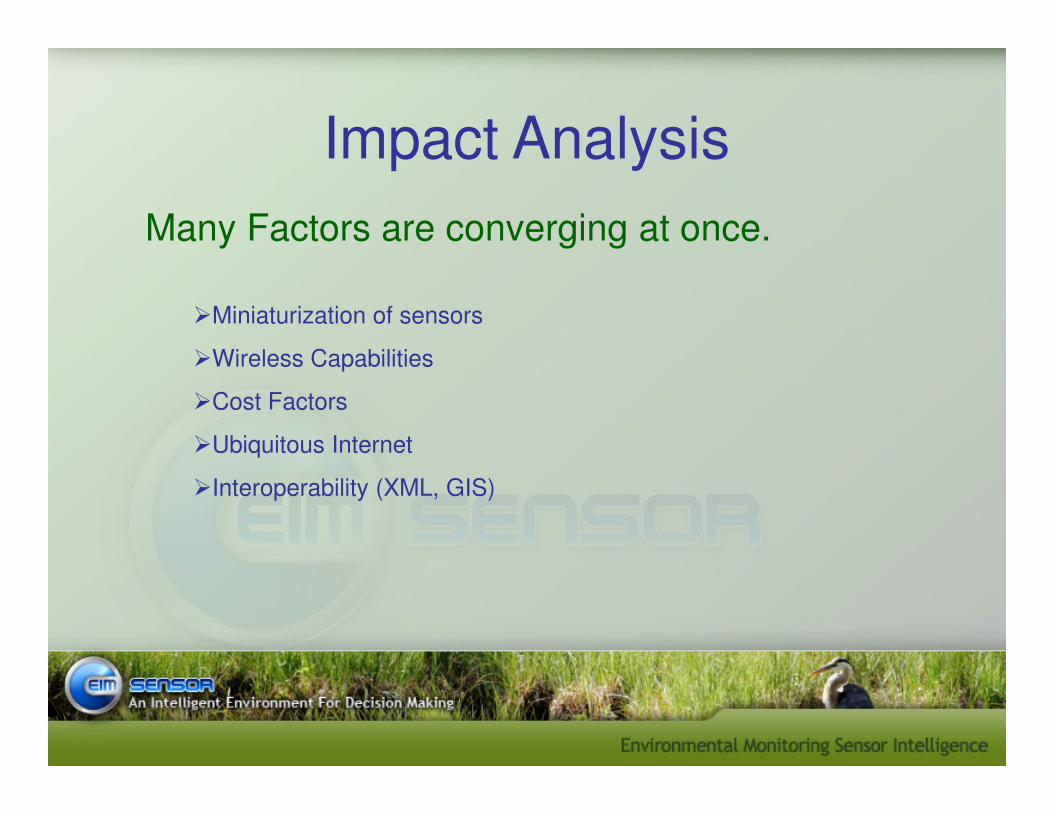
Impact Analysis
Many Factors are converging at once.
�Miniaturization of sensors
�Wireless Capabilities
�Cost Factors�Cost Factors
�Ubiquitous Internet
�Interoperability (XML, GIS)
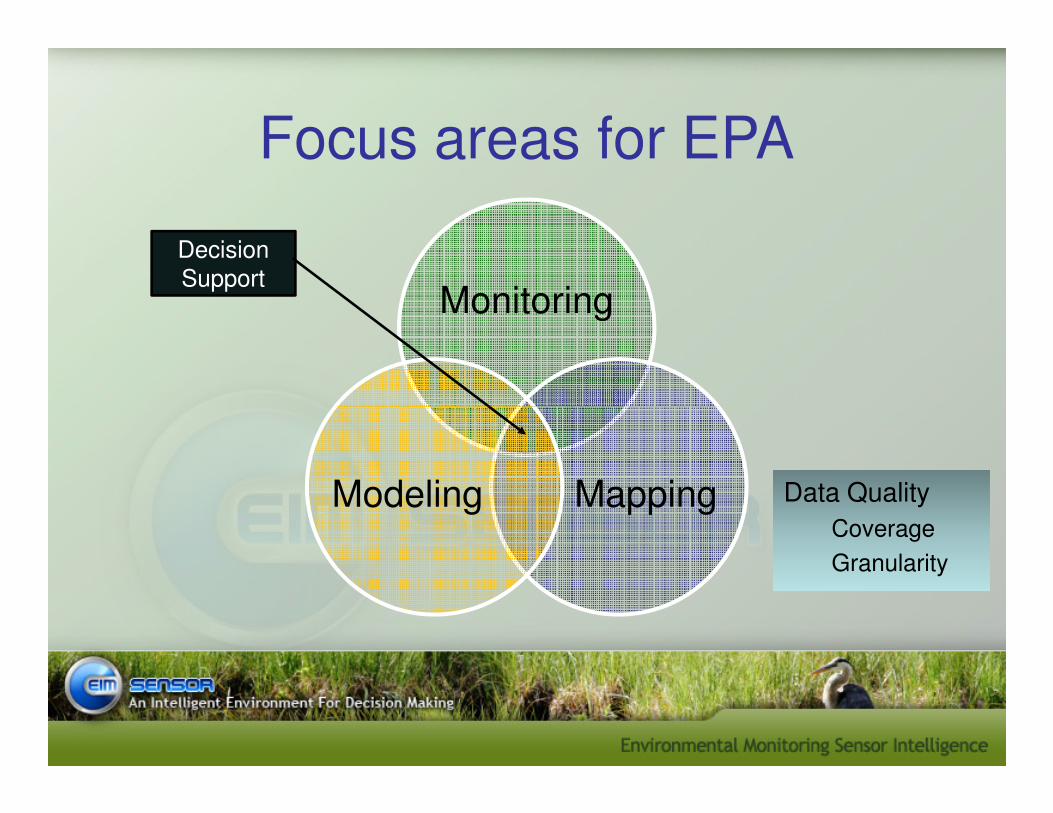
Focus areas for EPA
Monitoring
Decision
Support
Data Quality
Coverage
Granularity
MappingModeling
In other words…
We must tie the Maps, Models and Monitoring into a common framework
This is NOT AN EASY TASK!
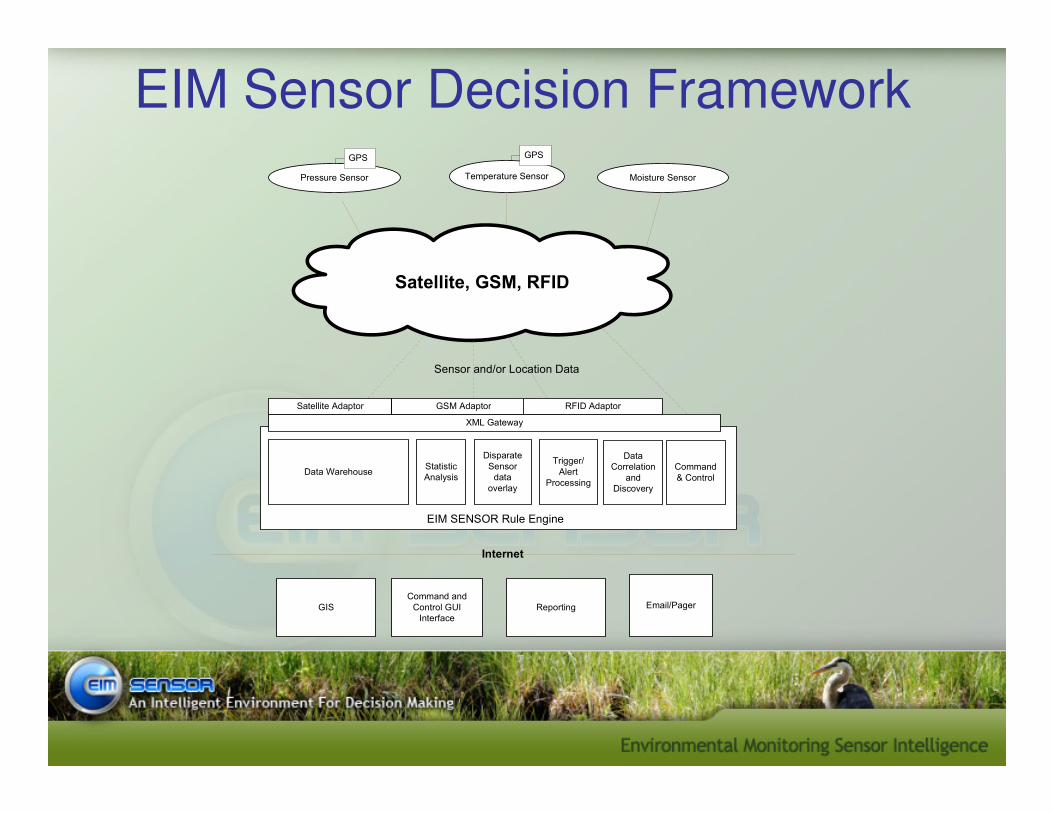
EIM Sensor Decision Framework
Pressure Sensor Temperature Sensor Moisture Sensor
Satellite, GSM, RFID
GPS GPS
Satellite Adaptor GSM Adaptor RFID Adaptor
Sensor and/or Location Data
GIS Reporting
Command and
Control GUI
Interface
Data WarehouseStatistic
Analysis
Disparate
Sensor
data
overlay
Trigger/
Alert
Processing
EIM SENSOR Rule Engine
Data
Correlation
and
Discovery
Command
& Control
Satellite Adaptor GSM Adaptor RFID Adaptor
XML Gateway
Internet
Email/Pager
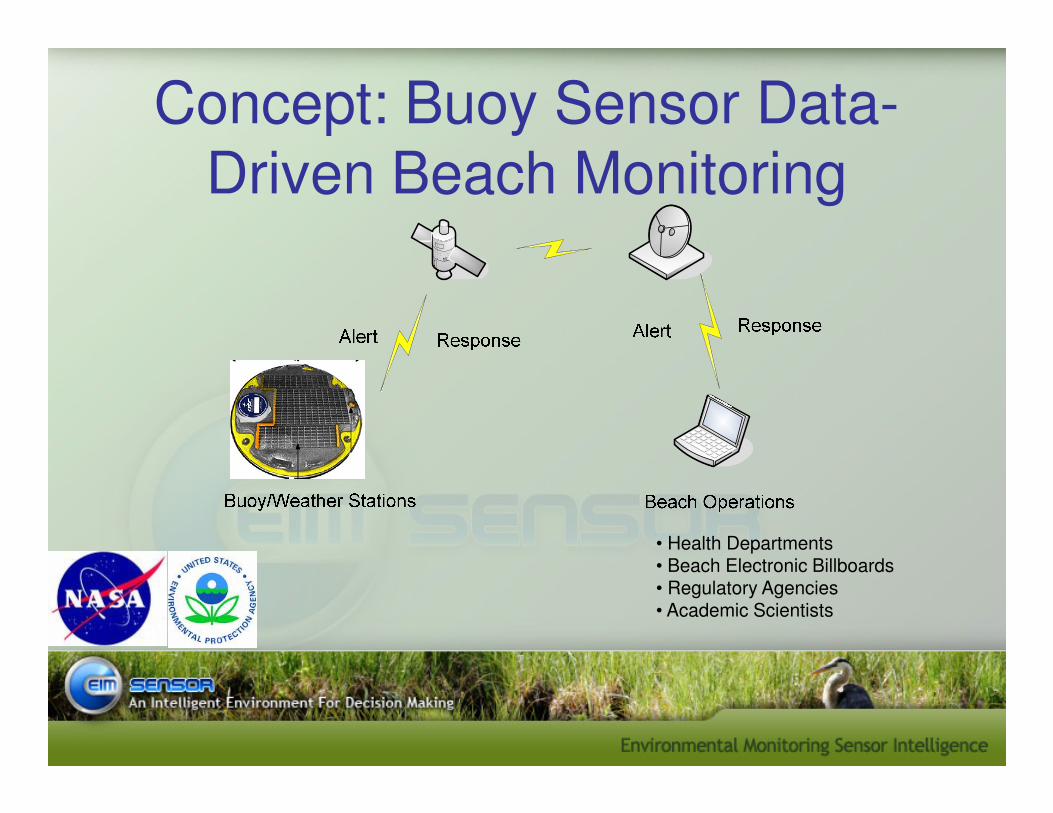
Concept: Buoy Sensor Data-
Driven Beach Monitoring
• Health Departments• Beach Electronic Billboards• Regulatory Agencies• Academic Scientists
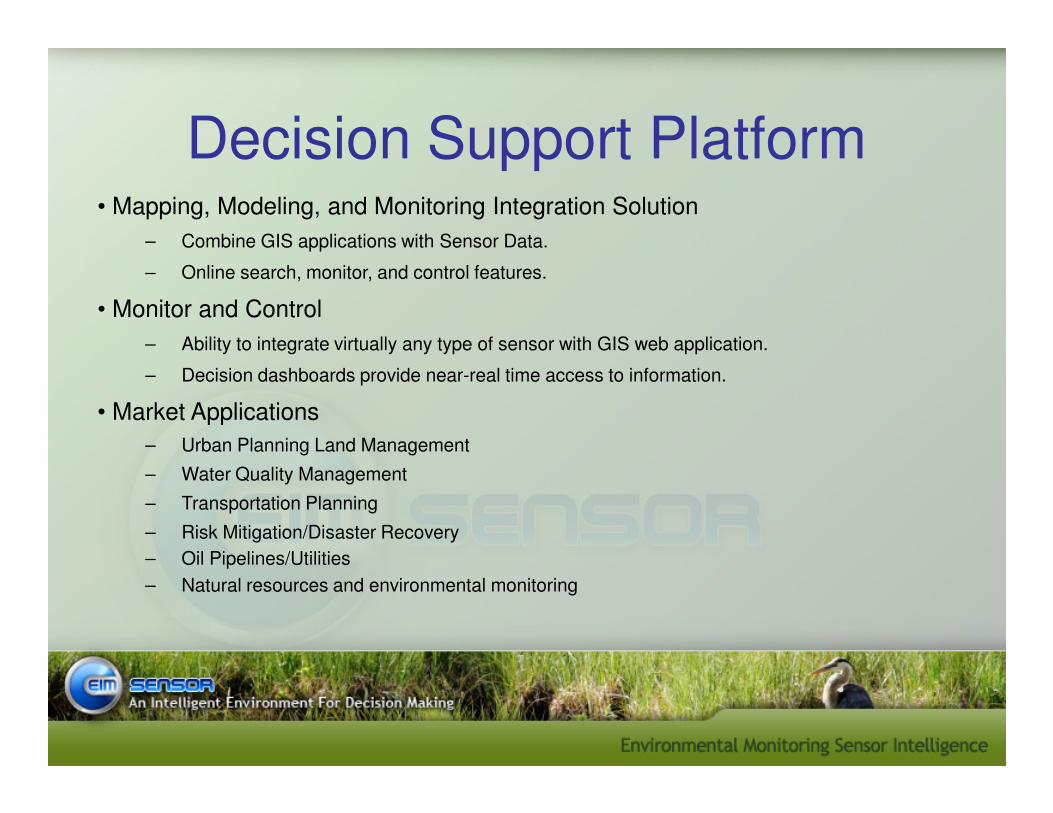
Decision Support Platform• Mapping, Modeling, and Monitoring Integration Solution
– Combine GIS applications with Sensor Data.
– Online search, monitor, and control features.
• Monitor and Control
– Ability to integrate virtually any type of sensor with GIS web application.
– Decision dashboards provide near-real time access to information.
• Market Applications• Market Applications
– Urban Planning Land Management
– Water Quality Management
– Transportation Planning
– Risk Mitigation/Disaster Recovery
– Oil Pipelines/Utilities
– Natural resources and environmental monitoring
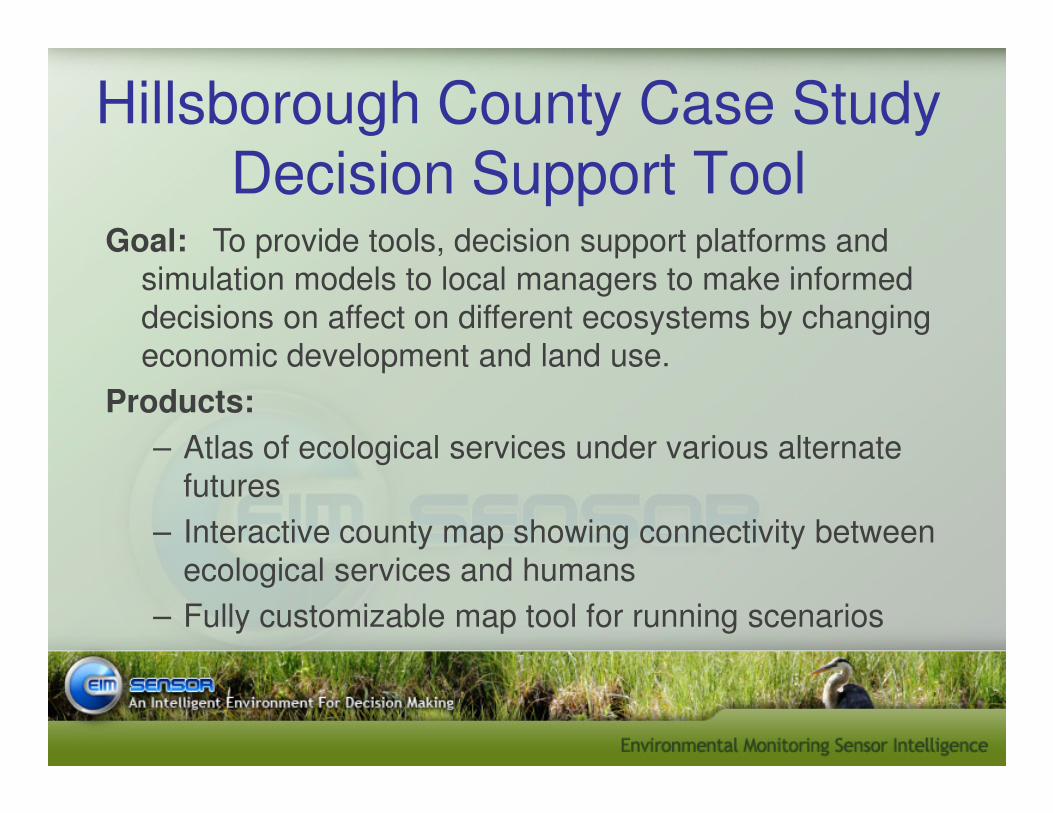
Hillsborough County Case Study
Decision Support ToolGoal: To provide tools, decision support platforms and
simulation models to local managers to make informed
decisions on affect on different ecosystems by changing
economic development and land use.
Products:Products:
– Atlas of ecological services under various alternate
futures
– Interactive county map showing connectivity between
ecological services and humans
– Fully customizable map tool for running scenarios
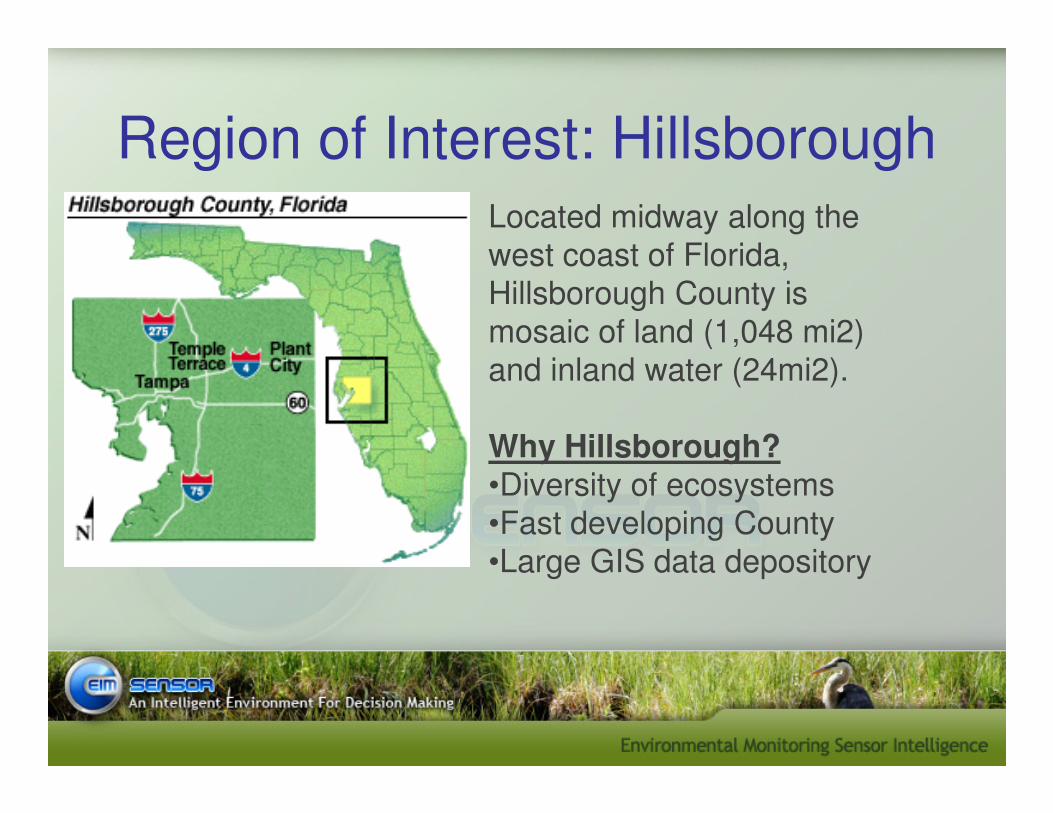
Region of Interest: HillsboroughLocated midway along the
west coast of Florida,
Hillsborough County is
mosaic of land (1,048 mi2)
and inland water (24mi2).
Why Hillsborough?•Diversity of ecosystems
•Fast developing County
•Large GIS data depository
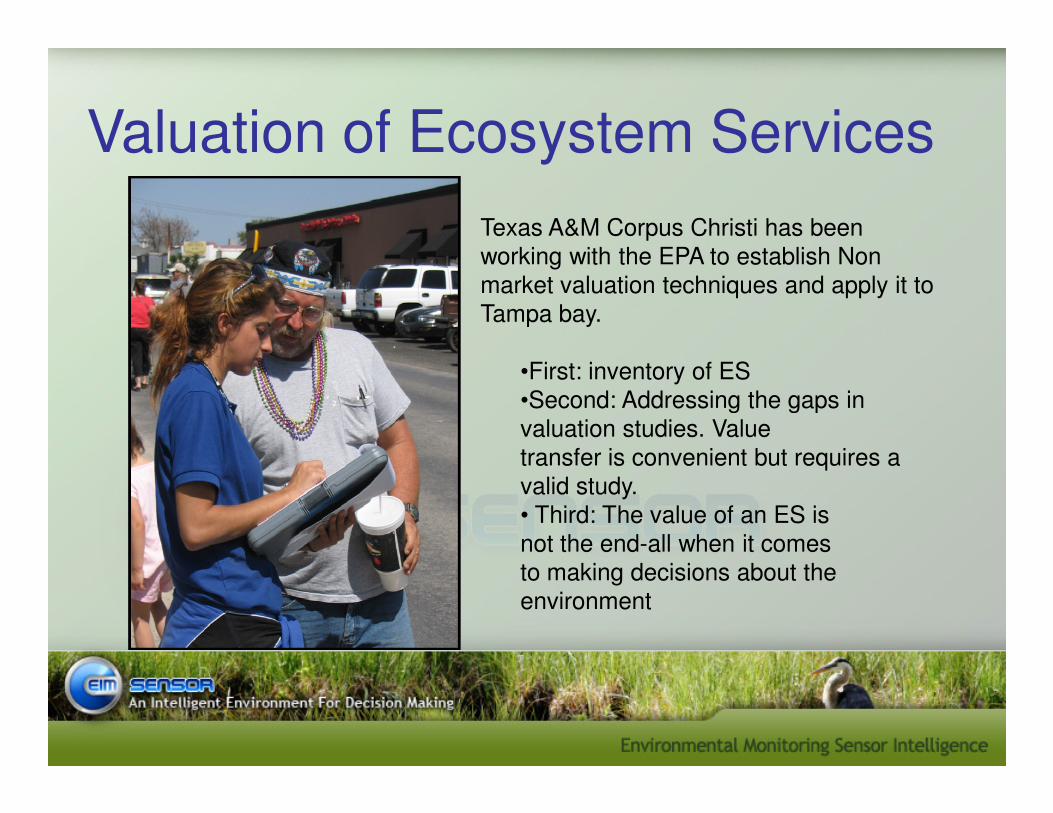
Valuation of Ecosystem Services
Texas A&M Corpus Christi has been
working with the EPA to establish Non
market valuation techniques and apply it to
Tampa bay.
•First: inventory of ES
•Second: Addressing the gaps in•Second: Addressing the gaps in
valuation studies. Value
transfer is convenient but requires a
valid study.
• Third: The value of an ES is
not the end-all when it comes
to making decisions about the
environment
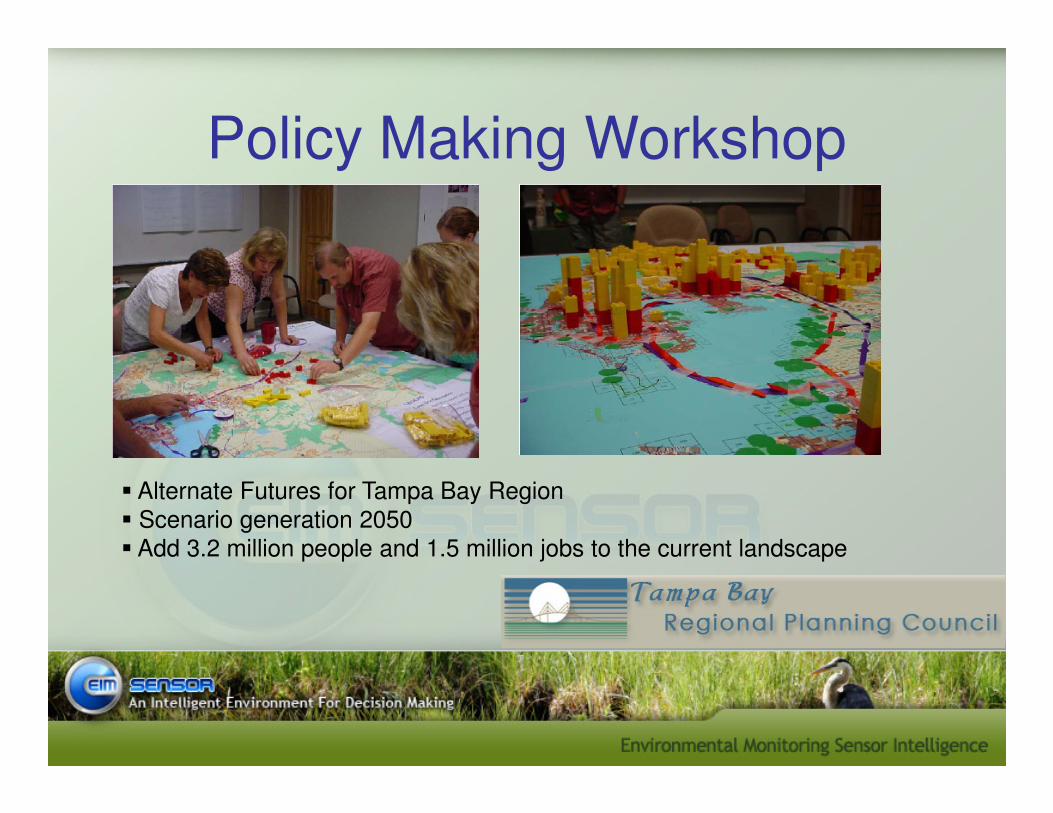
Policy Making Workshop
� Alternate Futures for Tampa Bay Region
� Scenario generation 2050
� Add 3.2 million people and 1.5 million jobs to the current landscape
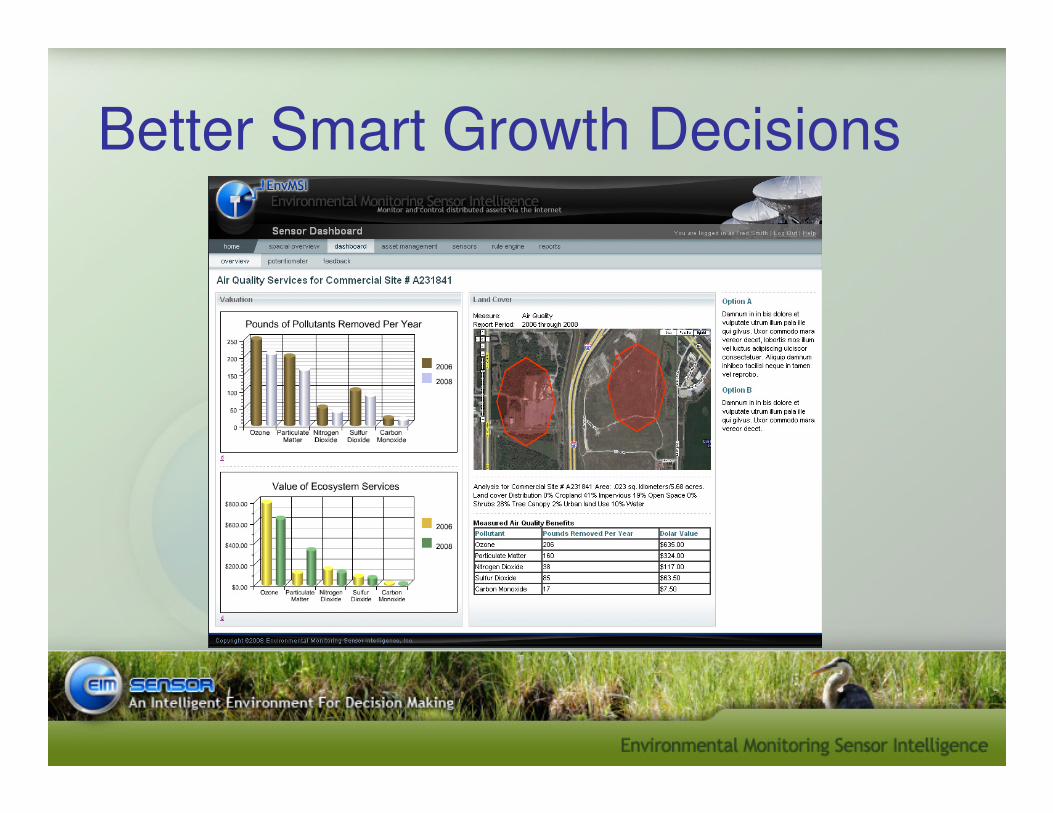
Better Smart Growth Decisions
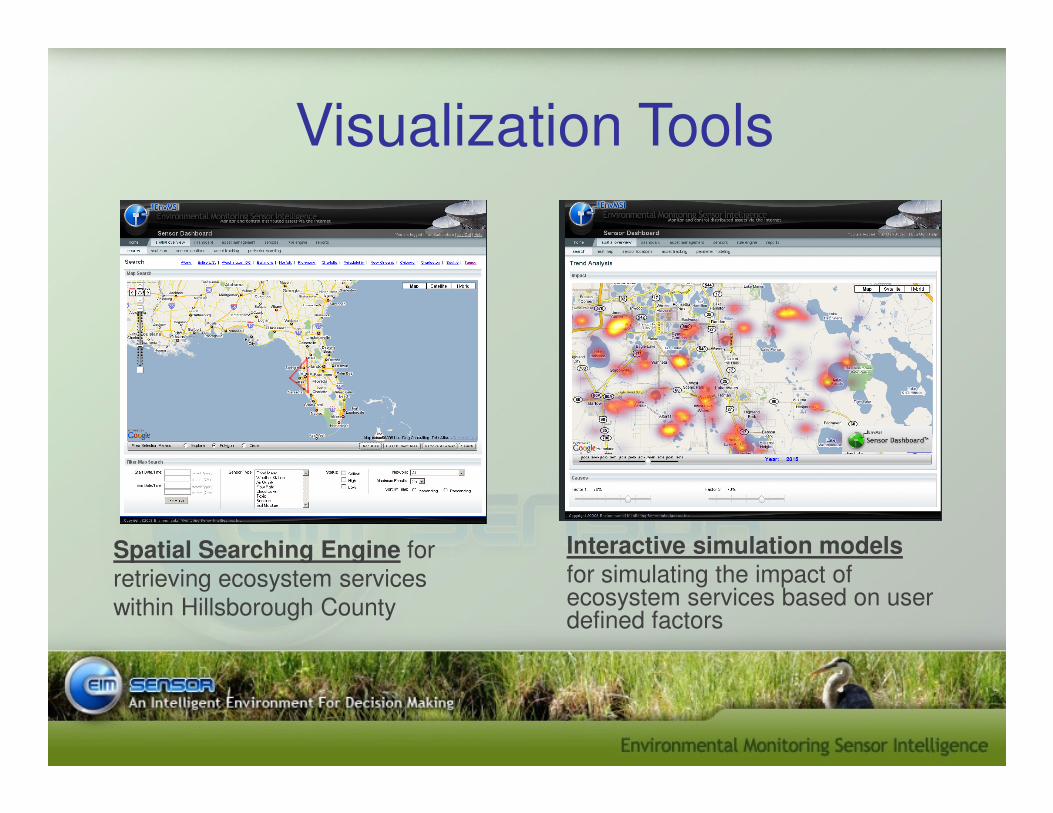
Visualization Tools
Spatial Searching Engine for
retrieving ecosystem services
within Hillsborough County
Interactive simulation modelsfor simulating the impact of ecosystem services based on user defined factors
Acknowlegements
�Working Team:
•EIM Sensor �Barney, Petrova, Gustafson, Yang, Garrett
•Gulf Ecology Division�Russell, Dantin, Devereux, Genthner, Harvey, Lewis, Nestlerode,
and Raimondo
•Gulf of Mexico Program•Gulf of Mexico Program�Hayes
•Texas A&M Corpus Christi�Yoskowitz
�Tampa Bay Steering Committee:•Headed by Tampa Bay Estuary Program of Tampa Bay.

Questions and Answers

Back-up Slides
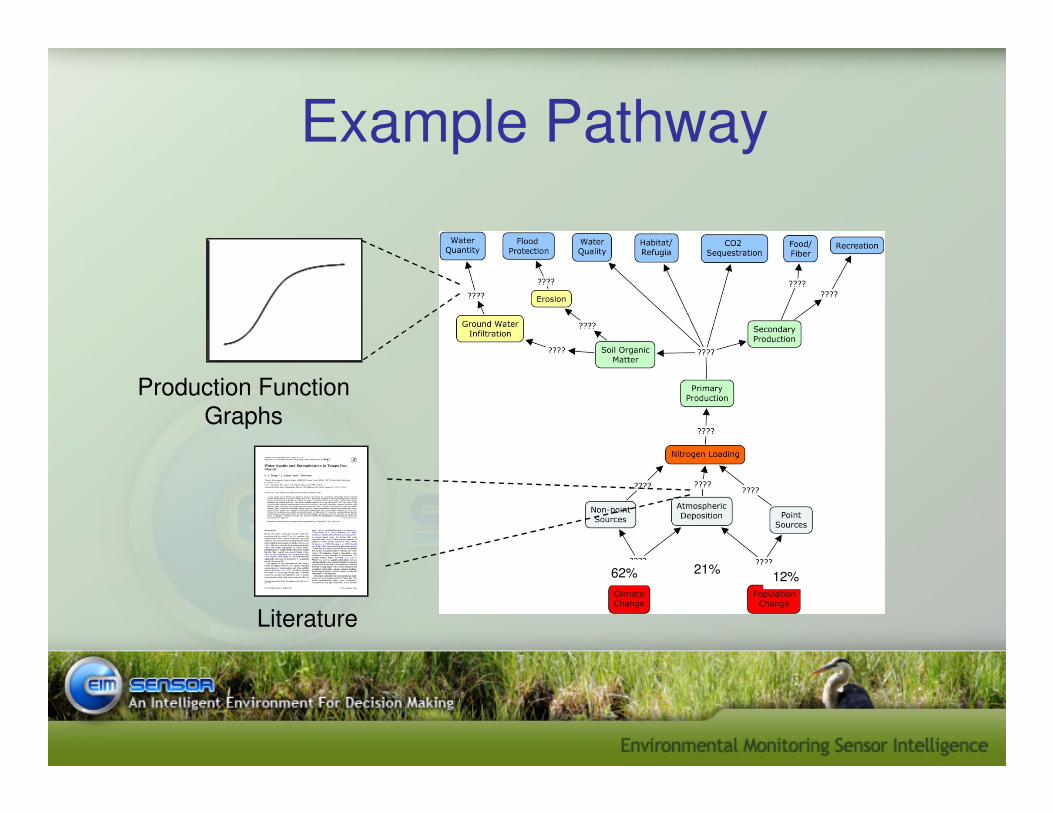
Example Pathway
Production Function
GraphsGraphs
Literature
12%21%62%
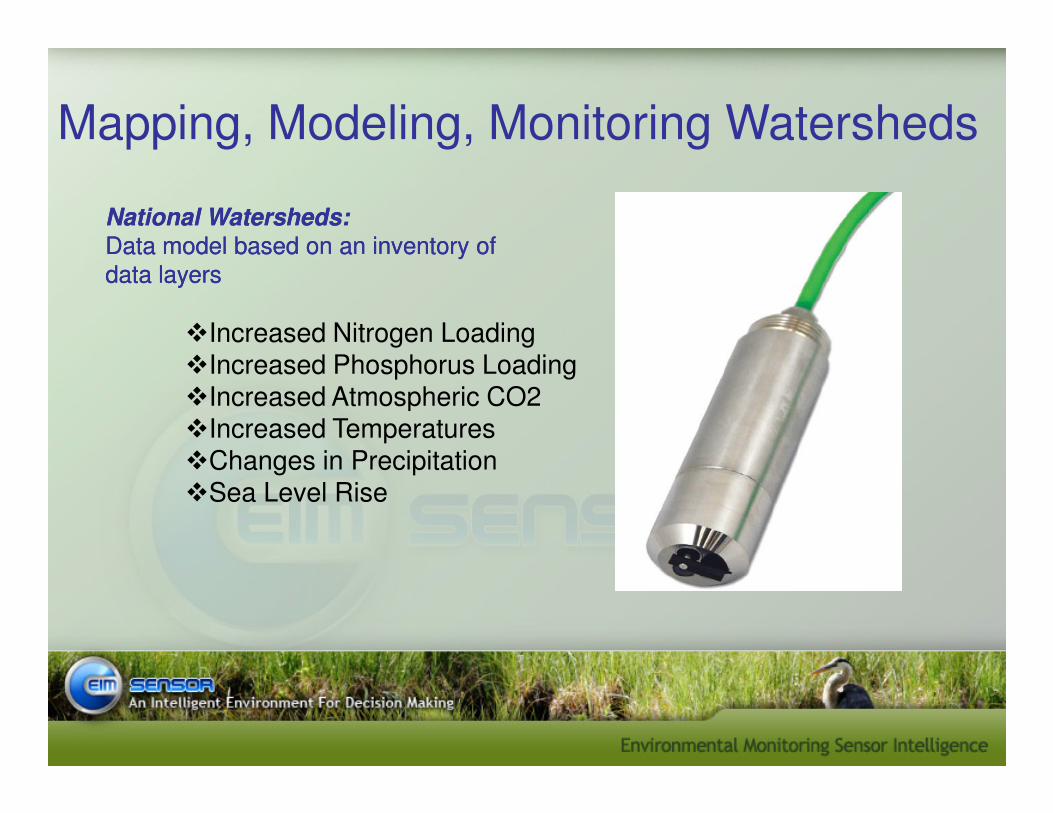
National National Watersheds:Watersheds:
Data model based on an inventory of Data model based on an inventory of
data layersdata layers
Mapping, Modeling, Monitoring Watersheds
�Increased Nitrogen Loading�Increased Phosphorus Loading�Increased Atmospheric CO2�Increased Atmospheric CO2�Increased Temperatures�Changes in Precipitation�Sea Level Rise