Biochemistry Vitamins 1. Water soluble vitamins 2. Fat soluble vitamins

Agilent Application Solution
Analysis of water-soluble vitamins from multivitamin tablets fornutrition labeling
Abstract
In this Application Note we describe an application solution to carry out qualitative
and quantitative analysis of water soluble vitamins. We developed a single and robust
reverse phase high performance liquid chromatographic (RP-HPLC) method for simul-
taneous determination of 10 different vitamins unlike a number of different traditional
methods which quantify the components individually. Separation and quantification
was achieved by an Agilent 1260 Infinity LC system using an Agilent Poroshell EC-C18
column. Detection was carried out in the range of 200 to 640 nm using a photodiode
array detector (DAD). As each vitamin has a different absorbance maximum, eight
separate wavelengths were selected for acquisition. This method has been partially
validated and was found to be appropriate to perform routine nutrition labeling analy-
sis for multivitamin tablets. The limit of detection (LOD), limit of quantitation (LOQ)
and linearity of each vitamin were established. The method was effectively trans-
ferred to a short Ultra High Pressure Liquid Chromatographic (UHPLC) method using
an Agilent 1290 Infinity LC system with the help of the Agilent Method Translator.
Author
Siji Joseph,
Agilent Technologies, Inc.
Bangalore, India
Application Note
Food
0 2.5 5 7.5 10 12.5 15 17.5 min
mAU
0
200400
600
800
1000 DAD1 A, Sig=205DAD1 C, Sig=220DAD1 E, Sig=266
min0 0.25 0.5 0.75 1 1.25 1.5 1.75
mAU
0
100
200
300
400
Agilent 1260 Infinity LC
Agilent 1290 Infinity LC
2
IntroductionVitamins are a range of small organicmolecules which are vital nutrientsrequired in trace levels and have specific roles to maintain normal healthand growth. As these vitamins are notsynthesized naturally in human body abalanced diet is mandatory to keep theamount of vitamins at the requiredlevel. However, at times dietary habitscan create a deficiency of these vita-mins. For these conditions, multivita-mins tablets are available in the marketfor the adequate supply of vitamins.However, as the lack of vitamins cre-ates illness; vitamins in excess levelsare also equally harmful to health.Labeling the vitamins in these multivita-min tablets is a mandatory requirementby The Food and Drug Administration(FDA). This clearly emphasizes theimportance of having efficient assaymethods to quantify vitamins towardsthe fulfillment FDA nutrition labelingrequirements.
Several different traditional analyticalmethods are available for individual vit-amins or for a small group of vitamins.Most of these methods involve tedious,long sample preparation and are nonspecific. Simultaneous reliable analysisof multiple vitamins is challenging,because of their differences in chemicalproperties. Wide range of concentra-tions from lower micrograms to highermilligrams of vitamins in vitamin sup-plements makes the task even morechallenging. Stability, matrix complexityand solubility issues of some vitaminsare additional bottlenecks.
• Agilent 1290 Infinity HighPerformance Autosampler (G4226A)
• Agilent 1290 Infinity ThermostattedColumn Compartment (G1316C)
• Agilent 1290 Infinity Diode ArrayDetector (G4212A) with Max-Lightflow cell (1.0 µL volume, 10 mm pathlength) (G4212-60008)
• Poroshell 120 EC-C18 columns withinternal diameters of 2.1 mm andlengths of 75 mm,packed with 2.7-µm particles (p/n 697775-902)
Both systems were controlled using theAgilent ChemStation B.04.02.
Reagents and materialsAll the chemicals and solvents usedwere HPLC grade and highly purifiedwater from a Milli Q water purificationsystem (Millipore Elix 10 model, USA)was used. Acetonitrile ‘gradient grade’was purchased from Lab-Scan(Bangkok, Thailand) and dibasic potas-sium phosphate was purchased fromFluka (Germany). O-Phosphoric acidwas purchased from Fluka (Switzerland)and sodium hydroxide was purchasedfrom Sigma (Germany). Standards ofascorbic acid (C), nicotinic acid (B3),calcium pantothenate (B5), pyridoxine(B6), niacinamide (B3), thiamine (B),folic acid(B9), biotin(B7),cyanocobal-amine (B12), and riboflavin (B2) werepurchased from Aldrich (India).
Here, we describe an approximatelly 20 minute long, single, reliable, robustmethod for the simultaneous determi-nation of 10 water soluble vitaminswith UV detection.
MethodInstruments and SoftwareAn Agilent 1260 Infinity LC System con-sisting of the following modules wasused:
• Agilent 1260 Series QuaternaryPump and Vacuum Degasser(G1311B)
• Agilent 1260 Series High-Performance Autosampler (G1367E)
• Agilent 1260 Series ThermostattedColumn Compartment (G1316C)
• Agilent 1260 Series Diode ArrayDetector (G4212B) with Max-Lightflow cell (60 mm path length)(G4212-60007)
• Poroshell 120 EC-C18 column 3.0 mm × 150 mm, 2.7 µm(p/n 693975-302)
• The UHPLC analysis was developedand performed using the Agilent1290 Infinity LC system,
• Agilent 1290 Infinity Binary Pumpwith integrated vacuum degasser(G4220 A) and 100 µL Jet Weavermixer
3
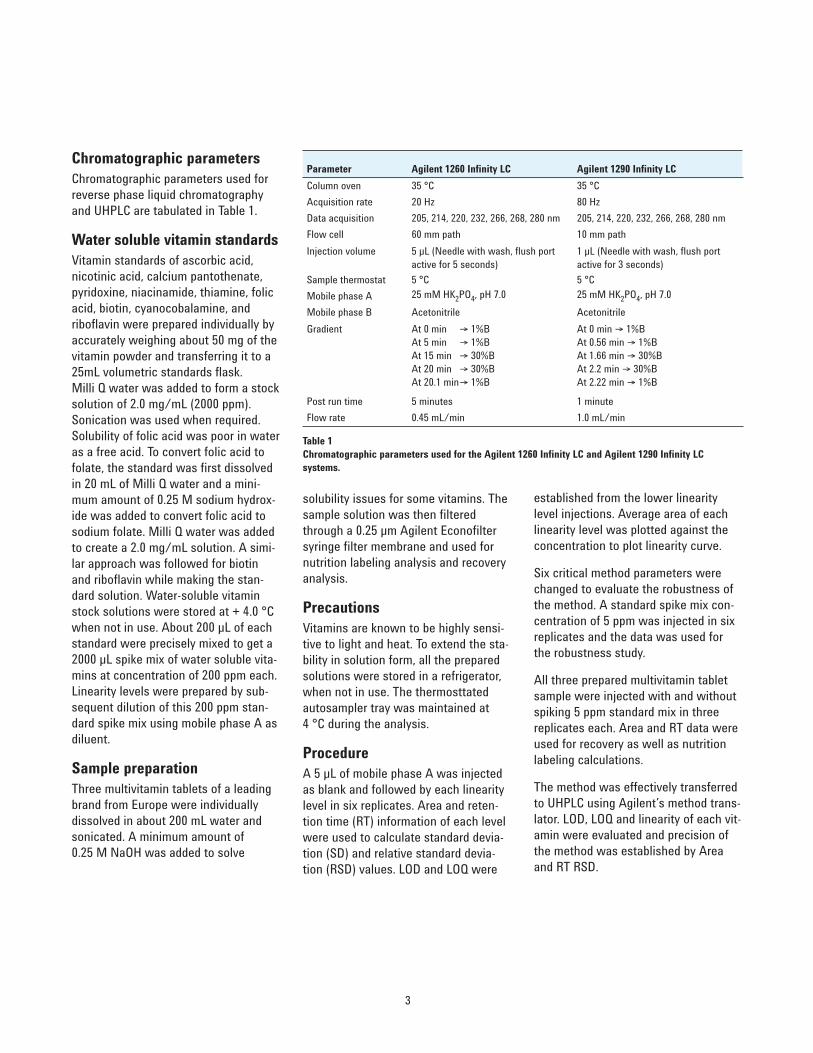
Chromatographic parametersChromatographic parameters used forreverse phase liquid chromatographyand UHPLC are tabulated in Table 1.
Water soluble vitamin standardsVitamin standards of ascorbic acid,nicotinic acid, calcium pantothenate,pyridoxine, niacinamide, thiamine, folicacid, biotin, cyanocobalamine, andriboflavin were prepared individually byaccurately weighing about 50 mg of thevitamin powder and transferring it to a25mL volumetric standards flask. Milli Q water was added to form a stocksolution of 2.0 mg/mL (2000 ppm).Sonication was used when required.Solubility of folic acid was poor in wateras a free acid. To convert folic acid tofolate, the standard was first dissolvedin 20 mL of Milli Q water and a mini-mum amount of 0.25 M sodium hydrox-ide was added to convert folic acid tosodium folate. Milli Q water was addedto create a 2.0 mg/mL solution. A simi-lar approach was followed for biotinand riboflavin while making the stan-dard solution. Water-soluble vitaminstock solutions were stored at + 4.0 °Cwhen not in use. About 200 µL of eachstandard were precisely mixed to get a 2000 µL spike mix of water soluble vita-mins at concentration of 200 ppm each.Linearity levels were prepared by sub-sequent dilution of this 200 ppm stan-dard spike mix using mobile phase A asdiluent.
Sample preparationThree multivitamin tablets of a leadingbrand from Europe were individuallydissolved in about 200 mL water andsonicated. A minimum amount of 0.25 M NaOH was added to solve
Parameter Agilent 1260 Infinity LC Agilent 1290 Infinity LC
Column oven 35 °C 35 °C
Acquisition rate 20 Hz 80 Hz
Data acquisition 205, 214, 220, 232, 266, 268, 280 nm 205, 214, 220, 232, 266, 268, 280 nm
Flow cell 60 mm path 10 mm path
Injection volume 5 µL (Needle with wash, flush portactive for 5 seconds)
1 µL (Needle with wash, flush portactive for 3 seconds)
Sample thermostat 5 °C 5 °C
Mobile phase A 25 mM HK2PO4, pH 7.0 25 mM HK2PO4, pH 7.0
Mobile phase B Acetonitrile Acetonitrile
Gradient At 0 min & 1%BAt 5 min & 1%BAt 15 min & 30%BAt 20 min & 30%BAt 20.1 min& 1%B
At 0 min & 1%BAt 0.56 min & 1%BAt 1.66 min & 30%BAt 2.2 min & 30%BAt 2.22 min & 1%B
Post run time 5 minutes 1 minute
Flow rate 0.45 mL/min 1.0 mL/min
Table 1Chromatographic parameters used for the Agilent 1260 Infinity LC and Agilent 1290 Infinity LC systems.
solubility issues for some vitamins. Thesample solution was then filteredthrough a 0.25 µm Agilent Econofiltersyringe filter membrane and used fornutrition labeling analysis and recoveryanalysis.
PrecautionsVitamins are known to be highly sensi-tive to light and heat. To extend the sta-bility in solution form, all the preparedsolutions were stored in a refrigerator,when not in use. The thermosttatedautosampler tray was maintained at 4 °C during the analysis.
ProcedureA 5 µL of mobile phase A was injectedas blank and followed by each linearitylevel in six replicates. Area and reten-tion time (RT) information of each levelwere used to calculate standard devia-tion (SD) and relative standard devia-tion (RSD) values. LOD and LOQ were
established from the lower linearitylevel injections. Average area of eachlinearity level was plotted against theconcentration to plot linearity curve.
Six critical method parameters werechanged to evaluate the robustness ofthe method. A standard spike mix con-centration of 5 ppm was injected in sixreplicates and the data was used forthe robustness study.
All three prepared multivitamin tabletsample were injected with and withoutspiking 5 ppm standard mix in threereplicates each. Area and RT data wereused for recovery as well as nutritionlabeling calculations.
The method was effectively transferredto UHPLC using Agilent’s method trans-lator. LOD, LOQ and linearity of each vit-amin were evaluated and precision ofthe method was established by Areaand RT RSD.
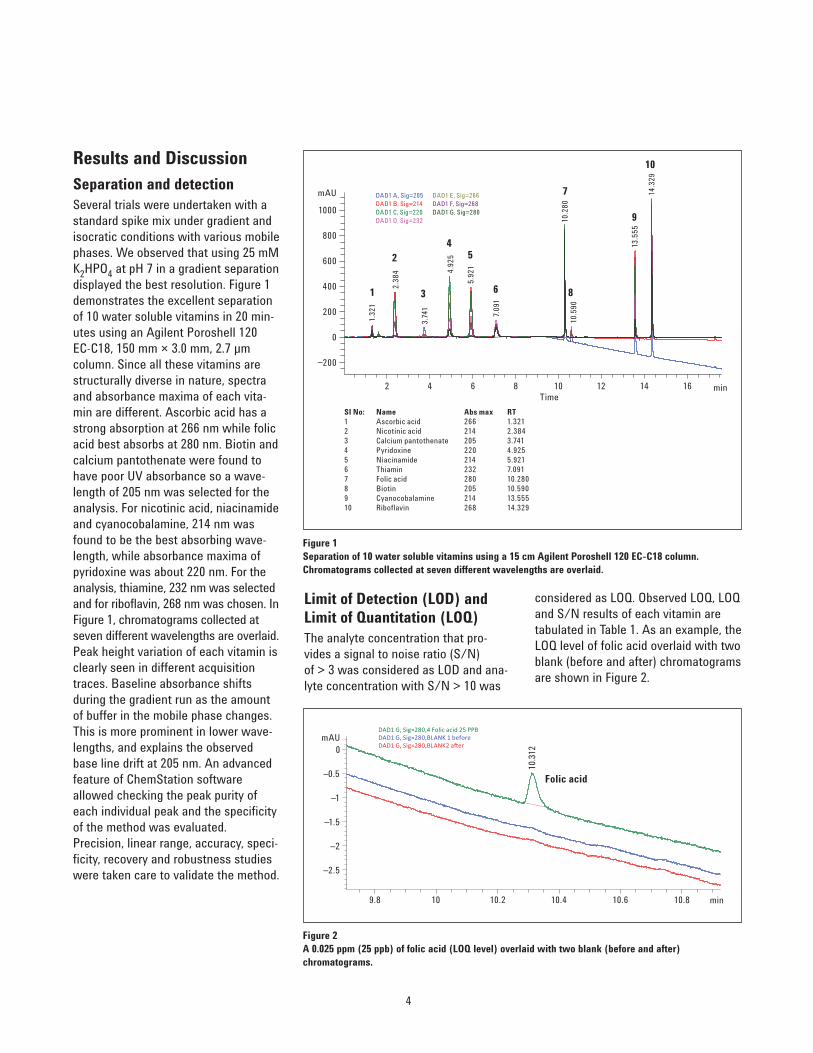
Limit of Detection (LOD) andLimit of Quantitation (LOQ) The analyte concentration that pro-vides a signal to noise ratio (S/N) of > 3 was considered as LOD and ana-lyte concentration with S/N > 10 was
considered as LOQ. Observed LOQ, LOQand S/N results of each vitamin aretabulated in Table 1. As an example, theLOQ level of folic acid overlaid with twoblank (before and after) chromatogramsare shown in Figure 2.
Results and DiscussionSeparation and detectionSeveral trials were undertaken with astandard spike mix under gradient andisocratic conditions with various mobilephases. We observed that using 25 mMK2HPO4 at pH 7 in a gradient separationdisplayed the best resolution. Figure 1demonstrates the excellent separationof 10 water soluble vitamins in 20 min-utes using an Agilent Poroshell 120 EC-C18, 150 mm × 3.0 mm, 2.7 µm column. Since all these vitamins arestructurally diverse in nature, spectraand absorbance maxima of each vita-min are different. Ascorbic acid has astrong absorption at 266 nm while folicacid best absorbs at 280 nm. Biotin andcalcium pantothenate were found tohave poor UV absorbance so a wave-length of 205 nm was selected for theanalysis. For nicotinic acid, niacinamideand cyanocobalamine, 214 nm wasfound to be the best absorbing wave-length, while absorbance maxima ofpyridoxine was about 220 nm. For theanalysis, thiamine, 232 nm was selectedand for riboflavin, 268 nm was chosen. InFigure 1, chromatograms collected atseven different wavelengths are overlaid.Peak height variation of each vitamin isclearly seen in different acquisitiontraces. Baseline absorbance shiftsduring the gradient run as the amountof buffer in the mobile phase changes.This is more prominent in lower wave-lengths, and explains the observedbase line drift at 205 nm. An advancedfeature of ChemStation softwareallowed checking the peak purity ofeach individual peak and the specificityof the method was evaluated.Precision, linear range, accuracy, speci-ficity, recovery and robustness studieswere taken care to validate the method.
4
SI No: Name Abs max RT1 Ascorbic acid 266 1.3212 Nicotinic acid 214 2.3843 Calcium pantothenate 205 3.7414 Pyridoxine 220 4.9255 Niacinamide 214 5.9216 Thiamin 232 7.0917 Folic acid 280 10.2808 Biotin 205 10.5909 Cyanocobalamine 214 13.55510 Riboflavin 268 14.329
min2 4 6 8 10 12 14 16
mAU
_200
0
200
400
600
800
1000
DAD1 A, Sig=205DAD1 B, Sig=214DAD1 C, Sig=220DAD1 D, Sig=232
DAD1 E, Sig=266DAD1 F, Sig=268DAD1 G, Sig=280
3.74
1
10.5
90
2.38
4
5.92
1
13.5
55
4.92
5
7.09
1
1.32
1
14.3
29
10.2
80
Time
1
2
3
45
6
7
8
9
10
Figure 1Separation of 10 water soluble vitamins using a 15 cm Agilent Poroshell 120 EC-C18 column.Chromatograms collected at seven different wavelengths are overlaid.
min9.8 10 10.2 10.4 10.6 10.8
_2.5
_2
_1.5
_1
_0.5
0
DAD1 G, Sig=280,BLANK 1 beforeDAD1 G, Sig=280,BLANK2 a!er
DAD1 G, Sig=280,4 Folic acid 25 PPB
10.3
12
Folic acid
mAU
Figure 2A 0.025 ppm (25 ppb) of folic acid (LOQ level) overlaid with two blank (before and after) chromatograms.
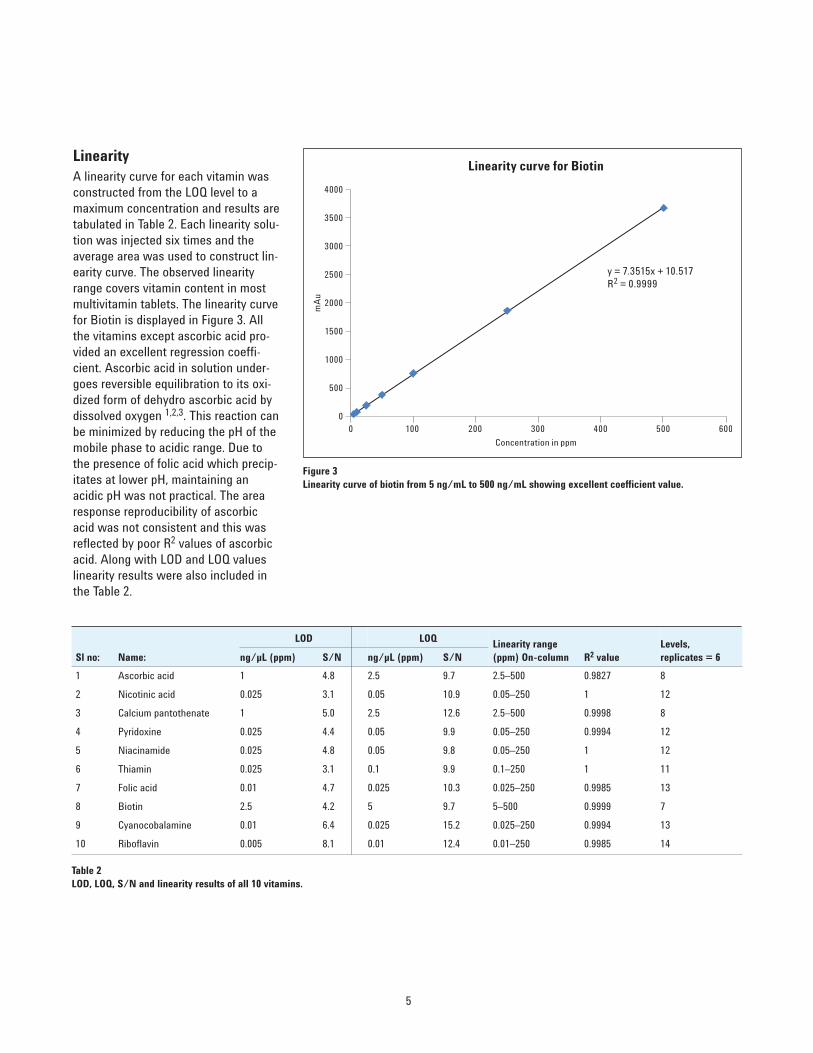
LinearityA linearity curve for each vitamin wasconstructed from the LOQ level to amaximum concentration and results aretabulated in Table 2. Each linearity solu-tion was injected six times and theaverage area was used to construct lin-earity curve. The observed linearityrange covers vitamin content in mostmultivitamin tablets. The linearity curvefor Biotin is displayed in Figure 3. Allthe vitamins except ascorbic acid pro-vided an excellent regression coeffi-cient. Ascorbic acid in solution under-goes reversible equilibration to its oxi-dized form of dehydro ascorbic acid bydissolved oxygen 1,2,3. This reaction canbe minimized by reducing the pH of themobile phase to acidic range. Due tothe presence of folic acid which precip-itates at lower pH, maintaining anacidic pH was not practical. The arearesponse reproducibility of ascorbicacid was not consistent and this wasreflected by poor R2 values of ascorbicacid. Along with LOD and LOQ valueslinearity results were also included inthe Table 2.
5
y = 7.3515x + 10.517R2 = 0.9999
0
500
1000
1500
2000
2500
3000
3500
4000
0 100 200 300 400 500 600
mA
u
Concentration in ppm
Linearity curve for Biotin
Figure 3Linearity curve of biotin from 5 ng/mL to 500 ng/mL showing excellent coefficient value.
Table 2LOD, LOQ, S/N and linearity results of all 10 vitamins.
Sl no: Name:
LOD LOQ Linearity range (ppm) On-column R2 value
Levels, replicates = 6 ng/µL (ppm) S/N ng/µL (ppm) S/N
1 Ascorbic acid 1 4.8 2.5 9.7 2.5–500 0.9827 8
2 Nicotinic acid 0.025 3.1 0.05 10.9 0.05–250 1 12
3 Calcium pantothenate 1 5.0 2.5 12.6 2.5–500 0.9998 8
4 Pyridoxine 0.025 4.4 0.05 9.9 0.05–250 0.9994 12
5 Niacinamide 0.025 4.8 0.05 9.8 0.05–250 1 12
6 Thiamin 0.025 3.1 0.1 9.9 0.1–250 1 11
7 Folic acid 0.01 4.7 0.025 10.3 0.025–250 0.9985 13
8 Biotin 2.5 4.2 5 9.7 5–500 0.9999 7
9 Cyanocobalamine 0.01 6.4 0.025 15.2 0.025–250 0.9994 13
10 Riboflavin 0.005 8.1 0.01 12.4 0.01–250 0.9985 14
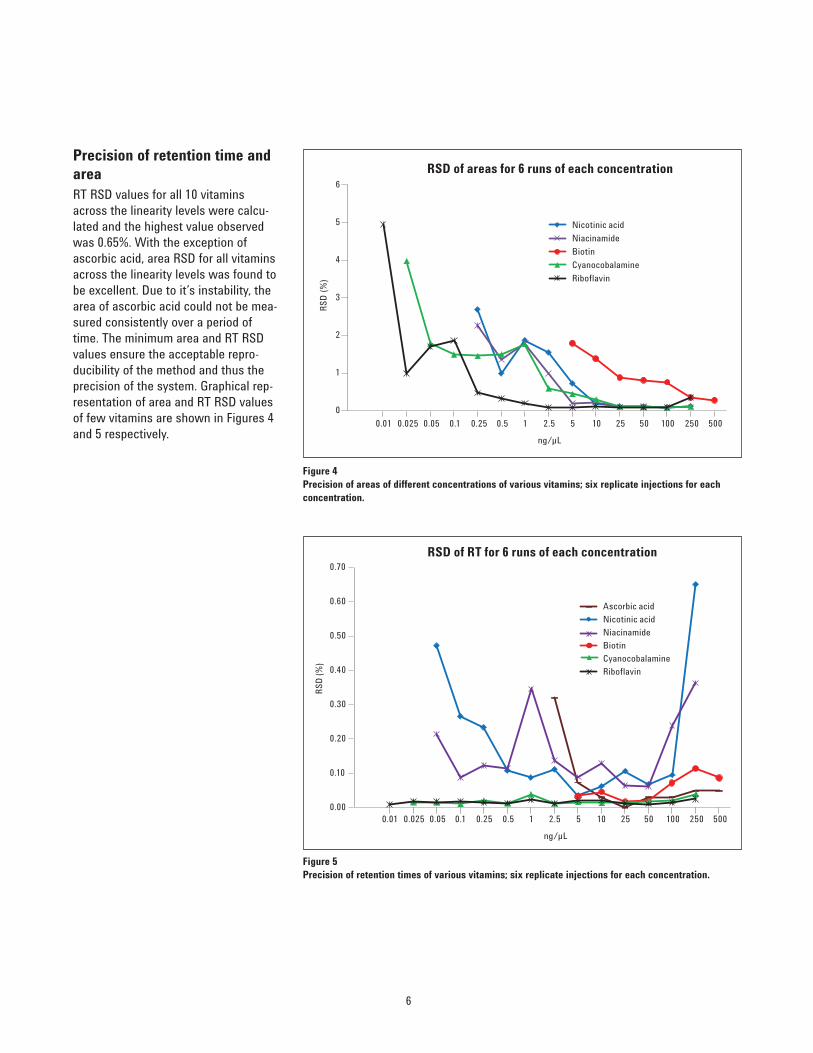
Precision of retention time andareaRT RSD values for all 10 vitaminsacross the linearity levels were calcu-lated and the highest value observedwas 0.65%. With the exception ofascorbic acid, area RSD for all vitaminsacross the linearity levels was found tobe excellent. Due to it’s instability, thearea of ascorbic acid could not be mea-sured consistently over a period oftime. The minimum area and RT RSDvalues ensure the acceptable repro-ducibility of the method and thus theprecision of the system. Graphical rep-resentation of area and RT RSD valuesof few vitamins are shown in Figures 4and 5 respectively.
6
ng/µL
0
1
2
3
4
5
6
0.01 0.025 0.05 0.1 0.25 0.5 1 2.5 5 10 25 50 100 250 500
RS
D (
%)
RSD of areas for 6 runs of each concentration
Nicotinic acid
Niacinamide
Biotin
Cyanocobalamine
Riboflavin
Figure 4Precision of areas of different concentrations of various vitamins; six replicate injections for each concentration.
ng/µL
0.01 0.025 0.05 0.1 0.25 0.5 1 2.5 5 10 25 50 100 250 5000.00
0.10
0.20
0.30
0.40
0.50
0.60
0.70
RS
D (%
)
RSD of RT for 6 runs of each concentration
Ascorbic acid
Nicotinic acid
Niacinamide
Biotin
Cyanocobalamine
Riboflavin
Figure 5Precision of retention times of various vitamins; six replicate injections for each concentration.

2 °C (33 °C) compared to the actualmethod. When the column temperaturewas raised by 2 °C (37 °C) compared tothe actual method, retention time ofthree mid eluting peaks were deviatedmore than the allowed limit. Robustnessstudies with changing column flow con-firmed that, retention times of earlyeluting five highly polar vitamins are
sensitive to the column flow rate. Arepresentative chromatogram of vita-min standard mix with actual andvaried column flow rates are shown inFigure 6. Studies with change in gradi-ent slope confirmed that retentiontimes of last two peaks are sensitive togradient slope. Study with change in pHof mobile phase demonstrates that
RobustnessTo test the robustness of the method, astandard spike mix solution of vitaminswith a concentration of 10 ng/mL wasused. With an injection volume setvalue of 5 µL, on column concentrationof this standard mix was 50 ng/mL(ppm). Six critical parameters werechanged and data collected in 10 repli-cate injections. Values from the last sixreplicates were used for the analysis.Allowed deviation for retention timeand area was set to ± 2.0% and ± 5% respectively.
Results from robustness study aresummarized in Table 3. From thoseresults, it is clear that, selecting exactabsorbance maxima of vitamins fordetection is important. Area responsesfor several vitamins were sensitive toincrease or decrease in detectionwavelength by 3 nm. Impact of columntemperature on retention time wasmeasured and was observed that, thedeviation was within the limit when thecolumn temperature was lowered by
7
Sl no: Parameter Value in original method
Measured deviation Modified values
Observed RT deviation(Allowed limit = ± 2%)
Observed area deviation(Allowed limit = ± 5%)
1 Column temperature 35 °C ± 5% 33 °C Passed Passed
37 °C Failed for three mid eluting compounds
Passed
2 Column flow 0.45 mL/min ± 2% 0.44 mL/min Passed for five last eluting compounds
Passed
0.46 mL/min Passed for five last eluting compounds
Passed
3 Injection volume 5 µL ± 5% 4.75 µL Passed Passed
5.25 µL Passed Passed
4 Gradient steepness 2.9 (1 to 30 in 10 minutes)
10% 3.2 (1 to 30 in 9 minutes)
Passed for eight first eluting compounds
Passed
2.6 (1 to 30 in 11 minutes)
Passed for eight first eluting compounds
Passed
5 Detection wavelength 205, 214, 220, 232,266, 268, 280 nm
± 3 nm 202, 211, 217, 229, 263,265, 277 nm
Passed Passed for seven compounds
208, 217, 223, 235, 269,271, 283 nm
Passed Passed for five compounds
6 pH of mobile phase 7.0 ± 0.2 6.8 Failed Failed
7.2 Failed Failed
Table 3Robustness test result summary.
min0 2.5 5 7.5 10 12.5 15 17.5
0
200
400
600
800
Blue trace: DAD1 C, Sig=220, 4 Original method, Column flow 0.45 mL
4.98
2
Green trace: DAD1 C, Sig=220, Column flow 0.46 mL
4.63
7
Red trace: DAD1 C, Sig=220, Column flow 0.44 mL
5.21
7
mAU
Figure 6Results from robustness study. Effect of varying column flow.
Vitamin R2 Linearity equation
Recovery (%)
Sample 1Sample 1 dilute Sample 2
Sample 2 dilute Sample 3
Sample 3 dilute
Nicotinic acid 1 y = 44.956x + 9.8116 95.4 96.3 94.2 99.1 97.5 95.1
Calcium pantothenate 0.9998 y = 8.1153x + 13.278 84.2 93.4 92.0 92.0 86.4 80.2
Pyridoxine 0.9994 y = 64.275x – 102.77 125.3 96.3 123.6 98.1 125.7 94.5
Niacinamide 1 y = 51.034x + 6.7257 96.9 100.0 99.6 98.3 100.1 87.0
Thiamine 1 y = 23.202x - 8.8965 100.7 99.7 100.6 102.3 99.2 98.0
Folic acid 0.9985 y = 38.06x + 42.787 80.8 82.2 81.6 85.1 82.3 81.8
Biotin 0.9999 y = 7.3515x + 10.517 82.2 94.8 80.4 96.3 84.0 95.6
Cyanocobalamine 0.9994 y = 31.164x + 31.428 84.9 83.8 85.6 87.3 80.5 83.0
Riboflavin 0.9985 y = 50.904x + 71.323 82.7 82.2 81.6 85.4 84.1 80.6
also carried out using a tenfold lowerdiluted sample matrix. The observedresults from recovery studies were tabu-lated in Table 4. Ascorbic acid wasfound to be degrading and omitted fromrecovery calculation. The excellent
recovery values confirms the reliabilityof extraction procedure and the methodcan be utilized for monitoring and quan-tifying water soluble vitamins in nutri-tion labeling analysis.
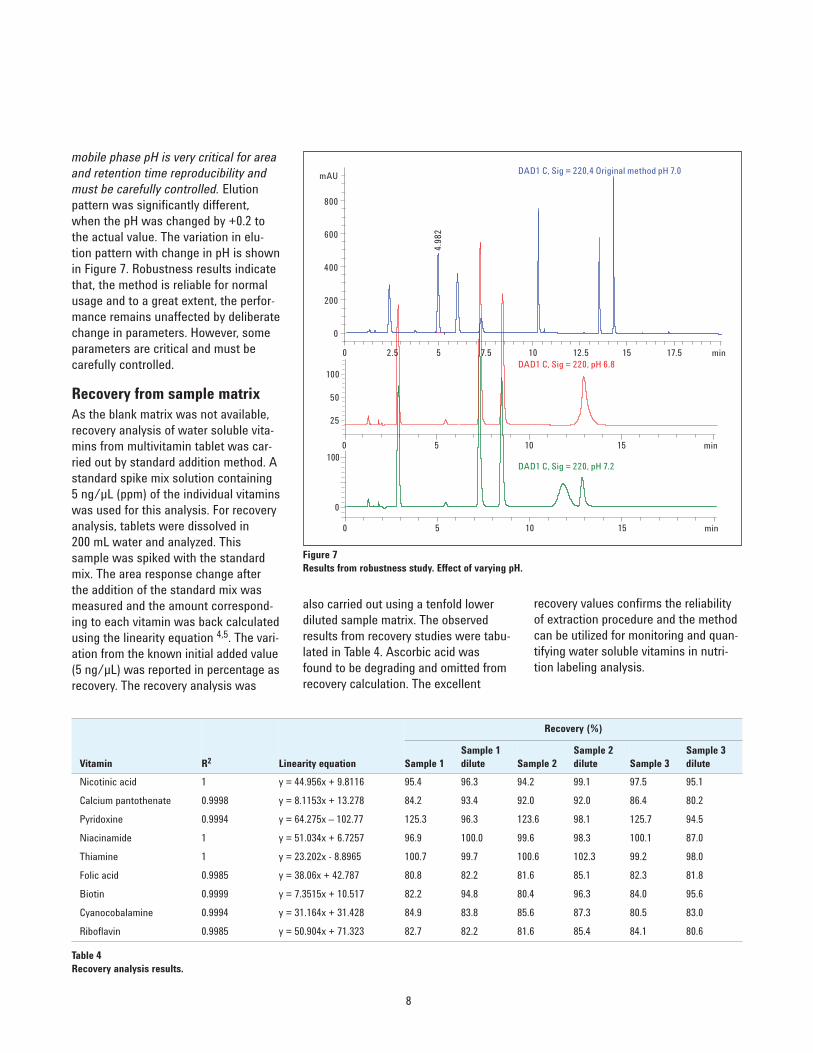
mobile phase pH is very critical for areaand retention time reproducibility andmust be carefully controlled. Elutionpattern was significantly different,when the pH was changed by +0.2 tothe actual value. The variation in elu-tion pattern with change in pH is shownin Figure 7. Robustness results indicatethat, the method is reliable for normalusage and to a great extent, the perfor-mance remains unaffected by deliberatechange in parameters. However, someparameters are critical and must becarefully controlled.
Recovery from sample matrixAs the blank matrix was not available,recovery analysis of water soluble vita-mins from multivitamin tablet was car-ried out by standard addition method. Astandard spike mix solution containing5 ng/µL (ppm) of the individual vitaminswas used for this analysis. For recoveryanalysis, tablets were dissolved in 200 mL water and analyzed. This sample was spiked with the standardmix. The area response change afterthe addition of the standard mix wasmeasured and the amount correspond-ing to each vitamin was back calculatedusing the linearity equation 4,5. The vari-ation from the known initial added value(5 ng/µL) was reported in percentage asrecovery. The recovery analysis was
8
min0 5 10 15
0
100DAD1 C, Sig = 220, pH 7.2
50
25
100DAD1 C, Sig = 220, pH 6.8
min0 5 10 15
min0 2.5 5 7.5 10 12.5 15 17.5
0
200
400
600
800
DAD1 C, Sig = 220,4 Original method pH 7.0
4.98
2
mAU
Figure 7Results from robustness study. Effect of varying pH.
Table 4Recovery analysis results.
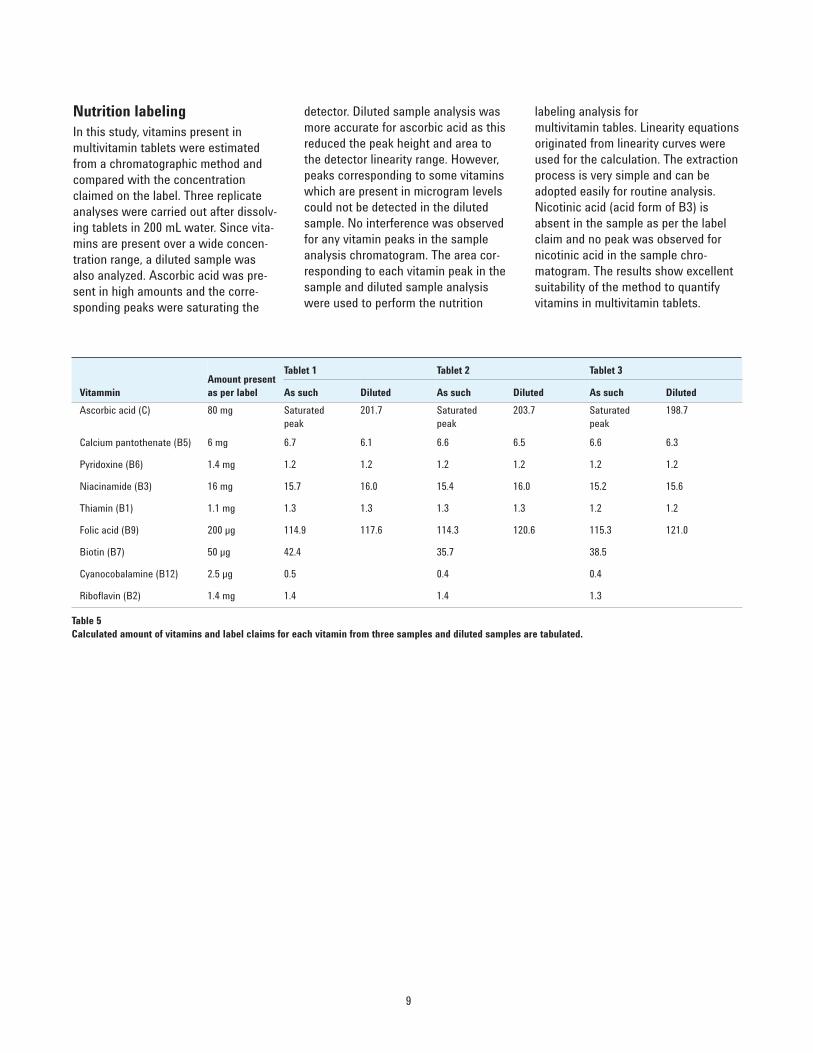
detector. Diluted sample analysis wasmore accurate for ascorbic acid as thisreduced the peak height and area tothe detector linearity range. However,peaks corresponding to some vitaminswhich are present in microgram levelscould not be detected in the dilutedsample. No interference was observedfor any vitamin peaks in the sampleanalysis chromatogram. The area cor-responding to each vitamin peak in thesample and diluted sample analysiswere used to perform the nutrition
labeling analysis for multivitamin tables. Linearity equationsoriginated from linearity curves wereused for the calculation. The extractionprocess is very simple and can beadopted easily for routine analysis.Nicotinic acid (acid form of B3) isabsent in the sample as per the labelclaim and no peak was observed fornicotinic acid in the sample chro-matogram. The results show excellentsuitability of the method to quantifyvitamins in multivitamin tablets.
Nutrition labelingIn this study, vitamins present inmultivitamin tablets were estimatedfrom a chromatographic method andcompared with the concentrationclaimed on the label. Three replicateanalyses were carried out after dissolv-ing tablets in 200 mL water. Since vita-mins are present over a wide concen-tration range, a diluted sample wasalso analyzed. Ascorbic acid was pre-sent in high amounts and the corre-sponding peaks were saturating the
9
Vitammin Amount present as per label
Tablet 1 Tablet 2 Tablet 3
As such Diluted As such Diluted As such Diluted
Ascorbic acid (C) 80 mg Saturated peak
201.7 Saturated peak
203.7 Saturated peak
198.7
Calcium pantothenate (B5) 6 mg 6.7 6.1 6.6 6.5 6.6 6.3
Pyridoxine (B6) 1.4 mg 1.2 1.2 1.2 1.2 1.2 1.2
Niacinamide (B3) 16 mg 15.7 16.0 15.4 16.0 15.2 15.6
Thiamin (B1) 1.1 mg 1.3 1.3 1.3 1.3 1.2 1.2
Folic acid (B9) 200 µg 114.9 117.6 114.3 120.6 115.3 121.0
Biotin (B7) 50 µg 42.4 35.7 38.5
Cyanocobalamine (B12) 2.5 µg 0.5 0.4 0.4
Riboflavin (B2) 1.4 mg 1.4 1.4 1.3
Table 5Calculated amount of vitamins and label claims for each vitamin from three samples and diluted samples are tabulated.
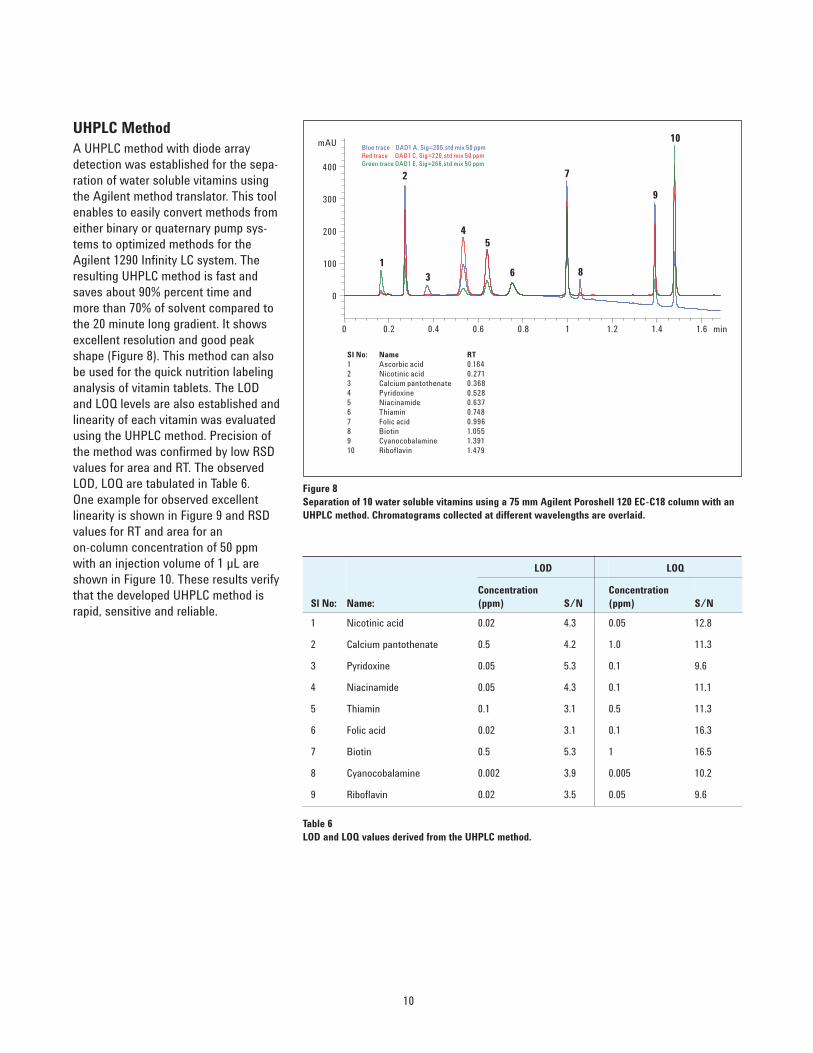
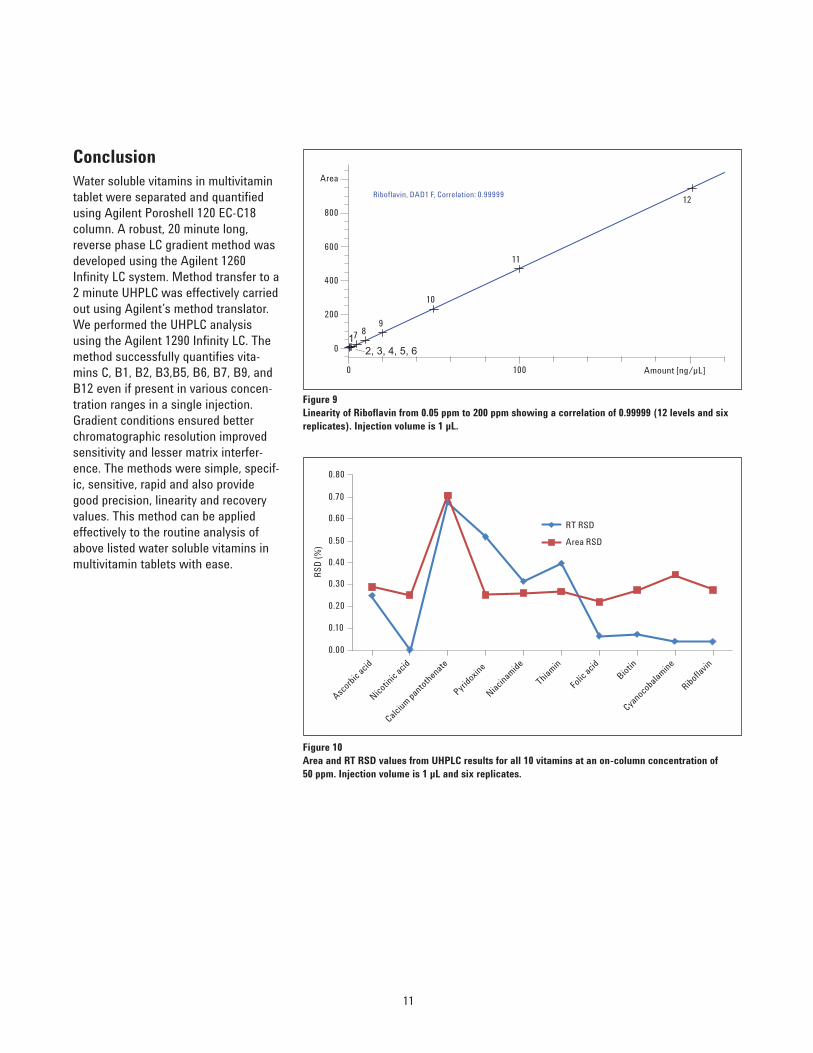
UHPLC MethodA UHPLC method with diode arraydetection was established for the sepa-ration of water soluble vitamins usingthe Agilent method translator. This toolenables to easily convert methods fromeither binary or quaternary pump sys-tems to optimized methods for theAgilent 1290 Infinity LC system. Theresulting UHPLC method is fast andsaves about 90% percent time andmore than 70% of solvent compared tothe 20 minute long gradient. It showsexcellent resolution and good peakshape (Figure 8). This method can alsobe used for the quick nutrition labelinganalysis of vitamin tablets. The LODand LOQ levels are also established andlinearity of each vitamin was evaluatedusing the UHPLC method. Precision ofthe method was confirmed by low RSDvalues for area and RT. The observedLOD, LOQ are tabulated in Table 6. One example for observed excellentlinearity is shown in Figure 9 and RSDvalues for RT and area for anon-column concentration of 50 ppmwith an injection volume of 1 µL areshown in Figure 10. These results verifythat the developed UHPLC method israpid, sensitive and reliable.
10
SI No: Name RT1 Ascorbic acid 0.1642 Nicotinic acid 0.2713 Calcium pantothenate 0.3684 Pyridoxine 0.5285 Niacinamide 0.6376 Thiamin 0.7487 Folic acid 0.9968 Biotin 1.0559 Cyanocobalamine 1.39110 Riboflavin 1.479
min0 0.2 0.4 0.6 0.8 1 1.2 1.4 1.6
mAU
0
100
200
300
400
Blue trace DAD1 A, Sig=205,std mix 50 ppmRed trace DAD1 C, Sig=220,std mix 50 ppmGreen trace DAD1 E, Sig=266,std mix 50 ppm
1
2
3
45
6
7
8
9
10
Figure 8Separation of 10 water soluble vitamins using a 75 mm Agilent Poroshell 120 EC-C18 column with anUHPLC method. Chromatograms collected at different wavelengths are overlaid.
Sl No: Name:
LOD LOQ
Concentration(ppm) S/N
Concentration(ppm) S/N
1 Nicotinic acid 0.02 4.3 0.05 12.8
2 Calcium pantothenate 0.5 4.2 1.0 11.3
3 Pyridoxine 0.05 5.3 0.1 9.6
4 Niacinamide 0.05 4.3 0.1 11.1
5 Thiamin 0.1 3.1 0.5 11.3
6 Folic acid 0.02 3.1 0.1 16.3
7 Biotin 0.5 5.3 1 16.5
8 Cyanocobalamine 0.002 3.9 0.005 10.2
9 Riboflavin 0.02 3.5 0.05 9.6
Table 6LOD and LOQ values derived from the UHPLC method.
ConclusionWater soluble vitamins in multivitamintablet were separated and quantifiedusing Agilent Poroshell 120 EC-C18column. A robust, 20 minute long,reverse phase LC gradient method wasdeveloped using the Agilent 1260Infinity LC system. Method transfer to a2 minute UHPLC was effectively carriedout using Agilent’s method translator.We performed the UHPLC analysisusing the Agilent 1290 Infinity LC. Themethod successfully quantifies vita-mins C, B1, B2, B3,B5, B6, B7, B9, andB12 even if present in various concen-tration ranges in a single injection.Gradient conditions ensured betterchromatographic resolution improvedsensitivity and lesser matrix interfer-ence. The methods were simple, specif-ic, sensitive, rapid and also providegood precision, linearity and recoveryvalues. This method can be appliedeffectively to the routine analysis ofabove listed water soluble vitamins inmultivitamin tablets with ease.
11
Amount [ng/µL]0 100
Area
0
200
400
600
800
12, 3, 4, 5, 6
7 89
10
11
12Riboflavin, DAD1 F, Correlation: 0.99999
Figure 9Linearity of Riboflavin from 0.05 ppm to 200 ppm showing a correlation of 0.99999 (12 levels and sixreplicates). Injection volume is 1 µL.
RT RSD
Area RSD
Ascorb
ic acid
Nicotinic
acid
Calcium pantoth
enate
Pyridoxin
e
Niacinamide
Thiamin
Folic acid
Biotin
Cyanocobalamine
Riboflavin
0.00
0.10
0.20
0.30
0.40
0.50
0.60
0.70
0.80
RS
D (%
)
Figure 10Area and RT RSD values from UHPLC results for all 10 vitamins at an on-column concentration of 50 ppm. Injection volume is 1 µL and six replicates.
www.agilent.com/chem/lc
© Agilent Technologies, Inc., 2011Published June 1, 2011Publication Number 5990-7950EN
References1.Katherine E. Sharpless, Sam Margolis,Jeanice Brown Thomas,“Determination of vitamins in food-matrix Standard Reference Materials,”National Institute of Standards andTechnology, 100 Bureau Drive, Stop8392, Gaithersburg, MD 20899-8392,USA
2.A. Jedlicka and J. Klimes,“Determination of Water- and Fat-Soluble Vitamins in Different MatricesUsing High-Performance LiquidChromatography,” Chem. Pap., 2005, 59,202–222.
3.Sam A. Margolis, David L Duewer,“Measurement of Ascorbic Acid inHuman Plasma and Serum: Stability,Intralaboratory Repeatability, andInterlaboratory Reproducibility,” ClinicalChemistry, 1996, 42, 1257–1262.
4.AOAC Official Method 2004.07 VitaminB6 in Reconstituted Infant FormulaLiquid Chromatographic Method FirstAction 2004.
5.Duncan Thorburn Burns, Klaus Danzer,and Alan Townshend, “Use of the terms‘recovery’ and ‘apparent recovery’ inanalytical procedures,” Pure Appl.Chem., Vol. 74, No. 11, pp. 2201–2205,2002.