Agenda - ndiastorage.blob.core.usgovcloudapi.net · Anderson-Darling - A goodness-of-fit test that...
64
Transcript of Agenda - ndiastorage.blob.core.usgovcloudapi.net · Anderson-Darling - A goodness-of-fit test that...


Agenda
Couple of questionsSession 1What workedAdditional Resources
Lets get a current baseline of CNN viewers…
Do you watch CNN everyday?

Anderson Cooper…
Do you know who Anderson Cooper is? http://video.google.com/videosearch?sourceid=navclient&rlz=1T4RNWN_enUS284US284&q=anderson%20cooper%20cnn%20heroes&hl=en&um=1&ie=UTF-8&sa=N&tab=wv#

Role Play
Approach for this segment

Lets establish a baseline of current understanding…
Variable “A” follows a lognormal distribution as determined by the A-D goodness of fit test. The Chi-Square test shows it has a p-value of 0.002.

Roll a dice…
1 2 63 4 5
1/6
7
Like
lihoo
d →
Values →
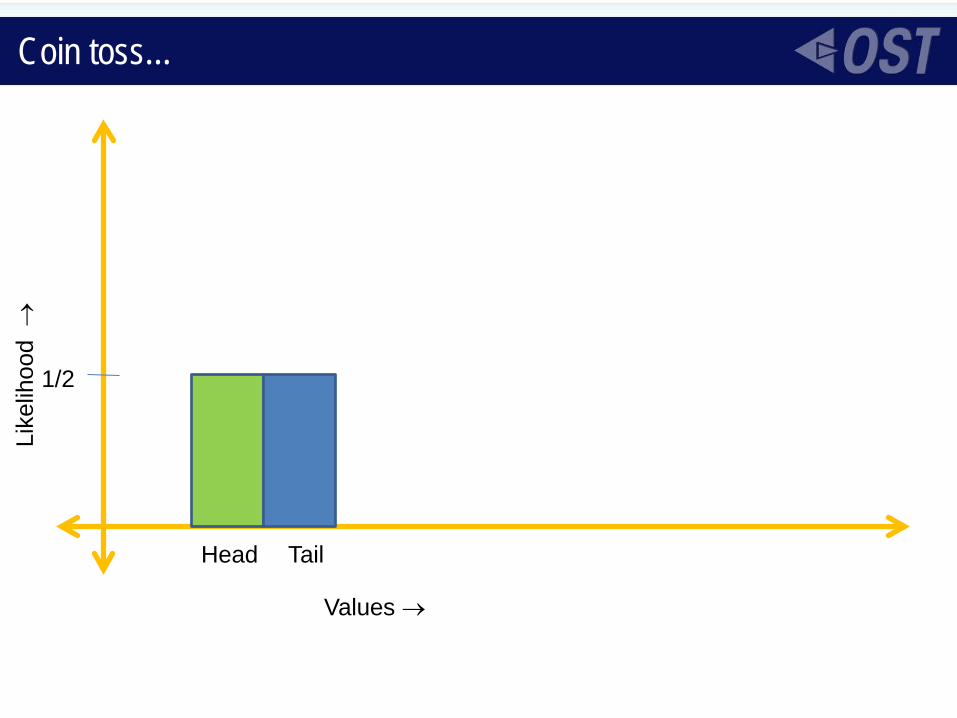
Coin toss…
Head Tail
1/2
Like
lihoo
d →
Values →
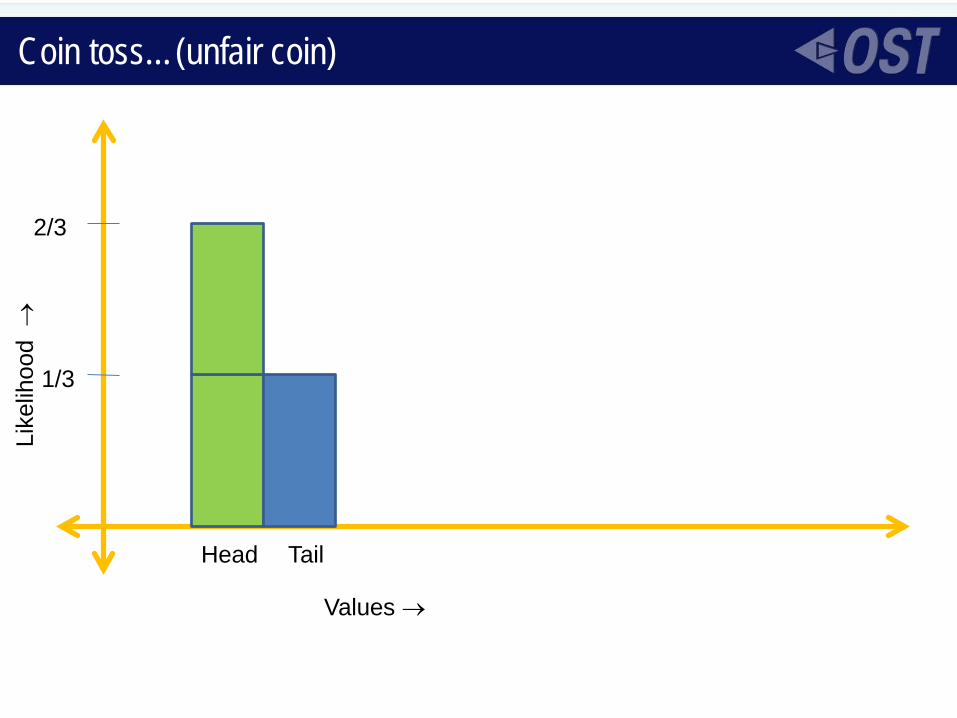
Coin toss…(unfair coin)
Head Tail
1/3
2/3
Like
lihoo
d →
Values →

Two die…
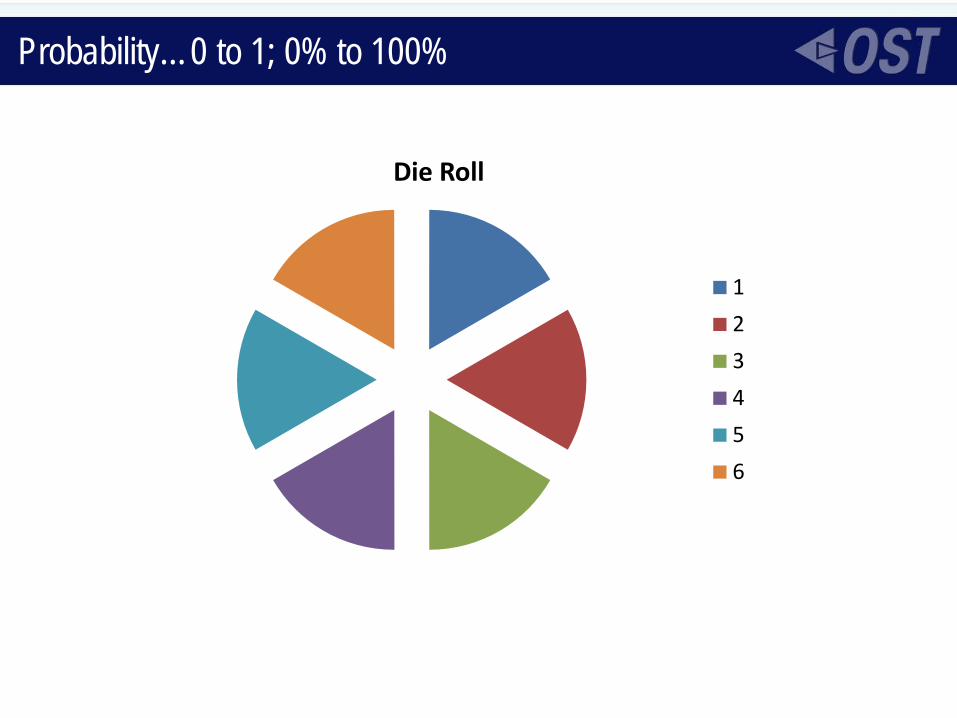
Probability…0 to 1; 0% to 100%
Die Roll
1
2
3
4
5
6

Area under a curve…

Heights of the VRVL PAT…+ QA group+ ESEPG
Joann – 5’ 1”Lakshmi – 5’ 4”Domenic – 5’ 8”Krithika – 5’ 8”Hongda – 6’ 1”Jerome – 6’ 1”James – 6’ 3”Charlotte - 5'6"Carolina - 5'5"Surya - 5'9"Nalini - 5'0"Barbara - 5'5"Nishi - 5'2"Deepti - 5'6"Dan Renfroe -Joe - 5'11Jack - 5'10"Ajay - 6'0"Vijay - 5'5"
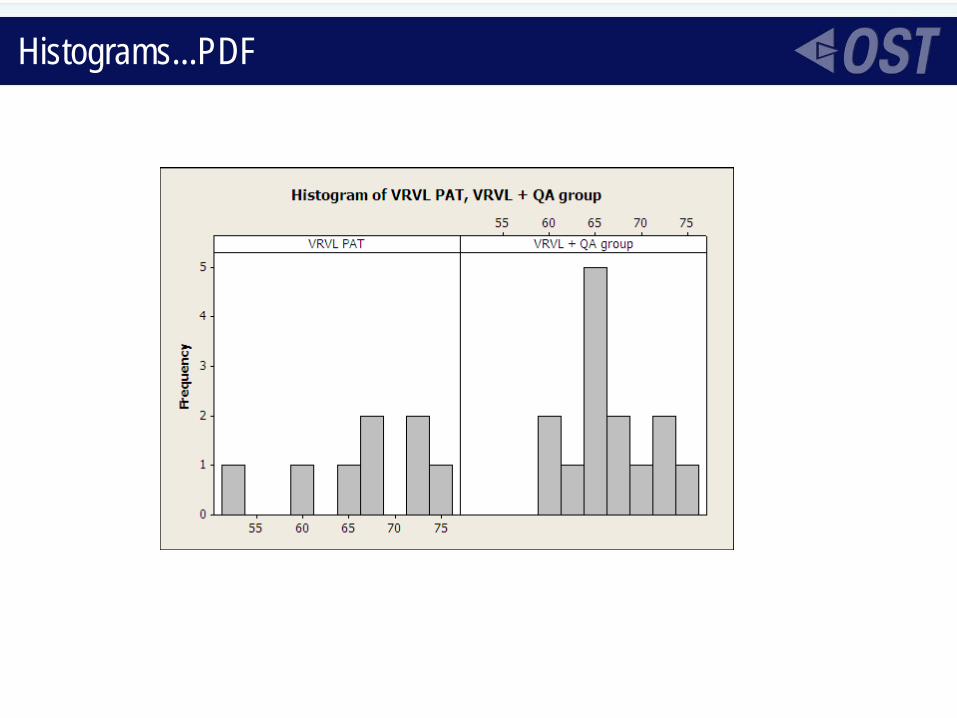
Histograms...PDF

Histograms
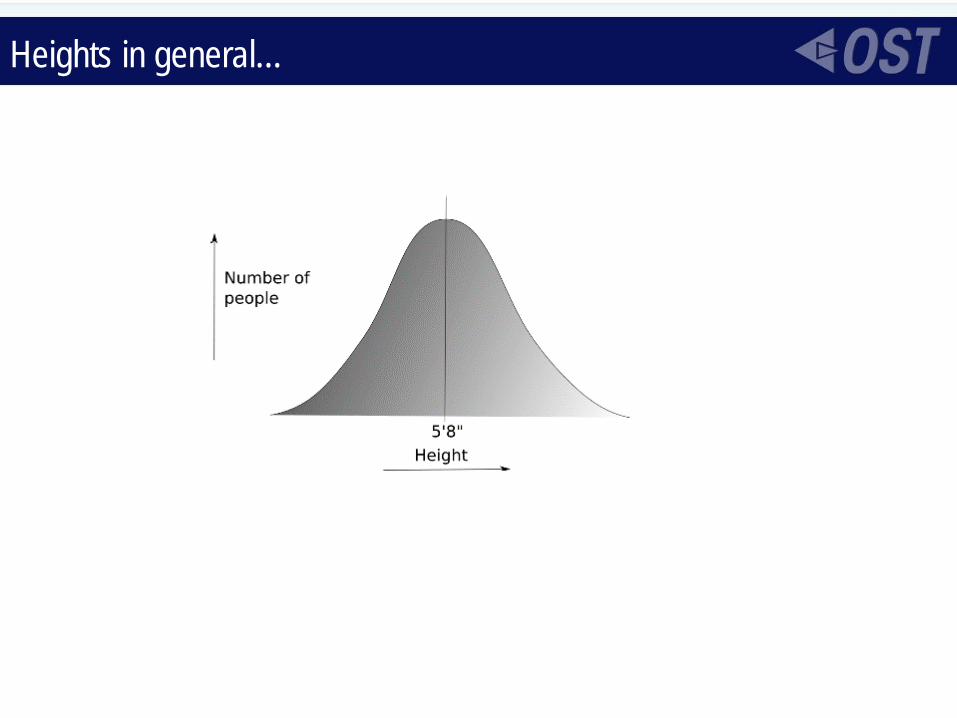
Heights in general…

Some other distributions…

Anderson – Darling…Does this fit?
Name Is a good fit if… More details
Anderson-Darling A-D<1.5
Chi-Square P Value>0.05 Oldest
Kolmogorov-Smirnov K-S<0.03

Results of Goodness of fit test…for heights

Do we understand…
A distribution…Goodness of fit…p-value

Lets get another baseline…
Variable “A” follows a lognormal distribution as determined by the A-D goodness of fit test. The Chi-Square test shows it has a p-value of 0.002.

And CNN viewership??
What is it now?

Which baselines changed?
CNN Viewership's?Do you know what Anderson Cooper looks like?Your “assumed identities” understanding of the statement?
Why/Why not?

Other tests
chi-square - The oldest and most common goodness-of-fit test. This test gauges the general accuracy by breaking down the distribution into areas of equal probability and comparing the data points within each area to the number of expected data points. Generally, a p-value greater than 0.5 indicates a close fit.
Kolmogorov-Smirnov - A goodness-of-fit test, the result of which is essentially the largest vertical distance between the two cumulative distributions. Generally a value less than 0.03 indicates a good fit.
Anderson-Darling - A goodness-of-fit test that closely resembles the Kolmogorov-Smirnov test, except that it weights the differences between the two distributions at their tails greater than at their mid-ranges. Use this test when you need a better fit at the extreme tails of the distributions. Generally a value less than 1.5 indicates a close fit.

Role play over
Thank you for the role play
Moving on with our agenda….

Stuff that worked or we’d do differently
Worked wellSocratic methodTheir dataEveryday examplesEveryone participatesNo fear
What we are doing differentlyMore exercisesCome up with x and y factors sooner

What we did next…Assignment

Results
Sample models that came upTime I need to spend on the help deskTime to develop reportsQuality of end productMy productivityLOE needed for TestingEtc.

What’s in the Appendix?
Material from additional sessionsIf you need help, we’ll be happy to chat via:
EmailPhoneEtc.
…to provide tips from our experience
Our Contact Information

Questions
Any Questions?

Appendix
Some more samples
Hypothesis Tests and JokesStandard Deviation and VariabilityTwo real life modelsL5 and basic stepsTool trainings

Do you understand this statement…
The NULL hypothesis was rejected in favor of the alternative hypothesis since the p value was…
Let’s get a baseline from the classHow many Get It?Somewhat?Do NOT get it?

Have you heard…
Innocent until proven guilty
The person is innocent
The person is guilty
Which of the above statements is…Status QuoConventional wisdomDoesn’t need to be provedAccepted without additional proof
Null Hypothesis
AlternativeHypothesis
Null Hypothesis

Alternative Hypothesis
Not Status QuoNot Conventional wisdomThe burden of proof rests on
• One who challenges• Makes a new claim• Wants to change the status quo
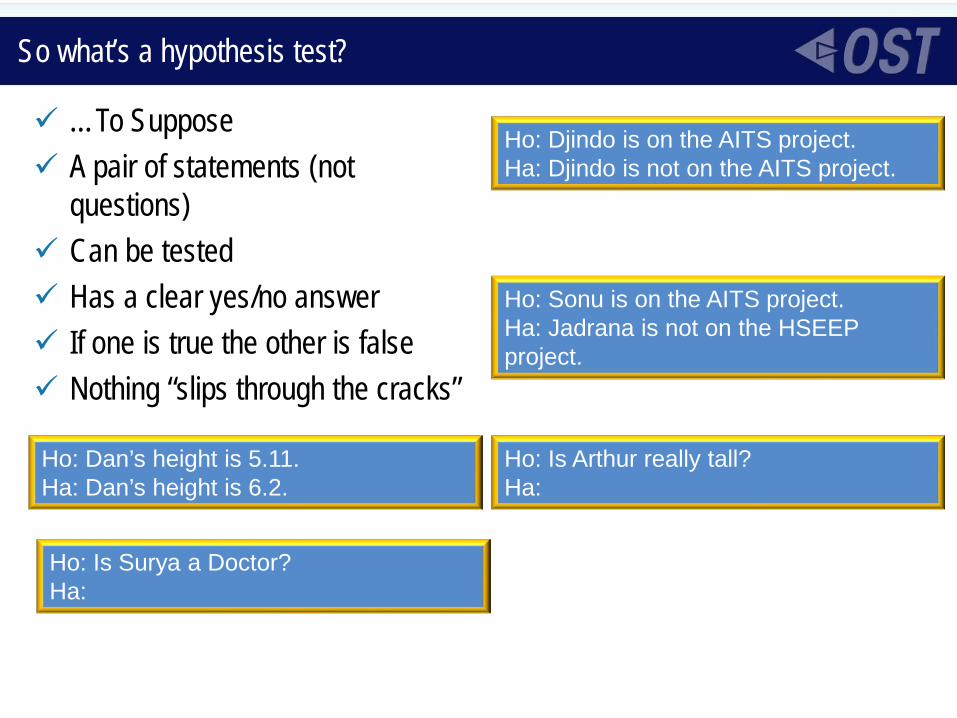
So what’s a hypothesis test?
…To Suppose A pair of statements (not
questions) Can be tested Has a clear yes/no answer If one is true the other is false Nothing “slips through the cracks”
Ho: Djindo is on the AITS project.Ha: Djindo is not on the AITS project.
Ho: Sonu is on the AITS project.Ha: Jadrana is not on the HSEEP project.
Ho: Dan’s height is 5.11.Ha: Dan’s height is 6.2.
Ho: Is Surya a Doctor?Ha:
Ho: Is Arthur really tall?Ha:

So what’s a hypothesis test?
…To Suppose A pair of statements (not
questions) Can be tested Has a clear yes/no answer If one is true the other is false Nothing “slips through the cracks”
Ho: Kusum was born in Washington DC.Ha: Kusum was not born in Washington DC.
Ho: Julie is a doctor.Ha: Julie is not a doctor.
Ho: Sean watches CNN every day.Ha: Sean does not watch CNN every day.

So what’s a hypothesis test?
Ho: Apple’s help desk answers calls in 2 min or less.Ha: Apple’s help desk answers calls in more than 2 min.
Ho: The average GPA of GW is 2.6 or higher.Ha: The average GPA of GW is less than 2.6.
Ho: Dan’s height is 5.11 or taller.Ha: Dan’s height is less than 5.11.
…To Suppose A pair of statements (not
questions) Can be tested Has a clear yes/no answer If one is true the other is false Nothing “slips through the cracks”

Once you run the hypothesis test you get a
P-Value…
When the p is low, the null must goWhen the P is high, the null must fly
HIGH
Less than (<) 0.05 or 5% Equal to or Greater than (<=) 0.05 or 5%

So what’s a hypothesis test?
Ho: Apple’s help desk answers calls in 2 min or less.Ha: Apple’s help desk answers calls in more than 2 min.
Ho: The average GPA of GW is 2.6 or higher.Ha: The average GPA of GW is less than 2.6.
Ho: Dan’s height is 5.11 or taller.Ha: Dan’s height is less than 5.11.
Do you understand this statement…
The NULL hypothesis was rejected in favor of the alternative hypothesis since the p value was…
Let’s get a baseline from the classHow many Get It?Somewhat?Do NOT get it?

Technical Terms…P value is the
Probability of Null being true…or accepting the null

Questions
Any Questions?

Some terms…
CENTRAL TENDENCYMean/AverageMedian
VARIANCE
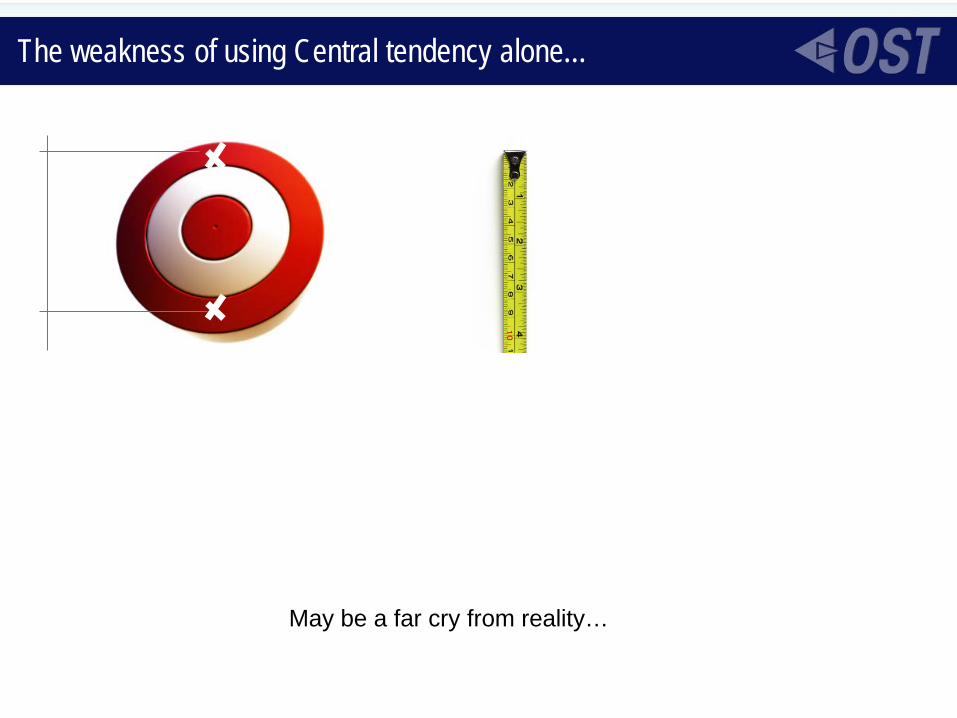
The weakness of using Central tendency alone…
May be a far cry from reality…

The weakness of using Central tendency alone…
You are a Manager for Boeing.
Expectation - 50 jet engines on June 29th.
You will store them in a warehouse.
Each day (late) –You loose $2 million.
Each day (early) – You pay $50,000 extra for warehouse costs.
Bidder A: Average 20 days
Bidder B: Average 20 days

Past deliveries…
Bidder A10 days20 days30 days
Bidder B19 days20 days21 days
• Bidder A-10,0,10
• Bidder B-1,0,1
Not a good measure of reliability…

So how do we measure it?
-10, 0, 10Square them first – 100, 0, 100Divide by total number of valuesSquare rootStandard Deviation –

Some more terms…
baselines

What we do is important
Keeping planes in the air
Ensuring people have access to insurance claims
Ensuring government’s money is spent well
Housing for the needy
Homeland Security
Tracking progress for government spending

So we need to do well
Continuously…In spite of the constraints…
Time Skills

Variability…
OST
Project 1
Member 1
Constraint 1
Constraint 2
Choice 1
Choice 2
Member 2 Member 3
Project 2 Project 3
Corp Units
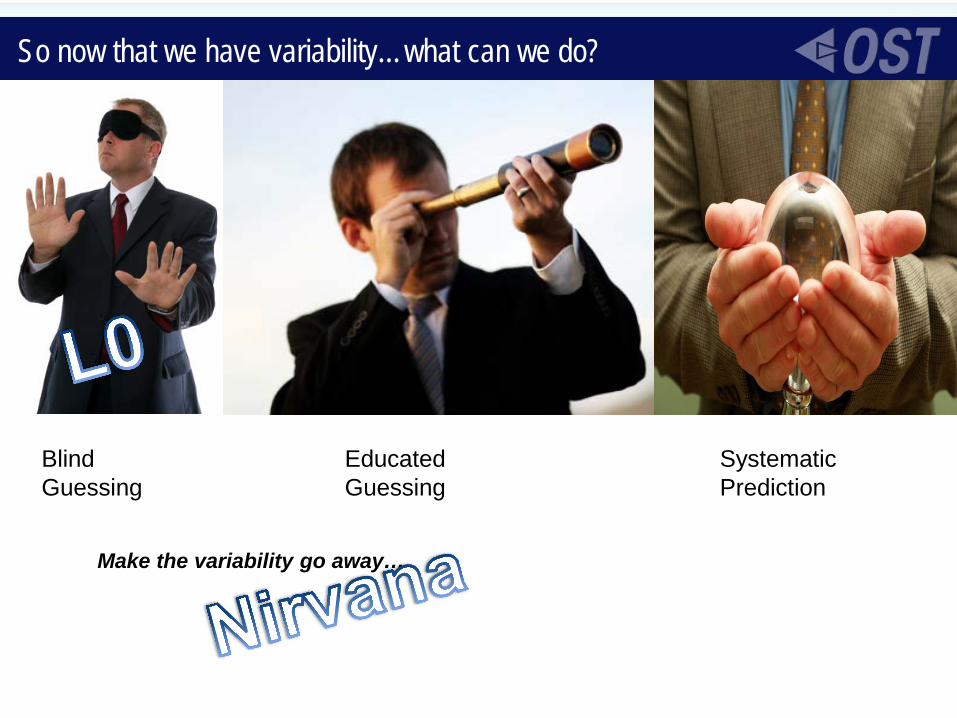
So now that we have variability…what can we do?
Blind Guessing
Educated Guessing
Systematic Prediction
Make the variability go away….

Great Concept, but does this really work?
The Heart Break ModelHeart Break…Stress cardiomyopathyApical ballooning syndromeMr. Li goes to WallstreetDefault CorrelationExamples –
• Chance of a dairy farm going bust – 10%• Chance of a dairy going bust – 5%• What if the dairy farm goes bust• And what if the dairy gets its supplies from this dairy…• Chance of dairy going bust…Rise

Default Correlation Examples…

The love calculator…
Now that I have a model…Don’t need conventional wisdom…Rating Agencies…Lot’s of buyers…Market explosion…
From 10’s of billions of $ in 2000 to $2 trillion in 2007Supply and demand…Loans become cheap…qualify easilyDefaults…

The effects…
Banks are scared to lendLiquidity dries upBusinesses can’t get loansEconomy grinds to a halt…

What went wrong?
Companies and people are differentModels weren’t updatedAssumptions…Not used as intended…Understanding…

Sample 2
OST AccountsKnow before you go – Risk Free!
• What if scenarios – Virtually• Efficiencies• Bottlenecks
Great Idea? Synergy!Accurately Evaluate OpportunitiesPowerful clear communicationsPredict the future!!

Ok, how do we get there?
60
Identify Business GoalsIdentify Processes and Sub
processesIdentify Outcomes (Y) and factors (X)
Collect Data
Assess Data Quality and IntegrityCreate Process
Performance Baseline
Create Process Performance Model
Take Action Based on Model
Recalibrate the model as needed
YYY Y
yyyy y y y
yyy y y y
y
y
High Level Business Goals(Balanced Scorecard)
Subordinate Business Goals(e.g., $ Buckets, % Performance)
XXX X
xxxx x x x
xxx x x x
x
x
High Level Process(e.g., Organizational Processes)
Subordinate Processes(e.g., Down to a Vital x
sub-process to be tackled by DMAIC team)
Pro
cess
-Agn
ostic
Pro
cess
-Orie
nted

Jokes
MUST READThree men are in a hot-air balloon. Soon, they find themselves lost in a canyon somewhere. One of the three men says, "I've got an idea. We can call for help in this canyon and the echo will carry our voices far." So he leans over the basket and yells out, "Helllloooooo! Where are we?" (They hear the echo several times.)
Fifteen minutes pass. Then they hear this echoing voice: " Helllloooooo! You're lost!!" One of the men says, "That must have been a statistician." Puzzled, one of the other men asks, "Why do you say that?" The reply: "For three reasons. (1) he took along time to answer, (2) he was absolutely correct, and (3) his answer was absolutely useless.“
I asked a statistician for her phone number... and she gave me an estimate.
ARGUING WITH A STATISTICIAN IS A LOT LIKE WRESTLING WITH A PIG. AFTER A FEW HOURS YOU BEGIN TO REALIZE THE PIG LIKES IT.
Then there's the one that if you laid every statistician on the face of the earth end to end you wouldn’t reach a conclusion.....Probably.
There was this statistics student who, when driving his car, would always accelerate hard before coming to any junction, whizz straight over it , then slow down again once he'd got over it. One day, he took a passenger, who was understandably unnerved by his driving style, and asked him why he went so fast over junctions. The statistics student replied, "Well, statistically speaking, you are far more likely to have an accident at a junction, so I just make sure that I spend less timethere.”

JokesJUST FOR FUN
Three professors (a physicist, a chemist, and a statistician) are called in to see their dean. Just as they arrive the dean is called out of his office, leaving the three professors there. The professors see with alarm that there is a fire in the wastebasket. The physicist says, "I know what to do! We must cool down the materials until their temperature is lower than the ignition temperature and then the fire will go out." The chemist says, "No! No! I know what to do! We must cut off the supply of oxygen so that the fire will go out due to lack of one of the reactants." While the physicist and chemist debate what course to take, they both are alarmed to see the statistician running around the room starting other fires. They both scream, "What are you doing?" To which the statistician replies, "Trying to get an adequate sample size."
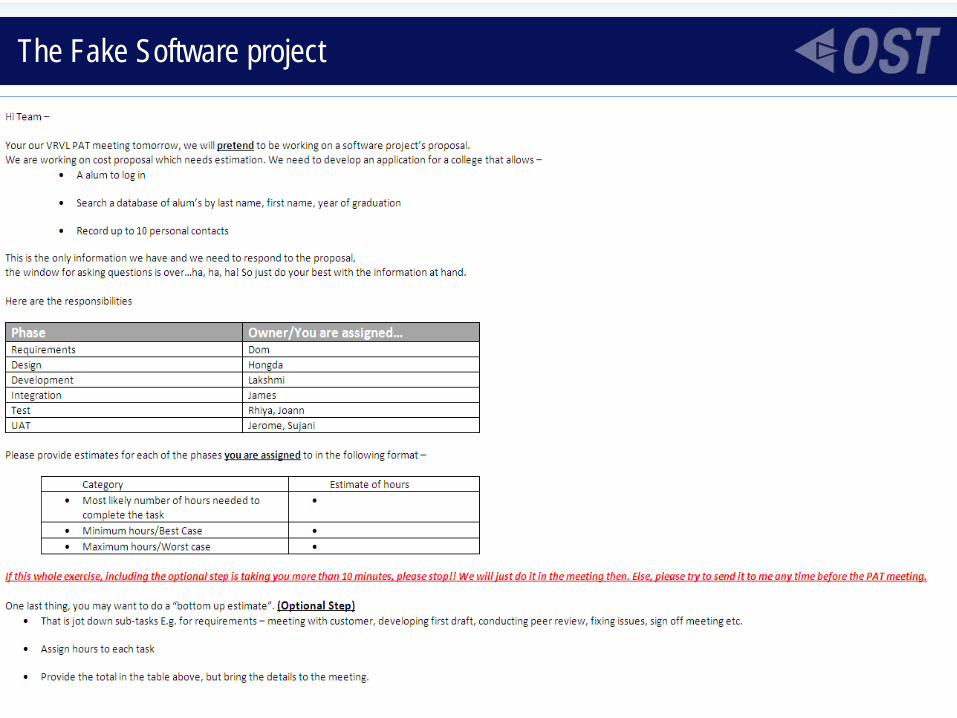
The Fake Software project