Aged society and Japan’s experiences Izumi_Aged Society...Aged society and Japan’s experiences...
17
Aged society and Japan’s experiences Mechanism for healthy and vibrant society Hiroto Izumi, Doctor of Engineering Special Advisor to the Prime Minister (Director-General of the Office of Healthcare Policy, Cabinet Secretariat, Government of Japan) April 14 th , 2018
Transcript of Aged society and Japan’s experiences Izumi_Aged Society...Aged society and Japan’s experiences...

Aged society and Japan’s experiencesMechanism for healthy and vibrant society
Hiroto Izumi, Doctor of EngineeringSpecial Advisor to the Prime Minister
(Director-General of the Office of Healthcare Policy,
Cabinet Secretariat, Government of Japan)
April 14th, 2018

0
1,000
2,000
3,000
4,000
5,000
6,000
7,000
8,000
9,000
10,000
11,000
12,000
13,000
800 1000 1200 1400 1600 1650 1700 1750 1800 1850 1900 1950 2000 2050 2100
(万人)
(年)
(1338)
(1716 to 1745)(1868)
(2030)
116,620,000 people
Aging rate: 31.6%
(2050)
97,080,000 people
Aging rate: 38.8%
(2100) (moderate-
range estimate)
49,590,000 people
Aging rate: 41.1%
(2100) (high-end estimate)
64,850,000 people
(2100) (low-end estimate)
37,950,000 people
(1192)7,570,000 people
8,180,000 people
(1603)12,270,000 people
31,280,000 people
33,300,000 people
(1945)
71,990,000 people
Kamakura
shogunate
established
Meiji
Restoration
Muromachi
shogunate
established
Kyoho
Reform
sEdo
shogunate
established
End of war
(2010)
128,060,000 people
The total population in Japan is expected to return to the level of 100 years ago, in the late Meiji era, by the coming
centennial. It will be an extremely rapid and extraordinary change compared with the past millennium.
(10 thousand ppl)
(Year)
Source:Population to 2010: materials prepared by National Spatial Planning and Regional Policy Bureau, Ministry of Land, Infrastructure Transport and Tourism (MLIT) based on the national census results
by Ministry of Internal Affairs and Communications (MIC) and the analysis of long-term chronological population distribution data in the Japanese islands (1974) by National Land Agency
The population thereafter: the materials prepared by National Spatial Planning and Regional Policy Bureau, MLIT based on Population Projection for Japan by National Institute of Population and
Social Security Research (estimated in January 2012)
Long-Term Changes in Total Population and Estimates of Future Population
1

Comparison between medical costs, self-pay burdens, and premiums per capita by age group (public medical insurance) (annually)
2
(Estimated values based on the performance in 2014)
22.7
12.3 9.2 7.2 7.4 9.4 11.0 12.3 13.9 17.2 21.9
27.8 36.0
45.4
61.9
77.7
92.3
103.1 109.3
116.7 117.1
3.7 2.8 2.2 3.6
11.8
21.9 25.9 28.9 32.4 35.8 38.5 38.0 30.3 23.3
18.5 13.9 14.3 14.6 13.2 12.5 12.0
60
40
20
0
20
40
60
80
100
120
140
0~4 5~9 10~14 15~19 20~24 25~29 30~34 35~39 40~44 45~49 50~54 55~59 60~64 65~69 70~74 75~79 80~84 85~89 90~94 95~99 100~
医療費 保険料 自己負担
Me
dic
al
co
sts
Self-p
ay b
urd
en
an
d p
rem
ium
(x 10,000
yen)
自己負担 1.7 1.7 2.2 2.5 2.8 3.2 3.9 4.9 6.1 7.6 9.1 7.5 6.4 7.4 8.0 8.1 8.4 8.5保険料 1.9 10.0 19.8 23.4 26.1 29.2 31.9 33.6 31.9 22.7 14.2 11.0 7.5 6.9 6.6 5.1 4.0 3.5
内訳
Medical costs
PremiumSelf-pay burden
Breakdown
Self-pay burden
Premium

FY2012
<<¥479.6 trillion>>
FY2015
<<¥509.8 trillion>>
FY2020
<<¥558.0 trillion>>
FY2025
<<¥610.6 trillion>>
Pension
Healthcare
Child rearing
Long-term care
Other
0
20
40
60
80
100
120
140
160
(Trillion yen)
109.5
(22.8%)
119.8
(23.5%)
134.4
(24.1%)
148.9
(24.4%)
118.7
(23.3%)
131.8
(23.6%)
144.8
(23.7%)
Simulation based on
current situation
After reforms
Outlook of benefit expensesBenefit expenses will increase from 109.5 trillion yen (22.8% of GDP) in FY2012 to148.9 trillion yen (24.4% of GDP) in FY2025.
Note 1: This outlook takes into account concrete measures, processes, and estimates expenses for social security reforms and reflects the effects of fulfillment, concentration, and
an increase in efficiency.
Note 2:The above figures for child rearing include the expenses of nursery schools, kindergartens, overtime childcare, community childcare support centers, temporary childcare,
cash benefits for children, childcare leave benefits, benefits for delivery, social care, and prenatal checkups provided that new systems should be carried out.
Note 3: The figures in parentheses “( )” represent the ratios against GDP. The figures in double-parentheses “<<>>” represent the amount of GDP.
19.8
54.0
60.4
14.9
46.9
58.5
10.5
39.5
56.5
8.4
35.1
53.8
Estimates for Future Social Security Expenses
3
Ref.) Budget size
of Japan:
¥96.3 trillion in
FY 2015
Social Security:
¥31.5trillion
Ratio of the
social security
against the policy
expenses(*):
55.0%
(*) Budget excluding government debt
expenses and local allocation tax subsidies
Years Required for Aging Rate to Rise from 7% to 14%
4
2025
2023
2016
2002
2002
2000
2000
2000
1994
1970
1930
1947
1941
1944
1944
1938
1890
1865
25
28
18
22
24
18
19
26
60
24
45
45
53
65
69
73
85
115
2050
2051
2034
2024
2026
2018
2019
2026
2054
1994
1975
1992
1994
2009
2013
2011
1975
1980
1850 1900 1950 2000 2050
Indonesia
India
Vietnam
Thailand
Sri Lanka
South Korea
Singapore
China
Kazakhstan
Japan
United Kingdom
Spain
Hungary
Canada
United States
Australia
Sweden
France
Year
Pro
ject
ion
Note : The year to the left of the bar designates the year in which the percentage of the population aged 65 and above (aging rate) reached 7%; the number to the
right of the bar designates the year when the aging rate attained 14%. The number on the bar designates the years required for that increase.
Source : Kinsella and Wan He (2009); Kazakhstan, Vietnam, India, and Indonesia calculated using UN (2015).
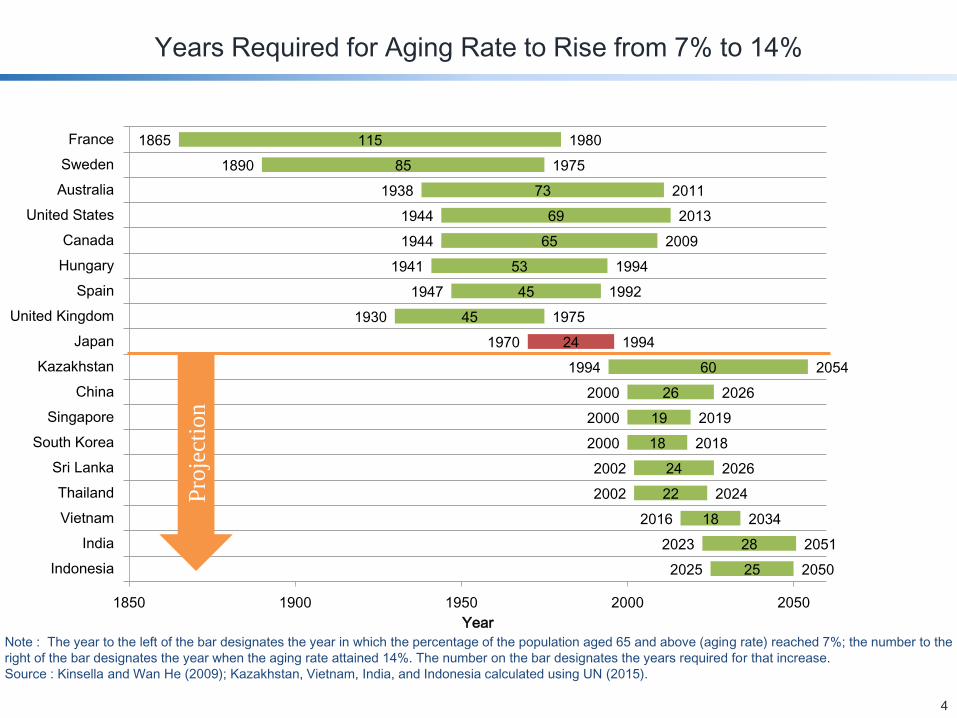
The lost twenty years in Japan
Why did Japan lose international competitiveness and
suffer from an economic slump?
¥
EPA
High corporate tax
Strong yen
Increased electricity
cost
Restrictions on
energy/environment
Delay in the agreement of
EPA(Economic Partnership
Agreement), etc.
Labor regulations
Shortage of labor
Decreasing demand
. . .
Super-aging society with fewer children/
society with a falling birth rate
In reality the
fundamental
factors are:
Basic structure for sustainable growth – The fundamental idea –
5

Basic structure for sustainable growth – Supply side –
6
Ensure immediate effects and easily gain a national
consensus.
More children Social participation by
women
Working elderly
3) Securing labor power (quantity, quality, and efficient utilization)
2) Promotion of capital investment
1) Improvement of productivity (TFP) by innovations (Total Factor Productivity - TFP)
Supply side
Foreign workers
+
Reforms regarding work style (Dynamic Engagement of All Citizens)Efficient
utilization
Quantity
Essentially healthyQuality
Infrastructure that allows as many nationals as possible to enjoy a society
with health and longevity, to continue to work if they wish, to participate in society,
and to proudly lead meaningful lives
A revolution in human resources development
〇Elderly in Japan are more eager to
work than those in Europe and
America. The percentage of people
aged 65 or more to the whole labor
force for 2016 is 11.8%, and the
number of those elderly is expected
to reach 7.7 million.
〇Labor force percentage of women
for 2016: 68.1% (the highest ever)
※Plan to Accelerate the Elimination
of Childcare waiting lists.
→Expand the capacity of childcare
to 500,000 by 2017
〇 Takes time to reach
consensus on some
issues such as developing
the environment to accept
foreign workers
〇The most important
but lacks immediate
effectivity
+ Absorb overseas demand
ex.) Recurrent education
ex.) Labor regulation reform

Males
Females
2010
2016
2010
2016
79.55
80.98
70.42
72.14
9.13 years
8.84 years
12.68 years
12.35 years
86.30
87.14
Average life expectancy healthy life expectancy
73.62
74.79
Sources:
- Average life expectancy:
Complete Life Table 2010, Ministry of Health, Labour and Welfare (MHLW)
Abridged Life Table 2016, MHLW
- Healthy life expectancy:
Abridged Life Table 2010/ 2016, MHLW
Vital Statistics of Japan 2010 / 2016, MHLW
Comprehensive Survey of Living Conditions 2010 / 2016, MHLW
Population Projection for Japan 2010 / 2016, MIC
* Goal of Health Japan 21 (the second project): to extend the healthy life expectancy to exceed the increase in the average life expectancy (FY2022)
Goal of Japan Revitalization Strategy and Healthcare Policy: to extend the healthy life expectancy nationally by at least one year by 2020 (FY2020)
The healthy life expectancy in 2016 was 72.14 years for males and 74.79 years for females.
The healthy life expectancy was extended by 1.72 years in males and 1.17 years for females, compared with 2010.
The period with limitations for ADL was shortened by 0.29 years for males and 0.33 years for females, compared with 2010.
Average life expectancy and healthy life expectancyHealthy life expectancy: period with no limitations for activities of daily living (ADL)
7
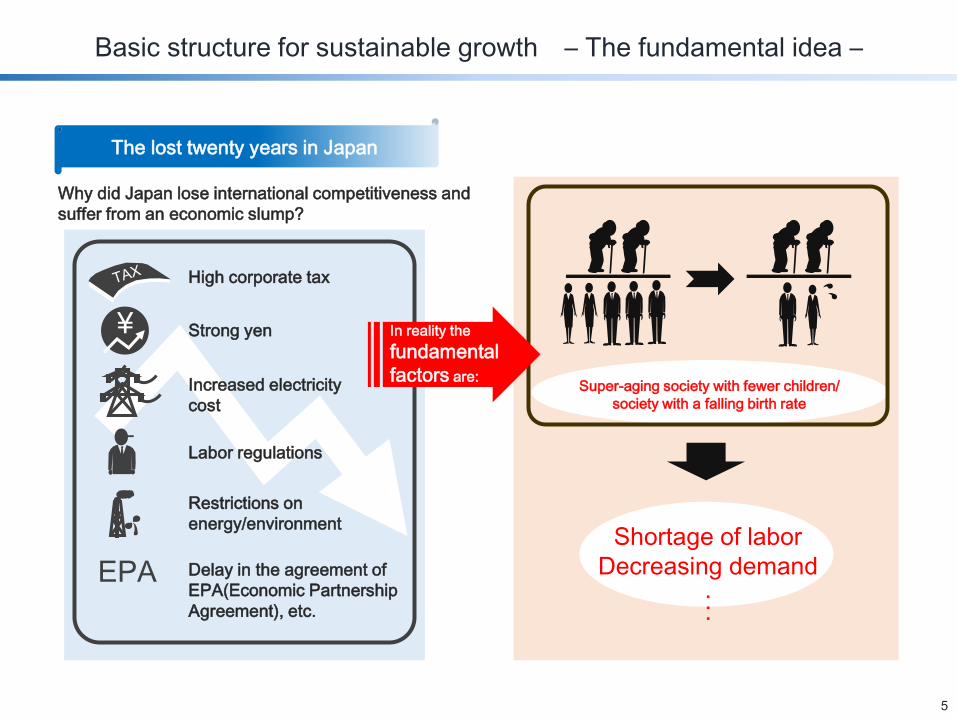
Future Prospects
8
As The Japan Gerontological Society and Geriatrics Society propose to change the definition of
“the elderly” from people aged 65 and older to people aged 75 and older, the rejuvenation of the
bodily functions of the elderly and the extension of healthy life are important aspects.
Historical changes in total points of a
physical strength test
(Source)Japan Sports Agency
The result summary of the physical strength/exercise ability test in FY 2015
0
5,000
10,000
15,000
20,000
25,000
30,000
35,000
40,000
2010年 2015年 2020年 2025年 2030年 2035年 2040年 2045年 2050年
Thousand people Elderly population (Five-year age group)
65~69歳 70~74歳 75~79歳 80~84歳 85~89歳 90歳~
【people over 80 years of age】15.99 million
(As of 2050 year)
【people over 65 years of age】29.45 million (Approx. 23%)
(As of 2010 year)
【people over 75 years of age】23.85 million (Approx. 25%)
(As of 2050 year)
(Source)Made by Ministry of Land, Infrastructure, and Transportation
It is expected that around 2020, the
physical strength of those aged 76-79
will improve to the level of physical
strength of those aged 66-69 in 1998.
Male
FemaleMale
Female
Male
Female
1998 1999 2000 2001 2002 2003 2004 2005 2006 2007 2008 2009 2010 2011 2012 2013 2014 2015

Change in the number of employed people by age group and employment rates in major countries
9
492(7.8)
519(7.9)
1247(19.8)
1124(17.2)
1472(23.4)
1458(22.3)
1291(20.5)
1489(22.8)
1227(19.5)
1134(17.4)
570(9.1)
807(12.4)
6,298 6,293 6,280 6,326 6,371 6,401 6,465 6,530
0
1,000
2,000
3,000
4,000
5,000
6,000
7,000
2010 11 12 13 14 15 16 17
(x 10,000 people)
(Year)
Over 65
years old
55-64
years old
45-54
years old
35-44
years old
25-34
years old
15-24
years old
Reference) 1. Prepared from the Ministry of Internal Affairs and Communications,
“Workforce survey” and OECD.stat.
2. Inside ( ) is the proportion of each age group of employed people.
The numbers of employed people by age group
Employment rates in major countries
51.5
50.6
55.3
58.4
58.0
60.4
58.5 59.7
56.6
58.2
50
52
54
56
58
60
62
2010 11 12 13 14 15 16
(%)
(Year)
U.S.UK
Germany
France
Japan
46.8 46.8
49.7
53.5 52.8
55.2
53.6 54.1
46.3
48.9
46
48
50
52
54
56
2010 2011 2012 2013 2014 2015 2016
(%)
(Year)
U.S.UK
Germany
France
Japan
Employment rates in major countries (women)
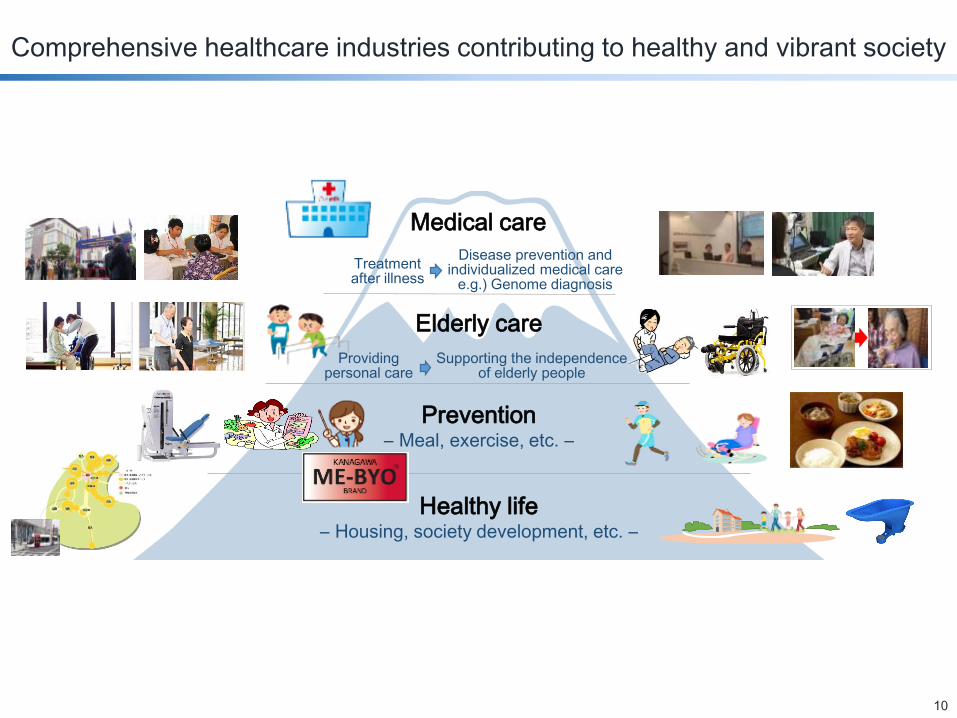
Comprehensive healthcare industries contributing to healthy and vibrant society
10
Medical care
Elderly care
Prevention― Meal, exercise, etc. ―
Healthy life― Housing, society development, etc. ―
Providingpersonal care
Supporting the independenceof elderly people
Treatment after illness
Disease prevention and individualized medical care
e.g.) Genome diagnosis
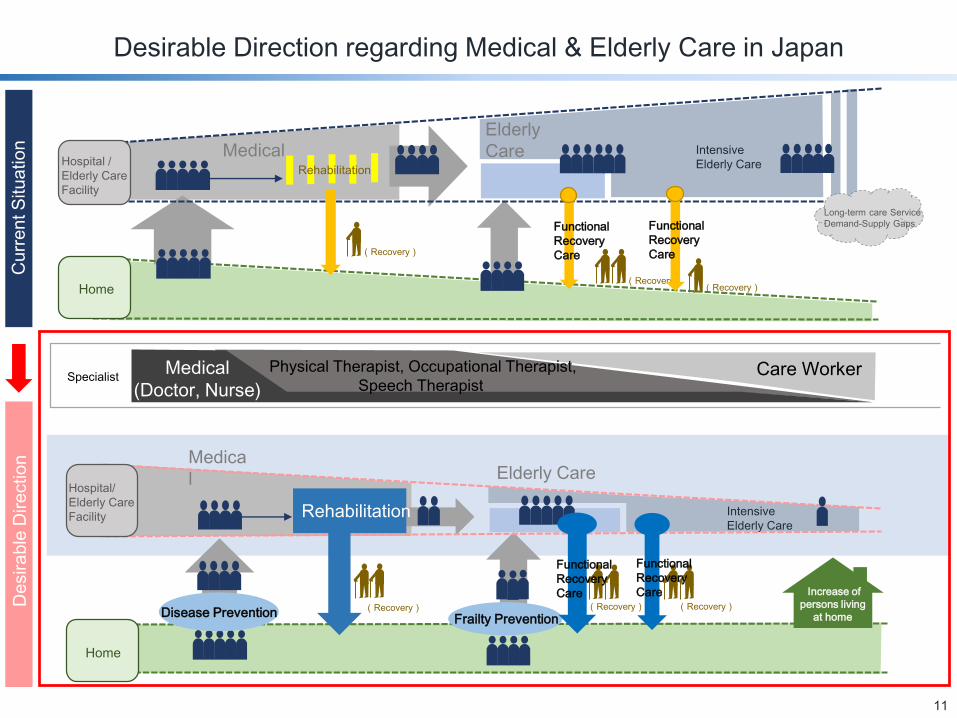
Cu
rre
nt S
itu
atio
nD
esira
ble
Dire
ctio
n
Medical Intensive
Elderly CareRehabilitation
Elderly
Care
Medica
l Elderly Care
Intensive
Elderly Care
Care WorkerPhysical Therapist, Occupational Therapist,
Speech TherapistMedical
(Doctor, Nurse)Specialist
(Recovery)
(Recovery)(Recovery)
(Recovery) (Recovery) (Recovery)
Home
Hospital /
Elderly Care
Facility
Frailty Prevention
Increase of
persons living
at home
Long-term care Service
Demand-Supply GapsFunctional
Recovery
Care
Disease Prevention
Rehabilitation
Functional
Recovery
Care
Home
Functional
Recovery
Care
Functional
Recovery
Care
Hospital/
Elderly Care
Facility
Desirable Direction regarding Medical & Elderly Care in Japan
11
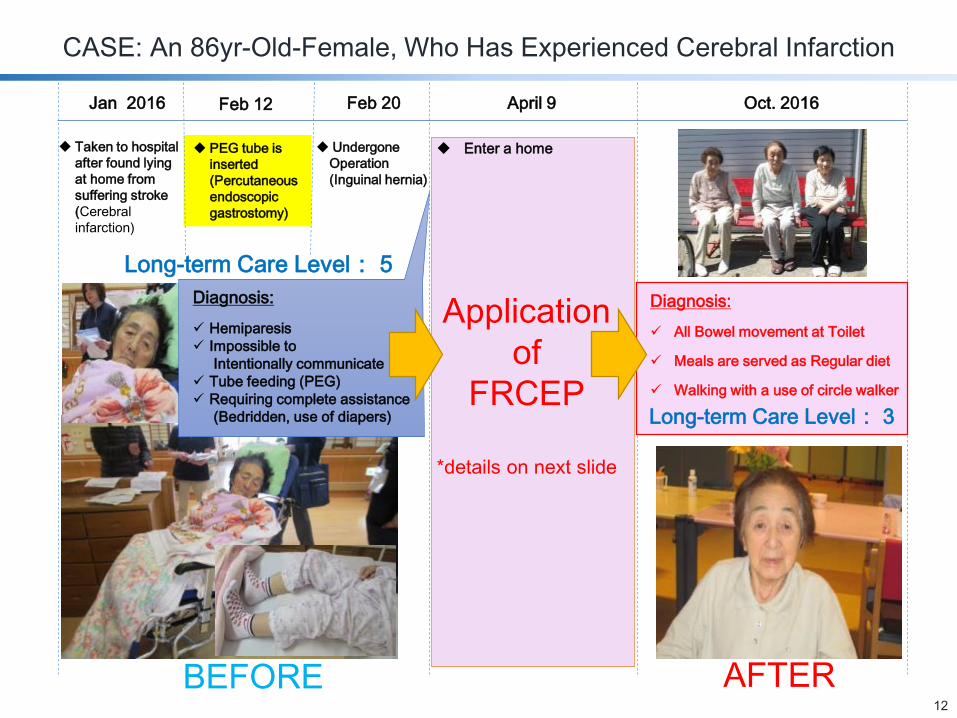
Jan 2016
Taken to hospital
after found lying
at home from
suffering stroke
(Cerebral
infarction)
Feb 12
PEG tube is
inserted
(Percutaneous
endoscopic
gastrostomy)
Feb 20 April 9
Enter a home
Oct. 2016
Diagnosis:
All Bowel movement at Toilet
Meals are served as Regular diet
Walking with a use of circle walker
Long-term Care Level: 5
Diagnosis:
Hemiparesis
Impossible to
Intentionally communicate
Tube feeding (PEG)
Requiring complete assistance
(Bedridden, use of diapers)
BEFORE AFTER
Undergone
Operation
(Inguinal hernia)
Application
of
FRCEP
*details on next slide
Long-term Care Level: 3
CASE: An 86yr-Old-Female, Who Has Experienced Cerebral Infarction
12
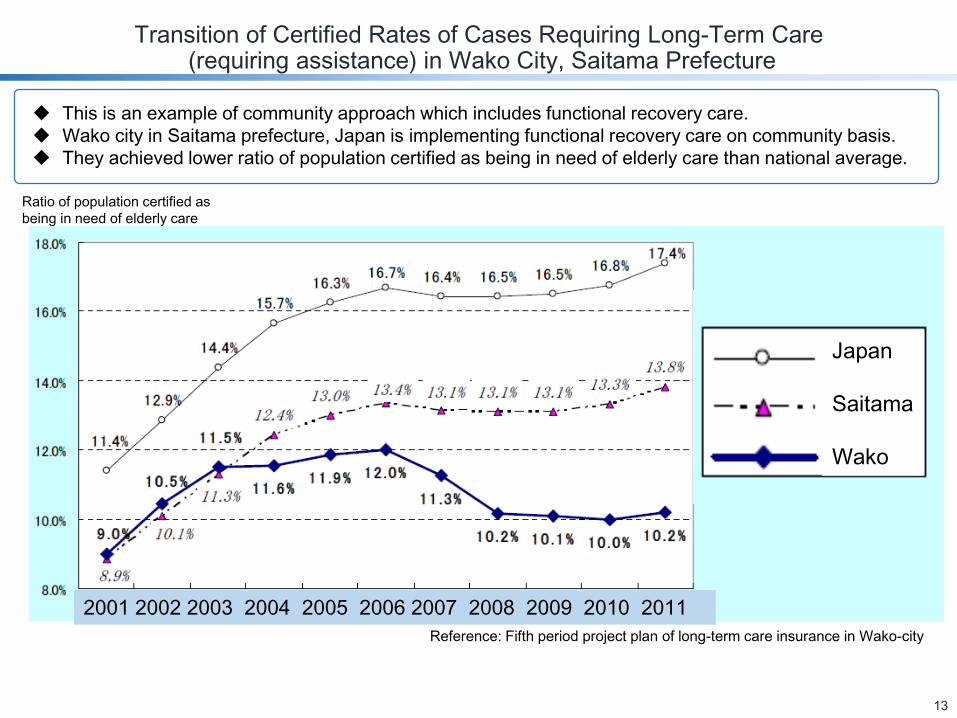
Reference: Fifth period project plan of long-term care insurance in Wako-city
Japan
Saitama
Wako
2001 2002 2003 2004 2005 2006 2007 2008 2009 2010 2011
Transition of Certified Rates of Cases Requiring Long-Term Care(requiring assistance) in Wako City, Saitama Prefecture
13
This is an example of community approach which includes functional recovery care.
Wako city in Saitama prefecture, Japan is implementing functional recovery care on community basis.
They achieved lower ratio of population certified as being in need of elderly care than national average.
Ratio of population certified as
being in need of elderly care
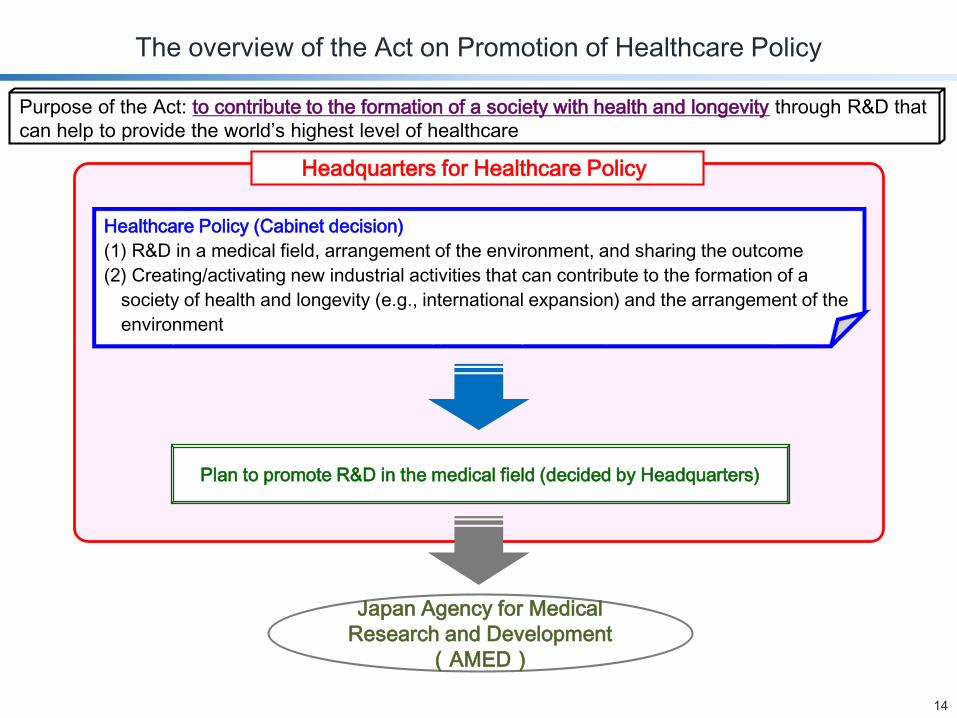
The overview of the Act on Promotion of Healthcare Policy
14
Japan Agency for Medical
Research and Development
(AMED)
Headquarters for Healthcare Policy
Healthcare Policy (Cabinet decision)
(1) R&D in a medical field, arrangement of the environment, and sharing the outcome
(2) Creating/activating new industrial activities that can contribute to the formation of a
society of health and longevity (e.g., international expansion) and the arrangement of the
environment
Plan to promote R&D in the medical field (decided by Headquarters)
Purpose of the Act: to contribute to the formation of a society with health and longevity through R&D that
can help to provide the world’s highest level of healthcare
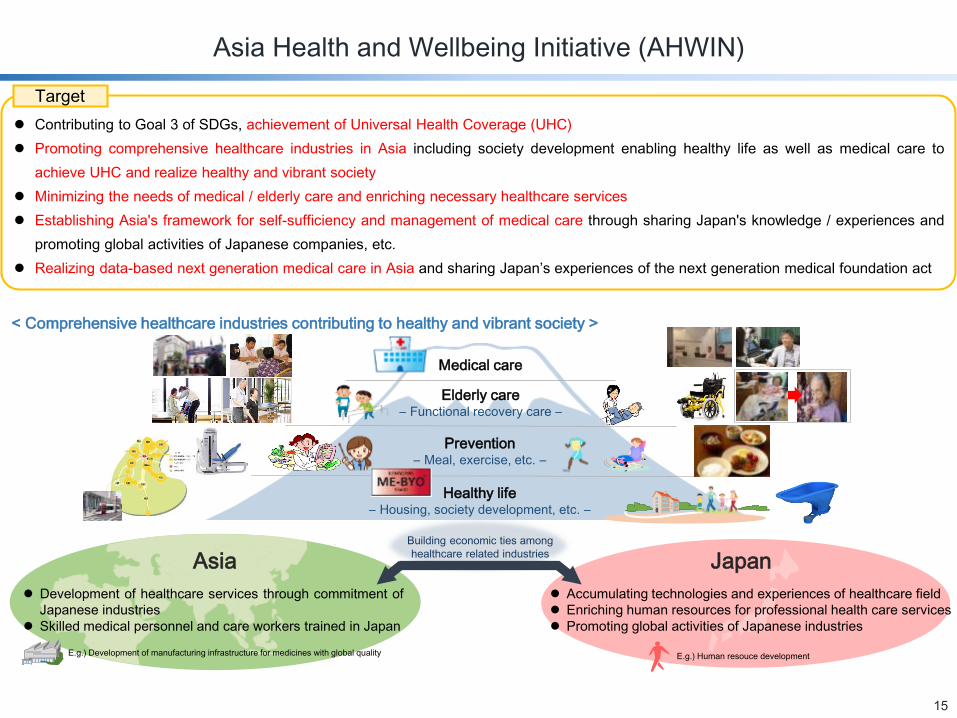
Asia Health and Wellbeing Initiative (AHWIN)
15
Contributing to Goal 3 of SDGs, achievement of Universal Health Coverage (UHC)
Promoting comprehensive healthcare industries in Asia including society development enabling healthy life as well as medical care to
achieve UHC and realize healthy and vibrant society
Minimizing the needs of medical / elderly care and enriching necessary healthcare services
Establishing Asia's framework for self-sufficiency and management of medical care through sharing Japan's knowledge / experiences and
promoting global activities of Japanese companies, etc.
Realizing data-based next generation medical care in Asia and sharing Japan’s experiences of the next generation medical foundation act
Target
Medical care
Elderly care― Functional recovery care ―
Prevention― Meal, exercise, etc. ―
Healthy life― Housing, society development, etc. ―
AsiaBuilding economic ties among
healthcare related industries
Accumulating technologies and experiences of healthcare field
Enriching human resources for professional health care services
Promoting global activities of Japanese industries
Japan
Development of healthcare services through commitment of
Japanese industries
Skilled medical personnel and care workers trained in Japan
E.g.) Human resouce developmentE.g.) Development of manufacturing infrastructure for medicines with global quality
< Comprehensive healthcare industries contributing to healthy and vibrant society >

Thank you for your attention


![Japan’s foremost Tsugaru Shamisen Performers OYAMA X … Poster 1[1].pdf · Japan’s foremost Tsugaru Shamisen Performers OYAMA X NITTA The Japan/America Society of Kentucky and](https://static.fdocuments.us/doc/165x107/5abcda5e7f8b9a321b8e89d4/japans-foremost-tsugaru-shamisen-performers-oyama-x-poster-11pdfjapans.jpg)