AFRL-VA-WP-TR-2005-3048 - DTIC
109
AFRL-VA-WP-TR-2005-3048 STRATEGIES FOR HUMAN- AUTOMATON RESOURCE ENTITY DEPLOYMENT (SHARED) Dr. Jose B. Cruz, Jr. Department of Electrical and Computer Engineering The Ohio State University 752 Dreese Laboratories 2015 Neil Avenue Columbus, OH 43210-1272 Air Force Institute of Technology Iterativity, Inc. University of Cincinnati University of Pittsburgh DECEMBER 2003 Final Report for 11 September 2001 – 31 December 2003 Approved for public release; distribution is unlimited. STINFO FINAL REPORT AIR VEHICLES DIRECTORATE AIR FORCE MATERIEL COMMAND AIR FORCE RESEARCH LABORATORY WRIGHT-PATTERSON AIR FORCE BASE, OH 45433-7542
Transcript of AFRL-VA-WP-TR-2005-3048 - DTIC
AFRL-VA-WP-TR-2005-3048 STRATEGIES FOR HUMAN-AUTOMATON RESOURCE ENTITY DEPLOYMENT (SHARED) Dr. Jose B. Cruz, Jr. Department of Electrical and Computer Engineering The Ohio State University 752 Dreese Laboratories 2015 Neil Avenue Columbus, OH 43210-1272 Air Force Institute of Technology Iterativity, Inc. University of Cincinnati University of Pittsburgh DECEMBER 2003 Final Report for 11 September 2001 – 31 December 2003
Approved for public release; distribution is unlimited.
STINFO FINAL REPORT
AIR VEHICLES DIRECTORATE AIR FORCE MATERIEL COMMAND AIR FORCE RESEARCH LABORATORY WRIGHT-PATTERSON AIR FORCE BASE, OH 45433-7542
NOTICE Using Government drawings, specifications, or other data included in this document for any purpose other than Government procurement does not in any way obligate the U.S. Government. The fact that the Government formulated or supplied the drawings, specifications, or other data does not license the holder or any other person or corporation; or convey any rights or permission to manufacture, use, or sell any patented invention that may relate to them. This report was cleared for public release by the Air Force Research Laboratory Wright Site Public Affairs Office (AFRL/WS) and is releasable to the National Technical Information Service (NTIS). It will be available to the general public, including foreign nationals. THIS TECHNICAL REPORT IS APPROVED FOR PUBLICATION. /s/ /s/ __________________________________________ _________________________________________ MARK J. MEARS DEBORAH S. GRISMER Program Engineer Chief, Control Design and Analysis Branch Control Design and Analysis Branch Air Force Research Laboratory /s/ __________________________________________ BRIAN W. VAN VLIET, Chief Control Sciences Division Air Vehicles Directorate This report is published in the interest of scientific and technical information exchange and its publication does not constitute the Government’s approval or disapproval of its ideas or findings.
i
REPORT DOCUMENTATION PAGE Form Approved OMB No. 0704-0188
The public reporting burden for this collection of information is estimated to average 1 hour per response, including the time for reviewing instructions, searching existing data sources, searching existing data sources, gathering and maintaining the data needed, and completing and reviewing the collection of information. Send comments regarding this burden estimate or any other aspect of this collection of information, including suggestions for reducing this burden, to Department of Defense, Washington Headquarters Services, Directorate for Information Operations and Reports (0704-0188), 1215 Jefferson Davis Highway, Suite 1204, Arlington, VA 22202-4302. Respondents should be aware that notwithstanding any other provision of law, no person shall be subject to any penalty for failing to comply with a collection of information if it does not display a currently valid OMB control number. PLEASE DO NOT RETURN YOUR FORM TO THE ABOVE ADDRESS.
1. REPORT DATE (DD-MM-YY) 2. REPORT TYPE 3. DATES COVERED (From - To)
December 2003 Final 09/11/2001 – 12/31/2003 5a. CONTRACT NUMBER
F33615-01-C-3151 5b. GRANT NUMBER
4. TITLE AND SUBTITLE
STRATEGIES FOR HUMAN-AUTOMATON RESOURCE ENTITY DEPLOYMENT (SHARED)
5c. PROGRAM ELEMENT NUMBER 0602301
5d. PROJECT NUMBER
A055 5e. TASK NUMBER
6. AUTHOR(S)
Dr. Jose B. Cruz, Jr.
5f. WORK UNIT NUMBER
0C 7. PERFORMING ORGANIZATION NAME(S) AND ADDRESS(ES) 8. PERFORMING ORGANIZATION
REPORT NUMBER Department of Electrical and Computer Engineering The Ohio State University 752 Dreese Laboratories 2015 Neil Avenue Columbus, OH 43210-1272
Air Force Institute of Technology Iterativity, Inc. University of Cincinnati University of Pittsburgh
9. SPONSORING/MONITORING AGENCY NAME(S) AND ADDRESS(ES) 10. SPONSORING/MONITORING AGENCY ACRONYM(S)
AFRL/VACA Air Vehicles Directorate Air Force Research Laboratory Air Force Materiel Command Wright-Patterson Air Force Base, OH 45433-7542
DARPA/IXO 11. SPONSORING/MONITORING
AGENCY REPORT NUMBER(S) AFRL-VA-WP-TR-2005-3048
12. DISTRIBUTION/AVAILABILITY STATEMENT Approved for public release; distribution is unlimited.
13. SUPPLEMENTARY NOTES Report contains color.
14. ABSTRACT
This report documents work done with DARPA funding, under contract F33615-01-C-3151 for the period of performance of September 2001 through December 2003. The main goal of the SHARED project is to develop a methodology for hierarchical control, including theory, algorithms, and experimentations. The goal also is to demonstrate the methodology in a prototype tool for optimal planning of shared responsibilities and roles in the hierarchical deployment and operation of teams of distributed cooperative automaton entities and human operators in future combat systems, in adversarial and uncertain situations. The underlying theme of the SHARED project is the use a hierarchical game theoretic framework, where entities at different levels use leader-follower games, peer entities at the same level use principles of cooperative games, robustness and estimation theory are blended, and total system design is human-centered.
15. SUBJECT TERMS Cooperative Control, Task Planning, Uncertainty, Path Planning, UAVs
16. SECURITY CLASSIFICATION OF: 19a. NAME OF RESPONSIBLE PERSON (Monitor) a. REPORT Unclassified
b. ABSTRACT Unclassified
c. THIS PAGE Unclassified
17. LIMITATION OF ABSTRACT:
SAR
18. NUMBER OF PAGES
112 Mark J. Mears 19b. TELEPHONE NUMBER (Include Area Code)
(937) 255-8685
Standard Form 298 (Rev. 8-98) Prescribed by ANSI Std. Z39-18

iii
Table of Contents 1 Introduction............................................................................................................................. 1
1.1 TCT Summary ................................................................................................................ 1
1.2 TDT Summary ................................................................................................................ 2
1.3 CPP Summary................................................................................................................. 4
1.4 VIA Summary................................................................................................................. 4
1.5 SHARED Scenario of Use .............................................................................................. 5
2 Research Goals and Objectives............................................................................................... 8
2.1 TCT Goals....................................................................................................................... 8
2.2 TDT Goals ...................................................................................................................... 8
2.2.1 TDT-Hierarchical Goals ......................................................................................... 8
2.2.2 TDT-ULTRA Goals.............................................................................................. 11
2.3 CPP Goals ..................................................................................................................... 14
2.4 VIA Goals ..................................................................................................................... 14
3 Progress Against SOW ......................................................................................................... 18
3.1 TCT Development ........................................................................................................ 18
3.2 TDT-Hierarchical Development ................................................................................... 18
3.3 TDT-ULTRA Development.......................................................................................... 19
3.4 CPPP Development....................................................................................................... 20
3.5 CPPS Development....................................................................................................... 21
3.6 Architecture and VIA Development ............................................................................. 22
4 Accomplishments and Achievements ................................................................................... 28
4.1 TCT Accomplishments ................................................................................................. 28
4.1.1 Basic Assumptions:............................................................................................... 29
4.1.2 Utilizing an Interactive Rule Base ........................................................................ 32
4.1.3 Probabilistic Resource Allocation......................................................................... 34
4.1.4 Evaluating Adversarial Resource Allocation........................................................ 35
4.2 TDT-Hierarchical Accomplishments............................................................................ 36
4.2.1 P-Controllers ......................................................................................................... 36
iv
4.2.2 TDT Multi-Level Architecture ............................................................................. 36
4.2.3 AI-Based Task Assignment .................................................................................. 40
4.2.4 Extended Bidirectional Associative Memory ....................................................... 40
4.2.5 Cooperative Jamming Strategy ............................................................................. 41
4.2.6 Cooperative Decoy Deployment........................................................................... 43
4.2.7 Experiments and Simulation Result of TDT-Hierarchical.................................... 44
4.3 TDT-ULTRA Accomplishments: ................................................................................. 45
4.4 CPPP Accomplishments ............................................................................................... 61
4.4.1 Accomplishments on Theory ................................................................................ 61
4.4.2 Accomplishments on Implementation/Simulation................................................ 61
4.5 CPPS Accomplishments ............................................................................................... 65
4.6 SHARED System and VIA Accomplishments ............................................................. 70
4.6.1 Domain Model Detailed System Design............................................................... 73
4.6.2 Interaction Model Detailed System Design .......................................................... 88
4.6.3 Presentation Model Detailed System Design........................................................ 93
5 Research Required ................................................................................................................ 94
5.1 TCT Research Required................................................................................................ 94
5.2 TDT Research Required ............................................................................................... 94
5.2.1 TDT-Hierarchical.................................................................................................. 94
5.2.2 TDT-ULTRA ........................................................................................................ 94
5.3 CPP Research Required ................................................................................................ 95
5.3.1 CPPP ..................................................................................................................... 95
5.3.2 CPPS ..................................................................................................................... 95
5.4 VIA Research Required ................................................................................................ 96
6 References and Standards ..................................................................................................... 97
7 Publications........................................................................................................................... 98
7.1 TCT Publications .......................................................................................................... 98
7.2 OSU TDT Publications ................................................................................................. 98
7.3 Pittsburgh TDT Publications......................................................................................... 98
7.4 CPPP Publications ........................................................................................................ 99
7.5 CPPS Publications ...................................................................................................... 100

v
7.6 VIA Publications......................................................................................................... 100
SHARED Final Report
vi
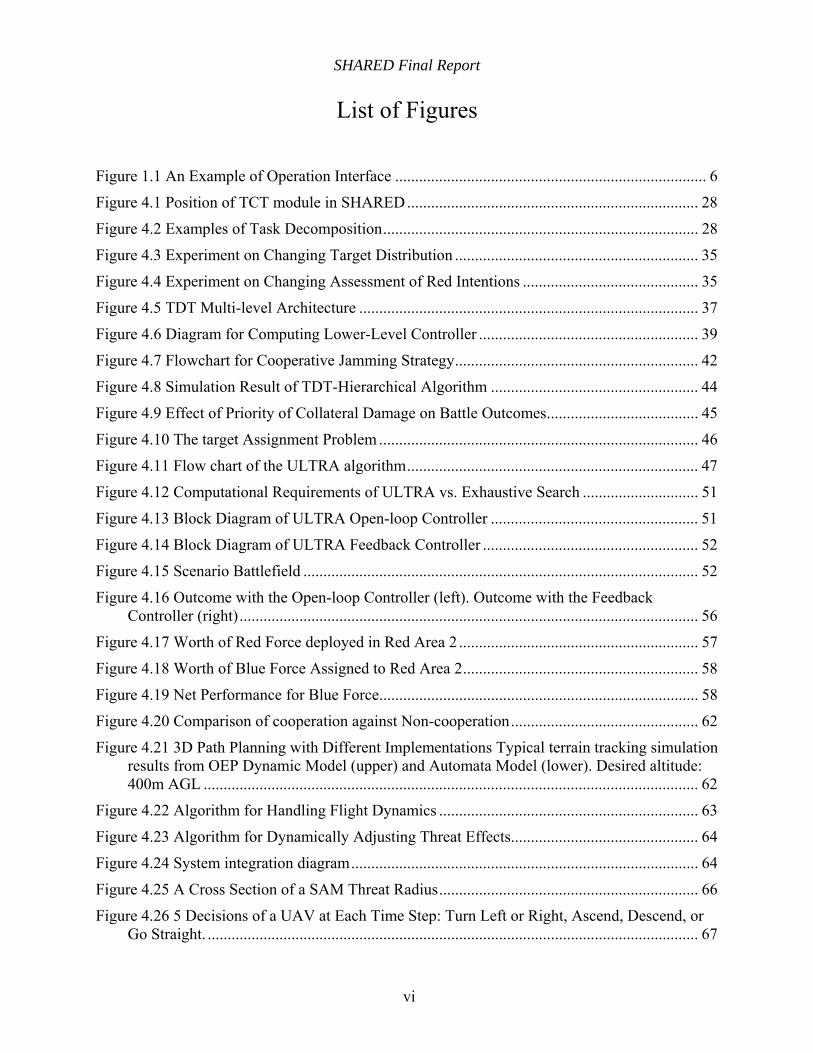
List of Figures
Figure 1.1 An Example of Operation Interface .............................................................................. 6
Figure 4.1 Position of TCT module in SHARED......................................................................... 28
Figure 4.2 Examples of Task Decomposition............................................................................... 28
Figure 4.3 Experiment on Changing Target Distribution ............................................................. 35
Figure 4.4 Experiment on Changing Assessment of Red Intentions ............................................ 35
Figure 4.5 TDT Multi-level Architecture ..................................................................................... 37
Figure 4.6 Diagram for Computing Lower-Level Controller ....................................................... 39
Figure 4.7 Flowchart for Cooperative Jamming Strategy............................................................. 42
Figure 4.8 Simulation Result of TDT-Hierarchical Algorithm .................................................... 44
Figure 4.9 Effect of Priority of Collateral Damage on Battle Outcomes...................................... 45
Figure 4.10 The target Assignment Problem ................................................................................ 46
Figure 4.11 Flow chart of the ULTRA algorithm......................................................................... 47
Figure 4.12 Computational Requirements of ULTRA vs. Exhaustive Search ............................. 51
Figure 4.13 Block Diagram of ULTRA Open-loop Controller .................................................... 51
Figure 4.14 Block Diagram of ULTRA Feedback Controller ...................................................... 52
Figure 4.15 Scenario Battlefield ................................................................................................... 52
Figure 4.16 Outcome with the Open-loop Controller (left). Outcome with the Feedback Controller (right)................................................................................................................... 56
Figure 4.17 Worth of Red Force deployed in Red Area 2 ............................................................ 57
Figure 4.18 Worth of Blue Force Assigned to Red Area 2........................................................... 58
Figure 4.19 Net Performance for Blue Force................................................................................ 58
Figure 4.20 Comparison of cooperation against Non-cooperation............................................... 62
Figure 4.21 3D Path Planning with Different Implementations Typical terrain tracking simulation results from OEP Dynamic Model (upper) and Automata Model (lower). Desired altitude: 400m AGL ............................................................................................................................ 62
Figure 4.22 Algorithm for Handling Flight Dynamics ................................................................. 63
Figure 4.23 Algorithm for Dynamically Adjusting Threat Effects............................................... 64
Figure 4.24 System integration diagram....................................................................................... 64
Figure 4.25 A Cross Section of a SAM Threat Radius................................................................. 66
Figure 4.26 5 Decisions of a UAV at Each Time Step: Turn Left or Right, Ascend, Descend, or Go Straight. ........................................................................................................................... 67
SHARED Final Report
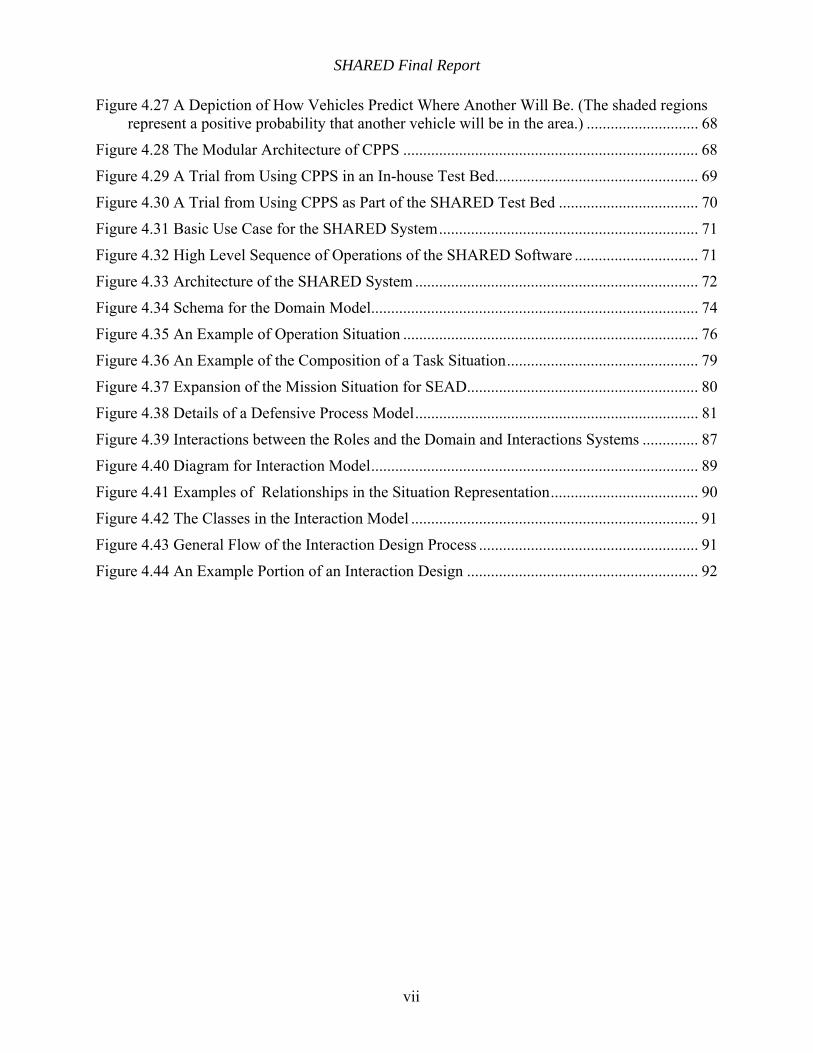
vii
Figure 4.27 A Depiction of How Vehicles Predict Where Another Will Be. (The shaded regions represent a positive probability that another vehicle will be in the area.) ............................ 68
Figure 4.28 The Modular Architecture of CPPS .......................................................................... 68
Figure 4.29 A Trial from Using CPPS in an In-house Test Bed................................................... 69
Figure 4.30 A Trial from Using CPPS as Part of the SHARED Test Bed ................................... 70
Figure 4.31 Basic Use Case for the SHARED System................................................................. 71
Figure 4.32 High Level Sequence of Operations of the SHARED Software ............................... 71
Figure 4.33 Architecture of the SHARED System ....................................................................... 72
Figure 4.34 Schema for the Domain Model.................................................................................. 74
Figure 4.35 An Example of Operation Situation .......................................................................... 76
Figure 4.36 An Example of the Composition of a Task Situation................................................ 79
Figure 4.37 Expansion of the Mission Situation for SEAD.......................................................... 80
Figure 4.38 Details of a Defensive Process Model....................................................................... 81
Figure 4.39 Interactions between the Roles and the Domain and Interactions Systems .............. 87
Figure 4.40 Diagram for Interaction Model.................................................................................. 89
Figure 4.41 Examples of Relationships in the Situation Representation..................................... 90
Figure 4.42 The Classes in the Interaction Model ........................................................................ 91
Figure 4.43 General Flow of the Interaction Design Process ....................................................... 91
Figure 4.44 An Example Portion of an Interaction Design .......................................................... 92
SHARED Final Report
viii
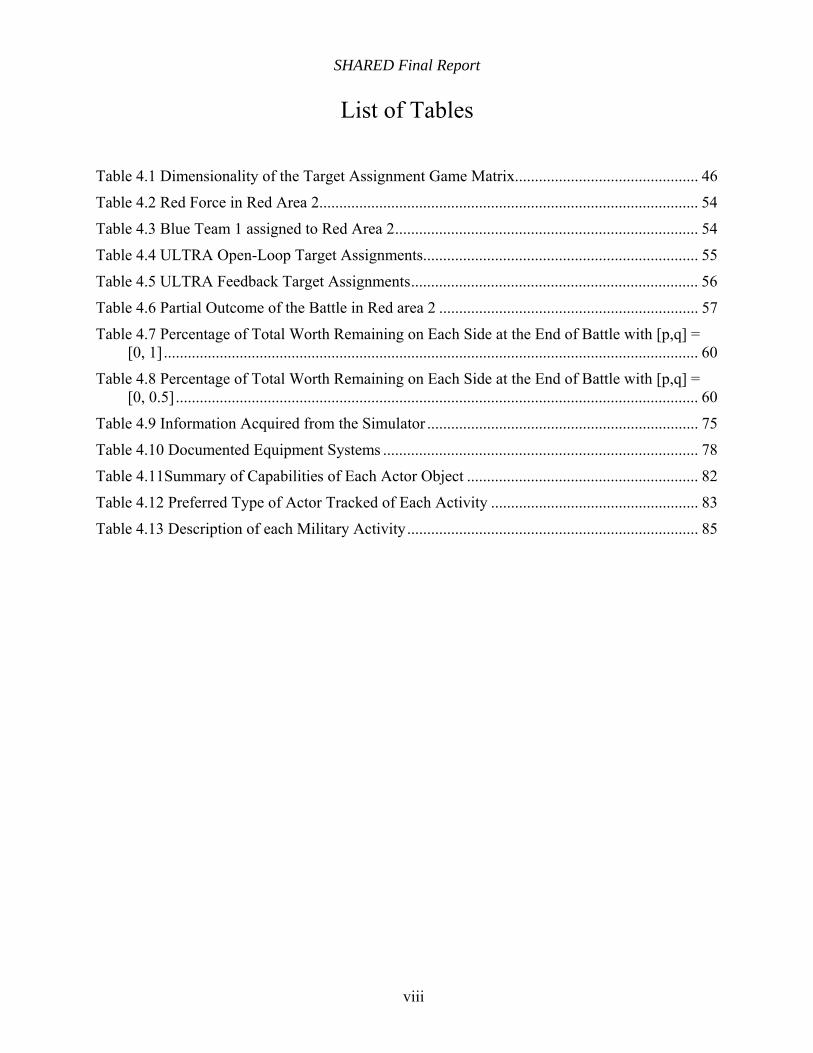
List of Tables
Table 4.1 Dimensionality of the Target Assignment Game Matrix.............................................. 46
Table 4.2 Red Force in Red Area 2............................................................................................... 54
Table 4.3 Blue Team 1 assigned to Red Area 2............................................................................ 54
Table 4.4 ULTRA Open-Loop Target Assignments..................................................................... 55
Table 4.5 ULTRA Feedback Target Assignments........................................................................ 56
Table 4.6 Partial Outcome of the Battle in Red area 2 ................................................................. 57
Table 4.7 Percentage of Total Worth Remaining on Each Side at the End of Battle with [p,q] = [0, 1]...................................................................................................................................... 60
Table 4.8 Percentage of Total Worth Remaining on Each Side at the End of Battle with [p,q] = [0, 0.5]................................................................................................................................... 60
Table 4.9 Information Acquired from the Simulator .................................................................... 75
Table 4.10 Documented Equipment Systems ............................................................................... 78
Table 4.11Summary of Capabilities of Each Actor Object .......................................................... 82
Table 4.12 Preferred Type of Actor Tracked of Each Activity .................................................... 83
Table 4.13 Description of each Military Activity......................................................................... 85

SHARED Final Report
1
1 Introduction
The main goal of the SHARED project is to develop a methodology for hierarchical control, including theory, algorithms, and experimentations. The goal also is to demonstrate the methodology in a prototype tool for optimal planning of shared responsibilities and roles in the hierarchical deployment and operation of teams of distributed cooperative automaton entities and human operators in future combat systems, in adversarial and uncertain situations.
The underlying theme of the SHARED project is the use a hierarchical game theoretic framework, where entities at different levels use leader-follower games, peer entities at the same level use principles of cooperative games, robustness and estimation theory are blended, and total system design is human-centered. The investigation at all levels of the functional hierarchy will explicitly consider presence of intelligent adversary using non-cooperative game theory.
In this section we briefly summarize the main modules of the SHARED software system, the TCT (Team Composition and Tasking), TDT (Team Dynamics and Tactics), CPP (Cooperative Path Planning) and VIA (Variable Initiative Automation). A short scenario of use for the SHARED system completes this section.
1.1 TCT Summary
The main purpose of TCT is to develop and provide an algorithm to schedule tasks at the mission level and allocate resources associated to these tasks. In order to accomplish this, a number of innovative developments were undertaken: first, a rule base is developed to help task prioritizing based on Rules of Engagements. Second, several parameters are introduced for a probabilistic framework for timing and resource calculation. Third, several criteria are considered in order to allocate the heterogeneous resources. TCT is within a large feedback loop where it is called if major discrepancies in expectations occurs or stages terminate.
The major accomplishments of TCT include:
Architecture of TCT was developed to perform task decomposition in the SHARED system.
TCT provides an algorithm of non-homogenous resource allocation based on the following variables:
o Number of targets.
o Air defensibility of targets.
o Target status, classified as potential, known, unknown.
o Information ability of targets, like communication capability.
TCT schedules the tasks using the following:
o Classify all tasks into several task types.
o Group all targets into several areas.
o Generate stages based on task types and tasks.
SHARED Final Report
2
o Provide several equations to estimate the duration for each stage.
o Develop a rule based from the information in hand to help schedule the whole process.
The above resource allocation algorithm, task scheduling and time estimation are integrated into a self-defined function in SHARED system, called the TCT agent. The TCT agent works to
o Generate task duration, including ending moments, based on all the current input task information
o Allocate available UAVs into each task associated with the first stage.
o Estimate the loss in both sides by a probability inner model of the battle, which is built by the information provided by the input data to the TCT agent.
o Allocate all estimated available UAVs into each tasks associated with the future stages, in order to give a whole view to the commander.
o Output all results, like stage information, the ending time and associated UAVs, ready to be presented to the human commander.
TCT also provides a pre-run simulator to estimate probabilistic outcomes (not integrated into system yet)
1.2 TDT Summary
The main purpose of TDT is to develop an effective target assignment algorithm and an optimal salvo size algorithm to destroy the opposing force combat capabilities. Furthermore, the TDT mission plan will find an optimal deployment of decoys, jamming and avoid collateral damage. There are two subparts: TDT Hierarchical and TDT ULTRA.
The major accomplishments of TDT Hierarchical are as follows:
A non-zero-sum non-cooperative game theoretical algorithm has been developed to determine the optimal salvo size to achieve the minimum remaining platforms of red and the maximum remaining platforms of blue at the end of a battle.
A Game Based hierarchical TDT architecture has been developed. This was accomplished by the innovative integration of heuristic based upper level planning (multi-stage UAV-target assignment) and event based lower level game, which considers the collateral damage effect.
A Cooperative Jamming Strategy has been developed to make use of the network-Centric paradigm by exploiting multiple platforms to gain geometric, physical and tactical advantage.
A Cooperative Decoy Deployment method has been developed to maximize the total probability of survival of Blue UAVs.
A software environment has been developed to test TDT is a simplified simulator which includes the AID, TCT, CPP and TDT. It can do multi-team & multi-mission tests.
SHARED Final Report
3
Full integration of TDT with AID and other modules of the SHARED project, and connectivity to software simulations and hardware demonstrations provided by the OEP.
The major accomplishments of TDT ULTRA are as follows:
The TDT ULTRA starts with an assignment obtained from the TCT level for a team of Blue UAV to be engaged in battle against a team of Red Units (SAM sites, troops, etc.). The basic premise of the TDT ULTRA is that if each Blue UAV is left to select its own Red targets based on its own information and with no coordination with other UAVs, then the result will be that each UAV will select the easiest and most visible Red target. That is, most UAVs will end up targeting the same Red unit and consequently many Red units will be missed. Thus the focus of the TDT ULTRA is to coordinate the Blue Team Target Selection Strategy (TSS) so as to maximize the collective Blue team damage against the Red units.
The TDT ULTRA assumes that the Red units are also optimizing and coordinating their targeting strategy against the Blue units and as a result determines the target selection strategy based on a game theoretic approach. The TDT ULTRA uses the Nash solution as the basis for determining the Blue team’s target selection strategy.
At the same time, the TDT ULTRA determines an “estimate” of the Red team’s target selection strategy.
The TDT ULTRA addresses the major issue of scalability that is often viewed as a drawback to the use of a game theoretic approach in target selection. This issue arises when the opposing teams consist of non-homogeneous units and hence a unit-on-unit target selection strategy has to be determined.
An efficient search method to determine the Non-Cooperative Nash Team Target Selection Strategy based on a Unit Level Team Resource Allocation search (ULTRA) has been developed to deal with this issue.
The ULTRA algorithm was tested for parameter sensitivity and robustness on numerous test examples and scenarios either developed at PITT or based on the Boeing challenge problems.
A fast real-time implementation of an ULTRA-based TDT controller in feedback form was developed.
The performance of ULTRA with and without feedback from the Boeing OEP was compared.
A Monte Carlo simulation approach was used to determine lower and upper bounds on ULTRA’s performance.
The concept of Distance Discount Factor (DDF) was introduced to address the issue that close but less significant targets could be more important than more significant but far targets.
The TDT ULTRA based on ULTRA was fully integrated into the SHARED system. It includes the following features: (a) Sensor scheduling (Find, Identify, and BDA), (b) Multiple types of weapons per UAV, (c) Movement, position, and firing range, (d) Non-
SHARED Final Report
4
uniform planning horizons, (e) Jamming and use of decoys, (f) Non Combat (Sensor) UAVs, (g) Adherence to R.O.E., and (h) Long term planning.
Finally, the Nash target selection strategy used in ULTRA was compared to naïve target selection strategies such as a random selection strategy and a unit greedy selection strategy. The results show that there is considerable advantage to using the Nash strategy.
1.3 CPP Summary
The main purpose of CPP is to develop a set of algorithms such that UAVs in a given scenario could cooperatively find a desired path to reach certain destinations and search a bounded area to increase certainty in the area. The CPP module is decomposed into two sub-modules: CPP-PointToPoint (CPPP) and CPP-Search (CPPS).
CPPP specifies way-points for UAVs to reach certain destinations while meeting certain requirements, including minimizing en route dangers, meeting time constraints, keeping mutual spacing, and decreasing fuel consumption, etc.
The major accomplishments of CPPP include:
A biological perspective is adopted on UAV groups and foraging theory is applied in cooperative path planning. The cohesion properties of the UAV groups are studied in a stability-theoretic framework.
Different dynamic models for UAVs are constructed and different implementations are compared for purpose of evaluation.
Three dimensional path planning algorithm is developed and its capability is enhanced with a heuristic approach. The impacts of uncertainty and limited UAV sensing capability on the path planning are also investigated.
All algorithms are implemented in OEP testbed and theoretical results are verified. Full system integration is accomplished.
Cooperative Path Planning: Search is concerned with directing the paths of UAV’s such that uncertainty about the environment is reduced and new targets are discovered while previously discovered targets are classified. This is a key problem to solve in the presence of uncertainty.
The major accomplishments of CPPS are:
Formulation of a stochastic decision-making algorithm to produce paths for the CPP Search problem.
Model of targets and threats in a 3-D environment
Development of cooperative methods to allow for decentralized planning
Integration of approach with rest of SHARED
1.4 VIA Summary
The object of the Variable Initiative Automation (VIA) portion of the SHARED project was to apply automated interaction design (AID) technology to military command and control domains,
SHARED Final Report
5
particularly automated planning environments, with the basic goal of meeting the human interaction requirements for control of multiple groups of unmanned air vehicles performing SEAD missions. In addition, this portion of the project was responsible for the overall system architecture, module integration, and software development.
Research goals emphasize the use of design automation technology to prove the concept of user interface creation by software agents, based on user needs and capabilities and reflecting the dynamically changing status of the situation.
Application goals emphasize the development and implementation of the SHARED software and the demonstration of advanced automated reasoning, planning, and design in a hardware context.
High level VIA project accomplishments included:
• Research and development leading to an AID system that provides consistent and useful situated interactions between a commander and a squad of unmanned aerial vehicles, supporting the full range of mixed-initiative control required.
• Design and implementation of the SHARED software application as a set of software agents, based on advanced automated reasoning capabilities and compositional knowledge representation structures.
• Full integration of specialized planners developed in other portions of the SHARED project, and connectivity to software simulations and hardware demonstrations provided by the OEP.
1.5 SHARED Scenario of Use
The commander is assigned a squad of UAVs and an area of operations. When SHARED is initially started, IPB is collected from the simulator and a situation model is built from that information by extending the semantics of the entities in the situation and interconnecting them through hierarchical and relational information.
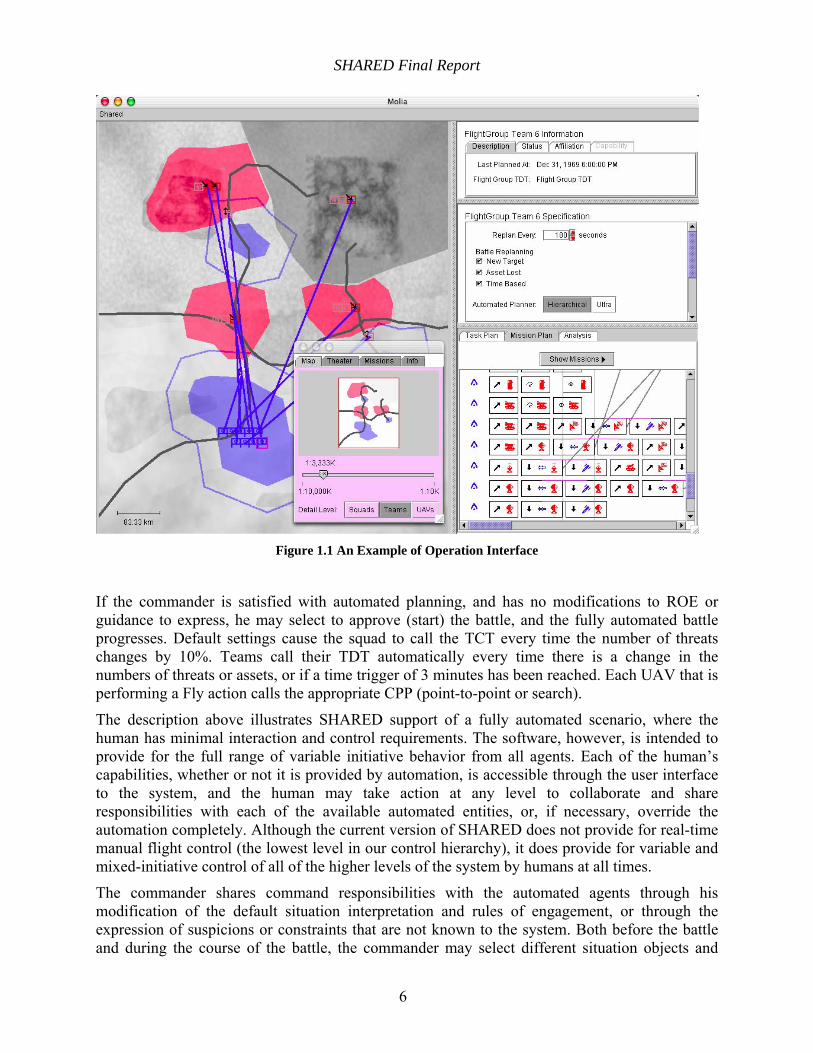
Each object in the situation model is responsible for interacting as necessary with other objects. For example, when the object representing the squad of UAVs has an unfilled plan, and so looks for associated agents who can perform the task planning activity it requires. If it has an associated TCT Agent that is capable of team formation, it calls that TCT to request a plan. If there isn’t a TCT, it assigns its planning activity to the human and sends the planning request through the UI. In the same way, once they are created, teams need to be planned, and so call a TDT agent. The result is a default plan on the situation. Once the situation is fully formed and planners have been called, the human need for interaction with the situation causes the UI to be presented to the commander (including interactions for activities that haven’t been performed because the automation may not be available). An example screen shot is shown below.
SHARED Final Report
6
Figure 1.1 An Example of Operation Interface
If the commander is satisfied with automated planning, and has no modifications to ROE or guidance to express, he may select to approve (start) the battle, and the fully automated battle progresses. Default settings cause the squad to call the TCT every time the number of threats changes by 10%. Teams call their TDT automatically every time there is a change in the numbers of threats or assets, or if a time trigger of 3 minutes has been reached. Each UAV that is performing a Fly action calls the appropriate CPP (point-to-point or search).
The description above illustrates SHARED support of a fully automated scenario, where the human has minimal interaction and control requirements. The software, however, is intended to provide for the full range of variable initiative behavior from all agents. Each of the human’s capabilities, whether or not it is provided by automation, is accessible through the user interface to the system, and the human may take action at any level to collaborate and share responsibilities with each of the available automated entities, or, if necessary, override the automation completely. Although the current version of SHARED does not provide for real-time manual flight control (the lowest level in our control hierarchy), it does provide for variable and mixed-initiative control of all of the higher levels of the system by humans at all times.
The commander shares command responsibilities with the automated agents through his modification of the default situation interpretation and rules of engagement, or through the expression of suspicions or constraints that are not known to the system. Both before the battle and during the course of the battle, the commander may select different situation objects and
SHARED Final Report
7
modify parameters that change will affect the actions of the planners. For example, at the team level of detail, the commander may change the high-level identification certainty required for attack, or express ideas about enemy intent. At the level of each enemy area, the commander can change the objectives for that area (SEAD, Interdiction, Close Air Support). For each enemy system, the Rules of Engagement (TCT [time critical target], Kill Zone [only attack in kill zone], Hostilities [only if attacked], or No Strike) may be changed, and suspected objects can be added and placed in their most likely location on the battlefield. In addition, the measure of merit may be set individually for each enemy system. Friendly areas are protected by default, but the commander can change that setting to exclude blue protection for any zone.
In addition to control over the planning parameters at various levels, the commander may invoke planning manually, and has full control over the parameters under which automated re-planning will take place. Both the TCT and the individual TDT planners may be set to re-plan after a specified elapsed time or based on a specified level of change to assets or targets. Throughout the planning and battle stages, the commander is presented with displays that allow him full situational awareness of the evolving situation together with the ability to take action at any level of granularity, as necessary.
SHARED Final Report
8
2 Research Goals and Objectives 2.1 TCT Goals
The research goals/objectives of TCT are to provide a hierarchical system tool for human commander to plan the whole mission. A sequence of tasks associated with the length of time should be provided by TCT module. Given a set of heterogeneous resources, the team for each task needs to be formed. TCT module also needs to communicate/interact with other modules and human in the system. A simulation capability to evaluate outcomes was also developed.
2.2 TDT Goals
Two research groups, one at OSU and one at Pittsburgh, developed TDT approaches.
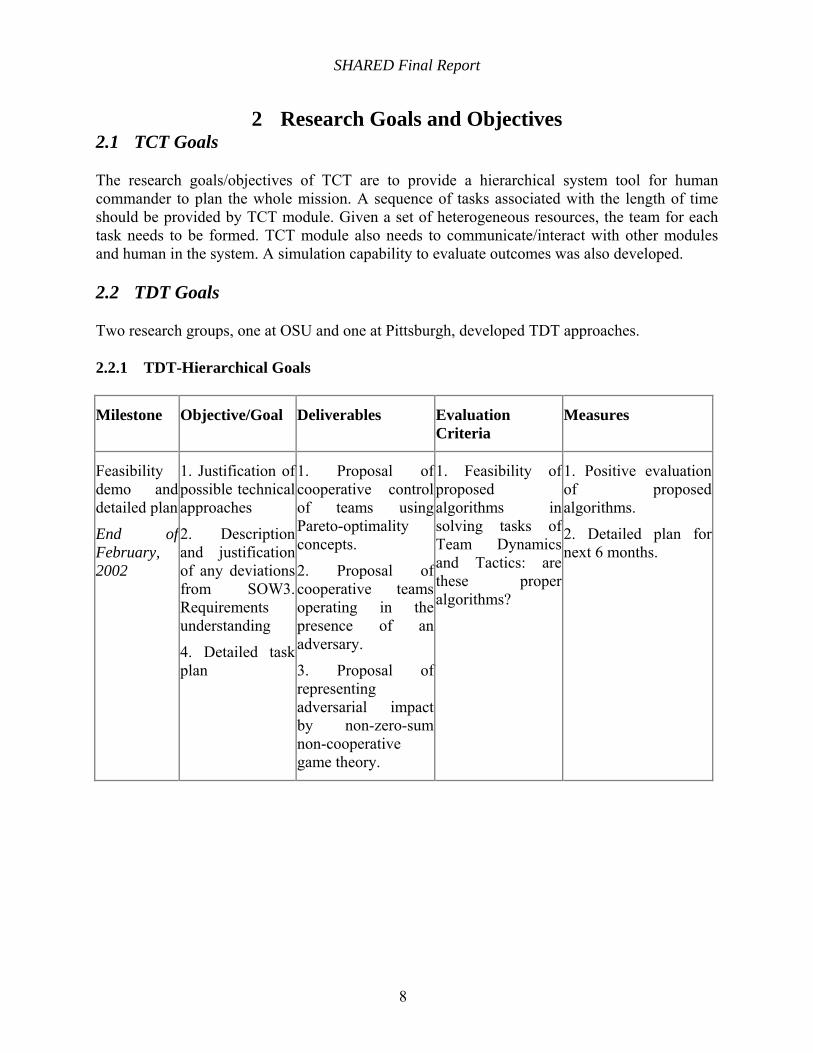
2.2.1 TDT-Hierarchical Goals
Milestone Objective/Goal Deliverables Evaluation Criteria
Measures
Feasibility demo and detailed plan
End of February, 2002
1. Justification of possible technical approaches
2. Description and justification of any deviations from SOW3. Requirements understanding
4. Detailed task plan
1. Proposal of cooperative control of teams using Pareto-optimality concepts.
2. Proposal of cooperative teams operating in the presence of an adversary.
3. Proposal of representing adversarial impact by non-zero-sum non-cooperative game theory.
1. Feasibility of proposed algorithms in solving tasks of Team Dynamics and Tactics: are these proper algorithms?
1. Positive evaluation of proposed algorithms.
2. Detailed plan for next 6 months.
SHARED Final Report
9
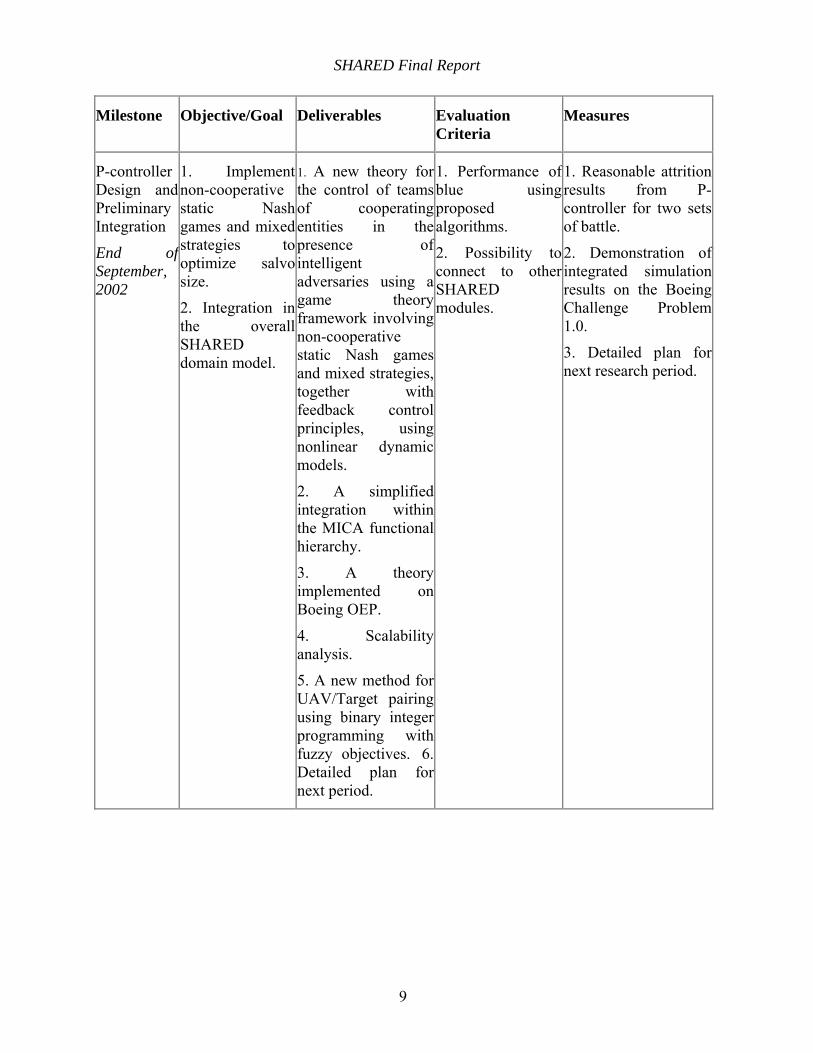
Milestone Objective/Goal Deliverables Evaluation Criteria
Measures
P-controller Design and Preliminary Integration
End of September, 2002
1. Implement non-cooperative static Nash games and mixed strategies to optimize salvo size.
2. Integration in the overall SHARED domain model.
1. A new theory for the control of teams of cooperating entities in the presence of intelligent adversaries using a game theory framework involving non-cooperative static Nash games and mixed strategies, together with feedback control principles, using nonlinear dynamic models.
2. A simplified integration within the MICA functional hierarchy.
3. A theory implemented on Boeing OEP.
4. Scalability analysis.
5. A new method for UAV/Target pairing using binary integer programming with fuzzy objectives. 6. Detailed plan for next period.
1. Performance of blue using proposed algorithms.
2. Possibility to connect to other SHARED modules.
1. Reasonable attrition results from P-controller for two sets of battle.
2. Demonstration of integrated simulation results on the Boeing Challenge Problem 1.0.
3. Detailed plan for next research period.
SHARED Final Report
10
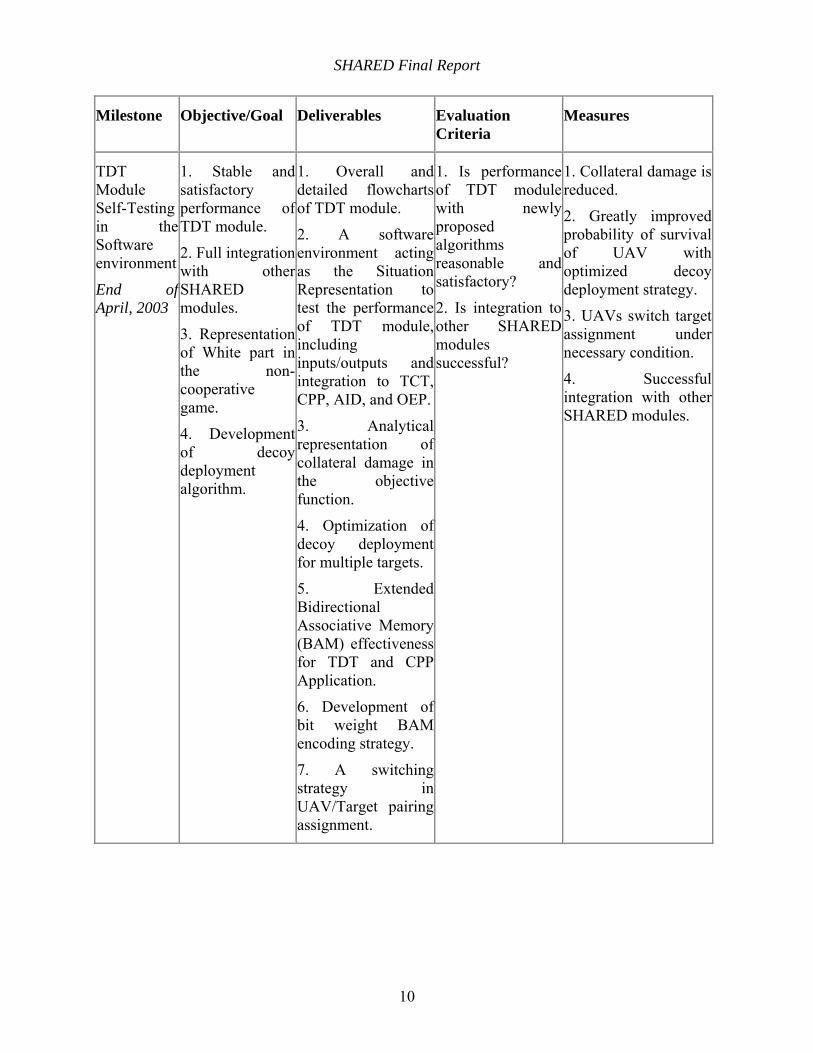
Milestone Objective/Goal Deliverables Evaluation Criteria
Measures
TDT Module Self-Testing in the Software environment
End of April, 2003
1. Stable and satisfactory performance of TDT module.
2. Full integration with other SHARED modules.
3. Representation of White part in the non-cooperative game.
4. Development of decoy deployment algorithm.
1. Overall and detailed flowcharts of TDT module.
2. A software environment acting as the Situation Representation to test the performance of TDT module, including inputs/outputs and integration to TCT, CPP, AID, and OEP.
3. Analytical representation of collateral damage in the objective function.
4. Optimization of decoy deployment for multiple targets.
5. Extended Bidirectional Associative Memory (BAM) effectiveness for TDT and CPP Application.
6. Development of bit weight BAM encoding strategy.
7. A switching strategy in UAV/Target pairing assignment.
1. Is performance of TDT module with newly proposed algorithms reasonable and satisfactory?
2. Is integration to other SHARED modules successful?
1. Collateral damage is reduced.
2. Greatly improved probability of survival of UAV with optimized decoy deployment strategy.
3. UAVs switch target assignment under necessary condition.
4. Successful integration with other SHARED modules.

SHARED Final Report
11
Milestone Objective/Goal Deliverables Evaluation Criteria
Measures
Hierarchical Team Tactics
End of September, 2003
1. Details of hierarchical team tactics scenario.
2. Optimization of Jamming strategy.
3. Integration of BAM in TDT/CPPP modules.
1. Full structure of hierarchical team tactics scenario.
2. Target Grouping concept implemented to reduce searching space for target assignment.
3. Weighted shortest path algorithm implemented to meet time constraints in target assignment.
4. Cooperative jamming strategy.
1. Is performance of TDT module with newly proposed algorithms reasonable and satisfactory?
2. Is integration to other SHARED modules successful?
1. Greatly increased number of survived UAV at the end of battle with optimized decoy deployment strategy and cooperative jamming strategy.
2. Simulation results of weighted shortest path algorithm.
3. Successful integration with other SHARED modules.
2.2.2 TDT-ULTRA Goals
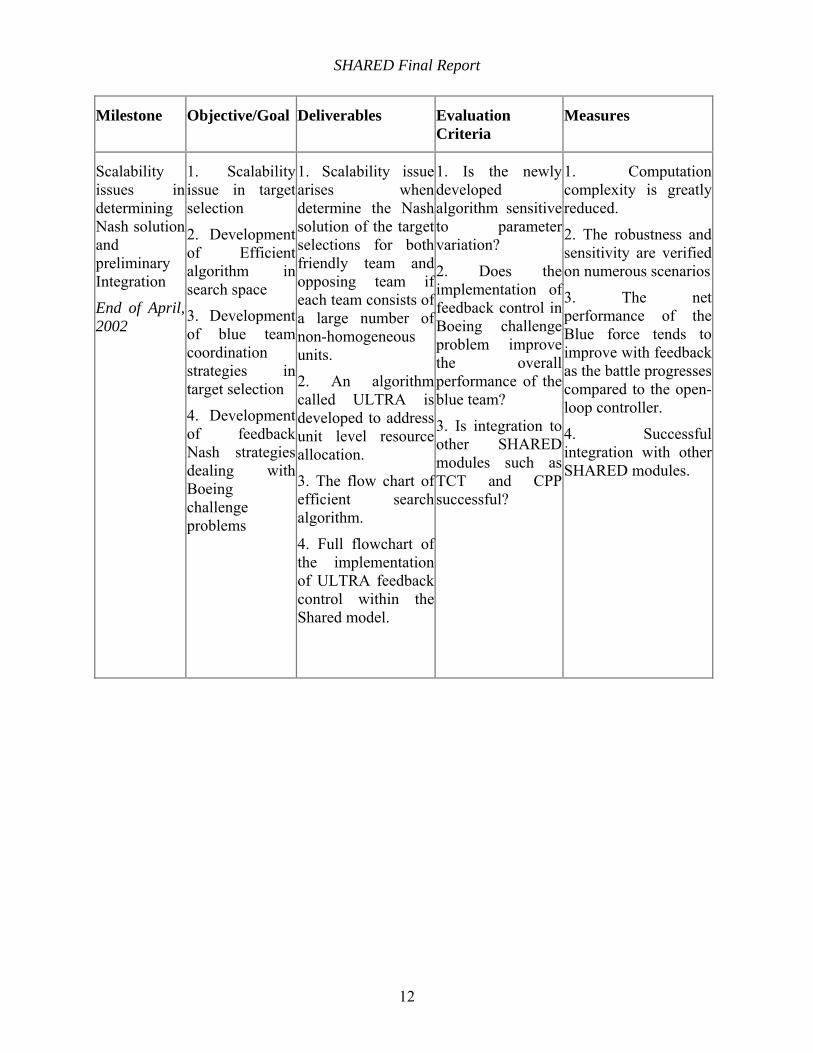
An important level in the operational hierarchy of overall system is the Team Dynamics and Tactics (TDT) level. At this level, individual autonomous entities, such as unmanned aerial vehicles (UAVs) within a team are assigned to a given set of subtasks in order to accomplish an overall team task. These assignments will support a collective team objective, and will be translated into end states to be pursued at the next lower level of planning, cooperative path planning. With consideration of adversaries in a real battle, the optimal strategies for both sides can be best analyzed within the framework of non-cooperative game theory. The goals of TDT-ULTRA include developing the Nash strategies as the optimal tactics for the teams in both forces. One important step is to address the issue of scalability in calculating target assignments with non-homogeneous units on each side. An efficient search algorithm needed to be developed in order to determine the Nash solution. A simulation software package also needed to be developed as a test bed to investigate the performance of various team tactics developed at this TDT level.
SHARED Final Report
12
Milestone Objective/Goal Deliverables Evaluation Criteria
Measures
Scalability issues in determining Nash solution and preliminary Integration
End of April, 2002
1. Scalability issue in target selection
2. Development of Efficient algorithm in search space
3. Development of blue team coordination strategies in target selection
4. Development of feedback Nash strategies dealing with Boeing challenge problems
1. Scalability issue arises when determine the Nash solution of the target selections for both friendly team and opposing team if each team consists of a large number of non-homogeneous units.
2. An algorithm called ULTRA is developed to address unit level resource allocation.
3. The flow chart of efficient search algorithm.
4. Full flowchart of the implementation of ULTRA feedback control within the Shared model.
1. Is the newly developed algorithm sensitive to parameter variation?
2. Does the implementation of feedback control in Boeing challenge problem improve the overall performance of the blue team?
3. Is integration to other SHARED modules such as TCT and CPP successful?
1. Computation complexity is greatly reduced.
2. The robustness and sensitivity are verified on numerous scenarios
3. The net performance of the Blue force tends to improve with feedback as the battle progresses compared to the open-loop controller.
4. Successful integration with other SHARED modules.
SHARED Final Report
13
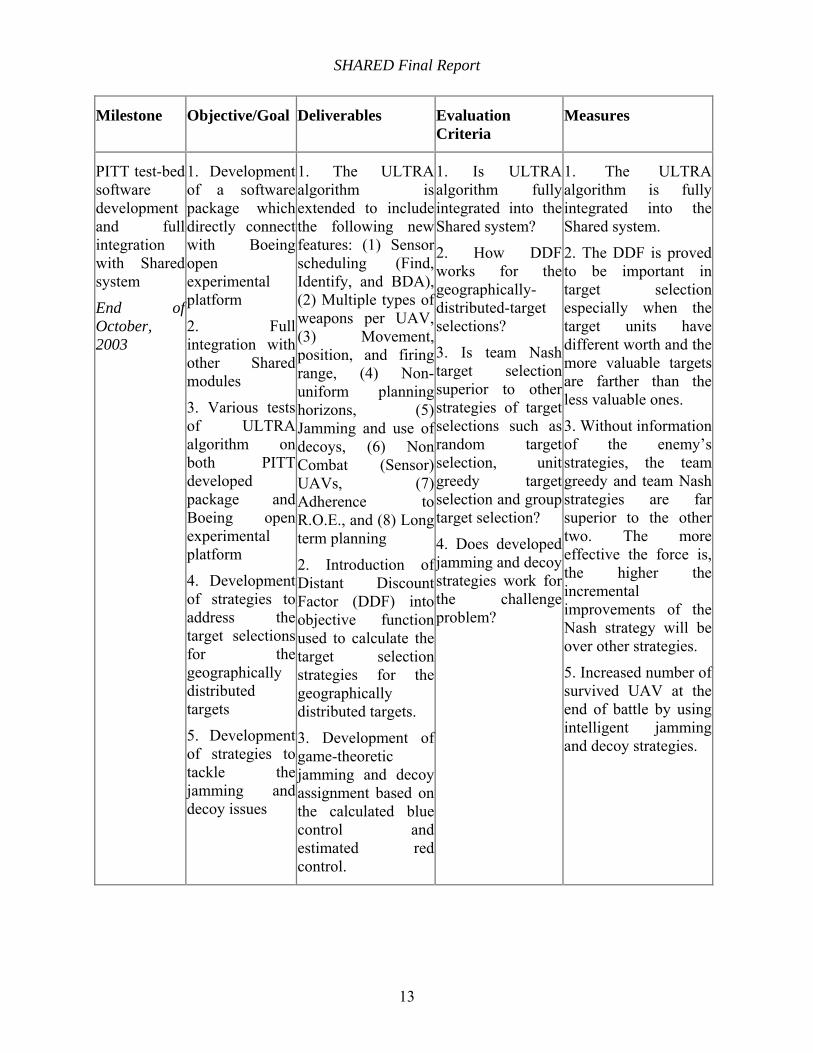
Milestone Objective/Goal Deliverables Evaluation Criteria
Measures
PITT test-bed software development and full integration with Shared system
End of October, 2003
1. Development of a software package which directly connect with Boeing open experimental platform
2. Full integration with other Shared modules
3. Various tests of ULTRA algorithm on both PITT developed package and Boeing open experimental platform
4. Development of strategies to address the target selections for the geographically distributed targets
5. Development of strategies to tackle the jamming and decoy issues
1. The ULTRA algorithm is extended to include the following new features: (1) Sensor scheduling (Find, Identify, and BDA), (2) Multiple types of weapons per UAV, (3) Movement, position, and firing range, (4) Non-uniform planning horizons, (5) Jamming and use of decoys, (6) Non Combat (Sensor) UAVs, (7) Adherence to R.O.E., and (8) Long term planning
2. Introduction of Distant Discount Factor (DDF) into objective function used to calculate the target selection strategies for the geographically distributed targets.
3. Development of game-theoretic jamming and decoy assignment based on the calculated blue control and estimated red control.
1. Is ULTRA algorithm fully integrated into the Shared system?
2. How DDF works for the geographically- distributed-target selections?
3. Is team Nash target selection superior to other strategies of target selections such as random target selection, unit greedy target selection and group target selection?
4. Does developed jamming and decoy strategies work for the challenge problem?
1. The ULTRA algorithm is fully integrated into the Shared system.
2. The DDF is proved to be important in target selection especially when the target units have different worth and the more valuable targets are farther than the less valuable ones.
3. Without information of the enemy’s strategies, the team greedy and team Nash strategies are far superior to the other two. The more effective the force is, the higher the incremental improvements of the Nash strategy will be over other strategies.
5. Increased number of survived UAV at the end of battle by using intelligent jamming and decoy strategies.
SHARED Final Report
14
2.3 CPP Goals
In a given scenario, there may exist many targets and threats that are either known or pop-up, stationary or mobile, isolated or well covered. Almost all of them are of UAVs’ interest. Information about these targets/threats is either known a priori or need to be discovered incrementally in the field.
The research goals/objectives of CPPP is such that UAVs plan paths cooperatively to reach certain destinations while meeting certain requirements, including minimizing en route dangers, meeting time constraints, keeping mutual spacing, and decreasing fuel consumption, etc. The CPPP also needs to communicate/interact with other modules/human in the system.
The goal of CPPS is to effectively plan paths to control the movements of air vehicles such that the maximum information about the environment can be discovered at a minimum risk to the vehicles. This is done with mind to both computational efficiency and cooperation---between peer vehicles, and between CPPS and other modules and / or human commanders.
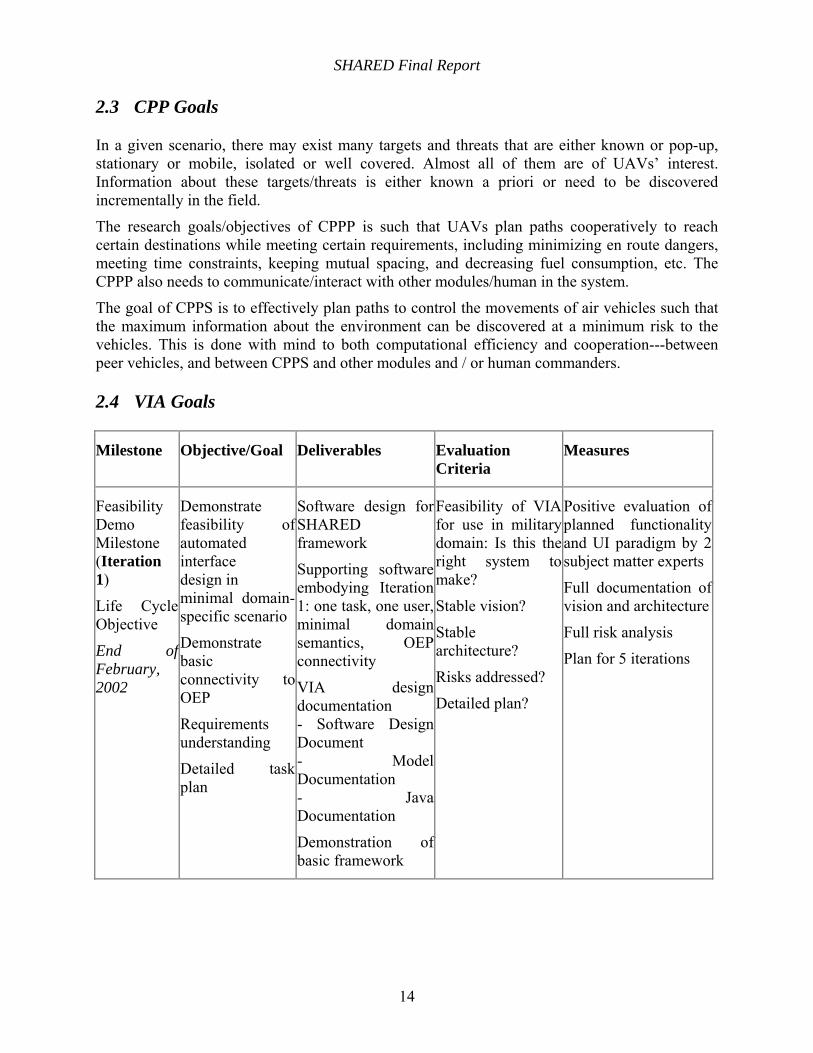
2.4 VIA Goals
Milestone Objective/Goal Deliverables Evaluation Criteria
Measures
Feasibility Demo Milestone (Iteration 1)
Life Cycle Objective
End of February, 2002
Demonstrate feasibility of automated interface design in minimal domain-specific scenario
Demonstrate basic connectivity to OEP
Requirements understanding
Detailed task plan
Software design for SHARED framework
Supporting software embodying Iteration 1: one task, one user, minimal domain semantics, OEP connectivity
VIA design documentation - Software Design Document - Model Documentation - Java Documentation
Demonstration of basic framework
Feasibility of VIA for use in military domain: Is this the right system to make?
Stable vision?
Stable architecture?
Risks addressed?
Detailed plan?
Positive evaluation of planned functionality and UI paradigm by 2 subject matter experts
Full documentation of vision and architecture
Full risk analysis
Plan for 5 iterations

SHARED Final Report
15
Milestone Objective/Goal Deliverables Evaluation Criteria
Measures
Life Cycle Architecture Milestone (Iteration 2)
End of September, 2002
Demonstration of basic VIA system with multiple roles, tasks, views, and processes
Generation of a usable SEAD command user interface, including all required tasks and participating objects.
Progress towards communication with one SHARED module
Full requirements specification
Software architecture specification
Architecture prototype, demonstration of full framework
Continuing advances in OEP communication
Preliminary Communication with one SHARED Module
Stable architecture? Risks addressed? Detailed plan?
Is this the right functional set?
Functionality adequate and available?
Are these the right architectural details?
Is it possible to connect to other SHARED modules?
100% of required functions planned
Positive evaluation by 4 SMEs of functional adequacy, general UI paradigm
100% of planner functions and 100% of OEP entities available in domain model
Full integration with at least 1 planner
SHARED Final Report
16
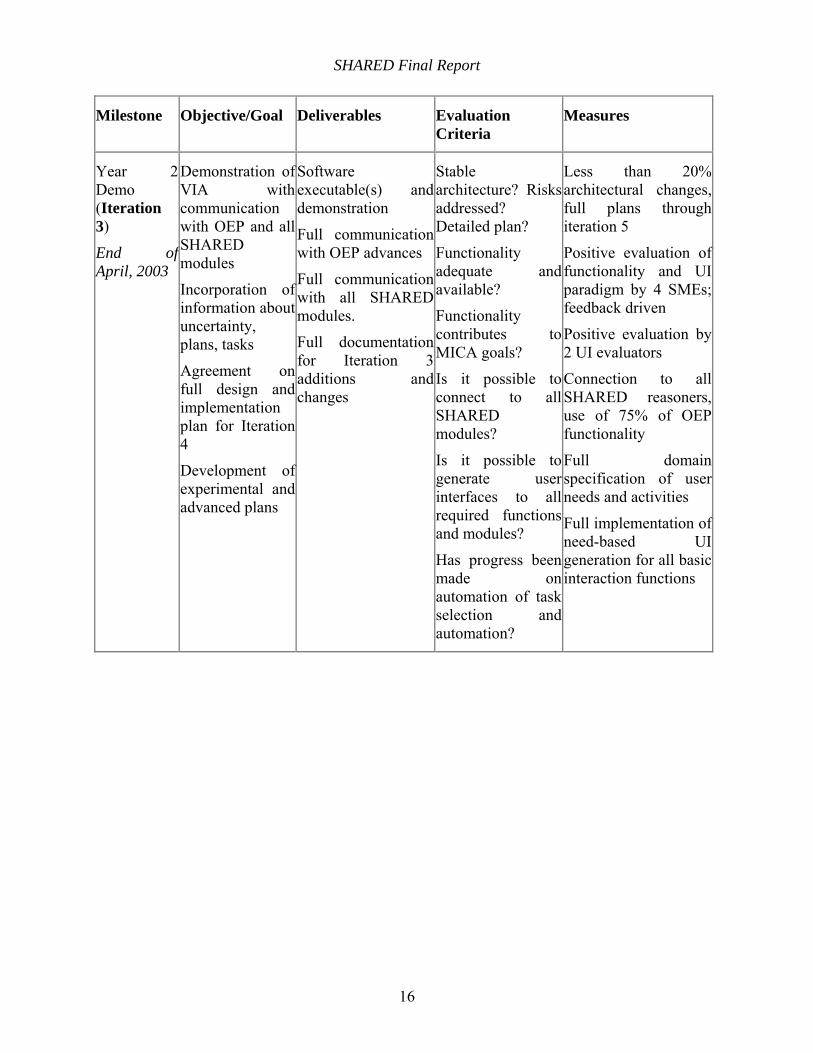
Milestone Objective/Goal Deliverables Evaluation Criteria
Measures
Year 2 Demo (Iteration 3)
End of April, 2003
Demonstration of VIA with communication with OEP and all SHARED modules
Incorporation of information about uncertainty, plans, tasks
Agreement on full design and implementation plan for Iteration 4
Development of experimental and advanced plans
Software executable(s) and demonstration
Full communication with OEP advances
Full communication with all SHARED modules.
Full documentation for Iteration 3 additions and changes
Stable architecture? Risks addressed? Detailed plan?
Functionality adequate and available?
Functionality contributes to MICA goals?
Is it possible to connect to all SHARED modules?
Is it possible to generate user interfaces to all required functions and modules?
Has progress been made on automation of task selection and automation?
Less than 20% architectural changes, full plans through iteration 5
Positive evaluation of functionality and UI paradigm by 4 SMEs; feedback driven
Positive evaluation by 2 UI evaluators
Connection to all SHARED reasoners, use of 75% of OEP functionality
Full domain specification of user needs and activities
Full implementation of need-based UI generation for all basic interaction functions
SHARED Final Report
17
Milestone Objective/Goal Deliverables Evaluation Criteria
Measures
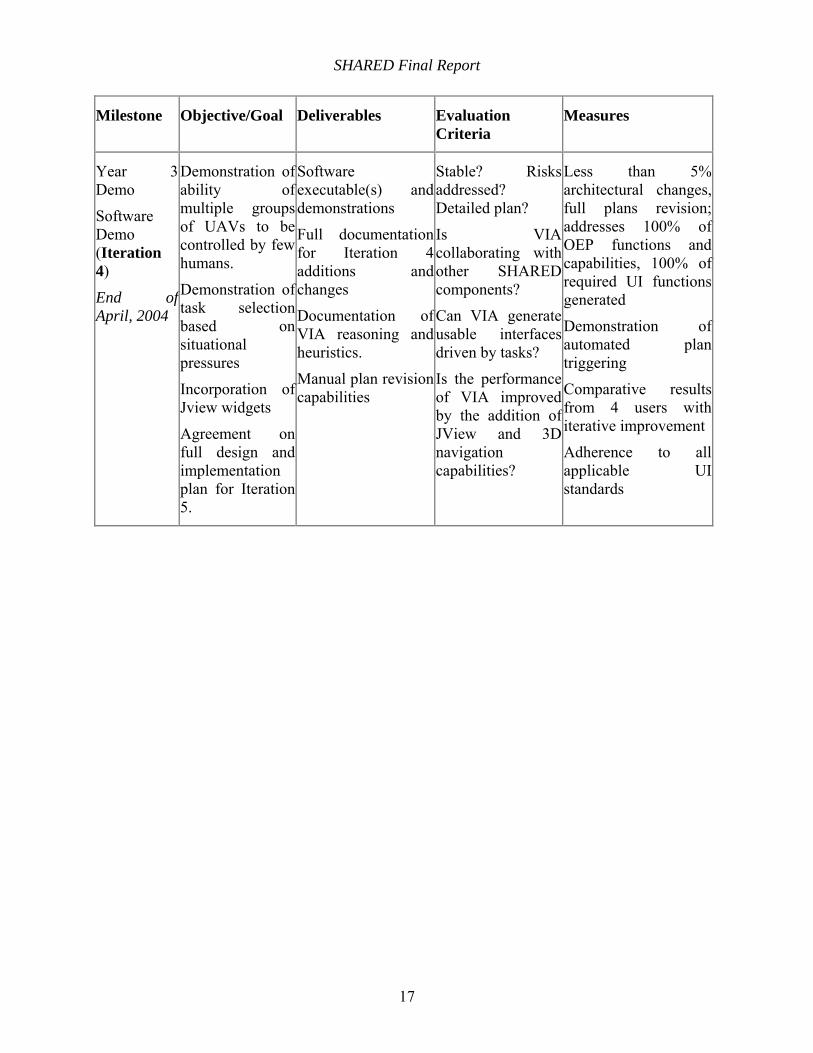
Year 3 Demo
Software Demo (Iteration 4)
End of April, 2004
Demonstration of ability of multiple groups of UAVs to be controlled by few humans.
Demonstration of task selection based on situational pressures
Incorporation of Jview widgets
Agreement on full design and implementation plan for Iteration 5.
Software executable(s) and demonstrations
Full documentation for Iteration 4 additions and changes
Documentation of VIA reasoning and heuristics.
Manual plan revision capabilities
Stable? Risks addressed? Detailed plan?
Is VIA collaborating with other SHARED components?
Can VIA generate usable interfaces driven by tasks?
Is the performance of VIA improved by the addition of JView and 3D navigation capabilities?
Less than 5% architectural changes, full plans revision; addresses 100% of OEP functions and capabilities, 100% of required UI functions generated
Demonstration of automated plan triggering
Comparative results from 4 users with iterative improvement
Adherence to all applicable UI standards
SHARED Final Report
18
3 Progress Against SOW
The MICA program was terminated after two years, during Iteration 4 of the development of the SHARED software. An analysis of progress at the halfway point against the initial task statement is given in this section.
3.1 TCT Development
Task II. C.3.1.2 (a) The Task Framework Progress: The overall task framework for SHARED was completed.
A three-level hierarchical structure has been developed.
The SHARED implementation does not follow this task framework exactly, although portions of it have been used in the implementation.
Task II. C.3.1.3 Plan and Evaluation Progress: Incomplete.
The plan for the whole mission is completed. But the criterion to evaluate the strategy of the allocation is unfinished.
3.2 TDT-Hierarchical Development
Task II. C.3.1.2 (b) Iterative Integration of Commander in Team Composition and tasking Using Ordinal games Progress: Incomplete. Modeling and algorithm has been completed, but the implementation is unfinished.
Task II. C.3.2.2 (a) Cooperative Control of Teams Using Pareto-optimality Concepts Progress: Complete
We formulate cooperative control in the framework of Pareto optimization and seek to obtain the set of Pareto optimal solutions. Automatically excluded from this set are sets of controls for which every team is worse off. These latter controls are called inferior solution. A convex linear combination of the team objective functions is formed and standard optimal control methods are applied to the composite objective function. For each set of values of the parameter weighting coefficients we obtain a Pareto-optimal solution.
Task II. C.3.2.2 (b) Using Non-zero-sum Non-cooperative Game Theory to Represent Adversarial Impact Progress: Complete
One type of uncertainty in military operations is the impact of an intelligent adversary. We reduce this uncertainty by using a game theoretic framework involving non-cooperative static Nash games and mixed strategies, together with feedback control principles, using nonlinear dynamic models. Also, for a determined UAV/Target pair, play a non-zero-sum non-cooperative
SHARED Final Report
19
game, cooperating with cooperative jamming algorithm and decoy deployment algorithm, to determine the optimal salvo size, decoy deployment and cooperative jamming strategies. The different cultural and social idiosyncrasies, effects-based operator and collateral damage effects is modeled by different weights and coefficient in objective function
Task II. C.3.2.2 (c) Cooperative Teams Operating in The Presence of an Adversary Progress: Complete
Combine the featuring in (a) and (b).
Task II. C.3.4.2 (c) Estimating Intent of the adversary Progress: Plan for Year 3
We may use learning game or partial observable Markov chain to tackle this subtask.
Task II. C.3.1.2 (a) The Task Framework Progress: Complete
Refer TCT
3.3 TDT-ULTRA Development
Task II.C.3.1.2(b) – Iterative Integration of Commander in Team Composition and Tasking Using Ordinal Games. Status: Theory Completed
We have developed a theory for team composition and tasking in which a commander is given a set of possible battle outcomes, each corresponding to a combination of both friendly and enemy team compositions. The commander then rank orders these outcomes according to both, his own preferences, and his estimate of the enemy commander’s preferences. From these subjective assessments, we can construct a non-zero-sum game matrix and determine a Nash equilibrium strategy without going through the process of constructing objective functions (which could be very difficult and impractical to construct in such cases). Further work and implementation of this task into the SHARED system has been postponed to concentrate on other aspects of TDT as per the objectives of MICA.
Task II.C.3.2.2(a) - Cooperative Control of Teams Using Pareto-optimality Concepts Status: Completed
We have developed a theory for dealing with competing teams of cooperative units. We considered a structure where there are several teams that are competing and each team consists of units that are cooperating for the benefit of the team. We have developed a solution concept for such systems called the Non-inferior Nash Strategy. A PhD thesis (Yong Liu) and a paper appearing in JOTA contain the details of this theory. We have implemented the results of this theory to the problem of target selection in a game environment in which each side is composed of a number of heterogeneous units, each capable of independent target selection. These units work cooperatively through the use of a team objective function. Thus, given an enemy target selection strategy, it is possible to calculate the team optimal strategy. However, the exponential relationship between the size of the resulting search space and the number of units present
SHARED Final Report
20
prohibits the use of standard game theoretic techniques even for situations involving small numbers of units. To deal with this scalability issue, we have developed an algorithm called the Unit Level Team Resource Allocation algorithm (ULTRA). Taking advantage of the structure inherent in the target selection problem, we are able to obtain target selection strategies resulting in team objective function scores that are on average within 5 percent of the global team optimal strategy.
Task II.C.3.2.2(b) – Using Non-zero-sum Non-cooperative Game Theory to Represent Adversarial Impact Status: Completed
In a military conflict, the adversary’s target selection strategy often strongly impacts the final outcome. Game theory provides widely accepted tools and solution methods for solving this type of competitive engagement. In particular, we employed the Nash equilibrium, in which neither team has an incentive to unilaterally deviate from a given set of target selection strategies. By applying the Nash strategy to the game theoretic model given in Task II.C.3.2(a) and using an iterative, ULTRA based Nash solution search we are able to quickly find approximate Nash strategies with accuracies exceeding 95% when compared to the strategies obtained by exhaustive search. The speed of the ULTRA process allows for real time implementation of the target selection algorithm in either open loop or feedback form.
Task II.C.3.2.2(c) – Cooperative Teams Operating in the Presence of an Adversary Status: Completed
It is well known that a Nash strategy is optimal only when the adversary is intelligent and also using a Nash strategy. Game theory cannot predict the outcome of an engagement in which non-Nash strategies are employed. However, we have shown that in target selection type problems, a team using Nash type strategies has a distinct advantage over an equivalent force using other types of naïve, non-game theoretic strategies, such as random or greedy. On average Nash target selection strategies have proven to be the best strategy to use when faced with an adversary, regardless of that adversary’s target selection methodology.
Task II.C.3.4.2(c) - Estimating Intent of the adversary Status: Incomplete, planned for 2004-2005
The approach for target selection that we employed necessitates also estimating the enemy’s target selection strategies. The question that remains to be addressed is: How good is this estimate and how can it be improved? We have started working on a procedure to use data obtained from the battlefield to assess our estimate of the enemy’s intent and improve on it. We had planned on working on this problem in the year 2004; however, the termination of MICA will render the status of this task as incomplete.
3.4 CPPP Development
SOW-II.C.3.3.2 (c) Biomimicry of Social Foraging for Cooperative Search/Engagement. Statement: The following aspects of biomimicry of social foraging will be studied in the proposed work:
SHARED Final Report
21
Social Foraging Strategies: The utility of further development of the social foraging metaphor will be explored;
Optimal Coordination Strategy Design: An Evolutionary Perspective.
Progress:
[Status: Complete.] Social foraging behaviors observed in nature are studied extensively. The focus are on biomimicry of several organisms including two kinds of bacteria (M. xanthus and E. Coli) and one kind of insects (bees). We construct and compare models representing different social foraging strategies, based on which different analogous implementable strategies for groups of UAVs are developed. Theoretical analysis is performed on these strategies and different implementations are evaluated with OEP testbed.
SOW-II.C.3.2.2 (e) Stability Analysis of Swarms of Agents. Statement: We will investigate stability analysis of a group of vehicles by characterizing group cohesiveness and formation patterns as invariant sets and showing that even in the presence of communication delays, cohesion/pattern formation can be maintained.
Progress: [Status: Complete through Year 2.] We refer to all groups of cooperative entities as “swarms.” Swarms with first-order dynamics are investigated first and the impacts of different environment profiles and different agent interactions on swarm stability are studied. Then we construct a more sophisticated swarm model with each agent having double integrator dynamics and analyze the stability of the swarms performing social foraging. We characterize swarm cohesiveness as a stability property and use a Lyapunov approach to develop conditions under which local agent actions will lead to cohesive foraging, i.e., agents entering certain invariant sets, even in the presence of imperfections characterized by uncertainty. It is shown that agents working in a highly coordinated fashion have advantages over agents with non-social behaviors and these advantages allow for cohesion maintenance, appropriate team dynamics, and hence mission success. We also model other imperfections like limited sensing capability in the system and investigate their impacts on the swarm stability. The effect of communication delays, which is another type of imperfection, is planned for Year 3. Stability analysis of formation patterns is also in the future plan.
3.5 CPPS Development
Task 1: Real Time Robust Learning and Path Planning Progress: Incomplete.
Developments:
Utilize probabilistic cognitive maps with Bayesian updates to learn in a three dimensional environment. The learning process includes both uncertainty about target locations and also potential threats. This allows the vehicle to incorporate both known and suspected (e.g. human commander’s intuition) information about the environment while at the same time allowing for updates due to sensor or other information received as the dynamic environment changes. This allows a single vehicle to plan where it is best to search.
SHARED Final Report
22
Task 2: Hierarchical and Cooperative Learning and Planning Progress: Partially completed. Work still in progress.
Formulated a Dynamic Programming algorithm in which the single step gain is based on likelihood of discovering targets, the safety of the planning vehicle in doing so, and a prediction of what effect other vehicles will have. Cooperation is achieved by intelligently predicting (based on what information is available) the actions of other vehicles.
3.6 Architecture and VIA Development
All subtasks (to the end of year 2) were successfully accomplished by Iterativity. An operational software application was developed, integrating all other modules and providing an automated interaction design module to dynamically manage the variable initiative interactions between a commander and the automated systems.
Subtask 1. Management and Collaboration. Status: Complete Activities:
Manage Task 9 program, including staffing, planning, oversight. Collaborate with others on SHARED project and other MICA team members. Attend meetings, symposia, and demonstrations. Demonstrate emerging technologies, present findings. Prepare and submit yearly reports. Track budget, labor, and spending; adjust as necessary. Evaluate risk and performance at each phase; develop phase plans and task development
efforts. Accomplishments:
Adhered to stated management process. No additional staffing required during the performance period.
Telecons, travel, etc. as required. Attended all TIMs and PMRs and participated in working groups and symposia.
Attended all TIMs, participated in demonstrations to Dr Tenney. Fully participated in VII and OEP working groups.
Published 1 conference proceeding (with demonstration), 1 book chapter, and 2 refereed journal articles. 2 additional submissions outstanding (IUI04 and CADUI04)
Every 6 months, full documentation and reports were prepared and submitted. Spreadsheets and plans required no deviations except additions due to additional
integration requirements to support integration of modules written in C++. Full documentation, phase plans, risk assessments, subgoals developed at beginning and
end of each of the 4 iterations that were performed during the 2 years of the program. Subtask 2. Model Requirements. Status: Complete through Year 2 (Iteration 4) Activities:

SHARED Final Report
23
Determine the information requirements for hierarchical planning. Model resource allocation tasks and team dynamic subtasks provided by Area 2
researchers, and those determined in SHARED tasks 1 through 4. Provide additional modeling requirements to Area 2 researchers. Develop user role models. Develop models of cognitive constraints. Incorporate scenarios and missions as available.
Accomplishments: Information requirements determined through research and interviews with SMEs;
integrated into situation representation to provide basis for automated interaction generation.
Full domain model and situation generation mechanism developed for all tasks required of a single human managing a squad of 36 UAVs under the framework of the OEP. Tasks were iteratively expanded and evaluated. Full capability and responsibility model developed for variably capable agent sets, through the TCT and TDT levels. Manual plan modification and low level (CPP) flight planning by humans was scheduled for Year 3, and has not yet been implemented.
Full collaboration with OEP was undertaken throughout the program. Iterativity provided requirements for, and assisted Boeing with the simulator notification-event object design. Provided requirements for simulator provision of IPB data.
Complete for single user. Additional human users were intended to be added during Year 3, and are not yet implemented.
Full interaction and presentation generation models were developed, incorporating human cognitive constraints in the various levels of the interaction design (e.g., information selection and chunking) and in the use of appropriate display heuristics (e.g., color coding, layout, attention direction mechanisms).
Full incorporation of all OEP information and scenarios up to final release; addition of experimentation functions to allow modification of scenarios.
Subtask 3. Explore Techniques. Status: Complete through Year 2 (Iteration 4) Activities:
Explore techniques to automatically compose the content and form of interactions for human MICA participants to facilitate hierarchical multi-asset resource allocation.
Incorporate methods to enhance human contributions, including flexibility and creativity.
Incorporate methods to mitigate human deficiencies, including decision bias and cognitive limitations.
Investigate mechanisms for cognitive constraints to affect interaction design. Investigate issues affecting human guidance to automation, including transfer of
authority and collaborative decision tuning; determine risk and mitigation parameters. Explore methods to monitor switching between modes of authority. Determine system requirements, evaluate approaches, implement test systems.

SHARED Final Report
24
Accomplishments: Fully implemented and functioning software system developed to automatically
compose dynamic user interfaces, in the context of a command situation involving multi-asset resource allocation with variably mixed-initiative collaboration between a single human commander, multiple teams of automata, and external planning agents.
Developed and incorporated mechanisms for fully implicit interactions for a non-intrusive interface. Designed and implemented interaction seeding through user capabilities and interaction emphasis based on assignment. Provided 2/3 of variable interaction continuum, including manual replanning and planner parameterization control, but not including plan modification or manual plan creation, and with no research contributing to fully manual flight (planned for years 3 and 4). Multiple views of information provided to provide flexibility.
Situation calculations included to reduce decision bias. Embedded help and exploratory UI functions included. Experiments to demonstrate the efficacy of these designs planned for year three.
Interaction models designed to support appropriate fusing and partitioning of interactions to different views, and automated filtering of information in each view implemented to provide interface facilitation.
Embedded mechanisms for human guidance at all levels. Provided roles and capabilities system to support human activities and to provide access to other tasks of which the user is capable. Provided control over software planning agent parameters.
Developed mechanisms for human commander to transfer control to automation, and for the human to take control at any level at any time.
Performed 4 full iterative development cycles following the Unified Process. Iteratively performed requirements gathering, implementation, testing and evaluation for all iterations.
Subtask 4. Develop Algorithms Status: Complete Activities:
Develop automated techniques to provide variable initiative interactions to human MICA participants.
Develop role-subtask heuristics. Develop interaction algorithms to automate design of subtask interactions guided by
usability knowledge. Develop compositional interaction model, and develop properties and algorithms for
individual interaction objects. Incorporate findings from other subtasks into interaction model and algorithms. Investigate interactions to support human interaction with and management of
uncertainty and probability, and mechanisms for discrimination between estimation and feedback information.
Accomplishments:
SHARED Final Report
25
Provided fully expanded capability and activity model to allow human users to monitor, modify, and perform the functions performed by automated planning reasoners. Provided integrated system with user-controlled selection of external reasoners.
Developed and implemented high level mechanisms to associate roles and responsibilities with interaction components that meet the needs of these roles and responsibilities.
Developed and implemented operational software that responds to interaction needs in a situation to fully automate the design, creation, and presentation of facilitative user interfaces. Incorporated state of the art usability knowledge at all hierarchical levels of interaction and presentation models.
Designed, developed and implemented object-oriented hierarchical interaction model that is able to self-compose consistent and usable interactions to meet the demands of the situation.
Full development iterations were performed on the situation, the interaction, and the presentation models to incorporate research developments.
Designed and implemented mechanisms to represent location uncertainty, identification uncertainty, status uncertainty, and modeled and demonstrated mechanisms to facilitate human understanding of this information. Provided implicit interactions throughout with immediate and discriminable feedback at all levels.
Subtask 5. Advanced Methods. Status: Complete through Year 2 (Iteration 4) Activities:
Investigate decision theoretic and game theory methods for task decomposition and allocation.
Investigate interaction criteria for spatial, temporal, and predictive planning information, and visualization and modification of automata goals and plans.
Investigate mechanisms to provide flexible team composition and re-organization. Investigate unpredicted advancements.
Accomplishments: Year 1 system provided task decomposition through the situation model. During
Iteration 3, task decomposition was transferred to the TDT modules. Allocation was considered throughout as a TCT and TDT function, although Year 3 plans included the inclusion of the ability for commanders to fully perform or modify TCT and TDT-type planning.
Designed and implemented interaction design model for visualization, information, specification, planning, and analysis activities at the squad, team, and UAV levels. Year 3 plans, which were not performed, involved full control of automata plans by human commanders.
Designed and implemented fully operational software to provide single human commander control over a squad of UAVs in a varying battlespace, and provided usable mechanisms for interaction with and understanding of the behavior of multiple software planning agent.
SHARED Final Report
26
All unpredicted advancements at each iteration were included in that or subsequent iterations.
Subtask 6. Experimentation. Status: Complete through Year 2 (Iteration 4) Activities:
Perform integrated software functionality and performance experiments. Develop basic presentation models for one interaction device, and implement mechanism
for experimentation. Develop small supporting battle space and planning scenarios, if necessary. Conduct various functionality, tradeoff, and cognitive performance evaluations, and
incorporate findings into ongoing research. Accomplishments:
Evaluations (functional, performance, and adherence to guidelines) were planned into and performed during each iteration of the software. Results of the previous iteration’s evaluations were incorporated into development processes for the next iteration, although incorporation of Iteration 4 evaluation improvements has been performed since the program has been terminated and no Iteration 5 is forthcoming.
Fully functioning interaction models were developed, tested, improved, and implemented within the functional SHARED system. Additional functions were added during Iteration 4 to facilitate experimentation with external modules.
All iterations of the SHARED domain and situation models adhered to the battlespace scenarios provided by the OEP. Domain semantics were improved and made richer during all iterations.
Each iteration involved integrated analyses of functionality, risk and benefit, performance, and usability, and included planned development based on the results of these evaluations.
Subtask 7. Integration. Status: Complete through Year 2 (Iteration 4) Activities:
Develop domain dependent implementation and integrate with other SHARED components.
Integrate with other program efforts. Develop interface to domain and simulation models. Provide software demonstration of interactions for commanders and operators involved in
managing a low number of small teams; provide extensions to accommodate more (5-10) and larger (20-30) teams.
Accomplishments:
A full domain model was developed and integrated with all SHARED components and the OEP.
A domain-independent AID system was also developed and implemented.

SHARED Final Report
27
Participation in working groups (particularly OEP), full collaboration with other SHARED team members via telecon and regular in-person meetings.
Full interfaces between the Situation Representation (implemented in Java) and the OEP simulation were developed and tested for each iteration of the OEP. All external planning modules (TCT, TDT-OSU, TDT-Pitt, CPPS) were provided with full Java to C++ interfaces, and were fully integrated in Iteration 3. The CPPP was written in Java from Iteration 2.
Demonstration of SHARED software were available at the end of each iteration up through Iteration 4. Demonstrations were given or available at each TIM and PMR. All versions of SHARED since Iteration 1 have included the ability to manage 36 UAVs in up to 36 individual teams.
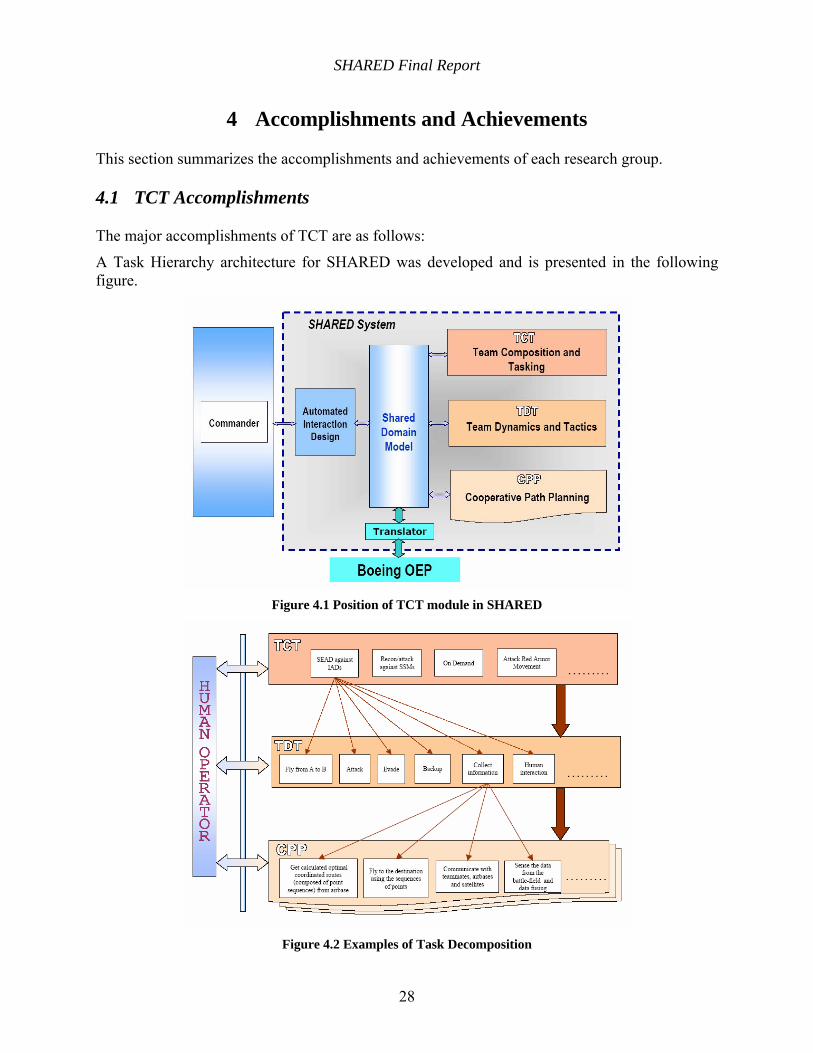
SHARED Final Report
28
4 Accomplishments and Achievements
This section summarizes the accomplishments and achievements of each research group.
4.1 TCT Accomplishments
The major accomplishments of TCT are as follows:
A Task Hierarchy architecture for SHARED was developed and is presented in the following figure.
Figure 4.1 Position of TCT module in SHARED
Figure 4.2 Examples of Task Decomposition
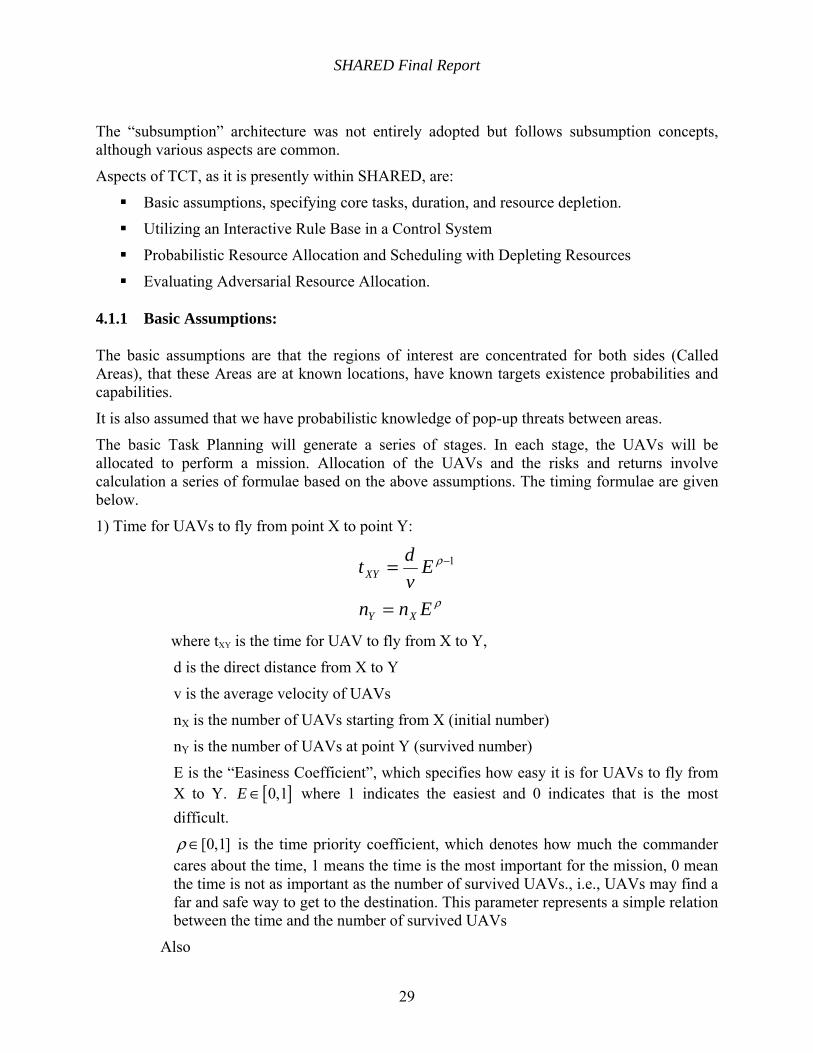
SHARED Final Report
29
The “subsumption” architecture was not entirely adopted but follows subsumption concepts, although various aspects are common.
Aspects of TCT, as it is presently within SHARED, are:
Basic assumptions, specifying core tasks, duration, and resource depletion.
Utilizing an Interactive Rule Base in a Control System
Probabilistic Resource Allocation and Scheduling with Depleting Resources
Evaluating Adversarial Resource Allocation.
4.1.1 Basic Assumptions:
The basic assumptions are that the regions of interest are concentrated for both sides (Called Areas), that these Areas are at known locations, have known targets existence probabilities and capabilities.
It is also assumed that we have probabilistic knowledge of pop-up threats between areas.
The basic Task Planning will generate a series of stages. In each stage, the UAVs will be allocated to perform a mission. Allocation of the UAVs and the risks and returns involve calculation a series of formulae based on the above assumptions. The timing formulae are given below.
1) Time for UAVs to fly from point X to point Y:
ρ
ρ
Enn
Evdt
XY
XY
=
= −1
where tXY is the time for UAV to fly from X to Y,
d is the direct distance from X to Y
v is the average velocity of UAVs
nX is the number of UAVs starting from X (initial number)
nY is the number of UAVs at point Y (survived number)
E is the “Easiness Coefficient”, which specifies how easy it is for UAVs to fly from X to Y. [ ]0,1E ∈ where 1 indicates the easiest and 0 indicates that is the most difficult.
[0,1]ρ ∈ is the time priority coefficient, which denotes how much the commander cares about the time, 1 means the time is the most important for the mission, 0 mean the time is not as important as the number of survived UAVs., i.e., UAVs may find a far and safe way to get to the destination. This parameter represents a simple relation between the time and the number of survived UAVs
Also
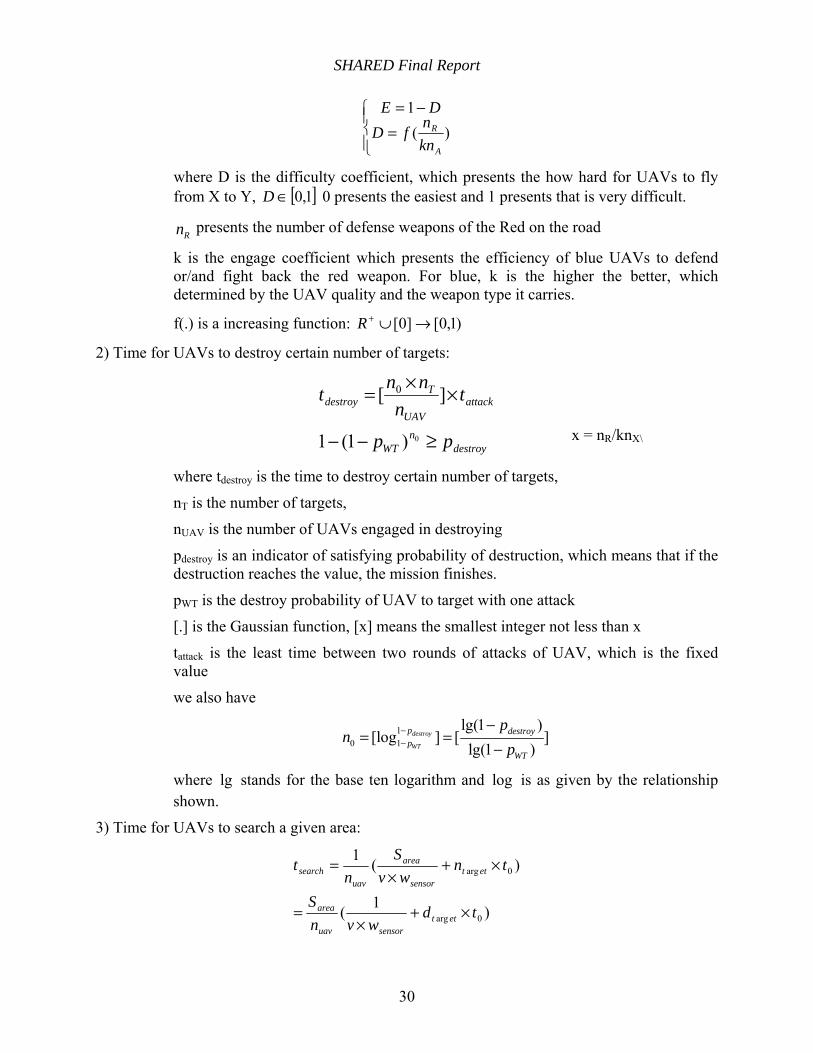
SHARED Final Report
30
⎪⎩
⎪⎨⎧
=−=
)(1
A
R
knnfDDE
where D is the difficulty coefficient, which presents the how hard for UAVs to fly from X to Y, [ ]1,0∈D 0 presents the easiest and 1 presents that is very difficult.
Rn presents the number of defense weapons of the Red on the road
k is the engage coefficient which presents the efficiency of blue UAVs to defend or/and fight back the red weapon. For blue, k is the higher the better, which determined by the UAV quality and the weapon type it carries.
f(.) is a increasing function: )1,0[]0[ →∪+R
2) Time for UAVs to destroy certain number of targets:
destroyn
WT
attackUAV
Tdestroy
pp
tn
nnt
≥−−
××=
0)1(1
][ 0
where tdestroy is the time to destroy certain number of targets,
nT is the number of targets,
nUAV is the number of UAVs engaged in destroying
pdestroy is an indicator of satisfying probability of destruction, which means that if the destruction reaches the value, the mission finishes.
pWT is the destroy probability of UAV to target with one attack
[.] is the Gaussian function, [x] means the smallest integer not less than x
tattack is the least time between two rounds of attacks of UAV, which is the fixed value
we also have
10 1
lg(1 )[log ] [ ]
lg(1 )destroy
WT
p destroyp
WT
pn
p−−
−= =
−
where lg stands for the base ten logarithm and log is as given by the relationship shown.
3) Time for UAVs to search a given area:
)1(
)(1
0arg
0arg
tdwvn
S
tnwv
Sn
t
ettsensoruav
area
ettsensor
area
uavsearch
×+×
=
×+×
=
x = nR/knX\
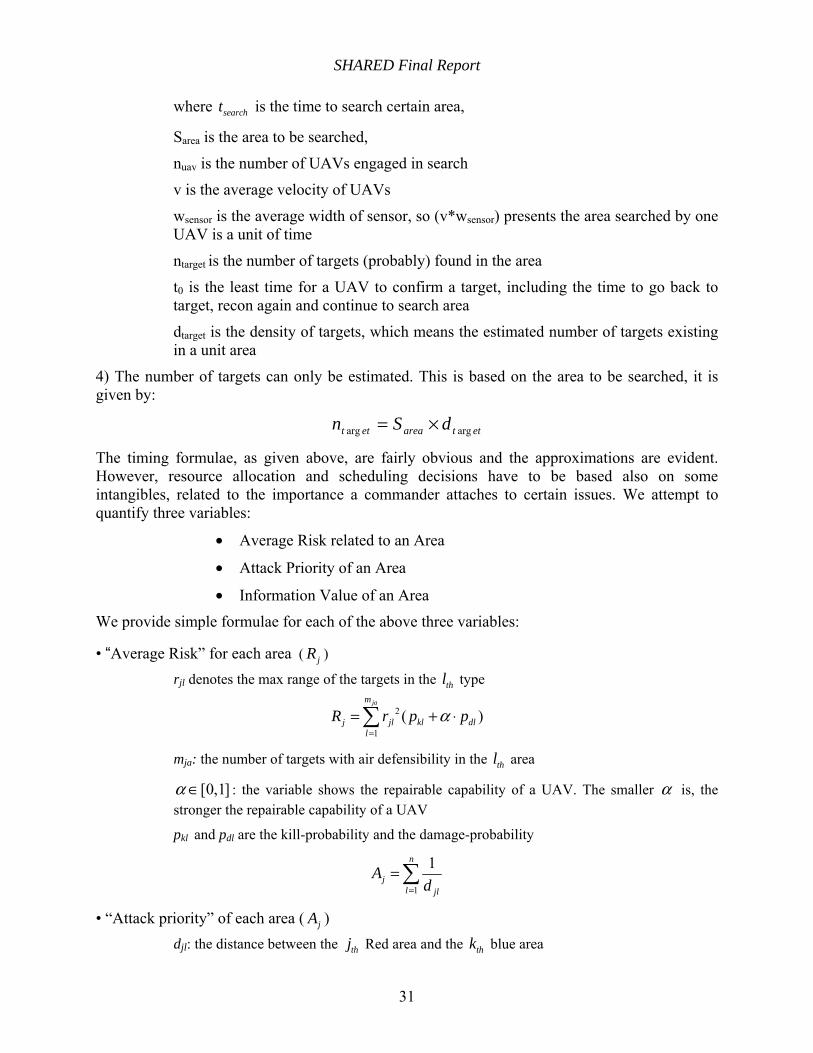
SHARED Final Report
31
where searcht is the time to search certain area,
Sarea is the area to be searched,
nuav is the number of UAVs engaged in search
v is the average velocity of UAVs
wsensor is the average width of sensor, so (v*wsensor) presents the area searched by one UAV is a unit of time
ntarget is the number of targets (probably) found in the area
t0 is the least time for a UAV to confirm a target, including the time to go back to target, recon again and continue to search area
dtarget is the density of targets, which means the estimated number of targets existing in a unit area
4) The number of targets can only be estimated. This is based on the area to be searched, it is given by:
ettareaett dSn argarg ×=
The timing formulae, as given above, are fairly obvious and the approximations are evident. However, resource allocation and scheduling decisions have to be based also on some intangibles, related to the importance a commander attaches to certain issues. We attempt to quantify three variables:
• Average Risk related to an Area
• Attack Priority of an Area
• Information Value of an Area
We provide simple formulae for each of the above three variables:
• “Average Risk” for each area ( jR )
rjl denotes the max range of the targets in the thl type
2
1( )
jam
j jl kl dll
R r p pα=
= + ⋅∑
mja: the number of targets with air defensibility in the thl area
[0,1]α ∈ : the variable shows the repairable capability of a UAV. The smaller α is, the stronger the repairable capability of a UAV
pkl and pdl are the kill-probability and the damage-probability
1
1n
jl jl
Ad=
=∑
• “Attack priority” of each area ( jA ) djl: the distance between the thj Red area and the thk blue area

SHARED Final Report
32
n: the number of targets in the thj Red area
1
p
j jll
I I=
=∑
• “Information Value” of each area ( jI ) Ijl: the value of information for the thl target type and ( )+∞∈ ,1jlI
p: the number of target types in the thj area
Variables defined in current specific case (CP1.0) are:
The number of the Blue airbase is p=1.
The dimension of white areas is q=1.
ljx is not scheduled if g2j=0 (the total number of SSMs in the thj area)
Only three kinds of weapons are assigned to UAVs in the specific case. They are sub-munitions, bombs and missiles.
Parameters that can be varied in the special case:
1. The number of the Red areas, m
2. The number of available UAVs of each type
3. The start and end of mission times
4. The IPB of the Red areas, for example the number and distribution of the Red targets in each area, the locations of the Red areas and the target types in each area.
5. The number of the Blue base can be more than 1.
6. The dimension of white areas.
4.1.2 Utilizing an Interactive Rule Base
Preliminary scheduling relies on prioritizing the different tasks that UAVs need to accomplish. In SHARED, we provide a Rule Base (derived from the given Rules of Engagement) that can lead to scheduling priorities. We have attempted to make the Rule Base as generic as possible so that it can be used in different situations and scenarios.
The Rule Base assumes there are Type A operations (operations to clear areas of communication and sensing capability) and Type B operations (operations dedicated to clearing areas of high level firing power). We then give the following simple low-level Rules:
We consider a finite number of relevant locations, and a finite number of operations that can be performed at those locations. A set of rules was selected based on the Rules of Engagement and definition of CP 1.1 and general considerations. They continue to be under review. The rule base we are using in TCT is given by, Rule 1: Type A operations, if any, will always precede type B operations. Rule 2: Type B operations, follow type A operations in areas cleared due to type A.
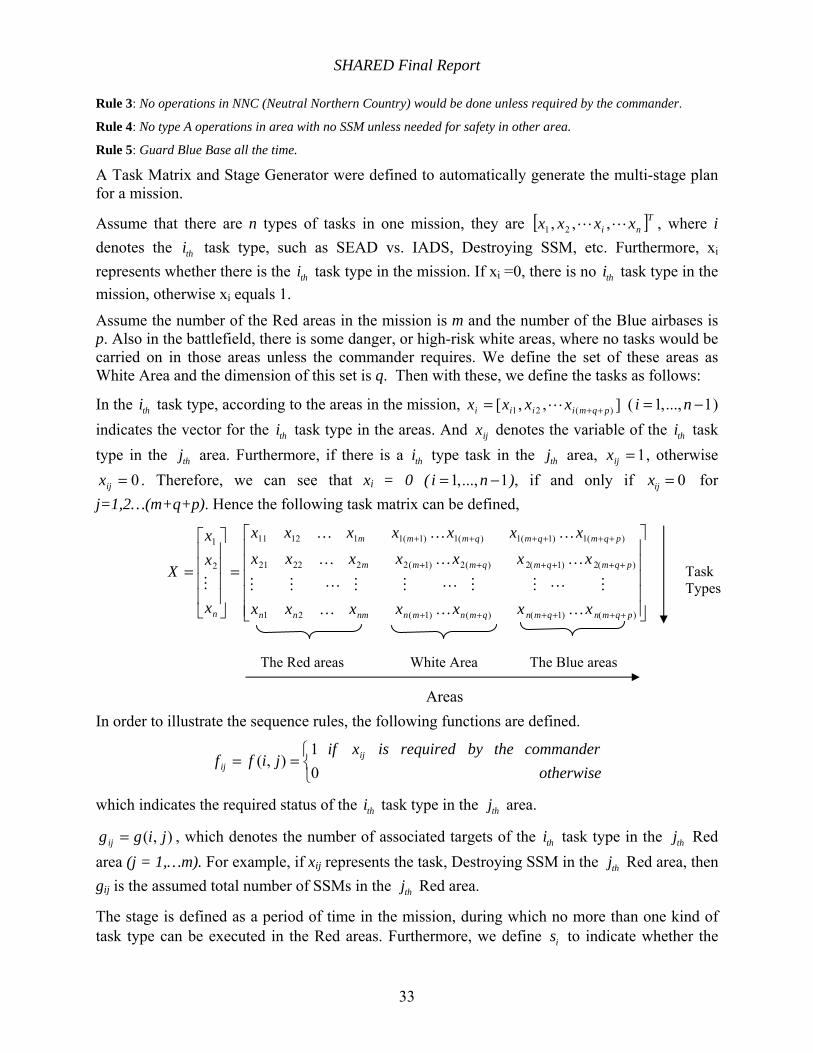
SHARED Final Report
33
Rule 3: No operations in NNC (Neutral Northern Country) would be done unless required by the commander.
Rule 4: No type A operations in area with no SSM unless needed for safety in other area.
Rule 5: Guard Blue Base all the time. A Task Matrix and Stage Generator were defined to automatically generate the multi-stage plan for a mission.
Assume that there are n types of tasks in one mission, they are [ ]Tni xxxx ,,, 21 , where i
denotes the thi task type, such as SEAD vs. IADS, Destroying SSM, etc. Furthermore, xi represents whether there is the thi task type in the mission. If xi =0, there is no thi task type in the mission, otherwise xi equals 1.
Assume the number of the Red areas in the mission is m and the number of the Blue airbases is p. Also in the battlefield, there is some danger, or high-risk white areas, where no tasks would be carried on in those areas unless the commander requires. We define the set of these areas as White Area and the dimension of this set is q. Then with these, we define the tasks as follows:
In the thi task type, according to the areas in the mission, ],,[ )(21 pqmiiii xxxx ++= ( 1,..., 1i n= − ) indicates the vector for the thi task type in the areas. And ijx denotes the variable of the thi task type in the thj area. Furthermore, if there is a thi type task in the thj area, 1=ijx , otherwise
0=ijx . Therefore, we can see that xi = 0 ( 1,..., 1i n= − ), if and only if 0ijx = for j=1,2…(m+q+p). Hence the following task matrix can be defined,
⎥⎥⎥⎥⎥
⎦
⎤
⎢⎢⎢⎢⎢
⎣
⎡
=
⎥⎥⎥⎥
⎦
⎤
⎢⎢⎢⎢
⎣
⎡
=
++++++
++++++
++++++
)()1()()1(21
)(2)1(2)(2)1(222221
)(1)1(1)(1)1(111211
2
1
pqmnqmnqmnmnnmnn
pqmqmqmmm
pqmqmqmmm
n xxxxxxx
xxxxxxx
xxxxxxx
x
xx
X
………
………………
In order to illustrate the sequence rules, the following functions are defined.
⎩⎨⎧
==otherwise
commanderthebyrequiredisxifjiff ij
ij 01
),(
which indicates the required status of the thi task type in the thj area.
),( jiggij = , which denotes the number of associated targets of the thi task type in the thj Red area (j = 1,…m). For example, if xij represents the task, Destroying SSM in the thj Red area, then gij is the assumed total number of SSMs in the thj Red area.
The stage is defined as a period of time in the mission, during which no more than one kind of task type can be executed in the Red areas. Furthermore, we define is to indicate whether the
The Red areas White Area The Blue areas
Areas
Task Types

SHARED Final Report
34
stage associated to the thi task type is empty or not. is = 1 represents that there is a nonempty stage for the thi task type that need to be done in the Red areas, otherwise si = 0. More clearly, if the stage for the thi task type has been finished or xi = 0, is =0. Without loss generality, we assume that xi (i=1,2…n-1) will not be executed, unless xk (k=1,2….i-1) has been finished or
0=kx (k=1,2….i-1), i.e. is = 0. Moreover, nx is one task type that is carried on in all stages.
SHARED can use the Rule Base as is, but asks the Commander to confirm the rules that it specifies, or, the outcome of those rules, that is the preliminary schedule.
The use of rule bases within a real-time control system is a somewhat new phenomena and some results have been developed in the context of fuzzy control theory. However, our development here is unique and new in that it pertains to prioritizing control actions, thus specifically a timing sequence. We believe this to be an open research area to be addressed.
4.1.3 Probabilistic Resource Allocation
An algorithm dealt with the heterogeneous resources allocation is developed in TCT. This algorithm is mainly based on proportional control algorithm. The following variables are considered in the allocation, such as Number of targets, Air defensibility of targets, Target status, classified as potential, known and unknown and information ability of targets, like communication capability. • “Total payoff” for each area ( jP ) is
Known targets: unknown targets: Potential targets
kn1> c 0un ptc c≥ ≥ > . vjl is the score for each target. Then the “total payoff” in the jth area is
calculated by, • Preliminary resource allocation is given by:
1
j
j
j j j jUAVj m
j j j jj
A P R I
A P R I
β
βχ
=
=∑
where m is the number of regions, jβ is a tuned parameter for future use. UAVjχ can be looked as
a variable represented the forecasted demand in the battle, since it reflects the comprehensive target information in each area. Using proportional approach to satisfy the estimated demand, the preliminary resource allocation in the TCT agent is obtained as follows. For the UAV team in the
thj area, the number of UAVs is:
∑=
=)(
1)(
knjm
lknjlknj cvp
( )
( )1
j unm
j un jl unl
p v c=
= ∑ ∑=
=)(
1)(
ptjm
lptjlptj cvp
)()()( ptjunjknjj pppP ++=
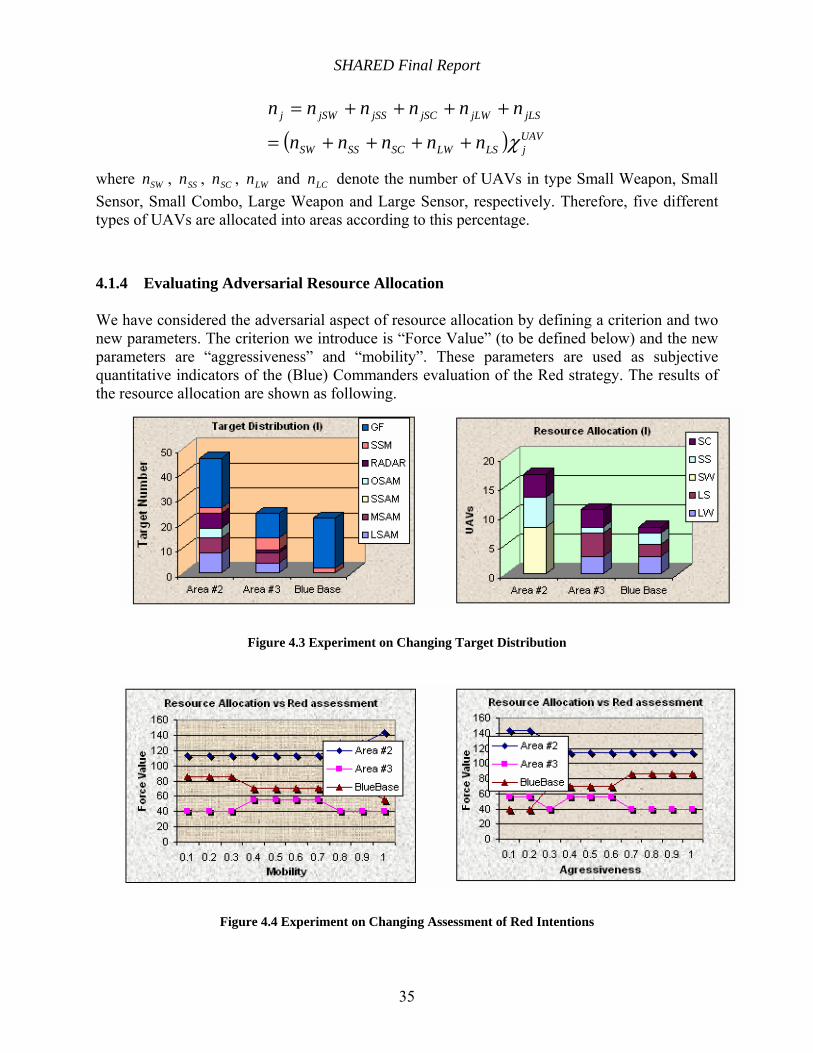
SHARED Final Report
35
( ) UAVjLSLWSCSSSW
jLSjLWjSCjSSjSWj
nnnnn
nnnnnn
χ++++=
++++=
where SWn , SSn , SCn , LWn and LCn denote the number of UAVs in type Small Weapon, Small Sensor, Small Combo, Large Weapon and Large Sensor, respectively. Therefore, five different types of UAVs are allocated into areas according to this percentage.
4.1.4 Evaluating Adversarial Resource Allocation
We have considered the adversarial aspect of resource allocation by defining a criterion and two new parameters. The criterion we introduce is “Force Value” (to be defined below) and the new parameters are “aggressiveness” and “mobility”. These parameters are used as subjective quantitative indicators of the (Blue) Commanders evaluation of the Red strategy. The results of the resource allocation are shown as following.
Figure 4.3 Experiment on Changing Target Distribution
Figure 4.4 Experiment on Changing Assessment of Red Intentions
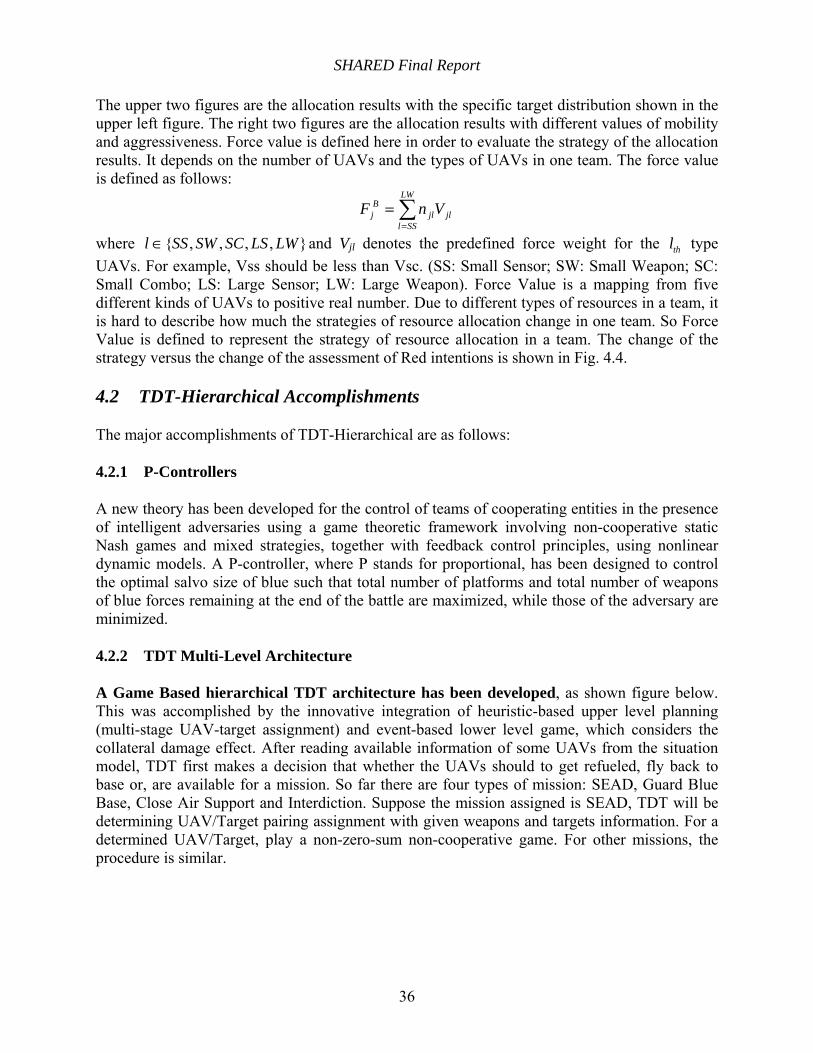
SHARED Final Report
36
The upper two figures are the allocation results with the specific target distribution shown in the upper left figure. The right two figures are the allocation results with different values of mobility and aggressiveness. Force value is defined here in order to evaluate the strategy of the allocation results. It depends on the number of UAVs and the types of UAVs in one team. The force value is defined as follows:
∑=
=LW
SSljljl
Bj VnF
where },,,,{ LWLSSCSWSSl ∈ and Vjl denotes the predefined force weight for the thl type UAVs. For example, Vss should be less than Vsc. (SS: Small Sensor; SW: Small Weapon; SC: Small Combo; LS: Large Sensor; LW: Large Weapon). Force Value is a mapping from five different kinds of UAVs to positive real number. Due to different types of resources in a team, it is hard to describe how much the strategies of resource allocation change in one team. So Force Value is defined to represent the strategy of resource allocation in a team. The change of the strategy versus the change of the assessment of Red intentions is shown in Fig. 4.4.
4.2 TDT-Hierarchical Accomplishments
The major accomplishments of TDT-Hierarchical are as follows:
4.2.1 P-Controllers
A new theory has been developed for the control of teams of cooperating entities in the presence of intelligent adversaries using a game theoretic framework involving non-cooperative static Nash games and mixed strategies, together with feedback control principles, using nonlinear dynamic models. A P-controller, where P stands for proportional, has been designed to control the optimal salvo size of blue such that total number of platforms and total number of weapons of blue forces remaining at the end of the battle are maximized, while those of the adversary are minimized.
4.2.2 TDT Multi-Level Architecture
A Game Based hierarchical TDT architecture has been developed, as shown figure below. This was accomplished by the innovative integration of heuristic-based upper level planning (multi-stage UAV-target assignment) and event-based lower level game, which considers the collateral damage effect. After reading available information of some UAVs from the situation model, TDT first makes a decision that whether the UAVs should to get refueled, fly back to base or, are available for a mission. So far there are four types of mission: SEAD, Guard Blue Base, Close Air Support and Interdiction. Suppose the mission assigned is SEAD, TDT will be determining UAV/Target pairing assignment with given weapons and targets information. For a determined UAV/Target, play a non-zero-sum non-cooperative game. For other missions, the procedure is similar.
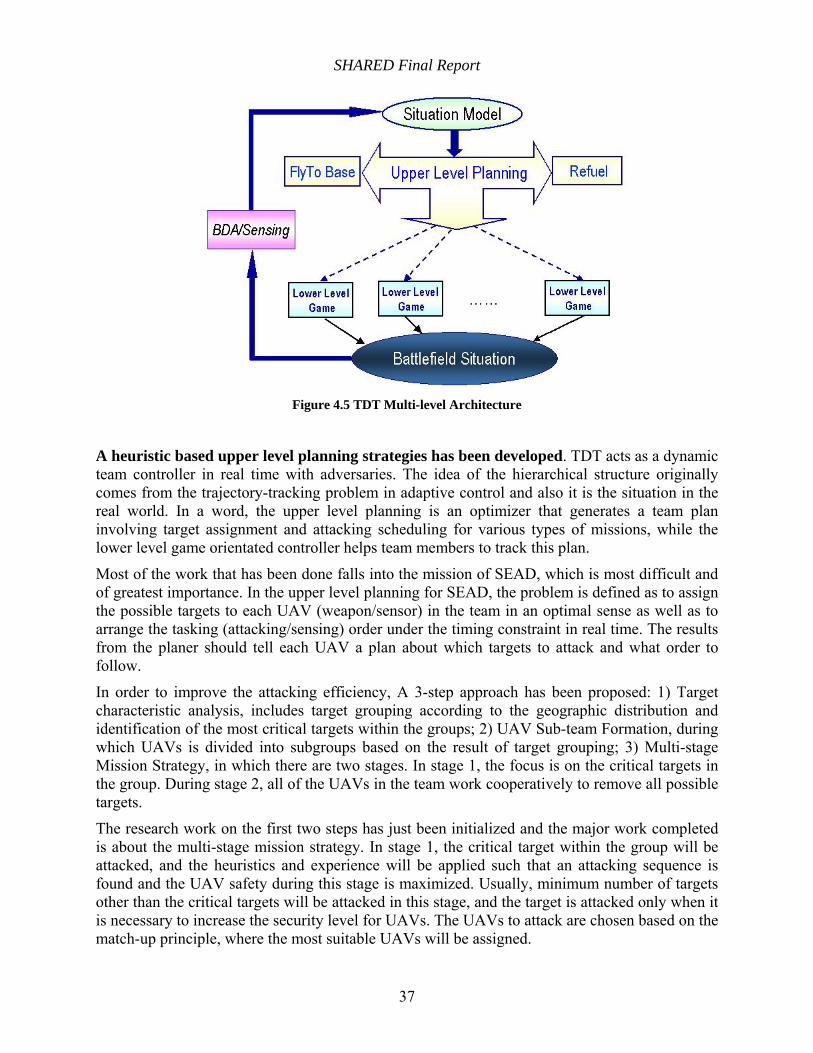
SHARED Final Report
37
Figure 4.5 TDT Multi-level Architecture
A heuristic based upper level planning strategies has been developed. TDT acts as a dynamic team controller in real time with adversaries. The idea of the hierarchical structure originally comes from the trajectory-tracking problem in adaptive control and also it is the situation in the real world. In a word, the upper level planning is an optimizer that generates a team plan involving target assignment and attacking scheduling for various types of missions, while the lower level game orientated controller helps team members to track this plan.
Most of the work that has been done falls into the mission of SEAD, which is most difficult and of greatest importance. In the upper level planning for SEAD, the problem is defined as to assign the possible targets to each UAV (weapon/sensor) in the team in an optimal sense as well as to arrange the tasking (attacking/sensing) order under the timing constraint in real time. The results from the planer should tell each UAV a plan about which targets to attack and what order to follow.
In order to improve the attacking efficiency, A 3-step approach has been proposed: 1) Target characteristic analysis, includes target grouping according to the geographic distribution and identification of the most critical targets within the groups; 2) UAV Sub-team Formation, during which UAVs is divided into subgroups based on the result of target grouping; 3) Multi-stage Mission Strategy, in which there are two stages. In stage 1, the focus is on the critical targets in the group. During stage 2, all of the UAVs in the team work cooperatively to remove all possible targets.
The research work on the first two steps has just been initialized and the major work completed is about the multi-stage mission strategy. In stage 1, the critical target within the group will be attacked, and the heuristics and experience will be applied such that an attacking sequence is found and the UAV safety during this stage is maximized. Usually, minimum number of targets other than the critical targets will be attacked in this stage, and the target is attacked only when it is necessary to increase the security level for UAVs. The UAVs to attack are chosen based on the match-up principle, where the most suitable UAVs will be assigned.
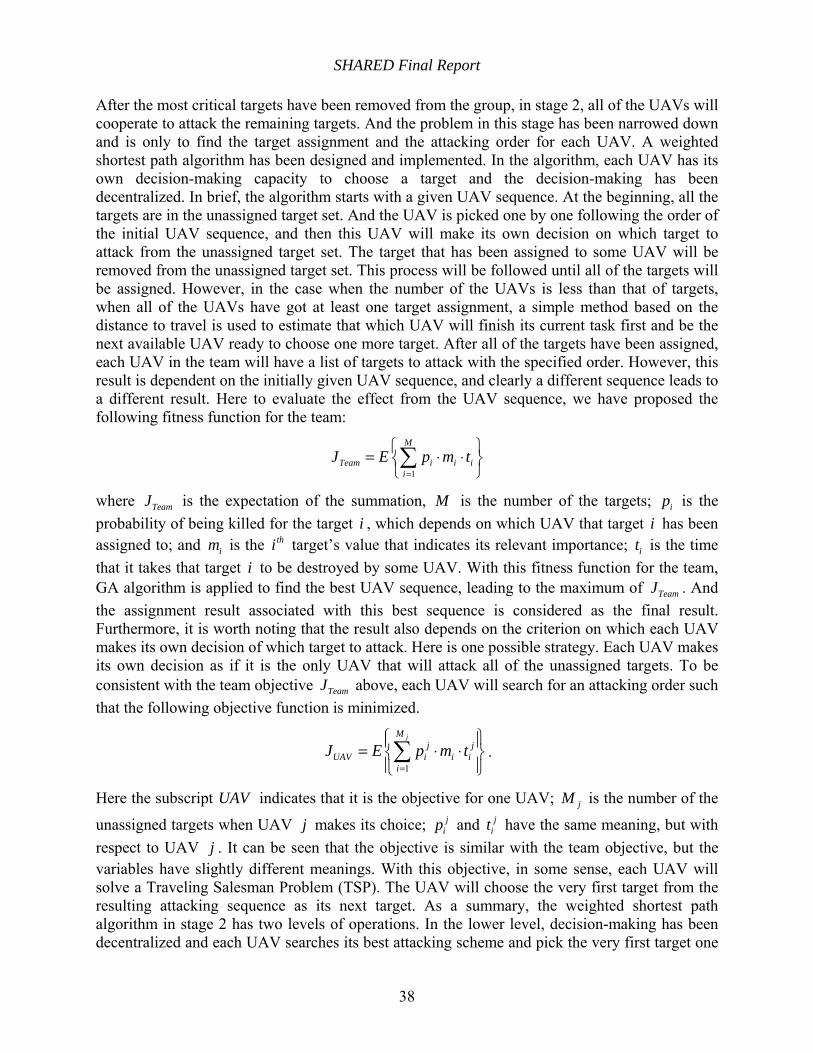
SHARED Final Report
38
After the most critical targets have been removed from the group, in stage 2, all of the UAVs will cooperate to attack the remaining targets. And the problem in this stage has been narrowed down and is only to find the target assignment and the attacking order for each UAV. A weighted shortest path algorithm has been designed and implemented. In the algorithm, each UAV has its own decision-making capacity to choose a target and the decision-making has been decentralized. In brief, the algorithm starts with a given UAV sequence. At the beginning, all the targets are in the unassigned target set. And the UAV is picked one by one following the order of the initial UAV sequence, and then this UAV will make its own decision on which target to attack from the unassigned target set. The target that has been assigned to some UAV will be removed from the unassigned target set. This process will be followed until all of the targets will be assigned. However, in the case when the number of the UAVs is less than that of targets, when all of the UAVs have got at least one target assignment, a simple method based on the distance to travel is used to estimate that which UAV will finish its current task first and be the next available UAV ready to choose one more target. After all of the targets have been assigned, each UAV in the team will have a list of targets to attack with the specified order. However, this result is dependent on the initially given UAV sequence, and clearly a different sequence leads to a different result. Here to evaluate the effect from the UAV sequence, we have proposed the following fitness function for the team:
1
M
Team i i ii
J E p m t=
⎧ ⎫= ⋅ ⋅⎨ ⎬⎩ ⎭∑
where TeamJ is the expectation of the summation, M is the number of the targets; ip is the probability of being killed for the target i , which depends on which UAV that target i has been assigned to; and im is the thi target’s value that indicates its relevant importance; it is the time that it takes that target i to be destroyed by some UAV. With this fitness function for the team, GA algorithm is applied to find the best UAV sequence, leading to the maximum of TeamJ . And the assignment result associated with this best sequence is considered as the final result. Furthermore, it is worth noting that the result also depends on the criterion on which each UAV makes its own decision of which target to attack. Here is one possible strategy. Each UAV makes its own decision as if it is the only UAV that will attack all of the unassigned targets. To be consistent with the team objective TeamJ above, each UAV will search for an attacking order such that the following objective function is minimized.
1
jMj j
UAV i i ii
J E p m t=
⎧ ⎫⎪ ⎪= ⋅ ⋅⎨ ⎬⎪ ⎪⎩ ⎭∑ .
Here the subscript UAV indicates that it is the objective for one UAV; jM is the number of the
unassigned targets when UAV j makes its choice; jip and j
it have the same meaning, but with respect to UAV j . It can be seen that the objective is similar with the team objective, but the variables have slightly different meanings. With this objective, in some sense, each UAV will solve a Traveling Salesman Problem (TSP). The UAV will choose the very first target from the resulting attacking sequence as its next target. As a summary, the weighted shortest path algorithm in stage 2 has two levels of operations. In the lower level, decision-making has been decentralized and each UAV searches its best attacking scheme and pick the very first target one
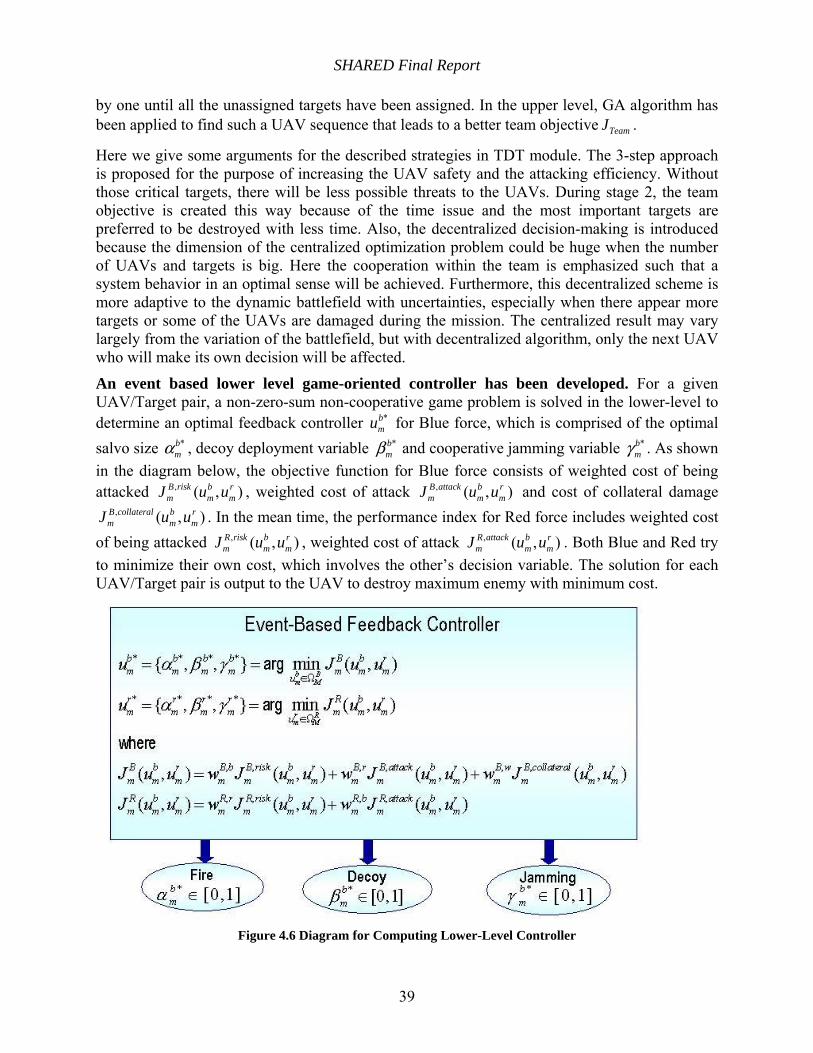
SHARED Final Report
39
by one until all the unassigned targets have been assigned. In the upper level, GA algorithm has been applied to find such a UAV sequence that leads to a better team objective TeamJ .
Here we give some arguments for the described strategies in TDT module. The 3-step approach is proposed for the purpose of increasing the UAV safety and the attacking efficiency. Without those critical targets, there will be less possible threats to the UAVs. During stage 2, the team objective is created this way because of the time issue and the most important targets are preferred to be destroyed with less time. Also, the decentralized decision-making is introduced because the dimension of the centralized optimization problem could be huge when the number of UAVs and targets is big. Here the cooperation within the team is emphasized such that a system behavior in an optimal sense will be achieved. Furthermore, this decentralized scheme is more adaptive to the dynamic battlefield with uncertainties, especially when there appear more targets or some of the UAVs are damaged during the mission. The centralized result may vary largely from the variation of the battlefield, but with decentralized algorithm, only the next UAV who will make its own decision will be affected.
An event based lower level game-oriented controller has been developed. For a given UAV/Target pair, a non-zero-sum non-cooperative game problem is solved in the lower-level to determine an optimal feedback controller *b
mu for Blue force, which is comprised of the optimal salvo size *b
mα , decoy deployment variable *bmβ and cooperative jamming variable *b
mγ . As shown in the diagram below, the objective function for Blue force consists of weighted cost of being attacked , ( , )B risk b r
m m mJ u u , weighted cost of attack , ( , )B attack b rm m mJ u u and cost of collateral damage
, ( , )B collateral b rm m mJ u u . In the mean time, the performance index for Red force includes weighted cost
of being attacked , ( , )R risk b rm m mJ u u , weighted cost of attack , ( , )R attack b r
m m mJ u u . Both Blue and Red try to minimize their own cost, which involves the other’s decision variable. The solution for each UAV/Target pair is output to the UAV to destroy maximum enemy with minimum cost.
Figure 4.6 Diagram for Computing Lower-Level Controller
SHARED Final Report
40
4.2.3 AI-Based Task Assignment
Several artificial intelligence based centralized target assignment algorithms for teamed UAVs have been developed. Task assignment is one of the core steps to effectively exploit the capabilities of cooperative control of multiple Uninhabited Aerospace Vehicle (UAV) teams. Task assignment is an NP-complete problem. In this project, we present several new task assignment algorithms that are based on the principles of artificial intelligence (AI), such as fuzzy logic, genetic algorithm and particle swarm optimization etc. We discuss the adaptation and implementation of the AI search strategy to the task assignment problem in the cooperative control of multiple UAVs.
A new theoretic approach to fuzzy noncooperative Nash games has been developed. Systems that involve more than one decision maker are often optimized using the theory of games. In the traditional game theory, it is assumed that each player has a well-defined quantitative utility function over a set of player’s decision space. Each player attempts to maximize/minimize his/her own expected utility, and each is assumed to know the extensive game in full. At present it cannot be claimed that the first assumption has been shown to be true in a wide variety of situations involving complex problems in economics, engineering, social and political sciences due to the difficulty inherent in defining an adequate utility function for each player in these types of problems. On the other hand, in many of such complex problems each player has a heuristic knowledge of the desires of the other players and a heuristic knowledge of control choices that they will each make in order to meet their ends. In this project, we utilize fuzzy set theory in order to incorporate the players’ heuristic knowledge of decision making into the framework of conventional game theory or ordinal game theory. We define a new approach to N-person static fuzzy non-cooperative games and develop a solution concept such as Nash for these types of games. We show that this general formulation of fuzzy non-cooperative games can be applied to solve multi-decision making problems where no objective functions are specified. The computational procedure is illustrated via application to a multi-agent optimization problem dealing with the design and operation of future military operation. Ref. [OSUTDT-6]
4.2.4 Extended Bidirectional Associative Memory
Extended Bidirectional Associative Memory has been developed for TDT and CPP Applications. We extended the Basic Bidirectional Associative Memory (BAM) (Ref. 12, 13) by choosing weights in the correlation matrix, for a given set of training pairs, which result in a maximum noise tolerance set for BAM. We prove that for a given set of training pairs, the maximum noise tolerance set is the largest, in the sense that this optimized BAM will recall the correct training pair if any input pattern is within the maximum noise tolerance set and at least one pattern outside the maximum noise tolerance set by one Hamming distance will not converge to the correct training pair. This maximum tolerance set is the union of the maximum basins of attraction. A standard Genetic Algorithm (GA) is used to calculate the weights to maximize the objective function which generates a maximum tolerance set for BAM. We have developed a BAM model of CPP. The optimization based training strategy was successfully implemented a CPP application. Feedback sensing was introduced as another extension of BAM in the context of the CPP application. Both extensions as well as the basic BAM were implemented in C++ simulation software. Simulation results suggested that the optimization based training strategy is

SHARED Final Report
41
very promising in designing the training weights, and BAM appears to be promising for future applications of military Hierarchical Cooperative Control.
4.2.5 Cooperative Jamming Strategy
A Cooperative Jamming Strategy has been developed to make use of the network-Centric paradigm by exploiting multiple platforms to gain geometric, physical and tactical advantage. Assume that the Blue force consists of weapon UAVs and sensor UAVs; the Red force consists of SAMs and radars (EW radars, SAM search radars and SAM fire control radars). Each Blue UAV has a jammer. The Blue jammer deployment strategy has been developed such that Blue UAVs are protected from being detected by Red radars. Because Red radars can network, the ideal situation is to jam all Red radars. However, due to the limited Blue jamming power, sometimes it is impossible to fulfill the ideal situation. Thus our goal is to jam as many Red radars as possible. This is an exhaustive search problem and the computation quantity depends on the number of both Blue jammers and Red radars. A suboptimal static jamming strategy with less computation quantity is developed as the following: Suppose that the initial states of all jammers are closed. In order to protect Blue UAVs from the Red attack, a conservative strategy is used: only the jammers loaded on the UAVs which cannot be reached by all of the Red weapons are regarded as available. The information whether a Blue UAV has been painted or not is known, but it does not know it is painted by which Red radars. The flowchart of the algorithm is given below and the details are followed.
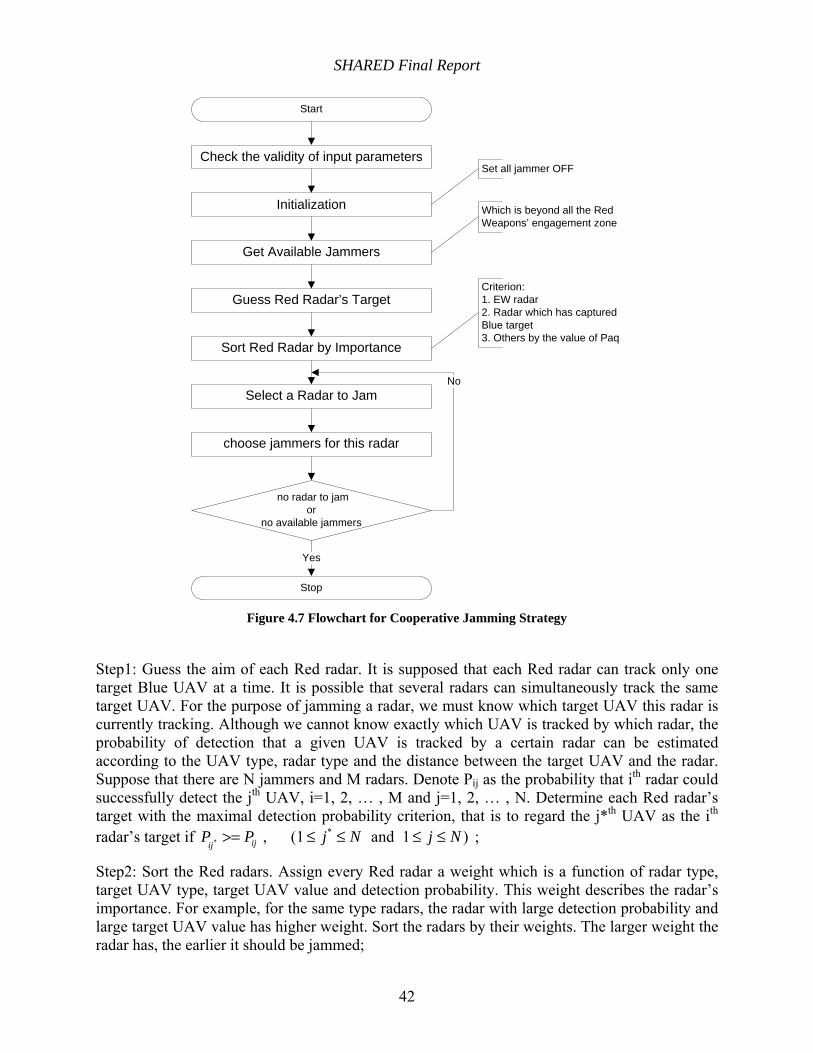
SHARED Final Report
42
Check the validity of input parameters
Start
Initialization
Get Available Jammers
Guess Red Radar’s Target
Sort Red Radar by Importance
Stop
Select a Radar to Jam
choose jammers for this radar
no radar to jamor
no available jammers
Yes
No
Set all jammer OFF
Which is beyond all the Red Weapons’ engagement zone
Criterion:1. EW radar2. Radar which has captured Blue target3. Others by the value of Paq
Figure 4.7 Flowchart for Cooperative Jamming Strategy
Step1: Guess the aim of each Red radar. It is supposed that each Red radar can track only one target Blue UAV at a time. It is possible that several radars can simultaneously track the same target UAV. For the purpose of jamming a radar, we must know which target UAV this radar is currently tracking. Although we cannot know exactly which UAV is tracked by which radar, the probability of detection that a given UAV is tracked by a certain radar can be estimated according to the UAV type, radar type and the distance between the target UAV and the radar. Suppose that there are N jammers and M radars. Denote Pij as the probability that ith radar could successfully detect the jth UAV, i=1, 2, … , M and j=1, 2, … , N. Determine each Red radar’s target with the maximal detection probability criterion, that is to regard the j*th UAV as the ith radar’s target if *
* , (1 and 1 )ijijP P j N j N>= ≤ ≤ ≤ ≤ ;
Step2: Sort the Red radars. Assign every Red radar a weight which is a function of radar type, target UAV type, target UAV value and detection probability. This weight describes the radar’s importance. For example, for the same type radars, the radar with large detection probability and large target UAV value has higher weight. Sort the radars by their weights. The larger weight the radar has, the earlier it should be jammed;
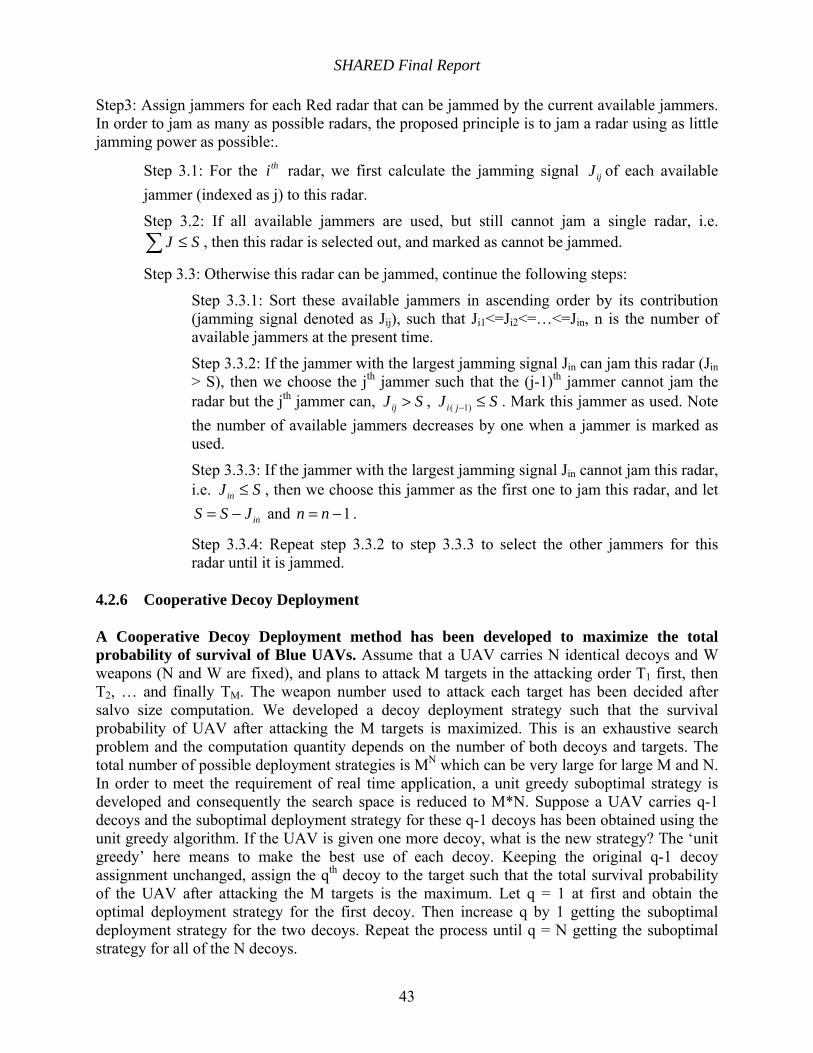
SHARED Final Report
43
Step3: Assign jammers for each Red radar that can be jammed by the current available jammers. In order to jam as many as possible radars, the proposed principle is to jam a radar using as little jamming power as possible:.
Step 3.1: For the thi radar, we first calculate the jamming signal ijJ of each available jammer (indexed as j) to this radar.
Step 3.2: If all available jammers are used, but still cannot jam a single radar, i.e. J S≤∑ , then this radar is selected out, and marked as cannot be jammed.
Step 3.3: Otherwise this radar can be jammed, continue the following steps:
Step 3.3.1: Sort these available jammers in ascending order by its contribution (jamming signal denoted as Jij), such that Ji1<=Ji2<=…<=Jin, n is the number of available jammers at the present time. Step 3.3.2: If the jammer with the largest jamming signal Jin can jam this radar (Jin > S), then we choose the jth jammer such that the (j-1)th jammer cannot jam the radar but the jth jammer can, ijJ S> , ( 1)i jJ S− ≤ . Mark this jammer as used. Note the number of available jammers decreases by one when a jammer is marked as used.
Step 3.3.3: If the jammer with the largest jamming signal Jin cannot jam this radar, i.e. inJ S≤ , then we choose this jammer as the first one to jam this radar, and let
inS S J= − and 1n n= − .
Step 3.3.4: Repeat step 3.3.2 to step 3.3.3 to select the other jammers for this radar until it is jammed.
4.2.6 Cooperative Decoy Deployment
A Cooperative Decoy Deployment method has been developed to maximize the total probability of survival of Blue UAVs. Assume that a UAV carries N identical decoys and W weapons (N and W are fixed), and plans to attack M targets in the attacking order T1 first, then T2, … and finally TM. The weapon number used to attack each target has been decided after salvo size computation. We developed a decoy deployment strategy such that the survival probability of UAV after attacking the M targets is maximized. This is an exhaustive search problem and the computation quantity depends on the number of both decoys and targets. The total number of possible deployment strategies is MN which can be very large for large M and N. In order to meet the requirement of real time application, a unit greedy suboptimal strategy is developed and consequently the search space is reduced to M*N. Suppose a UAV carries q-1 decoys and the suboptimal deployment strategy for these q-1 decoys has been obtained using the unit greedy algorithm. If the UAV is given one more decoy, what is the new strategy? The ‘unit greedy’ here means to make the best use of each decoy. Keeping the original q-1 decoy assignment unchanged, assign the qth decoy to the target such that the total survival probability of the UAV after attacking the M targets is the maximum. Let q = 1 at first and obtain the optimal deployment strategy for the first decoy. Then increase q by 1 getting the suboptimal deployment strategy for the two decoys. Repeat the process until q = N getting the suboptimal strategy for all of the N decoys.
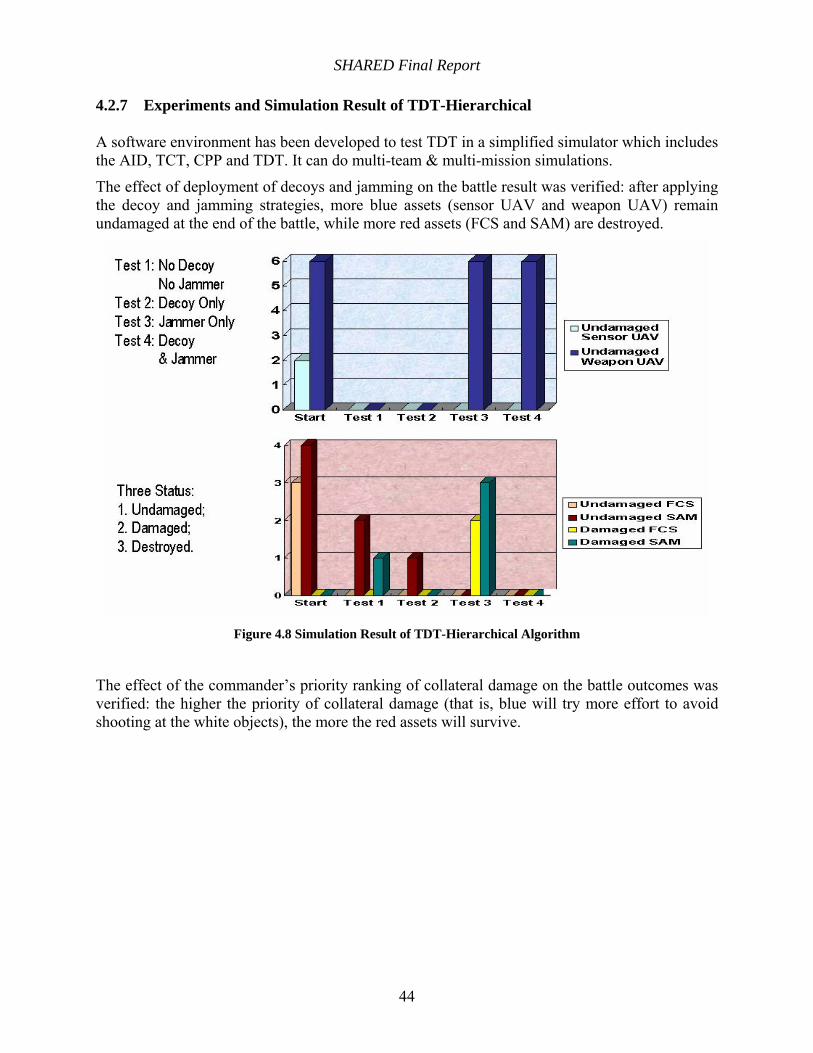
SHARED Final Report
44
4.2.7 Experiments and Simulation Result of TDT-Hierarchical
A software environment has been developed to test TDT in a simplified simulator which includes the AID, TCT, CPP and TDT. It can do multi-team & multi-mission simulations.
The effect of deployment of decoys and jamming on the battle result was verified: after applying the decoy and jamming strategies, more blue assets (sensor UAV and weapon UAV) remain undamaged at the end of the battle, while more red assets (FCS and SAM) are destroyed.
Figure 4.8 Simulation Result of TDT-Hierarchical Algorithm
The effect of the commander’s priority ranking of collateral damage on the battle outcomes was verified: the higher the priority of collateral damage (that is, blue will try more effort to avoid shooting at the white objects), the more the red assets will survive.
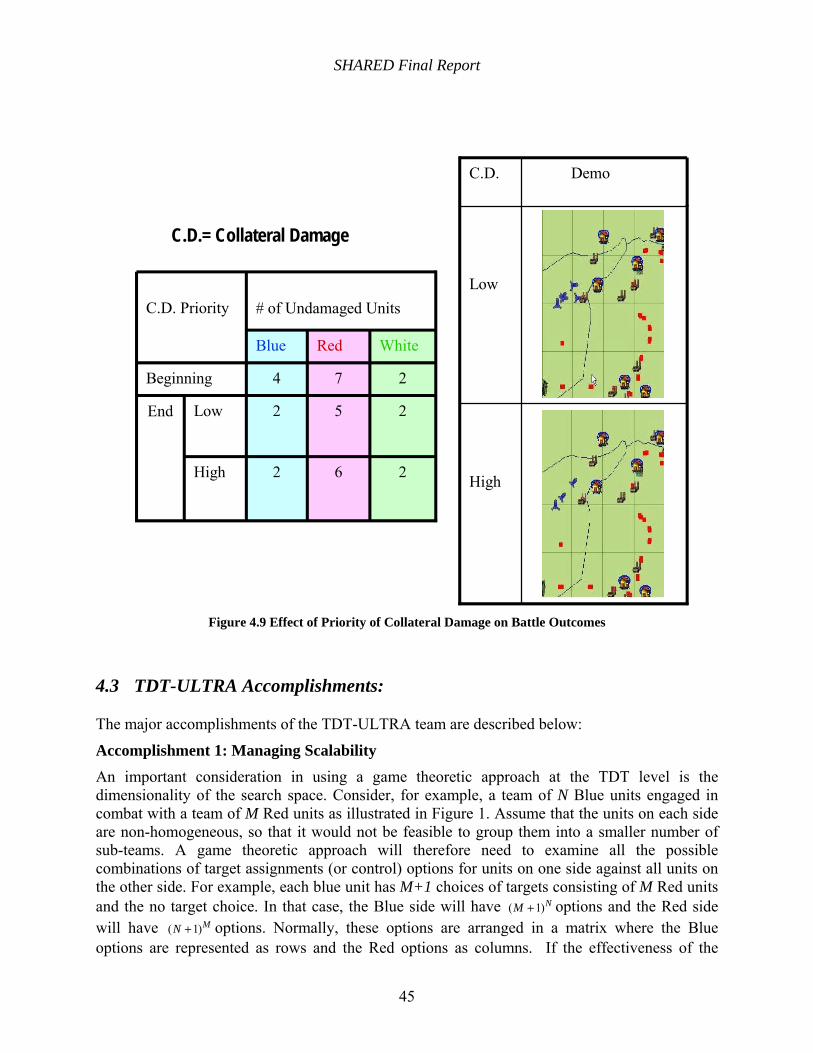
SHARED Final Report
45
2 5 2
2 6 2 High
2
End
7 4 Beginning
Red White
# of Undamaged Units
Low
Blue
C.D. Priority
High
Low
Demo C.D.
C.D.= Collateral Damage
Figure 4.9 Effect of Priority of Collateral Damage on Battle Outcomes
4.3 TDT-ULTRA Accomplishments:
The major accomplishments of the TDT-ULTRA team are described below:
Accomplishment 1: Managing Scalability
An important consideration in using a game theoretic approach at the TDT level is the dimensionality of the search space. Consider, for example, a team of N Blue units engaged in combat with a team of M Red units as illustrated in Figure 1. Assume that the units on each side are non-homogeneous, so that it would not be feasible to group them into a smaller number of sub-teams. A game theoretic approach will therefore need to examine all the possible combinations of target assignments (or control) options for units on one side against all units on the other side. For example, each blue unit has M+1 choices of targets consisting of M Red units and the no target choice. In that case, the Blue side will have ( 1)NM + options and the Red side will have ( 1)MN + options. Normally, these options are arranged in a matrix where the Blue options are represented as rows and the Red options as columns. If the effectiveness of the

SHARED Final Report
46
control options is assessed using objective functions ( , )BJ u v and ( , )RJ u v for the Blue and Red sides respectively, then each entry in this matrix will be a pair of real numbers { ( , )BJ u v , ( , )RJ u v } that correspond to the pair of options { ,u v } where u and v represent Blue and Red control variables, respectively. Table I illustrates the dimensionality of this matrix for several values of N and M.
Figure 4.10 The target Assignment Problem
A pair of control options { , }N Nu v will represent a Nash equilibrium solution if the following two inequalities hold:
( , ) ( , ) for all possible Blue control options ;( , ) ( , ) for all possible Red control options .
N N NB B
N N NR R
J u v J u v uJ u v J u v v
≥≥
The TDT level in SHARED will allow the commander to examine “what if” scenarios by choosing different objective functions, or different weight coefficients in the same objective function. In particular, this would lead to different “what if” scenarios that a commander might want to examine about his guesses (or estimates) of the adversary’s objective functions. The different scenarios translate into different forecasted enemy intents, leading to different Nash solutions.
Table 4.1 Dimensionality of the Target Assignment Game Matrix
Number of Blue Units
N
Number of Red Units
M
Size of Game Matrix: ( 1)NM + × ( 1)MN + Size of Search Space
4 3 256 × 125 332 10×
8 6 6 6(5.76 10 ) (0.53 10 )× × × 123.06 10×
16 12 17 14(6.65 10 ) (5.82 10 )× × × 3138.71 10×
UAV1
Unit 2
Unit 1
Unit M
UAV2
UAV3
UAV4
Unit 1
Team B
Unit 2
Unit 3
Unit N
Team A
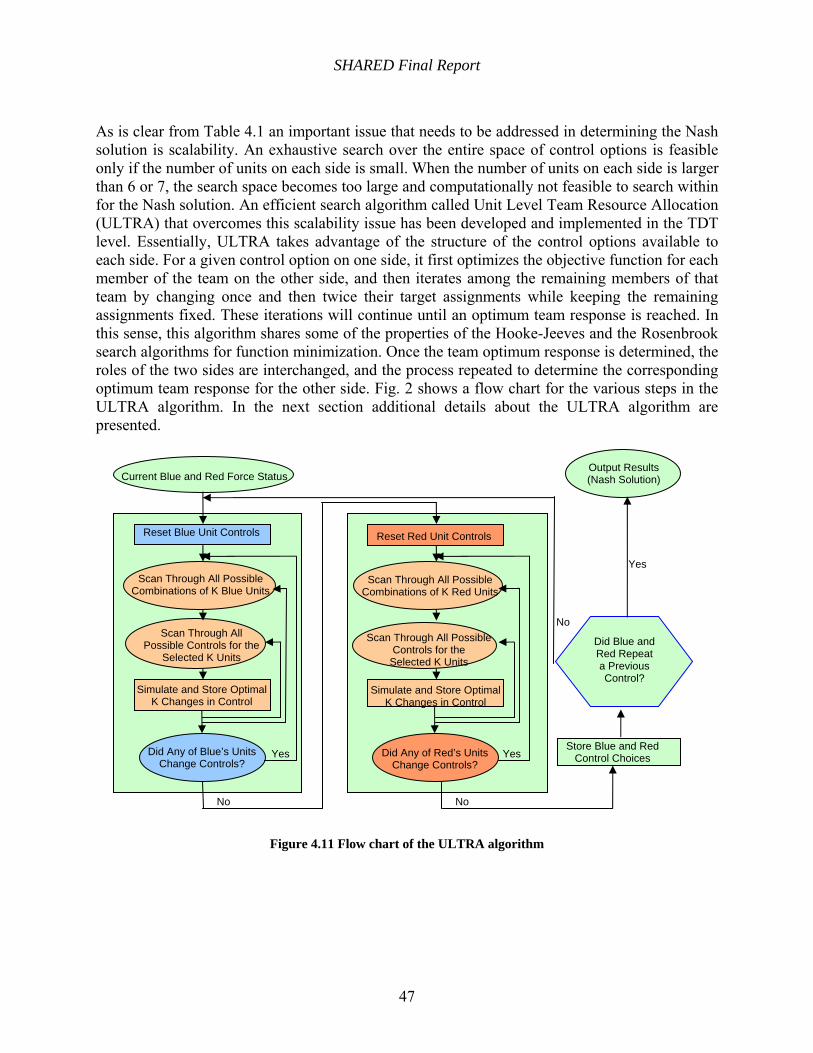
SHARED Final Report
47
As is clear from Table 4.1 an important issue that needs to be addressed in determining the Nash solution is scalability. An exhaustive search over the entire space of control options is feasible only if the number of units on each side is small. When the number of units on each side is larger than 6 or 7, the search space becomes too large and computationally not feasible to search within for the Nash solution. An efficient search algorithm called Unit Level Team Resource Allocation (ULTRA) that overcomes this scalability issue has been developed and implemented in the TDT level. Essentially, ULTRA takes advantage of the structure of the control options available to each side. For a given control option on one side, it first optimizes the objective function for each member of the team on the other side, and then iterates among the remaining members of that team by changing once and then twice their target assignments while keeping the remaining assignments fixed. These iterations will continue until an optimum team response is reached. In this sense, this algorithm shares some of the properties of the Hooke-Jeeves and the Rosenbrook search algorithms for function minimization. Once the team optimum response is determined, the roles of the two sides are interchanged, and the process repeated to determine the corresponding optimum team response for the other side. Fig. 2 shows a flow chart for the various steps in the ULTRA algorithm. In the next section additional details about the ULTRA algorithm are presented.
Figure 4.11 Flow chart of the ULTRA algorithm
Current Blue and Red Force Status
Reset Blue Unit Controls
Scan Through All Possible Combinations of K Blue Units
Scan Through All Possible Controls for the
Selected K Units
Simulate and Store Optimal K Changes in Control
Did Any of Blue’s Units Change Controls?
Yes
Reset Red Unit Controls
Scan Through All Possible Combinations of K Red Units
Did Any of Red’s Units Change Controls?
Yes
No No
Store Blue and Red Control Choices
No
Output Results (Nash Solution)
Yes
Did Blue and Red Repeat a Previous Control?
Scan Through All Possible Controls for the
Selected K Units
Simulate and Store Optimal K Changes in Control
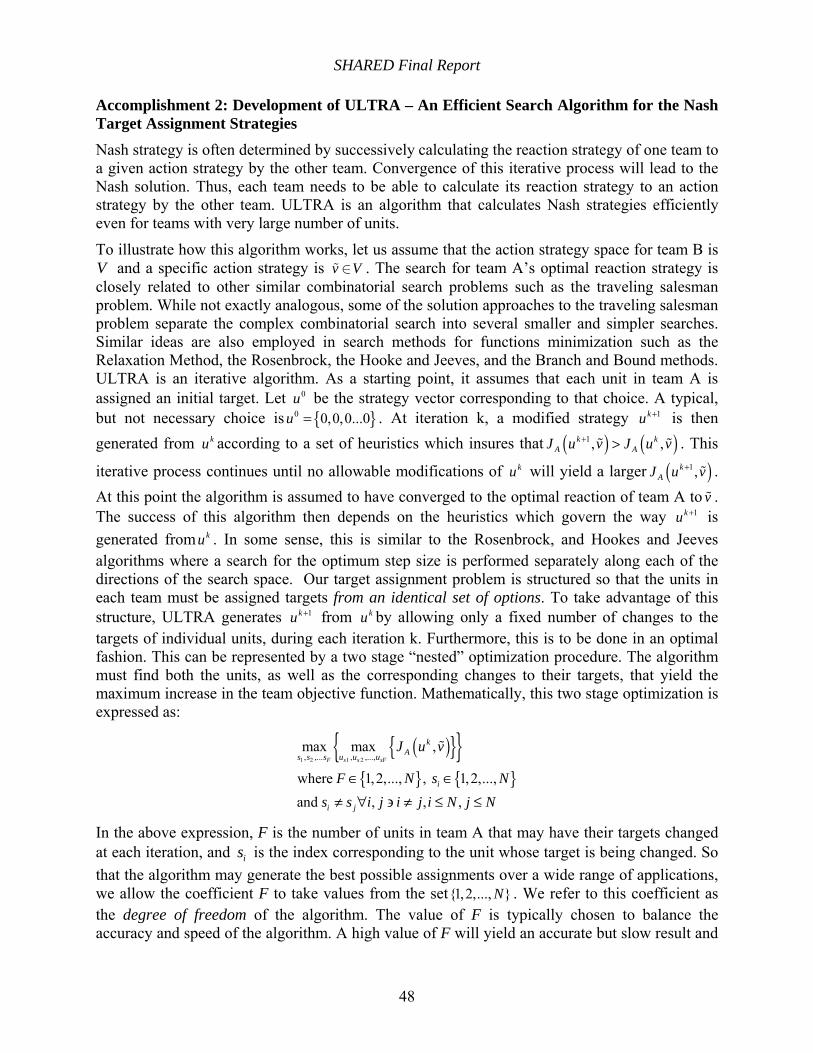
SHARED Final Report
48
Accomplishment 2: Development of ULTRA – An Efficient Search Algorithm for the Nash Target Assignment Strategies
Nash strategy is often determined by successively calculating the reaction strategy of one team to a given action strategy by the other team. Convergence of this iterative process will lead to the Nash solution. Thus, each team needs to be able to calculate its reaction strategy to an action strategy by the other team. ULTRA is an algorithm that calculates Nash strategies efficiently even for teams with very large number of units.
To illustrate how this algorithm works, let us assume that the action strategy space for team B is V and a specific action strategy is v V∈ . The search for team A’s optimal reaction strategy is closely related to other similar combinatorial search problems such as the traveling salesman problem. While not exactly analogous, some of the solution approaches to the traveling salesman problem separate the complex combinatorial search into several smaller and simpler searches. Similar ideas are also employed in search methods for functions minimization such as the Relaxation Method, the Rosenbrock, the Hooke and Jeeves, and the Branch and Bound methods. ULTRA is an iterative algorithm. As a starting point, it assumes that each unit in team A is assigned an initial target. Let 0u be the strategy vector corresponding to that choice. A typical, but not necessary choice is { }0 0,0,0...0u = . At iteration k, a modified strategy 1ku + is then generated from ku according to a set of heuristics which insures that ( ) ( )1, ,k k
A AJ u v J u v+ > . This
iterative process continues until no allowable modifications of ku will yield a larger ( )1,kAJ u v+ .
At this point the algorithm is assumed to have converged to the optimal reaction of team A to v . The success of this algorithm then depends on the heuristics which govern the way 1ku + is generated from ku . In some sense, this is similar to the Rosenbrock, and Hookes and Jeeves algorithms where a search for the optimum step size is performed separately along each of the directions of the search space. Our target assignment problem is structured so that the units in each team must be assigned targets from an identical set of options. To take advantage of this structure, ULTRA generates 1ku + from ku by allowing only a fixed number of changes to the targets of individual units, during each iteration k. Furthermore, this is to be done in an optimal fashion. This can be represented by a two stage “nested” optimization procedure. The algorithm must find both the units, as well as the corresponding changes to their targets, that yield the maximum increase in the team objective function. Mathematically, this two stage optimization is expressed as:
( ){ }{ }{ } { }
1 2 1 2, ,... , ,...,max max ,
where 1,2,..., , 1,2,...,and , , ,
F s s sF
kAs s s u u u
i
i j
J u v
F N s Ns s i j i j i N j N
∈ ∈≠ ∀ ∋ ≠ ≤ ≤
In the above expression, F is the number of units in team A that may have their targets changed at each iteration, and is is the index corresponding to the unit whose target is being changed. So that the algorithm may generate the best possible assignments over a wide range of applications, we allow the coefficient F to take values from the set{1,2,..., }N . We refer to this coefficient as the degree of freedom of the algorithm. The value of F is typically chosen to balance the accuracy and speed of the algorithm. A high value of F will yield an accurate but slow result and
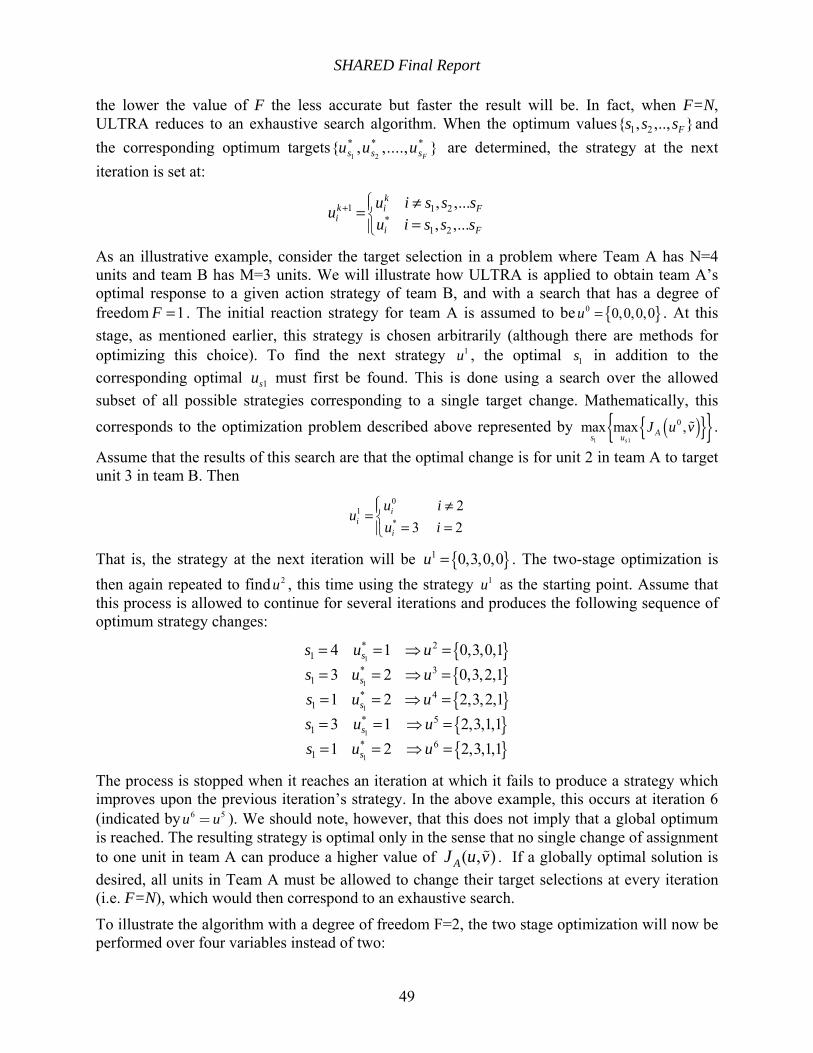
SHARED Final Report
49
the lower the value of F the less accurate but faster the result will be. In fact, when F=N, ULTRA reduces to an exhaustive search algorithm. When the optimum values 1 2{ , ,.., }Fs s s and the corresponding optimum targets
1 2
* * *{ , ,...., }Fs s su u u are determined, the strategy at the next
iteration is set at:
1 1 2*
1 2
, ,..., ,...
kk i Fi
i F
u i s s suu i s s s
+ ⎧⎪⎨⎪⎩
≠==
As an illustrative example, consider the target selection in a problem where Team A has N=4 units and team B has M=3 units. We will illustrate how ULTRA is applied to obtain team A’s optimal response to a given action strategy of team B, and with a search that has a degree of freedom 1F = . The initial reaction strategy for team A is assumed to be { }0 0,0,0,0u = . At this stage, as mentioned earlier, this strategy is chosen arbitrarily (although there are methods for optimizing this choice). To find the next strategy 1u , the optimal 1s in addition to the corresponding optimal 1su must first be found. This is done using a search over the allowed subset of all possible strategies corresponding to a single target change. Mathematically, this
corresponds to the optimization problem described above represented by ( ){ }{ }1 1
0max max ,s
As uJ u v .
Assume that the results of this search are that the optimal change is for unit 2 in team A to target unit 3 in team B. Then
01
*
23 2
ii
i
u iu
u i⎧ ≠⎪= ⎨ = =⎪⎩
That is, the strategy at the next iteration will be { }1 0,3,0,0u = . The two-stage optimization is then again repeated to find 2u , this time using the strategy 1u as the starting point. Assume that this process is allowed to continue for several iterations and produces the following sequence of optimum strategy changes:
{ }{ }{ }{ }{ }
1
1
1
1
1
* 21
* 31
* 41
* 51
* 61
4 1 0,3,0,13 2 0,3,2,11 2 2,3,2,13 1 2,3,1,11 2 2,3,1,1
s
s
s
s
s
s u us u us u us u us u u
= = ⇒ == = ⇒ == = ⇒ == = ⇒ == = ⇒ =
The process is stopped when it reaches an iteration at which it fails to produce a strategy which improves upon the previous iteration’s strategy. In the above example, this occurs at iteration 6 (indicated by 6 5u u= ). We should note, however, that this does not imply that a global optimum is reached. The resulting strategy is optimal only in the sense that no single change of assignment to one unit in team A can produce a higher value of ( , )AJ u v . If a globally optimal solution is desired, all units in Team A must be allowed to change their target selections at every iteration (i.e. F=N), which would then correspond to an exhaustive search.
To illustrate the algorithm with a degree of freedom F=2, the two stage optimization will now be performed over four variables instead of two:
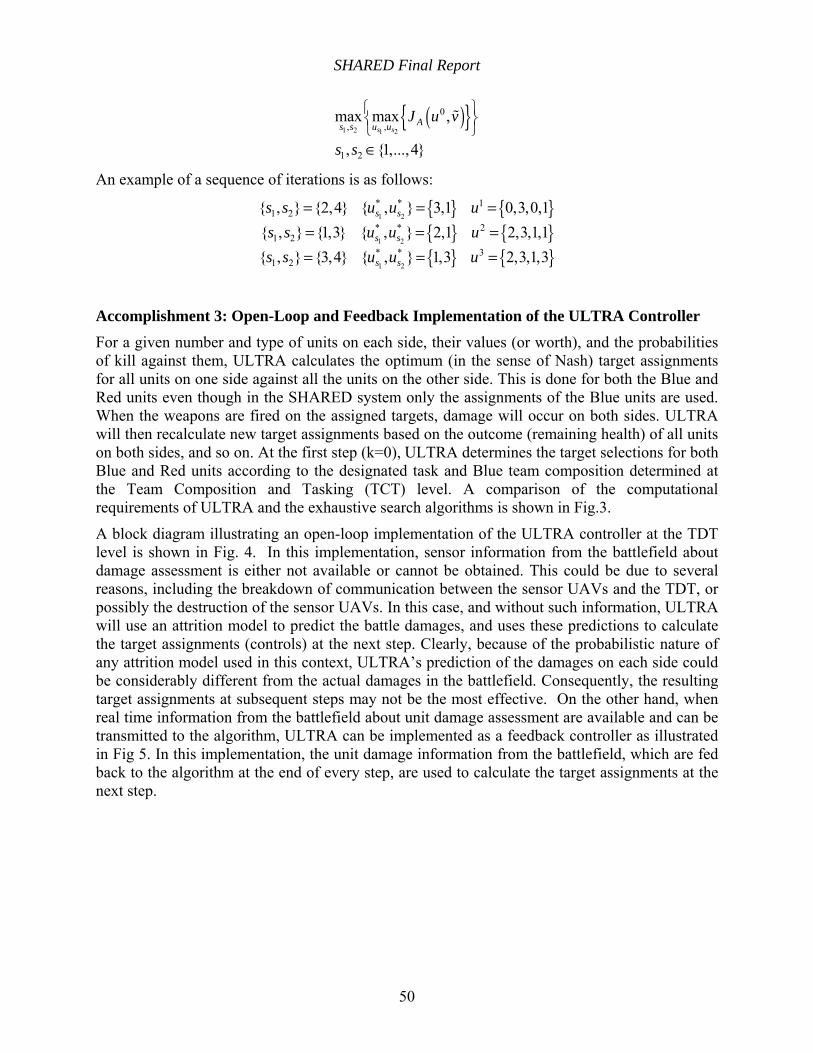
SHARED Final Report
50
( ){ }1 2 1 2
0, ,
1 2
max max ,
, {1,...,4}s s
As s u uJ u v
s s
⎧ ⎫⎨ ⎬⎩ ⎭∈
An example of a sequence of iterations is as follows:
{ } { }{ } { }{ } { }
1 2
1 2
1 2
* * 11 2
* * 21 2
* * 31 2
{ , } {2,4} { , } 3,1 0,3,0,1{ , } {1,3} { , } 2,1 2,3,1,1{ , } {3,4} { , } 1,3 2,3,1,3
s s
s s
s s
s s u u us s u u us s u u u
= = == = == = =
Accomplishment 3: Open-Loop and Feedback Implementation of the ULTRA Controller
For a given number and type of units on each side, their values (or worth), and the probabilities of kill against them, ULTRA calculates the optimum (in the sense of Nash) target assignments for all units on one side against all the units on the other side. This is done for both the Blue and Red units even though in the SHARED system only the assignments of the Blue units are used. When the weapons are fired on the assigned targets, damage will occur on both sides. ULTRA will then recalculate new target assignments based on the outcome (remaining health) of all units on both sides, and so on. At the first step (k=0), ULTRA determines the target selections for both Blue and Red units according to the designated task and Blue team composition determined at the Team Composition and Tasking (TCT) level. A comparison of the computational requirements of ULTRA and the exhaustive search algorithms is shown in Fig.3.
A block diagram illustrating an open-loop implementation of the ULTRA controller at the TDT level is shown in Fig. 4. In this implementation, sensor information from the battlefield about damage assessment is either not available or cannot be obtained. This could be due to several reasons, including the breakdown of communication between the sensor UAVs and the TDT, or possibly the destruction of the sensor UAVs. In this case, and without such information, ULTRA will use an attrition model to predict the battle damages, and uses these predictions to calculate the target assignments (controls) at the next step. Clearly, because of the probabilistic nature of any attrition model used in this context, ULTRA’s prediction of the damages on each side could be considerably different from the actual damages in the battlefield. Consequently, the resulting target assignments at subsequent steps may not be the most effective. On the other hand, when real time information from the battlefield about unit damage assessment are available and can be transmitted to the algorithm, ULTRA can be implemented as a feedback controller as illustrated in Fig 5. In this implementation, the unit damage information from the battlefield, which are fed back to the algorithm at the end of every step, are used to calculate the target assignments at the next step.
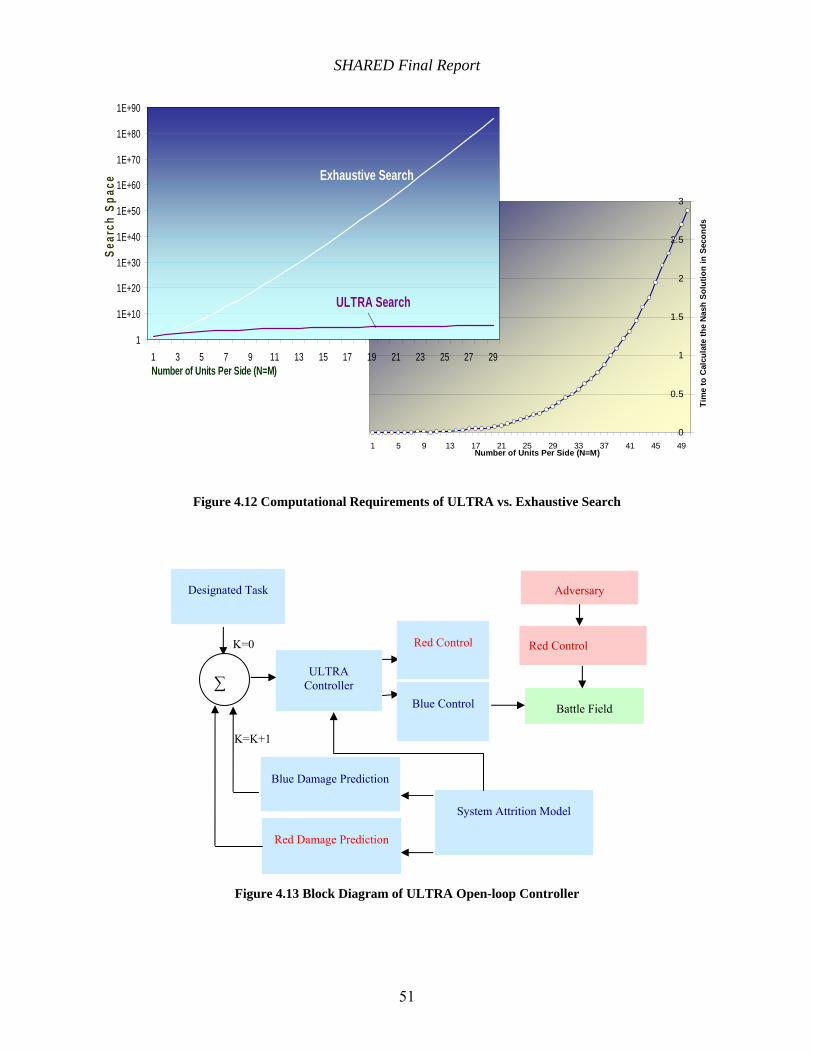
SHARED Final Report
51
Figure 4.12 Computational Requirements of ULTRA vs. Exhaustive Search
Figure 4.13 Block Diagram of ULTRA Open-loop Controller
0
0.5
1
1.5
2
2.5
3
1 5 9 13 17 21 25 29 33 37 41 45 49Number of Units Per Side (N=M)
Tim
e to
Cal
cula
te th
e N
ash
Solu
tion
in S
econ
ds
1
1E+10
1E+20
1E+30
1E+40
1E+50
1E+60
1E+70
1E+80
1E+90
1 3 5 7 9 11 13 15 17 19 21 23 25 27 29Number of Units Per Side (N=M)
Sear
ch S
pace
ULTRA Search
Exhaustive Search
Designated Task
∑ ULTRA
Controller
Red Control
Blue Control Battle Field
Adversary
Red Control
Blue Damage Prediction
Red Damage Prediction
K=0
K=K+1
System Attrition Model
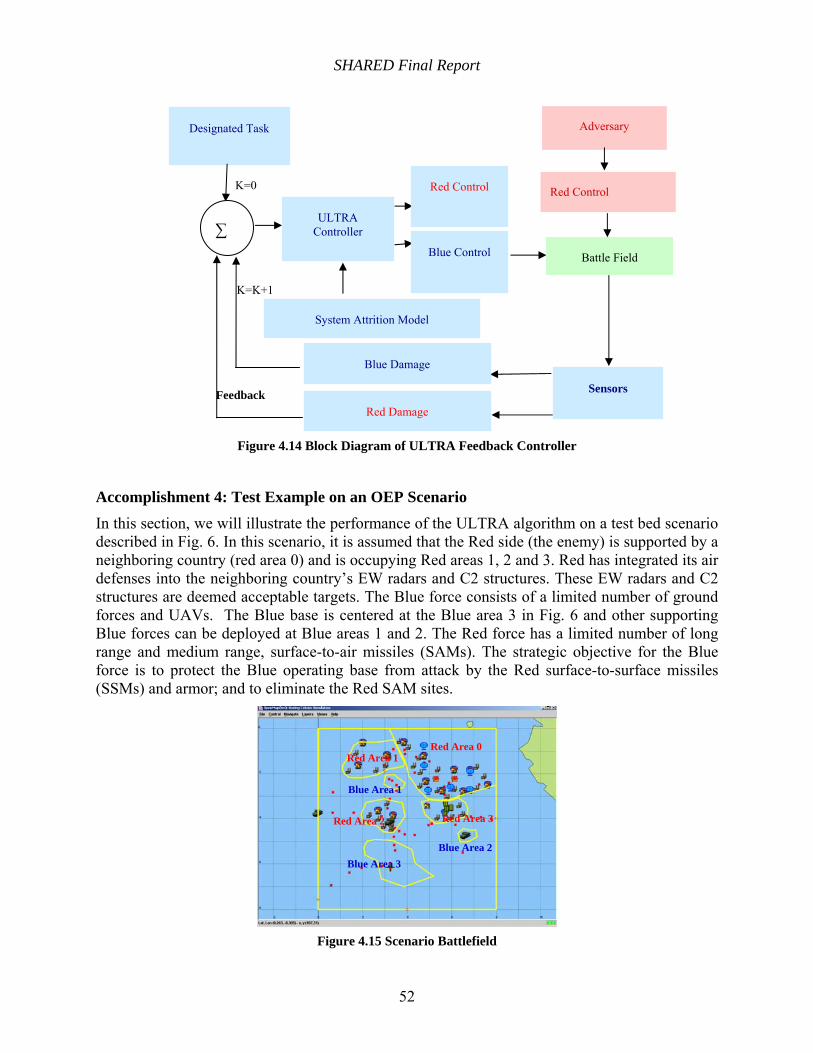
SHARED Final Report
52
Feedback
Designated Task
∑ ULTRA
Controller
Red Control
Blue Control Battle Field
Adversary
Red Control
Blue Damage
Red Damage
K=0
K=K+1
System Attrition Model
Sensors
Figure 4.14 Block Diagram of ULTRA Feedback Controller
Accomplishment 4: Test Example on an OEP Scenario
In this section, we will illustrate the performance of the ULTRA algorithm on a test bed scenario described in Fig. 6. In this scenario, it is assumed that the Red side (the enemy) is supported by a neighboring country (red area 0) and is occupying Red areas 1, 2 and 3. Red has integrated its air defenses into the neighboring country’s EW radars and C2 structures. These EW radars and C2 structures are deemed acceptable targets. The Blue force consists of a limited number of ground forces and UAVs. The Blue base is centered at the Blue area 3 in Fig. 6 and other supporting Blue forces can be deployed at Blue areas 1 and 2. The Red force has a limited number of long range and medium range, surface-to-air missiles (SAMs). The strategic objective for the Blue force is to protect the Blue operating base from attack by the Red surface-to-surface missiles (SSMs) and armor; and to eliminate the Red SAM sites.
Figure 4.15 Scenario Battlefield
Blue Area 3
Red Area 2
Blue Area 1
Red Area 1 Red Area 0
Red Area 3
Blue Area 2
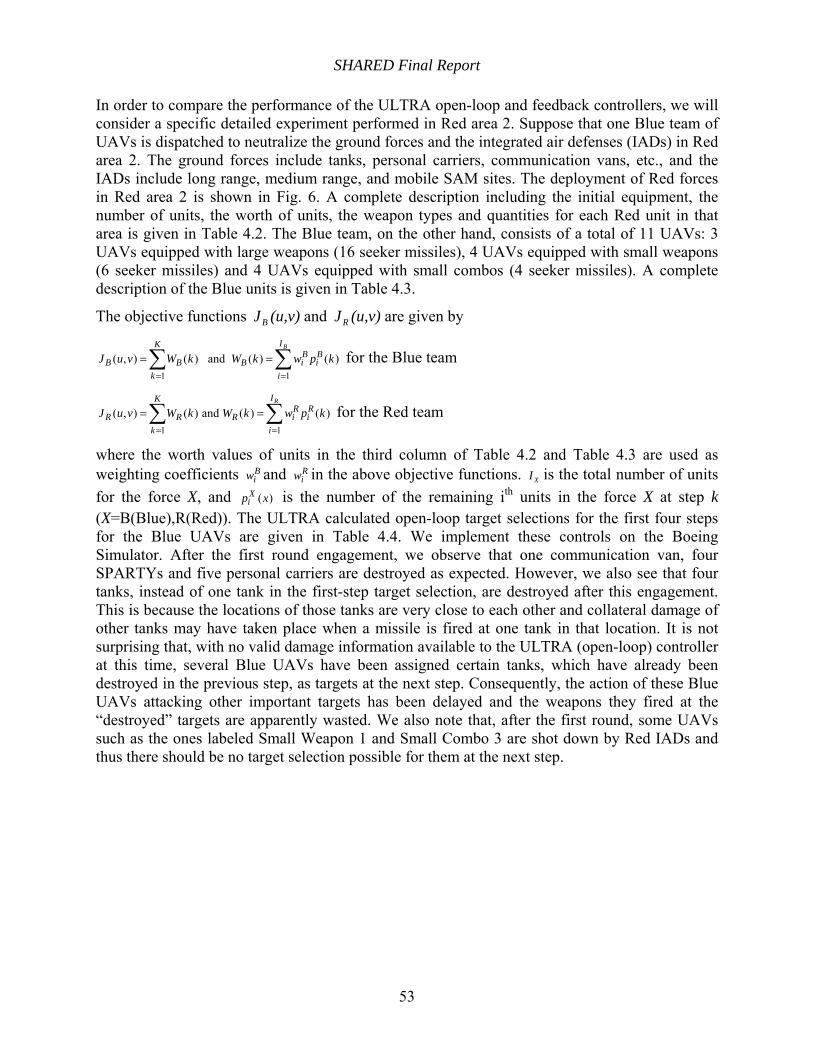
SHARED Final Report
53
In order to compare the performance of the ULTRA open-loop and feedback controllers, we will consider a specific detailed experiment performed in Red area 2. Suppose that one Blue team of UAVs is dispatched to neutralize the ground forces and the integrated air defenses (IADs) in Red area 2. The ground forces include tanks, personal carriers, communication vans, etc., and the IADs include long range, medium range, and mobile SAM sites. The deployment of Red forces in Red area 2 is shown in Fig. 6. A complete description including the initial equipment, the number of units, the worth of units, the weapon types and quantities for each Red unit in that area is given in Table 4.2. The Blue team, on the other hand, consists of a total of 11 UAVs: 3 UAVs equipped with large weapons (16 seeker missiles), 4 UAVs equipped with small weapons (6 seeker missiles) and 4 UAVs equipped with small combos (4 seeker missiles). A complete description of the Blue units is given in Table 4.3.
The objective functions BJ (u,v) and RJ (u,v) are given by
1 1
( , ) ( ) and ( ) ( )BIK
B BB B B i i
k i
J u v W k W k w p k= =
= =∑ ∑ for the Blue team
1 1
( , ) ( ) and ( ) ( )RIK
R RR R R i i
k i
J u v W k W k w p k= =
= =∑ ∑ for the Red team
where the worth values of units in the third column of Table 4.2 and Table 4.3 are used as weighting coefficients B
iw and Riw in the above objective functions. XI is the total number of units
for the force X, and ( )Xip x is the number of the remaining ith units in the force X at step k
(X=B(Blue),R(Red)). The ULTRA calculated open-loop target selections for the first four steps for the Blue UAVs are given in Table 4.4. We implement these controls on the Boeing Simulator. After the first round engagement, we observe that one communication van, four SPARTYs and five personal carriers are destroyed as expected. However, we also see that four tanks, instead of one tank in the first-step target selection, are destroyed after this engagement. This is because the locations of those tanks are very close to each other and collateral damage of other tanks may have taken place when a missile is fired at one tank in that location. It is not surprising that, with no valid damage information available to the ULTRA (open-loop) controller at this time, several Blue UAVs have been assigned certain tanks, which have already been destroyed in the previous step, as targets at the next step. Consequently, the action of these Blue UAVs attacking other important targets has been delayed and the weapons they fired at the “destroyed” targets are apparently wasted. We also note that, after the first round, some UAVs such as the ones labeled Small Weapon 1 and Small Combo 3 are shot down by Red IADs and thus there should be no target selection possible for them at the next step.
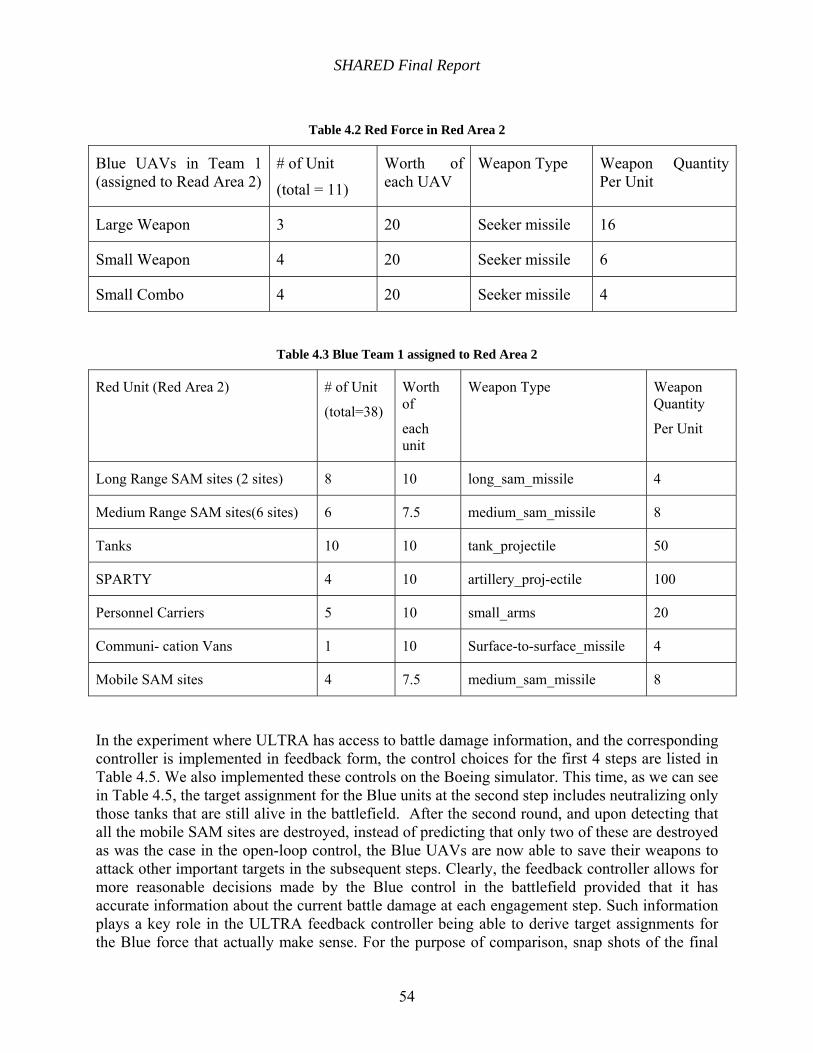
SHARED Final Report
54
Table 4.2 Red Force in Red Area 2
Blue UAVs in Team 1 (assigned to Read Area 2)
# of Unit
(total = 11)
Worth of each UAV
Weapon Type Weapon Quantity Per Unit
Large Weapon 3 20 Seeker missile 16
Small Weapon 4 20 Seeker missile 6
Small Combo 4 20 Seeker missile 4
Table 4.3 Blue Team 1 assigned to Red Area 2
Red Unit (Red Area 2) # of Unit
(total=38)
Worth of
each unit
Weapon Type Weapon Quantity
Per Unit
Long Range SAM sites (2 sites) 8 10 long_sam_missile 4
Medium Range SAM sites(6 sites) 6 7.5 medium_sam_missile 8
Tanks 10 10 tank_projectile 50
SPARTY 4 10 artillery_proj-ectile 100
Personnel Carriers 5 10 small_arms 20
Communi- cation Vans 1 10 Surface-to-surface_missile 4
Mobile SAM sites 4 7.5 medium_sam_missile 8
In the experiment where ULTRA has access to battle damage information, and the corresponding controller is implemented in feedback form, the control choices for the first 4 steps are listed in Table 4.5. We also implemented these controls on the Boeing simulator. This time, as we can see in Table 4.5, the target assignment for the Blue units at the second step includes neutralizing only those tanks that are still alive in the battlefield. After the second round, and upon detecting that all the mobile SAM sites are destroyed, instead of predicting that only two of these are destroyed as was the case in the open-loop control, the Blue UAVs are now able to save their weapons to attack other important targets in the subsequent steps. Clearly, the feedback controller allows for more reasonable decisions made by the Blue control in the battlefield provided that it has accurate information about the current battle damage at each engagement step. Such information plays a key role in the ULTRA feedback controller being able to derive target assignments for the Blue force that actually make sense. For the purpose of comparison, snap shots of the final
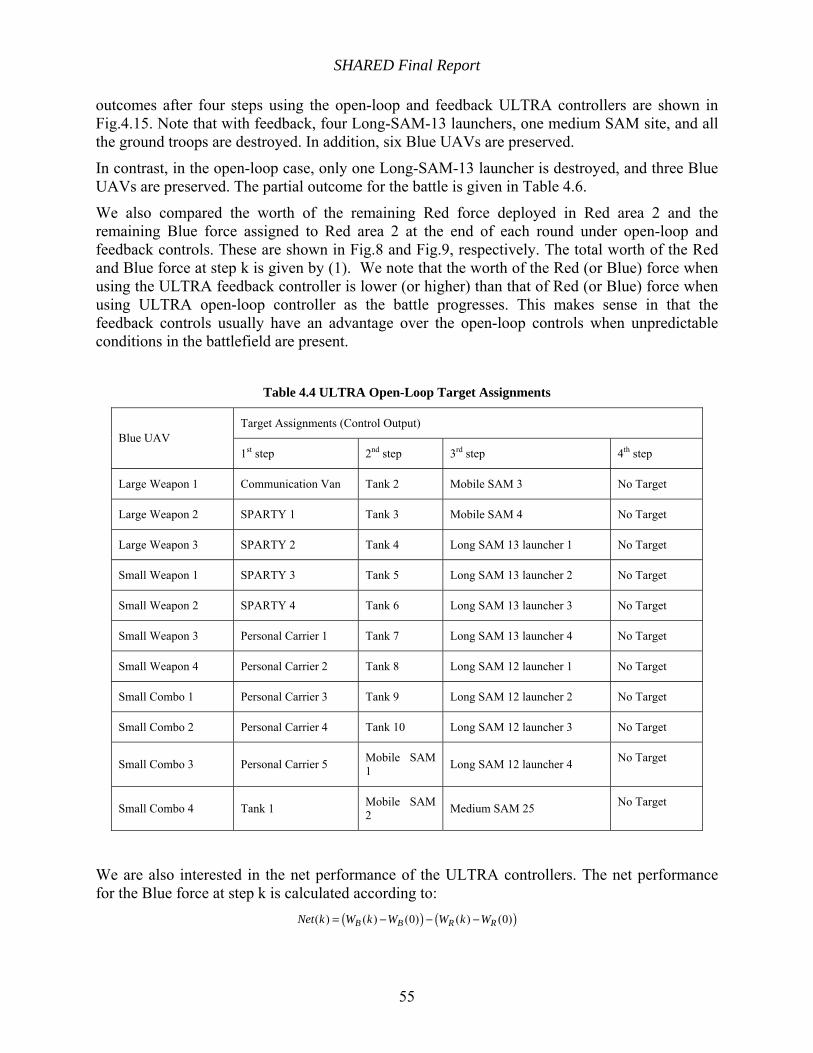
SHARED Final Report
55
outcomes after four steps using the open-loop and feedback ULTRA controllers are shown in Fig.4.15. Note that with feedback, four Long-SAM-13 launchers, one medium SAM site, and all the ground troops are destroyed. In addition, six Blue UAVs are preserved.
In contrast, in the open-loop case, only one Long-SAM-13 launcher is destroyed, and three Blue UAVs are preserved. The partial outcome for the battle is given in Table 4.6.
We also compared the worth of the remaining Red force deployed in Red area 2 and the remaining Blue force assigned to Red area 2 at the end of each round under open-loop and feedback controls. These are shown in Fig.8 and Fig.9, respectively. The total worth of the Red and Blue force at step k is given by (1). We note that the worth of the Red (or Blue) force when using the ULTRA feedback controller is lower (or higher) than that of Red (or Blue) force when using ULTRA open-loop controller as the battle progresses. This makes sense in that the feedback controls usually have an advantage over the open-loop controls when unpredictable conditions in the battlefield are present.
Table 4.4 ULTRA Open-Loop Target Assignments
Target Assignments (Control Output) Blue UAV
1st step 2nd step 3rd step 4th step
Large Weapon 1 Communication Van Tank 2 Mobile SAM 3 No Target
Large Weapon 2 SPARTY 1 Tank 3 Mobile SAM 4 No Target
Large Weapon 3 SPARTY 2 Tank 4 Long SAM 13 launcher 1 No Target
Small Weapon 1 SPARTY 3 Tank 5 Long SAM 13 launcher 2 No Target
Small Weapon 2 SPARTY 4 Tank 6 Long SAM 13 launcher 3 No Target
Small Weapon 3 Personal Carrier 1 Tank 7 Long SAM 13 launcher 4 No Target
Small Weapon 4 Personal Carrier 2 Tank 8 Long SAM 12 launcher 1 No Target
Small Combo 1 Personal Carrier 3 Tank 9 Long SAM 12 launcher 2 No Target
Small Combo 2 Personal Carrier 4 Tank 10 Long SAM 12 launcher 3 No Target
Small Combo 3 Personal Carrier 5 Mobile SAM 1 Long SAM 12 launcher 4 No Target
Small Combo 4 Tank 1 Mobile SAM 2 Medium SAM 25 No Target
We are also interested in the net performance of the ULTRA controllers. The net performance for the Blue force at step k is calculated according to:
( ) ( )( ) ( ) (0) ( ) (0)B B R RNet k W k W W k W= − − −
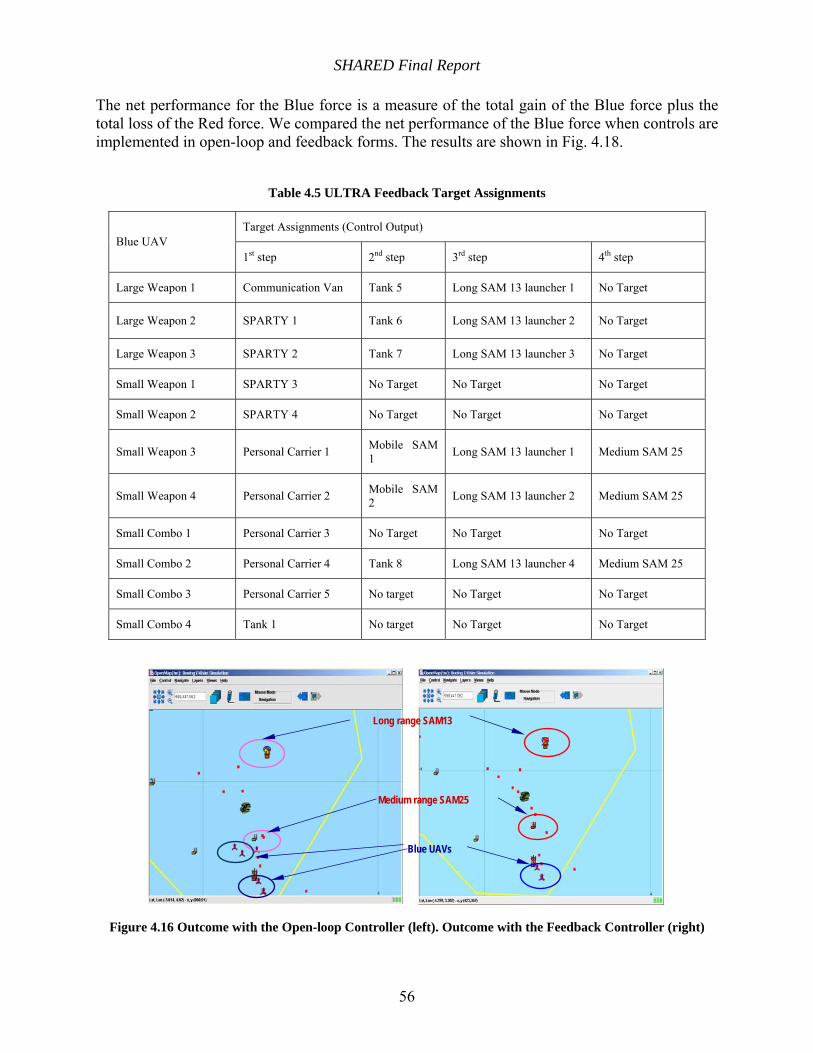
SHARED Final Report
56
The net performance for the Blue force is a measure of the total gain of the Blue force plus the total loss of the Red force. We compared the net performance of the Blue force when controls are implemented in open-loop and feedback forms. The results are shown in Fig. 4.18.
Table 4.5 ULTRA Feedback Target Assignments
Figure 4.16 Outcome with the Open-loop Controller (left). Outcome with the Feedback Controller (right)
Target Assignments (Control Output) Blue UAV
1st step 2nd step 3rd step 4th step
Large Weapon 1 Communication Van Tank 5 Long SAM 13 launcher 1 No Target
Large Weapon 2 SPARTY 1 Tank 6 Long SAM 13 launcher 2 No Target
Large Weapon 3 SPARTY 2 Tank 7 Long SAM 13 launcher 3 No Target
Small Weapon 1 SPARTY 3 No Target No Target No Target
Small Weapon 2 SPARTY 4 No Target No Target No Target
Small Weapon 3 Personal Carrier 1 Mobile SAM 1 Long SAM 13 launcher 1 Medium SAM 25
Small Weapon 4 Personal Carrier 2 Mobile SAM 2 Long SAM 13 launcher 2 Medium SAM 25
Small Combo 1 Personal Carrier 3 No Target No Target No Target
Small Combo 2 Personal Carrier 4 Tank 8 Long SAM 13 launcher 4 Medium SAM 25
Small Combo 3 Personal Carrier 5 No target No Target No Target
Small Combo 4 Tank 1 No target No Target No Target
Long range SAM13
Medium range SAM25
Blue UAVs
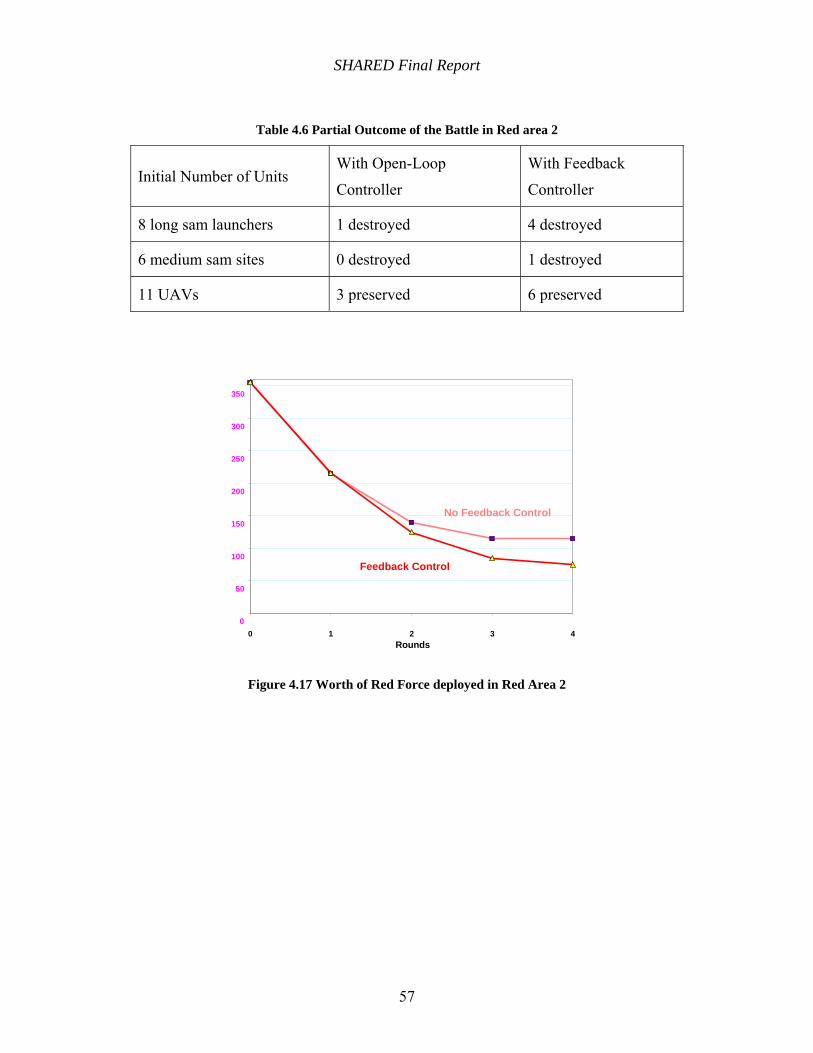
SHARED Final Report
57
Table 4.6 Partial Outcome of the Battle in Red area 2
Initial Number of Units With Open-Loop
Controller
With Feedback
Controller
8 long sam launchers 1 destroyed 4 destroyed
6 medium sam sites 0 destroyed 1 destroyed
11 UAVs 3 preserved 6 preserved
Figure 4.17 Worth of Red Force deployed in Red Area 2
Rounds
0
50
100
150
200
250
300
350
0 1 2 3 4
No Feedback Control
Feedback Control
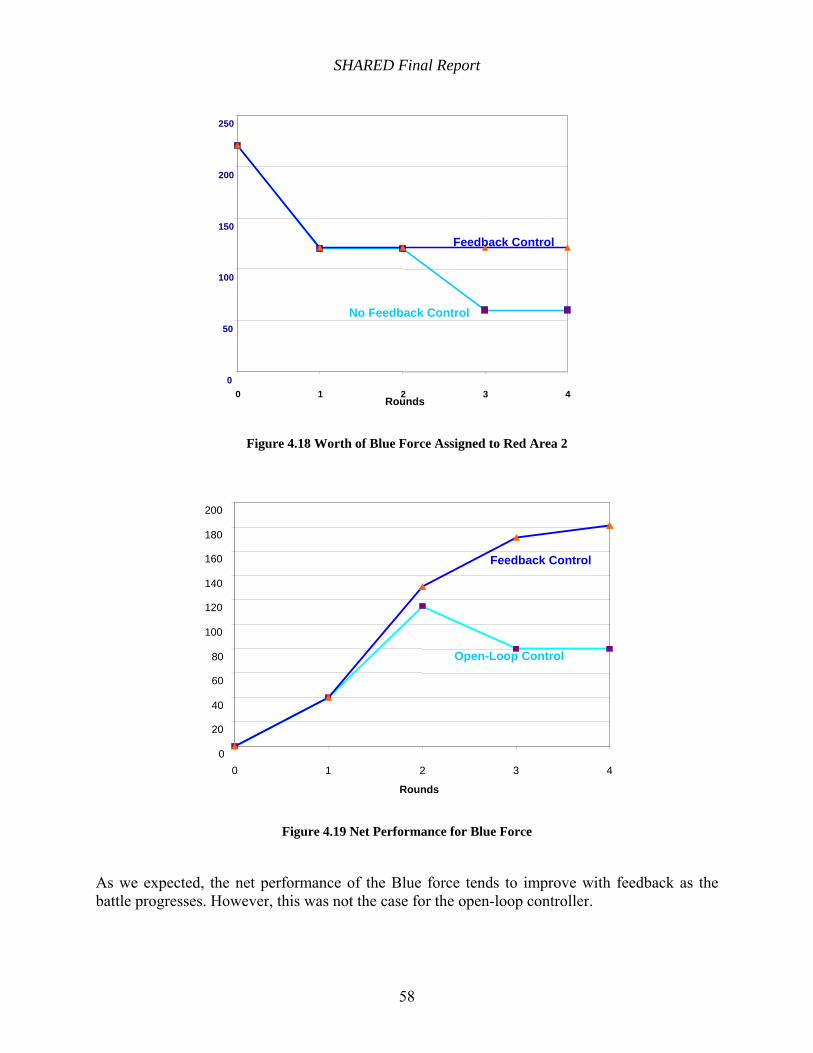
SHARED Final Report
58
Figure 4.18 Worth of Blue Force Assigned to Red Area 2
Figure 4.19 Net Performance for Blue Force
As we expected, the net performance of the Blue force tends to improve with feedback as the battle progresses. However, this was not the case for the open-loop controller.
0 20 40 60 80
100 120 140 160 180 200
0 1 2 3 4 Rounds
Feedback Control
Open-Loop Control
0
50
100
150
200
250
0 1 2 3 4Rounds
Feedback Control
No Feedback Control
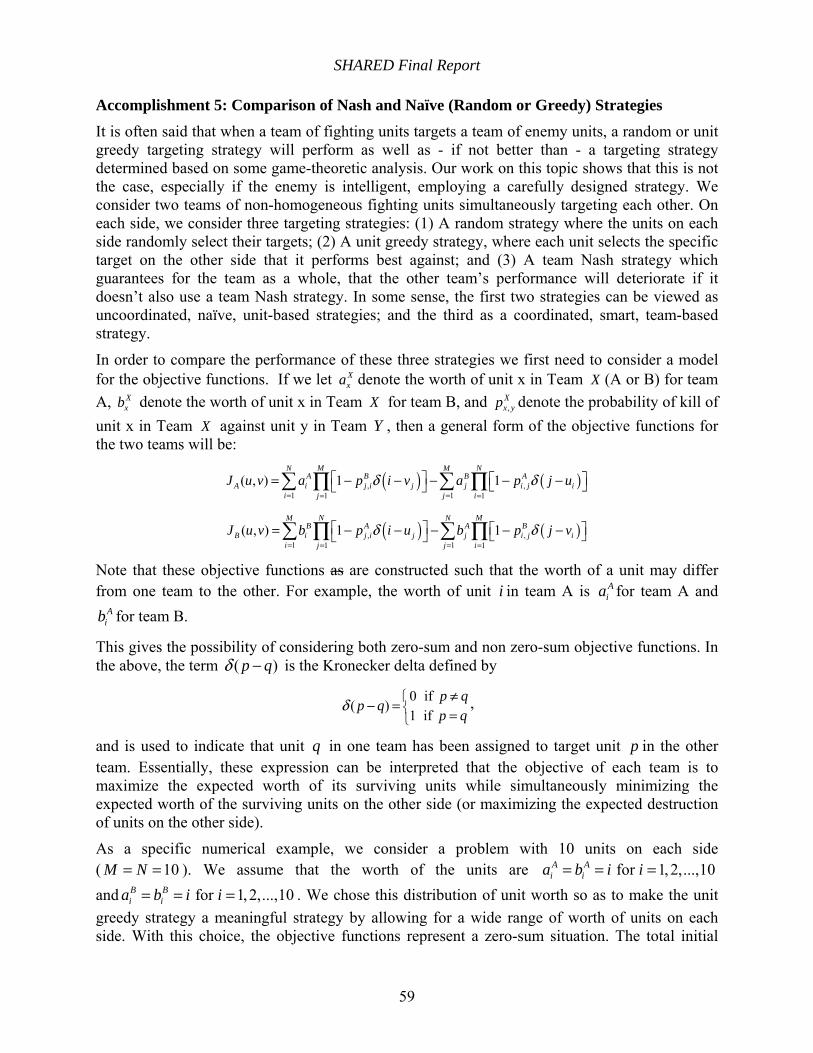
SHARED Final Report
59
Accomplishment 5: Comparison of Nash and Naïve (Random or Greedy) Strategies It is often said that when a team of fighting units targets a team of enemy units, a random or unit greedy targeting strategy will perform as well as - if not better than - a targeting strategy determined based on some game-theoretic analysis. Our work on this topic shows that this is not the case, especially if the enemy is intelligent, employing a carefully designed strategy. We consider two teams of non-homogeneous fighting units simultaneously targeting each other. On each side, we consider three targeting strategies: (1) A random strategy where the units on each side randomly select their targets; (2) A unit greedy strategy, where each unit selects the specific target on the other side that it performs best against; and (3) A team Nash strategy which guarantees for the team as a whole, that the other team’s performance will deteriorate if it doesn’t also use a team Nash strategy. In some sense, the first two strategies can be viewed as uncoordinated, naïve, unit-based strategies; and the third as a coordinated, smart, team-based strategy.
In order to compare the performance of these three strategies we first need to consider a model for the objective functions. If we let X
xa denote the worth of unit x in Team X (A or B) for team A, X
xb denote the worth of unit x in Team X for team B, and ,Xx yp denote the probability of kill of
unit x in Team X against unit y in Team Y , then a general form of the objective functions for the two teams will be:
( ) ( ), ,1 11 1
( , ) 1 1M NN M
A B B AA i j i j j i j i
i jj i
J u v a p i v a p j uδ δ= == =
⎡ ⎤ ⎡ ⎤= − − − − −⎣ ⎦⎣ ⎦∑ ∑∏ ∏
( ) ( ), ,1 11 1
( , ) 1 1N MM N
B A A BB i j i j j i j i
i jj i
J u v b p i u b p j vδ δ= == =
⎡ ⎤ ⎡ ⎤= − − − − −⎣ ⎦⎣ ⎦∑ ∑∏ ∏
Note that these objective functions as are constructed such that the worth of a unit may differ from one team to the other. For example, the worth of unit i in team A is A
ia for team A and A
ib for team B.
This gives the possibility of considering both zero-sum and non zero-sum objective functions. In the above, the term ( )p qδ − is the Kronecker delta defined by
0 if ( )
1 if p q
p qp q
δ ⎧⎨⎩
≠− =
=,
and is used to indicate that unit q in one team has been assigned to target unit p in the other team. Essentially, these expression can be interpreted that the objective of each team is to maximize the expected worth of its surviving units while simultaneously minimizing the expected worth of the surviving units on the other side (or maximizing the expected destruction of units on the other side).
As a specific numerical example, we consider a problem with 10 units on each side ( 10M N= = ). We assume that the worth of the units are for 1, 2,...,10A A
i ia b i i= = = and for 1, 2,...,10B B
i ia b i i= = = . We chose this distribution of unit worth so as to make the unit greedy strategy a meaningful strategy by allowing for a wide range of worth of units on each side. With this choice, the objective functions represent a zero-sum situation. The total initial
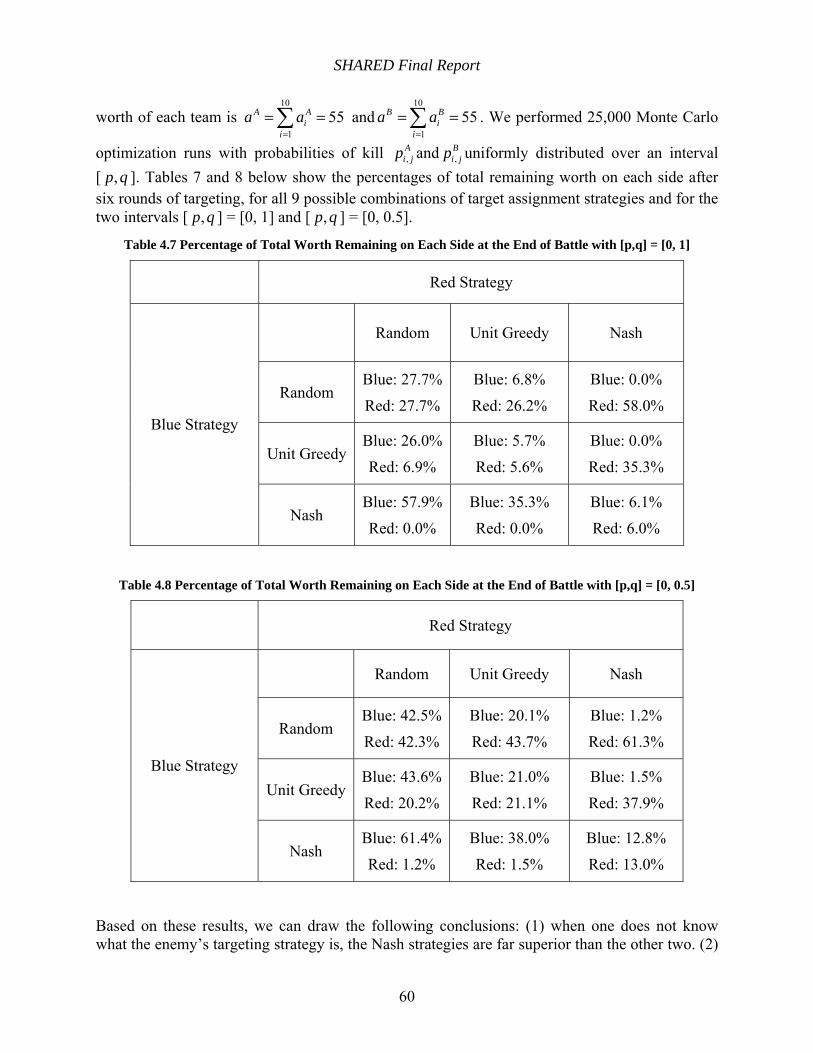
SHARED Final Report
60
worth of each team is 10
155A A
ii
a a=
= =∑ and10
155B B
ii
a a=
= =∑ . We performed 25,000 Monte Carlo
optimization runs with probabilities of kill ,Ai jp and ,
Bi jp uniformly distributed over an interval
[ ,p q ]. Tables 7 and 8 below show the percentages of total remaining worth on each side after six rounds of targeting, for all 9 possible combinations of target assignment strategies and for the two intervals [ ,p q ] = [0, 1] and [ ,p q ] = [0, 0.5].
Table 4.7 Percentage of Total Worth Remaining on Each Side at the End of Battle with [p,q] = [0, 1]
Red Strategy
Random Unit Greedy Nash
Random Blue: 27.7%
Red: 27.7%
Blue: 6.8%
Red: 26.2%
Blue: 0.0%
Red: 58.0%
Unit GreedyBlue: 26.0%
Red: 6.9%
Blue: 5.7%
Red: 5.6%
Blue: 0.0%
Red: 35.3%
Blue Strategy
Nash Blue: 57.9%
Red: 0.0%
Blue: 35.3%
Red: 0.0%
Blue: 6.1%
Red: 6.0%
Table 4.8 Percentage of Total Worth Remaining on Each Side at the End of Battle with [p,q] = [0, 0.5]
Red Strategy
Random Unit Greedy Nash
Random Blue: 42.5%
Red: 42.3%
Blue: 20.1%
Red: 43.7%
Blue: 1.2%
Red: 61.3%
Unit GreedyBlue: 43.6%
Red: 20.2%
Blue: 21.0%
Red: 21.1%
Blue: 1.5%
Red: 37.9%
Blue Strategy
Nash Blue: 61.4%
Red: 1.2%
Blue: 38.0%
Red: 1.5%
Blue: 12.8%
Red: 13.0%
Based on these results, we can draw the following conclusions: (1) when one does not know what the enemy’s targeting strategy is, the Nash strategies are far superior than the other two. (2)
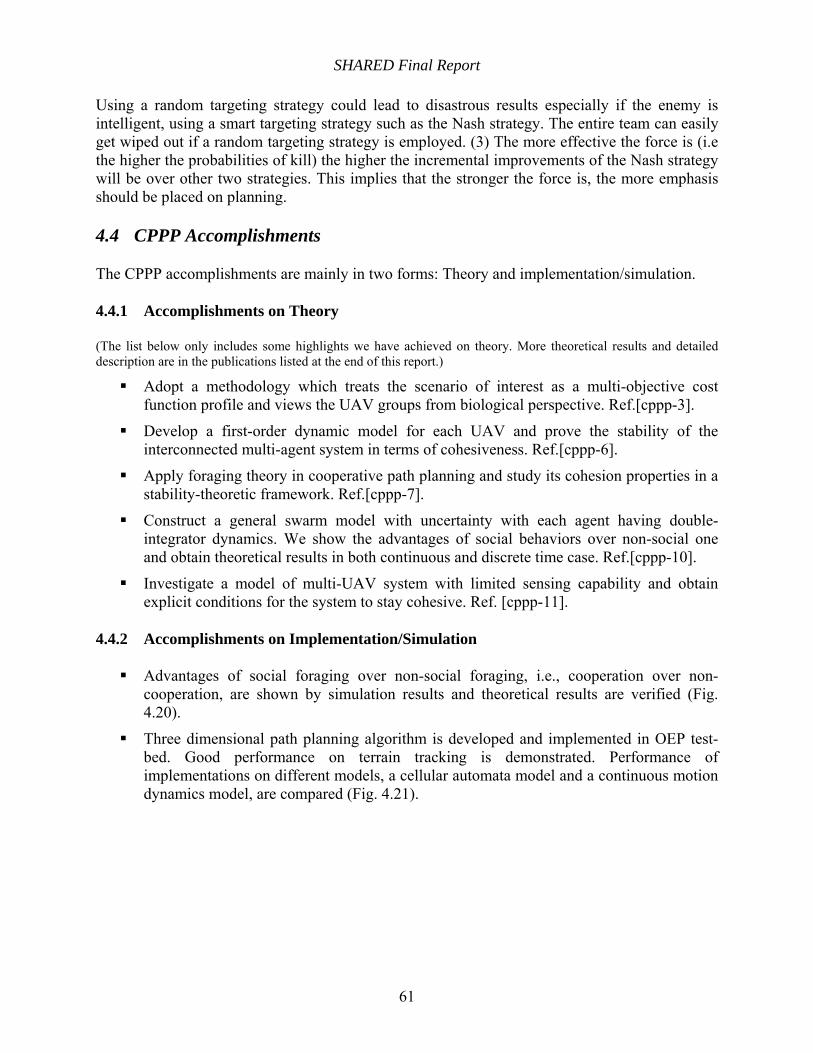
SHARED Final Report
61
Using a random targeting strategy could lead to disastrous results especially if the enemy is intelligent, using a smart targeting strategy such as the Nash strategy. The entire team can easily get wiped out if a random targeting strategy is employed. (3) The more effective the force is (i.e the higher the probabilities of kill) the higher the incremental improvements of the Nash strategy will be over other two strategies. This implies that the stronger the force is, the more emphasis should be placed on planning.
4.4 CPPP Accomplishments
The CPPP accomplishments are mainly in two forms: Theory and implementation/simulation.
4.4.1 Accomplishments on Theory
(The list below only includes some highlights we have achieved on theory. More theoretical results and detailed description are in the publications listed at the end of this report.)
Adopt a methodology which treats the scenario of interest as a multi-objective cost function profile and views the UAV groups from biological perspective. Ref.[cppp-3].
Develop a first-order dynamic model for each UAV and prove the stability of the interconnected multi-agent system in terms of cohesiveness. Ref.[cppp-6].
Apply foraging theory in cooperative path planning and study its cohesion properties in a stability-theoretic framework. Ref.[cppp-7].
Construct a general swarm model with uncertainty with each agent having double-integrator dynamics. We show the advantages of social behaviors over non-social one and obtain theoretical results in both continuous and discrete time case. Ref.[cppp-10].
Investigate a model of multi-UAV system with limited sensing capability and obtain explicit conditions for the system to stay cohesive. Ref. [cppp-11].
4.4.2 Accomplishments on Implementation/Simulation
Advantages of social foraging over non-social foraging, i.e., cooperation over non-cooperation, are shown by simulation results and theoretical results are verified (Fig. 4.20).
Three dimensional path planning algorithm is developed and implemented in OEP test-bed. Good performance on terrain tracking is demonstrated. Performance of implementations on different models, a cellular automata model and a continuous motion dynamics model, are compared (Fig. 4.21).

SHARED Final Report
62
Figure 4.20 Comparison of cooperation against Non-cooperation
Figure 4.21 3D Path Planning with Different Implementations Typical terrain tracking simulation results
from OEP Dynamic Model (upper) and Automata Model (lower). Desired altitude: 400m AGL
N=1 N=36
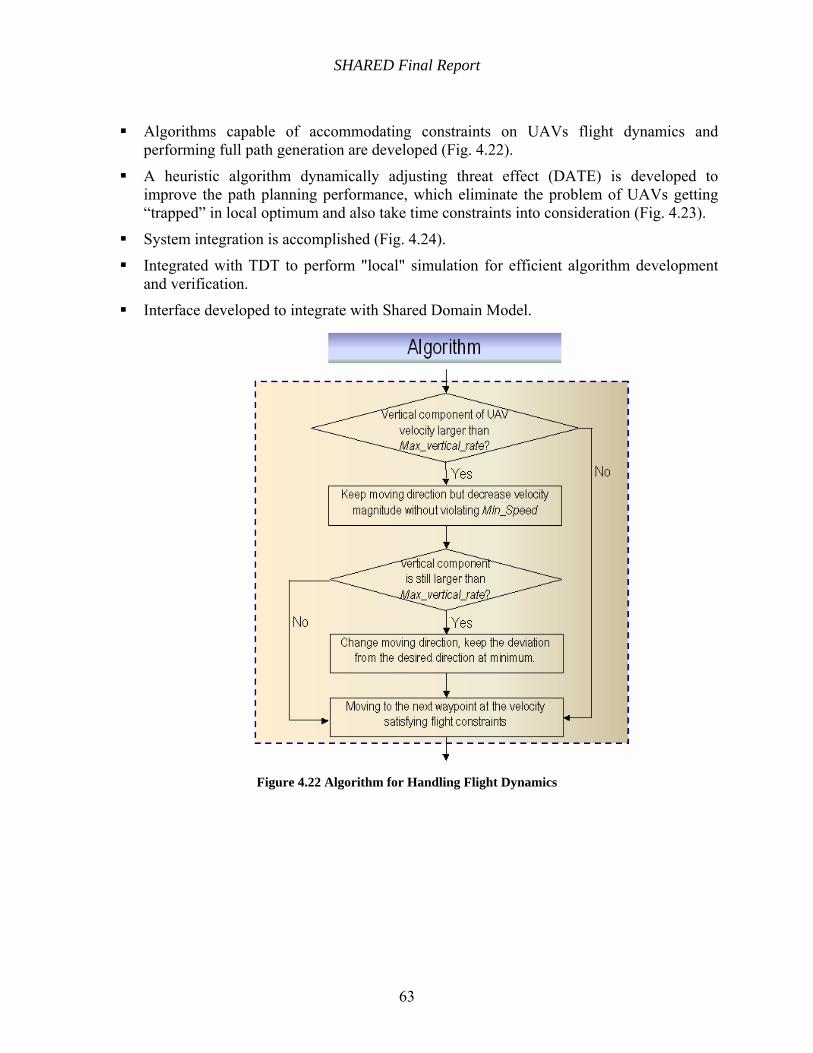
SHARED Final Report
63
Algorithms capable of accommodating constraints on UAVs flight dynamics and performing full path generation are developed (Fig. 4.22).
A heuristic algorithm dynamically adjusting threat effect (DATE) is developed to improve the path planning performance, which eliminate the problem of UAVs getting “trapped” in local optimum and also take time constraints into consideration (Fig. 4.23).
System integration is accomplished (Fig. 4.24).
Integrated with TDT to perform "local" simulation for efficient algorithm development and verification.
Interface developed to integrate with Shared Domain Model.
Figure 4.22 Algorithm for Handling Flight Dynamics
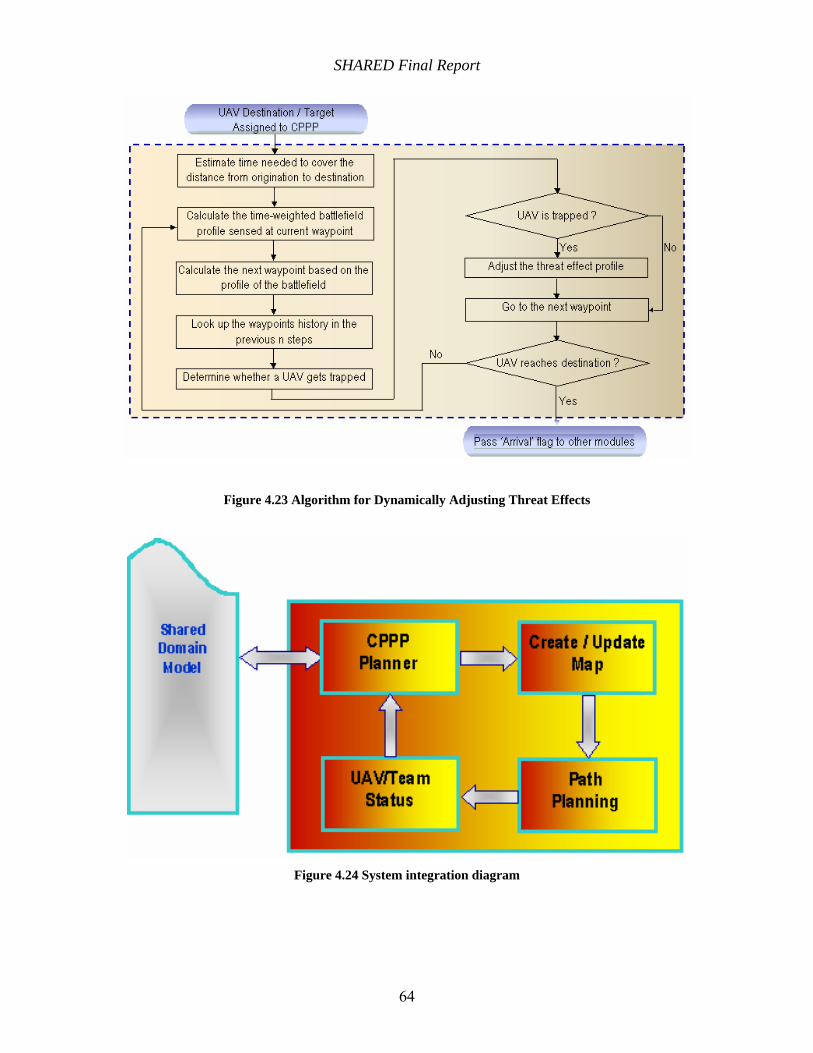
SHARED Final Report
64
Figure 4.23 Algorithm for Dynamically Adjusting Threat Effects
Figure 4.24 System integration diagram
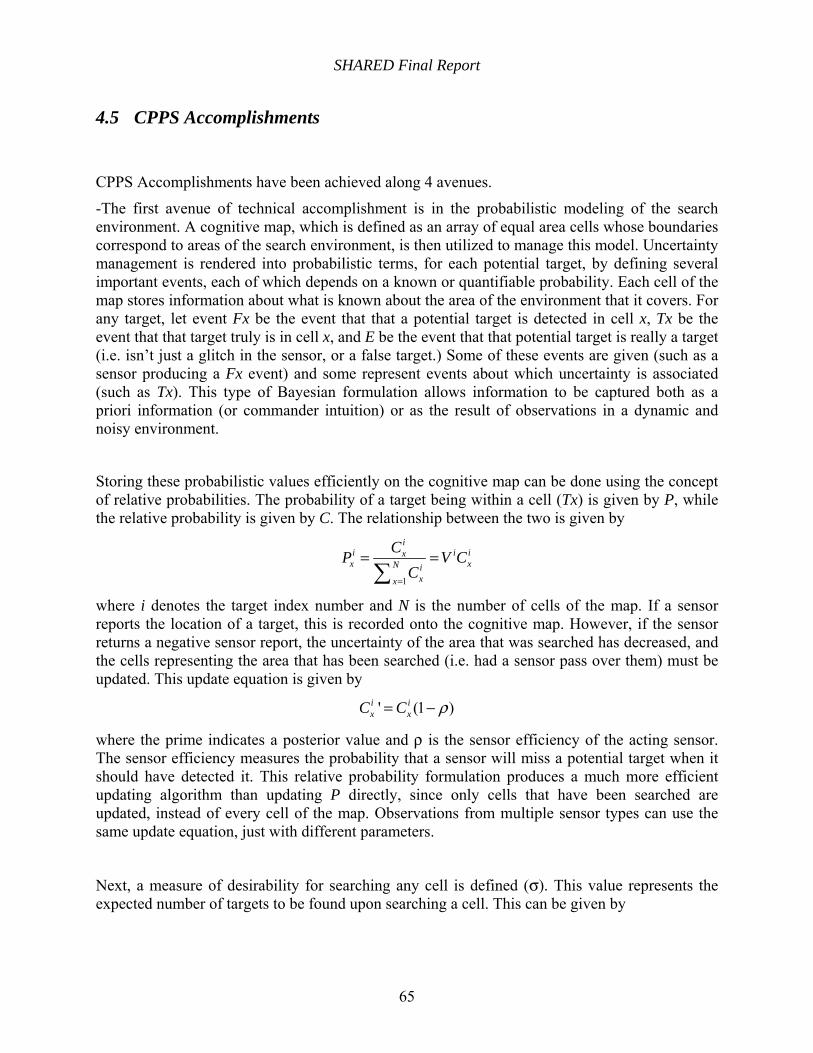
SHARED Final Report
65
4.5 CPPS Accomplishments
CPPS Accomplishments have been achieved along 4 avenues.
-The first avenue of technical accomplishment is in the probabilistic modeling of the search environment. A cognitive map, which is defined as an array of equal area cells whose boundaries correspond to areas of the search environment, is then utilized to manage this model. Uncertainty management is rendered into probabilistic terms, for each potential target, by defining several important events, each of which depends on a known or quantifiable probability. Each cell of the map stores information about what is known about the area of the environment that it covers. For any target, let event Fx be the event that that a potential target is detected in cell x, Tx be the event that that target truly is in cell x, and E be the event that that potential target is really a target (i.e. isn’t just a glitch in the sensor, or a false target.) Some of these events are given (such as a sensor producing a Fx event) and some represent events about which uncertainty is associated (such as Tx). This type of Bayesian formulation allows information to be captured both as a priori information (or commander intuition) or as the result of observations in a dynamic and noisy environment.
Storing these probabilistic values efficiently on the cognitive map can be done using the concept of relative probabilities. The probability of a target being within a cell (Tx) is given by P, while the relative probability is given by C. The relationship between the two is given by
1
ii i ix
x xN ixx
CP V CC
=
= =∑
where i denotes the target index number and N is the number of cells of the map. If a sensor reports the location of a target, this is recorded onto the cognitive map. However, if the sensor returns a negative sensor report, the uncertainty of the area that was searched has decreased, and the cells representing the area that has been searched (i.e. had a sensor pass over them) must be updated. This update equation is given by
' (1 )i ix xC C ρ= −
where the prime indicates a posterior value and ρ is the sensor efficiency of the acting sensor. The sensor efficiency measures the probability that a sensor will miss a potential target when it should have detected it. This relative probability formulation produces a much more efficient updating algorithm than updating P directly, since only cells that have been searched are updated, instead of every cell of the map. Observations from multiple sensor types can use the same update equation, just with different parameters.
Next, a measure of desirability for searching any cell is defined (σ). This value represents the expected number of targets to be found upon searching a cell. This can be given by
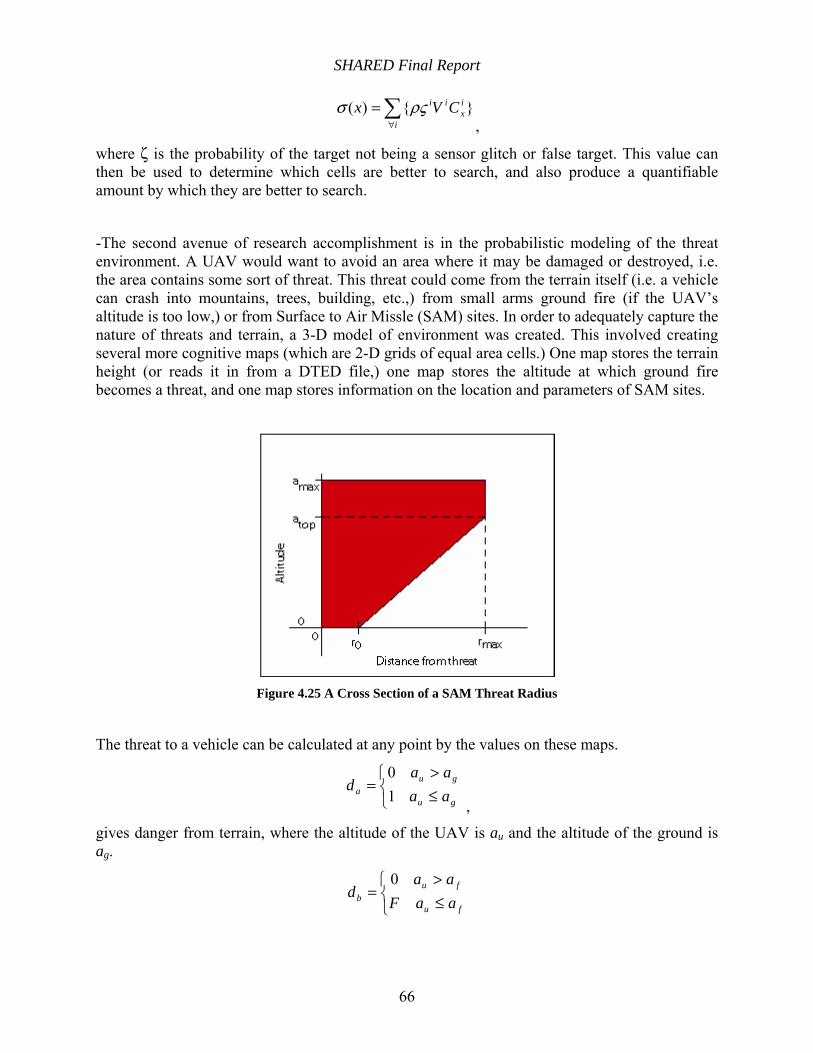
SHARED Final Report
66
∑∀
=i
ix
ii CVx }{)( ρςσ,
where ζ is the probability of the target not being a sensor glitch or false target. This value can then be used to determine which cells are better to search, and also produce a quantifiable amount by which they are better to search.
-The second avenue of research accomplishment is in the probabilistic modeling of the threat environment. A UAV would want to avoid an area where it may be damaged or destroyed, i.e. the area contains some sort of threat. This threat could come from the terrain itself (i.e. a vehicle can crash into mountains, trees, building, etc.,) from small arms ground fire (if the UAV’s altitude is too low,) or from Surface to Air Missle (SAM) sites. In order to adequately capture the nature of threats and terrain, a 3-D model of environment was created. This involved creating several more cognitive maps (which are 2-D grids of equal area cells.) One map stores the terrain height (or reads it in from a DTED file,) one map stores the altitude at which ground fire becomes a threat, and one map stores information on the location and parameters of SAM sites.
Figure 4.25 A Cross Section of a SAM Threat Radius
The threat to a vehicle can be calculated at any point by the values on these maps.
⎩⎨⎧
≤>
=gu
gua aa
aad
10
,
gives danger from terrain, where the altitude of the UAV is au and the altitude of the ground is ag.
⎩⎨⎧
≤>
=fu
fub aaF
aad
0
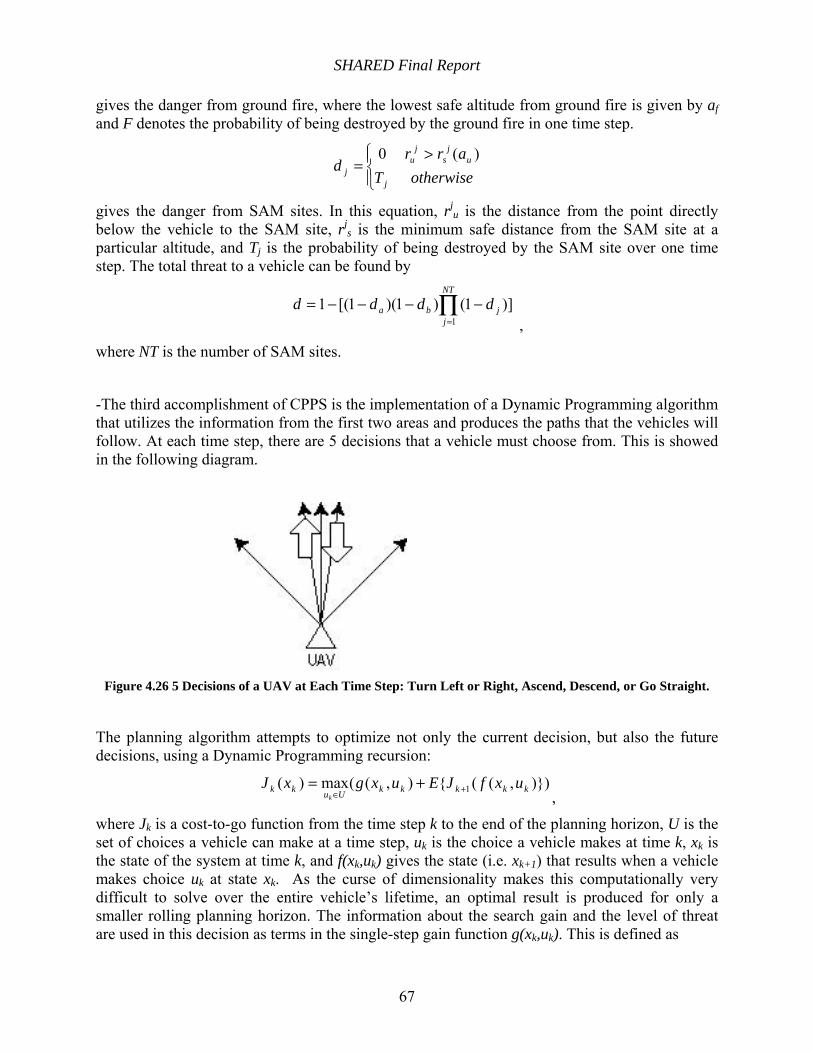
SHARED Final Report
67
gives the danger from ground fire, where the lowest safe altitude from ground fire is given by af and F denotes the probability of being destroyed by the ground fire in one time step.
⎪⎩
⎪⎨⎧ >
=otherwiseT
arrd
j
uj
sj
uj
)(0
gives the danger from SAM sites. In this equation, rj
u is the distance from the point directly below the vehicle to the SAM site, rj
s is the minimum safe distance from the SAM site at a particular altitude, and Tj is the probability of being destroyed by the SAM site over one time step. The total threat to a vehicle can be found by
])1()1)(1[(11
∏=
−−−−=NT
jjba dddd
,
where NT is the number of SAM sites.
-The third accomplishment of CPPS is the implementation of a Dynamic Programming algorithm that utilizes the information from the first two areas and produces the paths that the vehicles will follow. At each time step, there are 5 decisions that a vehicle must choose from. This is showed in the following diagram.
Figure 4.26 5 Decisions of a UAV at Each Time Step: Turn Left or Right, Ascend, Descend, or Go Straight.
The planning algorithm attempts to optimize not only the current decision, but also the future decisions, using a Dynamic Programming recursion:
)}),(({),((max)( 1 kkkkkUukk uxfJEuxgxJk
+∈+=
,
where Jk is a cost-to-go function from the time step k to the end of the planning horizon, U is the set of choices a vehicle can make at a time step, uk is the choice a vehicle makes at time k, xk is the state of the system at time k, and f(xk,uk) gives the state (i.e. xk+1) that results when a vehicle makes choice uk at state xk. As the curse of dimensionality makes this computationally very difficult to solve over the entire vehicle’s lifetime, an optimal result is produced for only a smaller rolling planning horizon. The information about the search gain and the level of threat are used in this decision as terms in the single-step gain function g(xk,uk). This is defined as
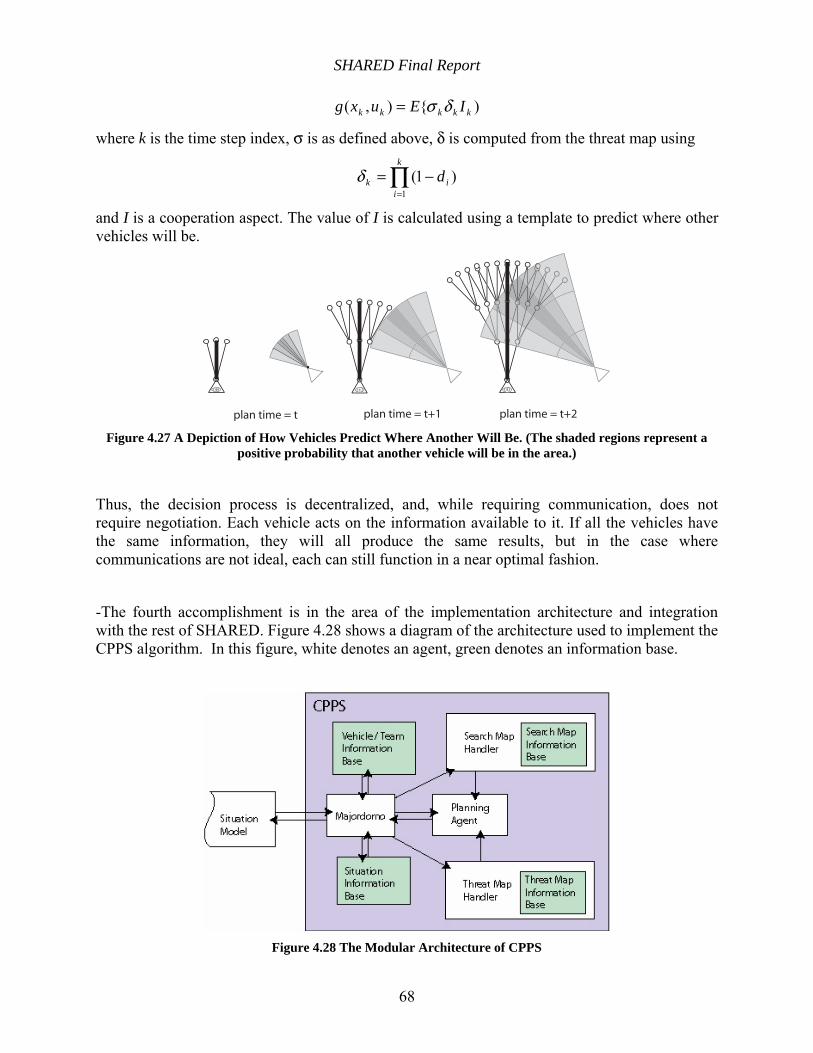
SHARED Final Report
68
){),( kkkkk IEuxg δσ= where k is the time step index, σ is as defined above, δ is computed from the threat map using
∏=
−=k
iik d
1
)1(δ
and I is a cooperation aspect. The value of I is calculated using a template to predict where other vehicles will be.
plan time = t plan time = t+1 plan time = t+2 Figure 4.27 A Depiction of How Vehicles Predict Where Another Will Be. (The shaded regions represent a
positive probability that another vehicle will be in the area.)
Thus, the decision process is decentralized, and, while requiring communication, does not require negotiation. Each vehicle acts on the information available to it. If all the vehicles have the same information, they will all produce the same results, but in the case where communications are not ideal, each can still function in a near optimal fashion.
-The fourth accomplishment is in the area of the implementation architecture and integration with the rest of SHARED. Figure 4.28 shows a diagram of the architecture used to implement the CPPS algorithm. In this figure, white denotes an agent, green denotes an information base.
Figure 4.28 The Modular Architecture of CPPS
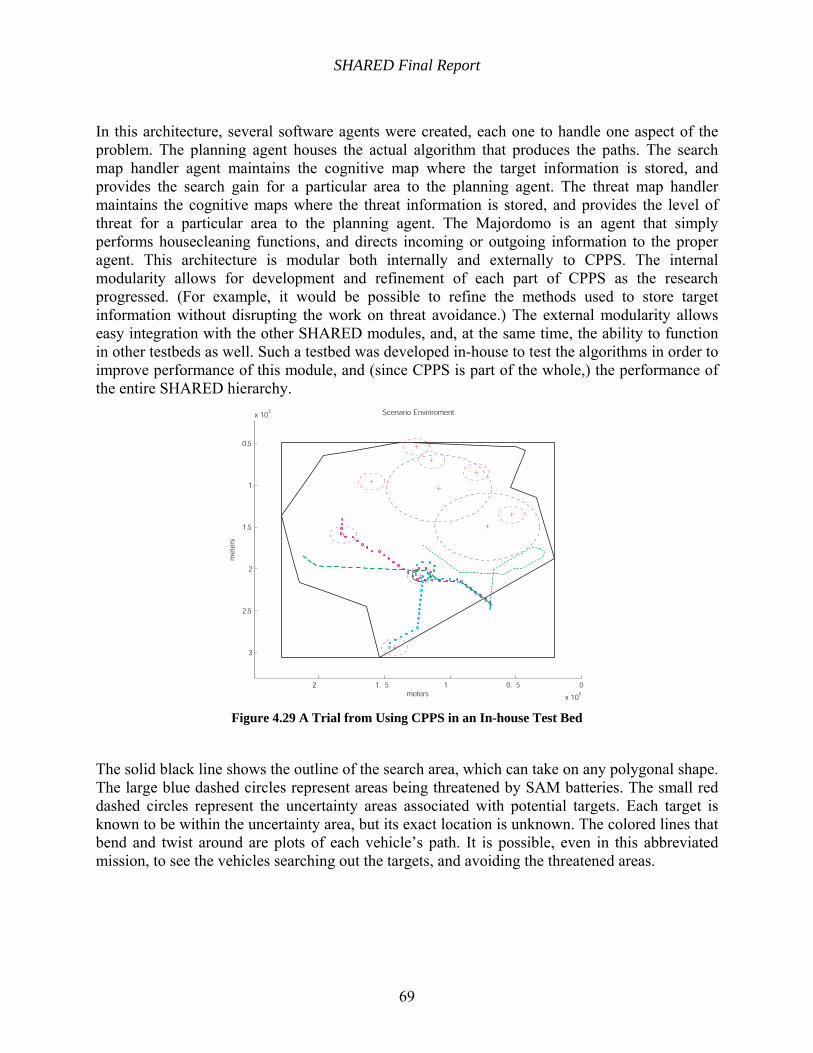
SHARED Final Report
69
In this architecture, several software agents were created, each one to handle one aspect of the problem. The planning agent houses the actual algorithm that produces the paths. The search map handler agent maintains the cognitive map where the target information is stored, and provides the search gain for a particular area to the planning agent. The threat map handler maintains the cognitive maps where the threat information is stored, and provides the level of threat for a particular area to the planning agent. The Majordomo is an agent that simply performs housecleaning functions, and directs incoming or outgoing information to the proper agent. This architecture is modular both internally and externally to CPPS. The internal modularity allows for development and refinement of each part of CPPS as the research progressed. (For example, it would be possible to refine the methods used to store target information without disrupting the work on threat avoidance.) The external modularity allows easy integration with the other SHARED modules, and, at the same time, the ability to function in other testbeds as well. Such a testbed was developed in-house to test the algorithms in order to improve performance of this module, and (since CPPS is part of the whole,) the performance of the entire SHARED hierarchy.
2 1. 5 1 0. 5 0
x 105
3
2.5
2
1.5
1
0.5
x 105
meters
met
ers
Scenario Envinroment
Figure 4.29 A Trial from Using CPPS in an In-house Test Bed
The solid black line shows the outline of the search area, which can take on any polygonal shape. The large blue dashed circles represent areas being threatened by SAM batteries. The small red dashed circles represent the uncertainty areas associated with potential targets. Each target is known to be within the uncertainty area, but its exact location is unknown. The colored lines that bend and twist around are plots of each vehicle’s path. It is possible, even in this abbreviated mission, to see the vehicles searching out the targets, and avoiding the threatened areas.
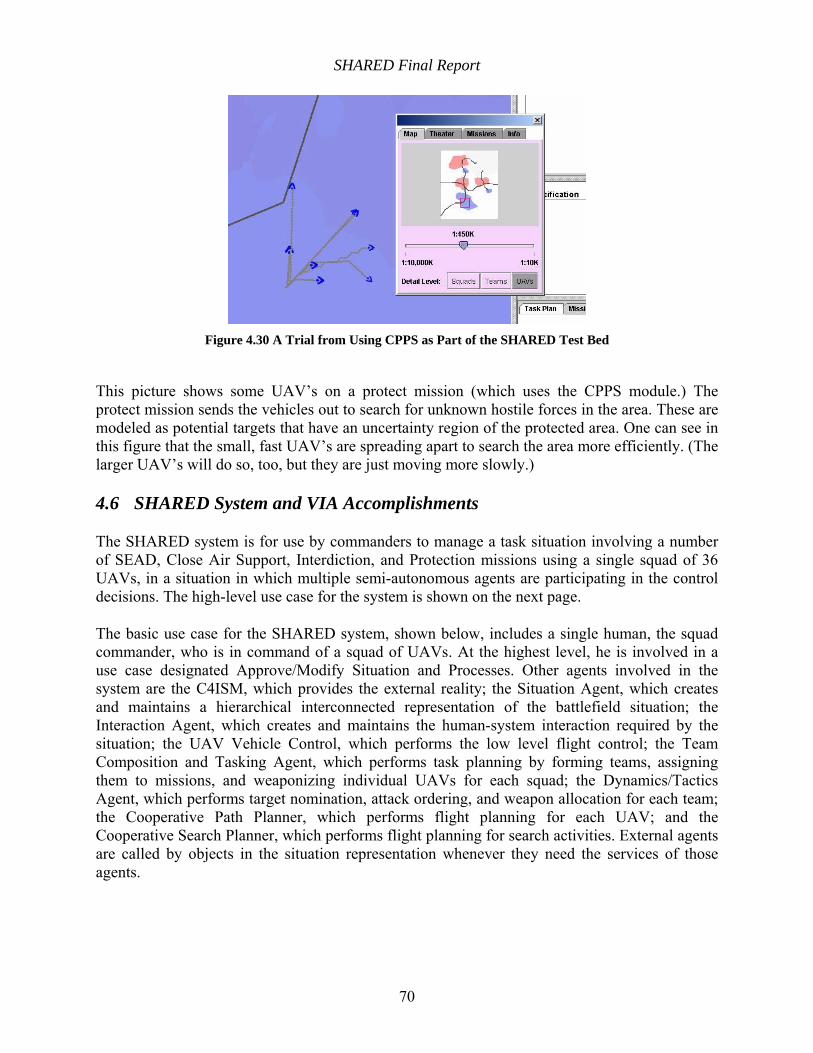
SHARED Final Report
70
Figure 4.30 A Trial from Using CPPS as Part of the SHARED Test Bed
This picture shows some UAV’s on a protect mission (which uses the CPPS module.) The protect mission sends the vehicles out to search for unknown hostile forces in the area. These are modeled as potential targets that have an uncertainty region of the protected area. One can see in this figure that the small, fast UAV’s are spreading apart to search the area more efficiently. (The larger UAV’s will do so, too, but they are just moving more slowly.)
4.6 SHARED System and VIA Accomplishments
The SHARED system is for use by commanders to manage a task situation involving a number of SEAD, Close Air Support, Interdiction, and Protection missions using a single squad of 36 UAVs, in a situation in which multiple semi-autonomous agents are participating in the control decisions. The high-level use case for the system is shown on the next page.
The basic use case for the SHARED system, shown below, includes a single human, the squad commander, who is in command of a squad of UAVs. At the highest level, he is involved in a use case designated Approve/Modify Situation and Processes. Other agents involved in the system are the C4ISM, which provides the external reality; the Situation Agent, which creates and maintains a hierarchical interconnected representation of the battlefield situation; the Interaction Agent, which creates and maintains the human-system interaction required by the situation; the UAV Vehicle Control, which performs the low level flight control; the Team Composition and Tasking Agent, which performs task planning by forming teams, assigning them to missions, and weaponizing individual UAVs for each squad; the Dynamics/Tactics Agent, which performs target nomination, attack ordering, and weapon allocation for each team; the Cooperative Path Planner, which performs flight planning for each UAV; and the Cooperative Search Planner, which performs flight planning for search activities. External agents are called by objects in the situation representation whenever they need the services of those agents.
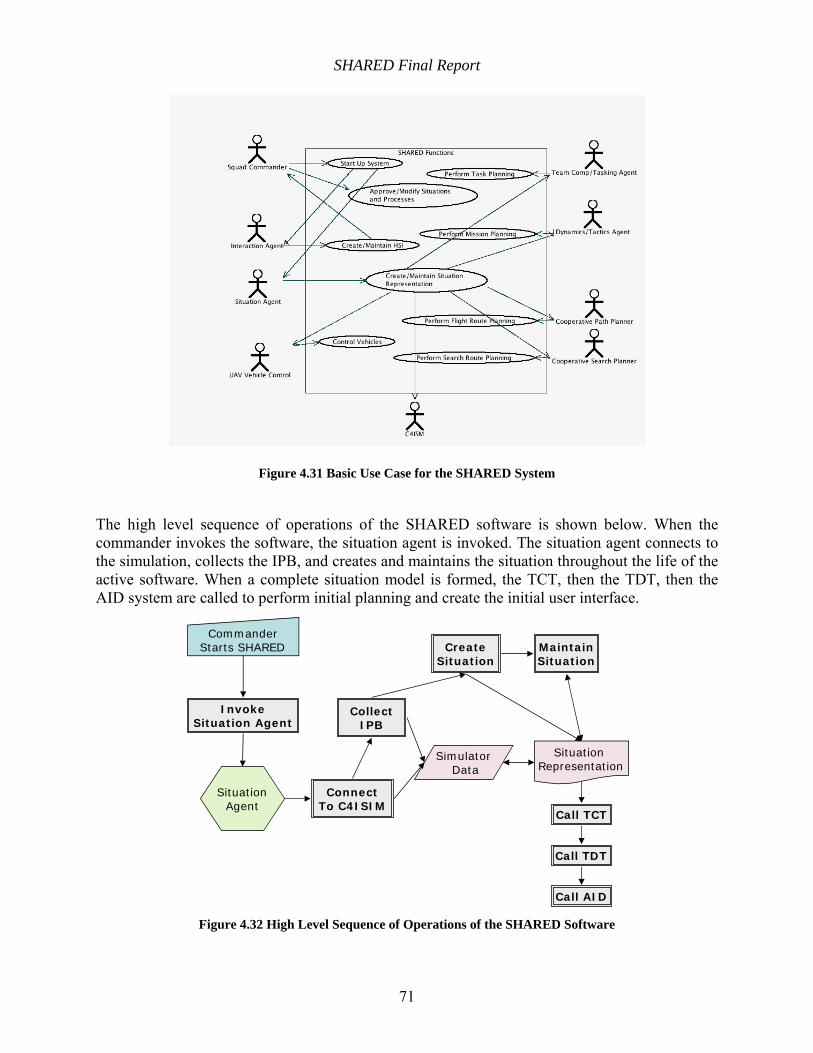
SHARED Final Report
71
Figure 4.31 Basic Use Case for the SHARED System
The high level sequence of operations of the SHARED software is shown below. When the commander invokes the software, the situation agent is invoked. The situation agent connects to the simulation, collects the IPB, and creates and maintains the situation throughout the life of the active software. When a complete situation model is formed, the TCT, then the TDT, then the AID system are called to perform initial planning and create the initial user interface.
CommanderStarts SHARED
ConnectTo C4ISIM
Simulator Data
Situation Representation
CreateSituation
CollectIPB
Call TCT
Call TDT
Call AID
MaintainSituation
InvokeSituation Agent
SituationAgent
Figure 4.32 High Level Sequence of Operations of the SHARED Software
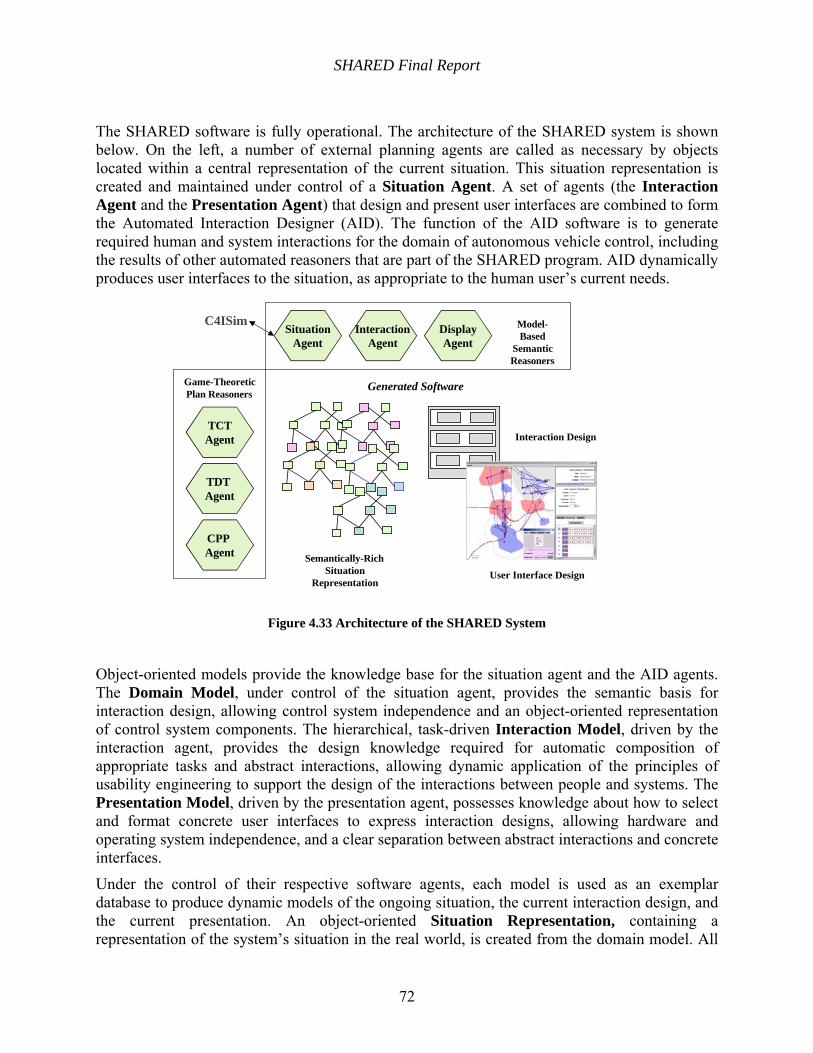
SHARED Final Report
72
The SHARED software is fully operational. The architecture of the SHARED system is shown below. On the left, a number of external planning agents are called as necessary by objects located within a central representation of the current situation. This situation representation is created and maintained under control of a Situation Agent. A set of agents (the Interaction Agent and the Presentation Agent) that design and present user interfaces are combined to form the Automated Interaction Designer (AID). The function of the AID software is to generate required human and system interactions for the domain of autonomous vehicle control, including the results of other automated reasoners that are part of the SHARED program. AID dynamically produces user interfaces to the situation, as appropriate to the human user’s current needs.
Figure 4.33 Architecture of the SHARED System
Object-oriented models provide the knowledge base for the situation agent and the AID agents. The Domain Model, under control of the situation agent, provides the semantic basis for interaction design, allowing control system independence and an object-oriented representation of control system components. The hierarchical, task-driven Interaction Model, driven by the interaction agent, provides the design knowledge required for automatic composition of appropriate tasks and abstract interactions, allowing dynamic application of the principles of usability engineering to support the design of the interactions between people and systems. The Presentation Model, driven by the presentation agent, possesses knowledge about how to select and format concrete user interfaces to express interaction designs, allowing hardware and operating system independence, and a clear separation between abstract interactions and concrete interfaces.
Under the control of their respective software agents, each model is used as an exemplar database to produce dynamic models of the ongoing situation, the current interaction design, and the current presentation. An object-oriented Situation Representation, containing a representation of the system’s situation in the real world, is created from the domain model. All
Semantically-RichSituation
Representation
TCTAgent
C4ISim
CPP Agent
Generated Software
TDT Agent
Game-TheoreticPlan Reasoners
Model-Based
SemanticReasoners
SituationAgent
DisplayAgent
InteractionAgent
Interaction Design
User Interface Design
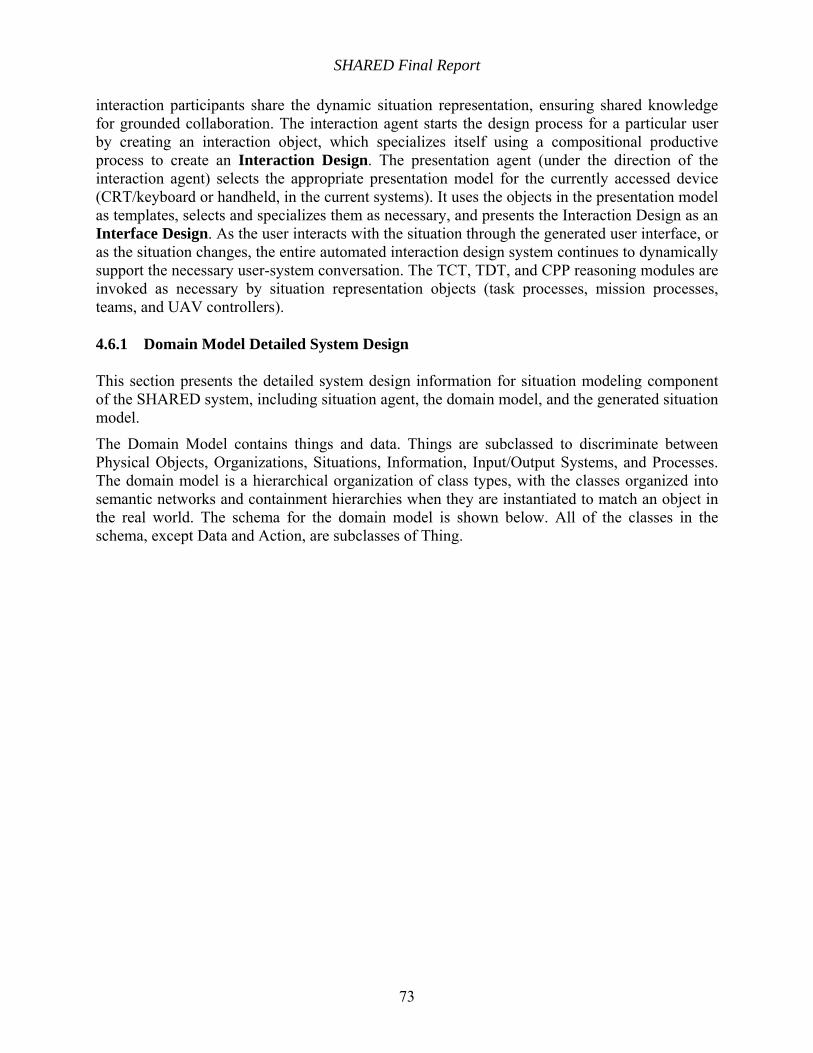
SHARED Final Report
73
interaction participants share the dynamic situation representation, ensuring shared knowledge for grounded collaboration. The interaction agent starts the design process for a particular user by creating an interaction object, which specializes itself using a compositional productive process to create an Interaction Design. The presentation agent (under the direction of the interaction agent) selects the appropriate presentation model for the currently accessed device (CRT/keyboard or handheld, in the current systems). It uses the objects in the presentation model as templates, selects and specializes them as necessary, and presents the Interaction Design as an Interface Design. As the user interacts with the situation through the generated user interface, or as the situation changes, the entire automated interaction design system continues to dynamically support the necessary user-system conversation. The TCT, TDT, and CPP reasoning modules are invoked as necessary by situation representation objects (task processes, mission processes, teams, and UAV controllers).
4.6.1 Domain Model Detailed System Design
This section presents the detailed system design information for situation modeling component of the SHARED system, including situation agent, the domain model, and the generated situation model.
The Domain Model contains things and data. Things are subclassed to discriminate between Physical Objects, Organizations, Situations, Information, Input/Output Systems, and Processes. The domain model is a hierarchical organization of class types, with the classes organized into semantic networks and containment hierarchies when they are instantiated to match an object in the real world. The schema for the domain model is shown below. All of the classes in the schema, except Data and Action, are subclasses of Thing.
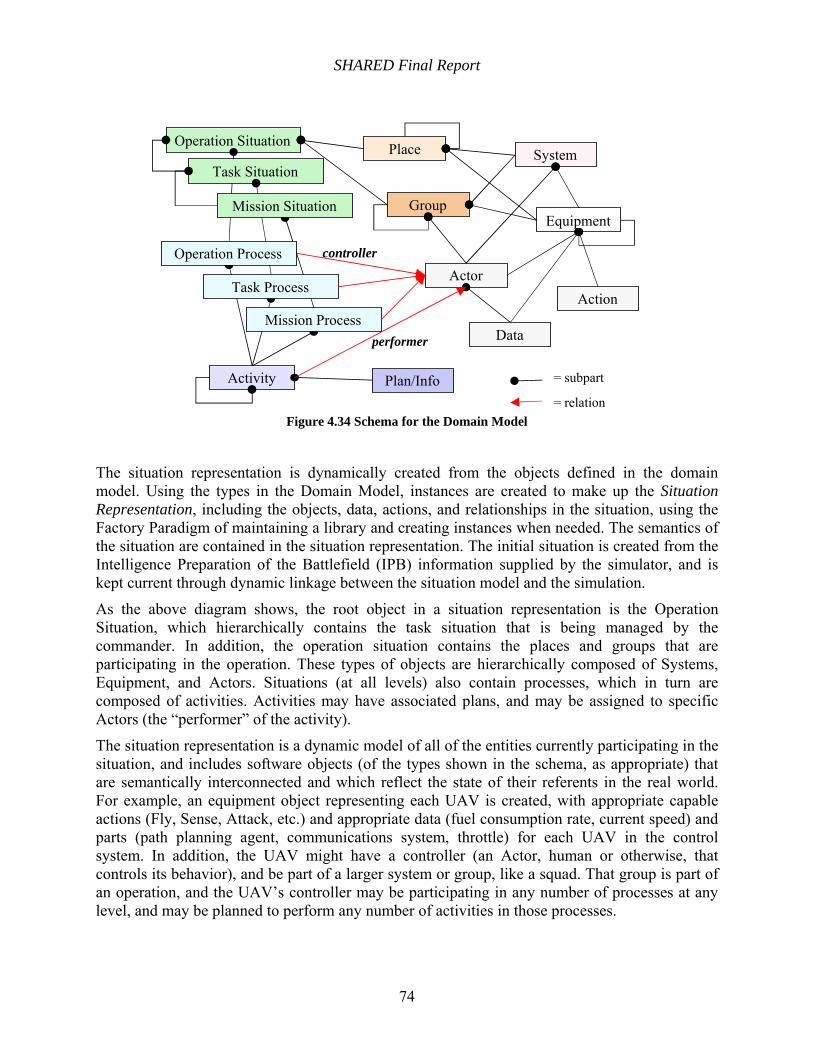
SHARED Final Report
74
Figure 4.34 Schema for the Domain Model
The situation representation is dynamically created from the objects defined in the domain model. Using the types in the Domain Model, instances are created to make up the Situation Representation, including the objects, data, actions, and relationships in the situation, using the Factory Paradigm of maintaining a library and creating instances when needed. The semantics of the situation are contained in the situation representation. The initial situation is created from the Intelligence Preparation of the Battlefield (IPB) information supplied by the simulator, and is kept current through dynamic linkage between the situation model and the simulation.
As the above diagram shows, the root object in a situation representation is the Operation Situation, which hierarchically contains the task situation that is being managed by the commander. In addition, the operation situation contains the places and groups that are participating in the operation. These types of objects are hierarchically composed of Systems, Equipment, and Actors. Situations (at all levels) also contain processes, which in turn are composed of activities. Activities may have associated plans, and may be assigned to specific Actors (the “performer” of the activity).
The situation representation is a dynamic model of all of the entities currently participating in the situation, and includes software objects (of the types shown in the schema, as appropriate) that are semantically interconnected and which reflect the state of their referents in the real world. For example, an equipment object representing each UAV is created, with appropriate capable actions (Fly, Sense, Attack, etc.) and appropriate data (fuel consumption rate, current speed) and parts (path planning agent, communications system, throttle) for each UAV in the control system. In addition, the UAV might have a controller (an Actor, human or otherwise, that controls its behavior), and be part of a larger system or group, like a squad. That group is part of an operation, and the UAV’s controller may be participating in any number of processes at any level, and may be planned to perform any number of activities in those processes.
Operation Situation
Activity
Place
Equipment
System
Group
Actor
Plan/Info
Data
Action
= subpart
= relation
performer
controller
Task Situation
Operation Process
Mission Situation
Task Process
Mission Process

SHARED Final Report
75
When the SHARED application is invoked, it creates a Situation Representation by calling the OperationSituation. The operation initiates a connection to the simulator (Sim), reading information that allows it to create a theater, blue forces, and a default mission with the necessary Task and Mission Situations and Processes in the situation model.
Roads are currently the only hardcoded information used in the system. The information available from the Boeing simulator is used to create the Molian boundaries, Northern Neighbor boundaries, Blue Government and its controlled areas, an AirWing with a Squad with 36 UAVs, a human squad commander, and Molian Rebels and their controlled areas, with any known components. In addition, some unit type information is acquired from the simulator, and used to set the default values of some domain classes’ data values. The information acquired from the simulator is summarized in the following table:
Table 4.9 Information Acquired from the Simulator
Sim Type Name Domain Classes Domain Properties
PlatformType LargeUAV SmallUAV WideBodyISR Tanker
myMinimumSpeed myMaximumSpeed myWeaponCarryCapacity myMeanTimeToRepair myMaximumVerticalRate
DefensiveType AAGuns ShortSAM MediumSAM LongSAMLauncher
myReactionTime myRadarRange myReloadTime
WeaponType GPSBomb SubMunitions SeekerMissile AntiRadiatiomMissile
myMaximumRange myWeaponSpeed myCEP myCarryCapacityUsed
The current version of the SHARED system supports a single operation situation containing a single task situation. Task Situations contain the entire picture of the battlespace as it involves a squad of UAVs. Task situations may contain a number of mission situations involving teams in that squad. Mission Situations are defined for SEAD, Close Air Support, Interdiction, and Defend Blue (Offensive Counter Air is not included at this time).
An example of the composition of the top layer of a situation representation, expressed as an operation situation, is shown below.
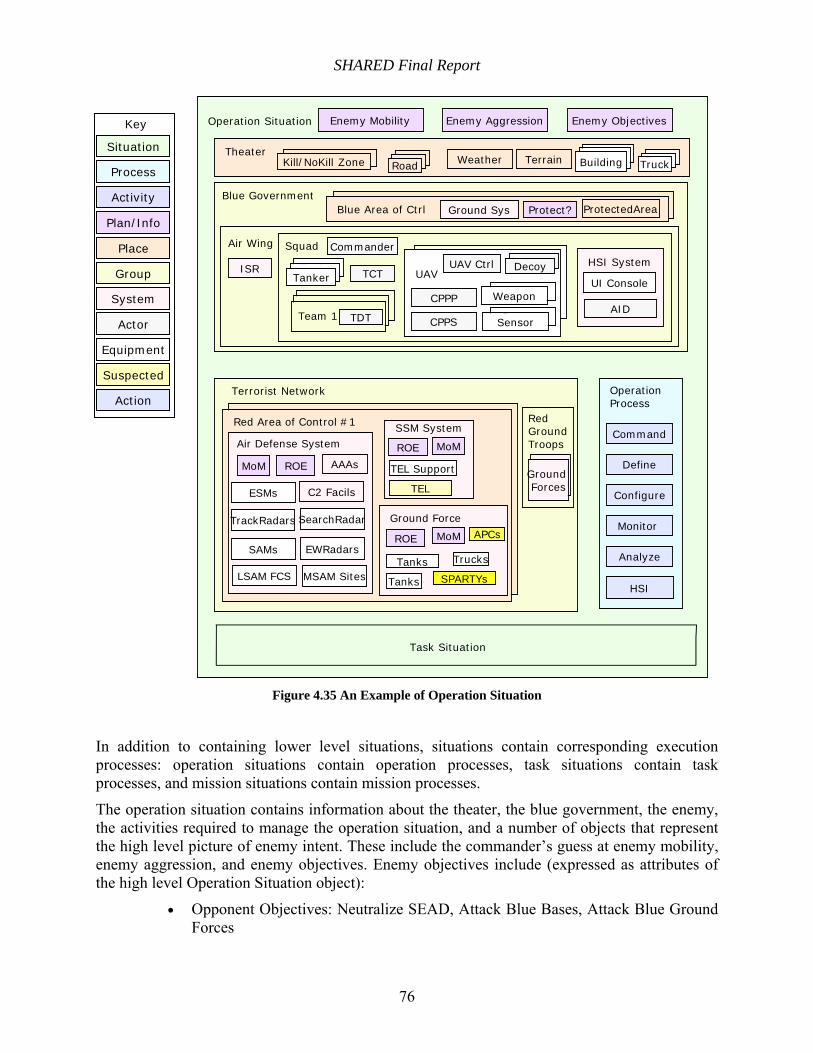
SHARED Final Report
76
Situation
Process
Activity
Place
Equipment
System
Group
Actor
Plan/Info
Key
Suspected
Action
Theater
Red Area of Control #1
Blue Area of Ctrl
Operation Situation
Task Situation
Enemy Mobility
Kill/NoKill Zone RoadRoadRoadBuilding RoadRoadTruck
Red Area of Control #1 Red Ground Troops
Terrorist Network
Ground Forces
SSM System
TEL
TEL Support
Ground Force
Trucks
SPARTYs
Tanks
Tanks
ROE
Air Defense System
SearchRadarTrackRadars
SAMs
LSAM FCS MSAM Sites
C2 FacilsESMs
EWRadars
Blue Government
Air Wing Squad
ISR TCT
Blue Area of Ctrl
CommanderHSI System
AID
UI Console
TDTTeam 1
Ground Sys
UAV
CPPP
UAV Ctrl
WeaponWeapon
SensorsSensor
Enemy Aggression Enemy Objectives
Weather Terrain
Operation Process
HSI
Command
Monitor
Define
Analyze
Configure
MoM
ROE MoM
ROE MoM
Protect?
Tanker
BuildingBuilding
ProtectedArea
TankerTanker
CPPS
DecoyDecoy
AAAs
APCs
Ground Forces
Figure 4.35 An Example of Operation Situation
In addition to containing lower level situations, situations contain corresponding execution processes: operation situations contain operation processes, task situations contain task processes, and mission situations contain mission processes.
The operation situation contains information about the theater, the blue government, the enemy, the activities required to manage the operation situation, and a number of objects that represent the high level picture of enemy intent. These include the commander’s guess at enemy mobility, enemy aggression, and enemy objectives. Enemy objectives include (expressed as attributes of the high level Operation Situation object):
• Opponent Objectives: Neutralize SEAD, Attack Blue Bases, Attack Blue Ground Forces
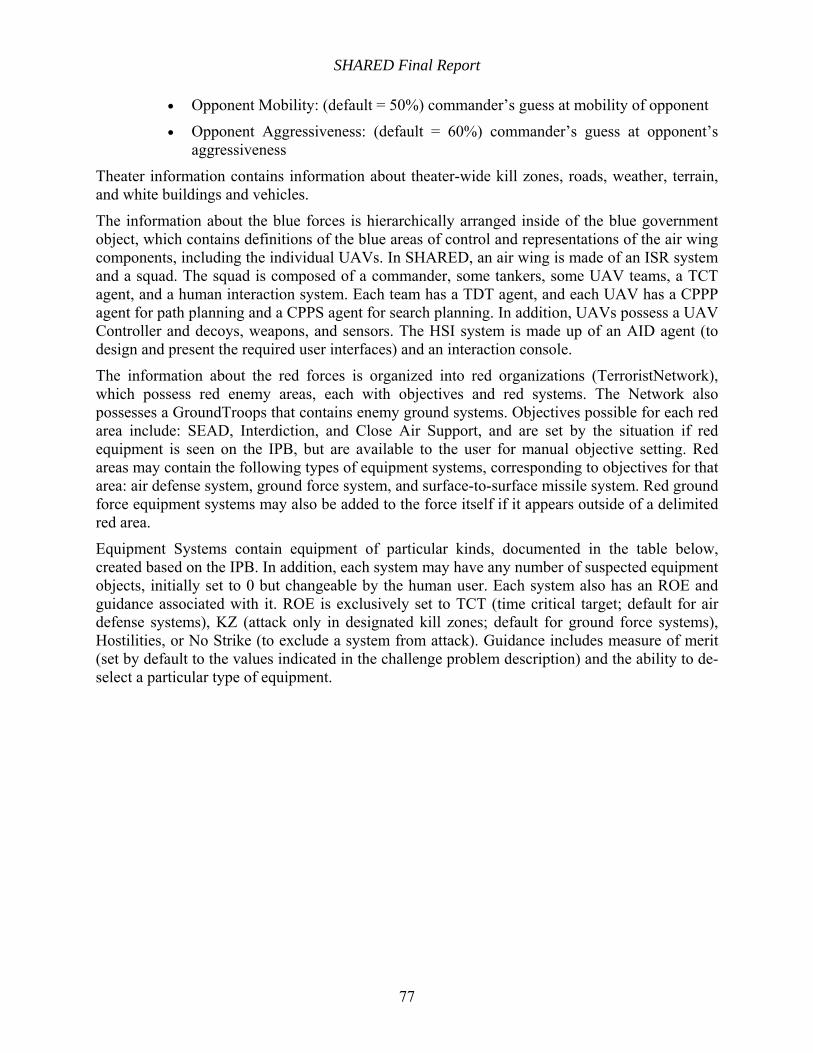
SHARED Final Report
77
• Opponent Mobility: (default = 50%) commander’s guess at mobility of opponent
• Opponent Aggressiveness: (default = 60%) commander’s guess at opponent’s aggressiveness
Theater information contains information about theater-wide kill zones, roads, weather, terrain, and white buildings and vehicles.
The information about the blue forces is hierarchically arranged inside of the blue government object, which contains definitions of the blue areas of control and representations of the air wing components, including the individual UAVs. In SHARED, an air wing is made of an ISR system and a squad. The squad is composed of a commander, some tankers, some UAV teams, a TCT agent, and a human interaction system. Each team has a TDT agent, and each UAV has a CPPP agent for path planning and a CPPS agent for search planning. In addition, UAVs possess a UAV Controller and decoys, weapons, and sensors. The HSI system is made up of an AID agent (to design and present the required user interfaces) and an interaction console.
The information about the red forces is organized into red organizations (TerroristNetwork), which possess red enemy areas, each with objectives and red systems. The Network also possesses a GroundTroops that contains enemy ground systems. Objectives possible for each red area include: SEAD, Interdiction, and Close Air Support, and are set by the situation if red equipment is seen on the IPB, but are available to the user for manual objective setting. Red areas may contain the following types of equipment systems, corresponding to objectives for that area: air defense system, ground force system, and surface-to-surface missile system. Red ground force equipment systems may also be added to the force itself if it appears outside of a delimited red area.
Equipment Systems contain equipment of particular kinds, documented in the table below, created based on the IPB. In addition, each system may have any number of suspected equipment objects, initially set to 0 but changeable by the human user. Each system also has an ROE and guidance associated with it. ROE is exclusively set to TCT (time critical target; default for air defense systems), KZ (attack only in designated kill zones; default for ground force systems), Hostilities, or No Strike (to exclude a system from attack). Guidance includes measure of merit (set by default to the values indicated in the challenge problem description) and the ability to de-select a particular type of equipment.
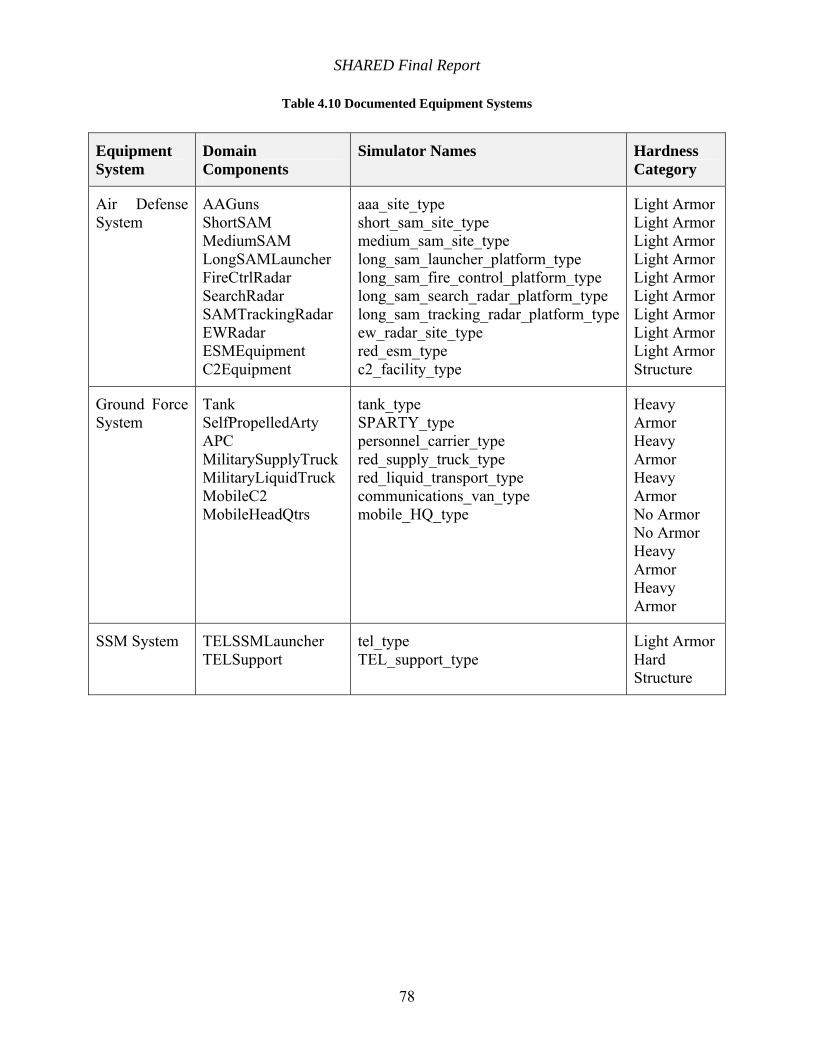
SHARED Final Report
78
Table 4.10 Documented Equipment Systems
Equipment System
Domain Components
Simulator Names Hardness Category
Air Defense System
AAGuns ShortSAM MediumSAM LongSAMLauncher FireCtrlRadar SearchRadar SAMTrackingRadar EWRadar ESMEquipment C2Equipment
aaa_site_type short_sam_site_type medium_sam_site_type long_sam_launcher_platform_type long_sam_fire_control_platform_type long_sam_search_radar_platform_type long_sam_tracking_radar_platform_type ew_radar_site_type red_esm_type c2_facility_type
Light ArmorLight ArmorLight ArmorLight ArmorLight ArmorLight ArmorLight ArmorLight ArmorLight ArmorStructure
Ground Force System
Tank SelfPropelledArty APC MilitarySupplyTruck MilitaryLiquidTruck MobileC2 MobileHeadQtrs
tank_type SPARTY_type personnel_carrier_type red_supply_truck_type red_liquid_transport_type communications_van_type mobile_HQ_type
Heavy Armor Heavy Armor Heavy Armor No Armor No Armor Heavy Armor Heavy Armor
SSM System TELSSMLauncher TELSupport
tel_type TEL_support_type
Light ArmorHard Structure
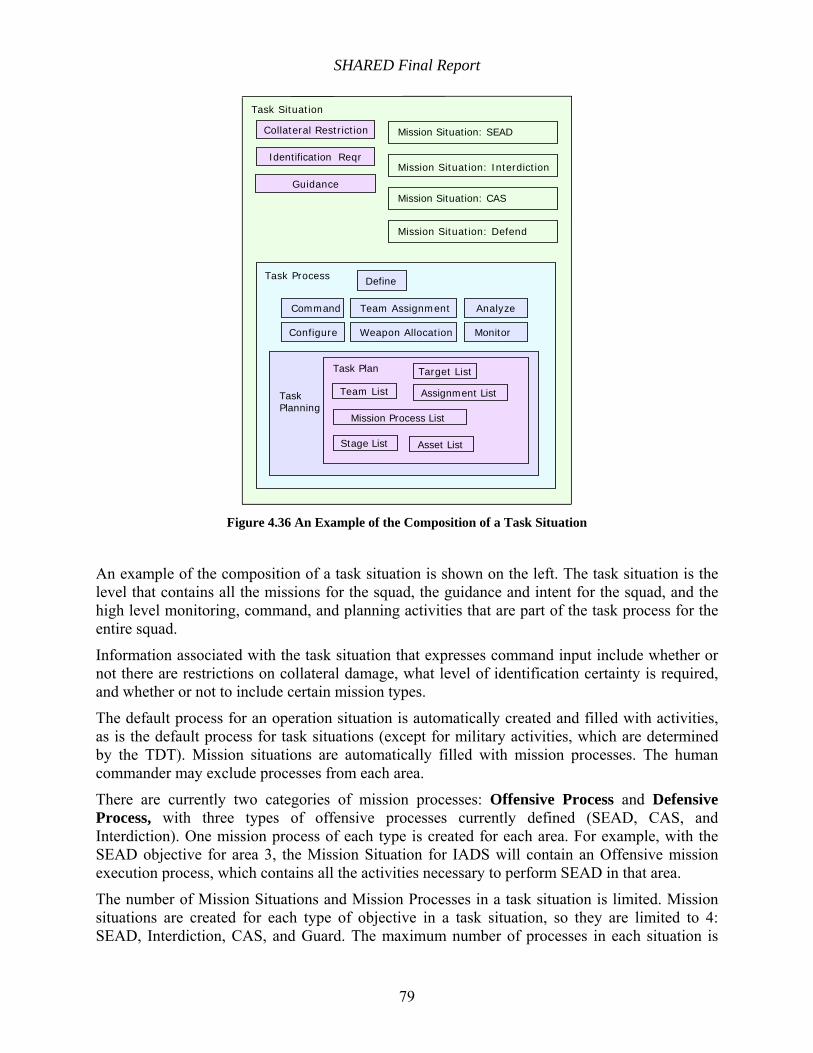
SHARED Final Report
79
Task Situation
Collateral Restriction Mission Situation: SEAD
Task Process
Task Planning
Task Plan
Command
Monitor
Define
Analyze
Configure
Team Assignment
Weapon Allocation
Team List
Target List
Asset List
Assignment List
Mission Process List
Stage List
Identification Reqr
GuidanceMission Situation: CAS
Mission Situation: Defend
Mission Situation: Interdiction
Figure 4.36 An Example of the Composition of a Task Situation
An example of the composition of a task situation is shown on the left. The task situation is the level that contains all the missions for the squad, the guidance and intent for the squad, and the high level monitoring, command, and planning activities that are part of the task process for the entire squad.
Information associated with the task situation that expresses command input include whether or not there are restrictions on collateral damage, what level of identification certainty is required, and whether or not to include certain mission types.
The default process for an operation situation is automatically created and filled with activities, as is the default process for task situations (except for military activities, which are determined by the TDT). Mission situations are automatically filled with mission processes. The human commander may exclude processes from each area.
There are currently two categories of mission processes: Offensive Process and Defensive Process, with three types of offensive processes currently defined (SEAD, CAS, and Interdiction). One mission process of each type is created for each area. For example, with the SEAD objective for area 3, the Mission Situation for IADS will contain an Offensive mission execution process, which contains all the activities necessary to perform SEAD in that area.
The number of Mission Situations and Mission Processes in a task situation is limited. Mission situations are created for each type of objective in a task situation, so they are limited to 4: SEAD, Interdiction, CAS, and Guard. The maximum number of processes in each situation is
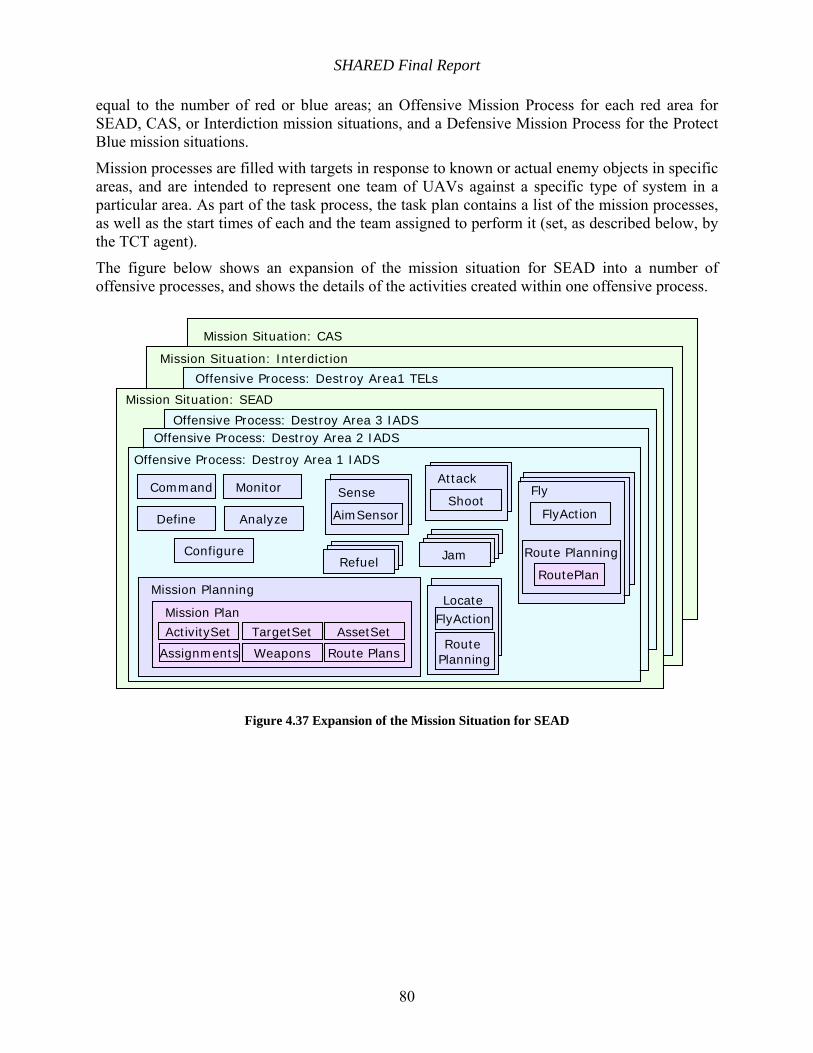
SHARED Final Report
80
equal to the number of red or blue areas; an Offensive Mission Process for each red area for SEAD, CAS, or Interdiction mission situations, and a Defensive Mission Process for the Protect Blue mission situations.
Mission processes are filled with targets in response to known or actual enemy objects in specific areas, and are intended to represent one team of UAVs against a specific type of system in a particular area. As part of the task process, the task plan contains a list of the mission processes, as well as the start times of each and the team assigned to perform it (set, as described below, by the TCT agent).
The figure below shows an expansion of the mission situation for SEAD into a number of offensive processes, and shows the details of the activities created within one offensive process.
Figure 4.37 Expansion of the Mission Situation for SEAD
Mission Situation: CAS
Mission Situation: SEAD
Mission Situation: Interdiction
Offensive Process: Destroy Area 1 IADS
CommandAttack
Shoot
Offensive Process: Destroy Area1 TELs
Offensive Process: Destroy Area 2 IADSOffensive Process: Destroy Area 3 IADS
Fly
Route Planning
FlyAction
RoutePlan
Sense
AimSensor
LocateLocate
LocateLocateLocateJamLocateLocateRefuel
Monitor
Define Analyze
Configure
Mission Planning
Mission Plan
WeaponsAssignments
AssetSet
Route Plans
TargetSetActivitySetFlyAction
Route Planning

SHARED Final Report
81
The details of a defensive process model are shown below.
Figure 4.38 Details of a Defensive Process Model
Each type of process (operation, task, or mission process) is defined as being made up of a set of activity objects, like command, fly, sense, attack, monitor, plan a route, or evaluate a plan. As part of the task situation, the task processes needed to represent the unfolding task are created, and automatically filled and assigned to appropriate actors (see below). In the same way, as part of the creation of a mission situation, the mission processes required to perform each mission situation are created and assigned.
The number of activities in a mission process is unlimited and will fluctuate as the situation changes. Activities are created for the human commander (Monitor, Command, Evaluate Plan, Define, etc., as appropriate to the level [operation, task, or mission]). Activities are also created for the automation (the TCT agent is assigned the Task Planning Activity, AID is assigned all Human-System Interaction Activities, the TDT agent is assigned the Mission Planning Activity, and the CPP agent is assigned the Route Planning Activity).
Military Activities can only be performed by UAVs, and are not created by the situation, but by the TDT based on the needs of the situation. The Military Activities include: Fly, Attack, Sense, Locate, Jam, Protect, and Refuel. Based on the targetlist derived from IPB, the TDT defines Attack (with accompanying FlyTo activities), Sense, Refuel, etc. activities for each target. These activities are then created in the situation representation and added to the mission process.
Objects in the situation representation automatically react to the changes in the situation as indicated by simulator values, and objects and context are created and destroyed as necessary to provide a semantically rich picture of the actual situation. The situation model actively and dynamically performs target evaluation, creating missions and mission targets as necessary, for assignment by external agents like the TCT and TDT. Each situation type knows what sort of targets needs to be included in a process, subject to commander’s guidance, objectives, and ROE.
Mission Situation: Defend
Defensive Process: Protect Blue Area 1
Defensive Process: Protect Blue Area 2
CommandAttack
Shoot
Fly
Route Planning
FlyAction
RoutePlan
Sense
AimSensor
LocateLocateLocateLocate
LocateLocateLocateJam
LocateLocateRefuel
Monitor
Define Analyze
Configure
Mission Planning
Mission Plan
WeaponsAssignments
AssetSet
Route Plans
TargetSetActivitySetLocate
Protect
FlyAction
Route Planning
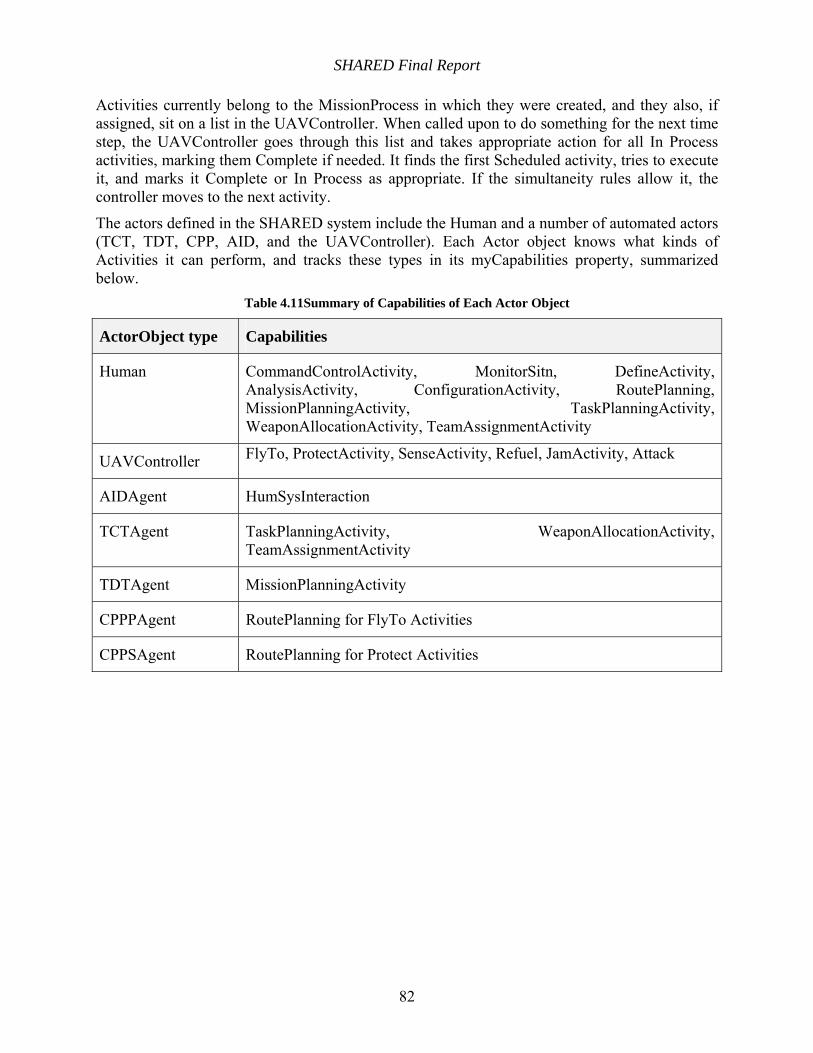
SHARED Final Report
82
Activities currently belong to the MissionProcess in which they were created, and they also, if assigned, sit on a list in the UAVController. When called upon to do something for the next time step, the UAVController goes through this list and takes appropriate action for all In Process activities, marking them Complete if needed. It finds the first Scheduled activity, tries to execute it, and marks it Complete or In Process as appropriate. If the simultaneity rules allow it, the controller moves to the next activity.
The actors defined in the SHARED system include the Human and a number of automated actors (TCT, TDT, CPP, AID, and the UAVController). Each Actor object knows what kinds of Activities it can perform, and tracks these types in its myCapabilities property, summarized below.
Table 4.11Summary of Capabilities of Each Actor Object
ActorObject type Capabilities
Human CommandControlActivity, MonitorSitn, DefineActivity, AnalysisActivity, ConfigurationActivity, RoutePlanning, MissionPlanningActivity, TaskPlanningActivity, WeaponAllocationActivity, TeamAssignmentActivity
UAVController FlyTo, ProtectActivity, SenseActivity, Refuel, JamActivity, Attack
AIDAgent HumSysInteraction
TCTAgent TaskPlanningActivity, WeaponAllocationActivity, TeamAssignmentActivity
TDTAgent MissionPlanningActivity
CPPPAgent RoutePlanning for FlyTo Activities
CPPSAgent RoutePlanning for Protect Activities
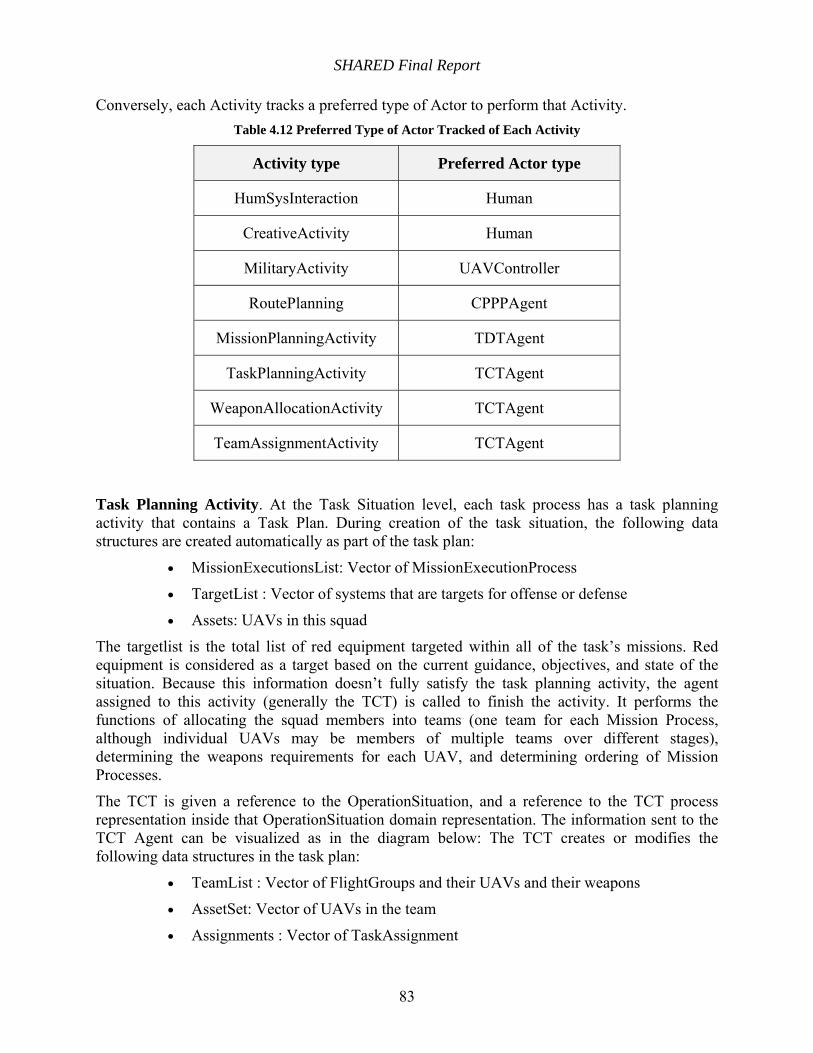
SHARED Final Report
83
Conversely, each Activity tracks a preferred type of Actor to perform that Activity. Table 4.12 Preferred Type of Actor Tracked of Each Activity
Activity type Preferred Actor type
HumSysInteraction Human
CreativeActivity Human
MilitaryActivity UAVController
RoutePlanning CPPPAgent
MissionPlanningActivity TDTAgent
TaskPlanningActivity TCTAgent
WeaponAllocationActivity TCTAgent
TeamAssignmentActivity TCTAgent
Task Planning Activity. At the Task Situation level, each task process has a task planning activity that contains a Task Plan. During creation of the task situation, the following data structures are created automatically as part of the task plan:
• MissionExecutionsList: Vector of MissionExecutionProcess
• TargetList : Vector of systems that are targets for offense or defense
• Assets: UAVs in this squad
The targetlist is the total list of red equipment targeted within all of the task’s missions. Red equipment is considered as a target based on the current guidance, objectives, and state of the situation. Because this information doesn’t fully satisfy the task planning activity, the agent assigned to this activity (generally the TCT) is called to finish the activity. It performs the functions of allocating the squad members into teams (one team for each Mission Process, although individual UAVs may be members of multiple teams over different stages), determining the weapons requirements for each UAV, and determining ordering of Mission Processes.
The TCT is given a reference to the OperationSituation, and a reference to the TCT process representation inside that OperationSituation domain representation. The information sent to the TCT Agent can be visualized as in the diagram below: The TCT creates or modifies the following data structures in the task plan:
• TeamList : Vector of FlightGroups and their UAVs and their weapons
• AssetSet: Vector of UAVs in the team
• Assignments : Vector of TaskAssignment
SHARED Final Report
84
The TaskAssignment structure associates items as follows:
• aMissionProcess : MissionProcess
• assocTarget : System in an Area
• myStartTime : TimeData
• assocTeam : FlightGroup
In response to this plan, flight group objects are created in the squad and filled in appropriately. Although the current TCT is not capable of this, it is also possible for a TCT function to create and destroy various mission processes to create a more efficient situation. The inputs and outputs to the external C++ TCT code are documented in the Java Documentation for the SHARED software.
Mission Planning Activity. At the Mission Situation level, each mission process’ mission planning task contains a Mission Plan that contains the specific activities that will be performed (generated by the TDT based on the types of targets), the start time of each activity (inferred from the ordering of activities provided by the TDT agent for the team as described below), the UAV assigned to the activity (set by the TDT agent for the team), the weapons used for each activity (the UAV’s suite of weapons is set by the TCT agent for the squad, and the specific allocation of weapons against activities is set by the TDT agent), the target of each activity (set by the TDT), and the route for each activity that involves movement (set by the UAV’s CPP).
The following is automatically created on the mission plans for each Mission Process in each mission situation:
• TargetSet: Vector of targets (equipment) for this Mission Process
Because the mission planning task for each particular Mission Process is assigned to the TDT for that team that is responsible for the Mission Process, the TDT is called, returning the following information:
• ActivityList : Vector of Activities
• Assignments : Vector of Assignment (one each activity)
The MissionAssignment structure associates items as follows:
• anActivity : Activity
• aTarget : the target Tangible object of this activity
• assocWeapons : Vector of Weapons for this UAV for this activity, if any
• assocUAV : UAV
• myStartTime : TimeData
The TDT performs the functions of creating appropriate activities for each target and assigning them to UAVs in an ordered list, along with setting any sensor or weapon selections and parameters.
The table below describes each of the Military Activities, and the parameters that must be set by the TDT for that activity, the rules about simultaneity (when the next scheduled activity is called by the UAV Controller), and the criteria that govern the completion of that activity
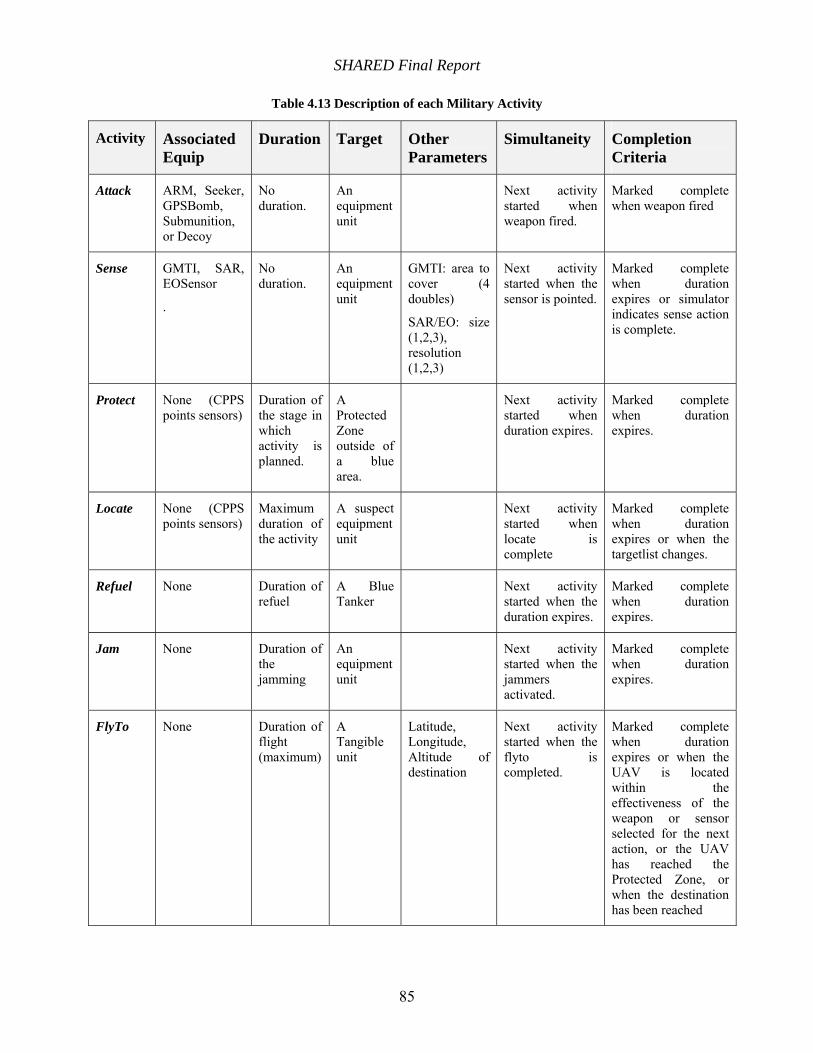
SHARED Final Report
85
Table 4.13 Description of each Military Activity
Activity Associated Equip
Duration Target Other Parameters
Simultaneity Completion Criteria
Attack ARM, Seeker, GPSBomb, Submunition, or Decoy
No duration.
An equipment unit
Next activity started when weapon fired.
Marked complete when weapon fired
Sense GMTI, SAR, EOSensor
.
No duration.
An equipment unit
GMTI: area to cover (4 doubles)
SAR/EO: size (1,2,3), resolution (1,2,3)
Next activity started when the sensor is pointed.
Marked complete when duration expires or simulator indicates sense action is complete.
Protect None (CPPS points sensors)
Duration of the stage in which activity is planned.
A ProtectedZone outside of a blue area.
Next activity started when duration expires.
Marked complete when duration expires.
Locate None (CPPS points sensors)
Maximum duration of the activity
A suspect equipment unit
Next activity started when locate is complete
Marked complete when duration expires or when the targetlist changes.
Refuel None
Duration of refuel
A Blue Tanker
Next activity started when the duration expires.
Marked complete when duration expires.
Jam None
Duration of the jamming
An equipment unit
Next activity started when the jammers activated.
Marked complete when duration expires.
FlyTo None
Duration of flight (maximum)
A Tangible unit
Latitude, Longitude, Altitude of destination
Next activity started when the flyto is completed.
Marked complete when duration expires or when the UAV is located within the effectiveness of the weapon or sensor selected for the next action, or the UAV has reached the Protected Zone, or when the destination has been reached
SHARED Final Report
86
When the simulation is running, new red units in areas of interest will be evaluated according to the guidance and ROE, and new targets will be assigned to the mission’s targetlist. When the targetlist changes, the team may automatically call the TDT for replanning; old activities will be destroyed and new activities and assignments will be created as set by the TDT. The team will also track the asset UAVs on the team, and call the TDT for a replan when the asset list changes.
The timing of calling external agents is shown in the Java Documentation for the SHARED software. Automatic triggering of TDT replanning for a team occurs when a new item appears on the targetlist for the mission, the asset list for the team changes, or a set amount of time has elapsed. All of these parameters are under commander control. The inputs and outputs from the external C++ TDT modules are documented in the Java documentation for the SHARED software.
Flight Path Planning Activities. Because the CPP for a particular UAV is assigned the route planning activity, the performance of an activity requiring route planning causes the UAVController to invoke the CPP, which writes the following to each of the mission plans that the particular UAV participates in:
• Routes : Routeplan for next segment
The CPP modifies in each MissionAssignment structure:
• assocRoute: route for next leg of this activity
When the UAVController is processing a Protect or Locate activity, it checks whether it has a team name. If it does not have a team name, it needs to create a team name and find all the cohorts for this team. While doing so, it fills in its cohort’s team name field and its cohort’s cohort list. Each UAVController keeps track of its current team name and its team cohorts. To create the team name, the UAVController uses the current number listed as a class property of UAVController, and then increments the number. To find the team members (cohorts), the UAVController looks through all the Protect activities in the same MissionProcess as its Protect. If the target of that Protect is the same as the target of its own Protect or find it adds the performer of that activity to the cohort list. After creating the cohort list, it assigns both the team name and the cohort list to each member on the cohort list. The internally implemented (Java) CPP-P is called for FlyTo activity planning. The CPP-S is called as an external module for all Protect activities. The inputs and outputs to the external C++ CPP-S are documented in the Java documentation for the SHARED software.
The algorithm for the CPPP module is contained in the Java CPPPAgent class and documented in the Java Documentation for the SHARED software. The algorithm compares 8 possible future positions (each one time step away) and chooses the one with the best score based on its proximity to the current goal and the threat posed by known enemy units. If the UAV has not recently made progress the weight given to the threat scores is reduced. The exact score calculations are shown in the Java documentation.
Roles. Roles are used as the communication mechanism between the situation model and the interaction design system. Roles that are shared between objects in different modules define the affordance dependencies between them; for example, a particular type of view is defined as affording a particular type of object or information, and certain types of elements afford the display of certain types of data. The use of roles provides independence between the various
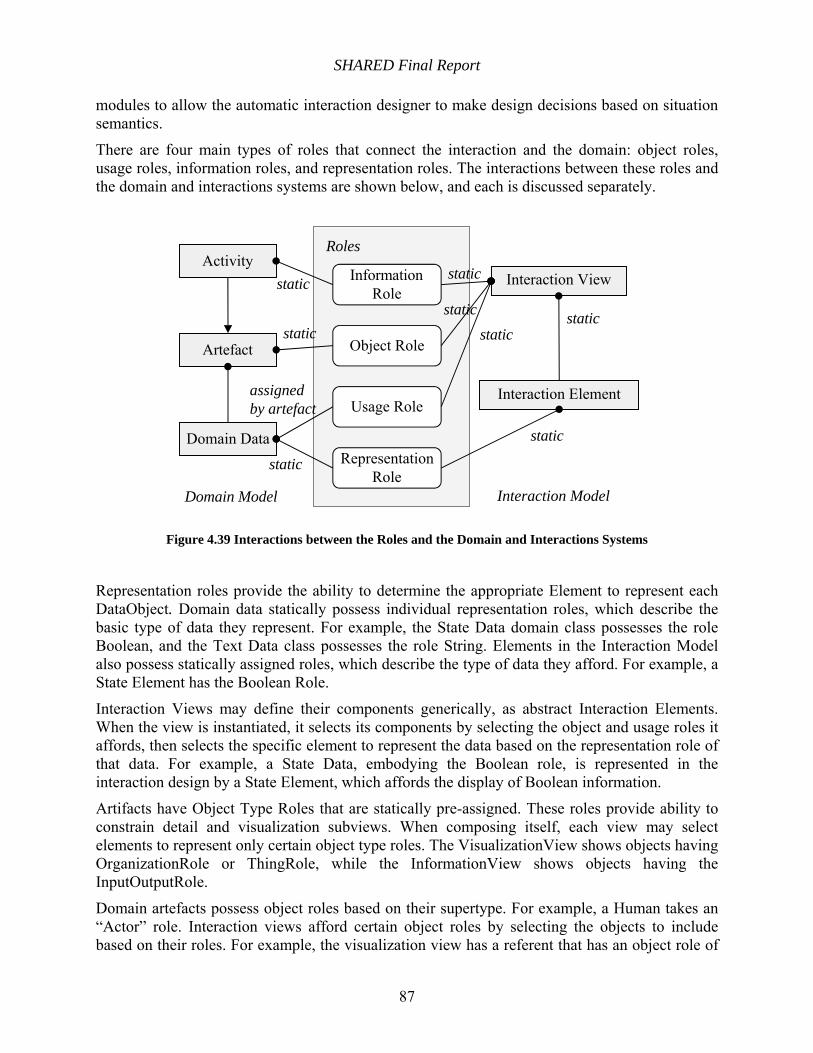
SHARED Final Report
87
modules to allow the automatic interaction designer to make design decisions based on situation semantics.
There are four main types of roles that connect the interaction and the domain: object roles, usage roles, information roles, and representation roles. The interactions between these roles and the domain and interactions systems are shown below, and each is discussed separately.
Figure 4.39 Interactions between the Roles and the Domain and Interactions Systems
Representation roles provide the ability to determine the appropriate Element to represent each DataObject. Domain data statically possess individual representation roles, which describe the basic type of data they represent. For example, the State Data domain class possesses the role Boolean, and the Text Data class possesses the role String. Elements in the Interaction Model also possess statically assigned roles, which describe the type of data they afford. For example, a State Element has the Boolean Role.
Interaction Views may define their components generically, as abstract Interaction Elements. When the view is instantiated, it selects its components by selecting the object and usage roles it affords, then selects the specific element to represent the data based on the representation role of that data. For example, a State Data, embodying the Boolean role, is represented in the interaction design by a State Element, which affords the display of Boolean information.
Artifacts have Object Type Roles that are statically pre-assigned. These roles provide ability to constrain detail and visualization subviews. When composing itself, each view may select elements to represent only certain object type roles. The VisualizationView shows objects having OrganizationRole or ThingRole, while the InformationView shows objects having the InputOutputRole.
Domain artefacts possess object roles based on their supertype. For example, a Human takes an “Actor” role. Interaction views afford certain object roles by selecting the objects to include based on their roles. For example, the visualization view has a referent that has an object role of
Interaction Element
Interaction View
static
static
assigned by artefact
static
staticstatic
Domain Model Interaction Model
Object Role
Usage Role
RepresentationRole
Domain Data
Artefact
static
Roles
InformationRole
Activitystatic
static

SHARED Final Report
88
SituationRole, and selects the parts of the referent with a PhysicalObjectRole to display in the visualization view.
Usage roles are assigned dynamically to a Data situation object by the Artefact domain object that owns it. The usage role assigned to a data object represents how the data’s owner uses the data, regardless of the type of information that data represents (boolean, string, continuous, etc.). For example, an object’s name has an Identity Usage Role and its location has a Location Usage Role. Interaction Views are predefined to afford certain usage roles. For example, the Specification View shows information about an object that has any of the following roles: parameter, value, or setter. Usage roles provide the ability to reveal or hide different types of information about objects by coding the “use” of a particular piece of data for its owner object. Data usage roles are exclusive (each data has only one).
Information roles are statically assigned to Interaction Views and Domain Activities, to allow the required views to be generated for tasks. The information role of a view indicates what information type it affords, while the information role of an activity defines its information requirements. For example, the Command Information Role is afforded by the Specification and Command Interaction Views, and is required by the Command/Control activity.
4.6.2 Interaction Model Detailed System Design
This section provides the details of the organization and operation of the interaction model, the interaction agent, and the interaction design.
The SHARED system supports the human side of mixed-initiative interactions explicitly by integrating multiple software agents (like AID) that can automate certain activities, and automatically assigning all activities that don’t have capable software agents to the human. It supports variable initiative interaction by allowing the human to investigate information about all activities they are capable of, and providing interactions to support those capabilities. In this way, the human commander can easily and efficiently over-ride or modify the behavior and guidance of the software agents who are effectively part of his team.
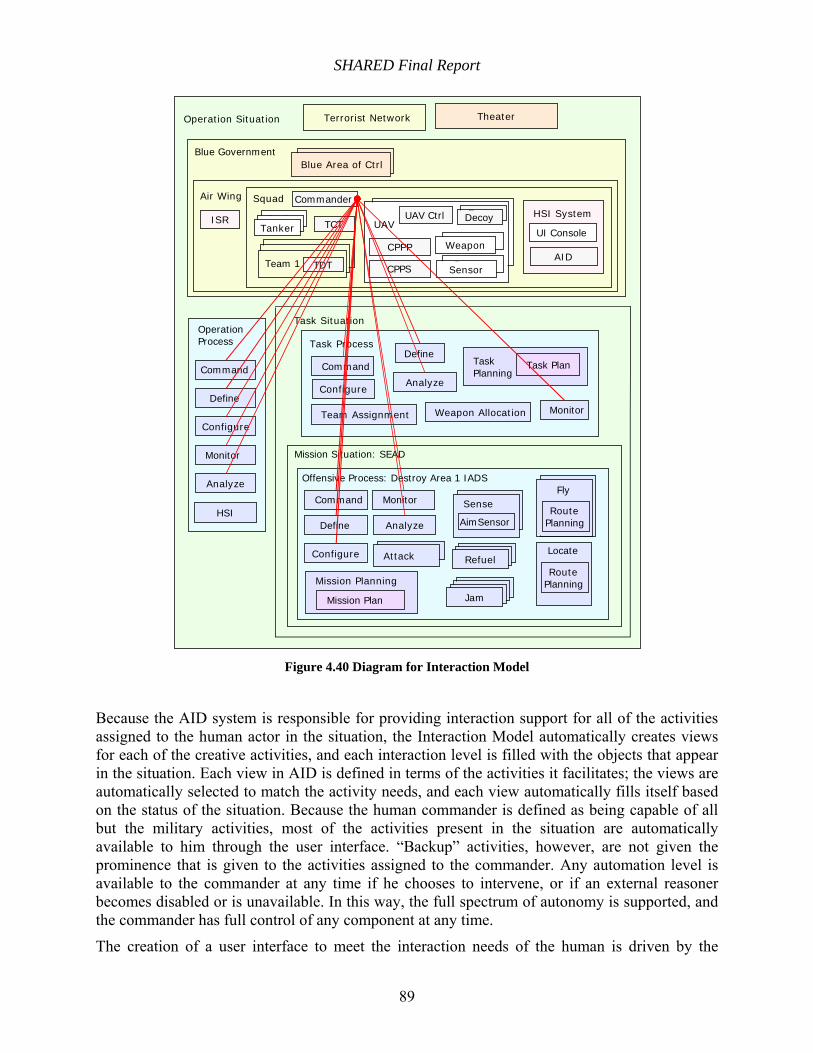
SHARED Final Report
89
Theater
Blue Area of Ctrl
Operation Situation Terrorist Network
Blue Government
Air Wing Squad
ISR TCT
Blue Area of Ctrl
CommanderHSI System
AID
UI Console
TDTTeam 1
UAV
CPPP
UAV Ctrl
WeaponWeapon
SensorsSensor
Operation Process
HSI
Command
Monitor
Define
Analyze
Configure
TankerTankerTanker
CPPS
DecoyDecoy
Task Situation
Task Situation
Task Process
Task Planning
Task PlanCommand
Monitor
Define
AnalyzeConfigure
Team Assignment Weapon Allocation
Mission Situation: SEAD
Offensive Process: Destroy Area 1 IADS
Command
Attack
Sense
AimSensor
Locate
LocateLocateLocateJam
LocateLocateRefuel
Monitor
Define Analyze
Configure
Mission Planning
Mission Plan
Route Planning
Locate
Fly
Route Planning
Figure 4.40 Diagram for Interaction Model
Because the AID system is responsible for providing interaction support for all of the activities assigned to the human actor in the situation, the Interaction Model automatically creates views for each of the creative activities, and each interaction level is filled with the objects that appear in the situation. Each view in AID is defined in terms of the activities it facilitates; the views are automatically selected to match the activity needs, and each view automatically fills itself based on the status of the situation. Because the human commander is defined as being capable of all but the military activities, most of the activities present in the situation are automatically available to him through the user interface. “Backup” activities, however, are not given the prominence that is given to the activities assigned to the commander. Any automation level is available to the commander at any time if he chooses to intervene, or if an external reasoner becomes disabled or is unavailable. In this way, the full spectrum of autonomy is supported, and the commander has full control of any component at any time.
The creation of a user interface to meet the interaction needs of the human is driven by the
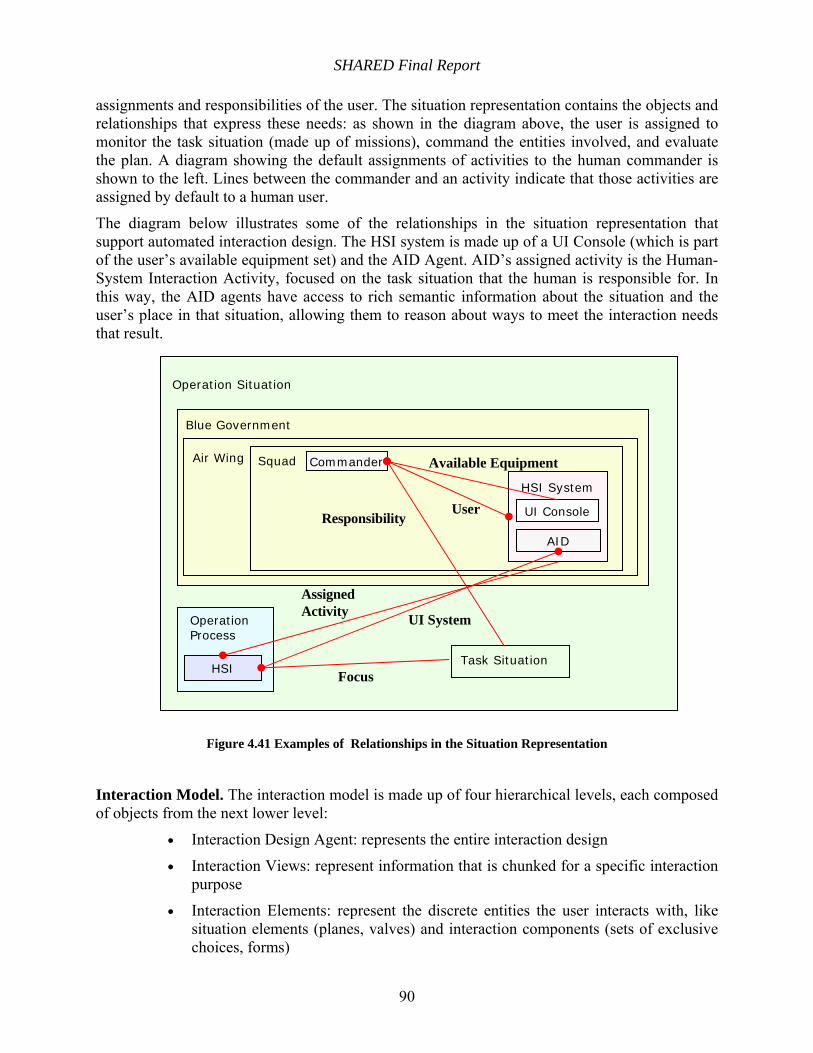
SHARED Final Report
90
assignments and responsibilities of the user. The situation representation contains the objects and relationships that express these needs: as shown in the diagram above, the user is assigned to monitor the task situation (made up of missions), command the entities involved, and evaluate the plan. A diagram showing the default assignments of activities to the human commander is shown to the left. Lines between the commander and an activity indicate that those activities are assigned by default to a human user.
The diagram below illustrates some of the relationships in the situation representation that support automated interaction design. The HSI system is made up of a UI Console (which is part of the user’s available equipment set) and the AID Agent. AID’s assigned activity is the Human-System Interaction Activity, focused on the task situation that the human is responsible for. In this way, the AID agents have access to rich semantic information about the situation and the user’s place in that situation, allowing them to reason about ways to meet the interaction needs that result.
Figure 4.41 Examples of Relationships in the Situation Representation
Interaction Model. The interaction model is made up of four hierarchical levels, each composed of objects from the next lower level:
• Interaction Design Agent: represents the entire interaction design
• Interaction Views: represent information that is chunked for a specific interaction purpose
• Interaction Elements: represent the discrete entities the user interacts with, like situation elements (planes, valves) and interaction components (sets of exclusive choices, forms)
Operation Situation
Blue Government
Air Wing Squad Commander
HSI System
AID
UI Console
Operation Process
HSITask Situation
User
AssignedActivity UI System
Available Equipment
Focus
Responsibility
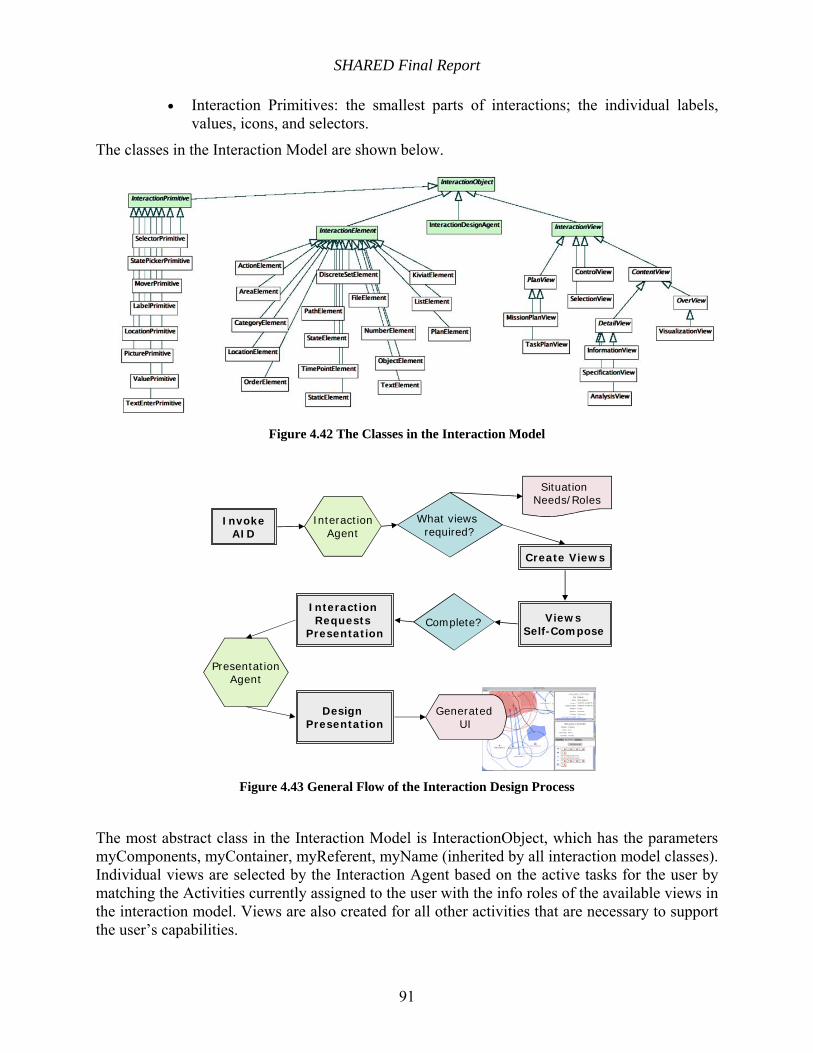
SHARED Final Report
91
• Interaction Primitives: the smallest parts of interactions; the individual labels, values, icons, and selectors.
The classes in the Interaction Model are shown below.
Figure 4.42 The Classes in the Interaction Model
What views required?
Generated UI
InteractionAgent
PresentationAgent
Create Views
Views Self-Compose
Design Presentation
InvokeAID
Complete?Interaction Requests
Presentation
Situation Needs/Roles
Figure 4.43 General Flow of the Interaction Design Process
The most abstract class in the Interaction Model is InteractionObject, which has the parameters myComponents, myContainer, myReferent, myName (inherited by all interaction model classes). Individual views are selected by the Interaction Agent based on the active tasks for the user by matching the Activities currently assigned to the user with the info roles of the available views in the interaction model. Views are also created for all other activities that are necessary to support the user’s capabilities.
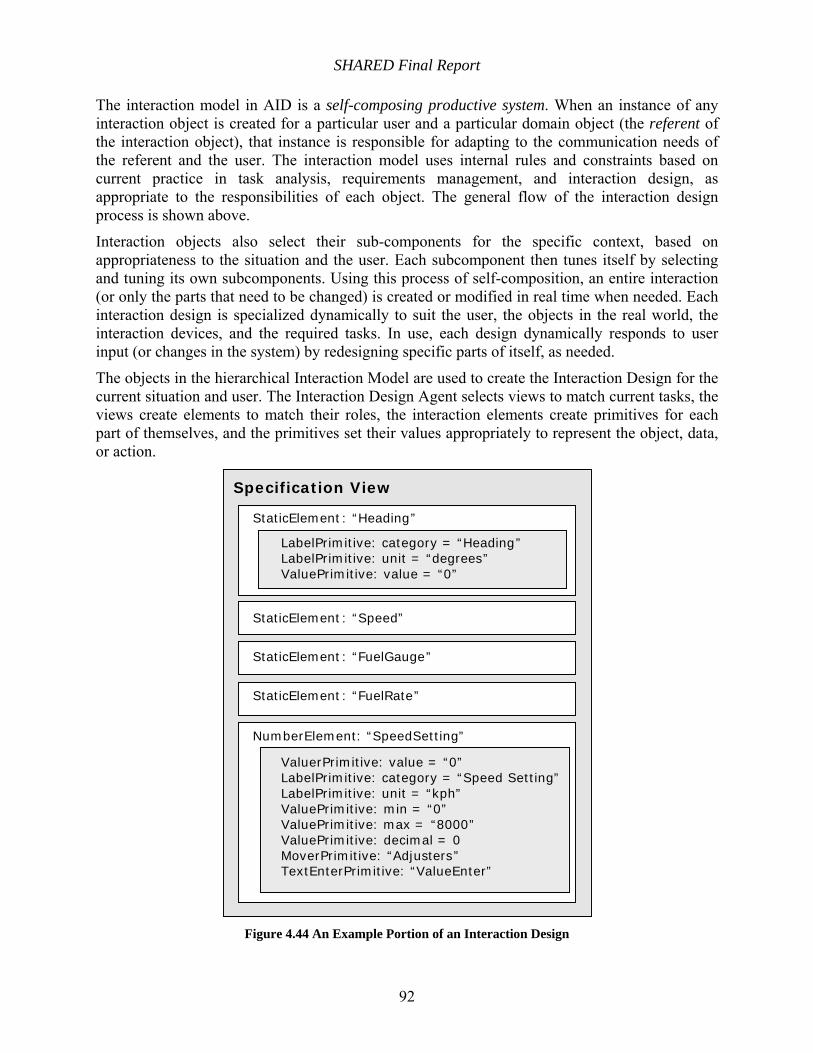
SHARED Final Report
92
The interaction model in AID is a self-composing productive system. When an instance of any interaction object is created for a particular user and a particular domain object (the referent of the interaction object), that instance is responsible for adapting to the communication needs of the referent and the user. The interaction model uses internal rules and constraints based on current practice in task analysis, requirements management, and interaction design, as appropriate to the responsibilities of each object. The general flow of the interaction design process is shown above.
Interaction objects also select their sub-components for the specific context, based on appropriateness to the situation and the user. Each subcomponent then tunes itself by selecting and tuning its own subcomponents. Using this process of self-composition, an entire interaction (or only the parts that need to be changed) is created or modified in real time when needed. Each interaction design is specialized dynamically to suit the user, the objects in the real world, the interaction devices, and the required tasks. In use, each design dynamically responds to user input (or changes in the system) by redesigning specific parts of itself, as needed.
The objects in the hierarchical Interaction Model are used to create the Interaction Design for the current situation and user. The Interaction Design Agent selects views to match current tasks, the views create elements to match their roles, the interaction elements create primitives for each part of themselves, and the primitives set their values appropriately to represent the object, data, or action.
Specification View
StaticElement: “Heading”
StaticElement: “Speed”
StaticElement: “FuelGauge”
StaticElement: “FuelRate”
NumberElement: “SpeedSetting”
ValuerPrimitive: value = “0”LabelPrimitive: category = “Speed Setting”LabelPrimitive: unit = “kph”ValuePrimitive: min = “0”ValuePrimitive: max = “8000”ValuePrimitive: decimal = 0MoverPrimitive: “Adjusters”TextEnterPrimitive: “ValueEnter”
LabelPrimitive: category = “Heading”LabelPrimitive: unit = “degrees”ValuePrimitive: value = “0”
Figure 4.44 An Example Portion of an Interaction Design
SHARED Final Report
93
The full interaction design is a hierarchical structure, with views that contain elements and elements that contain primitives that have all variables filled. An example portion of an interaction design is shown above. This example is a partial design for a Specification View for an aircraft. The heading, speed, fuel gauge, fuel rate, and speed setting data have been selected for inclusion because they all have the usage role of parameter when associated with an aircraft.
The Number Element was selected to represent the Speed Setting data because speed is represented by a continuous data object with the representation role of “number”, which is the same role held by Number Elements. Each data property of the speed setting is represented as part of the number element, using the appropriate primitives; for example, value primitives are used to represent current value, minimum value, maximum value, and the decimal places, while a text enter primitive is used to represent the editable nature of this value.
4.6.3 Presentation Model Detailed System Design
The presentation model is separate from the interaction model and the interaction design, in order to provide adaptation to multiple types of user interface devices, and to separate user requirements from the physical satisfaction of these requirements. For example, on a CRT-based system, the presentation model converts the interaction design into a presentation by selecting user interface components like windows (to enclose the interaction), frames (for views), and widgets (for elements). The presentation components are then specialized according to the parameters of the objects in the situation. In addition to the device-specific knowledge about translation from interaction objects to presentation objects, each presentation model also contains a number of heuristics that specify how to select and specialize presentation objects, and how to code and present the interaction object information (for example, how to line up widgets, add appropriate status coding, and represent objects symbolically or textually).

SHARED Final Report
94
5 Research Required
This section summarizes the work still required on each of the SHARED modules.
5.1 TCT Research Required
Currently, TCT estimates the time for each stage based on the equations we provided. How to schedule the whole mission in an optimal way is still under consideration. Specifically, Rule Based sequencing needs to be further developed.
The preliminary allocation is based on the proportional control. Distributed resource allocation with different dynamics still needs to be developed in order to deal with more complicated situations.
Moreover, the functionality position of TCT in the situation as cooperative player and non-corporative player has been noticed in SHARED. Further analysis on how to design this type of player in the situation is required. In the short term, simplified (super-real time) simulation capability is also advocated.
5.2 TDT Research Required 5.2.1 TDT-Hierarchical
We recognize that considerable additional effort is required to refine our present TDT-Hierarchical. We have identified the following research enhancements required:
Estimation Intent of the adversary.
Consideration of the different cultural and social idiosyncrasies
Implementation of adaptation of ordinal game for interfacing with human commanders
Further details heuristic based upper level planning in hierarchical TDT
Computation strategies for non-zero-sum games
Other jamming deployment strategies and algorithm
5.2.2 TDT-ULTRA
Additional effort would have resulted in considerable improvement of the TDT-ULTRA. Some of our plans and research requirements have included the following topics which remain unfinished:
Continue to upgrade and test ULTRA. Additional features that could have been considered include:
o Estimation of enemy intent.
o Other jamming and decoy control strategies.
o 3-D information in Blue target selection in ULTRA.
SHARED Final Report
95
o Adaptive adjustments of parameters in cost functions.
o The effects of asymmetric collateral damage weights.
Continue to perform experiments using ULTRA with
o Red Controls ignored.
o Red Controls determined based on a Zero-Sum game.
o Red Controls determined based on a Nonzero-Sum game.
Continue to investigate ULTRA with distance discount factor for:
o Specific target selection by sub-teams of UAVs
o Specific target selection by scattered individual UAVs
Perform Experiments on sensor-based BDA with sensor UAVs having partial information about the battlefield.
Game theoretic approach is essential in battle management in future combat systems. More emphasis should be placed on it.
The game approach becomes more effective if there is a mechanism for estimating the enemy’s intent. Very few results are available in this area.
5.3 CPP Research Required 5.3.1 CPPP
CPPP adopts a gradient-climbing approach to perform path planning. This approach has the advantages of good scalability, low computation burden, and low memory requirements and complexity, which facilitate on-board implementation. But it also has the disadvantage of easy to get "trapped" in local optimum in a resource profile. The DATE algorithm developed by us could overcome the problem, but at a cost that en route safe UAV-to-threat distance is not guaranteed. The algorithm could be enhanced via the idea of tube generation, selection, and following.
Also currently a heuristic approach is adopted to handle the case when time constraint exists. It would be desirable to determine the flight path with a theoretical approach, in which other physical constraints, including fuel consumption, fitness of UAVs, and so on, may also be accommodated relatively easily in the framework.
Moreover, to determine the conditions under which the UAV team achieves cohesion when time delays and asynchronism exist in a communication network is also very important since generally their impact on the system performance is significant in reality.
5.3.2 CPPS
Further research would have refined the performance of the existing algorithms. Such research would have included incorporating heuristics and learning methods (e.g. utilizing simulation methods such as Neuro-Dynamic Programming) in the planning algorithm to enhance search efficiency in terms of increased planning ability (e.g. through better information utilization) and decreased computational load. It also would have included improving the control of the sensors, including the ability to position sensors independently of vehicle motion and the control of
SHARED Final Report
96
multiple sensors. This entails the development of control strategies (for both sensors and vehicle paths; and cooperative and single-UAV sensor control) to maximize the payoff of sensor use while maintaining a feasible computational load. Further research would also have meant conducting more experiments, both inside and outside of the SHARED system (using modularity to ensure improved performance in the SHARED system.) Additionally, methods to incorporate moving targets would have to be included in any additional research in order to cover that aspect of the problem. The probabilistic nature of the target information base was expected to have made this relatively easy.
5.4 VIA Research Required
Now that we have achieved a robust software system to embody SHARED, our third year MICA efforts were intended to emphasize algorithm improvement and extension of human interaction into the lowest levels of human interaction in the plan. Currently, the human commander may affect the plan through expression of suspicions, ROE, and guidance, and has full control over automated replanning triggers. But, he cannot now directly manipulate the elements of an automated plan (“assign this activity to that UAV rather than this one” or “fly through this corridor rather than that”). Introducing these capabilities reveals a number of issues involving overlapping areas of responsibility and involves intricate plan dependency parameters that we are eager to investigate. In addition, numerous improvements to both the models and the reasoning employed in the domain and the interaction generators is anticipated as the technology evolves, along with APIs for user interaction designers, agent developers, and domain model maintenance.
SHARED Final Report
97
6 References and Standards
1. Ahlstrom, V. and Longo, K. (2001) Human Factors Design Guide Update (Report Number DOT/FAA/CT-96-01): A Revision to Chapter 8- Computer Human Interface Guidelines. US Department of Transportation, April.
2. Ahlstrom, V., Longo, K., and Truitt, T. (2002) Human Factors Design Guide Update (Report Number DOT/FAA/CT-96-01): A Revision to Chapter 5- Automation Guidelines. US Department of Transportation, February.
3. Builder, Carl H., Banks, Steven C., and Nordin, Richard (1999) Command Concepts: A Theory Derived from the Practice of Command and Control. Washington, D.C.: National Defense Research Institute/RAND.
4. Freeman, J. and MacMillan, J. (2002) Mixed initiative control of robotic systems. 2002 Command and Control Research and Technology Symposium, Monterey, California, June 11-13.
5. Galitz, W. (1997) The Essential Guide to User Interface Design. New York: Wiley.
6. Landauer, T. (1995) The Trouble with Computers. Cambridge, Mass.: MIT Press.
7. Mandel, T. (1997). The Elements of User Interface Design. New York: Wiley.
8. Mayhew, D. (1999) The Usability Engineering Lifecycle. San Francisco: Morgan Kaufman Publishers.
9. National Research Council (2000) Uninhabited Air Vehicles: Enabling Science for Military Systems. Washington, D.C.: National Academy Press.
10. Nielsen, J. (1993) Usability Engineering. Boston: Academic Press.
11. Rosson, M and Carroll, J. (2002) Usability Engineering. San Francisco, Morgan Kaufmann Publishers.
12. Y.F.Wang, J.B.Cruz, Jr.,and J.H.Mulligan, Jr. (1990) Two Coding Strategies for Bidirectional Associative Memory, IEEE Trans. Neural Networks, vol. 1, no. 1, pp. 81-92, March.
13. B.Kosko (1988), Bidirectional Associative Memories, IEEE Trans. Syst. Man, Cybern., vol. 18, no. 1, pp. 46-60, January.
SHARED Final Report
98
7 Publications 7.1 TCT Publications
[TCT-1] Yaodong Pan, Tankut Acarman, and Umit Ozguner, "Nash Solution by Extremum [TCT-1] Y. Pan, T. Acarman, and U. Ozguner, "Nash Solution by Extremum Seeking Control Approach," Proc. of the 41st IEEE Conference on Decision and Control, Las Vegas, NV, December 10-13, 2002, pp. 329-334.
[TCT-2] L. Xu and U. Ozguner, “Battle Management for Unmanned Aerial Vehicles”, Proc. of the 42nd IEEE Conference on Decision and Control, Maui, HI, December 9-12, 2003, pp. 3585-3590.
[TCT-3] Yaodong Pan and Umit Ozguner, “Sliding Mode Extremum Seeking Control for Linear Quadratic Dynamic Game”, Proc. of the 2004 American Control Conference, Boston, MA, June 29-July2, 2004.
7.2 OSU TDT Publications
[OSUTDT-1] J. B. Cruz, Jr. and M. A. Simaan, "Ordinal Game Theory and Applications - A New Framework For Games Without Payoff Functions, Proc. of the 2002 Mediterranean Conference on Control and Automation, Lisbon, Portugal, July 9-12, 2002, CD-ROM (#474.pdf).
[OSUTDT-2] G. Chen and J. B. Cruz, Jr., "Genetic Algorithm for Task Allocation in UAV Cooperative Control," Proc. of the 2003 AIAA Guidance, Navigation, and Control Conference, Austin, Texas, August 2003.
[OSUTDT-3] D. Garagic and J. B. Cruz, Jr., "An Approach to Fuzzy Noncooperative Games," Journal of Optimization Theory and Applications, Vol. 118, No. 3, September 2003, pp. 475–491.
[OSUTDT-4] Yong Liu, M. A. Simaan, and J. B. Cruz, Jr., “Game Theoretic Approach to Cooperative Teaming and Tasking in the Presence of an Adversary,” Proc. of the 2003 American Control Conference, Denver, CO, June 4-6, 2003, pp. 5375-5380.
[OSUTDT-5] J. B. Cruz, Jr., G. Chen, D. Garagic, X. Tan, D. Li, D. Shen, M. Wei, and X. Wang, “Team Dynamics and Tactics for Mission Planning”, Proc. of the 42nd IEEE Conference on Decision and Control, Maui, HI, December 9-12, 2003, pp. 3579-3584.
7.3 Pittsburgh TDT Publications
[PITT-1] J. B. Cruz, Jr. and M. A. Simaan, “Ordinal Game Theory and Applications – A New Framework for Games Without Payoff Functions,” Proc. of the 2002 Mediterranean Conference on Control and Automation, Lisbon, Portugal, July 9-12, 2002, CD-ROM (#474.pdf).
SHARED Final Report
99
[PITT-2] Yong Liu, M. A. Simaan, and J. B. Cruz, Jr., “Game Theoretic Approach to Cooperative Teaming and Tasking in the Presence of an Adversary,” Proc. of the 2003 American Control Conference, Denver, CO, June 4-6, 2003, pp. 5375-5380.
[PITT-3] D. Galati, Yong Liu, and M. A. Simaan, “A Fast Algorithm for Unit Level Team Resource Allocation in a Game Environment,” Proc. of the 42nd IEEE Conference on Decision and Control, Maui, HI, December 9-12, 2003, pp. 2872-2877.
[PITT-4] Yong Liu, D. Galati, and M. A. Simaan, “Team Dynamics and Tactics in SHARED,” Proc. of the 42nd IEEE Conference on Decision and Control, Maui, HI, December 9-12, 2003, pp. 3561-3566.
[PITT-5] Yong Liu, “Nash Based Strategies for the Control of Extended Complex Systems,” Ph.D dissertation, University of Pittsburgh, October 2003.
[PITT-6] Yong Liu and M. A. Simaan, “Noninferior Nash Strategies for Multi-Team Systems,” Journal of Optimization Theory and Applications, Vol.120, No.1, January 2004, pp. 29-51.
[PITT-7] Yong Liu, D. Galati, and M. A. Simaan “Nash Strategies with Distance Discount Factor in Target Selection Problems”, Proc. of the 2004 American Control Conference, Boston, MA, June 29-July2, 2004.
[PITT-8] Yong Liu, D. Galati, and M. A. Simaan, “A Game Theoretic Approach to Team Dynamics and Tactics in Mixed Initiative Control of Automa-teams,” Submitted to the 43rd IEEE Conference on Decision and Control, Paradise Island, Bahamas, December 14-17, 2004.
[PITT-9] D. Galati and M. A. Simaan, ‘Effectiveness of the Nash Strategies in Competitive Multi-Team Target Assignment Problems,” Submitted to the 43rd IEEE Conference on Decision and Control, Paradise Island, Bahamas, December 14-17, 2004.
7.4 CPPP Publications
[CPPP-1] V. Gazi and K. M. Passino, “Stability Analysis of Swarms in an Environment with an Attractant/Repellent Profile,” Proc. of the 2002 American Control Conference, Vol. 3, May 8-10, 2002, pp. 1819-1824.
[CPPP-2] V. Gazi and K. M. Passino, “Stability Analysis of Swarms,” Proc. of the 2002 American Control Conference, Vol. 3, May 8-10, 2002, pp. 1813-1818.
[CPPP-3] V. Gazi and K. M. Passino, “A Class of Attraction/Repulsion Functions for Stable Swarm Aggregations,” Proc. of the 41st IEEE Conference on Decision and Control, Las Vegas, NV, Vol. 3, December 10-13, 2002, pp. 2842-2847.
[CPPP-4] V. Gazi and K. M. Passino, “Stability Analysis of Social Foraging Swarms: Combined Effects of Attractant/Repellent Profiles,” Proc. of the 41st IEEE Conference on Decision and Control, Las Vegas, NV, Vol. 3, December 10-13, 2002, pp. 2848-2853.
[CPPP-5] Yanfei Liu and K. M. Passino, “Biomimicry of Social Foraging Behavior for Distributed Optimization: Models, Principles, and Emergent Behaviors,” Journal of Optimization Theory and Applications, Vol. 115, No. 3, December 2002, pp. 603-628.
[CPPP-6] V. Gazi and K. M. Passino, “Stability Analysis of Swarms,” IEEE Transactions on Automatic Control, Vol. 48, Issue. 4, April 2003, pp. 692–697.
SHARED Final Report
100
[CPPP-7] V. Gazi and K. M. Passino, “Stability Analysis of Social Foraging Swarms,” IEEE Trans. on Systems, Man, and Cybernetics-Part B: Cybernetics, Vol. 34, No. 1, February 2004, pp. 539-557.
[CPPP-8] Yanfei Liu and K. M. Passino, “Cohesive Behaviors of Multiple Cooperative Mobile Discrete-time Agents in a Noisy Environment,” Accepted by the 4th Annual International Conference on Cooperative Control and Optimization, November 2003.
[CPPP-9] Yanfei Liu and K. M. Passino, “Stability Analysis of Swarms in a Noisy Environment." Proc. of the 42nd IEEE Conference on Decision and Control, Maui, HI, December 9-12, 2003, pp. 3573-3578.
[CPPP-10] Yanfei Liu and K. M. Passino, “Stable Social Foraging Swarms in a Noisy Environment,” IEEE Trans. on Automatic Control, Vol. 49, No. 1, January 2004, pp. 30-44.
[CPPP-11] Yanfei Liu and K. M. Passino, “Stability Analysis of Cohesion properties of Cooperative Agents with Limited Sensor Capability,” Submitted for publication, 2004.
7.5 CPPS Publications
[CPPS-1] Y. Yang, A. A. Minai, and M. M. Polycarpou, "Decentralized Cooperative Search in UAV's Using Cooperative Learning," Proc. of the 2002 AIAA Guidance, Navigation, and Control Conference, Monterey, CA, August 2002.
[CPPS-2] M. Flint, M. Polycarpou, and E. Fernandez-Gaucherand, "Cooperative Control for Multiple Autonomous UAV's Searching for Targets," Proc. of the 41st IEEE Conference on Decision and Control, Las Vegas, NV, December 10-13, 2002, pp. 2823-2828.
[CPPS-3] Y. Yang, A. A. Minai, and M. M. Polycarpou, "Analysis of Opportunistic Method for Cooperative Search by Mobile Agents," Proc. of the 41st IEEE Conference on Decision and Control, Las Vegas, NV, December 10-13, 2002, pp. 576-577.
[CPPS-4] M. Flint, E. Fernandez-Gaucherand, M. Polycarpou, “Cooperative Control for UAV’s Searching Risky Environment for Targets.” Proc. of the 42nd IEEE Conference on Decision and Control, Maui, HI, December 9-12, 2003, pp. 3567-3572.
7.6 VIA Publications
[VIA-1] R. Penner and E. Steinmetz, “Automated Support for Human Mixed Initiative Decision and Control,” Proc. of the 42nd IEEE Conference on Decision and Control, Maui, HI, December 9-12, 2003, pp. 3549-3554.
[VIA-2] R. Penner and E. Steinmetz, “Implementation of Automated Interaction Design with Collaborative Models.” Interacting with Computers, Vol. 15, Issue 3, 2003, pp. 367-385.
[VIA-3] R. Penner and E. Steinmetz, “Automated Interaction Design for Command and Control of Military Situations.” IUI ’04, Madeira, Funchal, Portugal, January 13-16, 2004, pp. 362-363.