Africa Agriculture Status Report 2014 - Climate … · · 2015-10-20that help smallholders to...
218
Africa Agriculture Status Report 2014 CLIMATE CHANGE AND SMALLHOLDER AGRICULTURE IN SUB-SAHARAN AFRICA
Transcript of Africa Agriculture Status Report 2014 - Climate … · · 2015-10-20that help smallholders to...

Africa Agriculture Status Report 2014 CLIMATE CHANGE AND SMALLHOLDER AGRICULTURE
IN SUB-SAHARAN AFRICA


Africa Agriculture Status Report 2014 | 5
Table of Contents
FOREWORD
PREFACE
ACKNOWLEDGEMENTS
ACRONYMS
INTRODUCTION
CHAPTER I: Smallholder Agriculture and Climate Variability and Change in Sub-Saharan Africa: Looking Forward to 2050
CHAPTER II: Agricultural Land, Water Management and Climate Change in Sub-Saharan
CHAPTER III: Climate-Smart Agriculture for Food Security and Enhanced Resilience
CHAPTER IV: Enabling Adaptation to Climate Variability and Change across Sub-Saharan Africa
CHAPTER V: Knowledge Management Systems and Education for Building Smallholder Resilience to Climate Change
CHAPTER VI: Conclusions and Way Forward
SECTION II: Agriculture Data for Selected Sub-Saharan Countries
6
8
9
11
14
18
52
76
118
162
182
186

6 | Africa Agriculture Status Report 2014
Foreword
Humanity is at an environmental crossroads, and the long-term welfare of literally billions of people is at stake. Climate change has been sneaking up on us for many decades – some say ever since the advent of the Industrial Revolution – but it is only relatively recently that steps began to be taken to confront what I have called a ‘creeping catastrophe’. In 1989, the United Nations established the UN Framework Convention on Climate Change (UNFCCC) and called for global action to reverse the alarming, but at the time, not well-understood climate trends.
The UNFCCC explicitly requested Member States to enact effective environmental legislation, and that new environmental standards and ecosystem management objectives be embraced. Since then, considerable progress has been made, both in terms of our scientific understanding of climate change and its likely impacts, as well as in the willingness of governments to acknowledge and address the challenge.
The Inter-governmental Panel on Climate Change (IPCC) – a scientific body under the auspices of the UN, which assesses scientific evidence contributed to it by thousands of researchers worldwide on the causes and likely implications of climate change – confirms that the phenomenon is a manifestation of human activities on and to our planet, and their impact on the earth’s natural climate. Yes, there are those who still doubt the anthropogenic causes underlying the climate shifts we are beginning to see and experience, but as the evidence mounts and is becoming more overwhelming, their numbers are dwindling fast. And as the IPCC warns, unless humanity acts now to address climate change, its effects may be irreversible.
As is made clear by the contributing authors of this publication, one of the key sectors that is already and will increasingly be affected by climate change is agriculture. This is particularly true for agriculture in developing countries, and especially for countries in sub-Saharan Africa. Rapid and uncertain changes
in rainfall patterns and temperature regimes threaten food production, increase the vulnerability of African smallholder farmers, and can result in food price shocks and increased rural poverty. As noted elsewhere in this publication, agriculture – even the low-input smallholder agriculture of sub-Saharan Africa – is both a ‘victim and a culprit’ relative to climate change.
Although developing countries, especially those in Africa, are likely to bear the brunt of climate change, none of us will be immune to its impacts. It is time we acted together and be reminded that, when it comes to the devastating effects if climate change, we all swim – or sink – together. This is not the time to play the blame game.
While considerable progress is being made on a number of fronts regarding climate change, much more remains to be done. This is a global problem and requires global actions and solutions. As a UN Special Envoy on Climate Change, I advocate for leaders in government, industry, finance and civil society, especially in Africa, to show serious commitment towards addressing climate change and to find ways to adapt to and mitigate its impacts on our people. Climate-related government programs, whether aimed at adaptation or mitigation (or both), should be mainstreamed into national budgets in order to transform growing political will into concrete actions that help smallholders to adapt to and mitigate climate change.
The developed, as well as developing countries alike must live up to their responsibilities in safeguarding our planet. We must all take steps to implement the commitments we have made to reduce greenhouse gas emissions that are harmful to the atmosphere. Developing countries may need to give greater emphasis to adaptation, at least in the near term, while industrialized nations focus more on mitigation measures, but we all have a role to play in meeting this environmental challenge.
Africa Agriculture Status Report 2014 | 7
Foreword
Fortunately, as this publication attests, there are many adaptation and mitigation options at our disposal. We need to be moving towards the widespread adoption of ‘climate-smart’ agricultural technologies and practices – not just in Africa, but globally. If we fail to do so, we risk greater food insecurity, higher food prices and rising poverty, as well as continued ecosystem degradation.
Beyond that, we must move together to address the root causes of climate change. I do not believe that any rational person would choose to live in a world
characterized by ever-higher temperatures, melting polar icecaps, rising sea-levels, the destruction of coral reefs, more intense hurricanes and cyclones, deadly droughts, desertification, and increasingly contaminated rivers and polluted air. After all, such negative consequences of climate change are not selective; they affect everyone, everywhere. We must act swiftly and responsibly, individually and collectively, to ensure a secure future for Africa and for humanity as a whole. The current generation of humanity owes it as a duty to posterity.
John Agyekum Kufuor Former President of the Republic of Ghana and the UN Secretary-General’s Special Envoy on Climate Change

8 | Africa Agriculture Status Report 2014
Preface
In 2004, the African Union adopted the InterAcademy Council report ‘Realizing the Promise and Potential of African Agriculture’ to the then Secretary General of the United Nations, Mr. Kofi Annan. Mr. Annan had asked the IAC to analyze and diagnose the reasons for the absence of a green revolution on a continent so rich in natural and human resources. The diagnosis highlighted more than 20 different impediments and provided a set of recommendations relating to needed improvements in agro-technologies, institutions, markets, policies, farmer organizations and innovative finance.
Many initiatives and activities have been undertaken during the last ten years, among them the creation of AGRA – the Alliance for a Green Revolution in Africa – which until recently was under the chairmanship of Mr. Annan. The programs launched by AGRA focus on strengthening Africa’s seed systems, improving soil health, increasing smallholder access to markets, supporting agricultural policy reform, bolstering institutions, and enhancing the availability of affordable financing.
The efforts of all these programs are oriented towards empowering farmers, strengthening their institutions (such as cooperatives and farmer groups), enlightening financial organizations as to the business opportunities available in the agricultural sector, and creating better enabling environments through policy reform, government investment programs, and enhanced political will. The achievements of AGRA and its many partners are impressive and we are witnessing the start of a green revolution that is well matched to needs and opportunities across Africa. Smallholders are increasing their productivity and strengthening their entrepreneurial capabilities. In many places they are breaking free of hunger and poverty.
There are still considerable differences in progress, both between and within countries, as the circumstances faced by smallholder producers are highly variable. On top of that, the challenges with which smallholders must contend are becoming more difficult. Climate change is now becoming a serious constraint. The challenge of providing food security for a rapidly growing population must be met, and in doing so the role of smallholders – both as contributors to climate change and as victims of it – has to be addressed.
This year the Africa Agriculture Status Report is focused on that enormous challenge. It shows that climate change is already taking place, and it is affecting the growth and potential yields of staple food crops and cropping systems, as well as the volatility and vulnerability of the dominant farming systems.
The role of soil fertility and plant nutrition in strengthening the vigor of farming systems and make them less vulnerable to climate change is explicitly addressed in this Report. In addition, the possibilities and limitations of the various farming systems are illustrated and analyzed. It also highlights the many differences between systems and how they may be improved such that smallholder farmers can both adapt to a changing climate and reduce greenhouse gas emissions.
That is ‘climate-smart agriculture’. There is still much that must be done to upgrade key farming systems, but this Report shows that climate change can be addressed and that food security need not be jeopardized, but rather can be strengthened, by the widespread adoption of new approaches.
Prof. Rudy Rabbinge Wageningen University, The Netherlands

. Box 3.1 Agriculture GHGEmissions: Jane K. Njuguna (AGRA)

10 | Africa Agriculture Status Report 2014
IV. Enabling Adaptation to Climate Variability andChange Across Sub-Saharan Africa
Farming Systems of Sub-Saharan Africa:Paramu L. Mafongoya (University of KwaZulu-Natal), Oluyede C. Ajayi (CTA), Bashir Jama(AGRA), Risper Nyairo (ICRAF), K.C. Chirigo(University of KwaZulu-Natal) and T.R. Musimwa(University of KwaZulu-Natal)
Going Beyond “Demos”: Rebbie Harawa(AGRA), Abed Kiwia (AGRA), Jayne Mugwe(Kenya University), Qureish Noordin (AGRA),David Kimani (AGRA) and Bashir Jama (AGRA).Fast Facts on Fertilizer Markets in Africa: CeciliaKhupe (AFAP)
Seeds Systems: Chikelu Mba (FAO), Jane Ininda(AGRA), Edward Mabaya (Cornell University) andCaroline Mwongera (CIAT)
Output Market Structures: Antony Chapoto(IAPRI)
Land Tenure and Climate Change: EvelynNamubiru-Mwaura (AGRA)
Policy and Governance: Abdulai Jalloh(CORAF), Evelyn Namubiru-Mwaura (AGRA), andRodney Lunduka (CIMMYT)
V. Knowledge Management Systems and Education for Building Smallholder Resilience to Climate Change
Irene Appeaning Addo (University of Ghana), Samuel Nii Ardey Codjoe (University of Ghana), Marie Rarieya (AGRA), Madakadze Rufaro (AGRA), Sebastian Chakeredza (ANAFE), Nancy Sah Akwen (University of Ghana), Mary Njoroge (AGRA), Peter Wachira (Vi Agroforestry), Qureish Noordin (AGRA) and Ijeoma Emenanjo (World Bank)
VI. Conclusions and Way Forward
Ademola Braimoh (World Bank) and David Sarfo Ameyaw (AGRA)
Valuable comments and suggestions were provided by Antony Esilaba (KARI), Augustine Langyintuo (IFC/World Bank Group), Barbara Bamanya (AGRA), Cheryl Palm (Columbia University), Christine Heumesser (World Bank), Eija Pehu (World Bank), Fredrick Ayuke (UON), George Kararach (AFDB), Gina Alvarado (ICRW), Jacinta Kimwaki (AGRA), James Mutegi (IPNI), Jane Mariara (UoN), Joseph Rusike (AGRA), Lynn Brown (World Bank), Manyewu Mutamba (SACAU), Marialena Vyzaki (World Bank), Oladele Oladimeji Idowu (North-West University, Mafikeng Campus), Peter Cooper (CGIAR), Prisca Hazvinei Mugabe (University of Zimbabwe), Richard Jones (AGRA), Ruth Ongang’o (AJFAND), Sepo Hachigonta (National Research Foundation), Silvia Silvestri (ILRI), Steven Were Omamo (AGRA), Terhi Havimo (World Bank). The Report also profited from a Write-shop held on April 10, 2014 in Nairobi, Kenya. All those who were able to attend deserve our appreciation.
The Report benefitted greatly from the insights of the members of the Editorial Board and we are very grateful for their time and effort. We also wish to thank staff from the Ministries of Agriculture, as well as the Central Bureaus of Statistics in Burkina Faso, Burundi, Ethiopia, Ghana, Kenya, Malawi, Mali, Mozambique, Niger, Nigeria, Rwanda, Tanzania, and Uganda for providing the country-specific micro-data included in this Report.
The Global Index was provided by Mark Musumba (Columbia University), Chen Chen (University of Notre Dame) and Jessica Hellmann (University of Notre Dame). Data tables were compiled and prepared by Jane Njuguna (AGRA) and Aboubacar Diaby (AGRA).
Jane Karuku President, AGRA

Africa Agriculture Status Report 2014 | 11
Acronyms
AATF African Agriculture Technological Foundation
ACCI African Center for Crop Improvement
ACMAD African Centre of Meteorological Application for Development
ACPC African Climate P olicy Centre
AfDB African Development Bank
AGRA Alliance for a Green Revolution in Africa
AMCEN African Ministerial Conference on the Environment
AU African Union
AUC African Union Commission
AYI Area Yield Index
AYII Area Yield Index Insurance
CA Conservation Agriculture
CAADP Comprehensive Africa Agriculture Development Program
CAHOSCC Committee of African Heads of State and Government on Climate Change
CARD Centre for Agriculture and Rural Development International
CBSD Cassava Brown Streak Disease
CCAFS Climate Change, Agriculture and Food Security
CCDA Conference on Climate Change and Development in Africa
CCRIF Caribbean Catastrophe Risk Index Insurance F acility
CDC Caisse des Dépôts Climat
CDI Clinton Development Initiative
CGIAR Consultative Group on International Agricultural Research
CIMMYT International Maize and Wheat Improvement Center
CIP International Potato Center
CIRAD Agricultural Research for Development
CLN Corn Lethal Necrosis
CNAAS National Agriculture Insurance Company of Senegal
COMACO Community Markets for Conservation
CSA Climate-Smart Agriculture
CTC Community Trading Centers
DTMA Drought-Tolerant Maize for Africa
EAC East African Community
ECCAS Economic Community of Central African States
ECOWAS Economic Community of West African States
ERPA Emissions Reduction Purc hase Agreement

12 | Africa Agriculture Status Report 2014
FANRPAN Food, Agriculture and Natural Resources P olicy Analysis Network
FAO Food and Agriculture Organization of the United Nations
FARA Forum for Agricultural Researc h in Africa
FARMAF Farm Risk Management for A frica Project
FBO Farmer-Based Organization
GBD Going Beyond Demos
GFCS Global Framework for Climate Services
GHG Green House Gas
GIS Geographic Information System
IBLI Index Based Livestoc k Insurance
ICRISAT International Crops Research Institute for the Semi-Arid-T ropics
IDRC International Development Research Centre
IFPRI International Food Policy Research Institute
IGAD Intergovernmental Authority on Development
IIPACC Innovative Insurance Products for Adaption to Climate Change
IISD International Institute for Sustainable Development
ILRI International Livestock Researc h Institute
IPCC Intergovernmental Panel on Climate Change
ISFM Integrated Soil Fertility Management
ISO International Organization for Standardization
IWMI International Water Management Institute
LEAP Livelihoods Early Assessment and Protection
MCMV Maize Chlorotic Mottle Virus
MFI Microfinance Institutions
MLN Maize Lethal Necrosis
MPCI Multi-Peril Crop Insurance
MSIF Mauritius Sugar Insurance Fund
MT/ha Metric Tons per Hectare
NAIC Nigerian Agricultural Insurance Corporation
NAPA National Adaptation Programme of Action
NDVI Normalized Difference Vegetation Index
NDWI Normalized Difference Water Index
NEPAD New Partnership for A frica’s Development
NERICA New Rice for Africa
NEXTGEN Next Generation Cassava Breeding P roject
PASS Program for Africa’s Seed Systems
PPP Public-Private Partnership
REDD Reducing Emissions from Deforestation
SADC Southern African Development Community
SALM Sustainable Agricultural Land Management
SAR Synthetic Aperture Radar
SARI Selian Agricultural Research Institute
SIDA Swedish International Development Cooperation Agency

Africa Agriculture Status Report 2014 | 13
SMV Sugar Mosaic Virus
SSA Sub-Saharan Africa
TLU Tropical Livestock Unit
TSI Total Sum Insured
UNDP United Nations Development Programme
UNECA United Nations Economic Commission for Africa
UNFCCC United Nations Framework Convention on Climate Change
USAID United States Agency for International Development
WACCI West African Center for Crop Improvement
WII Weather Index Insurance
14 | Africa Agriculture Status Report 2014
IntroductionSmallholder Farmers, Food Security and the Climate Challenge in Sub-Saharan Africa
(4°C or more)

16 | Africa Agriculture Status Report 2014
The good news is that there are interventions applicable to African farming systems that will simultaneously increase yields, increase resilience to climate change, reduce GHG emissions, and increase the stock of carbon in the soil. Climate-smart agriculture (CSA) is an approach for addressing food security challenges under the new realities of climate change. CSA identifies synergies and tradeoffs among food security, adaptation and mitigation as a basis for reorienting agricultural policies and practices in response to climate change. Examples of CSA include improving the efficiency of water and nutrient use, use of diverse varieties and breeds, integrated pest management, integrated crop, livestock and agroforestry system, and improved grassland management. With climate-smart technologies, the threats of climate change to agriculture can be reduced by increasing the adaptive capacity of farmers, increasing resilience and resource use efficiency,
and enhancing the mitigation potential of agricultural landscapes.
Policymakers and development practitioners still see smallholders as the driving force of economic growth and poverty reduction in Africa, and mainstreaming climate change into the agricultural development agenda is a key priority. GDP growth originating in agriculture is 2-4 times more effective in raising the incomes of extremely poor people than is GDP growth originating outside the sector. Smallholder farmers across the continent have begun to embrace climate-smart farming approaches and technologies, but as the impacts of climate change become increasingly evident, they may need to adapt more quickly and more comprehensively. The increased adoption of climate-smart practices by smallholders will require strong public support, along with greater access to improved technologies and local and international markets.
Objectives and Overview of the Report As the second in the series of the African Agriculture Status Report, this volume seeks to provide an in-depth and comprehensive analysis of emerging issues and challenges faced by African smallholder farmers, and allow scholars and professionals to contribute practical and evidence-based solutions. The Report documents the effects of climate change on smallholders in Africa, the ongoing adaptation by farmers and livestock keepers, constraints to adoption of climate-smart technologies, and highlights areas where investments in African agriculture have the potential to be most productive. It seeks to help African agricultural policy makers and stakeholders identify climate change issues and challenges, as well as appropriate climate-smart agriculture practices and policies that can help smallholder farmers sustain and improve their livelihoods – that can increase productivity and incomes, enhance adaptation and build resilience to climate change, and reduce GHG emissions by Africa’s agricultural producers and processors.
The first part of the Report – Chapters 1-6 – focuses on climate variability and change, its impacts on agriculture, the need for adaptation to improve resilience, mitigation issues, and the factors influencing the adoption of climate-smart practices. The second part of the Report is a compilation of micro- and macro-agriculture data tables from selected SSA countries that show trends in agricultural data and climate-related variables.
Chapter 1 of the Report discusses the current status and importance of smallholder farmers to sub-Saharan agricultural productivity, and the significant impact and
implications of climate change for these smallholders. It examines the importance and current variability and risk for smallholder farmers and the need to support them in coping with such risk. There is also a summary projection of climate changes to 2050 for the different regions of SSA and how these changes are likely to impact the suitability of major food staples.
Chapter 2 deals with land and water management practices and their effects on agricultural productivity, profitability and resilience to climate change. Agricultural practices that enhance adaptation to climate change are highlighted, including the policy implications and institutional frameworks needed to support the practices.
Chapter 3 examines climate-smart agriculture in more detail vis-à-vis the triple win of improved productivity, enhanced resilience, and improved GHG mitigation. This chapter stresses the need to recognize that many existing indigenous practices are inherently climate-smart, and support them beyond the dominant top-down technology transfer model that excludes farmers from the development, dissemination, and adoption of improved practices and technologies.
Chapter 4 presents a set of policy-related recommendations aimed at strengthening resilience to climate change. These relate to seed systems, the uptake of environmentally friendly soil management options, and improved access to agricultural input and output markets. Also of crucial importance is genuine reform and implementation of Africa’s land tenure systems, which

Africa Agriculture Status Report 2014 | 17
currently tend to discourage investment by farmers in a host of climate-smart agricultural practices.
In Chapter 5, the role of knowledge management systems and education is examined, along with how they contribute to building smallholder resilience to climate change. The chapter argues for the integration of indigenous and scientific knowledge systems to support sustainable agriculture production. It also stresses the need for co-learning and co-management of knowledge management systems through education and training. This would generate a supportive scientific environment and farmer-led adoption of CSA technologies and practices that build resilience under current and likely future impacts of climate change.
Chapter 6 concludes with a concise summary of solution-oriented recommendations for transforming and reorienting SSA’s agricultural systems to support food security under a changing climate.
The tables in the second part of the report comprise a set of useful African agricultural statistics and data. It is an attempt to create readily available and timely agricultural data to support more effective planning, monitoring and evaluation of agricultural and climate change polices and program results.
While this publication addresses some of the key issues and challenges of climate change and smallholder agriculture in SSA, it is not an exhaustive analysis of all challenges and potential solutions. There is a limit to what a synthesis report of this nature can accommodate. The climate change-agriculture-food security nexus is a vast area, and we encourage more research to inform strategic investments aimed at efficiently and effectively transitioning to climate-resilient agricultural production systems that minimize greenhouse gas emissions and make efficient use of resources among smallholders in sub-Saharan Africa.
ReferencesJones, P.G. & Thornton, P.K. (2008). Croppers to livestock keepers: livelihood transitions to 2050 in Africa due to climate change. Environmental Science & Policy 12(4), 427-437.
Lane, A. & Jarvis, A. (2007). Changes in climate will modify the geography of crop suitability: Agricultural biodiversity can help with adaptation. Journal of the Semi-Arid Tropical Agricultural Research, 4(1)
Sarr, B. (2012). Present and future climate change in the semi-arid region of west Africa: A crucial input for practical adaptation in agriculture. Atmospheric Science Letters 13(2), 108-112. DOI: 10.1002/asl.368.
Thornton, P. & Cramer, L. (Eds.). (2012). Impacts of climate change on the agricultural and aquatic systems and natural resources within the CGIAR’s mandate. CCAFS Working Paper 23. Copenhagen, Denmark: CGIAR Research Program on Climate Change, Agriculture and Food Security. Available at http://cgspace.cgiar.org/handle/10568/21226
Thornton, P.K., Jones, P.G., Ericksen, P.J. & Challinor, A.J. (2011). Agriculture and food systems in sub-Saharan Africa in a 4°C+ world. Philosophical Transactions of the Royal Society A 369, 117-136.
Tubiello, F.N., Salvatore, M., Cóndor Golec, R.D., Ferrara, A., S. Rossi, R., Biancalani, S., Federici, H., Jacobs, A. & Flammini. (2014). Agriculture, forestry and other land use emissions by sources and removals by sinks. FAO Statistics Division Working Paper Series ESS/14- 02. Rome, Italy: FAO, pp.89
U.S. Environmental Protection Agency. (2012). Global Anthropogenic Non-CO2 Greenhouse Gas Emissions: 1990-2030. Washington, D.C.: U.S. Environmental Protection Agency.
World Bank 2013. Turn down the heart: Climate extremes, regional impacts and the case for resilience. Washington, DC.: USA
World Resources Institute. (2014). World resources report 2013-2014: Creating a sustainable food future, Washington, DC.: USA

18 | Africa Agriculture Status Report 2014
Chapter 1 Smallholder Agriculture and Climate Variability and Change in Sub-Saharan Africa: Looking Forward to 2050

Africa Agriculture Status Report 2014 | 19
KEY MESSAGES
Climate change is real, and is already affecting African agriculture. Between 1886 and 2012, global average temperatures have risen by 0.85°C and this is reflected across all regions of SSA; and further increases of about 1.5°C by 2050 are almost certain. Changes in current rainfall patterns are less clear, but consensus projections have all regions becoming wetter, except for southern Africa, where a robust drying trend is anticipated. Increased frequency and severity of extreme climatic events (severe storms, flooding, droughts, etc.) are very likely.
Other important changes are also affecting the agricultural environment and will certainly continue to 2050 unless successfully addressed. For example, declining soil fertility, reduced farm size, and rural to urban migration all present challenges to achieving food security. If SSA is to meet the challenge of feeding an additional 1.6 billion people by 2050, an integrated approach to addressing all changes that have negative impacts in the agricultural environment is essential.
Previous studies, and research undertaken by CCAFS presented in this chapter, have shown that climate change, principally increasing temperatures, will result in reduced yields of all major food staples in SSA, as well as a loss of area that is currently suitable for these crops. It is imperative that smallholder farmers adapt their farming practices to help negate these and other projected negative impacts. A two-pronged adaptation strategy is needed:
• First, and immediately, helping rainfed farmers better cope with current ‘season-to-season’ and ‘within-season’ rainfall variability is essential. Helping farmers cope more effectively with climatic variability is a win-win approach that will not only improve their current levels of production and prosperity, but will also build their livelihood resilience and adaptive capacity for the future.
• Second, in the medium to longer term, farmers will have to proactively adapt their farming practices. Such adaptation is likely to evolve from ‘incremental adaptation’ (for example, changing crop planting dates), through ‘systems adaptation’ (changing choices about crops or livestock), to ‘transformational adaptation’ (possibly seeking alternative livelihoods as agriculture becomes unfeasible).
AGRA is well placed to support such adaptation, directly (in collaboration with its many partners and grantees), and through high-level policy advocacy. Policy makers have an absolutely critical role to play in encouraging adaptation actions. Governments need to:
• Fulfill their investment commitments under the 2003 Maputo Declaration;
• Increase public investment in R&D activities designed to meet the challenges of climate change and adaptation;
• Create policy and regulatory environments that encourage private sector investments in agriculture;
• Adopt a value chain approach in tackling risk management and climate change;
• Expedite the generation and sharing of new scientific knowledge relevant to progressive climate change adaptation and mitigation;
• Facilitate the breeding, testing and release of new and better-adapted crops varieties and livestock breeds; and
• Accelerate development interventions focused on ensuring, not just an adequate supply of calories, but also access to more nutritious crops and diversified diets.
ONE
TWO
THREE
FOUR

20 | Africa Agriculture Status Report 2014
IntroductionThe principal purpose of this chapter is to present and discuss the current and projected impacts of both climate variability and climate change on smallholder agriculture in sub-Saharan Africa (SSA), with a specific focus on rainfed farming systems.
We start by summarizing the current status and importance of smallholder agriculture and why, because of the potential that smallholder agriculture holds, policy makers should do more to ensure that governments meet the investment commitments made in the 2003 Maputo Declaration.
We then turn to a much more detailed presentation of significant changes in climate that have already been observed and discussed in the latest IPCC Assessment Report (Stocker et al., 2013). However, other important changes in the agricultural environment have also taken place during the last 40 years and are ongoing. We discuss some of the most important of these changes that, together with climate change, will also almost certainly continue to 2050 unless they are successfully addressed along with
climate change using an integrated approach.
From there, we turn to the principal purpose of this chapter – discussing the implications of climate variability and change for smallholder farmers. We examine the importance of current climate variability and rainfall-induced risk for smallholder farmers and explain why helping them better cope with such risk is an important part of a two-pronged approach to enable them to adapt to future climate change.
That is followed by a summary of projected climate changes to 2050 for the different regions of SSA and how these projected changes are likely to impact the climatic suitability of major food staples.
Given that climate change is already affecting smallholder farming and that it will inevitably have progressively more severe impacts in the future, adaptation to these changes has become an urgent imperative. We thus present what we believe are priority adaptation actions in the agriculture and food sectors of SSA.
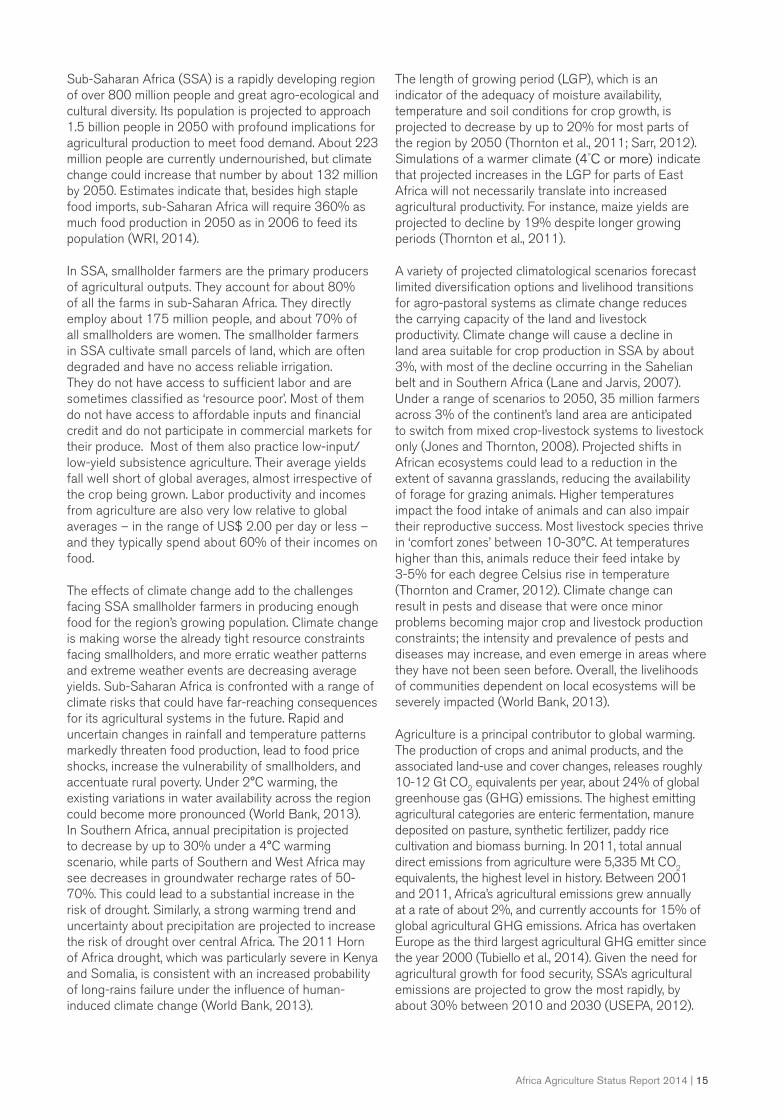
Current Status and Importance of Smallholder AgricultureAgriculture is the main industry in SSA, employing 65% of Africa’s labor force and accounting for about a third of its gross domestic product (World Bank, 2008). If we describe smallholder farmers as those with 2 hectares or less, they represent 80% of all SSA farms and contribute up to 90% of the production in some SSA countries (Wiggins, 2009; Wiggins and Sharada, 2013). In Botswana, for example, 76% of the population depends on subsistence agriculture; in Kenya, 85%; in Malawi, 90%; and in Zimbabwe, 70-80% (Rockström, 1999; Ngigi, 2011).
Smallholders provide about 80% of the food supply in Africa. Agricultural labor productivity remains low in SSA; calculations using data since 2008 indicate that the average value added per worker for 34 SSA countries is US$ 318, compared to a world average of US$ 1,000 for the same period. The low productivity of agriculture translates to less than US$ 1 per day, a key factor affecting rural poverty (Rosen and Shapouri, 2012). The proportion of the poor in SSA is 53% with the proportion of undernourished1 at 30% in 2010, making it the highest in any region.
The main characteristics of production systems of smallholder farmers include: small-scale holdings (< 2 hectares); simple, rudimentary technologies; low returns; and high seasonal labor fluctuations, with women playing a vital role in production. Smallholder farmers differ in individual characteristics, farm size, resource distribution between food and cash crops, livestock and off-farm activities, their use of external inputs and hired labor, the proportion of food crops sold, and household expenditure patterns.
Most SSA smallholders combine crop farming with livestock (PPLIPI, 2005). Livestock production contributes to poverty reduction in various ways. It can increase local food supplies, serve as a source of income and a means for capital accumulation, generate employment, and supply inputs and services for growing crops. Livestock and livestock products are the most important source of cash income in many smallholder mixed-farming systems in SSA. In mixed-farming systems, livestock reduce the risks resulting from seasonal crop failures, as they add to the diversification of production and income sources (Sansoucy et al.,
1. ‘Undernourished’ is defined as people whose dietary energy consumption is continuously below a minimum dietary energy requirement to maintain a healthy life and carry out light physical activity.
Africa Agriculture Status Report 2014 | 21
1995). Livestock also play a critical role in the process of the agricultural intensification by providing draft power and manure.
In SSA countries, crop yield levels remain low compared to other regions of the world [Chauvin et al., 2012 (Figure 1.1)]. According to the World Bank (2007), an average SSA farmer produces only one ton of cereal per hectare – less than half of what an Indian farmer produces, less than a fourth of a Chinese farmer’s production, and less than a fifth of an American farmer’s output. In common with rainfed agriculture across the world, productivity of SSA agriculture depends on climate; efficient and effective use of the factors of production (farmland, water and labor); agricultural inputs (fertilizers, irrigation, seeds and capital
equipment); and farmers’ skills. The region’s agriculture involves diverse crops (Table/Map 1.1) and livestock, but productivity is particularly important for cereals and starchy roots, which provide two-thirds of the total energy intake for the population (Diao et al., 2012).
African agricultural production is also vulnerable to climate change due to its dependence on rainfed agriculture (IFAD, 2011; Rockström, 2003). About 90% of the SSA population depends on rainfed agriculture for food production (FAO, 2006). This means that most African small-scale farmers plan agricultural production based on rainfall, anticipating both good and bad. Inadequacy/uneven distribution of rainfall, exacerbated by climate change and already being experienced across the region, is a threat to the system.
Figure 1.1 Cereal yields by region in major food-deficit countries
0.001990
TON
S/H
EC
TAR
E
1992 1994 1996 1998 2000 2002 2004 2006 2008 2010
0.50
1.00
1.50
2.00
2.50
3.00
3.50
North Africa
Latin America and the Caribbean
Asia
Sub-Saharan Africa
Note: Average cereal yields for the 77 low-income food deficit countries included in the ERS International Food Security Assessment, categorized by region.
Source: ERS (2013). USDA, Economic Research Service using data from United Nations, Food and Agriculture Organization.
Table/Map 1.1 Major crops in selected SSA countries
Source: AGRA, 2013.
Burkina FasoSorghum, Millet, Maize, Rice, Cowpea, Soybeans,
Groundnuts
NigerMillet, Sorghum, Cassava, Maize, Cowpea, Groundnuts
NigeriaMaize, Rice, Sorghum, Millet, Cassava, Yam, Groundnuts, Soybeans, Cowpea
RwandaSorghum, Potatoes, Maize, Beans, Wheat, Soy beans
Sierra LeoneRice, Cassava, Yams, Groundnuts, Maize
UgandaBanana, Cassava, Potatoes, Maize, Millet, Rice, Sorghum, Beans
TanzaniaMaize, Rice , Wheat, Cassava, , Beans, Sorghum, Pigeon Peas
ZambiaMaize, Sorghum, Rice, Groundnuts, Beans, Pigeon Peas
EthiopiaTeff, Maize, Wheat, Barley, Sorghum, Millet, Oats
GhanaRice, Cassava, Maize, Sorghum, Cassava, Sweet
Potatoes
KenyaMaize, Wheat, Rice, Beans, Sorghum, Cassava, Sweet Potatoes, Millet, Cowpea, Chick Peas, Pigeon
LiberiaRice, Cassava, Yams, Maize
MaliMillet, Rice, Maize, Sorghum, Cowpea, Soybeans,
Ground nuts
MozambiqueCassava, Maize, Groundnuts, Sweet Potatoes, Soybeans
MalawiMaize, Beans, Potatoes, Cassava, Sorghum, Pigeon Pea

22 | Africa Agriculture Status Report 2014
Some recent indications of climate change in SSAIn 2013, the African continent experienced an overall hot year, the second warmest on record behind 2010. The temperature in Vioolsdrif, South Africa, for example, soared to 47.3°C on March 4 – the hottest March temperature ever measured in Africa. In West Africa, the temperature in Navrongo, Ghana, reached 43°C on March 6, the warmest temperature ever measured in Ghana.
A decline in precipitation has been observed In West Africa since the end of the 1960s, ranging from 20-40% between the period of 1931-1960 and 1968-1990 (IPCC, 2007; Sissoko et al., 2010). However, in a recent study, Fabusoro et al. (2014) found that in the subhumid parts of Nigeria the mean monthly rainfall has been increasing by 65 mm/month/decade from 1982 to 2010 (see figure below). The study found, not surprisingly, that among small-scale farmers, rainfall is the most important climatic factor critical to their survival, particularly for their crop growth and livestock herds. A period of low rainfall means a period of scarcity of both feed and water, and increased grazing distances for pastoralists. The study also found that the pattern of rainfall and temperature in the study area appeared to be going in the same general direction, with temperature rising at about 0.4oC/month/decade in southwest Nigeria (see Figure).
Evidence of progressive warming from the 1980s to the 2000s is obvious across most of the stations observed. As temperatures rise, rainfall patterns change and variability increases; farmers may need to grow different crops, plant at different times, use different inputs, raise different animals, and be ready for ongoing changes (Nelson et al., 2014). The absence of a highly significant reduction in mean annual rainfall does not imply a lesser probability of occurrence of drought. The indirect effects of climate change are seen more on the socioeconomic impacts, which
Trend of mean monthly rainfall in the Ogun-Oyo region in Nigeria from 1982 to 2010
0
20
40
60
80
100
120
19
82
19
84
19
86
19
88
19
90
19
92
19
94
19
96
19
98
20
00
20
02
20
04
20
06
20
08
20
10
y=0.653x + 88.33 R2=0.329
Source: Fabusoro et al., 2014
LT_ave_rain
Linear (LT_ave_rain)
23 | Africa Agriculture Status Report 2014
are the outcomes of the direct impact. These outcomes are evident on household income/savings, cost of food, poverty level, health and welfare issues, gender disparity, conflict over natural resource use, and social inequality, among others. The channels through which climate change affect smallholder farming systems in Africa indirectly are through savings, technology transfer, economic uncertainty and productivity of capital input needed in agriculture among others.
Source: E. Fabusoro, W. Asante and S.N. Ali 2014
Trend in mean monthly maximum temperature for the Ogun-Oyo region of Nigeria, from 1982 to 2010
30.0
19
82
19
83
19
84
19
85
19
86
19
87
19
88
19
89
19
90
19
91
19
92
19
93
19
94
19
95
19
96
19
97
19
98
19
99
20
00
20
01
20
02
20
03
20
04
20
05
20
06
20
07
20
08
20
09
20
10
TEM
PE
RAT
UR
E (°
C)
30.5
31.0
31.5
32.0
32.5
33.0
33.5
34.0
y=0.044x + 31.79
34.5
Source: Fabusoro et al., 2014

24 | Africa Agriculture Status Report 2014
Potential for agricultural growthBefore delving more deeply into the already observed effects of climate change, as well as projected future changes, we want to note that despite climate change and its associated effects, African agriculture has enormous potential for growth. This stems from the continent’s abundant natural resources, particularly land, and the large yield gap that countries can explore to increase food security and reduce poverty. SSA has the highest proportion of rural poor and the greatest potential for smallholder agriculture-led poverty reduction. Christiaensen, Demery and Kuhl (2011) indicate that a 1% increase in agricultural per capita GDP reduced the poverty gap five times more than a 1% increase in GDP per capita in other sectors, mainly among the poorest people. Agriculture employs a large number of people in SSA and increasing productivity is essential to reducing poverty and food insecurity.
This agricultural potential has made investment in agriculture the backbone of overall growth and development for a majority of the countries in the region, and the key for poverty reduction and food security. SSA countries invest, on average, 5-7% of
public expenditure in agriculture, compared to 8-10% in Asia (RESAKSS, 2010). In the 2003 Maputo Declaration, African Heads of State committed to increasing expenditures on agriculture to10% of the national budget, yet only 8 countries had reached or surpassed that goal by mid-2010 (Diao et al., 2012).
There is an urgent need for SSA policy makers and international institutions to give primary attention to the plight of smallholder farmers in order to sustainably reduce poverty and improve food security. Rainfed agricultural production in the region is still highly volatile and only the inter-seasonal and inter-annual management of water offers a means of buffering regional production shortfalls. In practical terms, policy makers and water managers concentrate more on clean water supply projects, which account for a very low percentage of basic human water requirements, and on large-scale irrigation, which accounts for 70-80% of the world’s developed freshwater resources (Savenije, 1998). Yet while dry spells are the main reason for crop failures, relatively little attention is dedicated to mitigating their effects.
Already Observed Effects of Climate ChangeIt is now beyond reasonable doubt that the emissions of greenhouse gases (GHGs) resulting from many sectors of human activity are causing the world to warm at an unprecedented rate. This in turn will surely have long-term effects not only on rainfall amounts and distribution patterns, but also on all components of the climate system. Such changes in the climate system are already happening and have been reported at the global level in the recently released 5th Assessment Report (AR5) of the IPCC (Stocker et al., 2013).
We summarize some key observations of relevance to SSA below. Inevitably, there are uncertainties involved in both analyzing past evidence of climate change as well as in projecting future climates. In AR5, IPCC describes how it determines the level of these uncertainties (see Box 1.1) and in subsequent discussions, where appropriate, we use the same convention as the IPCC and provide in italics the designated expression of uncertainty associated with observations and projections.
Box 1.1 Describing uncertainty of current observations and future projections; from the Fifth Assessment Report (AR5) of the Intergovernmental Panel on Climate ChangeAs in previous IPCC Assessment Reports, there are varying degrees of uncertainty associated with current observations of climate change, depending on the quality of evidence available. This is also true for projections of future climate change. Added uncertainty comes from:
1. Natural internal variability of the climate system: This arises from such factors as variations in the large-scale ocean circulation, El Niño-Southern Oscillation, and changes in the ocean heat content. These are natural processes within the climate system.

Africa Agriculture Status Report 2014 | 25
2. Model uncertainty: Climate scientists use models to project plausible future climate scenarios. However, even though such models are continually being improved, knowledge about the processes that govern climate systems is still limited; inadequate computing resources also contribute to this uncertainty.
3. Future global development uncertainty: While the Representative Concentration Pathways (RCPs) used in AR5 chart specific futures in GHG and aerosol concentrations, there remains considerable uncertainty as to which RCP best represents future world development and hence GHG emissions.
The IPCC’s AR5 uses the following terms to communicate the degree of certainty associated with current observations and future projections:
• The degree of certainty of each key finding is based on the amount, type, quality and consistency of the evidence, and is described as limited, medium or robust.
• The degree of agreement between the various sources of evidence is described as low, medium or high.
• The level of confidence in the validity of a finding is a synthesis of the ‘degree of certainty’ and ‘agreement’, and is described as very low, low, medium, high and very high.
• The likelihood of an event having occurred or, more importantly, occurring in the future is described quantitatively using the following terms: virtually certain (99-100% probability), very likely (90-100%), likely (66-100%), about as likely as not (33-66%), unlikely (0-33%), very unlikely (0-10%), and exceptionally unlikely (0-1%). Unless otherwise stated, findings assigned a likelihood term are associated with high or very high confidence in the validity of the finding.
Source: IPCC, 2013.
2. CO2e (carbon dioxide equivalent) is defined as the concentration of carbon dioxide that would cause the same amount of radiative forcing as a given mixture of carbon dioxide and other greenhouse gases (IPCC Glossary of Terms)
Observed changes in atmospheric carbon dioxide and other GHGsOver and above their direct effect on global warming, consideration of the levels of GHGs in the atmosphere are important for agriculture for three reasons. First, GHG emissions from agriculture itself are estimated to account for between 10-12% of the total global anthropogenic emissions, or around 6.1 Gigatons of carbon dioxide equivalent (GtCO2e) per annum.2 Of the GHGs emitted by agriculture, the non-CO2 gases, notably nitrous oxide (N2O) and methane (CH4), are by far the most important; the agricultural sector accounts for 84% of the global N2O emissions and 54% of the global CH4 emissions (Verchot, 2007; IPCC, 2014).
Second, there is considerable potential for the agricultural sector to mitigate the levels of GHG emissions, either through the sequestering of carbon dioxide or through reducing the emissions of methane and nitrous oxide. For example, Smith et al. (2008) estimated the global ‘technical mitigation potential’ within agriculture (excluding associated land use change) as between 5.5 and 6.0 GtCO2e per annum,
with the greatest technical potential for climate change mitigation lying in increasing soil carbon.
Third, the negative impacts of increased levels of carbon dioxide are to some extent offset by the ‘CO2-fertilizer effect’, whereby higher levels of CO2 fertilizer use lead to greater photosynthetic rates and enhanced dry matter accumulation by both trees and crops (Taub, 2010; Stocker et al., 2013). However, increases in atmospheric CO2 have also been shown to negatively affect the nutritional quality of food crops. If plants absorb the same amount of a mineral nutrient (such as iron and zinc), but produce more biomass because of rising CO2 levels, then the concentration of the nutrient in the edible parts of the plant will decrease (Dwivedi et al., 2013). As a result, people will need to consume more of the plant food to ingest the same amount of these nutrients. For many smallholder farmers and their families, this may well not be possible and would intensify the already acute problem of micronutrient malnutrition in SSA.

26 | Africa Agriculture Status Report 2014
Water productivity and climate changeAfrica’s vulnerability to climate change is exacerbated by poorly developed infrastructure and policies related to water and land (IPCC SPM, 2007). In some parts of sub-Saharan Africa, especially the semiarid areas, rainfall is already unreliable, causing severe impacts on crop production (Kurukulasuriya et al., 2003). In other areas, such as in East Africa and the Ethiopian highlands, rainfall and runoff are expected to increase with climate change, and more extensive and severe flooding is anticipated (FAO, 2010).
Water productivity in African agriculture will be affected by climate change as more active storm systems emerge, especially in the tropics. Greater variability in rainfall is expected, which will increase the risks of dryland farming. The demand for irrigation will grow (in terms of area) and irrigation water use on existing crop areas will increase due to greater evaporative demand. The water resources available for irrigation will become more variable, and could decline in areas with low rainfall.
Estimates of the additional water required to meet future demand for agricultural production under climate change vary widely, from 40-100% (FAO, 2010), even as water productivity is likely to decline. Climate change is expected to result in:
• Excessive surface runoff, due to the sheer intensity of storms and the inability of soils in many areas to absorb extreme rainfall due to poor water infiltration characteristics;
• Poor groundwater recharge, especially in arid and semiarid areas where rainfall will decrease and become more variable;
• Increases in salinity in agricultural fields, especially those under irrigation, emanating from sea level intrusion and/or depletion of ground water levels;
• Crop failures caused by irregular rainfall and seasonal shocks (i.e., losses from floods and extended dry spells); and
• Farming systems moving progressively towards the margins – semiarid croplands may become rangelands; humid, seasonally dry lands may take on a more semiarid nature; and semiarid zones may turn to deserts.
As the reliability of water for agriculture decreases and supplies become more variable within seasons, there are questions as to the extent to which irrigation can be maintained, intensified or expanded without compromising ecosystem services. Strategies to maintain and/or increase water productivity are discussed in Chapter 2.
Source: B.M. Mati (JKUAT), 2014

Africa Agriculture Status Report 2014 | 27
As a result of anthropogenic emissions, the atmospheric concentrations of the GHGs carbon dioxide (CO2), methane (CH4), and nitrous oxide (N2O) have all increased since 1750. In 2011 the concentrations of these gases were 391 parts per million (ppm), 1,803 parts per billion (ppb), and 324 ppb, and exceeded pre-industrial levels by about 40%, 150%, and 20%, respectively. GHG concentrations now substantially
exceed the highest concentrations recorded in ice cores dating back over the past 800,000 years, and the mean rates of increase in atmospheric concentrations over the past century are, with very high confidence, unprecedented in the last 22,000 years (Stocker et al., 2013). Since 1960, CO2 levels have continued to rise steadily and almost linearly at a rate of 1.5 ppm/year; in May 2013 the level reached 400 ppm.
Observed changes in temperatures, precipitation and extreme eventsWarming of the climate system is unequivocal and, since the 1950s, many of the observed changes are unprecedented over decades to millennia. The atmosphere and the ocean have both warmed, the amounts of snow and ice have diminished, and the sea level has risen. Each of the last three decades has been successively warmer at the Earth’s surface than in any preceding decade since 1850. Over the longest period during which calculation of regional trends is sufficiently complete (1901–2012), all SSA regions have experienced surface warming.
Confidence in precipitation change since 1901, averaged over global land areas, is low prior to 1951 and medium afterwards. Averaged over the mid-latitude land areas of the Northern Hemisphere, precipitation has increased since 1901 (medium confidence before and high confidence after 1951). For other latitudes, including SSA, area-averaged long-term positive or negative trends in rainfall amounts, as yet, have low
confidence. In SSA, this is in part due to the fact that most areas of the African continent lack sufficient observational data to draw conclusions about trends in annual precipitation over the past century.
Changes in many extreme weather and climate events have been observed since about 1950. For instance, it is very likely that the number of cold days and nights has decreased and the number of warm days and nights has increased on a global scale. It is likely that the frequency of heat waves has increased in large parts of Europe, Asia and Australia. There are likely more land regions where the number of heavy precipitation events has increased than where it has decreased. The frequency or intensity of heavy precipitation events has likely increased in North America and Europe. On other continents, including SSA, confidence in changes in heavy precipitation events is at most medium (Stocker et al., 2013).
Rainfed Agriculture and Smallholder Farming in Sub-Saharan AfricaA great deal has been written about the importance and the diversity of smallholder farming systems in SSA, or indeed the associated constraints and opportunities that they face in the 21st century (see, for example, Jayne et al., 2010; Livingston et al., 2011; AGRA, 2013; Collier and Dercon, 2013).
However, to set the scene we provide a summary overview of some key characteristics of the agro-ecological zones in SSA and the farming systems that have evolved in each zone (see Table 1.2 and the following section).
In addition, as we look forward 40 years, we also highlight some of the major changes that have occurred in the agricultural sector in SSA during the past 40 years (Table 1.4), accepting that such a broad overview will inevitably mask important differences both between and within countries (AGRA, 2013). Nevertheless, such changes are indicative of ongoing and overarching trends of the last 40 years that, in addition to climate change, will almost certainly continue to 2050, unless successfully addressed. These changes are important and will need to be addressed in an integrated approach together with that of changing climates. Furthermore, in

28 | Africa Agriculture Status Report 2014
many instances climate change will potentially further exacerbate the negative implications that these changes have for smallholder farmers.
Agro-ecological zones Agro-ecological zones (AEZs) are climate-based and their delineation will therefore be affected by climate change. They are classified according to the average
length of growing period (LGP), which is defined as ‘the period (in days) during a year when precipitation exceeds half the potential evapotranspiration’ (defined as the sum of direct evaporation from the soil surface and transpiration from plants). LGP can also be used as a proxy for the number of grazing days of naturally regenerating pastures. As such, AEZs are a very useful basis for determining the general suitability and production potential of crops and livestock in any given area and, as would be expected, are reflected by the broadly defined rainfed farming systems that have evolved over the years (Table 1.2).
Table 1.2 Agro-ecological zones in SSA and their characteristics
ZONELGP (DAYS)1
AVERAGE RAINFALL (MM)1
LAND AREA (% OF SSA)2
% OF RURAL POPULATION IN SSA2
PRINCIPAL AGRICULTURAL PRODUCTS BY FARMING SYSTEM3
Arid < 90 < 200 37.3 5.3 (4) Pastoral: Cattle, camels, sheep, goats
Agro-pastoral: Sorghum, millet: with pulses, sesame, cattle, sheep, camels, goats, poultrySemiarid 90-179 < 90 18.1 27.0 (38)
Subhumid 180-269 800-1500 21.7 20.3 (24)
Mixed cereal/root crop: Maize, sorghum, millet, cassava: with yams, legumes, tobacco, cotton. Cattle
Mixed maize: Maize, with tobacco, cotton, cattle, goats and poultry.
Humid > 270 > 1500 18.5 28.0 (39)
Tree crop: Cocoa, coffee, oil palm, rubber, with yams and maize.
Forest-based: Cassava, with maize, sorghum, beans and cocoyam.
Highlands4 180 – > 270
n.a. 4.4 19.4 (112)
Highland Perennial: Banana, plantain, enset, coffee, with cassava, sweet potato, beans, cereals. Cattle
Highland Temperate: Wheat, barley, with peas, lentils, broad beans, rape, teff and potatoes. Cattle
1. Source: Bationo et al. (2006). 2. Source: Nkonya et al. (2011). (Note: Rural population of SSA in 2011 was 576 million: Figures in parentheses are rural population densities as people/km2.) 3. Source: Dixon et al. (2001). [Note: Major farm products in bold]. 4. Defined as areas within the semiarid, subhumid and humid zones where the mean daily temperature during the growing period is less than 20°C.
However, the World Meteorological Organization defines ‘climate’ as ‘the statistical description in terms of means and variability of key weather parameters for a given area over a period of time – usually at least 30 years. For agriculture, both the mean of the weather parameter and the variability associated with that mean are important to farmers, especially for those smallholder farmers in SSA who depend on rainfed farming. AEZs, however, are based on mean climate variables and while the season-to-season variability of temperature is usually low, this is not the case with rainfall, for which variability is substantial. Examination of long-term rainfall
records indicates that the inherent variability in seasonal rainfall totals, as expressed by the coefficient of variation (CV), increases disproportionally as one moves from humid and subhumid agro-ecological zones to the drier semiarid and arid zones (Table 1.3).
For rainfed farmers, both ‘between seasons’ and ‘within season’ variability of rainfall are the dominant factors in determining the seasonal outcome of cropping and livestock enterprises. We discuss the importance of such rainfall variability and the resultant climate-induced risks that farmers face in more detail later in this chapter.

Africa Agriculture Status Report 2014 | 29
Table 1.3 Annual rainfall totals (mm) from historical weather data at selected locations in different agro-ecological zones (AEZ) in sub-Saharan Africa. (Stern and Gathenya, Pers. comm.)
ZONE LOCATION PERIOD AEZ
ANNUAL RAINFALL TOTALS (MM)
CV (%)
DATA SOURCE1
MIN QUARTILES Max25 50 75
Botswana Francistown 1961-2000 Semiarid 116 362 467 605 912 32 BDMS
Tanzania Dodoma 1935-2012 Semiarid 283 487 569 650 1083 25 TMA
Zimbabwe Bulawayo 1951-2010 Semiarid 198 483 588 739 1014 29 ZMSD
Kenya Katumani 1961-2012 Semiarid 334 523 654 811 1262 29 KMD
Sudan Rashad 1951-2009 Semiarid 456 618 691 783 1042 18 SMA
Malawi Chitedze 1950-2008 Subhumid 398 791 889 1007 1259 19 MMS
Rwanda Kigali 1971-2012 Subhumid 687 858 1000 1073 1357 16 RMA
Nigeria Samaru 1928-1983 Subhumid 608 939 1057 1188 1482 17 NMA
Ghana Axim 1960-2012 Humid 1169 1743 1956 2317 3332 23 GMA
Kenya Kericho 1950-2000 Highlands 1479 1889 2129 2393 2723 16 WARMA 1. Botswana Dept. Met. Services (BDMS); Kenya Met Dept. (KMD); Tanzanian Met. Agency (TMA); Zimbabwe Met. Services Dept. (ZMSD); Sudan Met. Authority (SMA); Malawi Met. Services (MMS); Rwanda Met. Agency (RMA); Nigerian Met. Agency (NMA); Ghana Met. Agency (GMA); Water Resources Management Authority (WARMA).
Human and livestock populations and urbanization Over the last 40 years, the human population of SSA has tripled, rising from 279 to 826 million. This is reflected in both rural and urban populations, the latter having grown at a faster rate, largely due to rural/urban migration, although part of this rapid rate of urbanization can also be attributed to the expansion and reclassification of urban boundaries (Djurfeldt and Jirström, 2013). As a result, the percent population living in urban centers has risen from 20 to 36% (Table 1.4). This trend is projected to continue and by 2050 about 50% of SSA’s population will be living in towns and cities. In situations where smallholder farmers experience greater or more frequent hardship due to climate change, rural-urban migration is likely to be further exacerbated. For example, Marchioroi et al. (2012) show how weather anomalies induce rural/urban migration that subsequently triggers international migration and, based on medium UN population and IPCC climate change projections, estimate that future weather anomalies will lead to an additional annual displacement of 11.8 million people in SSA by the end of the 21st century. At the same time, in the coming
40 years it is projected that the population will triple again, rising to nearly 2.4 billion (Haub and Kaneda, 2013). Livestock numbers (cattle, sheep and goats and camels) have also more than doubled, rising from 342 to 719 million and, as a result, total meat production on a per capita basis has remained the same. Milk production per capita has however declined. Such large increases in human and livestock populations have resulted in substantial secondary trends in land use, crop production and natural resources.
Land use and crop production Between 1970 and 2010, the area of cultivated arable land has expanded from 132 to 184 million hectares. Areas with permanent crops have risen from 14 to 23 million hectares (Table 1.4). This expansion of arable land is reflected in the area harvested of the major food staples of maize (17 to 31 million hectares), sorghum (13 to 19 million hectares), rice (3 to 9 million hectares) and cassava (6 to 13 million hectares). Irrigated agriculture has also expanded from 2.4 to 5.3 million hectares, but as a percentage of total land use remains very low compared to other developing regions.

30 | Africa Agriculture Status Report 2014
Over the last 40 years, modest yield increases of staple crop have also occurred (maize 1.1 to 1.8; sorghum 0.7 to 1.0; rice 1.4 to 2.1; and cassava 6.3 to 10.3 tons/ha), but yields in general are still well below the potential that could be achieved, largely due to the low adoption of recommended improved production practices and the constraints faced by risk-averse farmers resulting from highly variable rainfall, which we discuss in more detail below. However, when these modest yield increases are combined with increased harvested area, total staple food production (maize + sorghum + rice + cassava) has risen impressively, from 71 to 232 million tons year and, with the exception of sorghum, has kept pace with or exceeded population growth on a per capita production basis (Table 1.4). Even so, in the 2010-2012 period, 26% of the population of SSA remained undernourished (IFAD et al., 2012).
While increasing food production through the further expansion of agricultural land remains possible in some countries, in many it does not. The challenge of meeting ever-increasing demand for food arising from human population growth, coupled with the projected negative impacts of increasing temperatures and rainfall changes on crop production, remains an urgent priority.
Farm size Despite the increased amount of land area harvested, the arable land on a rural per capita basis has declined from 0.59 hectares per rural person to 0.35 (Table 1.4). This is reflected by a steady decrease in farm size over the last 40 years (Eastwood et al., 2006). In the 1990s, average farm size in SSA was 2.4 hectares, and 80%
of smallholdings were already less than 2 hectares (Nagayets, 2005). More recently, from a study of 100 villages in eight SSA countries, Jirström et al. (2011) found that average farm size had decreased further, from 2.42 hectares in 2002 to 2.16 by 2008.
Over the past decade, the decline in farm size has led to a debate about the future of small farms in SSA, with some fearing that shrinking farm size may result in a poverty trap for smallholders who end up cultivating tiny parcels of land (e.g., Harris and Orr, 2014). Others continue to support strategies that promote productivity growth and commercialization in African smallholder agriculture (e.g., Jayne et al., 2010). Djurfeldt and Jirström (2013) recently reviewed this debate in the context of ongoing urbanization and shifts in dietary preferences. They conclude that access to urban markets is crucial and that “encouraging high value, intensive agriculture in dynamic, well-connected, densely populated settings makes sense”.
However, more than 130 million people live more than 5 hours from a market town of 5,000 people or more (Livingston et al., 2011), and such remote rural communities are likely to be untouched by urbanization. For such communities, Djurfeldt and Jirström (2013) conclude that policy solutions “must rest primarily on basic measures to improve food security through raising yields of staple crops and drought-resistant varieties, rather than primarily meeting potential urban demand”. However, such remote communities are very often in arid and semiarid areas and are therefore those most susceptible to climate hazards, while also being the most difficult to reach with policy innovations and agricultural advice. With continuing decline in farm size and progressive climate change, the latter strategy suggested by Djurfeldt and Jirström will prove challenging to implement.
Table 1.4 Summary agricultural statistics and trends in sub-Saharan Africa from the 1970s to the 2010s ITEM PARAMETER AND UNITS
5-YEAR MEAN 1968-1972
5-YEAR MEAN 2008-2012
CHANGE (%)
HUMAN POPULATION
Total
Rural
Urban
Urbanization
Millions
Millions
Millions
Urban as % of total
278.7
223.9
54.8
19.7
826.4
525.5
300.9
36.4
+197
+135
+449
+85
LIVESTOCK
Cattle
Sheep and Goats
Camels
Population (millions)
Population (millions)
Population (millions)
128.0
205.6
8.8
234.4
468.0
16.9
+83
+128
+92
Total milk Production (Million tons) 9.7 24.3 +151

Africa Agriculture Status Report 2014 | 31
ITEM PARAMETER AND UNITS5-YEAR MEAN 1968-1972
5-YEAR MEAN 2008-2012
CHANGE (%)
Total meat Production (Million tons) 3.9 11.2 +187
AGRICULTURAL LAND
Arable land
Permanent crops
Permanent grasslands
Irrigated land
Area (million ha)
Area (million ha)
Area (million ha)
Area (million ha)
132.2
13.6
713.2
2.4
184.3
23.1
723.5
5.3
+39
+70
+1
+121
INPUT USE
Fertilizer use Consumption (1;000 tons)
Kg fertilizer/ha arable land
982
7.4
2,0991
12.91
+116 +74
STAPLE FOOD CROPS
Maize Production (million tons)
Area harvested (million ha)
18.9
16.6
56.7
31.1
+200
+87
Sorghum Production (million tons)
Area harvested (million ha)
8.5
12.8
20.1
19.4
+136
+52
Rice Production (million tons)
Area harvested (million ha)
4.6
3.3
19.9
9.4
+332
+185
Cassava Production (million tons)
Area harvested (million ha)
38.9
6.4
135.2
13.3
+247
+108
PER CAPITA STATISTICS
Arable land Hectares/rural person 0.59 0.35 - 41
Staple crop production
Kg/person 254 280 +10
Milk production Kg/person 35 29 - 17
Meat Production Kg/person 14 14 0
1 Fertilizer consumption and ‘kg fertilizer/ ha’ refer to the period 2001 / 2002 beyond which comparable data are not available in FAOSTAT.
Source: FAO, 2014
Soil healthMore than 20 years ago, Stoorvogel et al. (1993) drew attention to the alarming rate of nutrient depletion in SSA soils, due to the negative balance of nutrient loss through crop off-take, nutrient leaching, and soil erosion, relative to a very low level of nutrient replacement through the application of organic and inorganic fertilizers. While inorganic fertilizer use has shown some growth, the average fertilizer use per hectare of arable land has remained very low compared with other developing regions (Table 1.4), and today some 80% of the total arable land in SSA has serious soil fertility and/or physical soil problems. Farmers are still losing 8
million tons of soil nutrients each year, estimated to be worth US$ 4 billion year (Sanchez and Swaminathan, 2005; Toenniessen, et al., 2008; AGRA, 2013).
The problems that smallholder rainfed farmers face regarding fertilizer cost, access, and availability are well understood by governments and the development community, and several countries are having some success in providing subsidies that encourage the use of improved seed and fertilizer. Malawi provides a successful and well-documented example (Denning et al., 2009). In addition, a wide range of Integrated Soil Fertility Management (IFSM) approaches have been advocated and piloted, but few have yet been successfully brought to scale. IFSM lies at the heart of AGRA’s strategy for

32 | Africa Agriculture Status Report 2014
smallholder farmers (AGRA, 2013) and it is clearly imperative that, if SSA is to feed an estimated additional 1.6 billion people by 2050, the fundamental issue of soil degradation must be successfully addressed and solutions brought to scale across the continent.
This challenge is made even more pressing in the face of the potentially negative impacts of climate change on soil fertility. Increased temperatures will accelerate the
rate of soil organic matter decomposition, with negative effects on soil water-holding capacity and nutrient loss, more rapid organic matter decomposition will inevitably reduce the potential of innovations that seek to increase carbon sequestration in the soil. Furthermore, projected increases of rainfall amounts and intensity will lead to greater erosion of nutrient-rich topsoil and more intense leaching of plant-available nutrients beyond the root zones of crops.
Climate Variability and Smallholder AgricultureSmallholder farmers in SSA are currently vulnerable to a wide range of stresses, and ‘vulnerability assessments’ of farming communities and their farming systems are complex undertakings that require multi-dimensional approaches. They need to encompass environmental, social and economic spheres, as described by Shroter et al. (2005) and Malcomb et al. (2014), and incorporate such features as susceptibility, exposure and coping/adaptive capacities.
In this chapter however, we focus more specifically on ‘climate-induced vulnerability’, which can be defined as: “The degree to which a system (farming community) is susceptible to, or unable to cope with, adverse effects of climate change, including climate variability and extremes” (IPCC, 2007). We discuss below the challenges imposed by climate variability and how, over generations, farmers have learned to cope with it. We also discuss how helping farmers better cope with climate variability today has become widely recognized as an important first step in enabling them to adapt to climate change in the future.
Climate variabilityOver the centuries, the natural sciences have determined the principles that govern how key weather parameters affect crop growth and yield and, in conjunction with improved crop varieties, it is largely because of such understanding that enormous gains in food and feed production levels have been possible, enabling many parts of the world to continue feeding an ever expanding human and animal population.
For smallholder farmers and pastoralists in SSA, the most important of these weather parameters is rainfall. Both the expected mean rainfall and the variability associated with that mean, often expressed as the coefficient of variation (see Table 1.3), are important. While the mean rainfall will broadly determine the types of crops grown and the livestock that farmers keep
(Table 1.2), many argue that for risk-averse small-scale farmers, it is the variability of the rainfall rather than the mean that has the greatest impact on their vulnerability and in shaping their decision making process (Thomas et al., 2007). It is argued that this is especially true with regard to investment decisions concerning labor and capital that must be made before the onset of the season. Table 1.3 illustrates this rainfall variability for a range of selected locations in SSA, and we note again that variability tends to increase disproportionally as one moves from humid and subhumid AEZs to drier zones. It is in these drier areas, where rainfall variability is high, that farmers and pastoralists are most vulnerable and are particularly exposed to rainfall-induced risk.
Based on methods outlined in Jones and Thornton (2009) and using recent climate model output from the fifth phase of the Coupled Model Intercomparison Project (Jones and Thornton, 2013), we have mapped those areas in SSA where annual rainfall totals have high levels of variability; in Figure 1.2, we have highlighted areas with a CV of 25% or greater. As can be seen, these areas cover a substantial proportion of sub-Saharan Africa, tending to dominate in the Sahelian region and in East and Southern Africa.
However, it is not only the ‘between-season’ variability of rainfall totals that we present in Table 1.3 and illustrate in Figure 1.2 that is important.
‘Within-season’ rainfall variability is also critically important, as it determines such variables as: the effective onset of the crop season; the timing, length and severity of dry spells during the growing season; and the effective end of the season (Stern and Cooper, 2011). These variables in turn are reflected in the risk that a ‘failed season’ will occur. In this chapter we define a season as having ‘failed’ if, in any year: it never starts; or if there are fewer than 50 growing days; or if more than 30% of the days within a season proper (one that has started and ended) are considered to be ‘non-growing days’ due to moisture stress. More details on the definition of ‘season failure’ used are given in Jones and Thornton (2009).

Africa Agriculture Status Report 2014 | 33
Figure 1.2 Areas with coefficients of variation of annual rainfall > 25% under current climatic conditions
In Figure 1.3 (A), we have simulated and mapped the probability that such failed main growing seasons will occur under current climatic conditions. In doing so, we have only considered areas where the LGP is currently >
40 days per year, since where it is < 40 days per year we do not consider cropping to be viable. In Figure 1.3 (B), we have also mapped the probability of failed seasons under projected climate change by 2050.
Figure 1.3 (A) Probability of main season failure in any year under current climatic conditions, using simulated weather data from MarkSim and (B) by 2050, using an ensemble mean of 17 General Circulation Models and Representative Concentration Pathway 8.5
<5%5-20%20-33%33-50%>50%
<5%5-20%20-33%33-50%>50%
A. B.

34 | Africa Agriculture Status Report 2014
As expected, in comparing Figures 1.2 and 1.3 (A), the dry areas with high rainfall variability (a CV > 25%) also have the highest probability of failed seasons (a probability > 50%, shown as dark green areas); the red areas are where the probability of failure during the main growing season is between 33-50%. However, even under wetter and less variable rainfall conditions (the pale blue and yellow areas), farmers are still vulnerable to main season failure in from 5-33% of the seasons. It is only in the most humid parts of SSA (the pale green areas) that this risk falls to less than 5% (i.e., 1 year in 20). Under projected climate change [(Figure 1.3 (B)], rainfed agriculture south of the Zambezi becomes substantially riskier, with Namibia, South Africa, Botswana, and the southern parts of Mozambique, Zimbabwe, and Angola, being particularly affected. Other regions may also suffer considerable increases in cropping risk, notably southern Sudan and areas in a belt running east to west from southern Ivory Coast across Ghana to Nigeria.
Given the above analyses of climate risk, it is not surprising that smallholder farmers remain
understandably reluctant to invest in possibly more sustainable, productive and potentially economically rewarding practices when the rate of return to that investment appears so unpredictable from season to season and indeed, for costly inputs such as fertilizer, may often be negative (Dimes, 2005).
In response to such variability in rainfall and its associated impact on farm production, famers have developed coping strategies (Belay et al., 2005; Nyong et al., 2007; Deressa et al., 2010; Ng’ang’a et al., 2013) that can be defined as “strategies that have evolved over time through peoples’ long experience in dealing with the known and understood natural weather variation that they expect in seasons combined with their specific responses to the season as it unfolds”. However, such coping strategies are ‘risk spreading’ in nature and are designed to mitigate the negative impacts of poor or failed seasons and extreme events; they usually fail to exploit the opportunities presented by average and better-than-average seasons (Rao et al., 2011). As a result, reliance on traditional coping strategies enables farmers to survive, but it seldom lifts them out of poverty.
Box 1.2 Providing climate information to farming households in sub-Saharan AfricaMany promising opportunities to adapt agricultural systems to a variable and changing climate depend on climate information, and can be constrained if the right information is not available at the right spatial and temporal scale. Historical climate information allows farming systems and production technologies to be tailored to the degree of risk and any climatic trends. Advanced information about the upcoming growing season enables farmers to adopt improved technology, intensify production, replenish soil nutrients, and invest in more profitable enterprises when conditions are forecast to be favorable. Such information also helps farmers to more effectively protect their families and farms against the long-term consequences of adverse extreme climatic events.
National Meteorological Services (NMS) in most African countries distribute agro-meteorological bulletins throughout the growing season that package relevant information about monitored weather and current crop conditions, and sometimes weather forecasts with agro-advisory products tailored to the need of farm management decision making. Since 1997, regional climate outlook forums in Africa have supported the production, dissemination and use of consensus forecasts for the main crop-growing seasons.
In the past, widespread use and benefit among smallholder farmers has been limited by challenges related to: the scale and form in which such information is packaged; timely and equitable access to it; perceived legitimacy and credibility of the information providers; and farmers’ capacity to understand and act on complex information (Hansen et al., 2011). However, climate services in Africa have received increasing attention in recent years in response to growing investment in climate change adaptation, as evidenced by the integration of resilience into development objectives and major climate service initiatives, such as: the UN Global Framework for Climate Services (GFCS); ClimDev-Africa; and the CGIAR Research Program on Climate Change, Agriculture and Food Security (CCAFS). These and other initiatives are significantly increasing the capacity of several African countries to provide climate information and advisory services to farming communities, and are overcoming some of the challenges that farmers face in order to benefit from such information. Highlights include:
• Through financial and technical support from several international organizations, the NMSs of Ethiopia, Tanzania, and Madagascar, as well as AGRHYMET in West Africa, now routinely produce and disseminate spatially complete climate information at a resolution that is relevant to smallholder farmers.
Africa Agriculture Status Report 2014 | 35
• As of 2012, the ‘METAGRI’ project conducted 159 ‘Roving Seminars’ that provided seasonal climate information and training to 7,300 farmers from 3,000 villages; distributed more than 3,000 rain gauges to farmers, and trained 800 communicators from agricultural extension, local government, NGOs and media across 15 West African countries.
• A project led by Grameen Foundation provided weather forecasts and management advisories to more than 12,000 farmers in the Kasese District of Uganda through mobile phones and a network of trained Community Knowledge Workers.
• CCAFS is working with partners to develop and evaluate several models for communicating seasonal climate forecasts and supporting climate-informed management for smallholder farmers in Kenya, Ethiopia, Uganda, Tanzania and Zimbabwe in Eastern and Southern Africa, and in Senegal, Burkina Faso, Mali, Ghana and Niger in West Africa.
• A CCAFS pilot climate service initiated in 2011 in Kaffrine, Senegal, quickly reached more than 5,000 farmers in the Kaffrine Region, and was expanded to three new regions in Senegal. Lessons from Kaffrine were incorporated into climate information programming of a network of rural radio stations, which reach an estimated 2 million farmers across Senegal.
• In 2008-2010, the African Farm Radio Research Initiative worked with 25 radio stations in 5 countries (Tanzania, Malawi, Uganda, Mali and Ghana) to plan, produce and evaluate two Participatory Radio Campaigns. An estimated 20 million farmers learned about specific agricultural improvements, and 10 million farmers adopted some aspect of the recommended practices.
• The ‘Climate Services Adaptation Program in Africa’ in Tanzania and Malawi, launched in early 2014 with support from the Norwegian government, is the first national, multi-sector implementation project under the GFCS.
Firm estimates are not available of the number of smallholder farm households that benefit routinely from climate information in SSA. However, we estimate that ongoing initiatives – particularly those that incorporate climate information and advisories into rural radio – reach several million households, and that close to half of these households factor this information into their farming and livelihood decisions (Jim Hansen, pers. comm.). Given the growing interest and investment in climate services, and promising initiatives that are at an early stage of development, we expect that climate services could expand to tens of millions, and that the relevance and benefits to those who do use climate information will be enhanced substantially over the coming decade.
Helping farmers better cope with current climate variability: A first step in adapting to climate changeOver the last four decades, agricultural development policies and innovation have not only aimed to achieve increased levels of farm productivity, but have also sought to promote innovations that help farmers better cope with climate-induced risk; many of these innovations have been brought to scale in SSA. They include such improvements as drought-resistant varieties, index-based crop/livestock insurance, and soil management techniques that help conserve soil moisture in dry seasons and mitigate runoff and erosion in wetter seasons (Cooper et al., 2013). One particularly useful initiative that is rapidly gaining momentum in SSA aims
to bring weather information to farmers in a format that is understandable and useful for them in making timely farm-level decisions (see Box 1.2).
However, more recently it has become widely accepted that for resource-poor and risk-prone farming communities, risk mitigation must also be an integral component of strategies for adaptation to climate change, and that a two-pronged approach – sometimes referred to as the ‘twin pillars’ of adaptation to climate change – is needed (Burton and van Aalst, 2004; DFID, 2005; Washington et al., 2006; Cooper et al., 2008). Such an approach recognizes that both shorter- and longer-term strategies are required.
The shorter term – Since smallholder farmers are already vulnerable to current weather variability and associated shocks, it is essential to help them build their livelihood resilience and adaptive capacity via better mechanisms for coping with current weather-induced risk. This is important for two reasons:

36 | Africa Agriculture Status Report 2014
1. It can be assumed that all ongoing development initiatives targeting sustainable improvements in food, nutrition, animal feed, income, and environmental resources will translate into enhanced livelihood assets, and hence greater resilience and adaptive capacity, although it must be recognized that avoiding tradeoffs between such goals will have to be carefully navigated and in some instances may not be possible (Cooper et al., 2013). However, while this assumption is widely held to be true, it is not always easy to demonstrate, since in practice there are pertinent and critical issues of uncertainty in determining adaptive capacity at different scales, from the household to country levels (Vincent, 2007).
2. Perhaps more important are the current and already substantial season-to-season weather ranges, especially rainfall amounts, and the extent to which these ranges will change in the future and hence to what extent farmers will experience weather conditions under progressive climate change that they are not already experiencing today.
With respect to rainfall, the current range of seasonal totals experienced by farmers over the years is very large (see Table 1.3). For example, at Katumani in Kenya rainfall totals have ranged from 334 mm to 1,262 mm between 1961 and 2012, with a median value of 654 mm and a CV of 29%. Even with a plus or minus 5-10% change in the median and associated rainfall range due to climate change, it is clear that in the majority of future seasons farmers will not be experiencing rainfall totals that fall too far outside their current experience. For rainfall therefore, helping farmers cope better with current rainfall variability is a win-win strategy. It will benefit them both now and in the future, even as changes in rainfall amounts and distribution patterns become more pronounced.
The same is not true for temperature. Here, the range of mean annual temperatures experienced by farmers is much narrower. Again using Katumani as an example, mean annual maximum temperatures ranged from 23.8°C to 26.8°C between 1961 and 2012 with a median value of 25.1°C and CV of only 2.3%; mean annual minimum temperatures ranged from 12.6 to 14.8OC with a median value of 13.4°C and CV of 3.9%. If temperatures rise 1.5 to 2.5°C, as is projected for 2050, farmers will be
experiencing temperature conditions that fall outside their current experience for the majority of seasons and will need to adapt their practices accordingly. However, currently most smallholder farming systems are relatively ‘low input’ and the wider adoption of improved production practices and ‘temperature-adapted’ crop germplasm has the potential to largely compensate for the negative impacts of such increases in temperature, providing that temperatures do not rise above a given crop’s tolerance range.
One important mechanism by which increased temperatures decrease crop yields is by accelerating the rate of crop development, thus reducing their time to maturity and hence the length of time that they are able to accumulate dry matter through photosynthesis. For example, using crop growth simulations for a range of food staples in SSA, Cooper et al. (2009) showed that improved production practices, coupled with the choice of appropriate maturity length germplasm that compensated for reduced time to maturity, would actually allow farmers to achieve higher yields under a 3°C temperature increase than they are achieving today with low input levels and currently used germplasm. Proven recommendations for such improved production practices and a wide range of maturity length germplasm are available to support such an adaptation strategy in SSA.
The medium to longer term – As climate change becomes more obvious, both in its identification and impact, farmers will have to progressively adapt their practices to a new and progressively evolving set of climate-induced risks and opportunities. The IPCC’s AR5 makes it clear that by 2050, at least half the cropping area of most African countries will have climates that are outside the current experience in the country and that, in general, the length of growing seasons and suitability of crops are likely to decline in all tropical farming systems. Progressive adaptation to these new and continually evolving climatic conditions is imperative. Rickards and Howden (2012) describe how, as the degree of climate change and its impacts become more pronounced, such progressive adaptation is likely to evolve from ‘Incremental adaptation’ (for example, changing crop planting dates) through ‘systems adaptation’ (changing choices about crops or livestock) to ‘transformational adaptation’ (possibly seeking alternative livelihoods as agriculture becomes unfeasible).
Climate Change to 2050 and Implications for Smallholder AgricultureIn this section, we focus our discussion on climate change projections for the different regions of SSA, but also include some of the more global-level
projections from the IPCC (Stocker et al., 2013) that have implications for smallholder agriculture in SSA. We also refer to the projected impact of global
Africa Agriculture Status Report 2014 | 37
warming on rising sea levels, which in turn will affect coastal livelihoods. Finally, we present and discuss the implications of projected climate change on the degree of climatic suitability in different regions for major food staples. While our focus is on crops, climate change will also have important, and largely negative, impacts on coastal and inland fisheries, as well as livestock productivity and pasture growth (Porter et al., 2014; Field et al., 2014).
Future GHG emissionsIn 2000, the IPCC Special Report on Emission Scenarios developed 40 future non-mitigation GHG emission scenarios (Nakicenovic, N. et al., 2000). The 40 scenarios encompassed the current range of uncertainties of future GHG emissions arising from such driving forces such as demographic, social, economic and technological development, and all were assumed to be equally valid with no assigned probability of occurrence. These scenarios were in use up to and including the 4th Assessment Report produced in 2007.
In contrast, however, GHG emissions in the IPCC’s AR5 are not projected, but rather prescribed by four Representative Concentration Pathways (RCPs). In these RCPs, different patterns are prescribed for the three key GHGs (CO2, CH4 and N2O). These patterns are shown in Figure 1.4 for the 4 RCPs used in AR5. While it is not certain which of the RCPs most accurately reflects the future pattern of GHG emission, what is
certain is that there will be further warming and changes in all components of the climate system up to and beyond 2050.
Using the outputs of a range of General Circulation Models (GCM), we calculated the projected changes in mean temperature increases (°C) and total rainfall changes (%) to 2050 for the five regions of SSA, both for RCP 6.0 and RCP 8.5. The outputs are presented in Table 1.5 for the minimum, maximum and quartile values of the projected changes.
Projected temperature changesIn most parts of SSA, temperatures are already close to, and sometimes exceed, the optimum with regard to crop growth and yield. As discussed earlier, global warming has already been observed across the continent and it is certain that temperatures will continue to rise, posing increasing constraints on farm-level production. At the global level, Stocker et al. (2013) have shown that RCPs 2.6, 4.5 and 6.0 projections to 2050 show relatively similar mean increases in temperatures of between 1.0 and 1.4°C, with a collective likely range of 0.4 to 2.0°C. In contrast, RCP 8.5 projections are considerably warmer, with a mean increase of 2.0°C and a likely range of 1.4 to 2.6°C. In addition, relative to natural climate variability, near-term increases in annual mean temperatures are expected to be larger in the tropics and subtropics of SSA than in the mid-latitudes (high confidence).
Figure 1.4 Prescribed Greenhouse Gas emissions of the 4 Representative Concentration Pathways to 2100
300 0 0
100
200
300
400
500
1000
2000
3000
4000
5000
400
500
600
700
800
900
1000
2000 2000 20002025 2025 20252050 2050 20502075 2075 20752100 2100 2100
CO
2 C
ON
CE
NTR
ATIO
N (P
PM
)
CH
4 C
ON
CE
NTR
ATIO
N (P
PB
)
N2O
CO
NC
EN
TRAT
ION
S (P
PB
)
RCO 2.6 RCP 6RCP 4.5 RCP 8.5
Source: van Vuuren, D.P. et al., 2011

38 | Africa Agriculture Status Report 2014
These global level observations by the IPCC are reflected by our SSA regional projections in Table 1.5, where it can be seen that RCP 8.5 results in greater temperature increase than RCP 6.0, and that the projected median and range of temperature increases for both RCPs are larger in SSA than for the global mean. There are
expected differences between GCMs in their temperature projections, but in general, within a given RCP the range of increases (i.e., comparing the minimum to maximum) and the median values are very similar for all SSA regions, except for the Sahel (SAH) where temperature increases are projected to be about 0.5°C greater by 2050.
Projected rainfall changesIn the IPCC’s AR5, Stocker et al. (2013) report that in SSA extreme precipitation events over most of the mid-latitude land masses and over wet tropical regions will very likely become more intense and more frequent by the end of this century, as the global mean surface temperature increases. While monsoon winds in West Africa are likely to weaken, monsoon precipitation is likely to intensify due to the increase in atmospheric moisture. Monsoon onset dates are likely to become earlier or not to change much. Monsoon retreat dates will likely be delayed, resulting in lengthening of the monsoon season. Importantly, there is high confidence that the El Niño-Southern Oscillation (ENSO) will remain the dominant mode of inter-annual variability in the tropical Pacific, producing global effects throughout the 21st century. Due to the increase in moisture availability, the variability of ENSO-related precipitation at the regional scale in SSA will likely intensify.
Our regional level rainfall change projections illustrate three important points. First, and as expected, they show a far greater degree of uncertainty than temperature projections, with a wide range of projections across GCMs, ranging from strongly negative minimum values to strongly positive maximum values for each region. Second, they confirm that rainfall changes (positive or negative) are more pronounced under RCP 8.5 than 6.0. Third, that despite the wide range of projections it is possible to distil out a ‘consensus’ conclusion with regard to the likely direction and extent of rainfall changes. In AR4, IPCC (2007) provided regional level projections and used the convention of describing a ‘consensus’ as being when the 25, 50 and 75% quartiles for any given region showed the same directional change in rainfall. Using the same convention, we can see important differences between regions, which we discuss here in the context of RCP 6.0.
Sahelian Africa has the widest range of rainfall change projections, but there is still a consensus among the
Table 1.5 Projections for annual temperature and rainfall changes in SSA by 2050 (2040-2069), relative to the 1950-2000 period (WorldClim data), using Representative Concentration Pathway 6.0 with 19 General CirculationModels and RCP 8.5 with 32 GCMs
REGION1 RCP
MEAN TEMP. RESPONSE (OC) MEAN TEMP. RESPONSE (OC)
MIN
QUARTILES
MAX MIN
QUARTILES
MAX25 50 75 25 50 75
SAH6.0 1.7 1.9 2.2 2.3 3.0 -7.9 0.4 7.5 16.3 48.0
8.5 2.2 2.7 3.0 3.5 4.0 -18.2 1.9 8.8 20.4 49.6
WAF6.0 1.2 1.6 1.7 1.8 2.5 -3.3 1.2 2.8 4.8 13.0
8.5 1.7 2.2 2.4 2.9 3.5 -10.8 -0.9 2.6 4.5 18.0
CAF6.0 1.3 1.5 1.8 2.0 2.6 -7.6 1.2 2.1 3.6 10.1
8.5 1.7 2.3 2.6 3.0 3.7 -9.3 0.8 3.9 7.3 14.1
EAF6.0 1.3 1.6 1.6 1.9 2.5 -8.5 1.7 6.3 12.0 22.7
8.5 1.6 2.1 2.4 2.9 3.4 -6.9 3.8 9.3 15.6 35.9
SAF6.0 1.4 1.8 1.9 2.2 2.6 -9.3 -4.9 -1.6 0.9 6.4
8.5 1.8 2.6 2.8 3.1 3.5 -12.5 -7.3 -3.0 -0.3 4.6
1. SAH = Sahelian Africa, WAF = West Africa (humid), CAF = Central Africa, EAF = Eastern Africa, SAF = Southern Africa. [See map insert in Figures 1.5-1.7 for regional delineation]

Africa Agriculture Status Report 2014 | 39
models that the region will become wetter by 2050, with a median increase in total annual rainfall of 7.5% by 2050. Given the arid to semiarid nature of this region, such increases in rainfall are likely to be positive and important. In contrast, for both humid West Africa and Central Africa, the projected range of changes is much narrower. The consensus is that these regions will also become wetter, but with smaller increases than in Sahelian Africa, with a median value of 2.8% for humid West Africa and 2.1% for Central Africa. Given that these two regions are already dominated by wetter humid and subhumid AEZs, these relatively smaller increases in rainfall are less likely to be important with regard to crop production. East Africa also shows a wetting consensus with a median value of 6.3%.
In Southern Africa however, a drying consensus is evident, with a median value of -1.6%. While this is a relatively small decrease, large areas of Southern Africa are already arid or semiarid and hence this decrease, combined with projected temperature increases, will likely have strong negative impacts on crop performance.
Projected sea level riseIn the context of SSA, sea level rises are important for low-lying coastal regions where high population densities are common; 320 coastal cities in SSA have more than 100,000 people each, and nearly 56 million people (2005
estimate) are living in low elevation coastal zones of less than 10 m above sea level (Brown et al., 2011). In such areas, increased flooding and seawater inundation due to a rising sea level would severely disrupt local fishery-based and agricultural livelihoods to the extent that large-scale migration could well result. For example, more than 20 years ago it was estimated that the number of people that would be displaced in the coastal regions of Nigeria ranged from 740,000 for a 20 cm rise in sea level to 3.7 million for a 1 m rise (Awosika et al., 1992). Since then, population densities in Nigeria have risen substantially. Not only would such large-scale migration from Africa’s coastal towns and cities severely disrupt the livelihoods of those displaced, but also would inevitably increase population pressure elsewhere with associated negative impacts.
The global mean sea level will continue to rise during the 21st century (Stocker et al., 2013) and the rate of sea level rise will very likely exceed that observed during the 1971-2010 period, due to increased thermal expansion from ocean warming and loss of mass from glaciers and ice sheets. The mean projections arising from the four RCPs and their likely ranges are given in Table 1.6. As can be seen, sea levels are projected to rise between 0.17 to 0.38 m by 2050.
As a result, Field et al. (2014) state: “due to sea level rise throughout the 21st century, coastal systems and low-lying areas will increasingly experience adverse impacts such as submergence, coastal flooding and coastal erosion (very high confidence)”.
The impact of projected climate change on the suitability of staple food cropsMuch has been published concerning the impact of climate change on the yields of staple food crops in SSA (e.g., for maize, cassava, millet, groundnuts and sorghum,
see Schlenker and Lobell, 2010). In addition, IFPRI has used the IMPACT model, described by Rosegrant et al. (2012), coupled with climate models, to produce three detailed research monographs that examine the implications of alternative futures for climate change, global food supply, demand, trade, prices, and food security at the country level for West (Jalloh et al., 2013), East (Waithaka et al., 2012) and Southern Africa (Hachigonta et al., 2013).
Table 1.6 Global mean sea level rise (m) with respect to 1986-2005, based on 21 Coupled Model Intercomparison Project models
GLOBAL MEAN SEA LEVEL RISE
(M)
SCENARIO2046 - 2065 2081 -2100MEAN LIKELY RANGE MEAN LIKELY RANGE
RCP 2.6 0.24 0.17 to 0.32 0.40 0.26 to 0.63
RCP 4.5 0.26 0.19 to 0.33 0.47 0.32 to 0.63
RCP 6.0 0.25 0.18 to 0.32 0.48 0.33 to 0.63
RCP 8.5 0.30 0.22 to 0.38 0.63 0.45 to 0.82
Source: Stocker et al., 2013
40 | Africa Agriculture Status Report 2014
We do not attempt to provide an overview of this literature on climate change impacts on crop yields per se; instead we look at the impact of climate change on changes in the ‘climatic suitability’ of major food staples. Regardless of the level of crop management imposed, every crop has a set of optimum temperature and rainfall ranges under which it is best suited to grow, hence changes in rainfall and temperature conditions in areas where any given food staple is currently grown will change the level of suitability of that crop in that particular area.
To assess the impact of climate change projections on the percent changes in the suitability of important food staples in SSA, we used the average climate change projections to 2050 from 19 GCMs as an input into a model called EcoCrop (Ramirez-Villegas et al., 2013). EcoCrop is a niche-based model that uses environmental ranges to determine the main niche of a particular crop and numerically assess the environmental conditions to determine a potential climatic suitability rating. To achieve a particular prediction, a parameter set of the optimal and marginal temperatures and rainfall at which the crop can grow is defined. EcoCrop and its parameterization for major food staples are fully described by Ramirez-Villegas et al. (2013) and Jarvis et al. (2012).
To show the usefulness of EcoCrop, we map the output of this assessment for two important staples, which show very contrasting results in Figure 1.5 for cassava (Manihot esculenta) and Figure 1.6 for beans (Phaseolus vulgaris L).
Cassava has a much broader range of temperature (15 to 45°C) and rainfall (300 to 2,800 mm per season) under which it will grow compared to beans (14 to 26°C and 200 to 710 mm per season). These ranges are reflected in the extent to which changes in temperature and rainfall affects the suitability of the two crops (Figures 1.5 and 1.6). Cassava shows practically no change in overall suitability in Sahelian Africa, humid West Africa, and Central Africa, but shows important gains in suitability in East Africa and Southern Africa. In contrast, beans show a marked decline in suitability in Central, Southern and Eastern Africa, with smaller declines in Sahelian and West Africa. It is only in small areas of the cooler highlands in Eastern and Southern Africa that beans show an increase in suitability.
We have taken this analysis a step further for all the major food staples grown in SSA. The mean overall change in the suitability of a given crop in a given region, as illustrated for cassava and beans, arises from the combination of changes in two biophysical quantities: changes in the degree of suitability within those areas in the region where the crop is currently grown; and losses from, or gains to, the size of the suitable area within the region arising from either currently suitable areas becoming unsuitable, or new areas becoming suitable.
The possible loss of currently suitable areas for any given crop is especially important for smallholder farmers
who are growing that crop in those areas, and points to the strong possibility that they will need to adapt to climate change, either through accessing improved crop germplasm with enhanced tolerance to the new climatic conditions or by changing their choice of crop or even their choice of activity. For example, Jones and Thornton (2009) suggest that there will be places where the livelihood strategies of rural people may need to change in order to preserve food security and provide income-generating options. These are likely to include areas of SSA that are already marginal for crop production; as these become increasingly marginal, then livestock may provide an alternative to cropping.
We illustrate this projected loss of currently suitable areas using 19 GCMs for RCP 6.0 in Figure 1.7 for several staples: yams (Dioscorea spp), sorghum (Sorghum bicolor), pearl millet (Pennisetum glaucum), groundnut (Arachis hypogaea), finger millet (Eleusine coracana), common bean, cassava and banana (Musa acuminata).
Despite its regional importance, we were not able to analyze maize due to the large diversity of cropping systems and germplasm across the region (see Hodson et al., 2002) and the consequent difficulty in the parameterization of EcoCrop for maize. Ongoing improvements in the parameterization for EcoCrop are being done at the International Center for Tropical Agriculture (CIAT), in collaboration with the International Maize and Wheat Improvement Center (CIMMYT). For preliminary analyses of maize suitability under projected climate change, see Jarvis et al. (2012).
What is immediately apparent from Figure 1.7 is the substantial loss of suitable areas for beans in all regions. These losses are particularly important in East Africa (a median 28% loss) and Central Africa (an 80% loss), where currently over 7 million hectares of the crop are grown and constitute both a source of high-quality protein for family consumption and a significant source of household income from local sales. In West Africa, an 80% loss is also observed, but in this region the area of beans currently grown is smaller (around 0.6 million hectares). For other staples, the losses of suitable areas are in general much less pronounced, although banana shows significant median losses of 8% in West Africa and 25% in Sahelian Africa. Yam shows losses of between 4-6% in Southern, Eastern and Sahelian Africa, and finger millet shows a 14% loss in Sahelian Africa.
While the low levels of suitability area loss for the majority of staples are encouraging, in as much as it means that in general those crops can continue to be grown where they are currently grown, we must emphasize that this does not infer that climate change will not affect their growth and yield. The direction of yield change in any given area depends on the physiology of the crop concerned and the current climatic condition under which it is grown. Across the tropics – and particularly in SSA – the net effect of climate change on yield will be negative (Challinor et al.,

Africa Agriculture Status Report 2014 | 41
2014; Lobell et al., 2008; Schlenker and Lobell, 2010). For example, Schlenker and Lobell (2010) conclude that by 2050, mean estimates of aggregate production
changes in SSA are -22% for maize, -17% for sorghum, -17% for pearl millet, -18% for groundnut, and -8% for cassava.
Figure 1.5 Projected changes (%) in cassava (Manihot esculenta) suitability by 2050 in SSA regions as the average of 19 Coupled Model IntercomparisonProject models for Representative Concentration Pathway 6.0 and 32 CMIP models for RCP 8.5
Figure 1.6 Projected changes (%) in bean (Phaseolus vulgaris) suitability by 2050 in SSA regions as the average of 19 Coupled Model Intercomparison Project models for Representative Concentration Pathway 6.0 and 32 CMIP models for RCP 8.5
West Africa (humid)
Southern Africa
Central Africa
Sahelian Africa
East Africa
Regions
West Africa (humid)
Southern Africa
Central Africa
Sahelian Africa
East Africa
Regions

42 | Africa Agriculture Status Report 2014
Figure 1.7 Projected percentage losses of currently suitable areas for staple crops in SSA regions1 by 2050 as the average of 19 Coupled Model Intercomparison Project models (Representative ConcentrationPathway 6.0) (Thick black vertical lines are the median, boxes show the first and third quartile; whiskers extend 5% and 95% of the distributions, and circles are values that fall outside those boundaries.)
WAF
EAF
SAF
SAHCAF
PERCENTAGE LOSS OF CURRENTLY SUITABLE AREAS
Banana
Cassava
Common bean
Finger millet
Ground nut
Pearl millet
Sorghum
Yam
0 20 40 60 80 100
PERCENTAGE LOSS OF CURRENTLY SUITABLE AREAS
Banana
Cassava
Common bean
Finger millet
Ground nut
Pearl millet
Sorghum
Yam
0 20 40 60 80 100
Banana
Cassava
Common bean
Finger millet
Ground nut
Pearl millet
Sorghum
Yam
0 20 40 60 80 100
PERCENTAGE LOSS OF CURRENTLY SUITABLE AREAS
Banana
Cassava
Common bean
Finger millet
Ground nut
Pearl millet
Sorghum
Yam
0 20 40 60 80 100
PERCENTAGE LOSS OF CURRENTLY SUITABLE AREAS
Banana
Cassava
Common bean
Finger millet
Ground nut
Pearl millet
Sorghum
Yam
0 20 40 60 80 100
PERCENTAGE LOSS OF CURRENTLY SUITABLE AREAS
EAFCAF
SAF
WAF
SAH

Africa Agriculture Status Report 2014 | 43
Climate change and agricultural pests and diseasesInsect scourges and epidemics of plant diseases are a part of human history, causing sometimes widespread hunger and famine, and to this day reducing the quantity and quality of agricultural produce and threatening food security. Weather is a key driver of the intensity of these biotic threats to agricultural productivity, and many forecasting models routinely use short-term weather data to anticipate actions needed for effective pest and disease management. This approach falls short of predicting the likely impacts of climate change on insect populations and the incidence and prevalence of plant diseases. Unfortunately, most projections regarding threats to food security from climate change still largely ignore the likely impacts of insect pests and diseases. Scientists, mostly in the industrialized world, have just begun to study the impact of climate change on agricultural pests (http://onlinelibrary.wiley.com/doi/10.1111/ppa.2011.60.issue-1/issuetoc). Building on the experience and tools developed by the International Potato Center (CIP) to model the impact of climate change on important insect pests in Africa, open-source software called ‘Insect Life Cycle Modeling’ (ILCYM) was developed. ILCYM facilitates insect phenology modeling and risk mapping under current and future climate change scenarios. CIP is using the software for projections about the principal potato and sweet potato pests; Bioversity International has begun applying it to banana pests; the International Institute of Tropical Agriculture (IITA) is using it for cassava pests; and the International Centre of Insect Physiology and Ecology (ICIPE) is applying it to maize and other crop pests (http://www.rtb.cgiar.org/predicting-climate-changes-impact-on-crop-pests-and-diseases/#sthash.zuc40ajt.dpuf)
Such tools will be very useful in developing other, urgently needed modeling software aimed at contain various pests resulting from climate change. According to Oerke (2006), insect pests and disease pathogens, combined with weeds, destroy over 50% of the world’s food supply every year. In East Africa, for example, outbreaks of such pests as cereal aphids and the coffee berry borer (see below) have become increasingly common, as seasons grow drier.
Source: K. Mutambuki and P. Likhayo (KARI), 2014
Some like it hot – Climate change and the coffee berry borerThe negative effects of climate change are already evident for many of the 25 million coffee farmers across the tropics and the 90 billion dollar (US) coffee industry. The coffee berry borer (Hypothenemus hampei), the most important pest of coffee worldwide, has already benefited from rising temperatures in East Africa; increased damage to coffee crops and expansion in its distribution range have been reported. Under climate change, the situation with H. hampei is projected to worsen in the current Coffea arabica-producing areas of Ethiopia, the Ugandan part of the Lake Victoria and Mt. Elgon regions, Mt. Kenya and the Kenyan side of Mt. Elgon, and most of Rwanda and Burundi. The hypothetical number of generations per year of H. hampei is predicted to increase dramatically – from five generations per year to ten – in all C. arabica-producing areas. This will have serious implications for C. arabica production and livelihoods in East Africa. It may be that the best way to adapt to rising temperatures on coffee plantations through the introduction of shade trees on sun-grown plantations. However, there is a pressing need to fill existing knowledge gaps in the coffee industry, and to develop science-based adaptation strategies to mitigate the impacts of climate change on coffee production. For details, visit: http://www.plosone.org/article/info%3Adoi%2F10.1371%2Fjournal.pone.0024528#pone-0024528-g009
The extreme weather events anticipated under climate change are also likely to spread crop pests and diseases to new areas. In the absence of mitigation efforts, production will be reduced, access to markets will be increasingly restricted, and export earnings will decline. For example, the Bomet maize disease (maize lethal necrosis) has caused bans in the cross-border trading of maize in order to maintain the disease-free status of importing countries. Combined with post-harvest spoilage, losses due to pests and diseases become critical, particularly for resource-poor smallholder farmers. Under climate change, post-harvest crop losses may increase even further than today’s already unacceptable levels. The increased temperatures and levels of atmospheric carbon dioxide associated with climate change are believed to favor mold growth and mycotoxin production, particularly in grain during storage and transport. Changes in rainfall patterns and intensity also greatly influence grain quality. Grain moisture content, the quality of storage facilities available, and temperatures determine the quality of grain after harvest.
Source: Some like it hot – Climate change and the coffee berry borer Authors: J. Jaramillo, E. Muchugu, F. E. Vega, A. Davis, C. Borgemeister, and A. Chabi-Olaye
44 | Africa Agriculture Status Report 2014
Priority Adaptation Actions in the Agriculture and Food SectorsOur own analyses of projected climate change and its probable impact on the suitability of major food staples, together with results reported in the literature, clearly show that not only is climate change already affecting rainfed farming in SSA, but that its negative impact is almost certain to become more pronounced towards 2050. In this assessment we have drawn heavily on the IPCC’s Fifth Assessment Report, which has provided us with the first opportunity since 2007 to appraise the global scientific consensus on climate change. Of particular importance, Working Group II reported in April 2014 on vulnerability, impacts and adaptation, including a chapter on ‘Food Security and Food Production Systems’ (Field et al., 2014; Porter et al., 2014).
What is abundantly clear is the urgency with which farmers will need to progressively adapt to climate change. In 2003, the International Institute for Sustainable Development (IISD) made an emotive observation that remains especially relevant to smallholder farmers in SSA: “Adaptation to climate change is therefore no longer a secondary and long-term response option only to be considered as a last resort. It is now prevalent and imperative, and for those communities already vulnerable to the impacts of present day climatic hazards, an urgent imperative” (IISD, 2003).
More than ten years have passed since then and today there is no question that definitive adaptation action is needed at all levels, including among governments, farmers, businesses and scientists. Such adaptation options could include: on-farm interventions, such as shifting breeds or species produced; crop diversification; landscape-level management of water resources, soils and biodiversity; services such as weather forecasting (see Box 1.2), farm insurance, disaster relief, and agricultural research; and potentially much more transformative changes, such as shifts in the geography of major production areas for crops and livestock (cf. Jones and Thornton, 2009).
We have identified seven priorities for adaptation action emerging from our own analyses, as well as from the AR5 Working Group II findings on impacts and adaptation in the agriculture and food sectors (see also Vermeulen, 2014):
1. Urgency – since climate change is affecting food and farming now, we need to speed up the pace of adaptation to achieve mitigation co-benefits wherever possible.
2. Investment – we need to increase the proportion of climate finance going into adaptation, and to secure a flow of resources to locations and populations where adaptation needs are greatest.
3. Private finance – we need creative finance and insurance products to improve both risk management and access to capital for adaptation actions, especially among smallholder producers.
4. Value chains – we need to pay more attention to how food value chains are managed to deal with climate risks, secure affordable and nutritious food supplies for poor consumers, and improve links between small-scale producers and processors to stable markets, whether local or distant.
5. Knowledge – since climate change is not static, we will continually need to generate and share new knowledge, extending the information revolution into fields, forests and fisheries in remote localities.
6. Breeding – we need to invest now in farmer- and science-led breeding, as it is demonstrably one of the most effective climate change adaptation measures, and requires 8-20 year lead times for the release of new varieties of crops and livestock.
7. Nutrition – we need to focus development interventions that ensure not just maintained calorie supplies under climate change, but also enable access to diverse food baskets as well as to fortified or biofortified food staples. This is especially important in more remote rural areas where changes in dietary preferences, and hence food diversity, are likely to be slower.
We feel that AGRA is well placed to engage in all of these suggested priority actions, either through direct action with research and development partners or through policy advocacy at the highest levels.

Africa Agriculture Status Report 2014 | 45
Concluding RemarksThat warming has already occurred across all regions of SSA is unequivocal, and an additional mean temperature increase of about 1.5°C by 2050 is almost certain. While observed changes in rainfall are currently less clear, consensus projections indicate that all regions will become wetter, albeit with greater variability and more intense storms, except for southern Africa a robust drying trend is indicated. However, other important changes have also occurred in the agricultural environment and will also certainly continue unless they are successfully addressed. Because of this, confronting the challenge of climate change must not be done in isolation, but in an integrated approach that also addresses the negative impacts of these other ongoing changes.
Previous studies and our own research have shown that climate change, principally increasing temperatures, will result in reduced yields for all major food staples in SSA, as well as a loss of area that is currently climatically suitable for these crops. As a result of such projected
impacts of climate change, it has become imperative that smallholder farmers adapt their farming practices to help negate these and other projected negative impacts.
We suggest that a two-pronged adaptation strategy is needed. First, and immediately, helping farmers to cope more effectively with current climate variability is a win-win approach that will not only improve their current levels of production, but will also build their livelihood resilience and adaptive capacity for the future. Second, in the medium to longer term and as the extent and impacts of climate change become more pronounced, farmers will need to adapt their farming practices. It is probable that such adaptation will need to evolve from ‘incremental adaptation’ through ‘systems adaptation’ to ‘transformational adaptation’ as the extent of climate change and its impacts become progressively more pronounced. Drawing on the recent IPCC AR5, we have summarized seven key areas of adaptation action that we believe AGRA and its partners are well placed to address.

46 | Africa Agriculture Status Report 2014
ReferencesAGRA, 2010. Africa Agriculture Status Report: Focus on Staple Crops. Alliance for a Green Revolution for Africa (AGRA), Nairobi, Kenya.
AGRA (2013). Africa agricultural status report: Focus on staple crops. Nairobi, Kenya. Alliance for a Green Revolution in Africa (AGRA). pp 202.
Altieri, M.A. and P. Koohafkan, 2008. Enduring Farms: Climate Change, Smallholders and Traditional Farming Communities. Environment and Development Series 6. Third World Network, 131 Jalan Macalister, 10400 Penang, Malaysia.
Awosika, L. F., French, G. T., Nicholls, R. J. and Ibe, C. E. (1992). The impact of Sea level Rise on the Coastline of Nigeria. In: Proceedings of IPCC Symposium on the Rising Challenges of the Sea. Magaritta, Venezuela. 14-19 March, 1992
Bationo, A., Hartemink, A., Lungo, O., Naimi, M., Okoth, P., Smaling, E. and Thiombiano, L. (2006). African Soils: Their Productivity and Profitability of Fertilizer Use. Background paper prepared for the African Fertilizer Summit. June 9-13th, 2006. Abuja, Nigeria.
Below, T., Artner, A. Siebert, R. and Sieber, S. (2010). Micro-level Practices to Adapt to Climate Change for African Small-scale Farmers, A Review of Selected Literature, IFPRI Discussion Paper 00953, February 2010
BeyeneK., F., and W. Manig. (2005). Coping with drought among pastoral and agro-pastoral communities in eastern Ethiopia. Journal of Rural Development 28: 185–210.
Brown, S. Kebede, A.S. and Nicholls, R.J. (2011). Sea-Level Rise and Impacts in Africa, 2000 to 2100. School of Civil Engineering and the Environment. University of Southampton, Southampton SO17 1BJ, UK.
Burton, I. and van Aalst, M., 2004. Look before you leap: A risk management approach for incorporating climate change adaptation into World Bank Operations, World Bank Monograph, Washington (DC), DEV/GEN/37 E.
Challinor AJ; Watson J; Lobell DB; Howden SM; Smith DR and Chhetri N (2014). A meta-analysis of crop yield under climate change and adaptation. Nature Climate Change, 4, pp.287-291.
Chancellor T and Kubiriba J (2006) The Effects of Climate Change on Infectious Diseases of Plants (Department of Trade and Industry, London), Review for UK Government Foresight Project, Infectious Diseases—Preparing for the Future.
Chauvin, N. C., Mulangu, F. and G. Mulangu, 2012. Food Production and consumption Trends in Sub-Saharan Africa: Prospects for the Transformation of the Agricultural Sector. Working Paper, United Nations Development Programme (UNDP) 76pp.
Christiaensen, L., Demery, L. and Kuhl, J. 2011. The (evolving) role of agriculture in poverty reduction – an empirical perspective. Journal of Development Economics 96: 239-254.
Codjoe, S. N. A and Owusu, G. 2011. Climate change/variability and food systems: evidence from the Afram Plains, Ghana. Reg Environ Change. DOI 10.1007/s10113-011-0211-3
Collier, P. and Dercon, F. (2013) African Agriculture in 50 Years: Smallholders in a rapidly changing world? World Development. http://www.sciencedirect.com/science/article/pii/S0305750X13002131
Cooper, P.J.M., J. Dimes, K.P.C. Rao, B. Shapiro, B. Shiferaw and S. Twomlow (2008). Coping better with current climatic variability in the rain-fed farming systems of sub-Saharan Africa: An essential first step in adapting to future climate change? Agric. Ecosyst. Environ. Vol. 126. Issues 1-2, 24-35.
Cooper P.J.M., Rao K.P.C, Singh P, Dimes J, Traore P.S, Rao K, Dixit P and Twomlow S.J. (2009). Farming with current and future climate risk: Advancing a ‘Hypothesis of Hope’ for rain-fed agriculture in the semi-arid tropics. J. SAT Agric. Res. 7, pp 1-19.
Cooper, P. J.M., S. Cappiello, S. J. Vermeulen, B. M. Campbell, R. Zougmoré and J. Kinyangi. (2013). Large-scale implementation of adaptation and mitigation actions in agriculture. CCAFS Working Paper no. 50. CGIAR Research Program on Climate Change, Agriculture and Food Security (CCAFS). Copenhagen, Denmark. Available online at: www.ccafs.cgiar.org
Denning G, Kabambe P, Sanchez P, Malik A, Flor R, et al. (2009) Input Subsidies to Improve Smallholder Maize Productivity in Malawi: Toward an African Green Revolution. PLoS Biol 7(1)
Deressa, T.T., Ringler, C and Hassan, R.M. (2010) Factors Affecting the Choices of Coping
Strategies for Climate Extremes: The Case of Farmers in the Nile Basin of Ethiopia. IFPRI Discussion Paper 01032 November 2010
DFID, 2005. Climate Proofing Africa: Climate and Africa’s development challenge. Department for International Development, London.
Diao, X., and P. Hazell. (2004). Exploring Market Opportunities for African Smallholders. 2004. Africa Conference Brief 6. Washington, DC: International Food Policy Research Institute (IFPRI).
Diao, X., J. Thurlow, S. Benin and S. Fan, 2012. Strategies and priorities for African Agriculture: Economic-wide perspectives from country studies. IFPRI, Washington DC.
Dimes, J.P., 2005. Application of APSIM to evaluate crop improvement technologies for enhanced water use efficiency in Zimbabwe’s SAT. In: Pala, M., Beukes, D.J., Dimes, J.P., Myers, R.J.K. (Eds.), Management for improved water use efficiency in the dry areas of Africa and West Asia: Proceedings of a workshop organized by the Optimizing Soils Water Use (OSWU) Consortium. April 2002, Ankara, Turkey. Aleppo Syria; ICARDA and Patancheru, India: ICRISAT. pp. 203–214.
Africa Agriculture Status Report 2014 | 47
Dixon, J. and Gulliver, A. with Gibbon, D. (2001). Chapter 2: Sub-Saharan Africa. In: Farming systems and poverty: Improving Farmers’ Livelihoods in a Changing World. FAO and World Bank, Rome and Washington DC.
Djurfeldt, A. A. and Jirström, M. (2013). Urbanization and Changes in Farm Size in Sub-Saharan Africa and Asia from a Geographical Perspective: A review of the literature. A Foresight Study of the CGIAR’s Independent Science and Partnership Council. 6 February 2013.
Dwivedi’s., Sahrawat, K., Upadhyaya, H., and Oritz., R. 2013. Food, nutrition and agrobiodiversity under global climate change. Adv Agron 120:1-128.
Eastwood, R., M. Lipton and A. Newell (2006). “Farm Size”. Paper prepared for Volume III of the Handbook of Agricultural Economics, University of Sussex. September 2006.
Economic Research Services (ERS) 2013. Sub-Saharan African cereal yields show signs of growth http://www.ers.usda.gov/data-products/chart-gallery/detail.aspx?chartId=37396&ref=collection#.U4da_fldV8E
FAO, 2006. Demands for products of irrigated agriculture in sub-Sahara Africa. FAO Water Report No. 31, 142pp.
FAO, 2008. Current World Fertilizer Trends and Outlook to 2011/12. Food and Agriculture Organization, Rome
FAO, (2009). “The Special Challenge for Sub-Saharan Africa”, Issues Brief, presented at the 2009 High-Level Expert Forum on “How to Feed the World in 2050,” Food and Agriculture Organization, Rome, October 12-13).
FAO, 2011. Food and Agriculture Organization of the United Nations, 2011. FAOSTAT Database. Available at www.fao.org/. FAO, Rome.
FAO, IIED and IFAD, 2009. Land grab or development opportunity? Agricultural investment and international land deals in Africa, IIED/FAO/IFAD, London/Rome.
FAO/World Bank. 2001. Farming systems and poverty. Improving farmer’s livelihoods in a changing world. Rome and Washington D.C. 412 pp.
FAO (2014) FAOSTAT.
Fabusoro, E., Sodiya, C. I., Fasona, M., Oyedepo, J. (2014). Vulnerability of Settled Fulani Agro-Pastoralists’ Livelihoods to Climate Change and Emerging Innovations for Adaptation and Land Accessibility in Southwest Nigeria, A Global Environmental Change Research Project sponsored by global System for Analysis, Research and Training (START), subaward grant 2013-02
Farrow, F., Musoni, D., Cook, S., and Buruchara, R. (2011) Assessing the risk of root rots in common beans in East Africa using simulated, estimated and observed daily rainfall data. Experimental Agriculture 47: 357–373
Field C.B, Barros V.R, Mastrandrea M.D, et al. (2014). Summary for Policy Makers. In: Climate Change 2014: Impacts, Adaptation, and Vulnerability. Contribution of Working Group II to the Fifth Assessment Report of the Intergovernmental Panel on Climate Change. http://www.ipcc-wg2.gov
Gyampoh, B. A., Asante, W. A., La Rose, D. J., Adu-Acheampong, G., Assimeng, T and Opoku, A.G. 2011. Mapping and Documenting Indigenous Knowledge in Climate Change Adaptation in Ghana. Technical Report. Recovery Program Support to Northern Ghana-UNDP/NADMO and African Adaptation Program – UNDP /Environmental Protection Agency. http://www.undp-aap.org/sites/undpaap.org/files/Ghana_Mapping%20and%20Documenting%20Indegenous%20Knowledge%20in%20CCA%20in%20Ghana_2011.pdf
Hachigonta, S., Nelson, G.C., Thomas, T.S. and Sibanda, L.M. (2013). Southern African Agriculture and Climate Change: A Comprehensive Analysis. International Food Policy Research Institute, Washington DC, USA (2013) 337 pp. 2033 KStreet, NW Washington, DC 20006-1002, USA.Hansen, J.W., Mason, S., Sun, L. and Tall, A., (2011). Review of seasonal climate forecasting for agriculture in sub-Saharan Africa. Experimental Agriculture 47:205-240.
Harris, D and Orr, A (2014). Is rainfed agriculture really a pathway from poverty? Agricultural Systems, Volume 123, pp 84-96
Haub, C and Kaneda,T. (2013) World Population Data Sheet. Population Reference Bureau, 1875 Connecticut Ave., NW, Washington, DC 20009 USA.
HarvestChoice, 2011. Agro-Ecological Zones (AEZ – 16 Classes) of Sub-Sahara Africa. International Food Policy Research (IFPRI), Washington D.C.
Hodson, D.P., Martinez-Romero, E., White, J.W., Jones, P.G., and Banzinger, M. 2002). Africa Maize Research Atlas. Version 1.0. International Maize and Wheat Improvement Center, CIMMYT
Hodson M., 2010 Water Productivity in Rainfed Agriculture: Redrawing the rainbow of water to achieve food security in rainfed smallholder systems. Ph. D. Thesis, Delft University of Technology, Delft, The Netherlands. 169pp.
IFAD, 2011. Proceedings, IFAD (International Fund for Agricultural Development) Conference on New Directions for Smallholder Agriculture, 24-25 January, 2011.IFAD, WFP, and FAO, 2012: The State of Food Insecurity in the World 2012. Economic growth is necessary but not sufficient to accelerate reduction of hunger and malnutrition. Food and Agriculture Organization of the United Nations (FAO), Rome, Italy, pp. 61.
IFPRI (2005). The future of small farms: Proceedings of a research workshop, Wye, UK, June 26-29, 2005. IFPRI (International Food Policy Research Institute). Washington, DC.
IISD, (2003). Livelihoods and Climate Change: Combining disaster risk reduction, natural resource management and climate change adaptation in a new approach to the reduction of rural poverty. IUCN-IISD-SEI-IC Task Force on Climate Change. Published by IISD. ISBN 1-895563-72-3. 24pp.

48 | Africa Agriculture Status Report 2014
IPCC, 2007: Climate Change 2007: The Physical Science Basis.Contribution of Working Group I to the Fourth Assessment Report of the Intergovernmental Panel on Climate Change, S. Solomon, D. Qin, M. Manning, Z. Chen, M. Marquis, K.B. Averyt, M. Tignor and H.L. Miller, Eds., Cambridge University Press, Cambridge, UK and New York, NY, USA
IPCC (2007) Contribution of Working Group II to the Fourth Assessment Report of the Intergovernmental Panel on Climate Change M.L. Parry, O.F. Canziani, J.P. Palutikof, P.J. van der Linden and C.E. Hanson, Eds. Cambridge University Press, Cambridge, UK, 976 pp
IPCC (2014). Summary for Policymakers, In: Climate Change 2014, Mitigation of Climate Change. Contribution of Working Group III to the Fifth Assessment Report of the Intergovernmental Panel on Climate Change, Cambridge University Press, Cambridge, United Kingdom and New York, NY, USA.
Jalloh, A., Nelson, G.C., Thomas, T.S., Zougmoré, R, and Roy-Macauley, H. (2013). West African Agriculture and Climate Change: A Comprehensive Analysis. International Food Policy Research Institute 2033 K Street, NW Washington, DC 20006-1002, USA
Jarvis, A., Ramirez-Villegas, J., Herrera-Campo, B.V and Navarro-Racines, C. (2012) Is cassava the answer to African climate change adaptation? Tropical Plant Biology, Vol.5 pp 9-29.
Jayne, T.S., Mather, D. and Mghenya, E. (2010). Principal Challenges Confronting Smallholder Agriculture in Sub-Saharan Africa. World Development Vol. 38, No. 10, pp. 1384–1398.
Jirström, M., A. Andersson and G. Djurfeldt (2011). Smallholders caught in poverty – Flickering signs of agricultural dynamism. African smallholders - food crops, markets and policy. E. Aryeetey, G. Djurfeldt and A. Isinika. London, CABI.
Jones P.G, and Thornton P.K (2009). Croppers to livestock keepers: Livelihood transitions to 2050 in Africa due to climate change. Environmental Science and Policy 12, 427-437.
Jones P.G, and Thornton P.K (2013). Generating downscaled weather data from a suite of climate models for agricultural modelling applications. Agricultural Systems 114, 1-5.
Katz, R. W. and Brown, B. G., 1992. Extreme Events in a Changing Climate: Variability is more
Morton, J. F. (2007). The impact of climate change on smallholder and subsistence agriculture, PNAS, 19680–1968, December 11, 2007 _ vol. 104 _ no. 50
Kheralla, M. D., E. Gabre-Medhin, N. Minot and M. Johnson, 2002. Reforming agricultural markets in Africa, John Hopkins University Press, Baltimore.
Livingston, G., Schonberger, S. and Delaney, S. (2011). Sub-Saharan Africa: The state of smallholders in agriculture. Paper presented at the IFAD Conference on New Directions for Smallholder Agriculture 24-25 January, 2011. International Fund for Agricultural Development, Via Paolo Di Dono, 44, Rome 00142, Italy.
Lobell, D.B., Burke, M.B., Tebaldi, C., Mastrandrea, M.D., Falcon, W.P. and Naylor, R.L. (2008) Prioritizing Climate Change Adaptation Needs for Food Security in 2030. Science 319: 607-610.
Malcomb, D.W., Weaver, E.A. and Krakowka, A.R. (2014). Vulnerability modeling for sub-Saharan Africa: An operationalized approach in Malawi. Applied Geography 48, 17-30
Marchioroi, L., Maystadt, J-F, and Schumacher, I. (2012). The impact of weather anomalies on migration in sub-Saharan Africa. Journal of Environmental Economics and Management. Vol. 63, pp 355–374.
Nagayets, O. (2005). Small Farms: Current Status and Key Trends. Information Brief prepared for the Future of Small Farms Research Workshop, Wye College, June 26–29, 2005.
Nakicenovic, N. et al (2000). Special Report on Emissions Scenarios: A Special Report of Working Group III of the Intergovernmental Panel on Climate Change, Cambridge University Press, Cambridge, U.K., 599 pp. Available online at: http://www.grida.no/climate/ipcc/emission/index.htm
Ng’ang’a SK, Diarra L, Notenbaert A, and Herrero M. (2013). Coping strategies and vulnerability to climate change of households in Mali. CCAFS Working Paper No. 35. Copenhagen, Denmark: CGIAR Research Program on Climate Change, Agriculture and Food Security (CCAFS).
Nelson, G., Bereuter, D. and Glickman, G. (2014) Advancing Global Food Security in the Face of a Changing Climate, The Chicago Council on Global Affairs, US
Ngigi, S.N. 2011 Climate Change Adaptation Strategies: Water Resources Management Options for Smallholder Farming Systems in Sub-Saharan Africa. The MDG Centre, East and Southern Africa. The Earth Institute at Columbia University
Nin-Pratt, A.M. Johnson, E. Magalhaes, I. You, X. Diao and J. Chamberlain 2011. Yield gaps and potential agricultural growth in central and West Africa. Research Monograph. IFPRI, Washington DC.
Nkonya, E., Place, F., Pender, J., Mwanjololo, A., Okhimamhe, A., Kato., E., Crespo, S., Ndjeunga, J. and Traore, T. (2011). Climate Risk Management through Sustainable Land Management in Sub-Saharan Africa. IFPRI Discussion Paper 01126.
Nyong, A., Adesina, F. and Osman Elasha, B. (2007). The value of indigenous knowledge in climate change mitigation and adaptation strategies in the African Sahel. Mitigation and adaptation strategies. Global Change 12: 787–797.
Osbahr, H., Dorward, P. Stern, R. D and Cooper, S. J. (2011) Supporting agricultural innovation in Uganda to climate risk: linking climate change and variability with farmer perceptions. Experimental Agriculture 47: 293–316.
Africa Agriculture Status Report 2014 | 49
Porter J.R, Xie L, Challinor A, Cochrane K et al. (2014). Food Security and Food Production Systems. In: Climate Change 2014: Impacts, Adaptation, and Vulnerability. Contribution of Working Group II to the Fifth Assessment Report of the Intergovernmental Panel on Climate Change. http://www.ipcc-wg2.gov
PPLIP, 2005. Livestock Development for Sub-Sahara Africa. Pro-Poor Livestock Policy (PPLIP) Initiative. Research Report.
Ramirez-Villegas, J., Jarvis, A., and Laderach, P. (2013). Empirical approaches for assessing the impacts of climate change on agriculture: The EcoCrop model and a case study with grain sorghum. Agricultural and Forest Meteorology, 170: 67-78.
Rao, K. P. C., Ndegwa, W. G., Kizito, K. and Oyoo, A. (2011) Climate variability and change: Farmer perceptionsand understanding of intra-seasonal variability in rainfall and associated risk in semi-arid Kenya. Experimental Agriculture 47: 267–291.
Resakss. 2010. Regional Strategic Knowledge and Support System. Facilitated by IFPRI.[www.resakss.org]
Rickards, L and S. M. Howden, S.M. (2012). Transformational adaptation: agriculture and climate change. Crop and Pasture Science 63: 240–250)
Rockstrom, J. (2003). Water for food and nature in drought prone tropics: Vapour shift in rainfed agriculture. The Royal Society. 1997-2009.
Rosegrant, M.W. and N.D. Perez, 1997. Water Resources Development in Africa: A review and synthesis of issues, potentials and strategies for the future. EPTD Discussion Paper No. 28, Washington DC, IFPRI.
Rosegrant, M.W and the IMPACT Development Team (2012). International Model for Policy Analysis of Agricultural Commodities and Trade (IMPACT) International Food Policy Research Institute Washington, D.C.
Rosen S, and S. Shapouri 2012. Factors Affecting Food Production Growth in Sub-Saharan Africa. http://www.ers.usda.gov/amber-waves/2012-september/factors-affecting-food-production.aspx#.U3ukI_ldWSo
Sadik, N., 1991. Food, Nutrition and Agriculture, 1: 3-6
Sanchez, P.A. and Swaminathan, (2005). Hunger in Africa: the link between unhealthy people and unhealthy soil. Lancet 265: 442–444.
Sansoucy, R., M. A. Jabbar, S. Ehui and H. Fitzhugh (1995), Keynote paper: The contribution of livestock to food security and sustainable development, in: Livestock Development Strategies for Low Income Countries, FAO/ILRI, Rome/Nairobi.
Savenije, H. H. G. 1998. How do we feed a growing world population in a situation of water scarcity? In: Water- The key to socio=economic development and quality of life. 8th Stockholm Sympossium, 10-13 August, 1998
Sissoko, K., van Keulen, H., Verhagen, J., Tekken, V., & Battaglini, A. (2011). Agriculture, livelihoods and climate change in the West African Sahel. Regional Environmental Change, 11(1), 119-125.
Schlenker W and Lobell DB (2010) Robust negative impacts of climate change on African agriculture. Environmental Research Letters 5: 014010.
Schroter, D., Polsky, C and Patt, G. (2005). Assessing vulnerabilities to the effects of global change: an eight step approach. Mitigation and Adaptation Strategies for Global Change 10: 573–596.
Smith P, et al. (2008). Greenhouse gas mitigation in agriculture. Phil. Trans. R. Soc. B 27 February 2008 vol. 363 no. 1492 789-813.
Stern, R. D. and Cooper, P. J. M. (2011) Assessing climate risk and climate change using rainfall data–a case study from Zambia. Experimental Agriculture 47: 241–266.
Stocker, T.F., D. Qin, G.-K. Plattner, L.V. Alexander, S.K. Allen, N.L. et al, (2013) Technical Summary. In: Climate Change 2013: The Physical Science Basis. Contribution of Working Group I to the Fifth Assessment Report of the IPCC. http://www.ipcc-wg2.gov
Stoorvogel, J.J., Smaling, E.M.A. and Janssen, B.H. (1993) Calculating soil nutrient balances in Africa at different scales. Fertilizer Research, Vol. 35, pp227-23
Taub, D. (2010) Effects of Rising Atmospheric Concentrations of Carbon Dioxide on Plants. Nature Education Knowledge 3(10):21
Thomas, D.S.G., Twyman, C., Osbahr, H. and Hewitson, B. (2007). Adaptation to climate change and variability: farmer responses to intra-seasonal precipitation trends in South Africa. Climatic Change (2007) 83:301–322.
Toenniessen, G., Adesina, A. and DeVries, J. (2008). Building an alliance for a Green Revolution in Africa. Annals of the New York Academy of Sciences, 1136(1), 233–242. doi: 10.1196/annals.1425.028.
Thompson, L. G. 2010. Climate Change: The Evidence and Our Options. The Behavior Analyst, No. 2-33, 153–170.
Thompson, L. G., Brecher, H. H., Mosley-Thompson, E., Hardy, D. R., & Mark, B. G. (2009). Glacier Loss on Kilimanjaro Continues Unabated. Proceedings of the National Academy of Sciences, 106, 19,770 – 19,775.
Thorton, P. K., Jones, P. G., Ericksen, P. J. and Challinor, A. J. (2010): Agriculture and food systems in sub-Saharan African in a 4oC+ World, Philosophical Transactions of the Royal Society A. 369, doi: 10.1098/rsta.2010.0246
USDA, 2012. Factors Affecting Food Production Growth in Sub-Saharan Africa. www.ers.usda.gov/amber-waves • Economic Research Service/USDA

50 | Africa Agriculture Status Report 2014
van Vuuren, D.P , et al (2011). The representative concentration pathways: an overview. Climatic Change 109: 5–31
Verchot, L.V. (2007). Opportunities for climate change mitigation in agriculture and investment requirements to take advantage of these opportunities. A report to the UNFCCC Secretariat Financial and Technical Support Programme. ICRAF, Nairobi, Kenya. 2 July 2007. http://www.icraf.com/downloads/publications/PDFs/rp15435.pdf
Vermeulen S.J. (2014). Climate change, food security and small-scale producers. CCAFS Info Brief. CGIAR Research Program on Climate Change, Agriculture and Food Security (CCAFS). Copenhagen, Denmark. Available online at: www.ccafs.cgiar.org
Vincent, K. (2007) Uncertainty in adaptive capacity and the importance of scale. Global Environmental Change 17, 12–24.
Waithaka, M., Nelson, G.C., Thomas, T.S. and Kyotalimye, M. (2013) East African Agriculture and Climate Change: A Comprehensive Analysis. International Food Policy Research Institute, 2033 K Street, NW Washington, DC 20006-1002, USA.
Washington, R., Harrison, M., Conway, D., Black, E., Challinor, A.J., Grimes, D; Jones, R., Morse, A., Kay, G., Todd, M. (2006) African Climate Change: Taking the Shorter Route, Bulletin of the American Meteorological Society, 87(10), pp1355-1366. doi:10.1175/BAMS-87-10-1355
Wiggins, S. 2009. Can the smallholder model deliver poverty reduction and food security for a rapidly growing population in Africa? Paper for the Expert Meeting on How to feed the World in 2050, Rome.
Wiggins, S. and K. Sharda, 2013. Looking back, peering forward: what has been learned from the food-price spike of 2007–2008?
World Bank (2008). The Growth Report: Strategies for Sustained Growth and Inclusive Development. Commission on Growth and Development, World Bank, Washington D.C.

Africa Agriculture Status Report 2014 | 51

52 | Africa Agriculture Status Report 2014
Chapter 2 Agricultural Land, Water Management and Climate Change in Sub-Saharan Africa

Africa Agriculture Status Report 2014 | 53
KEY MESSAGES
Climate change is already affecting SSA agricultural productivity and will have greater negative impacts in the future, largely due to low adoption of climate-smart land and water management practices and high rates of poverty that reduce smallholder farmers’ coping capacity.
Climate-smart practices – which involve using a combination of organic and inorganic inputs and improved crop varieties – are more profitable and have lower climate-related risks than conventional practices. Even so, adoption of these practices in SSA is more limited relative to conventional practices – which are land degrading and have lower favorable effects on adapting to climate change.
Improving agricultural water management is one of the key requirements for increasing resilience and adaptation to climate change, but achieving this will require greater and more coordinated investments by governments and development partners that aim to address negative impacts of climate change on smallholder farmers livelihoods.
SSA has the lowest uptake of agricultural mechanization in the world, a major constraint to the adoption of climate-smart management practices. Increasing agricultural mechanization will require strengthening farmer organizations, agricultural commercialization, and investments in rural services for farm machinery
Adaptation to climate change in SSA is achievable, but requires more larger and more coordinated investments, as well as institutional changes that deliberately address the impacts of climate change
ONE
TWO
FOUR
FIVE
THREE
54 | Africa Agriculture Status Report 2014
IntroductionClimate change is very likely to lead to a reduction in yields of major cereal crops in sub-Saharan Africa (SSA), with strong regional variability (Lobell et al., 2008; Liu et al., 2008; Walker and Schulze, 2008; Thornton et al., 2009a; Lobell et al., 2011; Roudier et al., 2011). The intergovernmental Panel on Climate Change (IPCC) estimates that climate change in SSA will reduce crop yields by 8% by 2050 (Porter et al., 2014). The yield reduction on rainfed cropland could be as high as 50% by 2020 (Nakooda et al., 2011). Maize is one of the most vulnerable crops: estimated yield losses range from 18% for Southern Africa (Zinyengere et al., 2013) to 22% aggregated across SSA, with yield losses for South Africa and Zimbabwe exceeding 30% (Schlenker and Lobell, 2010).
The impact of climate change on agricultural productivity is severe in SSA due to low adoption of key production technologies that enhance adaptation to climatic change and increase productivity. Area planted with improved crop varieties in 1998 in SSA was only 27%, compared to 82% in developing Asia, 52% in the Latin America and Caribbean countries, and 58% in North Africa and Near East (NENA) during the same period (Evenson, 2000). The average application rate of inorganic fertilizer in SSA – which increases soil carbon (Vlek et al., 2004) and consequently reduces climate-induced production risks (Cooper et al., 2009, 2011) – was only 11 kg NPK/ha in 2001-10, compared to an average of 34 kg NPK/ha for East Europe [the region that had the second lowest fertilizer application rate in the world during the same period (FAOSTAT)]. Pender et al. (2009) estimate that only about 5 million hectares of cropland benefit from low-cost, productivity-enhancing land management practices (e.g., incorporation of crop residues and use of other organic inputs). Only 6% of SSA cropland is irrigated (You
et al., 2013), far less than in other regions. The level of mechanization in the region is also low, which contributes to poor agricultural productivity. Human power accounts for 65% of farm energy used in SSA (FAO, 2005), which makes it harder for farmers to adopt labor-intensive, climate-smart farming practices.
These realities make adaptation to climate change especially difficult for smallholder farmers. Addressing these challenges require empirical evidence to support efforts to design policies and strategies for increasing uptake of technologies that are profitable, increase agricultural productivity, reduce climate-related production risks, and contribute to the mitigation of climate change.
The main objective of this chapter is to analyze the land and water management practices required to simultaneously enhance agricultural productivity, profitability and resilience to climate change. The chapter begins with an analysis of sustainable land and water management practices that enhance agricultural productivity and their profitability. These practices comprise a key area of investment for climate-smart agriculture that simultaneously addresses food security and climate change challenges (see Chapter 3). This is followed by an analysis of the adoption rates of improved land management practices and how their use is related to increasing profitability. Agricultural water management is also discussed, with a focus on those practices that enhance adaptation to climate change. Agricultural mechanization in the region is then discussed, focusing on the role it can play in increasing the adoption of sustainable land and water management practices that enhance climate change adaptation. Policy implications of the above are then highlighted, with a focus on strategies required to enhance agricultural productivity and adaption to climate change across SSA.
Climate-smart Sustainable Land Management PracticesClimate-smart sustainable land management practices are those that simultaneously and sustainably increase productivity, strengthen resilience, and contribute to the mitigation of climate change by reducing greenhouse gas emissions and sequestering carbon on farmlands (FAO, 2010; World Bank, 2012; Beddington, 2013). Land and water management practices that have been proven to be climate-smart on rainfed systems include, for example: mulching and crop residue management (Cooper et al., 2009); conservation agriculture (Hobbs and Govaerts, 2010); mixed crop-livestock farming (Braimoh et al., 2013); and integrated soil fertility management (ISFM)
(Srinavasao et al., 2012). These land management practices typically help to regulate climate change by increasing soil carbon over time. Soil carbon also improves moisture retention capacity and other physical soil characteristics important for adaptation to climate change.
ISFM involves combining judicious quantities of chemical fertilizers with organic inputs and improved germplasm (Vanlauwe and Giller, 2006; Tittonnell, 2008) and is especially important because it significantly increases soil carbon (Makumba et al., 2007; Nandwa and Bekunda
Africa Agriculture Status Report 2014 | 55
1998; Killham, 2011). In a study covering four SSA countries, Nkonya et al. (2012) showed that the returns to applying one kg of Nitrogen to maize increased by 58% on plots receiving both fertilizer and manure, compared to plots using inorganic fertilizer only. Our analysis will pay particular attention to ISFM since it has been shown to have a number of favorable attributes.
The profitability and yield variance of selected ISFM practices was examined using DSSAT (Decision Support System for Agro-technology Transfer) -CENTURY agro-ecosystem crop simulation models. The analysis included simulations of the impact of manure, fertilizer, crop residue incorporation, and a combination of the four practices at different levels (for methodological details, see Nkonya et al., 2011).
Figure 2.1 shows that, for maize and rice, land management practices that combine crop residues with the use of fertilizer and with manure produce the highest returns, compared to using either of the practices alone. This is consistent with other studies that have shown that ISFM practices are profitable (e.g., Doraiswamy et al., 2007). If farmers were making rational economic decisions with full information, one would expect that land management practices with high returns would have corresponding high adoption rates. Unfortunately, this is not the case. Based on nationally representative data drawn from agricultural household survey in six SSA countries in East, Southern and West Africa, only 6% of households reportedly used ISFM, while about 50% did not use inorganic fertilizer or organic inputs – the least profitable and most land degrading management practice (Table 2.1).
Figure 2.1 Net Present Value (NPV) of maize and rice under different soil fertility management practices, Guinea Savanna region, Nigeria
Note: CR = crop residue incorporation
Source: Crop simulation results
0 -5
0
5
10
15
20
25
30
50
100
150
200
250
CR100% Manure 1.7 tons/ha 50% CR
40 kg N/ha manure1.7 tons/ha & 50%
CR
80 kg N/ha, 100% CR
80 kg N/ha, 5 tons/ha manure,
100% CR
NP
V, (U
S$
/HA
/YE
AR
), M
AIZ
E
NP
V, (U
S$
/HA
/YE
AR
), R
ICE
Maize
Rice
Table 2.1 Adoption (%) and profitability (US$/ha/year) of soil fertility management practices in SSA COUNTRY ISFM ORGANIC INPUTS FERTILIZER NOTHINGMali 0 11 23 66
Uganda 0 68 1 31
Kenya 16 22 17 44
Nigeria 1 28 23 47
Malawi 8 3 52 38
Tanzania 1 3 1 95
Mali 18 37 16 27
ISFM FERTILIZER ORGANIC INPUTS NOTHINGAdoption rate (%) 6.2 19.1 24.6 49.8
Profit (US$/ha/year)a 36.5 24.6 15.1 10.4

56 | Africa Agriculture Status Report 2014
Returns to ISFM practices for maize in Nigeria are reported in Figure 2.1, while Figure 2.2 summarizes the land management adoption rates reported in Table 2.1. The results show an inverse relationship between profit and adoption rate of land management practices; a phenomenon euphemistically referred to as the ‘unholy cross’. Why such an economically irrational decision by farmers when many studies show that they respond to market signals (e.g., Eriksson, 1993; Barrett, 2008)?
A number of biophysical and socioeconomic constraints limit adoption of ISFM and water management practices (Twomlow et al., 2006; Braimoh, 2012). In a broader context, Barrett (2008) notes that high transaction costs, limited access to improved technologies, and lack of productive assets are the major constraints that limit farmer participation in agricultural input and output markets. Hence, promoting group marketing and improving access to markets through road construction could facilitate farmers’ adoption of land management practices that produce high returns, but require the purchase of external inputs – namely inorganic fertilizer and improved seeds.
Additionally, data used in this study (see Nkonya et al., 2011) shows that farmers are less likely to use inorganic fertilizer on plots with poor soil fertility in Nigeria, but are more likely to use manure, or plant trees, or nothing. Likewise, farmers in Uganda – where inorganic fertilizer application is low – are more likely
to use manure on plots with fine-textured soils than on sandy soils and to plant trees on sandy soils. Moreover, households with mixed crop-livestock production systems are more likely to use a mix of both organic and inorganic fertilizer in Nigeria and only manure in Uganda. Taken together, these results suggest that farmers with lower soil fertility are less likely to adopt ISFM. A major reason is the non-existence of manure market.
The impact of education on adoption of ISFM practices differs across East and West Africa. In Kenya, more educated heads of households are found to be more likely to adopt mulching, crop residue management, fertilizer, and conservation structures. Similarly, post-secondary education in Uganda is associated with a higher likelihood to use crop rotation, mulching, crop residue and tree planting, whereas secondary education is associated with fertilizer use and deep tillage. In Niger and Nigeria, however, higher education generally has negative or non-significant associations with land management practices. This could be due to the high opportunity cost of highly educated labor, which makes it more costly to adopt labor-intensive land management practices. This raises the need for mechanization, which is discussed later in this chapter.
Access to rural services, namely markets and extension services, has different impacts on the likelihood to use climate-smart practices. Closer proximity to markets increases the probability of adopting mineral fertilizer,
Figure 2.2 An ‘unholy cross’: The inverse relationship between adoption rate and profitability
Sources: Adoption rate of land management practices: Mali: Direction nationale de l’informatique (DNSI) and the Recensement general de l’agriculture, 2004/2005; Uganda: Uganda national panel survey 2009/10 Agriculture module; Kenya: Kenya Agricultural Sector Household Baseline Survey; Nigeria: Fadama III household survey, 2012; Malawi: National panel survey, agriculture module, 2010/11
Note: Returns are to maize in Nigeria for the following land management practices: i) ISFM (5 t/ha manure, 80 kg N/ha, 100% crop residues, ii) Fertilizer: 80 kg N/ha + 100% crop residues, iii) manure 5 t/ha, 100% crop residues, iv) Nothing – no manure or fertilizer applied, 100% crop residues.
Adoption rate
Profit US$/ha/year
-50
0
50
100
150
200
250
ISFM Fertilizer Manure Nothing
AD
OP
TIO
N R
ATE
(%),
PR
OF
ITA
BIL
ITY
(US
$/H
A/Y
EA
R)

Africa Agriculture Status Report 2014 | 57
mulching, and tree planting in Kenya, irrigation and crop rotation in Nigeria, and mulching in Niger. Farmers in remote areas are more likely to use composting and soil conservation in Kenya and Niger, and manure in Nigeria, than those in areas closer to agricultural markets. These results suggest that farmers in remote areas are more likely to use organic soil fertility management practices than those closer to markets.
Access to extension services increases the probability of adopting fertilizer, irrigation, and crop rotation in Nigeria, irrigation in Niger, and tree planting in Uganda. However, access to extension services reduces the probability of adopting the practice of applying manure in Nigeria, using crop rotations in Uganda, and using alley cropping, mulching and soil conservation in Niger. These results suggest that extension services are generally weak in providing advisory support on organic soil fertility management practices. As expected, the presence of projects or programs promoting sustainable land management practices in a village increased the probability of fertilizer, manure and compost adoption in Nigeria, alley cropping in Niger, and mineral fertilizer in Uganda. The different influences of traditional agricultural extension services and land management projects show their potential complementarity. The results underscore the importance of multiple providers of extension services that can provide different kinds of complementary
technologies. Our results also suggest the need to increase the capacity of agricultural extension services to provide ISFM practices.
Impacts of sustainable land management practices on climate-related production risksVariability in yields is among the major consequences of climate change and weather variability. Using household cross-sectional data collected from Kenya and Uganda in East Africa, and from Nigeria and Niger in West Africa, the mean-variance of crop yields was analyzed using the method of Just and Pope (1979). The discussion below focuses on soil fertility management and variables that are relevant to policy decisions (for details on methodological approaches and how statistical and econometric issues were addressed, see Nkonya et al., 2011). Access to roads and markets reduces production risks in the semiarid areas (Table 2.2), which highlights the importance of enhancing markets as part of building resilience to climate change. Access to extension services also reduces production risks in all agro-ecological zones (AEZs) – highlighting the importance of technical information in climate change adaptation.
Table 2.2 Drivers of crop production risks (deviation from conditional mean crop yield) VARIABLE SEMIARID HIGHLANDS HUMID ALL AEZ
LOG (VARIANCE OF VALUE OF CROP PRODUCTIVITY/HA)
ACCESS TO RURAL SERVICES
- Ln (distance to road, km) -0.019* 0.435*** 0.152 -0.089
- Ln (distance to agricultural market, km) -0.023* -0.132 0.065 0.304***
Have access to extension services -0.042* -0.415*** -0.315* 0.055
Have access to credit -0.029 0.134 0.168 -0.082
HUMAN CAPITAL
PRIMARY ACTIVITY OF HOUSEHOLD HEAD (CF. CROP PRODUCTION)
- Livestock production 0.092 0.197 0.612
- Non-farm activities 0.245*** -0.07 -0.224 0.175
Female-headed household 0.037 -0.185 -0.184 0.15
- Ln (household size) -0.023 0.264** 0.077 0.592***

58 | Africa Agriculture Status Report 2014
Formal education has ambiguous impacts on production risks. Compared to no formal education, primary education increases production risks in the drylands and highlands. However, post-secondary education reduces production risks, but the numbers of farmers with post-secondary education were very few. It appears that the impact of formal education on production risks may be interacting with other unobserved variables in the study, requiring further analysis.
Consistent with other studies (e.g., Cooper et al., 2009; Hobbs and Govaerts, 2010; Srinanavasao et al., 2012),
organic soil fertility management markedly reduce production risks. The results highlight the large potential played by organic soil fertility management in addressing climate change adaptation. Additionally, inorganic fertilizer also reduces production risks in semiarid areas (Table 2.2). This serves an important role that proper use of inorganic fertilizer through innovative approaches, such as microdosing, could help build the soil carbon (Vlek et al., 2004; Liniger et al., 2011) and consequently reduce production risks. The results further show the key role played by organic soil fertility in reducing climate-related production risks.
VARIABLE SEMIARID HIGHLANDS HUMID ALL AEZ
LOG (VARIANCE OF VALUE OF CROP PRODUCTIVITY/HA)
LEVEL OF EDUCATION OF HOUSEHOLD HEAD (CF. NO FORMAL EDUCATION)
- Primary education 0.350*** 0.541*** 0.012 0.477
- Secondary education -0.038 0.09 0.265 0.827***
- Post-secondary education -0.379** 0.439 0.002 -2.040***
PHYSICAL CAPITAL ENDOWMENT
- Ln (plot area, ha) 0.090*** -0.068 0.062 0.784***
- Ln (value of livestock, US$) 0 -0.011 -0.024 -0.009
FARMER ASSESSMENT OF SOIL FERTILITY OF PLOT (VERY GOOD)
- Poor 0.004 -0.03 -0.217 0.031
- Moderate -0.002 0.112 -0.237 0.005
ADOPTION OF SOIL FERTILITY MANAGEMENT PRACTICES
- Manure -0.027* -0.309* -0.338 -0.293
- Inorganic fertilizer -0.194* 0.965*** 0.123 -0.459
- Crop residues -0.619** -0.773*** 0.164 -0.529
- Manure and Fertilizer -0.221* 1.211 -0.276 0.694
- Crop residue and fertilizer - -1.620* -0.835 1.578**
- Manure & Residue -0.171 -0.899** 0.85 1.102*
COUNTRY (CF. NIGER)
Uganda - -7.794*** -7.790***
Nigeria -0.111
AGROECOLOGICAL ZONE (CF. HUMID)
- Semiarid -3.962***
- Highlands 1.669***
Constant 0.357*** 8.364*** 8.981*** 2.931***
Source: Household survey reported by Nkonya et al. (2011)
Africa Agriculture Status Report 2014 | 59
Water Management for Climate Change Adaptation in SSAWater is a key driver of agriculture productivity and the impact of climate change on its supply, quantity, and distribution requires efficient water management. Box 2.1 gives a strong rationale for improving agricultural water management to enhance climate adaptation. Currently, insufficient measured data represent a systemic limitation for obtaining an accurate estimation of actual and future water resource availability in Africa (Neumann et al., 2007; Batisani, 2011). Furthermore, the availability of water in SSA differs widely as a consequence of the great diversity of biophysical and socioeconomic conditions of each country.
Climate projections show that mean annual temperature and evaporation are likely to increase over the African continent, particularly in the most arid regions. A reduction in precipitation is likely to occur over Northern Africa and the Southwestern parts of South Africa, leading to a future decrease in water availability (IPCC WGll, 2014; FAO, 2008). Extreme events, such as droughts and floods are expected to become more
frequent, due to the increasing variability of climate (FAO, 2008; Tomlow et al., 2008; MacDonald et al., 2009). Frequent droughts are likely to cause severe water shortages and intensification of stress on groundwater delivery infrastructures (UNEP, 2003; Cooper et al., 2008; Stern Report, 2006; IRI, 2006; UNDP, 2006). MacDonald et al. (2009) point out that, areas with precipitation of between 200 to 500 mm per year – the Sahel, the Horn of Africa, and Southern Africa – could experience a decline in groundwater recharge. Our understanding of how climate change will affect water resources and water quality in Africa is still insufficient (IPCC WGll, 2014). However, different independent studies indicate that the impact of climate change on water resources is expected to be relatively small compared to the strong influence that non-climate drivers are likely to have, such as population growth, water withdrawals, increases in GDP, urbanization, increases in irrigated areas, and land-use changes (Calow and MacDonald, 2009; MacDonald et al., 2009; Beck and Bernauer, 2011).
Box 2.1 Rationale for focusing on Agricultural Water ManagementAgricultural water management is “the management of all the water put into agriculture (crops, tree crops and livestock) in the continuum from rainfed systems to irrigated agriculture. It includes irrigation and drainage, rainwater harvesting, soil and water conservation, agronomy, interventions such as integrated watershed management, and all relevant aspects of management of water and land” (Mati, 2010; FAO, 1995). Improving access, control, and management of water in agriculture will enhance agricultural productivity and profitability in many ways. These include: i) reducing crop water stress by reducing runoff, evaporation, and deep percolation losses and removal of excess water; ii) reducing water-induced soil and nutrient loss; iii) facilitating crop production in dryland areas; iv) increasing cropping intensity; and v) reducing climatic risk and thereby facilitating crop intensification and diversification.
The Africa Water Vision for 2025 visualizes “An Africa where there is an equitable and sustainable use and management of water resources for poverty alleviation, socioeconomic development, regional cooperation and the environment” (UN Water/Africa, 2003). However, most of the focus for this vision has gone into water and sanitation initiatives, while development of agricultural water has been fairly limited – yet it has huge potential. For instance, out of the 39.4 million hectares with potential for improvement, only 7.1 million hectares (18%) or just 3% of the total farmed area has been equipped for agricultural water management in SSA (World Bank, 2006). Of this, three countries (Sudan, South Africa and Madagascar) account for two thirds of the developed area, while water-managed area in the remaining countries does not exceed 300,000 ha/country. Meanwhile, over the last 40 years, only 4 million hectares of land have been put under new agricultural water management in SSA. Over the same period, China and India added 25 and 32 million hectares, respectively (World Bank, 2007; Molden et al., 2007). Therefore, progress in enabling agriculture to benefit from water management has been very slow in SSA, equivalent to a growth rate of just 1%, and targeted development is needed.

60 | Africa Agriculture Status Report 2014
An average of about 77% of water withdrawals in SSA are used for agricultural purposes, reaching as high as 90% in East Africa. According to FAO (2009), water demand on the part of three sectors in Africa (agriculture, industry and households) will increase about 40% by 2030. Climate change will intensify the current water competition between communities (exacerbating internal social conflicts) and countries, in particular in regions that are expected to become drier and that are more dependent on foreign water resources. The capacity of groundwater delivery systems to meet increasing demands for water will acquire increasing importance in the context of prospective scenarios regarding climate change (IPCC WGll, 2014; Calow and MacDonald, 2009).
Irrigated agriculture is still undeveloped in SSA, representing only 0.6% of total agricultural land (cropland and rangeland). Rainfed agriculture remains the predominant agricultural production system. More than half of the irrigation-equipped area is concentrated in four countries: South Africa (30%), Madagascar (20%), Nigeria (5%) and Ethiopia (5%). Other forms of agricultural water management (non-equipped lowland areas, wetlands, inland valley bottoms) are mainly located in humid regions. Flood
recession agriculture is widespread, especially in dry zones.
The trend of total agricultural land and irrigation-equipped area from 1961 to 2011 in SSA is shown in Figure 2.3. Total agriculture land increased by some 8% in the last decade, while the area equipped with irrigation remained stable, after a steady increase from 2 to 5 million hectares from 1960 to 2000. This trend can be explained by important changes occurring in the irrigation sector. For instance, the increase of irrigation area before 2000 is related to large-scale irrigation plans promoted by some SSA governments in countries served by large perennial rivers. From the end of the 1990s onward, the increase in irrigated area has slowed as governments transferred irrigation scheme management to users. Furthermore, donor interest in this sector decreased for several reasons, such as the decline in food prices, the high per-hectare development cost (irrigation development became more expensive because the easiest areas for irrigation had already been developed), investments necessary for rehabilitation, etc. In recent years, in many SSA countries investments were finalized to promote small irrigation projects, sometimes with private sector investment, involving user participation to achieve more effective results.
Figure 2.3 Evolution of agricultural and irrigation-equipped areas in Africa regions from 1961 to 2011
0
1000
2000
3000
4000
5000
6000
7000
8000
9000
10000
0
0.5
1
1.5
2
2-5
3
3-5
4
4.5
1961 1970 1975 1980 1985 1990 1995 2000 2005 2010 2011
AG
RIC
ULT
UR
AL
AR
EA
(10
5 H
A)
AR
EA
EQ
UIP
PE
D F
OR
IRR
IGAT
ION
(10
3 H
A)
10
3 H
A /
PE
RS
ON
Middle AfricaEastern AfricaWestern AfricaSouthern Africa
Total equipped for irrigation
Agricultural area pro capite
Source: FAO, 2013b

Africa Agriculture Status Report 2014 | 61
Agricultural Water Management StrategiesAs agriculture represents the main water-consuming sector in SSA, measures to increase water efficiency and enhance resilience of the agricultural system are particularly relevant in coping with future climate change developments. There are many options for increasing agricultural water use efficiency, including: i) sustainable intensification and increase of irrigated crop areas; ii) increase in crop productivity; iii) cultivation of water-efficient and drought-tolerant crops; iv) sustainable water management through seasonal rainfall harvest; v) adoption of low-cost and conservative agricultural practices to address climate variability, and vi) diversification of farming systems and associated livelihoods (IPCC WGll, 2014; FAO, 2008; UNEP, 2003; Twomlow et al., 2008). Sustainable agricultural intensification – i.e., achieving increased outputs from the same cropped areas with reduced negative environmental impacts – is being promoted across SSA. This includes intercropping, integrated pest management, conservation agriculture, crop breeding, cropping system improvements, agroforestry and soil conservation, and livestock and fodder crops (Pretty et al., 2011; The Montpellier Panel, 2013). Conservation agriculture practices, such as agroforestry, conservation tillage, contouring and terracing, and mulching can also contribute to improving landscape hydrology, resilience in agro-ecosystems, and livelihoods, and be a response to climate risks (IPCC). Modification of cropping systems can allow adapting to variability in
the rainy season, reducing water use, and optimizing irrigation (FAO, 2008). Furthermore, water use efficiency can be achieved through practices such as zero or minimum tillage, which can contribute to improved soil structure, topsoil organic matter content, and increases in soil moisture. However, no tillage requires the adoption of an efficient and integrated weed management system.
The threat of climate change in areas with poorly distributed water resources is expected to increase the vulnerability of land users to crop failures, and hence their exposure to food insecurity. There is broad agreement that climate change will impact rainfall, making it more variable and less reliable (Lenton and Muller, 2009). In general, almost all agricultural water management technologies and practices can have some impact on climate change resilience. The designation of what constitutes best choices in water management for SSA, however, is broad and includes various combinations of technologies, practices, and approaches for sustaining the control of water, and its conveyance and application from such sources as rainfall, surface runoff, and subterranean aquifers. Examples of agricultural water management technologies are summarized in Table 2.3. The next section then discusses selected agricultural water management interventions for enhancing adaptation to climate change.
Table 2.3 Agricultural water management technologies by scale of application
SCALE WATER SOURCE WATER CONTROL WATER LIFTING CONVEYANCE APPLICATION DRAINAGE &
REUSE
SMAL
LHOL
DER
FARM
-LEV
EL RAIN
W
ATER
• In situ water• Farm ponds• Rain Column
Green Wall• Cistern and
underground ponds• Roof water harvesting• Recession agriculture
• Treadle pumps• Water cans
• Drum • Channels• Pipes
• Flooding• Direct
application• Drip
• Drainage of water logging
• Surface drainage channels
• Recharge wells
SURF
ACE
WAT
ER
• Spate and flooding• Diversion• Pumping
• Micro pumps (petrol, diesel)
• Motorized pumps
• Channels• Canals• Pipes (rigid,
flexible)
• Flood & Furrow
• Drip• Sprinkler
• Surface drainage channels
• Drainage of water logging
GROU
ND
WAT
ER
• Spring protection• Hand dug wells• Shallow wells
• Gravity• Treadle pumps• Micro pumps
(petrol, diesel)• Hand pumps
• Channels• Canals• Pipes (rigid,
flexible)
• Flood & Furrow
• Drip• Sprinkler
• Surface drainage channels
• Drainage of water logging
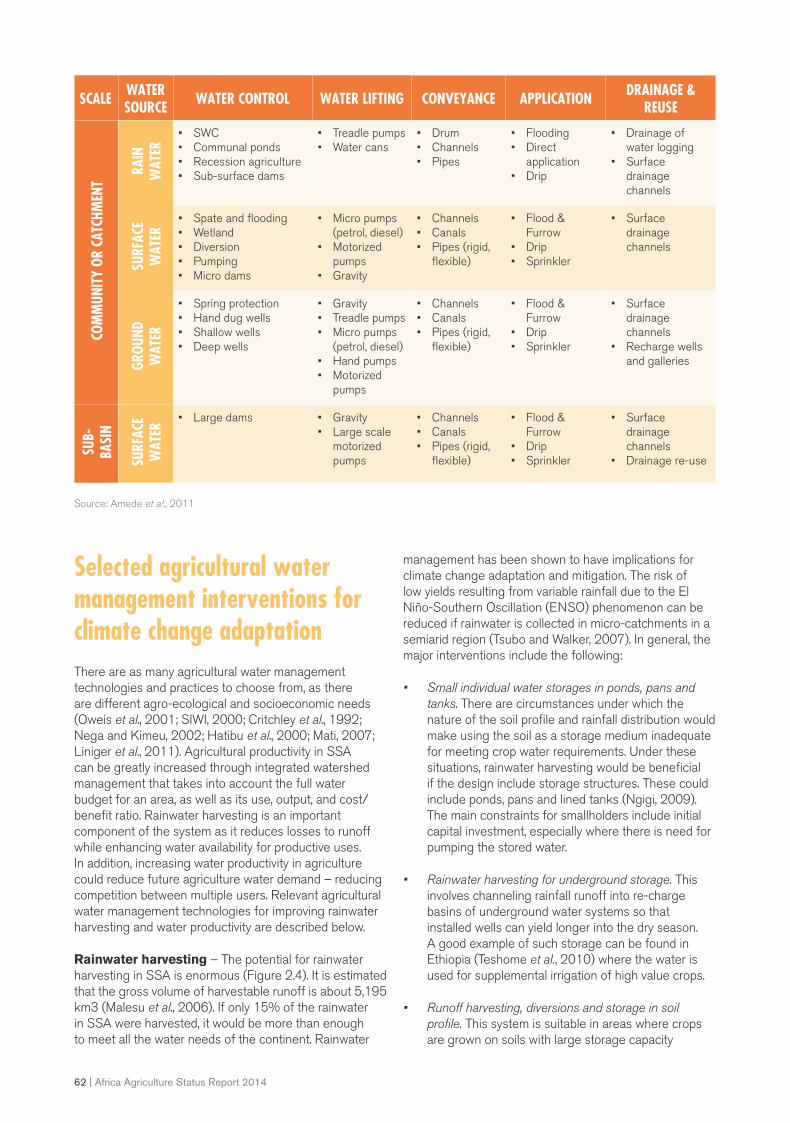
62 | Africa Agriculture Status Report 2014
Selected agricultural water management interventions for climate change adaptationThere are as many agricultural water management technologies and practices to choose from, as there are different agro-ecological and socioeconomic needs (Oweis et al., 2001; SIWI, 2000; Critchley et al., 1992; Nega and Kimeu, 2002; Hatibu et al., 2000; Mati, 2007; Liniger et al., 2011). Agricultural productivity in SSA can be greatly increased through integrated watershed management that takes into account the full water budget for an area, as well as its use, output, and cost/benefit ratio. Rainwater harvesting is an important component of the system as it reduces losses to runoff while enhancing water availability for productive uses. In addition, increasing water productivity in agriculture could reduce future agriculture water demand – reducing competition between multiple users. Relevant agricultural water management technologies for improving rainwater harvesting and water productivity are described below.
Rainwater harvesting – The potential for rainwater harvesting in SSA is enormous (Figure 2.4). It is estimated that the gross volume of harvestable runoff is about 5,195 km3 (Malesu et al., 2006). If only 15% of the rainwater in SSA were harvested, it would be more than enough to meet all the water needs of the continent. Rainwater
management has been shown to have implications for climate change adaptation and mitigation. The risk of low yields resulting from variable rainfall due to the El Niño-Southern Oscillation (ENSO) phenomenon can be reduced if rainwater is collected in micro-catchments in a semiarid region (Tsubo and Walker, 2007). In general, the major interventions include the following:
• Small individual water storages in ponds, pans and tanks. There are circumstances under which the nature of the soil profile and rainfall distribution would make using the soil as a storage medium inadequate for meeting crop water requirements. Under these situations, rainwater harvesting would be beneficial if the design include storage structures. These could include ponds, pans and lined tanks (Ngigi, 2009). The main constraints for smallholders include initial capital investment, especially where there is need for pumping the stored water.
• Rainwater harvesting for underground storage. This involves channeling rainfall runoff into re-charge basins of underground water systems so that installed wells can yield longer into the dry season. A good example of such storage can be found in Ethiopia (Teshome et al., 2010) where the water is used for supplemental irrigation of high value crops.
• Runoff harvesting, diversions and storage in soil profile. This system is suitable in areas where crops are grown on soils with large storage capacity
SCALE WATER SOURCE WATER CONTROL WATER LIFTING CONVEYANCE APPLICATION DRAINAGE &
REUSECO
MM
UNIT
Y OR
CAT
CHM
ENT
RAIN
W
ATER
• SWC• Communal ponds• Recession agriculture• Sub-surface dams
• Treadle pumps• Water cans
• Drum • Channels• Pipes
• Flooding• Direct
application• Drip
• Drainage of water logging
• Surface drainage channels
SURF
ACE
WAT
ER
• Spate and flooding• Wetland• Diversion• Pumping• Micro dams
• Micro pumps (petrol, diesel)
• Motorized pumps
• Gravity
• Channels• Canals• Pipes (rigid,
flexible)
• Flood & Furrow
• Drip• Sprinkler
• Surface drainage channels
GROU
ND
WAT
ER
• Spring protection• Hand dug wells• Shallow wells• Deep wells
• Gravity• Treadle pumps• Micro pumps
(petrol, diesel)• Hand pumps• Motorized
pumps
• Channels• Canals• Pipes (rigid,
flexible)
• Flood & Furrow
• Drip• Sprinkler
• Surface drainage channels
• Recharge wells and galleries
SUB-
BASI
N
SURF
ACE
WAT
ER
• Large dams • Gravity• Large scale
motorized pumps
• Channels• Canals• Pipes (rigid,
flexible)
• Flood & Furrow
• Drip• Sprinkler
• Surface drainage channels
• Drainage re-use
Source: Amede et al., 2011

Africa Agriculture Status Report 2014 | 63
but direct rainfall is not sufficient for the soil’s capacity. Extra water, obtained through rainwater harvesting, is conveyed from other areas, an approach that integrates conservation of rainwater and supplementary irrigation (Steenbergen, 2011; Critchley and Siegert, 1992).
Improving water productivity – Water productivity is gauged by yield or net incomes per unit of water use by crop types and livestock (Molden et al. 2007). Another definition indicates water productivity is a measure of the amount of water needed to generate a given amount (or value) of produce. Because water productivity can be quantified, it enables improvements to be charted, thereby encouraging faster progress (Passioura, 2006). It is based on the concept of ‘more crop per drop’ – a key concept of agricultural productivity. By improving water productivity, the water saved could balance the water needs between agricultural and environmental services for climate change adaptation. Water productivity therefore means getting more value or benefit from the volume of water used to produce crops, fish, forests and livestock (Kijne et al., 2003). According to Molden et al. (2010), physical water productivity is defined as the ratio of (useful) crop output (for instance, 1 kg of grain) to the volume of water used to produce it (m3/kg or mm/ha/kg). The specific water use per unit of food produced (the inverse of water productivity) refers to kilograms of production and a more uniform measure – per 1,000 kcal of energy contained in that food (Rockström et al., 2007).
Efforts will be needed to exploit win-win opportunities/potentials for Africa, i.e., water management practices that simultaneously increase yields and water productivity.
Climate change adaptation measures that target water and crop management will be needed, especially in water-stressed areas. Improving water productivity will be one option to offset increased water demand from crops due to increases in atmospheric temperatures. Climate-smart agriculture, which incorporates adaptive innovations in which water is crucial, will be necessary. In the case of water productivity, options for adaptation can be defined at three levels: i) farm; ii) irrigation system or catchment (the system level); and iii) river basins and nations (the strategic or planning level).
There are options for adapting to climate change using different mixes of rainfed and irrigated agriculture, especially supplemental irrigation. All of the following interventions will need to be considered:
• Improved water storage is seen as one important option for adapting to climate change in Africa. However, water flows are likely to be more variable and extreme, which has implications for storage. Storage options will need to be flexible and entail low capital and operating costs; large surface water storage sites have mostly been developed already and groundwater recharge technology is still immature;
• Expanding and intensifying irrigation systems, targeting crops with high (economic) water productivity, such as fruits, vegetables and fodders;
• Conservation agriculture practices such as zero and minimum tillage can be applied to enhance soil moisture storage and improve soil structure and organic matter contents;
Figure 2.4 Relative potential for rainwater harvesting in Africa
Source: Malesu et al., 2006

64 | Africa Agriculture Status Report 2014
• Investing in peri-urban and urban irrigation systems, which an utilize natural rainfall, storm water storages or urban wastewater;
• Agroforestry systems, which include incorporating deep-rooted trees and shallow-rooted crops, can be used to better exploit available soil moisture, providing sufficient shade to allow high-value crops to be grown and maximizing benefits at the farm level;
• Precision agriculture, especially with regard to irrigation water management, which could mean shifting from surface to sprinkler irrigation, reducing the scale from boom-sprinklers to micro-sprinklers, shifting from sprinkler to drip irrigation and ultimately, the use of ‘smart water application techniques’ and greenhouse farming;
• Other water-saving methods, such as deficit irrigation, proper irrigation scheduling, sub-surface irrigation, and relay intercropping, could substantially improve water productivity; and
• In rainfed systems, developing integrated water systems that utilize reverse-slope terraces and water-harvesting techniques (pitting, trenches, basins) in order to capture every drop where it falls.
Micro-irrigation systems are also a promising way to improve water productivity. They utilize low-head, drip irrigation kits for smallholders. Many types of drip
irrigation systems are in use in many parts of SSA. Drip irrigation is the most efficient method of irrigating a crop. For instance, whereas sprinkler systems can achieve around 75-85% efficiency, drip systems typically are 90% efficient or higher if managed properly, since evaporation and runoff are minimized. The System of Rice intensification (SRI) is an innovative technology for growing paddy rice, which uses less water but incredibly increases yields (Laulanie, 1983; Uphoff, 2003). SRI has been successfully adopted in Kenya (Mati et al., 2011), improving irrigation efficiency, increasing yields, and reducing mosquito survival in paddies.
Another key intervention is integrating livestock into the water agenda, including in the design, planning and implementation of irrigation schemes (Amede et al., 2009). According to Steinfeld et al. (2006), there are four aspects that should be considered: i) water used to meet increasing feed demands; ii) controlling overstocking and improving watering points; iii) proper management of manure and wastewater; and iv) managing livestock intensification.
Finally, aquaculture (fish farming) can be practiced in large parts of the SSA where conditions are right. This involves excavation of fishponds, either on riverbeds or as artificial ponds or reservoirs stocked with fish. Rearing fish in ponds can be part of integrated systems utilizing water harvesting to increase water productivity. The fish in these ponds can be nourished using feed purchased from agrodealers, or using household food waste mixed with chopped leaves from certain bushes and trees.
Policies and Institutional Framework for Improving Agricultural Water Management in SSATo cope with increasing pressures on water resources in SSA, sustainable and efficient water management strategies are needed. Institutional framework changes are essential in this context, including greater inter-agency cooperation, clear consultation and communication, as well as active participation (FAO, 2008). The expected decline in water resources and increase in water withdrawals require greater water availability, which could be achieved through capital investment in reservoirs and infrastructure, reduction of water loss through water-conserving technologies, development of robust and flexible water allocation systems, and efficient water management. The need for water storage will increase, and storage options need to be flexible and involve low capital and operating costs, as they will have to cope with more variable and extreme flows (FAO, 2008). Since the management of natural resources, agriculture, water, and ecosystems
will become more complex, it is necessary to develop comprehensive programs that promote adaptation through a more holistic approach, including integrated programs on combating desertification and improving water management and irrigation efficiency (FAO, 2008, Twomlow et al., 2008). Integrated catchment management – a process that promotes the coordinated development and management of water, land and related resources in order to maximize economic and social welfare in an equitable manner without compromising the sustainability of vital ecosystems – is being increasingly included in SSA government strategies (Global Water Partnership, 2010). However, while there is growing theoretical consensus on this approach, implementation presents challenges, especially in developing countries, in relation to the lack of supportive formal and informal institutional contexts, and related investments in capacity building.
Africa Agriculture Status Report 2014 | 65
The existing policy and institutional framework influencing the development of agricultural water management in SSA are well stated by the New Partnership for Africa’s Development (NEPAD) and its Comprehensive Africa Agriculture Development Programme (CAADP), which recommended, “extending the area under sustainable land management and reliable water control systems, especially small-scale water control, building up soil fertility and moisture holding capacity of agricultural soils and expansion of irrigation”, as one of three ‘Pillars’ (NEPAD, 2003). There are also regional policies such as the Southern Africa Development Community (SADC) Water Policy and Land and Water Management for the Nile Basin Initiative. In most countries, there are national policies that support water development for agriculture, though most countries are in the process of reviewing their policies.
For instance, in a study of policies in nine countries of SSA (Mati et al., 2007) it was found that most policies place greater emphasis on drinking water and sanitation, paying less attention to water for agricultural purposes (Figure 2.5). This has resulted in lack of clear ownership of agricultural water management issues.
Some countries have also recently developed National Adaptation Plans (NAPAs) for climate change adaptation. Others have adopted public-private partnerships for financing agricultural water management activities. In addition, governments should also investigate the possibility of cushioning the poorest from the impacts of climate change on water resources. Investments in agricultural water management should be boosted to enhance farmers’ livelihoods, while also taking care of environmental sustainability.
Figure 2.5 Proportion of agricultural water management issues in sector policies in nine SSA countries
Source: Mati et al., 2007
0
1
2
3
4
5
6
7
8
9
Water &
San
it
Enviro
nmen
t
Agric &
Rura
l Dev
Land R
eform
PRSPs
Irrigati
onSAPs
Food
Sec
urity
Disaste
r Mgt
Livesto
ck
Fores
try
IWRM
Physic
al D
ev.
Wildlife
Decree
s
Land U
se
Natural
Res
Mgt
NO
. OF
CO
UN
TRIE
S
SECTOR POLICY
Major challenges to enhancing agricultural water management for climate change adaptation in SSAMost irrigation systems in SSA already exploit available sources of surface water, and therefore the extension of irrigated land, especially at the household level, should explore groundwater opportunities. This strategy is
suggested as an adaptation option to mitigate climate change impacts in agriculture (Kundzewicz et al., 2007; Pittalis, 2010). However, this implies the availability of low-cost local energy sources, which could be implemented through local integrated programs of rural development (see www.ghajaproject.net). In SSA countries, the number of farms under one hectare in size is significant and is expected to grow, as Africa is the only region in the world where the rural population is expected to grow through 2030 (FAO, 2013b). Small-scale farms have very low productivity and produce

66 | Africa Agriculture Status Report 2014
limited incomes, and can not support the high costs of an irrigation system. Often, because of insecure land tenure, smallholder farmers are not motivated to invest in their land in ways that raise productivity. For these reasons, future investments in the agriculture sector for purposes of significantly increasing crop productivity should focus on the needs of small-scale farming systems.
The major constraints to enhancing agricultural water management for climate change adaptation in SSA include negative perceptions regarding the returns on investment from agricultural water management, especially irrigation. Another is the high initial investment required, as sometimes supporting infrastructure such as roads, stores, and processing facilities may have to be constructed first. Moreover, the poorest and most vulnerable communities tend to be located in the driest
and most remote parts of the country (far from roads and market centers), making the transaction costs high for nearly any activity. The trial and error tendency of farmers exposed to irrigation and/or water harvesting for the first time can lead to mistakes, which could discourage both the farmers and investors.
Furthermore, the links between knowledge being available, its applicability, and its adoption by smallholders tend to be weak; investment capital and support from value chains is also often lacking (Chisenga and Teeluck, 2006). However, even with these limitations, the benefits of optimally managing water for agriculture far outweigh the threats, especially as the results of doing so include increased food security, wealth creation, poverty reduction, and improved livelihoods for smallholder farmers.
Mechanization Mechanization increases labor productivity and reduces drudgery – thus improving the quality of rural life and farming lifestyle. Additionally, mechanization can lead to performing tasks that cannot be done by human power, which in turn can increase the uptake of labor-intensive climate-smart agricultural practices. Mechanization can also enhance value addition and reduce post-harvest losses – a problem that leads to loss of about US$ 4 billion/year (World Bank, 2011).
SSA has the lowest rate of mechanization, with motorized equipment contributing only about 10% of farm energy, compared to 50% in other regions (Figure 2.6). This raises two important questions: 1) can mechanization be a tool for enhancing mitigation and adaptation to climate change, and 2) what can be done to increase climate-smart mechanization in SSA? The first question is addressed first, since it is important to know whether mechanization is a tool for adaptation and/or mitigation, or a cause of climate change.
Figure 2.6 Energy source in SSA and other developing regions
Source: FAO 2005
Note: Other developing regions considered include: LAC, developing Asia, and NENA
0
10
20
30
40
50
60
70
SSA Other developing regions
PE
RC
EN
T
Human powerAnimal powerMechanical power

Africa Agriculture Status Report 2014 | 67
Can mechanization be used as a tool for achieving climate-smart agriculture?Mechanization could be a tool for achieving climate-smart agriculture or worsening GHG emission. Both outcomes are examined, and then policies and strategies are discussed that could make mechanization a tool for achieving climate-smart agriculture.
Enhancing adoption labor-intensive climate-smart practices – Mechanization and other types of labor saving technologies increase land and labor productivity and could reduce production costs. As argued earlier, a number of climate-smart soil health management practices are organic inputs, which are bulky and labor intensive when used in systems with no or limited mechanization. For example, adoption of manure requires hauling it from kraals to crop plots. Hence, mechanization could contribute to increasing the adoption of ISFM and other labor-intensive organic land management practices that simultaneously increase yields and resilience to climate change. Mechanization could also enhance water-harvesting practices through improved tillage methods, construction of water-harvesting structures, transportation of organic inputs, and other direct and indirect benefits that may increase land productivity.
Improving the timeliness of farm activities – Mechanization can help improve the timeliness of farm operations by having the means to implement activities when required, rather than when manual labor and other resources dictate. This is especially crucial for climate change adaptation, where timing of farm operations is critical.
• Optimizing of tilling, time of planting, and weeding operations: One of the impacts of climate change is increased rainfall variability – especially in semiarid and arid zones, which cover about 43% of the land area in SSA (Dixon et al., 2001). Time of planting was the third most important adaptation strategy in East and West Africa (Nkonya et al., 2011). Similarly, time of tilling, planting, and weeding could enhance adaptation to climate change. Mechanization could improve timeliness of planting and weeding operations, and thus contribute to adaptation.
• Optimizing the timing of fertilizer application: Key to increasing the efficiency of fertilizer application is timing. Applying fertilizer at the wrong time may lead to poor yield response if the soils are dry. At the same time, applying fertilizer just before or during heavy rains may result in expensive nutrients being washed away. Applying fertilizer at the wrong time of the crop growth cycle, i.e., at a time other than when the plants need
fertilizer the most, is also sub-optimal. A study by Piha (1993) examined the timing of fertilizer application following the seasonal rainfall pattern. The study revealed that by changing the timing of application to coincide with the right rains, crop yield increased by 25-42% and profits increased by 21-41% compared to the existing fertilizer recommendations. A lack of mechanization compromises the timing of fertilizer application, which is done during the peak labor period. This leads to poor timing of fertilizer application and what Giller et al. (2006) call “negative soil fertility gradients away from the homestead”, i.e., plots away from home receive less of the bulky organic inputs. Unfortunately, fertilizer recommendations in SSA and other developing regions have focused mainly on the type and amount of fertilizer and little on the timing and methods to increase efficiency of fertilizer use (World Bank, 2006; Piha, 1993).
Contributing to climate change mitigation by improving nutrient use efficiency – About 47% of the nitrogen applied (36 out 78 million tons) is lost annually to the environment through leaching, erosion, runoff, and gaseous emissions (Roy, et al., 2002). Nitrogen recovery for rainfed crops is about 20-30%, while irrigated crops recover only 30 to 40% of applied nitrogen (Roberts, 2008). Inorganic nitrogen fertilizer placement and covering simultaneously reduces greenhouse gas emissions (Linquist et al., 2012) and increases nutrient use efficiency (NUE) (Roy et al., 2002). Likewise, covering of manure reduces methane emission (Eagle et al., 2012) and improves NUE (Roy et al., 2002; Roberts, 2008). Mechanization could contribute to reduction of gaseous emissions from nitrogen and manure in the following ways:
• By increasing NUE through better timing of fertilizer and organic input application, precision, and effectiveness through improved placement of appropriate quantities of applied inputs.
• Split application: The single application of large quantities of nitrogen may lead to greater losses than split applications that coincide with the plants’ nutrient requirements. A study done for irrigated rice in Indonesia and the Philippines showed that split application reduced the amount of nitrogen required by 17% without changing the yield (Roy et al., 2002). However, split application doubles the labor required and consequently increases production costs. Due to these constraints, the adoption of split fertilizer application is low. Again mechanization could alleviate the labor constraint and could reduce costs, provided the conditions discussed below are met.
Reducing drudgery and making agriculture more attractive to youth – Since the 1960s – a decade of independence for a majority of SSA countries – urbanization has increased at an annual rate of about 0.42%, the second highest urbanization rate in the
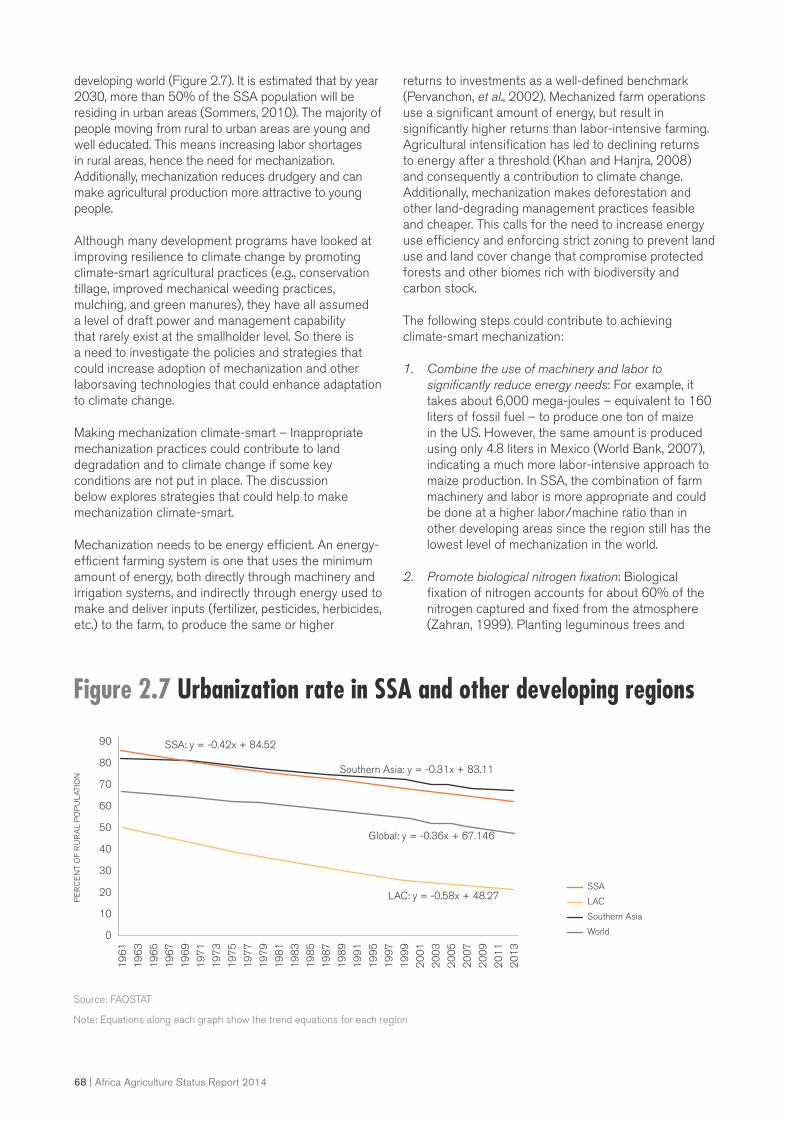
68 | Africa Agriculture Status Report 2014
developing world (Figure 2.7). It is estimated that by year 2030, more than 50% of the SSA population will be residing in urban areas (Sommers, 2010). The majority of people moving from rural to urban areas are young and well educated. This means increasing labor shortages in rural areas, hence the need for mechanization. Additionally, mechanization reduces drudgery and can make agricultural production more attractive to young people.
Although many development programs have looked at improving resilience to climate change by promoting climate-smart agricultural practices (e.g., conservation tillage, improved mechanical weeding practices, mulching, and green manures), they have all assumed a level of draft power and management capability that rarely exist at the smallholder level. So there is a need to investigate the policies and strategies that could increase adoption of mechanization and other laborsaving technologies that could enhance adaptation to climate change.
Making mechanization climate-smart – Inappropriate mechanization practices could contribute to land degradation and to climate change if some key conditions are not put in place. The discussion below explores strategies that could help to make mechanization climate-smart.
Mechanization needs to be energy efficient. An energy-efficient farming system is one that uses the minimum amount of energy, both directly through machinery and irrigation systems, and indirectly through energy used to make and deliver inputs (fertilizer, pesticides, herbicides, etc.) to the farm, to produce the same or higher
returns to investments as a well-defined benchmark (Pervanchon, et al., 2002). Mechanized farm operations use a significant amount of energy, but result in significantly higher returns than labor-intensive farming. Agricultural intensification has led to declining returns to energy after a threshold (Khan and Hanjra, 2008) and consequently a contribution to climate change. Additionally, mechanization makes deforestation and other land-degrading management practices feasible and cheaper. This calls for the need to increase energy use efficiency and enforcing strict zoning to prevent land use and land cover change that compromise protected forests and other biomes rich with biodiversity and carbon stock.
The following steps could contribute to achieving climate-smart mechanization:
1. Combine the use of machinery and labor to significantly reduce energy needs: For example, it takes about 6,000 mega-joules – equivalent to 160 liters of fossil fuel – to produce one ton of maize in the US. However, the same amount is produced using only 4.8 liters in Mexico (World Bank, 2007), indicating a much more labor-intensive approach to maize production. In SSA, the combination of farm machinery and labor is more appropriate and could be done at a higher labor/machine ratio than in other developing areas since the region still has the lowest level of mechanization in the world.
2. Promote biological nitrogen fixation: Biological fixation of nitrogen accounts for about 60% of the nitrogen captured and fixed from the atmosphere (Zahran, 1999). Planting leguminous trees and
Figure 2.7 Urbanization rate in SSA and other developing regions
Source: FAOSTAT
Note: Equations along each graph show the trend equations for each region
SSA
LAC
Southern Asia
World0
10
20
30
40
50
60
70
80
90
19
61
19
77
19
95
19
69
19
85
20
03
19
63
19
79
19
97
19
71
19
87
20
05
19
65
19
81
19
99
19
73
19
89
20
07
19
67
19
83
20
01
19
75
19
91
20
09
20
11
20
13
PE
RC
EN
T O
F R
UR
AL
PO
PU
LATI
ON
Southern Asia: y = -0.31x + 83.11
SSA: y = -0.42x + 84.52
Global: y = -0.36x + 67.146
LAC: y = -0.58x + 48.27
Africa Agriculture Status Report 2014 | 69
shrubs could contribute up to 60 kg N/ha/year, thereby decreasing chemical fertilizer requirements by up to 75% while substantially increasing maize yields (Akinnifesi et al., 2008). This approach would further decrease the mechanical energy requirement per unit of production.
3. Advocate for reduced tillage: Using carbon emission (CE) to measure energy efficiency, Lal (2004) found that conventional tillage required 35.3 kg CE/ha while chisel tillage required 7.9 kg CE/ha. The most carbon efficient tillage method was no-till, which required only 5.8 kg CE/ha. However such tillage methods may not be feasible in some farming systems and soil types. For example, the no-till method may lead to lower yields and runoff on soils with hardpans that require use of a chisel plow to improve percolation. Selection of tillage methods therefore need to be done using a variety of criteria, and the selected method should show higher returns than the alternatives.
4. Use machinery on high yielding crop varieties: DeWit (1979) reviewed the energy efficiency of several production systems and concluded that technologies that lead to the highest possible yield per unit area were more energy efficient than those with lower yields. Such a conclusion seems to contradict those that show organic farming to be more energy efficient than conventional technologies. Possible reasons for this are the type of approaches used to measure energy and the technology mix used to produce a given weight of a crop. In addition, some of the studies reviewed by deWit considered only non-renewable energy and ignored renewable energy sources (such as solar, human, and animal energy, etc.).
5. Use renewable energy: Use of solar- and wind-powered farm equipment could greatly reduce carbon footprints from agricultural production and should therefore be encouraged when feasible.
What can be done to increase mechanization in SSA?As noted earlier, the level of mechanization in SSA is the lowest in the world. Past efforts to increase mechanization were limited to government-owned tractor hire programs and largely restricted to government-run state farms (FAO and UNIDO, 2008), both of which had predictably poor results. These past efforts offer lessons that could benefit future policies and strategies for mechanization in SSA. Experience from other developing regions could also help design policies and strategies for mechanization in SSA. The
following discussion summarizes the policies and strategies for climate-smart mechanization in SSA.
1. Farmer groups: Smallholder farmers can hardly afford to buy tractors and other farm equipment. Experience in SSA has shown that government-owned machinery hired out to farmers has not worked. This means that it is farmers – as individuals or in groups – who should own the farm equipment to address the shortcomings observed in government-owned equipment schemes. Farmer groups can pool members’ resources to buy expensive farm equipment. Additionally, farmer groups will enhance economies of scale, since most of the field equipment purchased can meet the needs of much larger farms than those owned by smallholders. Farmer groups can also enhance access to credit and other government and donor-supported programs that are oriented towards community-driven development, i.e., those that support and work through farmer groups. Experience from past community-driven development initiatives in SSA has shown promising results (see Nkonya et al. 2010), though they still remain prone to ‘elite capture’ and struggle with weak institutional and organizational capacity.
2. Rural vocational training and service: One of the constraints that dogged past mechanization programs in SSA is a lack of local technical services to maintain and repair farm equipment. Large and expensive equipment lacked regular and proper servicing, which eventually led to poor performance. Currently, the enrolment in science and technology universities in SSA is low. For example, in Uganda, enrolment in science and technology in universities is only 27%, while the level required for rapid rural development is about 40% (NDP, 2012). Increasing enrolment in university level science and technology programs, and especially in vocational training, is an important strategy for addressing the limited availability of technical support in rural areas. Supplying services and spare parts will help to enhance mechanization. Recent developments in motorcycle transportation in rural areas offer important lessons. Motorcycle transport services in these areas have increased dramatically in the past 20 years, which has contributed to poverty reduction and to keeping young people in rural areas (Porter, 2013). As motorcycle transport services expanded, so to did the number of repair shops and related services, all owned and operated by private individuals.
3. Agricultural commercialization: The economic use of large farm equipment requires operating farming as a business in order to afford the outlays required, either for purchasing equipment or paying service providers for specific operations, such as threshing (FAO, 2009).

70 | Africa Agriculture Status Report 2014
4. Coordinated mechanization programs: Past mechanization programs were not well coordinated and this led to poor performance. The development of successful mechanization programs will require participation by several ministries, including: agriculture (to promote agricultural development), education (to promote vocational training and enhance science and technology studies), finance (to promote access to the credit needed to acquire farm equipment), and local governments (to promote collective action). Such inter-ministerial collaboration and coordination is always a daunting but surmountable challenge (Volkery et al., 2006).
5. Development of simple tools: Relatively simple and inexpensive mechanical tools are needed so that smallholder farmers can quickly acquire them and put them to use. For example, treadle pumps and hip-pumps for irrigation have been developed and sold in SSA by a number of NGOs, such as KickStart international and W-3-W (Keraita de Fraiture, 2012). Such manually operated small pumps cost much less than motorized irrigation pumps, and can be used as a stepping-stone to the adoption of larger motorized pumps.
6. Develop farm equipment that uses renewable energy: Solar- or wind-powered driers, irrigation pumps, etc., are especially appropriate for SSA where sunshine and wind are plentiful and where access to fossil fuel is expensive and harder to obtain in rural areas. UNEP is currently supporting African Rural Energy Enterprise Development (AREED), which in turn invests in the development of renewable energy enterprises (Etcheverry, 2003). The AREED
approach is especially appealing because it promotes development of human capital through training, as well as access to credit and other financial services aimed at nurturing development of private entrepreneurship in renewable energy. Such efforts should be enhanced and coordinated with other programs.
7. Seize new opportunities provided by cheaper machinery: Current machinery and equipment from emerging markets present both opportunities and challenges. The low prices of farm equipment and other types of machinery from emerging economies make them more affordable to poor farmers in SSA. However, they also pose challenges, as some of this cheap machinery is defective or quickly breaks down. Strict import regulations are needed to ensure that farmers do not waste their limited resources on equipment that ends up working for only few months.
8. Enforcement of zoning and tillage methods: As discussed above, inappropriate mechanization can contribute to land degradation. For example, the availability of transportation and high-power logging equipment could lead to serious deforestation. This calls for Ministries of Environment and Natural Resources to implement strict regulations designed to protect environmentally vulnerable areas. Additionally, some land-degrading management practices that could be made possible by the use of machinery need to be regulated to ensure mechanization does not worsen land degradation climate change.
Summary and Policy ImplicationsThis study shows that land management practices that include the use of both inorganic fertilizer and organic inputs are climate-smart, since they simultaneously increase productivity, carbon sequestration, and profits, and reduce climate-related risks and enhance resilience to climate change. Unfortunately, adoption rates for these practices are low due to limited access to agricultural extension services, poor market access, and lack of mechanization. Promotion of group marketing and improving access to markets through road construction could facilitate farmers’ adoption of climate-smart land management practices as well enhance mechanization.
The declining availability of water resources requires policies and strategies that will enhance investment
in agricultural water management. The current focus of water investments in SSA remains on drinking water. Furthermore, increases in irrigated areas in the region have slowed as governments transferred irrigation scheme management to users. Donor interest in agricultural water management has also decreased for several factors, such as the decline in food prices, high per-hectare development costs, and the investments needed for rehabilitation. This pattern is unfortunate given the increasing need for greater investment in agricultural water management. The need for increased and better-coordinated public and private investment in agricultural water management cannot be overemphasized. There is also need to expand investment in a variety of water sources. Current investments are largely focused on surface water.
Africa Agriculture Status Report 2014 | 71
Investments for developing irrigation systems that use groundwater and rainwater harvesting could significantly increase irrigation development – especially in semiarid areas.
The poor coordination across ministries and sectors also needs to be addressed. For example, a Ministry of Water Resources may be responsible for development of irrigation systems, yet have a weak working relationship with its sister Ministry of Agriculture. The multiple uses of water and its mobility require coordinated efforts to realize more efficient agricultural water management investments. For example integrated catchment management will maximize the economic and social welfare in an equitable manner without compromising the sustainability of vital ecosystems.
Increasing mechanization and improved market access could also attract young people to farming – something that would lead to favorable outcomes since young farmers have greater propensity to use new climate change-related knowledge and strategies. Increasing uptake of mechanization requires developing the capacity of farmers to operate in groups in order to make the ‘lumpy’ investments required to buy and operate farm equipment. Due to its capital-intensive nature, mechanization will be successful in areas with sufficient local capacity to provide mechanical services and supply necessary equipment. Increased investment in vocational training involving local young people could help facilitate this success.
Provision of advisory services on ISFM, mechanization, agricultural water management practices, climate change, and agricultural marketing remains weak. There is need of retraining agricultural extension service providers on ISFM, climate change, and other new knowledge. In addition, there is need for pluralistic
extension systems that can provide complementary advisory services.
Smallholder farming has to be seen and operated as a business – rather than a subsistence way of life – in order to achieve mechanization and the adoption of ISFM and other climate-smart agricultural management practices. Most current policies in SSA remain heavily oriented towards production and less geared to invest in and promote marketing services. This orientation needs to change quickly in order to help farmers to adopt climate-smart land and water management practices.
Mechanization could improve the timeliness of farm operations – an operational aspect that is crucial for adaptation to climate change – especially in semiarid areas that are more affected by climate change than humid and subhumid areas. Additionally, mechanization could enhance nutrient use efficiency and alleviate labor constraints, and thus enable adoption of labor-intensive organic inputs. Although many development programs have looked at improving resilience to climate change by promoting sustainable land management practices, they have rarely considered their labor intensity. This needs to change. Mechanization needs to be enhanced by learning from past failures and successes, and by encouraging farmers to adopt relatively simple mechanical tools, such as treadle pumps, as a logical and affordable step towards mechanization.
Overall, a more comprehensive, holistic approach is required to realize climate-smart agriculture. The fragmented efforts that have dominated past programs are not likely to achieve the high agricultural productivity needed to lift smallholder farmers out of poverty and reduce their vulnerability to climate change.
72 | Africa Agriculture Status Report 2014
ReferencesAkinnifesi F., O.C. Ajayi, G., Sileshi, P.W., Chirwa, and Chianu, J. 2010. Fertiliser trees for sustainable food security in the maize-based production systems of East and Southern Africa. A review. Agronomy for Sustainable Development 30: 615–629.
Awulachew, S.B., Merrey, D. J., Kamara, A. B., Van Koppen, B., Penning de Vries, F. and Boelee, E. 2005. Experiences and opportunities for promoting small-scale/micro irrigation and rainwater harvesting for food security in Ethiopia. IWMI Working Paper 98. Colombo: International Water Management Institute.
Amede, T., Awulachew, S.B., Mati, B., Traore, S. and Yitayew, M. 2011. Agricultural Water Management in the Context of Climate Change in Africa. African Climate Policy Center (ACPC) of United Nations Economic Commission for Africa (UNECA). Working Paper 9. pp. 32. http://www.uneca.org/sites/default/files/publications/wp9-awm_formated_draft_final.pdf
Barrett, C. 2008. Smallholder market participation: Concepts and evidence from eastern and southern Africa. Food Policy 33:299–317.
Beddington, J. 2011. The future of food and farming. International Journal of Agricultural Management, 1(2),1-6.
Braimoh, A. 2012.Productivity and climate benefits of improved land management technologies. Agriculture and Rural Development Notes 60, World Bank, Washington DC.
Braimoh, A., Morgan, N., and Le Gall, F. 2013. Potential Impact of Climate Change on Resilience and Livelihoods in Mixed Crop-Livestock Systems. Agriculture and Environmental Services Note 2.World Bank, Washington DC.
Chisenga, J. K. and Teeluck, J.P. 2006. Initial scoping of status of knowledge management in Kenya, Madagascar, Malawi, Mauritius and Tanzania. Mission report. SWMnet Working Paper 10. Nairobi. http://www.imawesa.net/publications/Working papers
Cleveringa, R., Kay, M. and Cohen, A. 2009. Synthesis of Strategic Approaches: Enhancing Pro-poor Investments in Water and Livelihoods. Rome: IFAD.
Cooper, P.J.M., Rao, K.P.C., Singh, P., Dimes, J., Traore, P.S., Rao, K., Dixit, P. and Twomlow, S.J. 2009. Farming with Current and Future Climate Risk: Advancing a ‘Hypothesis of Hope’ for Rainfed Agriculture in the Semi-arid Tropics. Journal of SAT Agricultural Research 7: 1–19.
Cooper, P.J.M. and Coe, R. 2011. Assessing and Addressing Climate-induced Risk in Sub-Saharan Rainfed Agriculture Foreword to a Special Issue of Experimental Agriculture. Experimental Agriculture, 47(2): 179–184.
Cooper, P.J.M., Dimes, J., Rao, K.P.C., Shiferaw, B., and Twomlow, S. J. 2008.Coping with better with current climatic variability in the rain-fed farming systems of sub-Saharan Africa: a dress rehearsal for adapting to future climate change – agriculture. Ecosystems and Environment 126, 24–35.
Critchley, W., Reij, C., and Seznec, A. 1992.Water harvesting for plant production. Volume II: Case studies and conclusions for sub-Saharan Africa. World Bank Technical Paper Number 157. Africa Technical Department series.
Dixon, J. and Gulliver, A. 2001. Farming Systems and Poverty. Improving farmers’ livelihoods in a changing world. FAO, Rome.
Eagle, A., Olander, L.P., Henry, L.R., Haugen-Kozyra, K., Millar, N. and Robertson, G.P. 2012. Greenhouse gas mitigation potential of agricultural land management in the United States. A synthesis of the literature. Report NIR 10-04, 3rd edition. Durham, NC: Nicholas Institute for Environmental Policy Solutions, Duke University.
Eriksson, G. 1993. Peasent response to price incentives in Tanzania. Research Report 91, Nordiska Afrikainstitutet, pp. 5-67.
Evenson, R.E. 2003. Production impacts of crop genetic improvement. In: Evenson, R.E. and D. Gollin (eds). Crop variety improvement and its effect on productivity. The Impact of International Agricultural Research. CABI pp. 447-472.
Food and Agriculture Organization. 1995. Water Report 7. Irrigation in africa in figures. Rome, Italy: FAO
FAO. 2005. World agriculture, towards 2015/2030.
FAO (2010). “Climate-smart’’ agriculture policies, practices and financing for food security, adaptation and mitigation
FAO and UNIDO. 2008. Agricultural mechanization in Africa. Time for action. Planning investment for enhanced agricultural productivity. Report of an Expert Group Meeting, January 2008, Vienna.
FAO, 2008.Climate change, water and food security. FAO Water Reports 36. http://www.fao.org/docrep/014/i2096e/i2096e.pdf (downloaded 02/05/2014).
FAO, 2009. A Review of evidence on dryland pastoral systems and climate change: Implications and opportunities for mitigation and adaptation. Land and water discussion paper No. 7, 2009. Rome: Food and Agriculture Organization.
FAO, 2013a.AQUASTAT database - Food and Agriculture Organization of the United Nations (FAO). Available at: http://www.fao.org/nr/water/aquastat/main/index.stm (accessed 02/05/2014).
FAO, 2013b.FAOSTAT database - Food and Agriculture Organization of the United Nations (FAO). Available at: http://faostat.fao.org/ (accessed 05/05/2014)
Africa Agriculture Status Report 2014 | 73
FAO, 2011. Climate change, water and food security. FAO Water Reports, 36. , Rome: Food and Agriculture Organization of the United Nations.
Giller, K.E., Rowe, E.C. de Ridder, I. N. and van Keulen, H. 2006. Resource use dynamics and interactions in the tropics: Scaling up in space and time. Agricultural Systems 88:8–27.
Global Water Partnership. 2010. What is Integrated Water Resource Management (IWRM)? http://www.gwp.org/The-Challenge/What-is-IWRM/ (accessed 02/05/2014).
Hatibu, N., Mahoo, H. F., Kajiru, G. J. 2000. The role of RWH in agriculture and natural resources management: From mitigating droughts to preventing floods. In Rainwater Harvesting for Natural Resources Management N. Hatibu & H.F. Mahoo (eds.) A planning guide for Tanzania. Technical Handbook No. 22.RELMA, Nairobi. 58-83.
Hobbs P. and Govaerts, B. 2010. How conservation agriculture can contribute to buffering climate change. In Reynolds M. (ed.), Climate change and crop production. Oxfordshire: CABI., pp. 177-199.
IPCC. 2007. Climate change 2007, the fourth IPCC assessment report. Cambridge University Press
IPCC WGll, 2014. The fifth assessment report of working group ll (draft)
International Research Institute for Climate and Society. 2006. A gap analysis for the implementation of the ‘the global climate observing system programme in africa’.The International Research Institute for Climate and Society (IRI) in collaboration with Global Climate Observing System (GCOS), United Kingdom’s Department for International Development (DFID), and UN Economic Commission for Africa (ECA), IRI Technical Report Number IRI-TR/06/1, p. 47.
Keraita, B., and de Fraiture, C. 2011. Investment opportunities for water lifting and application technologies in smallholder irrigated agriculture in Tanzania. Colombo, Sri Lanka: International Water Management Institute (IWMI). (AgWater Solutions Project Case Study Report).
Khan, S., and Hanjra, M.A. 2008. Footprints of water and energy inputs in food production – global perspectives. Food Policy 34(2):130-140.
Khan S., M.A. Khan, M.A. Hanjra and Mub, J. 2009. Pathways to reduce the environmental footprints of water and energy inputs in food production Food Policy 34 (2): 141–149.
Kijne, J.W., Barker, R., and Molden, D. (2003) Improving water productivity in agriculture: editors’ overview. pp xi-xix. In: Water productivity in agriculture: Limits and opportunities for improvement J.W. Kijne, R. Barker and D.Molden(eds.) Wallingford, UK: CABI Publishing
Killham K. 2011. Integrated soil management – moving towards globally sustainable agriculture. Journal of Agricultural Science, 149, 29–36.
Kundzewicz, Z.W., Mata, L.J., Arnell, N.W., Döll, P., Kabat, P., Jiménez, B., Miller, K.A., Oki, T., Sen, Z. and. Shiklomanov, I.A. 2007: Freshwater resources and their management. Climate Change 2007: impacts, adaptation and vulnerability. Contribution of working group II to the fourth assessment report of the intergovernmental panel on climate change, M.L. Parry, O.F. Canziani, J.P. Palutikof, P.J. van der Linden and C.E. Hanson, (eds.) Cambridge, UK: Cambridge University Press, , pp. 173-210.
Kurukulasuriya, P. and Rosenthal, S. 2003. Climate change and agriculture: A review of impacts and adaptations. World Bank Climate Change Series. Vol. 91. Washington, USA: World Bank Environment Department
Laulanie, H. 1983. Le riz à Madagascar. Un développement en dialogue avec les paysans.
Lenton, R., and M. Muller (eds.) 2009.Integrated water resources management in practice: Better water management for development. Global water partnership. London, UK: Earthscan.
Liniger, H. P., MekdaschiStuder, R., Hauert, C., and Gurtner, M. 2011. Sustainable land management in practice – guidelines and best practices for sub-Saharan Africa. World Overview of Conservation Approaches and Technologies and Food and Agriculture Organization of the United Nations.
Liu, J., Fritz,S., van Wesenbeeck, C.F.A., Fuchs, M., You, L., Obersteiner, M. and Yang, H. 2008. A spatially explicit assessment of current and future hotspots of hunger in Sub-Saharan Africa in the context of global change. Global and Planetary Change, 64(3-4), 222-235.
Lobell, D.B., Bänziger, M., Magorokosho, C. and Vivek, B. 2011: Nonlinear heat effects on African maize as evidenced by historical yield trials. Nature Climate Change, 1, 42-45.
Lobell, D.B., Burke, M.B. Tebaldi, C. Mastrandrea, M.DFalcon, W.P. and Naylor, R.L. 2008: Prioritizing climate change adaptation needs for food security in 2030. Science, 319 (5863) pp. 607-610.
Linquist B., M.A. Adviento-Borbe, C.M. Pittelkow, C. van Kessel, K.J. van Groenigen. 2012. Fertilizer management practices and greenhouse gas emissions from rice systems: A quantitative review and analysis. Field Crops Research. 135:10-21.
Makumba, W., Akinnifesi, F.K., Janssen, B., and Oenema, O. 2007. Long-term impact of a gliricidia-maize intercropping system on carbon sequestration in southern Malawi. Agriculture, Ecosystems & Environment 118:237-243.
Malesu, M., Khaka, E., Mati, B., Oduor, A. De Bock, T., Nyabenge, M. and Oduor, V. 2006. Mapping the Potentials for rainwater harvesting technologies in Africa.A GIS overview of development domains for the continent and nine selected countries. Technical manual No. 7, Nairobi, Kenya: World Agroforestry Centre (ICRAF), Netherlands Ministry of Foreign Affairs. 120 p.
74 | Africa Agriculture Status Report 2014
Mati, B. M. 2010. Agricultural water management delivers returns on investment in eastern and southern Africa: A regional synthesis. In Mati, B.M. Agricultural water management interventions delivers returns on investment in Africa. A compendium of 18 case studies from six countries in eastern and southern Africa. VDM Verlag. 1-29.
Mati, B. M., Wanjogu, R., Odongo, B., and Home, P.G. (2011). Introduction of the system of rice intensification in Kenya: Experiences from Mwea Irrigation Scheme. Paddy and Water Environment 9(1), 145-154.
Mati, B.M. 2007. 100 Ways to Manage Water for Smallholder Agriculture in Eastern and Southern Africa. SWMnet proceedings 13. Nairobi, Kenya. Htpp://www.asareca.org/swmnet/imawesa
Mati, B.M. 2010. Agricultural water management delivers returns on investment in Africa: A compendium of 18 case studies from six countries in eastern and southern Africa. VDM Verlag, pp. 128-139.
Molden, D., Frenken, K., Barker, R., de Fraiture, C., Mati, B., Svendsen, M., Sadoff, C. and Finlayson, C. M. 2007. Trends in water and agricultural development. In Water for food, water for life: A comprehensive assessment of water management in agriculture. London, UK: Earthscan and Colombo: International Water Management Institute, 57-89.
Molden, D., Oweis, T., Steduto, P., Bindraban, P., Hanjra, M. and Kijne, J. 2010. Improving agricultural water productivity: Between optimism and caution. Agricultural Water Management 97, 528–535
Montpellier Panel, 2013. Sustainable intensification: A new paradigm for african agriculture. London.
Nandwa, S. and Bekunda, M. 1998. Research on nutrient flows and balances in east and southern Africa: State-of-the-art. Agriculture, Ecosystems & Environment 71(1-3), 5-18.
NEPAD (New Partnership for Africa’s Development). 2003. Comprehensive Africa Agriculture Development Program (CAADP). Midrand, South Africa: NEPAD.
Ngigi, S.N. 2009. Climate change adaptation strategies: Water resources management options for smallholder farming systems in sub-Saharan Africa. New York, USA: MDG Centre for East and Southern Africa, Earth Institute at Columbia University, pp.189
Nkonya, E., D. Phillip, T. Mogues, J. Pender, and E. Kato. 2010. From the Ground up: Impact of a pro-poor community driven development project in Nigeria. International Food Policy Research Institute Research Monograph. Washington DC, USA: IFPRI, pp. 93.
Nkonya E., Place, F., Pender, J., Mwanjololo, M., Okhimamhe, A., Kato, E., Crespo, S., Ndjeunga, J. and Traore, S. 2011. Climate risk management through sustainable land management in sub-Saharan Africa. IFPRI Discussion Paper 01126. Washington DC, USA: IFPRI
Nkonya E., J. Koo, P. Marenya, and R. Licker. 2012. Achieving Zero Land Degradation and Higher Crop Yields. In: Global food policy report 2011. IFPRI, Washington DC.
Oweis, T., Prinz, P. and Hachum, A. 2001.Water Harvesting. Indigenous knowledge for the future of the drier Environments. Aleppo, Syria: International Centre for Agricultural Research in the Dry Areas
Passioura, J. (2006) Increasing crop production when water is scarce – from breeding to field management. Agricultural Water Management 80, 176-196.
Piha, M. 1993. “Optimizing Fertilizer Use and Practical Rainfall Capture in a Semiarid Environment with Variable Rainfall.” Experimental Agriculture 29: 405–15.
Pittalis, D., 2010. Interdisciplinary studies for the knowledge of the groundwater fluoride contamination in the eastern African rift: Meru district - North Tanzania. PhD thesis. http://eprints.uniss.it/3885/
Porter G. 2013. Transport Services and Their Impact on Poverty and Growth in Rural Sub-Saharan Africa. Online at http://www.ifrtd.org/files/uploads/
Porter J.R., Xie, L., Challiner, A., Cochrane, K., Howden, M., Iqbar, M.M., Lobell, D. and Travasso, M. 2014. Food security and food production. In: IPCC 2014.Climate change. Impacts, adaptation and vulnerability. Contribution to Working Group II to the 5th assessment report of the IPCC, online at http://www.IPCC.wg2.gov.
Pretty J., Toulmin C., Williams S., 2011. Sustainable intensification in African agriculture. International Journal of Agricultural Sustainability 9(1), 5-24.
Roberts, T. 2008. Improving nutrient use efficiency. Turkish Journal of Agriculture and Forestry 32, 177-182.
Rockström, J., Lannerstad, M. and Falkenmark, M. 2007. Assessing the prospects for a new green revolution in developing countries. Proceedings of the National Academy of Sciences 104(15), 6253– 6260.
Rosegrant, M. W., Koo, J., Cenacchi, N., Ringler, C., Robertson, R., Fisher, M., Cox, C. Garrett, K., Perez, N.D., and Sabbagh, P. 2014. Food Security in a World of Natural Resource Scarcity. The Role of Agricultural Technologies. International Food Policy Research Institute, Washington, D.C. USA
Rosenthal, D.M. and Ort, D.R. 2012. Examining cassava’s potential to enhance food security under climate change. Tropical Plant Biology, 5(1), 30-38.
Roudier, P., Sultan, B., Quirion, P. and Berg, A. 2011. The impact of future climate change on west African crop yields: What does the recent literature say? Global Environmental Change, 21(3), 1073-1083.

Africa Agriculture Status Report 2014 | 75
Roy, R., Misra, R. and Montanez, A. 2002. Decreasing reliance on mineral nitrogen – yet more food. Ambio 31(2), 177-183.
Stockholm International Water Institute. 2001. Water harvesting for upgrading of rain-fed agriculture. Problem analysis and research needs. Report II. Stockholm, Sweden: SIWI.
Schlenker, W. and Lobell, D.B. 2010: Robust negative impacts of climate change on African agriculture. Environmental Research Letters, 5(1)
Sommers, M. 2010. Urban youth in Africa. Environment and Urbanization 22(2), 317–332
Srinivasarao C., Venkateswarlu, B., Lal, R., Singh, A.K. Vittal, K.P.R., Kundu, S., Singh S.R. and
Singh, S.P. 2012. Long-term effects of soil fertility management on carbon sequestration in a rice–lentil cropping system of the Indo-Gangetic plains. Soil Science Society of America Journal 76,168–178
Stern N., 2006. The economics of climate change, final report. http://mudancasclimaticas.cptec.inpe.br/~rmclima/pdfs/destaques/sternreview_report_complete.pdf (Accessed 01/05/2014).
Teshome, A., Enyew, A. and Mati, B.M. (2010). Impact of water harvesting ponds on household incomes and rural livelihoods in Minjar Shenkora district of Ethiopia. Ecohydrology & Hydrology 10(2-4) 315-322
Thornton, P.K., Jones, P.G., Alagarswamy, G. and Andresen, J. 2009a. Spatial variation of crop yield response to climate change in East Africa. Global Environmental Change, 19(1), 54-65.
Tsubo, M. and Walker, S. (2007). An assessment of productivity of maize grown under water harvesting in a semi-arid region with special reference to ENSO. J. of Arid Environment 71(3), 299-311.
Twomlow, S,, Mugabe, F. T., Mwale, M., Delve, R., Nanja, D., Carberry, P., Howden, M., 2008. Building adaptive capacity to cope with increasing vulnerability due to climatic change in Africa – A new approach. Physics and Chemistry of the Earth 33, 780–787.
United Nations. 2003. Africa water vision 2025 Addis Ababa, Ethiopia: Economic Commission for Africa.
United Nations Environmental Program. 2003. Action plan of the Environment Initiative of the New Partnership For Africa’s Development (NEPAD)., Nairobi, Kenya: UNEP.
United Nations Environment Programme, 2010. Africa water atlas. Nairobi, Kenya: UNEP, Division of Early Warning and Assessment.
Van Steenbergen, F., Lawrence, P., Mehari Haile, A., Faures, J.M., and Salman, M. 2011. Guidelines on spate irrigation. Rome, Italy: Food and Agriculture Organization.
Vlek P., Rodr´iguez-Kuhl, G. and Sommer, R. 2004. Energy use and CO2 production in tropical agriculture and means and strategies for reduction or mitigation. Environment, Development and Sustainability 6, 213–233
Volkery, A., Swanson, D., Jacob, K., F. Bregha and Pinter, L. 2006. Coordination, challenges and innovations in 19 national sustainable development strategies. World Development, 34(12), 2047-2063
Walker, N.J. and Schulze, R.E. 2008: Climate change impacts on agro-ecosystem sustainability across three climate regions in the maize belt of South Africa. Agriculture, Ecosystems and Environment, 124(1-2), 114-124.
Wheeler, T., and von Braun, J. 2013. Climate Change Impacts on Global Food Security. Science. 2 August 2013, Vol. 341, No. 6145, pp. 508-513.
World Bank, 2006. Reengaging in agricultural water management: Challenges, opportunities and trade-offs. Washington DC, USA: World Bank , Water for Food Team, Agriculture and Rural Development Department, pp. 146.
World Bank. 2007. World development report 2008. Washington, DC, USA: World Bank, Agriculture for Development
World Bank, African Development Bank, FAO, IFAD and IWMI. 2007. Investment in agricultural water for poverty reduction and economic growth in sub-Saharan Africa. A collaborative program of AfDB, FAO, IFAD, IWMI and the World Bank. Synthesis report. Washington, DC, USA: World Bank.
World Bank. 2011. Missing food: The case of postharvest grain losses in sub-Saharan Africa. Washington DC, USA: World Bank.
World Bank. 2012. Carbon sequestration in agricultural soils. World Bank Report Number 67395-GLB. Washington DC, USA: World Bank
You, L., Ringler, C. Nelson, G., Wood-Sichra, U., Robertson, R., Wood, S., Guo, Z., Zhu, T., and Sun, Y. 2010. What is the irrigation potential for Africa? A combined biophysical and socioeconomic approach. IFPRI Discussion Paper 00993
Zahran, H.H. 1999. Rhizobium-legume symbiosis and nitrogen fixation under severe conditions and in an arid climate. Microbiology and Molecular Biological Review 63(4), 968-989.
Zinyengere, N., Crespo, O. and Hachigonta, S. 2013. Crop response to climate change in southern Africa: A comprehensive review. Global and Planetary Change, Accepted for publication 15 August 2013.

76 | Africa Agriculture Status Report 2014
Chapter 3 Climate-Smart Agriculture for Food Security and Enhanced Resilience

Africa Agriculture Status Report 2014 | 77
KEY MESSAGES
Inclusive partnerships involving governments, private sector agribusinesses, and development organizations will be instrumental in the development, dissemination, adoption, and monitoring and evaluation of CSA technologies.
Smallholder farmers who have adopted CSA technologies should champion the process through locally relevant collaborations and innovation platforms. Africa needs to harness opportunities arising from South-South cooperation and regional integration in fostering partnerships and building capacity in CSA.
It is important to recognize the climate-smart nature of many indigenous or traditional practices and to support them and build on them. The dominant top-down ‘transfer of technology’ model has largely excluded farmers from the development and dissemination of new technologies and led to low adoption of CSA technologies.
Major challenges in developing climate risk-management strategies for agriculture, and especially index-based weather and area yield insurance, include: the huge spatio-temporal variability of rainfall; limited consumer awareness; low financial literacy levels; poor public sector involvement; data scarcity; the generally weak technical capacity of African weather stations; limited product options for mitigating different risks; constraints to scalability; limited universal applicability; the high costs associated with research and setting up implementation structures; and very small premium volumes.
An inclusive approach to CSA in Africa is needed, one that both empowers women and generally reflects differing gender roles, and deliberately aims to involve Africa’s rural youth. An ‘innovation system’ approach should be taken that encompasses not only the introduction of new technologies, but also organizational and behavioral changes.
Climate change can have gender-differentiated impacts, mostly related to gender norms regarding who does what and who controls the benefits from different activities. Therefore, the types of climate change adaptation strategies adopted are different for different groups of people involved.
Gender needs and preferences across religious and ethnic groups should be recognized and considered by climate information providers in order to better target information delivery.
ONE
TWO
THREE
FOUR
FIVE
SIX
SEVEN
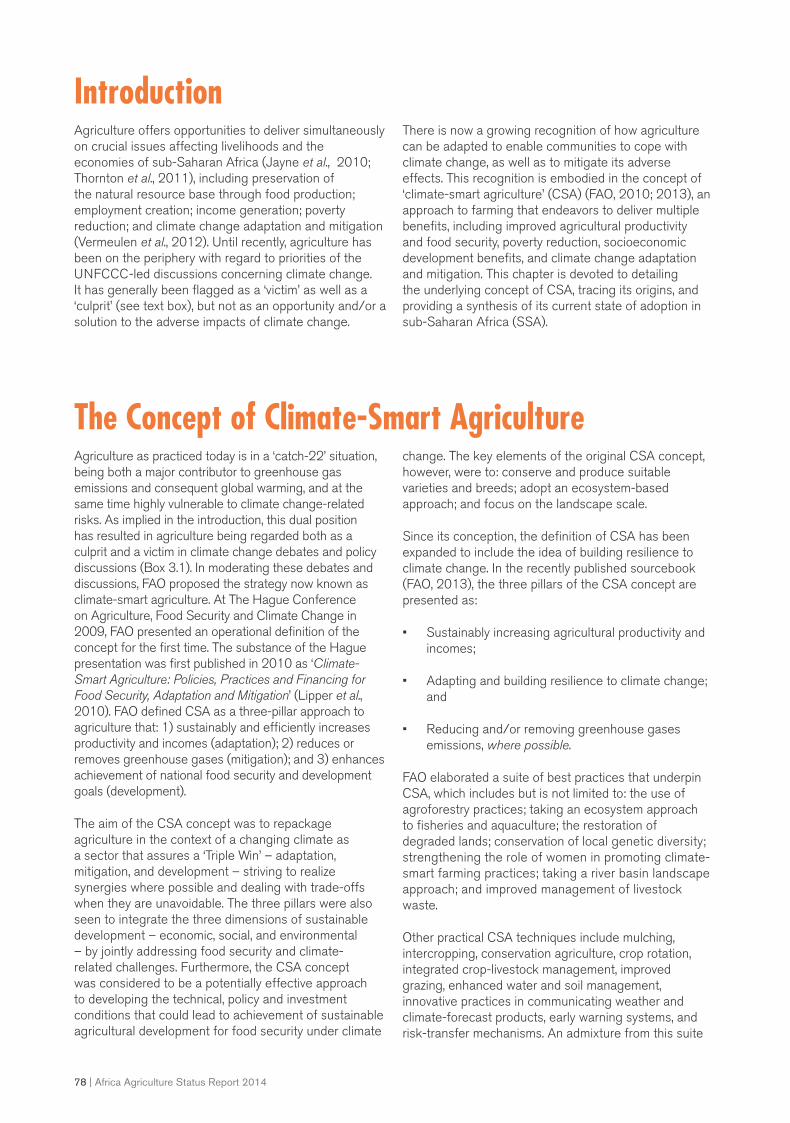
78 | Africa Agriculture Status Report 2014
IntroductionAgriculture offers opportunities to deliver simultaneously on crucial issues affecting livelihoods and the economies of sub-Saharan Africa (Jayne et al., 2010; Thornton et al., 2011), including preservation of the natural resource base through food production; employment creation; income generation; poverty reduction; and climate change adaptation and mitigation (Vermeulen et al., 2012). Until recently, agriculture has been on the periphery with regard to priorities of the UNFCCC-led discussions concerning climate change. It has generally been flagged as a ‘victim’ as well as a ‘culprit’ (see text box), but not as an opportunity and/or a solution to the adverse impacts of climate change.
There is now a growing recognition of how agriculture can be adapted to enable communities to cope with climate change, as well as to mitigate its adverse effects. This recognition is embodied in the concept of ‘climate-smart agriculture’ (CSA) (FAO, 2010; 2013), an approach to farming that endeavors to deliver multiple benefits, including improved agricultural productivity and food security, poverty reduction, socioeconomic development benefits, and climate change adaptation and mitigation. This chapter is devoted to detailing the underlying concept of CSA, tracing its origins, and providing a synthesis of its current state of adoption in sub-Saharan Africa (SSA).
The Concept of Climate-Smart Agriculture Agriculture as practiced today is in a ‘catch-22’ situation, being both a major contributor to greenhouse gas emissions and consequent global warming, and at the same time highly vulnerable to climate change-related risks. As implied in the introduction, this dual position has resulted in agriculture being regarded both as a culprit and a victim in climate change debates and policy discussions (Box 3.1). In moderating these debates and discussions, FAO proposed the strategy now known as climate-smart agriculture. At The Hague Conference on Agriculture, Food Security and Climate Change in 2009, FAO presented an operational definition of the concept for the first time. The substance of the Hague presentation was first published in 2010 as ‘Climate-Smart Agriculture: Policies, Practices and Financing for Food Security, Adaptation and Mitigation’ (Lipper et al., 2010). FAO defined CSA as a three-pillar approach to agriculture that: 1) sustainably and efficiently increases productivity and incomes (adaptation); 2) reduces or removes greenhouse gases (mitigation); and 3) enhances achievement of national food security and development goals (development).
The aim of the CSA concept was to repackage agriculture in the context of a changing climate as a sector that assures a ‘Triple Win’ – adaptation, mitigation, and development – striving to realize synergies where possible and dealing with trade-offs when they are unavoidable. The three pillars were also seen to integrate the three dimensions of sustainable development – economic, social, and environmental – by jointly addressing food security and climate-related challenges. Furthermore, the CSA concept was considered to be a potentially effective approach to developing the technical, policy and investment conditions that could lead to achievement of sustainable agricultural development for food security under climate
change. The key elements of the original CSA concept, however, were to: conserve and produce suitable varieties and breeds; adopt an ecosystem-based approach; and focus on the landscape scale.
Since its conception, the definition of CSA has been expanded to include the idea of building resilience to climate change. In the recently published sourcebook (FAO, 2013), the three pillars of the CSA concept are presented as:
• Sustainably increasing agricultural productivity and incomes;
• Adapting and building resilience to climate change; and
• Reducing and/or removing greenhouse gases emissions, where possible.
FAO elaborated a suite of best practices that underpin CSA, which includes but is not limited to: the use of agroforestry practices; taking an ecosystem approach to fisheries and aquaculture; the restoration of degraded lands; conservation of local genetic diversity; strengthening the role of women in promoting climate-smart farming practices; taking a river basin landscape approach; and improved management of livestock waste.
Other practical CSA techniques include mulching, intercropping, conservation agriculture, crop rotation, integrated crop-livestock management, improved grazing, enhanced water and soil management, innovative practices in communicating weather and climate-forecast products, early warning systems, and risk-transfer mechanisms. An admixture from this suite
Africa Agriculture Status Report 2014 | 79
of practices and technologies would be ideal as means of spreading risk and increasing resilience. However, the ‘best fit’ approach to applying these practices and technologies is to consider options with inherent characteristics that have potential to play a multiplicity of functions, such as to:
• Increase productivity and food security at the current levels of emissions;
• Increase resilience at the current levels of productivity and food security; or
• Reduce post-harvest losses and food wastage along value chains at the current levels of emissions;
• Increase productivity, resilience and food security while simultaneously reducing emissions, post-harvest losses and food wastage;
• Reduce emissions at the current levels of productivity and food security;
• Facilitate sustainable management of agricultural resources;
• Facilitate building of local capacity to implement CSA initiatives (or support the facilitation of) CSA knowledge sharing; and/or
• Enable access to markets for CSA products.
These attributes make CSA unique and different from the ‘business as usual’ agriculture that, besides being part of the climate change problem, is equally quite vulnerable to the adverse impacts of climate change. Consequently, CSA calls for efficiency in the management of weather/climate related risks, agricultural inputs, land, soil fertility, water, soil moisture, crop protection (IPM), farm-based energy (use of energy savers), and a wise mix of genetic resources and efficient post-harvest practices to deliver the most desirable results.
CSA thus provides a basis for the promotion and scaling up of proven technologies and practices for the production of crops, trees and livestock, forestry, and fisheries and aquaculture along sustainable and inclusive agricultural value chains. Examples of these practices, which are ‘best bets’ that are widely adopted by farmers in Africa, include agroforestry, conservation agriculture, fertilizer efficiency, and legume crop and tree rotations.
Climate-Smart Agricultural Initiatives in AfricaAfrica’s key option for achieving food security, poverty reduction, employment creation, and overall socioeconomic development lies in the transformation and improvement of its agricultural sector (IPCC, 2007). In line with this observation, in 2013 an appropriate climate change policy was formulated for African agriculture under the auspices of the African Ministerial Conference on the Environment (AMCEN), emphasizing adaptation as a priority intervention in African agriculture, but with mitigation as a co-benefit where achievable; this is in line with the UNFCCC-led Conference of the Parties (COP) process and, in particular, the Cancun Adaptation Framework and the Nairobi Work Programme. AMCEN observed that, by 2010, adaptation and mitigation strategies were already evident in all sectors of the African economy, but with great diversity by sub-region depending on local priorities and specific vulnerabilities. In Warsaw, during COP 19, Africa further pushed for concrete actions on loss and damage associated with the adverse effects of climate change, including its impacts on agriculture.
Conceptually, therefore, the AMCEN position of 2013 is clearly in tandem with the concepts and principles of climate-smart agriculture. The priority adaptation programs for Africa were categorized into three broad areas of work:
1. Disaster risk reduction and climate risk management, including early warning, preparedness, emergency response, and post-disaster recovery;
2. Sector-based planning and implementation, i.e., adaptation in key sectors, including water, agriculture, biodiversity, and ecosystems, taking into account cross-sector implications; and
3. Building economic and social resilience through the diversification of economies to reduce dependence on climate-sensitive sectors, including through the use of indigenous knowledge and practices and the strengthening of community organizations.
To support implementation of the above measures, AMCEN identified priority policy issues in three thematic areas, including capacity building, finance, and technology development and transfer. Some of the aspects singled out under capacity building include: training and piloting; empowerment of relevant institutions at various levels; enhancement of observation and knowledge management; strengthening communication, education and awareness-raising; developing tools, methods and technologies and supporting their application; and the sharing of experiences, information and best practices of

80 | Africa Agriculture Status Report 2014
Box 3.1. Agriculture GHG EmissionsAgriculture GHG emissions contribute substantial amounts into the atmosphere accounting directly for 10-12% emissions globally, plus similar amounts due to land use change largely linked to agriculture activities (IPCC 2014). Although the percentage of GHG emissions from agriculture in Africa is significant, it is not as high as in Asia and the Americas (FAOSTAT, 2014).The map below shows the emissions in Gigagrams CO2 eq, while the pie chart below shows the percentage distribution by continent, with Africa at 15% while Asia and the Americas are leading with 45% and 25% respectively.
Emissions by Continent (%)
Africa 15.2%
Americas 24.6%
Oceania 4.4%Europe
10.7%
Asia 45.1%
Source: FAOSTAT 2014
The emissions are from enteric fermentation, manure deposited on pasture, synthetic fertilizers, rice cultivation, manure management, crop residues, biomass burning, and manure applied to soils. Greenhouse gas emissions from enteric fermentation (38.7%) consist of methane, CH4, produced in digestive systems from livestock such as cattle, sheep, goats and pigs. Manure deposited on pasture led to larger emissions than manure applied to soils as organic fertilizer, with 27.4% of emissions from deposited manures. The emissions from burning savannah at 22% release methane and nitrous oxide into the air, which are strong greenhouse gases (Tubiello et al., 2014). The chart below shows FAOSTAT (2014) data on Africa’s contribution to GHG by sector.
Even though other continents have higher emissions, the African continent is likely to be more vulnerable to the impacts of climate change than any other, if the emissions are not reduced globally. The effects of the climate change resulting from these emissions can be reduced by taken actions such as the implementation of long term adaptive strategies that will allow farmers to respond to a new set of evolving conditions. As the shift in climatic conditions will be continuing, strategies for adaptation are necessary as coping mechanisms. In addition, mitigating factors should be put in place to reduce the production of GHGs and hence their contributions to climate change. Mitigation and adaptation strategies should occur simultaneously and interactively to lessen the effects of climate change.
In agriculture, mitigation and adaptation technologies include (but not limited to) cropland management, natural resource management, biodiversity management, Agroforestry practices. Reduced tillage often increases carbon sequestration by lowering the rate of decomposition of organic matter. Yet higher temperatures could lower soil carbon sequestration potential. Applying agroforestry strategies of increasing cropland cover as well as changing the land cover would sequester carbon while allowing for more resilient production systems (Schneider and Kumar, 2008).

Africa Agriculture Status Report 2014 | 81
Emissions by Sector in Africa
Burning - Crop residues 0.4%Rice Cultivation
3.3%
Manure Management 2.4%
Manure left on Pasture
27.4%
Synthetic Fertilizers 2.6%
Enteric Fermentation 38.7%
Manure applied to Soils
1%
Burning - Savanna 21.6%
Crop Residues 1.7%
Cultivation of Organic Soils 0.9%
AFRICA TOTAL: 808,742
Source: FAOSTAT 2014
Source: FAOSTAT 2014 Compiled by: J.K. Njuguna (AGRA), 2014
Burning - Crop residuesBurning - SavannaCrop ResiduesCultivation of Organic Soils
Enteric FermentationManure applied to SoilsManure left on PastureManure Management
Rice CultivationSynthetic Fertilizers
Asia Total: 2,404,978
North America Total: 414,650
South America Total: 756,943
Europe Total: 572,742
Africa Total: 808,742
Oceania Total: 235,416

82 | Africa Agriculture Status Report 2014
African countries. Regarding finance, some of the aspects singled out include: insurance and other risk management instruments; private sector instruments; market-based instruments, e.g., carbon finance; and improving access to financing. Key areas identified for technology development and transfer include: drip irrigation, water harvesting, drought-tolerant crop varieties, renewable energy, knowledge systems, and best practices. The thematic areas defined by AMCEN provide a basis for supporting climate-smart agricultural technologies and practices.
CSA technologies and practicesA wide range of CSA technologies and practices are currently in use in many African countries, including Malawi, Mozambique, Zambia, Zimbabwe, Rwanda, Niger, Kenya and Ethiopia, among others. In Southern Africa, a region identified as the most suitable for rapid scaling-up of these approaches, the CSA practices most commonly encountered are conservation agriculture, agroforestry, mixed livestock and cropping systems, and improved crop varieties (UNDP, 2013, FANRPAN, 2012).
In line with the AMCEN policy position, CSA technologies and practices that have been tried across the continent are based mainly on those options that promote adaptation and resilience, with mitigation as a co-benefit. A large collection of climate change adaptation literature shows that adaptation strategies being promoted to address climate change impacts in African agriculture include, but are not limited to the following:
• Heat stress/heat wave management (avoidance/tolerance);
• Improved natural resource management (land, water, biodiversity, terrain);
• Integrated soil fertility management with fertilizer tree technologies;
• New ways of pest/parasite/vector and disease management;
• Lifestyle management and attitude change (i.e., changing consumer tastes and preferences)
• Technology development and transfer (adaptable technologies);
• Response farming;
• Conservation tillage;
• Incorporation of trees into cropping systems through EverGreen Agriculture;
• Reducing CO2 emissions from the soil;
• Soil and water conservation;
• Reducing fossil fuel usage in field operations;
• Measures that capture and efficiently use water, especially in current rainfed areas and areas where scaled-up irrigation is environmentally unsustainable or economically not feasible;
• Techniques for drainage and watershed management, especially in areas with increasing precipitation;
• Use of organic matter to protect field surfaces and to preserve soil moisture;
• Diversification of crops, types of production, and of agricultural activities; and
• Agroforestry practices.
Available literature shows that the above CSA technologies and practices have been applied in several adaptation interventions across Africa in an attempt to offset the negative impacts of climate change on agricultural yields, mostly by switching between appropriate agricultural management policies and practices. For the most part, the objectives of these interventions have been to: i) intensify the resilience of production systems and rural livelihoods (adaptation); ii) sustainably reinforce production systems to attain productivity growth, thereby supporting the realization of national food security and development goals; and iii) lessen agriculture’s GHG emissions (including through increased production efficiency) and intensify carbon sequestration (mitigation).
Table 3.1 presents some of the adaptation strategies and activities that have been undertaken in Africa.. However, most of these strategies tend to overlap and/or complement one another. This calls for continuous investment in site-specific assessments of the adaptation, mitigation, and food security benefits of a range of agricultural production technologies and practices, and identification of those that are most suitable for a given agro-ecological and socioeconomic situation.

Africa Agriculture Status Report 2014 | 83
Table 3.1 Adaptation strategies and activities employed in Africa STRATEGY PROGRAM ACTIVITIES
Agricultural market development
• Facilitate access to financial services to fund adaptive technologies, practices and processes
• Investments in agribusiness infrastructure and market information systems to stimulate behavior change
• Cluster farming in order to attract agribusiness contracts and insurance cover
Alternative livelihoods (farm management and technical options)
• Reassessment of the crops, trees and livestock, and varieties grown
• Diversification of income sources
Behavior change • Cultural, social, attitude, perception, and lifestyle management (changing tastes and preferences)
• Behavior change campaigns
• Legal enforcement
Biodiversity management
• Switching to new alternative and more suitable crop species and varieties
• Crop and tree diversification, change of cropping mix, and intercropping
• Movement of crop species and varieties from less suitable to more suitable agro-ecological zones
• Technology development and transfer (adaptable technologies)
• Promotion of indigenous crops that are more resilient to anticipated climatic conditions (and improved access to markets for these crops)
• Low water-consuming crop species
• Farm micro-climate management
• Shelterbelts and wind breaks
• Agroforestry farming systems, farm micro-climate management, tree planting, and improved fallows
Infrastructure development
• Greenhouse farming
• Rural infrastructure development (including irrigation and rural roads)
• Climate-proofing of agricultural resources
Insurance • Insurance (social networks to spread, bear, and share losses)
• Index-based agricultural insurance (weather, area yield)
Integrated Pest Management (IPM)
• New ways of pest, parasite, vector and disease management
Improved natural resource management (land, water, biodiversity, terrain)
• Sustainable land management
• Agroforestry
• Conservation agriculture
• Integrated soil fertility management (ISFM) including fertilizer trees
• Organic farming
• Water demand management, water harvesting, and irrigation
• Watershed conservation and management, moisture conservation measures
• Irrigation, more efficient water use, and minimizing water loss

84 | Africa Agriculture Status Report 2014
Despite efforts being made by Africa (and by developing countries on other continents) to address climate change adaptation challenges in the agriculture sector, technological challenges remain that need to be addressed in order to realize the desired gains from the investments. In Table 3.2, a range of technological needs to support both adaptation and mitigation strategies in agriculture are presented.
In order to gain a more complete understanding of CSA technologies and practices being implemented in Africa, the sections that follow present the status of key practices in use across the continent.
Conservation agriculture – The productivity levels of African agriculture are low and have been declining over the years as a result of severe depletion of soils through generations of unsustainable farming methods, including repeated plowing, mono-cropping, little or no replenishment of nutrients, and burning of crop residues (Thierfelder and Wall, 2009; FAO, 2010).
Conservation agriculture (CA) has immense potential to reverse this trend. CA is a way of managing agro-ecosystems to achieve higher, sustained productivity, increased profits, and food security, while enhancing
the environment (FAO, 2010). The success of CA is mainly based on three principles: minimum soil disturbance, optimum soil cover (crop residue retention), and diversified crop rotations. It targets low soil fertility, moisture deficits, and low natural resource management standards through the use of soil fertility-enhancing technologies (precision fertilizer application, crop rotations, sequencing and interactions), improved moisture-use efficiency, and higher standards of agronomic management practices.
In Africa, the positive impacts of CA have been documented: improved yields; reduced labor requirements in the long run; creation of opportunities for off-farm income generating activities; protection of the environment; building self-reliance among households; and stimulation of rural development and economies (FAO, 2010). CA also presents potential for climate change mitigation through soil carbon sequestration. An increase in soil carbon by up to 9.4% in CA systems, compared to a decrease of up to 7.3% in conventional tillage systems in the first 30 cm, have been reported in Zambia. In addition, the positive evidence of CA on water productivity has been reported; higher water infiltration rates, for example, have been recorded in CA systems as compared to conventional systems (Thierfelder and Wall, 2009).
STRATEGY PROGRAM ACTIVITIES
Precision/response farming
• Improved efficiency in resource/input use, and improved timing of operations
• Precision of farm operations – flexibility in crop management based on weather variability
• Minimum tillage, cover cropping, and appropriate application of fertilizer/manure
• Conservation agriculture with trees
• Improved meteorological information, climate early warning systems, and weather information management
Social safety nets • Application of indigenous technical knowledge, networks, and local governance
• Weather forecast information dissemination
• Using little or no inputs
• Borrowing from family or local lenders
• Sale of family assets
• Investing in family ties and social networks
• Collective provision of farm inputs
• Collective marketing of farm products
• Farmer-to-farmer training
• Increased experimentation by farmers and other stakeholders
Capacity building • Training, system development, and climate proofing
Strategic food reserves • Food preservation and storage, especially cereal grains

Africa Agriculture Status Report 2014 | 85
Table 3.2 Developing country technology needs for tackling climate change impacts on agriculture
TECHNOLOGY NEEDS FOR MITIGATION TECHNOLOGY NEEDS FOR ADAPTATION
• Crop waste gasification
• Improved cultivation methods
• Production/management of soil nutrients
• Rational application of fertilizer
• Fertilizer tree technologies
• Drip irrigation
• Bio-digesters (manure management)
• Solar (photovoltaic) and wind water pumps (renewable energy harnessing)
• Solar energy for processing agricultural products
• Modification of livestock feed
• Stress tolerant/avoidance crop varieties
• Efficient water use and improved irrigation systems
• Low-density planting, adjustment of sowing dates, and crop rotations
• Enterprise diversification with EverGreen Agriculture
• Improved drainage
• Integrated pest management
• Sustainable grazing and herd management
• Heat-tolerant livestock breeds
• Buffering crops from heat and water stress by tree intercropping
• Mainstreaming of climate information and prediction products in agriculture
• Networks of early warning systems
Source: UNFCCC, 2009
Overall, CA helps to minimize soil disturbances, improves soil structure, assures greater water retention, and reduces yield variability. The practice also contributes to increased crop yield resilience and improved adaptation, while reducing carbon losses related to plowing and sequestering carbon via residue incorporation and reduced erosion. However, lessons coming out of CA pilots in Kenya (2010-2013) show that smallholder farmers do not adopt CA per se, but rather tend to adopt specific elements of CA (Osumba, pers. obs.). These choices tend to be determined by the farmers’ socioeconomic circumstances.
The incorporation of fertilizer trees into CA systems is now being promoted as a means to enhance both fodder production and soil fertility with minimum tillage (e.g. FAO, 2010; FAO, 2011). These practices are being extended to hundreds of thousands of farmers in Malawi and Zambia (Garrity et al., 2010). The portfolio of options includes intercropping maize with fast-growing N-fixing trees, including Gliricidia sepium, Tephrosia candida or pigeon peas, using trees such as Sesbania sesban as an improved fallow, or integrating full-canopy fertilizer trees such as Faidherbia albida into the CA system (Akinnifesi et al., 2010). The integration of the Faidherbia albida into CA systems has proven to be a particularly effective practice.
Agroforestry – This farming system intentionally integrates the production of compatible trees and non-tree crops or animals on the same land area with the aim of maximizing the beneficial interactions among system components. Agroforestry is important for climate change mitigation through carbon sequestration, both above and below ground, in cropping systems, and through the production of improved feed, leading to reduced enteric fermentation (methane emissions) in livestock-based systems. Agroforestry also contributes to adaptation in that it improves the resilience of agricultural production to climate variability by using trees to moderate local microclimates; it also intensifies and diversifies production and buffers farming systems against hazards.
Furthermore, in livestock production systems, shade trees reduce heat stress on animals, and in cropping systems trees slow down winds that increases water loss through evapotranspiration, leading to overall increases in productivity. Trees also improve the supply and quality of forage, which can help reduce overgrazing and curb land degradation. Other adaptation benefits of agroforestry include reduction in soil and water erosion, improved water management, reduced crop output variability, and higher and more stable incomes for farmers. Box 3.2 is an illustration of the beneficial aspects of agroforestry

86 | Africa Agriculture Status Report 2014
practices drawn from a case study dubbed the Kenya Agricultural Carbon Project. In addition, EverGreen Agriculture is the deliberate integration of trees into
cropping systems to increase yields and build resilience by restoring soil health and through buffering crops from heat and water stress (Box 3.3).
Box 3.2. Kenya Agricultural Carbon ProjectThe Kenya Agricultural Carbon Project (KACP) was the first pilot project in Africa, implemented by Vi Agroforestry in Western Kenya with the aim of assessing the reduction of GHG emissions through soil carbon sequestration. The project was designed to sequester 1,777,715 tons of CO2e net anthropogenic GHG emissions and removals for a crediting period of 20 years (2009-2031) and targeted 60,000 smallholder farmers with total landholdings of 45,000 hectares. Through technical support from the Biocarbon Fund of the World Bank and other partners, the project promoted and implemented a package of Sustainable Agricultural Land Management (SALM) practices within smallholder farming systems through innovative extension approaches supported by the extension advisory systems provided by the government and by various non-governmental organizations.
The extension system provided 28 field advisors who performed necessary assessments, monitoring and evaluation of project activities, and trained 3,000 registered farmer self-help groups on SALM practices. Upon training, Vi Agroforestry contracted the farmer groups, implemented adaptation strategies, and aggregated carbon credits with a roll out plan for implementing SALM activities over nine years, targeting the adoption of SALM by more than 90% of the smallholder farmers involved in the project. The activities that were promoted focused on increasing soil and biomass carbon stocks, and included: residue, grassland and manure management, as well as cover crops; agroforestry; and composting and terracing, predominantly on degraded land, i.e., either on cropland or grassland, but not on wetlands and forest land.
Adoption of SALM by smallholder farmers generated carbon stocks within their traditional agricultural systems, enabling them to access carbon markets and generate annual revenues that are projected to continue until 2031, with additional benefit of increased staple food production. For assurance of market availability, Vi Agroforestry and the Biocarbon Fund signed a 9-year Emission Reduction Purchase Agreement (ERPA) worth 150,000 tons of CO2eq Emission Reductions (ERs), leaving the rest of ERs open to other interested buyers. Carbon credits were generated and claimed based on a newly developed and approved verified carbon standard methodology called Adoption of Sustainable Agriculture Land Management. This methodology specifically addressed the need for a robust but cost-efficient monitoring system, and at the same time helped smallholder farmers reach their objectives of improved productivity, food security, and climate resilience. Agricultural activities and adoption of SALM in the baselines were assessed and monitored as a proxy of the carbon stock changes, using activity-based model estimates, while the Roth-C Model was used to quantify changes in soil carbon. This approach demonstrated additionality by application of barriers, such as technology, scaling up, and common practice analyses, as well as dissemination of knowhow to farmers. In order to quantify the GHG emissions reduction, a wide range of data was collected, including: area of project activities (crops, grazing, tillage, agroforestry); farming systems and baseline practices per area (an indicator of project adoption); and average annual biomass productivity, using yield as a proxy. IPCC default values were used for determining the yield-to-biomass ratio. Other data collected for quantifying GHG emission reductions included the amount of biomass burned, existence and amount of woody perennials (trees/shrubs), average number and type of animals, fertilizer amounts and types, and manure input.
Besides strengthening community structures, providing dedicated extension services, product value addition, and the introduction of farm enterprise development and village saving and loaning approaches, KACP also made immense contributions towards realization of food security and climate resilience. Smallholder farmers and farmer groups improved their productivity and livelihoods. During 2009-2012, maize yields on KACP farms (compared to controls and 2009 baseline yields) increased by 50% during the long-rains cropping season, and by 30% in the following short-rains cropping season. Farmers who adopted SALM practices enjoyed on-farm food self-sufficiency. Those who adopted farmer enterprise development and village savings and loaning schemes increased their financial capital and farm investments. Within three years, 73% of farmers within the project were able to save US$ 3-4 per month, compared to 44% of the controls. In addition, considerable soil carbon sequestration was realized, enabling farmer groups to receive carbon bonus payments. Furthermore, the project also contributed significantly to the restoration of degraded land, biodiversity, and the provision of other important ecosystem services.
Source: VI Agroforestry

Africa Agriculture Status Report 2014 | 87
Intercropping – Growing more than one crop on the same land management unit is a long-standing practice in sub-Saharan Africa, one that is used to spread risks and, if well managed, can deliver climate change adaptation and mitigation benefits. This may also include trees grown with crops (see Box 3.3). The cropping patterns promoted under this system include use of cover crops, intercrops, improved fallows and biological terraces.
A number of agronomic (CSA) practices have proven effective in delivering multiple benefits, including food security and improved climate change mitigation and adaptation. Among them are integrated ‘soil-crop-water’ management, improved water-use management, sustainable soil management, enhanced feed management, and diversification to more climate-resilient agricultural production systems. Benefits
Box 3.3. Creating an EverGreen Agriculture in AfricaEverGreen Agriculture is a form of agroforestry to achieve sustainable intensification in crop production by integrating trees directly into crop and livestock production systems. These are ‘double- story’ systems that feature both perennial and annual species (food crops and trees), maintaining a green cover on the land throughout the year. There are three types of evergreen agriculture practices:
• Conventional agriculture interplanted with trees
• Conservation agriculture with trees (CAWT)
• Farmer-Managed Natural Regeneration (FMNR)
EverGreen Agriculture practices provide needed biological and income diversity in the farm system. The types of intercropped trees may include species whose primary purpose is to provide products or benefits other than soil fertility replenishment alone, such as fodder, fruits, timber, or fuel wood. In such cases, the trees provide a value greater than that of the annual crop that would have been obtained from the field area occupied by the trees.
The intercropped trees may also be species that fix atmospheric nitrogen and make available other nutrients to the crops from deeper soil horizons. Some species, such as Gliricidia, Sesbania, Calliandra and Tephrosia are quite fast-growing and may require pruning during the growing season to a low stature, but they produce abundant biomass for fodder, fuel and/or mulching for soils within a couple of years of planting. Others such as Faidherbia albida are dormant and shed their leaves during the season when field crops are being established, but grow their leaves during the dry season when fields are fallow. They can be managed as large, full-canopy trees in the crop fields. Farmers can cultivate these nitrogen-restoring trees and shrubs among their food crops, such as maize, without blocking essential sunlight.
Annual crops planted with fertilizer trees have been shown to increase yields from 30% to 200%, depending on the age and density of the trees, agronomic practices used and the weather conditions. Establishing trees in fields can be done in numerous ways, such as through Farmer Managed Natural Regeneration of wildlings of useful species that come up spontaneously in the fields, or by planting the trees in either conventional and conservation farming systems.
Broad scale adoption of EverGreen Agriculture practises has already occurred in several parts of the African continent. In Niger, more than 5 million hectares of dryland croplands have been regreened through farmer-managed natural regeneration involving about 1,200,000 farming families. Uptake by over 200,000 families in Malawi, and by thousands of smallholder farmers in Zambia and Rwanda has occurred by establishing fertilizer and fruit trees in their farms. These successes, and many others, have proven the potential of EverGreen Agriculture to be transferred to millions of other households in these and other countries on a much bigger scale. At least seventeen African countries are already engaged in supporting EverGreen Agriculture. One example is the Prime Minister’s national program for upscaling Faidherbia albida in Ethiopia. Each country faces different challenges that require a diversity of EverGreen Agriculture systems to be adapted to meet local conditions and farmers’ needs.
Source: D. Garrity, 2014, ICRAF 2014

88 | Africa Agriculture Status Report 2014
include reduction of erosion due to runoff, improvement of water quality, and formation of natural terraces over time, leading to higher and less variable yields. In addition, this practice promotes flood mitigation, enhancement of biodiversity, reduced sedimentation of waterways, and the reduction of runoff velocity and associated soil losses.
Improved water management – With climate change, water scarcity presents one of the formidable agricultural production risks/challenges facing smallholder farmers in sub-Saharan Africa. Climate-smart water management technologies and practices are therefore key in determining farm-level productivity; they also have operational effects along the entire agricultural value chain. This in turn point to the need for developing response mechanisms that rest on appropriate policies, increased investments in water management, and improved institutional infrastructure and technical expertise, within the water and agriculture sectors and beyond (FAO, 2013).
With the increasing frequency and intensity of water-related climate events resulting from climate change, emphasis has often been given to such strategies as increased irrigation in order to drive agricultural intensification in Africa. However, increased demand for irrigation water faces growing competition for available water supplies, primarily for industrial uses, as well as to meet the needs of rapidly growing urban areas. Sub-Saharan Africa is already affected by water scarcity in a number of areas where smallholder farmers live, and in many locations climate change will further exacerbate vulnerability to water scarcity. Ground aquifers have been targeted as an alternative source of water for irrigation, but most of the shallow wells and boreholes are not as productive as they once were because aquifers are being depleted beyond their recharge capability due to climate change-induced decreases in precipitation.
In order for SSA smallholder farmers to remain in agriculture, interventions requiring climate-smart water management technologies and practices need to be put in place at various spatial scales. These interventions will need to encompass fields and farms, large-scale irrigation schemes, improvements in watersheds and/or aquifers, investments in the development of river basins (including trans boundary river basins), and improved national level water policies (FAO, 2013). Given the limited financial capacity of smallholder farmers, considerable investment at the farm-level will be required for water harvesting and on-farm water storage facilities. Major investments in groundwater development are needed, as well as for crop breeding to produce drought- and flood-tolerant crop varieties. Improved drainage systems are also needed and, where agro-ecologically appropriate and desired by farmers, smallholders should be supported in diversifying their operations to include fish farming. Land, water and crop
management technologies and practices required at the farm level include enhancement of soil moisture retention capacity, changing cropping patterns and adopting diversification, and supplementary irrigation. Improved water policies, coupled with stronger institutional infrastructure and technical capacity, would enable the deliberate and well-planned reallocation of available water supplies within and between sectors, the strengthening of land and water access rights, a mainstreaming of crop insurance practices, and improvement in the delivery of weather and climate services, all of which would contribute immensely to climate-smart water management (Turral et al., 2011).
Improved grassland management – Besides being critical sources of food and forage, Africa’s grasslands play an essential role in addressing climate change mitigation and adaptation goals. In grassland ecosystems, management regimes aimed at increasing forage production or transforming cultivated lands and areas covered by indigenous vegetation into grasslands may increase soil organic matter, thereby sequestering atmospheric carbon. In SSA, CSA grassland management practices that offer promise include, but are not limited to, fertilization, improved grazing management, conversion from cultivation and native vegetation, sowing/reseeding of legumes and grasses, and trees, assisted natural regeneration of trees in grazing systems, the introduction of earthworms, and irrigation. Other benefits associated with improving grasslands, beyond serving as more effective carbon sinks, include improved capacity to support livestock, better soil and water conservation leading to increased carbon sequestration, enhanced resilience, and reduced negative externalities that can arise from communal grazing.
Integrated livestock management – Globally, the livestock sector has been identified as a significant contributor to climate change through GHG emissions (FAO, 2013). However, sub-Saharan Africa’s contribution to climate change in this regard is modest when compared to developed countries (Gerber, et al., 2013). In addition, the relatively limited contributions to GHG emissions that do come from smallholder livestock operations in SSA can be further reduced through proper agricultural practices and management systems.
In an attempt to address the adverse impacts of climate change, several adaptation and mitigation strategies have been identified for the livestock sector. For example, provision of water is crucial for building resilience among pastoralists. In SSA, there are currently numerous initiatives by many institutions, including government agencies and NGOs, aimed at providing water to pastoral communities by sinking boreholes and excavating earth pans, dams and other types of water reservoirs. The main challenge resulting from such initiatives has been the convergence of pastoralists and
Africa Agriculture Status Report 2014 | 89
their livestock around the water point, often leading to overgrazing and denuding of the area (Ngigi, 2003).
Catchment approaches and in-situ soil and water conservation methods that are associated with minimum investments have been proven more effective than other methods in increasing availability of pasture during droughts. In addition, such practices as reforestation, terracing, gully control and other in-situ rainwater harvesting methods lead to increased vegetation (forage). These methods minimize runoff and maximize seepage, thereby raising the water table that enhances foliage growth and makes water readily available through shallow wells (Ngigi, 2003). Other climate-smart technologies and practices in the livestock sector include mechanisms for forage and fodder availability that helps build the resilience of pastoral communities and other livestock farmers. A good example is the use of ground scratching conservation tillage equipment, followed by pasture reseeding. This practice is currently gaining prominence among pastoralists in East Africa.
Fodder cultivation is also gaining importance among farmers in high-potential agricultural areas who are growing fodder for sale to producers living in drier, less productive regions. Despite this encouraging trend, a lack of high yielding pasture seed and a lack of bailing and storage facilities for the harvested grass present major challenges for the livestock sector. Other potential innovative approaches that fit well within CSA technologies and practices include embryo transplant schemes, in which locally adapted livestock breeds can act as surrogate mothers for high-yielding breeds, as well as improving local breeds by crossing them with heat- and disease-tolerant livestock to help ensure survival.
In the context of CSA, the principles of climate-smart livestock management include two core functions: resource-use efficiency, which emphasizes the mitigation potential of farming systems; and building resilience with buffering- and risk-management interventions at the farm and system levels. In Africa, at least three principal climate-smart livestock management strategies dominate livestock production systems: .
• Land-based systems: Although climate-smart options exist for livestock management within land-based grazing systems, adoption of such options in low-input smallholder systems is limited. The reduction of enteric methane emissions and increased soil carbon sequestration, constitute the major mitigation options for land-based systems. However, most of the CSA interventions practiced give rise to mitigation and adaptation synergies,
while others are ‘mitigation only’ options and ‘adaptation only’ practices. A notable characteristic of land-based systems, however, is that the role of manure management as a mitigation option is low. It is noteworthy that, despite the risk of tradeoffs between mitigation and the much-desired goal in Africa of achieving food security through adaptation to a changing climate, escape pathways do exist. Notable CSA options considered suitable for land-based systems and that deliver on multiple CSA goals include: grazing management; pasture management (Bentley et al., 2008); animal breeding (Bentley et al., 2008); animals and herd management; animal disease and health; supplementary feeding; early warning systems; weather-indexed insurance, and agroforestry practices.
• Mixed systems: Due to their intrinsic characteristic of providing multiple outputs, if well managed these systems may offer the most practical means of adapting to climate change and mitigating crop- and livestock-based GHG emissions. Several CSA technologies and livestock management practices have proven to be effective in delivering multiple benefits, including food security and improved climate change mitigation and adaptation. Notable examples include integrated soil-crop-water management, improved water-use efficiency and management, sustainable soil management, enhanced feed management, and movement towards more diverse and climate-resilient agricultural production systems.
• Landless systems: FAO defines a landless farming system as a “Subset of the solely livestock production systems in which less than 10 percent of the dry matter fed to animals is farm-produced and in which annual average stocking rates are above ten livestock units (LU) per hectare of agricultural land” (FAO, 2013). With the increasing demand for agricultural intensification in SSA, as well as rapid population growth leading to land fragmentation, climate-smart practices involving landless systems could offer opportunities for intensive livestock production systems in a changing climate. These opportunities are twofold: manure management in pig, dairy, and feedlots; and enteric fermentation in dairy and feedlots. CSA practices that are feasible in the context of SSA include: improved waste management through anaerobic digestion for biogas and fertilizer; improved feed conversion; sourcing low-emission feed; improving energy use efficiency; and building resilience along supply chains.

90 | Africa Agriculture Status Report 2014
Adoption of CSA Technologies and Practices by Smallholder Farmers in Sub-Saharan Africa Adoption of sustainable agricultural practices by farmers, including climate-smart technologies, is crucial to transforming African agriculture into a long-term, sustainable system (Muzari et al., 2012). Individual decisions are influenced by the availability of technical information and the appropriate technology necessary to implement sustainable approaches (Andersson and D’Souza, 2013). Adoption of specific CSA practices in response to changes in climate will reflect personal preferences and farmers’ commitment to increasing productivity and reducing vulnerability to food shortages at the household level (Lybbert and Sumner, 2012; Tambo and Abdoulaye, 2013; Campos et al., 2014).
Key determinants of adoption include socio-cultural and economic factors at all levels, and these could either motivate or hinder smallholder farmers from adopting CSA practices (Adesina and Chianu, 2002). Notable examples of such factors include: regional and national agricultural policies; economic conditions; levels of education and the availability of information; land tenure systems; and the preferences of individual farmers, which are conditioned by societal and community-based norms. These factors, singly or in combination, act to influence a farmer’s decision on whether to opt for conventional or new CSA production strategies.
Compatibility with current practices Farming systems in Africa, especially among smallholder farmers, have predominantly been subsistence in nature, and driven by traditional technologies and practices (Baiphethi and Jacobs, 2009; Salami et al., 2010; Whitbread et al., 2010; Kristjanson et al., 2012). Over time, risk-averse smallholders have tended to stick with the practices they know (De Pinto et al., 2013; Harrison et al., 2013). Consequently, adoption of new technologies and practices will depend on the extent to which the new approaches deviate from current practices and how compatible they are with existing production systems (Greiner and Gregg, 2011; Lybbert and Sumner, 2012). In this instance, compatibility refers to how well suited new technologies and practices are perceived to be, relative to the farmers’ local context, including: geographical location and agro-ecologies; farmers’ resources and capabilities; and individual farm characteristics, such as soil types, terrain, potential for erosion, and the prevalence of various biotic and abiotic threats to production. Where such factors have not been addressed, farmers have declined to adopt new practices (Mugwe et al., 2009; Daniel, Myers and
Dixon, 2012). The simple truth is that over time farmers have – through planned initiatives or trial and error – adopted agricultural practices on which they can rely and with which they are comfortable, and are reluctant to adopt new practices that are unproven within their context.
Other compatibility issues that may affect the adoption of CSA technologies include increased labor requirements, an inability to use existing equipment, environmental practices that reduce flexibility, lack of time, and specific requirements relating to the commodities being produced and/or the markets for farm produce (Harvey et al., 2014). These factors can constitute major hindrances to the adoption of CSA technologies and practices by smallholder farmers in Africa.
The social context for decisions about CSA adoption Decisions on CSA adoption need to be incorporated into the broader farm decision-making context, including economic, environmental, social, family, and personal considerations, as well as available agricultural and other support information sources. Of these, social issues are the most often overlooked factor, by farmers and development professionals alike (Andersson and D’Souza, 2013; Labeyrie, Rono and Leclerc, 2013; Beuchelt and Badstue, 2013).
However, it is worth noting that adoption of a sustainable practice or technology is a personal decision, determined by the perceived benefits of the practice itself, as well as the individual farmer’s preferences, incentives, and constraints. Furthermore, it is important to appreciate the fact that individual decisions are highly influenced by the socioeconomic context within which they are made, and that societal factors have a strong influence on the way an individual farmer perceives agriculture. Thus, a good understanding of social/societal factors influencing farmers’ adoption of sustainable practices is critical in promoting CSA adoption by farmers.
Barriers to adoption of CSAUnderstanding among institutions championing CSA technologies and practices about barriers to adoption by smallholder farmers is crucial to their success. These

Africa Agriculture Status Report 2014 | 91
barriers are wide ranging and include: insecure land tenure; limited access to information; lack of financing to support transitions to technologies that produce delayed returns on investment; inefficient input supply systems; lack of effective institutions for enabling collective action; labor constraints; and climate-driven uncertainty (Adgeret al., 2009; Deressa et al., 2009; Moser and Ekstrom, 2010; Nielsen and Reenberg, 2010; Crane, Roncoli, and Hoogenboom, 2011; Gifford, 2011; Biesbroek et al., 2013). Identifying these constraints is important to developing economically attractive and environmentally sustainable management practices that have adaptation and mitigation benefits (Neufeldt et al., 2011).
Adoption of CSA technologies and practices among African countries is likely to be heightened by focusing on proper instruments for managing climate-related risks, including: management of water, soil and land; agronomic practices; infrastructure and financing; information and communications technologies; social organization; and capacity development that leads to coherent agricultural policies and stronger institutions (Greiner and Gregg, 2011; Mariano et al., 2012; Wood et al., 2014). However, people may not adopt, or may adopt partially, for a variety of reasons, notably: competing priorities that place demands on scarce resources; a low productive base (natural and man-made capital assets), including poverty; inadequate knowledge (a poor understanding of CSA concepts); weak institutions (inadequate sector and stakeholder cooperation in planning for climate change); degraded natural resources that are expensive to rehabilitate; inadequate infrastructure; insufficient financial resources and distorted incentives; limited human capital (social networks and entitlements); and poor governance (Adesina et al., 2000; Knowler and
Bradshaw, 2007; Perret and Stevens, 2006; Greiner, Patterson, and Miller, 2009).
Other obstacles that impede adoption of CSA practices by smallholder farmers include:
• Fear that expected investment costs could exceed the expected benefits;
• Uncertainty about future manifestations of climate change makes it difficult to know what to do or when to do it;
• Uncertainty regarding irreversible consequences of some actions;
• Incentives may be distorted in ways that discourage adoption or encourage risky choices;
• Actions/inactions of other stakeholders can be an obstacle to adoption;
• Generally weak local institutions for providing community services;
• Treatment of a resource as an open access ‘commons’ has contributed to its degradation and created disincentives for investing in protection of the resource; and
• Lack of knowledge and information regarding options for managing climate-related risks.
Social barriers – Table 3.3 presents the main observed social barriers to adoption of CSA technologies and practices.
Table 3.3 Elements of social barriers to adoption of CSA STRATEGY PROGRAM ACTIVITIES
Cognitive • Living in denial, as if nothing is going wrong
• Change not yet seen as a problem: temptation to wait for the impact then react
Normative • Cultural norms that discourage change and innovation; an unwillingness to adopt new practices
• Traditional means of reacting to climate stress and shock may no longer be appropriate given that there is no cultural memory when it comes to future climate change
• Restrictive traditional and religious norms, such as reliance on traditional means of weather forecasting and planting, a constrained role for women in the household/community, and dependence on traditional means of coping with climate hazards
Institutional • Institutional inequalities and social discrimination restrict access, and
• Social/cultural rigidity: lack of institutional flexibility
Source: http://www.odi.org.uk/resources/download/4945.pdf

92 | Africa Agriculture Status Report 2014
Financial barriers – CSA technologies and practices such as conservation agriculture (CA) are labor-intensive and require considerable additional cost, which presents a major constraint to their adoption. Too often, specialized planting tools and other implements are not readily available, or when available they are prohibitively expensive. With CA, herbicides are a necessary input (which is obviously an additional cost associated with the practice); failing the use of herbicides, extra labor for weeding will be needed – also an additional cost that reduces the net benefits of zero or minimum tillage. Competing demands for crop residues leads to a low likelihood of their remaining in the field to build organic soil matter and help sustain the farming system (Briggs and Twomlow, 2002). The full benefits of CA (i.e., higher and more stable yields) require at least four years to materialize, making the large up-front investment in the practice a significant barrier to adoption. Smallholder farmers’ have to focus on near-term returns to their investments, in terms of additional food and income (Vanlauwe et al., 2014). Limited financial resources and lack of access to credit also hamper the adoption of CA technologies and practices.
Up-front financing costs, the opportunity costs associated with taking land out of production, and the cash constraints that face most smallholder farmers’ act to impede adoption of agroforestry practices in sub-Saharan Africa. To effectively promote agroforestry practices, financing mechanisms that address cash constraints and opportunity costs need to be explored.
Soil and water conservation structures often entail large up-front costs, with benefits usually accruing slowly over time. Additional costs include land being taken out of production and annual maintenance, which can entail heavy labor requirements.
Technological barriers – In agroforestry systems, the availability of a range of suitable tree and bush seedlings and seeds, as well as limited availability of information about the types of agroforestry options that can be used, work against adoption of these CSA practices (McNeely and Schroth, 2006). Local rules and norms regarding livestock grazing and bush fires, together with land tenure issues, may adversely affect investments in agroforestry (FAO, 2006).
Climate-related barriers – Although a lot of investments, notably in research and development, have been made towards maintenance and improvement of the agricultural production environment, emphasis on mainstreaming weather and climate information into decision-making has been weak or has made insignificant impacts. This is due to a lack of recognition and appreciation of weather and climate information as essential resources for agricultural producers. One of the major handicaps of farmers and other intermediaries along the agricultural information chain has been the limited capacity to incorporate weather
and climate information – and related early warnings – into farm-level decision-making. This calls for further investment in tailored value added climate services aimed at supporting smallholder farmers by building their resilience to the adverse effects of climate change and variability (Care, Huxtable, and Nguyen Thi Yen, 2009). This would not only help to secure the livelihoods of and vulnerable farming communities and the rural poor, but also improve their disaster preparedness.
In Africa, while seasonal weather forecasts are developed and disseminated, very few farmers use them in making farm-level decisions (Klopper, Vogel, and Landman, 2006). Weather services have always fallen short of meeting user needs in agriculture and allied sectors. Major barriers to their use in decision-making include their perceived low reliability, and their coarse spatial resolution in relation to the needs of individual farmers. The forecasts are often disseminated in an untimely manner, do not regularly reach smallholders, and are in forms that are not readily understood.
A wide range of gaps in knowledge have been identified that account for the above deficiency in delivery of weather and climate services. First, the demand for such information is quite diverse. Weather and climate service providers need to develop localized, timely and easily understandable information relevant to diverse cropping systems and decision cycles, and suitable for the varied needs of agricultural research institutions, extension service providers, irrigation managers, input suppliers, market intermediaries, local cooperatives, micro-financiers, farmers, fishers, livestock managers, and many others.
Notwithstanding the demand side, the supply chain is often constrained by insufficient data and resolution challenges that render the information disseminated quite generalized. Weather and climate data and information is poorly understood and usually presented using terminology that limits its utility for farm-level decisions, planning (including for food emergencies), trade, and extension providers. Moreover, it is poorly packaged and communicated. The result is operational forecasts characterized by inadequate content, inequitable access, marginal accuracy, and poor timeliness.
Socio-cultural issues – Various socio-cultural issues in Africa have a bearing on how households adapt to climate change, as well as whether and how they adopt CSA technologies and practices (Noordwijk, Hoang, and Neufeldt, 2011; Kristjanson et al., 2012; Bryan et al., 2013; Yegbemey et al., 2013). These issues include land tenure systems, household decision-making norms, and how household incomes are allocated. The impact of climate change on individuals, families and communities can vary considerably, depending on local cultural and gender norms regarding who does what and who controls the benefits from different

Africa Agriculture Status Report 2014 | 93
activities (CARE, 2010). Therefore, appropriate climate change adaptation strategies, including adoption of CSA practices and the use of weather and climate
information, will be distinct for different groups of people, including for men and women.
Gender and Climate-Smart AgricultureAlthough it is often assumed that gender refers only to women, a meaningful gender analysis also considers men and the differences between men and women. Gender is about relationships and power dynamics; it refers to socially constructed differences between men and women and is an acquired identity that is learned, changes over time and varies widely within and across cultures (INSTRAW, 2004). Differences in roles and responsibilities, access to and control over resources, and decision-making power are all informed by gender. However, not all women (nor all men) are the same in that they do not all have the same roles, levels of access to, and control over, resources or power in decision-making, since gender norms are also related to race, class, ethnicity, religion, and age. This means that one should not focus only on gender but try to understand a person’s position in society based on these factors, as well as the power dynamics that these imply (Kaijser and Kronsell, 2014); the interactions of these social identities will shape a person’s experiences and position in the community. This approach to understanding the impacts of climate change permits researchers, policy makers and development workers to understand the social dimensions of climate change, and to therefore structure policies, projects, and research in a manner that acknowledges these complexities and accounts for different local priorities and needs.
In Africa, men and women share in the food production responsibilities, where men are primarily responsible for cash crops and cattle, and women are primarily responsible for fuel wood and manure collection (Kyazze and Kristjanson, 2011; Mango et al., 2011; Yacine et al., 2011; Mwangangi et al., 2012). Furthermore, women’s property rights to land vary between countries and across regions within a country. However, land tenure systems and the availability of funds to invest in improved technologies are some of the common gender-sensitive problems predominantly faced by women farmers that constitute major barriers to the adoption of conservation agriculture in SSA (El-Fattal, 2012).
Different groups and types of people experience the impacts of climate change differently depending on their position in society, as determined by gender, race, class, ethnicity, religion, and age, among other factors (Ray-Bennett, 2009; Beuchelt and Badstue, 2013). Although both men and women are experiencing similar extreme climatic events, the impact of such
changes depends on their roles (CARE, 2010). Several gender differences are noted in perceived climate changes. Because of the distinct work that men and women do, largely dictated by gender norms, men and women perceive climate change differently and they are affected by it in different ways. Such differences have implications for policy and development programs. By understanding how climate change will impact men and women differently (based on their distinct roles and access to resources), development programs and policies can be designed to promote adaptation strategies that address such impacts in a gender-equitable manner.
Adaptation strategies adopted by men and women also depend on their access to and/or control over resources and their participation in decision-making processes. While CSA practices can help smallholder farmers adapt to climate change, these farmers also need good climate information services from reliable sources at the right times in order to adopt such practices and/or adopt other adaptation strategies. It is imperative, therefore, for climate service providers to recognize the needs and preferences of men and women across religious and ethnic groups, in terms of the types of information needed by women and men, the appropriate channels of disseminating such information, and the best way to disseminate it, in order to meet the climate information needs of the smallholder farmers. This is in response to the differentiated gender labor roles in which women are commonly engaged in most of the off-farm work (Yacine et al., 2011). Box 3.4 presents a case study drawn from four sites in Africa, three in East Africa and one in West Africa, showing climate information needs and access, disaggregated by gender.
Gender and religion shape access to different sources of information and therefore affect men and women differently in their abilities to adapt to climate change. In a study conducted in Kaffrine, Senegal, Yacine et al. (2011) observed that men received most of the weather and climate information through radio, television, networks of friends and relatives, NGOs, and development projects. In addition, men also had access to information on soil inputs and fertility management from other farmers, organizations such as the Regional Directorate for Rural Development (DRDR), and local and national government sources, including radio, television, and from local leaders and the mosque.

94 | Africa Agriculture Status Report 2014
Box 3.4 Gender-based climate information needs and access by smallholder farmers in AfricaThe CGIAR Program on Climate Change Agriculture and Food Security (CCAFS) East and West Africa Programs conducted a study to assess the gender dimension of climate information needs and access by smallholder farmers in Kaffrine, Senegal, Wote and Nyando in Kenya, and Rakai in Uganda. Site data about men’s and women’s access to and use of different types of climate information was collected from the four sites and analyzed.
Most men and women had access to information regarding the start of the rains, seasonal forecasts, and crop production. Women in Kaffrine seemed to have had the lowest access to climate information in general (their highest percent of access was 65% compared to at least 83% in the East Africa sites), which may be related to gender-defined labor roles in which women undertake most of the off-farm work (Yacine et al., 2011). In addition, there were some gender differences by site for different types of information. For example, in Nyando, 80% of men and 40% of women had access to seasonal weather forecasts. Similarly in Wote, 92% of men and only 43% of women had access to drought information. These observations emphasize the importance of considering gender in delivering seasonal weather forecasts information services to assure access to different types of information. Although twice as many men in Wote had access to information on droughts, women more frequently had access to information on crop and livestock production, as well as post-harvest handling, as compared to men. This is a reflection of household gender roles and responsibilities, where men are mainly in charge of overall decisions in a family while women are implementers and custodians of family resources.
Consequently, while men need information regarding when rains will start, many women need to know when rains will cease. This is due to the fact that culturally, men prepare their lands and plant first, and then their wives can do so (in order of marriage in the polygamous society). Therefore, women cannot choose when to plant their crops. On the other hand, rain cessation information is important because they can better plan when to harvest their crops. Along with the type of information (when rains start or end), men and women in the region have different preferences for sources of information.
Although access to and use of different types of climate information varied by both site and gender, typically if an individual had access to the information, they used it to engage in new agricultural practices that helped them adapt to climate change. However, this was not the case for droughts among men in Rakai and women in Kaffrine, where only 47% and 43%, respectively, used the information whenever they accessed it. However, this was not the case for short-term weather forecasts in Nyando for either men or women, or for men in Wote or women in Rakai. This is likely related to how salient, credible and relevant people perceive the information to be, or to whether they had access to other resources that are needed to use the information to adapt to or cope with weather events. Furthermore, access to sources of climate and agricultural-related information is largely informed by religious affiliation and gender. At the beginning of a project to reduce the vulnerability of women rural producers to rising hydro-meteorological disasters in Senegal, many experts and community leaders suggested that information be provided by radio, at the mosque, and to community leaders to make it widely accessible. However, later in the project it was found that women often fail to receive the information from the mosque or community leaders (authors’ observations).
With regard to climate and agricultural information sources, access to different sources (i.e., extension agents, radio programs, etc.) was largely structured by gender and, in certain study sites, by an individual’s religious affiliation. Most men and women across all the sites seem to have access to a few common sources of information, while access to other sources varies across the sites and by gender. Nearly all men and women had access to agricultural or climate information from radio programs, family members, neighbors, and their own or traditional knowledge. In addition, most men and women also got information from NGOs, government extension agents, and community meetings. However, these channels were less common in Kaffrine, especially among women, where only 2% of women had access to extension agents and 8% to NGOs and community meetings. There was a wide range in access to community meetings and NGOs across gender and sites. In Kenya, there was no statistically significant difference between men and women’s access to agricultural information from NGOs as opposed to their counterparts in Uganda and Senegal. Men across all study sites, except Wote, had access to information disseminated through community meetings. An insignificant population of men and women across the study sites had access to agricultural or climate information disseminated through TV, newspapers/bulletins, schools/teachers, mobile phones, the Internet, and agricultural shows.
Source: Authors’ Observations
Africa Agriculture Status Report 2014 | 95
The informal networks of communication are typically exclusionary of women, particularly networks related to livestock and human health. This is important to note because, while women may have some access to formal channels of information, they are unable to access information from informal networks structured by men due to cultural norms. Women primarily access information on livestock feed through women’s associations, water and forest services, and social networks, suggesting that most of women’s access to sources of information comes from institutions oriented specifically around women and their concerns.
While undertaking to offer agricultural and climate information services to smallholder farmers, it is imperative to consider, not only the type and source of information for different target audiences, but also the timing. Most of the mass media disseminate information in the evenings with the aim of reaching out to many people after work, but this does benefit women. Women often do not receive the forecasts on the radio because
they are given at the times of the day when women are the busiest: in the morning and evening when they are cooking or doing other chores. Access to and use of different types and sources of information is highly related to the gender, ethnicity, and religion of individuals in smallholder farming settings. If development projects and policies ignore how different individuals interact with sources and types of information and other resources, they may unintentionally address the needs of one group while further marginalizing the other.
Given the wider limitation to accessing relevant agricultural and climate information, women are therefore less likely than men to be aware of CSA practices, but more likely than men to adopt them if they were aware; when individuals have access to weather and agriculture-related information, they are more likely to take up new practices that help them adapt to climate change. Sources and modes of dissemination of such information strongly influence how well it reaches both men and women farmers.
Availability of Financial Services to Smallholder FarmersMost smallholder farmers in Africa have limited access to credit and, hence, limited financing for higher yielding and/or better adapted seed varieties and other improved production technologies. CSA approaches across the continent remain severely underfunded. To scale up these initiatives, governments and donors need to significantly rebalance their current focus in the direction of a much greater support for sustainable, agro-ecological approaches (Christian Aid, 2011). Such support should give due attention to issues related to financing CSA as an essential step towards managing climate related risks. Financing ‘early action’ to drive change in agricultural production systems in order to increase resilience to shocks induced by weather variability, while contributing significantly to mitigation of climate change, is instrumental in supporting CSA among small farmers. The nature of support includes national climate risk assessments, development of mitigation and adaptation strategies, and program implementation (Commission on Sustainable Agriculture and Climate Change, 2011).
Lack of awareness and understanding of CSA technologies by smallholder farmers, together with the associated higher cost farming technologies, have been major impediments to adoption of current and emerging climate0smart technologies and practices. Consequently, significant investment is required by technology providers in capacity development of extension services and farmers in order to increase their awareness of the benefits of unfamiliar technologies or practices. Various
avenues could be used to achieve this goal. Key among them: meeting farmers on their turf and explaining the benefits of the technology or practice, and on-farm demonstration of the technology or practice and the associated impacts on productivity. Promotion of public-private partnerships could provide quick solutions to the challenges that arise due to these expectations. In Kenya, through microfinance institutions (MFIs), a number of people have benefited from loan guarantee schemes from such donors as USAID and SIDA, designed to encourage MFIs to lend to the agricultural sector. However, to realize success, the incentives and targets for loan officers must be aligned to the high-level strategy of the respective MFI in order to safeguard the needs and interests of smallholder farmers.
Other funding sources for CSA include the technology development institutions themselves. Technology companies, through their own financial services, are offering farmers the opportunity to ‘rent to own’ – a kind of hire purchase arrangement, which breaks down the cost of the product into more affordable amounts. The widespread use of mobile phones and such services as M-pesa in countries like Kenya means that rental payments can be automated, as can payment reminders to farmers. In addition, agricultural companies can also provide ‘embedded finance’ in the value chain. For example, a company may source its crops from hundreds of out-growers. This implies that it has a vested interest in ensuring that its out-growers are successful through
96 | Africa Agriculture Status Report 2014
promoting the use of improved farming practices and new technology. The company can provide input loans to cover the cost of such items as drought-tolerant seed, fertilizer, and irrigation equipment, with the loans being repaid through the farmers’ deliveries of crops to the company. In order to safeguard the interests of companies, appropriate mechanisms should be put in place to curb ‘side-selling’ of agricultural produce by farmers striving to maximize returns. However, in Africa the vast majority of smallholder farmers does not participate in such out-grower schemes and are therefore shut out of these financing mechanisms.
Another innovative financing mechanism for CSA is the transformation of the NGO give-away model that often relies on continued donor funding, and is hence unsustainable, to for-profit companies that provide input loans to farmers and also act as off-takers of produce. These companies can also help communities set up village savings and loan schemes. This presents a great opportunity for companies promoting climate-smart practices and technologies to link up with village savings and loan schemes in addressing barriers to finance and reducing risks in agriculture.
Risks in AgricultureAfrican agriculture, being predominantly rainfed and dependent on other natural capital, together with the limited adaptive capacities of farmers, makes it a very risk-averse socioeconomic sector. Risks in African agriculture are wide ranging and include: natural and production risks; technology risks; market, marketing, price, and economic risks; credit and other financial risks; policy and institutional risks; and human health-related risks, among others (Commission on Sustainable Agriculture and Climate Change, 2011). In agriculture, risk could mean the likelihood of a dry year, an extreme flood, or even a sudden fluctuation in farm produce prices that in turn results in a substantial loss of crops or income (Steffen et al., 2011). Similarly, what may be a risk for some may be an opportunity for others. For instance, a La Niña event may increase the chance of flooding or waterlogging in some areas and thus significantly reduce crop yields, while in other areas it may in fact create the right conditions for a bumper crop.
Major climate vulnerabilities in Africa include high dependence on climate-sensitive livelihoods and value chains, degraded natural resources, a dilapidated infrastructure, inflexible behavior of many people in a changing environment, and the poverty trap, among others (Müller, 2013). A combination of these factors, and many others, increases Africa’s vulnerability to climate change. The climate of Africa continues to be highly variable, manifesting in increased frequency of droughts, floods, frost, hail, and strong winds that present considerable threats to the agricultural sector.
Initiatives for overcoming risk barriers to CSA adoption Increased frequencies and intensities of extreme climate events resulting from climate variability and change have prompted growing interest in risk management in agriculture (Collins, 2011). Risk management basically
refers to the process of identification, assessment, quantification, ranking and handling of potential risks (controlling the probability and/or impact of unfortunate events) in a way best-suited to investment objectives (Olson and Wu, 2010). Among the risk factors in African agriculture, those related to climate change pose the greatest challenge. For example, economic studies show that climate change will affect not only agricultural production, but also agricultural prices, trade, and food self-sufficiency (Evenson, 1999; Wang, Huang and Rozelle, 2010). In addition, climate change-induced extreme events, such as increased flooding, more frequent severe storms, droughts, and heat waves, and their related effects on animal health and the emergence and/or severity of pests and plant diseases, will have adverse impacts on agriculture (Schlenker and Lobell, 2010; Müller et al., 2011).
The costs of ordinary and catastrophic weather events have exhibited a rapid upward trend in recent decades ( Changnon, 2010; McKechnie and Wolf, 2010; Changnon, 2011). Over the years, farmers have employed both ex-ante and ex-post strategies to cope with the various risks inherent in agricultural systems (Thornton, 2006; Yamauchi, Yohannes and Quisumbing, 2009; Sirrine, Shennan and Sirrine, 2010; Leblois et al., 2014). Ex-ante risk management strategies used by SSA farmers include: risk avoidance, by planting early-maturing and drought-tolerant varieties to mitigate against drought; risk retention, by accumulating savings to use in periods of scarcity; risk reduction, by reducing investments committed to farming, or practicing conservation agriculture; and to some extent risk transfer, by purchasing insurance cover to cushion themselves against the adverse impacts of insurable risks.
With this backdrop, risk management using a wide range of approaches therefore merits special attention in agriculture. Some of the notable strategies that could deliver on the desired goals include: assessment and monitoring of climate and other agricultural production resources; use of weather and climate information and

Africa Agriculture Status Report 2014 | 97
agro-advisories; early warning and response systems; strategic diversification of farming systems to spread the risk; whole-farm planning and the allocation of resources to specific activities or seasons or years; and risk-transfer mechanisms involving use of relevant financial instruments, such as insurance, sales contracts and hedging. Combining practices that deliver short-term benefits with those that give longer-term benefits can reduce opportunity costs and provide greater incentives to invest in better management practices (World Agroforestry Centre, 2011).
Agricultural insurance as a tool for promoting CSA – Risk transfer mechanisms that involve purchase of insurance cover to cushion farmers against the adverse impacts of insurable risks constitute one of the means of supporting adoption of CSA among smallholder farmers. As observed by the IPCC (2014), “insurance and financial services represent a risk-spreading mechanism through which the costs of weather-related extreme events are distributed among other sectors and throughout society”.
In Africa, three broad categories of index-based insurance products have been piloted: 1) area-yield index insurance, 2) weather-index insurance, and 3) remotely-sensed Normalized Difference Vegetation Index (NDVI) and satellite-based rainfall index. These insurance products have been tested in several African countries (Müller et al., 2011; Müller, 2013) .
Crop area-yield index insurance (AYII) – This is a type of index insurance that covers farmers according to yield loss or shortfall against a predetermined average area yield (the index) in a defined geographical area, such as a county (Bokusheva & Breustedt, 2012). Despite the fact that this product does not insure individual farmers against yield loss on their own fields, but according to an area yield index, as well as its failure to pick localized events (including hail), this index covers all risks that reduce average yields in the area covered by the insurance service. However, a lack of high quality historical yield data for use in designing appropriate products presents a major challenge.
Weather-index insurance (WII) – This is an innovative form of index insurance that covers farmers against weather-related extreme events. WII utilizes a proxy (or index) – such as amount of rainfall, or temperature, or wind speed – to trigger indemnity payouts to farmers. This index helps to determine whether farmers have suffered losses from the insured peril and hence need to be compensated. Another inherent feature of this index is its capability to predict losses with a good degree of certainty. To date, the most common application of WII is against rainfall deficits, including drought, based on rainfall measurements at a reference weather station or stations during a defined period of time.
In this scheme, insurance payouts are made based on a pre-established indemnity scale set out in the insurance
policy. Here, the sum insured is based on the production costs for the selected crop, and indemnity payments are made when actual rainfall in the current cropping season, as measured at a selected weather station, falls below pre-defined threshold levels. Although this insurance product covers covariate weather risk, it is faced with a significant challenge related to basis risk that arises when what is predicted by the index differs from farmers’ experiences in some regions under insurance cover. The operationalization of this product requires intensive technical inputs and skills that are often not available in Africa. The concentration on rainfall indices and the need for high quality weather data and infrastructure, combined with the currently limited options for insurance products, present additional challenges to the adoption of this product.
Remotely sensed indexes [vegetation (NDVI) index, water (NDWI) index, synthetic (SAR) radar] – Inadequacy of ground-based data has prompted the use of remote sensing products in the form of NDVI, NDWI and SAR to design indexes to provide certain weather evidence (Razali and Nuruddin, 2011; Rojas et al., 2011). The remote sensing approach is currently more focused on the livestock sector, where it is used to determine the extent of drought, with compensation set by a threshold trigger (Chantarat et al., 2013). It is also increasingly considered a viable alternative to the index-based crop insurance, due to unreliable weather station-based data sources (Kamble et al., 2013). Since 2010, Kenya has been piloting a new NDVI pasture-drought scheme for nomadic pastoralists. Satellite estimation of rainfall using infrared and passive microwave radiation data offers the potential to overcome the lack of adequate density of ground-based weather observation stations in many developing countries in Africa. Satellite rainfall indexes are a very new concept and currently such products are under research and development in Kenya, Ethiopia, and in some West African countries.
These innovative products have been piloted to support smallholder farmers in other low income countries, especially in Africa, with mixed results (Jones et al., 2003; Rao, 2010; Zhou, 2010).There is great potential for index-based insurance in the future because a majority of smallholder farmers perceive climate change as a threat to their livelihoods (Morton, 2007; Bunce et al., 2010). However, management of climate-related risk varies by country and region. Usually, it is a mixture of commercial and public arrangements and self-insurance. Increasing the reliability and productivity of staple foods is a priority objective for smallholder farmers, and agriculture insurance could have positive impact on food security and income stabilization. Under increased weather-related risk exposure, agricultural insurance will ensure income is secured and that agricultural production is stabilized. Consequently, if widely adopted agricultural insurance has the potential to break the vicious cycle of high risk exposure, low investments, and low returns of subsistence farming (Nicola, 2011).

98 | Africa Agriculture Status Report 2014
Index-based weather insurance programs are being widely piloted in Africa as a means of achieving food security and poverty alleviation goals among 16 participating countries, including Benin, Botswana,
Burkina Faso, Ethiopia, Ghana, Kenya, Malawi, Mali, Mauritius, Mozambique, Nigeria, Rwanda, Senegal, Sudan, Tanzania, and Zambia. Box 3.5 highlights some success stories drawn from selected SSA countries.
Box 3.5 Pilot studies on Index-based weather insurance products in sub-Saharan AfricaA number of pilot studies have been conducted to test the suitability of index-based agricultural insurance in Africa since 2006.
EthiopiaEthiopia launched its index-based crop insurance in 2006, facilitated by the WFP with technical assistance from the World Bank. This was part of the implementation of a macro-drought index policy for the government of Ethiopia, designed as an ex-ante food security risk-financing instrument to fund emergency food aid. Under this macro-drought product, 62,000 households in 10 to 15 of the most-affected administrative districts were covered with a total sum insured of US$ 7.1 million and a total premium of US$ 930,000 (implied premium rate of 13%). While there was no payout because the weather conditions were good, the initiative enabled the government to develop a broader drought risk-management framework in the context of the Productive Safety Net Program (PSNP). The government was assisted in introducing an improved national and sub-national drought-risk modeling system for famine early warning purposes, termed LEAP (Livelihoods, Early Assessment and Protection) and to use this system to plan disbursements of emergency assistance to drought-affected regions in the country.
Under the second phase of PSNP (2010 to 2014), a drought-risk financing component was added to the program by securing a US$ 160 million contingency grant from the World Bank, the UK’s Department for International Development (DFID), and USAID; these funds are earmarked for distribution if LEAP indicates rainfall deficits and impending drought. This contingency loan arrangement was preferred by government because it was cheaper than purchasing a macro-level weather index insurance or derivative product (Hazell and Hess, 2011; ARCPT, 2011: Paper et al., 2013).
KenyaIn Kenya, interest in agricultural crop and livestock insurance re-emerged in the mid-2000s through two routes: 1) the development of a Kenyan market crop insurance capability to underwrite traditional indemnity-based multiple-peril crop insurance (MPCI) for medium- and large-scale commercial farmers, and 2) the introduction of index-based insurance as a potential retail product to market to smallholder and marginal crop and livestock producers in situations where it would be prohibitively expensive to operate traditional indemnity-based crop and livestock insurance programs. Consequently, several pilot initiatives have been undertaken for both crop and livestock. Of these many pilots, the Syngenta-supported initiatives have reached scale, with current insured farmers in excess of 140,000 across Syngenta’s Africa portfolio by 2013 (Salama and Kalibata, 2013; Paper et al., 2013). The success has been attributed to tying insurance premium payments to credit, having partnered with One Acre Fund, an NGO operating in Kenya, Rwanda, Tanzania and Burundi, and giving smallholder farmers inputs on a credit basis. Insurance is bundled with the input credit, with One Acre Fund purchasing insurance on behalf of farmers.
In addition, the International Livestock Research Institute (ILRI) has been spearheading the development of index-based livestock insurance (IBLI) in Kenya. IBLI is one of the most innovative risk-transfer approaches so far available for pastoral communities, and it has been tried in Kenya and Ethiopia. In Kenya IBLI was launched in February 2010. During the first sale window, 1,974 livestock producers (herders) purchased the IBLI drought cover in Marsabit District, covering a total of 5,965 Tropical

Africa Agriculture Status Report 2014 | 99
Livestock Units (TLUs) with a total sum insured (TSI) of US$ 1.18 million and total premiums paid by the herders of US$ 46,602 (average herder premium rate of 4.2%). While uptake was low in subsequent sale windows, research on the impact of insurance on food security showed that herders who were able to purchase IBLI were better off than those who did not.
SenegalThe government of Senegal recognized that it might be difficult to modernize its agricultural sector without appropriate risk-transfer mechanisms in place, given the serious impacts on food production of the increasing frequency and severity of natural disasters, especially drought and flooding. In addition, smallholder farmers required risk-transfer mechanisms to provide them with appropriate confidence that their investments in new technologies were guaranteed even in the face of challenges brought about by climate change. Furthermore, post-disaster aid to farmers was not producing the desired impact and ex ante intervention was seen to be necessary. This realization made Senegal one of the leading countries in West Africa to successfully broker a public-private partnership with the local insurance industry to support agricultural insurance, including index insurance (Muller, 2012). The government undertook a series of studies to determine the feasibility and viability of agricultural insurance. In 2005, it was recommended to establish a specialized National Agriculture Insurance Company of Senegal (CNAAS) to underwrite crop and livestock insurance based on the area yield-index for crops and livestock. The initiative covered selected crops (e.g., groundnut and maize) and livestock. An agricultural index insurance pilot was implemented in 2013 for 8,000-10,000 farmers in collaboration with international (CIRAD) and national (ISRA) research institutions, local experts from the National Meteorology Agency (ANACIM), and representatives of farmers’ organizations (ASPRODEB) (Africa, 2013; Paper et al., 2013).
Source: Muller, 2012
Key welfare impacts of livestock insurance coverage could be realized in the longer term, if livestock insurance helps pastoralists build up herd sizes over time and protects them from falling below the herd size needed to avoid collapsing into a poverty trap. A critical herd size of about 10-15 TLUs is appropriate to sustain a viable herd accumulation (Santos and Barrett 2013, Chantarat et al., 2014). Insurance services, therefore, constitutes an important tool for ensuring that smallholder farmers’ assets are protected and their livelihoods are enhanced. Livestock insurance could have large long-term positive impacts, especially on poor households with vulnerable herds, if the scheme safeguards them against falling into poverty traps. However, the overall impacts could be large when coverage is offered via cash transfers (non-conditional cash transfers provided by the government to cushion the most vulnerable households, e.g., Hunger Safety Net Program in Ethiopia and Kenya).
Transformation of weather and climate services – Weather and climate information play crucial roles before and during the cropping season, and if properly mainstreamed in farm-level decision-making, could enable farmers to mobilize requisite resources and apply them in a timely manner to reap maximum benefits from their investments. At the farm level, agricultural producers require information on a wide range of factors, including weather, soil, water, fertilizers
and pesticides that are specific to their farms. To further enhance farming decisions, farmers need additional information regarding the most appropriate types of seed, the crops that are available in the local market, and their respective market prices. This calls for the active participation of a number of stakeholders involved in delivering timely advice that is location and context specific, readily understood, and that has the potential to support end-user decision making, enabling them to take early actions and be prepared for an impending extreme or potentially disastrous event.
A precursor to realizing the full potential inherent in the renewed climate services would be an enhanced understanding and quantification of climate-related risks from extreme events, such as droughts, storms, hail, frost and floods. This would underpin informed decision-making for reducing the impacts of disasters and building socioeconomic resilience. One probable means of addressing this need is to develop a clear and operational framework for tackling the weather and climate challenges of the farming community and other related stakeholders, by providing timely value-added climate information and early warning services. This would constitute an innovative and possibly transformative way of translating climate information, which is seldom well understood by end users, into informed agricultural decisions, henceforth referred to as weather- and/or climate-based agricultural advisories.

100 | Africa Agriculture Status Report 2014
Climate-based agro-advisory services – In principle, a climate-based agro-advisory refers to recommendations derived from climate information that is transformed or translated using available agricultural knowledge that helps users along the agricultural information chain to make improved decisions for enhanced and sustained agricultural productivity. The agro-advisory service chain comprises a suite of steps, ranging from development and incorporation of science-based climate information and prediction services into planning, policy, and practical decision-making.
In SSA, owing to the increased ability of climate scientists and improved skill of climate forecasters, there are myriad emerging initiatives, both at the pilot and project levels, which use innovative approaches to address climate-related risk challenges in agriculture. Box 3.6 presents a case study drawn from SSA in which national agro-meteorological advisory services reach a significant proportion of their farming populations on a sustained basis with information and advisory services.
Box 3.6 Agro-meteorological advisory services in SSA: The case of Mali’s agro-meteorology advisory programIn response to increased cases of anomalous rainfall in Mali that culminated in widespread devastation to economies and livelihoods, a joint venture was initiated that involved Mali’s Direction Nationale de la Météorologie (DNM), the NMHS of Mali, external funding from the Swiss Agency for Development and Cooperation (SDC), and technical assistance from AGRHYMET center and WMO. The objective was to provide climate information to rural communities, particularly farmers, with a view to helping them manage rainfall-related risks. Prior to this intervention, local communities in Mali had been managing climate-related risks routinely as part of their everyday lives based on their indigenous and/or local knowledge systems. Initially, the probabilistic nature and highly scientific type of seasonal forecasts proved to be difficult for farmers to comprehend and integrate into decision-making. Like in most African countries, this demonstrated an inability by national meteorological services on their own to effectively communicate critical weather and climate information to vulnerable communities in rural areas.
To counter this weakness, the Mali initiative established a multidisciplinary group comprising technical, development, and research experts drawn from the NMHS, the Ministry of Agriculture, agricultural research institutes, rural development agencies, farmers, and the media. The group served as the interface between service providers and end users, a critical role that facilitates user-driven services by the NMHS. Recognizing the low literacy levels of farmers and the highly scientific level of climate products and information, the multidisciplinary group repackaged the climate data into useful information and advice for farmers, and made it available in multiple local languages. This made it more likely that farmers could use the information effectively, and contributed to sustaining the agricultural sector’s role in economic development.
Crop yields and incomes for farmers taking management decisions with and without agro-meteorological information, in the 2003-2004 seasons in Mali
CROPDEVELOPMENT ZONE FIELD TYPE AREA (HA)
AVERAGE YIELD (KG/HA)
GROSS INCOME (US$/HA)
INCOME GAIN IN AGROMET FIELDS (%)
Pearl millet OVHN Agromet 2,600 1,204 175 26
Non-agromet 67,168 957 139
DRAMR Agromet 750 757 110 10
Non-agromet 45,790 690 100
ORS Agromet 10,400 1,247 181 48
Non-agromet 461,915 840 122
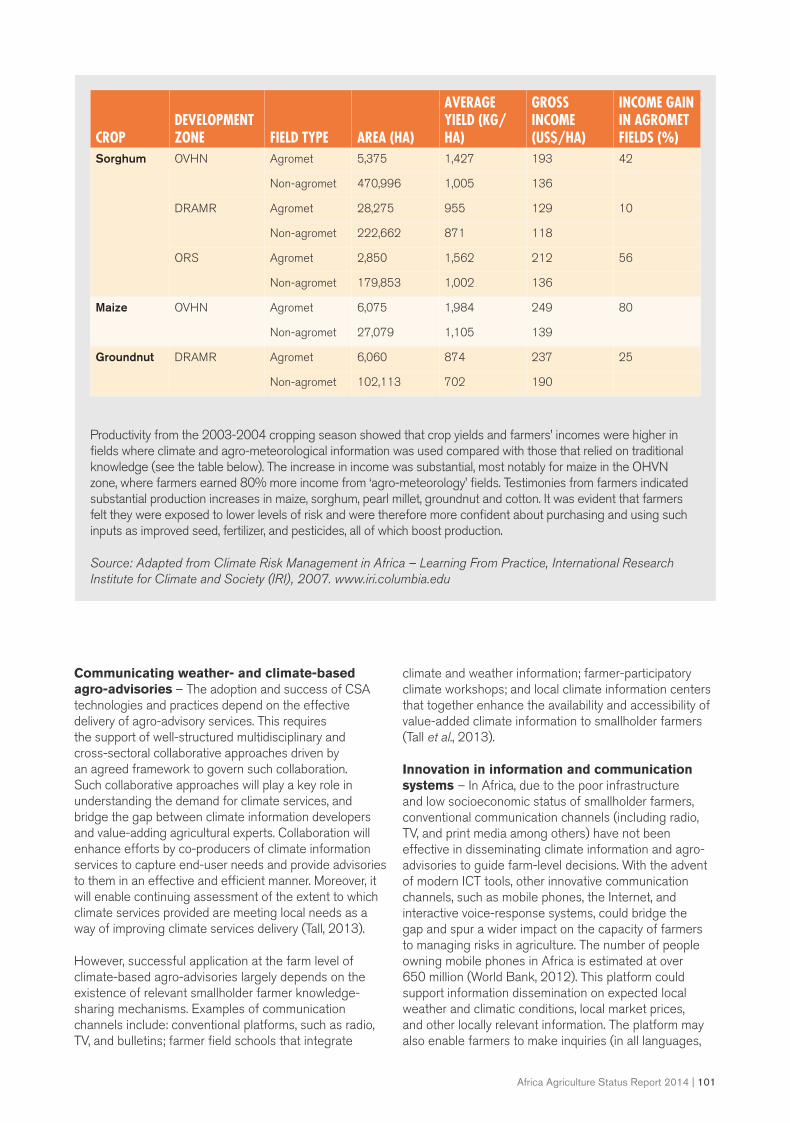
Africa Agriculture Status Report 2014 | 101
CROPDEVELOPMENT ZONE FIELD TYPE AREA (HA)
AVERAGE YIELD (KG/HA)
GROSS INCOME (US$/HA)
INCOME GAIN IN AGROMET FIELDS (%)
Sorghum OVHN Agromet 5,375 1,427 193 42
Non-agromet 470,996 1,005 136
DRAMR Agromet 28,275 955 129 10
Non-agromet 222,662 871 118
ORS Agromet 2,850 1,562 212 56
Non-agromet 179,853 1,002 136
Maize OVHN Agromet 6,075 1,984 249 80
Non-agromet 27,079 1,105 139
Groundnut DRAMR Agromet 6,060 874 237 25
Non-agromet 102,113 702 190
Productivity from the 2003-2004 cropping season showed that crop yields and farmers’ incomes were higher in fields where climate and agro-meteorological information was used compared with those that relied on traditional knowledge (see the table below). The increase in income was substantial, most notably for maize in the OHVN zone, where farmers earned 80% more income from ‘agro-meteorology’ fields. Testimonies from farmers indicated substantial production increases in maize, sorghum, pearl millet, groundnut and cotton. It was evident that farmers felt they were exposed to lower levels of risk and were therefore more confident about purchasing and using such inputs as improved seed, fertilizer, and pesticides, all of which boost production.
Source: Adapted from Climate Risk Management in Africa – Learning From Practice, International Research Institute for Climate and Society (IRI), 2007. www.iri.columbia.edu
Communicating weather- and climate-based agro-advisories – The adoption and success of CSA technologies and practices depend on the effective delivery of agro-advisory services. This requires the support of well-structured multidisciplinary and cross-sectoral collaborative approaches driven by an agreed framework to govern such collaboration. Such collaborative approaches will play a key role in understanding the demand for climate services, and bridge the gap between climate information developers and value-adding agricultural experts. Collaboration will enhance efforts by co-producers of climate information services to capture end-user needs and provide advisories to them in an effective and efficient manner. Moreover, it will enable continuing assessment of the extent to which climate services provided are meeting local needs as a way of improving climate services delivery (Tall, 2013).
However, successful application at the farm level of climate-based agro-advisories largely depends on the existence of relevant smallholder farmer knowledge-sharing mechanisms. Examples of communication channels include: conventional platforms, such as radio, TV, and bulletins; farmer field schools that integrate
climate and weather information; farmer-participatory climate workshops; and local climate information centers that together enhance the availability and accessibility of value-added climate information to smallholder farmers (Tall et al., 2013).
Innovation in information and communication systems – In Africa, due to the poor infrastructure and low socioeconomic status of smallholder farmers, conventional communication channels (including radio, TV, and print media among others) have not been effective in disseminating climate information and agro-advisories to guide farm-level decisions. With the advent of modern ICT tools, other innovative communication channels, such as mobile phones, the Internet, and interactive voice-response systems, could bridge the gap and spur a wider impact on the capacity of farmers to managing risks in agriculture. The number of people owning mobile phones in Africa is estimated at over 650 million (World Bank, 2012). This platform could support information dissemination on expected local weather and climatic conditions, local market prices, and other locally relevant information. The platform may also enable farmers to make inquiries (in all languages,

102 | Africa Agriculture Status Report 2014
including local dialects) specific to their crops, and receive personalized replies from agricultural extension experts on their phones. The service, if well configured, could offer personalized advisory services in voice and/or graphic modes on a simple mobile phone – all based on real-time data as well as the expressed needs of farmers.
Effective communication of weather-based agro-advisories to smallholder farmers would provide avenues through which resilience to climate change associated risks and impacts could be built. In Africa, several strategies have been used to communicate weather and climate information and their respective derived agro-advisories. A notable case from West Africa is presented in Box 3.7.
Furthermore, innovative communication strategies could complement community level efforts to enhance social cohesion through stronger community networks and local institutions focused on improving farmers’ capabilities in managing climate-related risks. This could be particularly important in communities where farmers are involved in groups that motivate and shape proactive
and participatory decision-making. In addition, farmers could gain immensely from the disseminated weather- and climate-based advisories, which could contain: recommendations on when to harvest crops in order to minimize crop damage; advice on water, pesticides, and fertilizers in relation to how much and the timing of application; current market prices to inform decisions on where and when to sell their produce; and information about accessing micro-loans and crop insurance services.
Besides farmers, other stakeholders along the agricultural value chains also stand to benefit tremendously from the agro-weather and climate advisory services. For instance, intermediary agro-product trading companies could gain direct access to farmers, fostering closer links to their customer base. Furthermore, this service constitutes a practical channel through which government systems could communicate information and new policies to farmers, as well as provide channels for receiving feedback from farmers that is crucial for further development and review of policies.
Box 3.7 Communicating seasonal forecasts to farmers in Kaffrine, Senegal for better agricultural managementThis project aimed at translating and communicating seasonal forecasts, along with an indication of probabilities, in easily understandable language, giving farmers the capacity to make informed farm management decisions. This was coupled with discussions on farmers’ traditional forecast practices, providing space to share the different types of knowledge and so increase everyone’s ability to make more informed decisions. This was in response to the need for adaptation to the projected adverse impacts of climate change. In the new scenario RCP4.5 (a moderate scenario), the Beijing Climate Center’s global circulation model projects a decrease in rainfall and an increase in temperature over the Kaffrine region in central Senegal in the 2020s. For Kaffrine, the likely increase in temperatures would create more evaporation, meaning more demand for water and more stress for the plants.
While climate has varied considerably over the past 50 years in Kaffrine, farmers were still not using seasonal forecast information to cope with climate variability. This project operated on the premise that seasonal climate forecasts, communicated in accessible and meaningful ways to farmers, could provide invaluable knowledge for local agricultural decisions and livelihoods. These forecasts were delivered through a multidisciplinary team of: farmers (unions and individual farmers); local extension workers; climatologists from the National Meteorological Agency; development workers from the Red Cross and from World Vision; agricultural advisers from the national agency for agricultural and rural advice (ANCAR); agronomists from the Ministry of Agriculture; an agro-economist from the Senegalese Agricultural Research Institute (ISRA); and staff from the Climate Change Agriculture and Food Security (CCAFS) West Africa program (which is run by the CGIAR Consortium). Scientific climate forecasts were brought together with farmers’ own local knowledge of, and vocabulary for, coping with the changing climate.
Source: Ndiaye et al. (2013)

Africa Agriculture Status Report 2014 | 103
Innovative Financing: ‘Growing’ Resources for Climate-Smart Agriculture Addressing the challenges associated with food security and climate change requires a concerted effort by a consortium of governments, development agencies, corporate partners and philanthropic organizations. However, the institutional landscape of organizations providing financial support for technical assistance and investments for CSA is both diverse and complex. Organizations such as FAO, the World Bank Group, the CGIAR Consortium (of which ILRI is a member), the Global Environment Facility (GEF) and other bilateral and multilateral development partners have been providing billions of dollars for decades in support of activities consistent with CSA. In the past, most institutions have approached agriculture and food security by focusing on productivity increases through the introduction of new technologies, such as improved seed, and fertilizer and/or more effective irrigation systems. More recently, however, organizations have approached agriculture with a view to increasing the resilience of the sector to the impacts of climate variability and change.
While CSA is not entirely new conceptually, placing agricultural production and food security in the context of global climate change might draw new attention to agriculture and enhance funding opportunities for technical assistance, research and other investments (Ayers and Huq, 2009). This would also assist in flagging the need for the international development community to develop a shared solution-oriented approach to finance CSA through such avenues as the Climate Investment Funds (CIF), which serves as a viable modality to provide large-scale resources for CSA using a programmatic and country-driven approach. One of the main principles of the CIF is to capitalize on the comparative advantages of partners and on crowd sourcing instead of competition, which usually leads to fragmentation and duplication of efforts. Two examples from SSA – Burkina Faso receiving support through the Forest Investment Program and Niger being supported through the Pilot Program for Climate Resilience – provide evidence of the CIF approach and positive early results.
Funding for climate-smart agricultureIn order to secure appropriate funding for CSA in Africa, the investments needed to support agricultural development in the context of CSA technologies and practices must be understood. Investing in CSA will
certainly come with a large price tag. According to the World Bank, cumulative gross investment requirements for developing countries’ agriculture add up to a total of nearly US$ 9.2 trillion over the next 44 years (2005/07-2050). This amount would be required to remain consistent with FAO’s long-term outlook for global agriculture (World agriculture: towards 2030/50). In order to achieve food security for a growing population in all developing countries, an estimated net US$ 83 billion per year is required; SSA alone will need US$ 11 billion per year (Miller et al., 2010; FAO, 2010).
In SSA, the annual cost for climate change adaptation for the period 2010-2050 is estimated at US$ 18 billion (Nakhooda et al., 2011). On the other hand, FAO estimates that the investment needed for SSA, the Near East, and North Africa for climate adaptation in agriculture will be around US$ 3 billion per year (Branca et al., 2012). Climate mitigation costs in Africa through better land and water management in Africa are estimated at between US$ 2.6-5.3 billion per year until 2030, with an additional US$ 8.1-16.2 billion per year to avoid a 75% deforestation of the continent (Shames et al., 2012).
Currently, the international community, using bilateral and multilateral aid, follows a project-based approach to channeling financial and technical resources to developing countries. Each institution follows its own logic and internal procedures consistent with the principles agreed in the ‘Paris Declaration on Aid Effectiveness’ (OECD, 2005). However, fragmentation of, and competition for, funding has become a major barrier to transformational changes in economic sectors at the country level, including agriculture. In recent years, developing country governments have become increasingly aware that it is not necessarily the amount of resources flowing into the country that will change the dynamics. A transparent and government-led ‘organization’ of funding flows is essential for using these resources effectively and efficiently. Country-ownership in managing funding flows and channeling resources to identified priority areas has become a key mantra for transformational change at the country-level.
Climate investment funds for climate-smart agriculture – In absence of a global deal on climate change, the international community created the Climate Investment Funds in 2008, as a multi-donor trust fund implemented through five multilateral development banks (MDB)1 in support of countries climate-resilient, low-carbon development paths. The CIF deploys an unprecedented high volume of resources (a total pledge volume of US$ 8 billion)
1. African Development Bank, Asian Development Bank, European Bank for Reconstruction and Development, Inter-American Development Bank and the World Bank Group (including IFC).

104 | Africa Agriculture Status Report 2014
to a limited number of member countries (48) to support climate mitigation and adaptation/resilience actions. The mandate to initiate transformational change and capture lessons in a systematic way has encouraged the application of a new approach to planning and implementing climate actions that goes beyond the business-as-usual mode of operation. Here, emphasis is given to country-led efforts to ensure domestic priority setting and resource deployment, which is rooted in a programmatic and partnership-based approach. Consultation and dialogue on resource planning and use are at the center of the approach, instead of competition and limited communication designed to ring-fence allocations and influence. The lessons learned from the CIF approach and its implementation is intended to inform other financing mechanisms for addressing climate change, including the Green Climate Fund.
CIF funding comprises two streams: the Forest Investment Program (FIP) and the Pilot Program for Climate Resilience (PPCR), both of which are supporting climate-smart agriculture. These two streams have a combined investment volume of about US$ 2 billion.
Forest Investment Program (FIP) – Recognizing that agriculture is the main driver of deforestation, which contributes about 17% to global GHG emissions with the sector itself contributing an additional 14%, FIP supports developing country efforts to reduce deforestation and forest degradation, and promotes sustainable forest management that leads to emissions reductions and enhancement of forest carbon stocks (REDD+). Investment areas in the FIP portfolio include agriculture, agroforestry and wider landscape management.
FIP financing complements large-scale MDB investments and leverages additional resources, including those from the private sector, to undertake the following functions:
• Promote forest mitigation efforts, including protection of forest ecosystem services;
• Provide support outside the forest sector to reduce pressure on forests (including agriculture);
• Help countries strengthen institutional capacity, forest governance, and forest-related knowledge; and
• Mainstream climate resilience considerations and contribute to biodiversity conservation, protection of the rights of indigenous peoples and local communities, and poverty reduction through rural livelihoods enhancements.
FIP has an investment volume of about US$ 640 million and supports the efforts of eight countries2 to address the drivers of deforestation and forest degradation, including agriculture. Each of these countries has an agreed national vision for using large-scale FIP resources in the context of their national REDD+ priorities. In addition, a ‘Dedicated Grant Mechanism for Indigenous Peoples and Local Communities’ complements larger REDD+ investments in three SSA countries: Burkina Faso, the Democratic Republic of Congo, and Ghana.
Pilot program for climate resilience (PPCR) – The PPCR is a fund meant to support country efforts to integrate climate risk and resilience into core development planning and implementation processes. The Program provides incentives for scaled-up action and initiates transformational change by catalyzing a shift from business-as-usual to broad-based strategies for achieving climate-resilient sustainable development at the country level. The centerpiece for the PPCR approach is cross-sectoral planning and management of natural resources in the context of climate change. Large-scale PPCR investments are complemented by capacity development activities that increase the ability of the stakeholders to react in an informed manner to the present and future impacts of climate variability and change. Informed decision-making enables particularly vulnerable groups (including women and indigenous peoples) to engage in a new paradigm for their livelihoods. Sound policies and the provision of better climate information and hydro-meteorological services are the backbone for any natural resources-based economy.
PPCR-supported programs are country-led and build on National Adaptation Programs of Action (NAPAs), along with other national development programs and plans. The PPCR complements existing development efforts and supports actions based on comprehensive planning consistent with country poverty reduction and development goals. PPCR supports nine countries and two regional programs, which cover nine additional small-island development states3. A total of US$ 1.3 billion has been made available to address key priority areas for adaptation and resilience building. To date, the largest investment areas of the PPCR are in agriculture, watershed and water basin management, and climate data and hydro-meteorological services. Three SSA countries (Niger, Mozambique and Zambia) participate in the PPCR. Boxes 3.8 and 3.9 present case studies of CIF investments in CSA in Africa, based on FIP (Burkina Faso) and PPCR (Niger) financing.
2. FIP pilot countries: Brazil, Burkina Faso, Democratic Republic of Congo, Ghana, Indonesia, Lao PDR, Mexico, Peru.
3. PPCR pilots: Bangladesh, Bolivia, Cambodia, Mozambique, Nepal, Níger, Tajikistan, Yemen, Zambia’ Carribbean regional program (Dominica, Haiti, Jamaica, Grenada, St. Lucia, St. Vincent and the Grenadines) and Pacific regional program (Papua New Guinea, Samoa and Tonga)
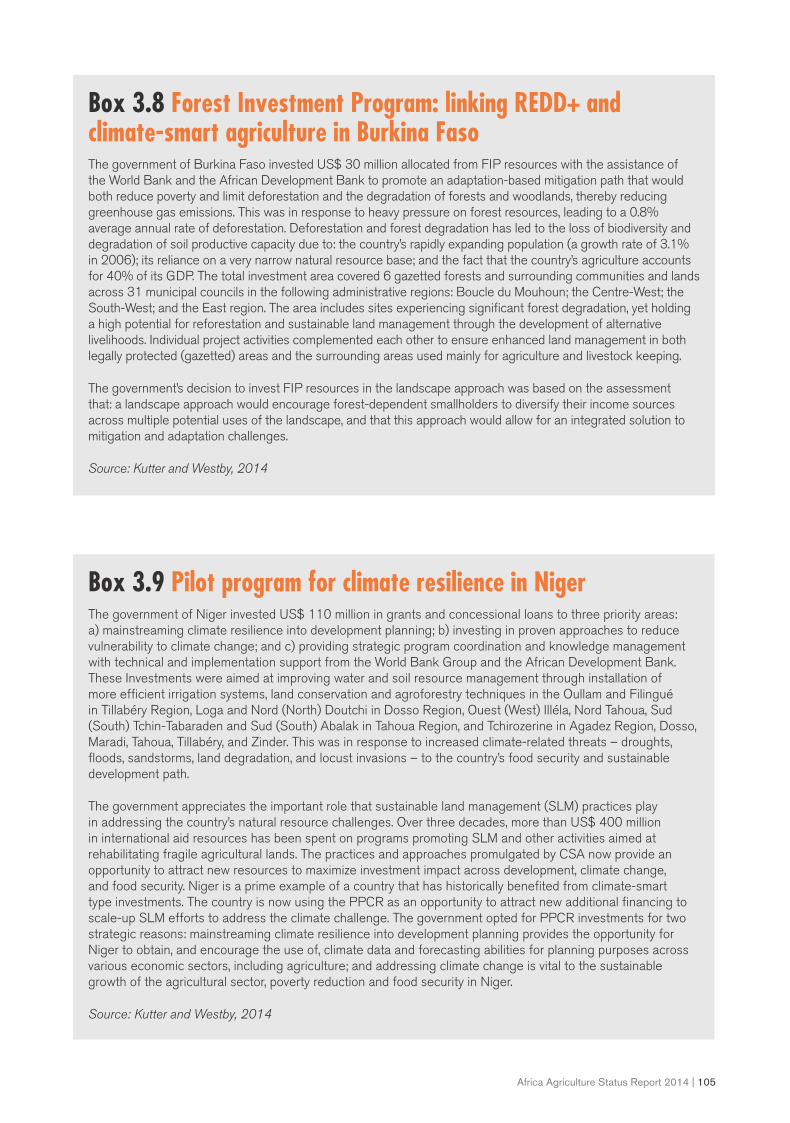
Africa Agriculture Status Report 2014 | 105
Box 3.8 Forest Investment Program: linking REDD+ and climate-smart agriculture in Burkina Faso The government of Burkina Faso invested US$ 30 million allocated from FIP resources with the assistance of the World Bank and the African Development Bank to promote an adaptation-based mitigation path that would both reduce poverty and limit deforestation and the degradation of forests and woodlands, thereby reducing greenhouse gas emissions. This was in response to heavy pressure on forest resources, leading to a 0.8% average annual rate of deforestation. Deforestation and forest degradation has led to the loss of biodiversity and degradation of soil productive capacity due to: the country’s rapidly expanding population (a growth rate of 3.1% in 2006); its reliance on a very narrow natural resource base; and the fact that the country’s agriculture accounts for 40% of its GDP. The total investment area covered 6 gazetted forests and surrounding communities and lands across 31 municipal councils in the following administrative regions: Boucle du Mouhoun; the Centre-West; the South-West; and the East region. The area includes sites experiencing significant forest degradation, yet holding a high potential for reforestation and sustainable land management through the development of alternative livelihoods. Individual project activities complemented each other to ensure enhanced land management in both legally protected (gazetted) areas and the surrounding areas used mainly for agriculture and livestock keeping.
The government’s decision to invest FIP resources in the landscape approach was based on the assessment that: a landscape approach would encourage forest-dependent smallholders to diversify their income sources across multiple potential uses of the landscape, and that this approach would allow for an integrated solution to mitigation and adaptation challenges.
Source: Kutter and Westby, 2014
Box 3.9 Pilot program for climate resilience in Niger The government of Niger invested US$ 110 million in grants and concessional loans to three priority areas: a) mainstreaming climate resilience into development planning; b) investing in proven approaches to reduce vulnerability to climate change; and c) providing strategic program coordination and knowledge management with technical and implementation support from the World Bank Group and the African Development Bank. These Investments were aimed at improving water and soil resource management through installation of more efficient irrigation systems, land conservation and agroforestry techniques in the Oullam and Filingué in Tillabéry Region, Loga and Nord (North) Doutchi in Dosso Region, Ouest (West) Illéla, Nord Tahoua, Sud (South) Tchin-Tabaraden and Sud (South) Abalak in Tahoua Region, and Tchirozerine in Agadez Region, Dosso, Maradi, Tahoua, Tillabéry, and Zinder. This was in response to increased climate-related threats – droughts, floods, sandstorms, land degradation, and locust invasions – to the country’s food security and sustainable development path.
The government appreciates the important role that sustainable land management (SLM) practices play in addressing the country’s natural resource challenges. Over three decades, more than US$ 400 million in international aid resources has been spent on programs promoting SLM and other activities aimed at rehabilitating fragile agricultural lands. The practices and approaches promulgated by CSA now provide an opportunity to attract new resources to maximize investment impact across development, climate change, and food security. Niger is a prime example of a country that has historically benefited from climate-smart type investments. The country is now using the PPCR as an opportunity to attract new additional financing to scale-up SLM efforts to address the climate challenge. The government opted for PPCR investments for two strategic reasons: mainstreaming climate resilience into development planning provides the opportunity for Niger to obtain, and encourage the use of, climate data and forecasting abilities for planning purposes across various economic sectors, including agriculture; and addressing climate change is vital to the sustainable growth of the agricultural sector, poverty reduction and food security in Niger.
Source: Kutter and Westby, 2014
106 | Africa Agriculture Status Report 2014
Emerging lessons from other funding mechanisms in support of CSALarge-scale finance for CSA can be leveraged and deployed if three crucial conditions are met. The first condition is a mechanism for country-driven programming resources. This implies that country governments need to lead the development of a common vision on how best to use available resources. In assuming a leadership role, the government can better organize the flows of resources to avoid duplication, fill financing gaps, and create synergies. Of course, country circumstances differ, so a flexible approach is needed that, in some cases, requires building institutional and human resource capacity in the government.
A second condition is the need for a programmatic approach to develop a pipeline of projects and programs in support of CSA that provides a strategic basis for planning and implementation. This is because: CIF has moved away from an isolated project-by-project approach and advocates a programmatic approach to planning and implementation; investment priorities are identified and agreed through public dialogue and consultations; development partners agree on the implementation arrangements for the identified investments based on their comparative advantages; synergies are identified and collaborative arrangements agreed upon; ensuring that the programmatic approach is fully deployed is a process that might take some time, depending on country-level capacity.
Finally, a partnership-based approach to programming the allocation of resources must replace a competition-
based approach. From the beginning, the CIF has made the conscious choice to program country allocations in a collaborative way through partnerships instead of encouraging competition among development partners. Competition creates isolation and discourages collaboration and partnerships at the country-level. Through an inclusive process for programming resources at the country level, all partners agree not only on a common vision for the use of the resources, but also on what each partner can contribute to making the agreed vision a reality.
Building on the CSA nature of existing practicesIt is important to recognize the inherently climate-smart nature of many existing indigenous or traditional practices, and to support them by adding value to their produce and making them more competitive in existing and emerging markets (UNDP, 2013). Such recognition will discourage the dominant model of farmer support based on a top-down, ‘technology transfer’ approach. Such an approach excludes farmers from the development and dissemination of new technologies. It has led to low adoption of new technologies, which are often considered irrelevant by farmers because the technologies fail to take into account their social, economic and environmental circumstances. A participatory approach would therefore yield better results by building local ownership and sustainability for CSA in Africa. Adaptation policies should be location specific, considered throughout the agricultural value chain, and be coupled with new strategies that build both resilience and preparedness for long-term climatic variability and change.
Conclusions and RecommendationsOwing to the escalating manifestations of extreme climate events that have negative impacts on the wellbeing of agriculture-dependent populations and sustainable development in Africa, there is urgent and growing need to improve climate risk-management capabilities, especially among smallholder farmers. Consequently, mechanisms for mainstreaming weather and climate information and early warning messages into decision making need to be developed. Capacity development of farmers and other intermediaries along the agricultural information chain to recognize and appreciate weather and climate as essential resources for agricultural production, and enhance their abilities to incorporate weather and climate information and related
early warnings into farm-level decision-making should be a matter of urgent priority if smallholder farmers are to remain in agriculture.
It is essential to harness valuable indigenous knowledge resources for coping with climate-related disasters and integrate it with additional scientific and technical knowledge – and then promote it as a means of customizing the weather- and climate-based advisories. It is also increasingly critical to foster full understanding of the nature of weather and climate extremes, the research approaches required to better anticipate the impacts of such extremes, and the vulnerability of human and natural ecosystems.
Africa Agriculture Status Report 2014 | 107
Mainstreaming CSA into national agricultural development strategies and policies is important. Time and again, promising technical interventions in agriculture have failed to deliver the benefits they promise because the policy environment does not encourage farmers to take up these interventions, or institutions such as land or tree tenure mean that farmers would not reap the gains from their climate-smart labors. Inappropriate policies and weak institutions may result in farmers adopting practices that are unsustainable or actively degrade the environment (Hailu and Campbell. 2013).
Addressing CSA constraints and barriers should be supported by a strong political will at national level crystallized into strategies that can guide nationally-led action and provide a basis for mobilizing international support. National agriculture development plans with appropriate institutions at national to local levels, provision of infrastructure, access to information and training and stakeholder participation and, last but not least, improvement of tenure arrangements are necessary for long-term transformation towards sustainable intensification and management of resources.
There is need for further investment in tailored value-added climate services aimed at supporting smallholder farmers by building their resilience to the adverse effects of climate change and climate variability. Vulnerable farming communities and the livelihoods of the rural poor have to be protected and strengthened through enhanced disaster preparedness. Weather- and climate-based agro-advisory services should, therefore, be scaled up to reach many more smallholder farmers who are struggling with climate change-induced vagaries of weather in Africa.
A gender-sensitive approach to program design and implementation is crucial to ensuring that the needs of all community members are met. Practices and technologies that rest on gender equitable principles can foster both increased adaptive capacity and resilience to climate change. Women play a key role in agriculture and hence increasing their access to and use of CSA technologies and practices, weather and climate agro-advisory services, and climate change-related financing would enhance their empowerment in contributing to increased agricultural productivity and overall economic growth.

108 | Africa Agriculture Status Report 2014
ReferencesAdesina, A. A., & Chianu, J. (2002). Determinants of farmers’ adoption and adaptation of alley farming technology in Nigeria. Agroforestry Systems, 55(2), 99–112.
Adesina, A. A., Mbila, D., Nkamleu, G. B., & Endamana, D. (2000). Econometric analysis of the determinants of adoption of alley farming by farmers in the forest zone of southwest Cameroon.Agriculture, Ecosystems and Environment, 80(3), 255–265.
Adger, W. N., Dessai, S., Goulden, M., Hulme, M., Lorenzoni, I., Nelson, D. R., Wreford, A. (2009). Are there social limits to adaptation to climate change? Climatic Change, 93, 335-354.
Andersson, J. A., & D’Souza, S. (2013). From adoption claims to understanding farmers and contexts: A literature review of Conservation Agriculture (CA) adoption among smallholder farmers in southern Africa. Agriculture, Ecosystems and Environment, 187, 116-132.
Africa, S. 2013. Global Index Insurance Facility. Washington, DC, USA: IFC
African Smallholder Farmers Group. 2012. Parliamentary Investigation into the integration of smallholder farmers into supply chains, Submission 10 February 2012.
African Union. Policy Brief: Opportunities and challenges for climate-smart agriculture in Africa.
Copenhagen, Denmark: CGIAR Research Program on Climate Change, Agriculture and Food Security (CCAFS), pp. 8
Ajayi, O.C., Akinnifesi, F.K., Sileshi, G. and Chakeredza, S. 2007. Adoption of renewable soil fertility replenishment technologies in the southern African region: Lessons learnt and the way forward. Natural Resources Forum 31, 306-317.
Ajayi, O.C., Akinnifesi, F.K., Sileshi, G. and Kanjipite, W. 2009. Labour inputs and financial profitability of conventional and agroforestry-based soil fertility management practices in Zambia. Agrekon, 48, 276-293.
Ajayi, O.C., Franzel, S., Kuntashula, E. and Kwesiga, F. 2003. Adoption of improved fallow technology for soil fertility management in Zambia: Empirical studies and emerging issues. Agroforestry Systems 59, 317–326.
Akinnifesi, F.K., Ajayi, O.C., Sileshi, G., Chirwa, P.W., & Chianu, J. (2010) Fertilizer tree systems for sustainable food security in the maizebased production systems of east and southern Africa region: A review. Agronomy for Sustainable Development, 30(3), 615-629. doi:10.1051/agron/2009058
Arame, T. 2013. What do we mean by climate services? Bulletin of the World Meteorological Organization, 62(Special Issue), pp.1
Arame T. 2013. Climate services for farmers: Lessons from Africa and south Asia. 3rd International Conference on Climate Services, Dec. 4-6, 2013, Montego Bay, Jamaica.
Ayers, J. M. and Huq, S. 2009. Supporting adaptation to climate change: What role for official development assistance? Development Policy Review, 27, 675–692. DOI: 10.1111/j.1467-7679.2009.00465.x
Babatunde, S. O., Opawole, A., and Akinsiku, O. E. 2012. Critical success factors in public-private partnership (PPP) on infrastructure delivery in Nigeria. Journal of Facilities Management, 10(3), 212 - 225. doi:10.1108/14725961211246018.
Baiphethi, M. N., & Jacobs, P. T. (2009). The contribution of subsistence farming to food security in South Africa. Agrekon, 48(4), 459-482. doi:10.1080/03031853.2009.9523836 .
Berg, A., Quirion, P., and Sultan, B. 2009. Weather-Index Drought Insurance in Burkina-Faso: Assessment of its potential interest to farmers. Weather, Climate, and Society, 1(1), 71–84. doi:10.1175/2009WCAS1008.1
Beuchelt, T. D. and Badstue, L. (2013). Gender, nutrition-and climate-smart food production: Opportunities and trade-offs. Food Security 5, 709-721.
Biesbroek, G. R., Klostermann, J. E. M., Termeer, C. J. A. M., & Kabat, P. (2013). On the nature of barriers to climate change adaptation. Regional Environmental Change, 13(5), 1119–1129.
Bhavnani, K., Foran, J. and Kurian, P. 2003. Feminist futures: Reimagining women, culture and development. London, UK: Zed Books, pp.320
Billy, A., and Farm, T. 2011. Insurance and agricultural development : new dynamics in Algeria, Morocco and Tunisia. pp.6
Bokusheva, R., & Breustedt, G. 2012. The effectiveness of Weather-Based Index Insurance and Area-Yield Crop Insurance : How reliable are ex post predictions for yield risk reduction? Quarterly Journal of International Agriculture, 51(2), 135–156.
Branca, G., McCarthy, N. 2011. Climate-smart agriculture: A synthesis of empirical evidence of food security and mitigation benefits from improved cropland management. Working paper. Rome, FAO.
Branca, G., Tennigkeit, T. Mann, W. and Lipper, L. 2012. Identifying opportunities for climate-smart agriculture investments in Africa. Rome: FAO
Briggs, L., & Twomlow, S. J. (2002). Organic material flows within a smallholder highland farming system of South West Uganda. Agriculture, Ecosystems and Environment, 89(3), 191–212.
Bryan, E., Ringler, C., Okoba, B., Roncoli, C., Silvestri, S., & Herrero, M. (2013). Adapting agriculture to climate change in Kenya: Household strategies and determinants. Journal of Environmental Management, 114, 26–35.

Africa Agriculture Status Report 2014 | 109
Bunce, M., Rosendo, S., and Brown, K. 2010. Perceptions of climate change, multiple stressors and livelihoods on marginal African coasts. Environment, Development and Sustainability, 12(3), 407–440.
Burney, J.A. Davis S. J, and Lobella, D.B. (2010) Greenhouse gas mitigation by agricultural intensification. Proceedings of the National Academy of Sciences, 107(26), 12057-12057. doi: 10.1073/pnas.0914216107
Cacho, O.J., Marshall, R.G. and Milne, M. 2003. Smallholder agroforestry projects: Potential for carbon sequestration and poverty alleviation. ESA working paper no. 03-06. Rome: FAO.
Campos, M., McCall, M. K., & González-Puente, M. (2014). Land-users’ perceptions and adaptations to climate change in Mexico and Spain: Commonalities across cultural and geographical contexts. Regional Environmental Change, 14(2), 811–823.
CARE. 2010. Adaptation, gender and women’s empowerment. CARE International Climate Change Brief. Available online at: http://www.careclimatechange.org/files/adaptation/CARE_Gender_Brief_Oct2010.pdf
Climate Change, Agriculture and Food Security. 2013. CCAFS Village Baseline Study 2010-11, http://hdl.handle.net/1902.1/CCAFS-VLS-2010-11 Statistical Services Centre [Distributor] V9 [Version], Copenhagen, Denmark: CCAFS.
Climate Change, Agriculture and Food Security. 2013. CCAFS Household Baseline Survey 2010-12, http://hdl.handle.net/1902.1/BHS-20102011 UNF:5:OhyaVN1n8lHPA5BOgyF+sw== Cathy Garlick [Distributor] V17 [Version] Copenhagen, Denmark: CCAFS
Changnon, S. A. 2010. Geographical distribution of weather catastrophes in the United States. Physical Geography 31(1), 29-39. doi:10.2747/0272-3646.31.1.29
Changnon, S. A. 2011. Temporal distribution of weather catastrophes in the USA. Climatic Change, 106(2), 129–140.
Chantarat, S., and Mude, A. 2009. The performance of index based livestock insurance: ex ante assessment in the presence of a poverty trap. Available at: http://papers.ssrn.com/sol3/papers.cfm?abstract_id=1844751
Chantarat, S., Mude, A. G., Barrett, C. B., & Carter, M. R. 2013. Designing index-based livestock insurance for managing asset risk in northern Kenya. Journal of Risk and Insurance, 80(1), 205–237.
Chen, D., Jackson, T. J., Li, F., Cosh, M. H., Walthall, C., and Anderson, M. 2003. Estimation of vegetation water content for corn and soybeans with a Normalized Difference Water Index (NDWI) using landsat thematic mapper data. IGARSS 2003. 2003 IEEE International Geoscience and Remote Sensing Symposium. Proceedings (IEEE Cat. No.03CH37477), 4. doi:10.1109/IGARSS.2003.1294609
Christian Aid. Healthy harvests: the benefits of sustainable agriculture in Africa and Asia, a Christian Aid report, September 2011.
Collins, J. M. 2011. Temperature variability over Africa. Journal of Climate, 24(14), 3649–3666. doi:10.1175/2011JCLI3753.1
Commission on Sustainable Agriculture and Climate Change.2011. Achieving food security in the face of climate change, summary for policy makers from the Commission on Sustainable Agriculture and Climate Change, November 2011. http://ccafs.cgiar.org/commission/reports#.U-NAWWMY6wh
Cooper, P.J.M, Cappiello, S., Vermeulen, S.J., Campbell, B.M., Zougmoré, R., Kinyangi, J., (2013). Copenhagen. Large-scale implementation of adaptation and mitigation actions in agriculture, Working Paper No. 50. A publication of the CGIAR Research Program on Climate Change, Agriculture and Food Security (CCAFS), available from http://tinyurl.com/nn9lzfr.
Crane, T. A., Roncoli, C., & Hoogenboom, G. (2011). Adaptation to climate change and climate variability: The importance of understanding agriculture as performance. NJAS - Wageningen Journal of Life Sciences, 57(3-4), 179–185.
Daniel, E., Myers, A., & Dixon, K. (2012). Adoption rationales of new management practices. Journal of Business Research, 65(3), 371–380.
Daron, J. D. and Stainforth, D. A. 2014. Assessing pricing assumptions for weather index insurance in a changing climate. Climate Risk Management 1, 76–91. doi:10.1016/j.crm.2014.01.001
De Nicola, F. 2012. The impact of weather insurance on consumption, investment and welfare. Washington, DC., USA: IFPRI, p. 46. doi:10.2139/ssrn.2172422
De Pinto, A., Robertson, R. D., & Obiri, B. D. (2013). Adoption of climate change mitigation practices by risk-averse farmers in the Ashanti Region, Ghana. Ecological Economics, 86, 47–54.
Deere, C. D., G. E. Alvarado, and J. Twyman. 2012. “Gender Inequality in Asset Ownership in Latin America: Female Owners versus Household Heads.” Development and Change 43 (2): 505-530.
Deressa, T. T., Hassan, R. M., Ringler, C., Alemu, T., & Yesuf, M. (2009). Determinants of farmers’ choice of adaptation methods to climate change in the Nile Basin of Ethiopia. Global Environmental Change, 19(2), 248–255.
Donna, L. 2011. Agriculture and climate change policy brief: Main issues for the UNFCCC and beyond. In Campbell, B., Mann, W., Meléndez-Ortiz, R., Streck, C., Tennigkeit, T. and Vermeulen, S. Agriculture and climate change: A scoping report. Meridian Institute. Available at www.climate-agriculture.org
Eckhardt, N.A., Cominelli, E., Galbiati, M. and Tonelli, C. 2009. The future of science: food and water for life. Plant Cell 21, 368-372.
El-Fattal, L. 2012. Climate-smart agriculture is ‘smarter’ when informed by a gender perspective. WOCAN Policy Brief. Women Organizing for Change in Agriculture & Natural Resource Management, Bangkok, Thailand.

110 | Africa Agriculture Status Report 2014
Evenson, R. E. 1999. Global and local implications of biotechnology and climate change for future food supplies. Proceedings of the National Academy of Sciences 96(11), 5921–5928.
FAOSTAT (2014). FAOSTAT emissions database, Rome, Italy: FAO. http://faostat3.fao.org/faostat-gateway/go/to/browse/G1/*/E
Food, Agriculture and Natural Resources Policy Analysis (FANRPAN). 2014. Declaration of the first Africa Congress on Conservation Agriculture, Lusaka, Zambia, 18th to 21st March 2014. Pretoria, South Africa: FANRPAN. Available at: http://www.fanrpan.org/documents/d01679/.
Food Agriculture and Natural Resources Policy Analysis Network Regional Secretariat. 2012. Engaging youth in climate-smart agriculture, Policy Brief Series, XII(1). http://www.fanrpan.org/documents/d01418/engaging_youth_in_csa_20121018.pdf
Food and Agriculture Organization 2013. Climate-smart agriculture sourcebook. Copenhagen, Denmark: FAO, pp. 570. Available online at: http://www.fao.org/docrep/018/i3325e/i3325e.pdf
Food and Agriculture Organization. 2014. Regional conference for Africa, state of food and agriculture in the Africa region and CAADP. Implementation with specific focus on smallholder farmers and family farming, twenty-eighth session, Tunis, Tunisia, 24-28 March 2014
Food and Agriculture Organization (FAO). 2013. 50 Years - 50 Ans - 50 Años. FAO Quarterly Journal on Animal Health, Production and Products. Rome, Italy: FAO http://www.fao.org/docrep/v8180t/v8180T00.htm#Contents
Food and Agriculture Organization (FAO). 2011. Save and Grow. A policymaker’s guide to the sustainable intensification of smallholder crop production. Rome: FAO. pp. 103.
Find Your Feet. 2012. Recognizing the unrecognized: Farmer innovation in northern Malawi. London, UK: Find Your Feet. Report available at http://www.asfg.org.uk/Farmer%20Innovation%20Study%20-%20FINAL.pdf
Förch, W., Sijmons, K., Mutie, I., Kiplimo, J., Cramer, L., Kristjanson, P., Thornton, P., Radeny, M., Moussa, A. and Bhatta, G. 2013. Core sites in the CCAFS regions: East Africa, west Africa and south Asia, Version 3. Copenhagen, Denmark: CGIAR Research Program on Climate Change, Agriculture and Food Security (CCAFS). Available online at: www.ccafs.cgiar.org
Franzel, S. 1999. Socio-economic factors affecting the adoption of improved tree fallows in Africa. Agroforestry Systems 47, 305-329.
Franzel, S. and Scherr, S.J. 2002. Introduction. In: Franzel, S. and Scherr, S.J. (eds). Trees on the farm: Assessing the adoption potential of agroforestry practices in Africa. Wallingford, UK: CABI.
Franzel, S., G.L. Denning, Lillesø-Barnekow, J-P. and Mercado, A.R. 2004. Scaling up the impact of agroforestry: Lessons from three sites in Africa and Asia, World Agroforestry Centre, Kenya and the Philippines. Agroforestry Systems, 61-62: 329-344
Garrity, D., Akinnifesi F., Ajayi, O., Sileshi G. W., Mowo, J.G., Kalinganire, A., Larwanou, M and Bayala, J. 2010. Evergreen Agriculture: a robust approach to sustainable food security in Africa. Food Security. 2(3): 197-214.
Gerber, P.J., Steinfeld, H., Henderson, B., Mottet, A., Opio, C., Dijkman, J., Falcucci, A. & Tempio, G. 2013. Tackling climate change through livestock – A global assessment of emissions and mitigation opportunities. Rome, Italy: Food and Agriculture Organization of the United Nations.
Gifford, R. (2011). The dragons of inaction: Psychological barriers that limit climate change mitigation and adaptation. American Psychologist, 66(4), 290-302. doi:10.1037/a0023566
Greiner, R., & Gregg, D. (2011). Farmers’ intrinsic motivations, barriers to the adoption of conservation practices and effectiveness of policy instruments: Empirical evidence from northern Australia. Land Use Policy, 28(1), 257–265.
Greiner, R., Patterson, L., & Miller, O. (2009). Motivations, risk perceptions and adoption of conservation practices by farmers. Agricultural Systems, 99(2-3), 86–104.
Gonen, A., and Zeitouni, N. 2010. Risk management of water resources in a changing climate. In Nota, G.(Ed.) Advances in risk management. InTech. Retrieved from http://www.intechopen.com/books/show/title/advances-in-risk-management
Goudou, D., Gué/Traoré, J., Ouédraogo, M., Segda, Z., Badiane Ndour, N.Y., Sall, M., Gueye, F.,
Guarantee, P., and Faso, B. 2011. IFC advisory services access to finance index-based insurance in francophone west Africa.
Hansen, J. W. 2007. Innovations in climate risk management: protecting and building rural livelihoods in a variable and changing climate. Semi-Arid Tropical Agricultural Research, 4(1), 1–38.
Harrison, G. W., Lau, M. I., Rutström, E. E., & Tarazona-Gómez, M. (2013). Preferences over social risk. Oxford Economic Papers, 65(1), 25–46.
Harvey, C. A., Chacón, M., Donatti, C. I., Garen, E., Hannah, L., Andrade, A., … Wollenberg, E. (2014). Climate-Smart Landscapes: Opportunities and Challenges for Integrating Adaptation and Mitigation in Tropical Agriculture. Conservation Letters, 7(2), 77–90.
Hill, R. V., and Viceisza, A. 2012. A field experiment on the impact of weather shocks and insurance on risky investment. Experimental Economics, 15(2), 341–371.
Howden, S.M., Soussana, J., Tubiello, F.N., Chhetri, N., Dunlop, M. and Meinke, H. 2007. Adapt ing agriculture to climate change. Proceedings of the National Academy of Sciences 104: 19691-19696.
Africa Agriculture Status Report 2014 | 111
Huxtable, J., & Yen, N. T. (2009). Mainstreaming Climate Change Adaptation: A Practioner’s Handbook. Secretary, 60–60. Retrieved from http://www.careclimatechange.org/files/adaptation/CARE_VN_Mainstreaming_Handbook.pdf
IFC. 2012. More Than Just Hot Air: Carbon market access and climate-smart agriculture for smallholder farmers, Smart lessons.
INSTRAW. 2004. Glossary of gender-related terms and concepts. Washington, DC, USA: United Nations International Research & Training Institute for the Advancement of Women.
Intergovernmental Panel on Climate Change, 2014. Climate change 2014: Impacts, adaptation, and vulnerability. Working Group II Contribution to the IPCC 5th Assessment Report. IPCC.
International Food Policy Research Institute (IFPRI). 2009. Climate change Impact on agriculture and costs of adaptation. Washington, DC, USA: IFPRI
International Organization for Standardization. 2009. ISO 31000:2009 Risk management - Principles and guidelines. Risk Management, 2009, 24. ISO. Retrieved from https://bsol-bsigroup-com.libezproxy.open.ac.uk/en/Bsol-Item-Detail-Page/?pid=000000000030202344
Intergovernmental Panel on Climate Change (IPCC). (2014) Working Group III-Mitigation of climate change. Chapter11: Agriculture, Forestry and Other Land Use (AFOLU). Geneva, Switzerland :IPCC, pp.181. Available online at: http://report.mitigation2014.org/drafts/final-draft-postplenary/ipcc_wg3_ar5_final-draft_postplenary_chapter11.pdf
Intergovernmental Panel on Climate Change (IPCC). Climate change 2007: Synthesis report, an assessment of the IPCC. IPCC Plenary XXVII, Valencia, Spain, 12-17 November 2007.
Intergovernmental Panel on Climate Change (IPCC). 2007. Agriculture in climate change. Mitigation. Working Group III Contribution
Ismail, S. 2013. Critical success factors of Public Private Partnership (PPP) implementation in Malaysia. Asia-Pacific Journal of Business Administration, 5(1), 6–19. doi:10.1108/17574321311304503
Jayne, T. S., Mather, D., and Mghenyi, E. 2010. Principal challenges confronting smallholder agriculture in sub-Saharan Africa. World Development, 38(10), 1384–1398.
Jin, X.-H., Zhang, G., and Yang, R. J. 2012. Factor analysis of partners’ commitment to risk management in public-private partnership projects. Construction Innovation: Information, Process, Management, 12(3), 297–316. doi:10.1108/14714171211244550
Jones, P. C., Kegler, G., Lowe, T. J., and Traub, R. D. 2003. Managing the seed-corn supply chain at Syngenta. Interfaces, 33(1), 311-322. doi:10.1287/inte.33.1.80.12718
Kalungu, J.W., Filho, W.L., and Harris, D. 2013. Smallholder farmers’ perception of the impacts of climate change and variability on rain-fed agricultural practices in semi-arid and sub-humid regions of Kenya. Journal of Environment and Earth Science, 3(7), 129-140
Kaijser, A. and Kronsell, A. 2014. Climate change through the lens of intersectionality, Environmental Politics, 23(3), 417-433, DOI: 10.1080/09644016.2013.835203
Kamble, B., Irmak, A., and Hubbard, K. 2013. Estimating crop coefficients using remote sensing-based vegetation index. Remote Sensing, 5, 1588–1602. doi:10.3390/rs5041588
Khumairoh, U., Groot, J. C. J., and Lantinga, E. A. 2012. Complex agro-ecosystems for food security in a changing climate. Ecology and Evolution, 2(7), 1696–1704.
Kiptot E. and Franzel S. 2011. Gender and agroforestry in Africa: are women participating?
ICRAF Occasional Paper No. 13. Nairobi: World Agroforestry Centre, pp.72
Klopper, E., Vogel, C. H., & Landman, W. A. (2006). Seasonal climate forecasts - Potential agricultural-risk management tools? Climatic Change, 76(1-2), 73–90.
Knowler, D., & Bradshaw, B. (2007). Farmers’ adoption of conservation agriculture: A review and synthesis of recent research. Food Policy, 32(1), 25–48.
Kristjanson, P., Neufeldt, H., Gassner, A., Mango, J., Kyazze, F. B., Desta, S., … Coe, R. (2012). Are food insecure smallholder households making changes in their farming practices? Evidence from East Africa. Food Security, 4(3), 381–397.
Kurukulasuriya, P. and Rosenthal, S. 2003. Climate change and agriculture: A review of impacts and adaptations. Climate change series, Paper No. 91. Published jointly with the Agriculture and Rural Development Department. p. 96.
Kyazze, F.B., Kristjanson P. 2011. Summary of baseline household survey results: Rakai district, south central Uganda. Copenhagen, Denmark: CGIAR Research Program on Climate Change, Agriculture and Food Security (CCAFS). Available online at: http://ccafs.cgiar.org/resources/baseline-surveys
Labeyrie, V., Rono, B., & Leclerc, C. (2013). How social organization shapes crop diversity: an ecological anthropology approach among Tharaka farmers of Mount Kenya. Agriculture and Human Values, 31, 97-107.
Lal, R. 2013. Food security in a changing climate. Ecohydrology & Hydrobiology, 13(1), 8–21. doi:10.1016/j.ecohyd.2013.03.006
Lalonde, C., and Boiral, O. 2012. Managing risks through ISO 31000: A critical analysis. Risk Management (14603799), 14(4), 272. doi:10.1057/rm.2012.9

112 | Africa Agriculture Status Report 2014
Lasker, R. D., and Weiss, E. S. 2003. Creating partnership synergy: the critical role of community stakeholders. Journal of Health and Human Services Administration, 26(1), 119–139.
Leblois, A., Quirion, P., Alhassane, A., & Traore, S. 2014. Weather index drought isurance: An ex ante evaluation for millet growers in Niger. Environmental and Resource Economics, 57(4), 527–551.
Leitch, M. 2010. ISO 31000:2009--the new international standard on risk management. Risk Analysis, 30(6), 887–892. doi:10.1111/j.1539-6924.2010.01397.
Li, B., Akintoye, A., and Hardcastle, C. 2001. Risk analysis and allocation in Public Private Partnership projects. In 17th Annual ARCOM Conference (Vol. 1, pp. 895–904). Manchester, UK: University of Salford.
Liniger, H., Critchley, W., Gurtner, M., Schwilch, G., and Mekdaschi Studer, R. 2007. Where the land is greener – case studies and analysis of soil and water conservation initiatives worldwide. https://www.wocat.net/en/methods.html
Liniger, H.P., Mekdaschi Studer, R. Hauert, C. and Gurtner, M. 2011. Sustainable land management in practice– guidelines and best practices for sub-saharan Africa. TerrAfrica, World Overview of Conservation Approaches and Technologies (WOCAT) and Food and Agriculture Organization of the United Nations.
Lipper, L., Mann, W., Meybeck, A., and Sessa, R. 2010. “Climate-smart” agriculture policies, practices and financing for food security, adaptation and mitigation. Hague Conference on Agriculture, Food Security and Climate Change, 31 October - 5 November 2010, 48. doi:10.1111/j.1467-6346.2009.02662.
Lybbert, T. J., & Sumner, D. A. (2012). Agricultural technologies for climate change in developing countries: Policy options for innovation and technology diffusion. Food Policy, 37(1), 114–123.
Mahul, O. and Stutley, C. 2010. Government support to agricultural insurance - challenges and options for developing countries. Washington, DC.: World Bank.
Mango, J., Mideva, A., Osanya, W. and Odhiambo, A. 2011. Summary of baseline household survey results: Lower Nyando, Kenya. Copenhagen, Denmark: CGIAR Research Program on Climate Change, Agriculture and Food Security (CCAFS).. Available online at: www.ccafs.cgiar.org.
Mariano, M. J., Villano, R., & Fleming, E. (2012). Factors influencing farmers’ adoption of modern rice technologies and good management practices in the Philippines. Agricultural Systems, 110, 41–53.
Matul, M., Mccord, M. J., Phily, C., Harms, J., Chamberlain, D., Cohen, M., and No, W. P. 2010. The landscape of microinsurance in Africa. Germany: Munich Re Foundation
McCarthy N, Lipper L, Branca, G. 2011. Climate smart agriculture: Smallholder adoption and implications for climate change adaptation and mitigation. Mitigation of Climate Change in Agriculture Working Paper No 3. Rome, Italy: FAO,. Available online at http://www.fao.org/docrep/015/i2575e/i2575e00.pdf
McKechnie, A. E., and Wolf, B. O. (2010). Climate change increases the likelihood of catastrophic avian mortality events during extreme heat waves. Biology Letters, 6(2), 253–256.
McNeely, J. A., & Schroth, G. (2006). Agroforestry and biodiversity conservation - Traditional practices, present dynamics, and lessons for the future. Biodiversity and Conservation, 15, 549-554
McOmber, C., Paniskowski, A. McKune, S. Bartels, W. and Russo, S. 2012. Investigating climate information services through a gendered lens. CGIAR Research Program on Climate Change, Agriculture and Food Security (CCAFS) Working Paper No. 42. Copenhagen, Denmark: CCAFS
Mercer, D.E. 2004. Adoption of agroforestry innovations in the tropics: A review. Agroforestry Systems, 61: 311-328.
Mills, E. 2009. A global review of insurance industry responses to climate change. Geneva Papers on Risk and Insurance Issues and Practice, 34(3), 323–359. doi:10.1057/gpp.2009.14
Miranda, M. J., and Farrin, K. 2012. Index insurance for developing countries. Applied Economic Perspectives and Policy, 34(3), 391–427.
Moreau, T. L., Moore, J., & Mullinix, K. (2012). Planning for climate action in British Columbia, Canada: Putting agricultural greenhouse gas mitigation on local government agendas. Journal of Agriculture, Food Systems, and Community Development, 2(2), 247–259. doi.org/10.5304/jafscd.2012.022.008
Mortimore, M.J., and Adams, W.M. 2001. Farmer adaptation, change and ‘crisis’ in the sahel. Global Environmental Change, 11, 49-57.
Morton, J. F. 2007. The impact of climate change on smallholder and subsistence agriculture. Proceedings of the National Academy of Sciences, 104(50), 19680–19685.
Morton, J.F. 2007. The impact of climate change on smallholder and subsistence agriculture. Proceedings of the National Academy of Sciences, 104, 19680-19685.
Moser, S. C., & Ekstrom, J. A. (2010). A framework to diagnose barriers to climate change adaptation. Proceedings of the National Academy of Sciences, 107(51), 22026–22031.
Mugwe, J., Mugendi, D., Mucheru-Muna, M., Merckx, R., Chianu, J., & Vanlauwe, B. (2009). Determinants of the decision to adopt integrated soil fertility management practices by smallholder farmers in the central highlands of Kenya. Experimental Agriculture, 45(1), 61-75. doi:10.1017/S0014479708007072

Africa Agriculture Status Report 2014 | 113
Muzari, W., Gatsi, W., & Muvhunzi, S. (2012). The Impacts of Technology Adoption on Smallholder Agricultural Productivity in Sub-Saharan Africa: A Review. Journal of Sustainable Development, 5(8), 69. doi:10.5539/jsd.v5n8p69
Muller, B. 2012. Index based crop insurance in Senegal and West Africa: Some concerns based on on-going experiments, 1-3. CIRAD, Agricultural Research for Development
Müller, C. 2013. African lessons on climate change risks for agriculture. Annual Review of Nutrition, 33, 395–411. doi:10.1146/annurev-nutr-071812-161121
Müller, C., Cramer, W., Hare, W. L., and Lotze-Campen, H. 2011. Climate change risks for African agriculture. Proceedings of the National Academy of Sciences, 108(11), 4313–4315.
Mwangangi, M., Mutie, M., Mango, J. 2012. Summary of baseline household survey results: Makueni, Kenya. Copenhagen, Denmark: CGIAR Research Program on Climate Change, Agriculture and Food Security (CCAFS). Available online at: www.ccafs.cgiar.org.
Nair, R. 2010. Weather-based crop insurance in India: Towards a sustainable crop insurance regime? Economic and Political Weekly, XLV(34), 73–81.
Nakhooda, S., Caravani, A., Bird, N. and Schalatek, L. 2011. Climate finance in sub-Saharan Africa. Climate Finance Policy Brief. Washington, DC: Heinrich Böll Foundation North American.
Nash, J. 2008. Re-thinking Intersectionality. Feminist Review, 89, 1-15.
Ndiaye, O., Abdoulaye, M., Mousa, S., Zougmoré, R. and Hansen, J. 2013. Communicating seasonal forecasts to farmers in Kaffrine, Senegal for better agricultural management. Case study prepared for Hunger, Nutrition, Climate Justice. Dublin, Ireland: Irish Aid. p.4
Neufeldt et al. 2013. Beyond climate-smart agriculture: toward safe operating spaces for global food systems. Agriculture & Food Security 2013 2:12.
Ngigi, S.N. 2003. Rainwater harvesting for improved food security: Promising technologies in the greater horn of Africa. Nairobi, Kenya: Greater Horn of Africa Rainwater Partnership (GHARP), Kenya Rainwater Association (KRA),
Nielsen, J. O., & Reenberg, A. (2010). Cultural barriers to climate change adaptation: A case study from Northern Burkina Faso. Global Environmental Change-Human and Policy Dimensions, 20(1), 142-152. doi:10.1016/j.gloenvcha.2009.10.002
Nisar, T. M. 2007. Risk management in public-private partnership contracts. Public Organization Review, 7(1), 1–19.
Noordwijk, M. Van, Hoang, M., & Neufeldt, H., Oborn, I., Yatich, T. (Eds.). (2011). How trees and people can co-adapt to climate change: reducing vulnerability through multifunctional agroforestry landscapes. Nairobi: World Agroforestry Centre (ICRAF), pp. 134
Organisation for Economic Co operation and Development (OECD). 2005. Paris declaration on aid effectiveness. Paris, France: OECD. http://www.oecd.org/development/effectiveness/34428351.pdf
Olson, D. L., and Wu, D. 2010. Enterprise risk management. Risk Management, 12, 1–13. doi:10.1007/978-3-642-11474-8
Onyango L, Mango J, Kurui Z, Wamubeyi B, Orlale R, Ouko E. 2012. Village baseline study: Site analysis report for Nyando – Katuk Odeyo, Kenya. Copenhagen, Denmark: CGIAR Research Program on Climate Change, Agriculture and Food Security (CCAFS).
Onyango, L., Mango, J., Zziwa, A., Kurui, Z., Wamubeyi, B., Sseremba, O., and Asiimwe, J. 2012. Village Baseline Study – Site Analysis Report for Kagera Basin – Rakai, Uganda (UG0204). CGIAR Research Program on Climate Change, Agriculture and Food Security (CCAFS), Copenhagen, Denmark. Available online at: www.ccafs.cgiar.org
Palm, C., Blanco-Canqui, H., DeClerck, F., Gatere, L., and Grace, P. 2013. Conservation agriculture and ecosystem services: An overview. Agriculture, Ecosystems and Environment, 187(1), 87-105
Sandmark, T., Debar, J., and Tatin-Jaleran, C. 2013. The emergence and development of agriculture microinsurance. A discussion paper. Luxembourg, Germany: Microinsurance Network, pp. 80.
Patt, A., Peterson, N., Carter, M., Velez, M., Hess, U., and Suarez, P. 2009. Making index insurance attractive to farmers. Mitigation and Adaptation Strategies for Global Change, 14(8), 737–753.
Pattberg, P. 2010. Public-private partnerships in global climate governance. Wiley Interdisciplinary Reviews: Climate Change, 1(2), 279–287.
Perret, S. R., & Stevens, J. B. (2006). Socio-economic reasons for the low adoption of water conservation technologies by smallholder farmers in southern Africa: a review of the literature. Development Southern Africa, 23(4), 461-476. doi:10.1080/03768350600927193
Phelan, L. 2011. Managing climate risk: extreme weather events and the future of insurance in a climate-changed world. Australasian Journal of Environmental Management, 18(4), 223-232. doi:10.1080/14486563.2011.611486
Phiri, D., S. Franzel S., Mafongoya, P., Jere, I., Katanga, R., and Phiri, S. 2004. Who is using the new technology? A case study of the association of wealth status and gender with the planting of improved tree fallows in Eastern Province, Zambia. Agricultural Systems, 79: 131–144.
114 | Africa Agriculture Status Report 2014
Phiri, I.M.G. and Saka, A.R. 2008. The impact of changing environmental conditions on vulnerable communities in the Shire Valley, Southern Malawi. In: Lee, C. and Schaaf, T. (eds.), The future of drylands. Paris, France: United Nations Educational, Scientific and Cultural Organization (UNESCO), 545-559.
Place, F., and Dewees, P. 1999. Policies and incentives for the adoption of improved fallows. Agroforestry Systems, 47, 323-343.
Place, F., Kariuki, G., Wangila, J., Kristjanson, P., Makauki A. and Ndubi. J. 2004. Assessing the factors underlying differences in achievements of farmer groups: methodological issues and empirical findings from the highlands of central Kenya. Agricultural Systems, 82: 257–272.
Poulton, C., and Macartney, J. 2012. Can Public-Private Partnerships leverage private investment in agricultural value chains in Africa? A preliminary review. World Development, 40(1), 96–109.
Power, A. G. 2010. Ecosystem services and agriculture: tradeoffs and synergies. Philosophical Transactions of the Royal Society of London. Series B, Biological Sciences, 365(1554), 2959–2971.
Rao, K. N. 2010. Index based crop insurance. Agriculture and Agricultural Science Procedia 1, 193–203
Ray-Bennett, N.S. 2009. Multiple disasters and policy responses in pre- and post-independence Orissa, India. Disasters 33(2):274–290.
Razali, S. M., and Nuruddin, A. A. 2011. Assessment of water content using remote sensing Normalized Difference Water Index: Preliminary study. Proceeding of the 2011 IEEE International Conference on Space Science and Communication (IconSpace), 265–268. doi:10.1109/IConSpace.2011.6015897
Reidsma, P., and Ewert, F. 2008. Regional farm diversity can reduce vulnerability of food production to climate change. Ecology and Society 13(1), art.38.
Rojas, O., Vrieling, A., and Rembold, F. 2011. Assessing drought probability for agricultural areas in Africa with coarse resolution remote sensing imagery. Remote Sensing of Environment, 115(2), 343–352.
Rosenzweig, C., Strzepek, K. M., Major, D. C., Iglesias, A., Yates, D. N., McCluskey, A., and Hillel, D. 2004. Water resources for agriculture in a changing climate: International case studies. Global Environmental Change, 14(4), 345–360.
Roth, J., Mccord, M. J., Liber, D., and Mccord, C. M. J. 2007. The landscape of microinsurance in the world ’s 100 poorest countries. Appleton, USA: MicroInsurance Centre, pp.97
Rott, H. 2009. Advances in Interferometric Synthetic Aperture Radar (InSAR) in earth system science. Progress in Physical Geography, 33(6), 769–791. doi:10.1177/0309133309350263
Economic Commission for Africa. 2012. Climate change the rural economy in southern Africa: Issues, challenges and opportunities, Issues Paper, UNECA-South Africa, pp73.
Salami, A., Kamara, A. B., & Brixiova, Z. (2010). Smallholder Agriculture in East Africa: Trends, Constraints and Opportunities. Working Paper No.105. TUNIS belvédère, Tunisia : African Development Bank Group, pp.52
Sandmark, T., Debar, J., & Tatin-Jaleran, C. (2013). The emergence and development of agriculture microinsurance. A discussion paper. Luxembourg, Germany: Microinsurance Network, pp.80
Scherr, S.J. and Sthapit, S. 2009. Sustainable land management in Africa: Opportunities for increasing agricultural productivity and greenhouse gas mitigation. TerrAfrica Climate Brief No. 2
Schlenker, W., and Lobell, D. B. 2010. Robust negative impacts of climate change on African agriculture. Environmental Research Letters, 5(1) doi:10.1088/1748-9326/5/1/014010
Schmidhuber, J. and Tubiello, F.N. 2007. Global food security under climate change. Proceedings of the National Academy of Sciences 104(50), 19703-19708.
Schneider, U. A, and Kumar, P. (2008) Greenhouse gas mitigation through agriculture. Choices, 23(1), 19-23. http://www.choicesmagazine.org/2008-1/theme/2008-1-06.htm.
Shames, S., Friedman, R. and Havemann, T. 2012. Coordinating finance for climate –smart-agriculture. Eco Agriculture Discussion Paper number 9
Silvestri, S., Rufino, M., Quiros, C. F., Douxchamps, S., Teufel, N., Singh, D., Mutie, I., Ndiwa, N., Ndungu, A., Kiplimo, J., Van Wijk, M. and Herrero, M., 2014. Impact Lite Dataset. http://dx.doi.org/10.7910/DVN/24751 International Livestock Research Institute; World Agroforestry Centre [Distributor] V2 [Version]
Sirrine, D., Shennan, C., and Sirrine, J. R. 2010. Comparing agroforestry systems’ ex ante adoption potential and ex post adoption: On-farm participatory research from southern Malawi. Agroforestry Systems, 79(2), 253–266.
Skees, J. R. 2008. Innovations in index insurance for the poor in lower income countries. Agricultural and Resource Economics Review, 37, 1–15. doi:http://www.narea.org/journal.htm
Slovic, P., Finucane, M. L., Peters, E., and MacGregor, D. G. 2004. Risk as analysis and risk as feelings: Some thoughts about affect, reason, risk, and rationality. Risk analysis, 24(2), 311-322.
Smith, L. C. 2002. Emerging Applications of Interferometric Synthetic Aperture Radar (InSAR) in geomorphology and hydrology. Annals of the Association of American Geographers, 9(3), 385-389. doi:10.1111/1467-8306.00295
Africa Agriculture Status Report 2014 | 115
Steffen, W., Sims, J., Walcott, J., and Laughlin, G. 2011. Australian agriculture: Coping with dangerous climate change. Regional Environmental Change, 11(Suppl. 1), 205–214.
Steinfeld, H., Gerber, P., Wassenaar, T., Castel, V., Rosales, M. & de Haan, C. (2006). Livestock`s Long Shadow Environmental Issues and Options. Rome, Italy: Food and Agriculture Organization, pp.26
Stewart, G. T., Kolluru, R., and Smith, M. 2009. Leveraging public-private partnerships to improve community resilience in times of disaster. International Journal of Physical Distribution & Logistics Management, 39(5), 343-364. doi:10.1108/09600030910973724
Susan Moran, M., Hymer, D. C., Qi, J., and Sano, E. E. 2000. Soil moisture evaluation using multi-temporal Synthetic Aperture Radar (SAR) in semiarid rangeland. Agricultural and Forest Meteorology 105(2000), 69–80).
Swinton, S. M., Lupi, F., Robertson, G. P. and Landis, D. A. 2006. Ecosystem services from agriculture: Looking beyond the usual suspects. American Journal of Agricultural Economics, 88(5), 1160–1166.
Tambo, J. A., & Abdoulaye, T. (2013). Smallholder farmers’ perceptions of and adaptations to climate change in the Nigerian savanna. Regional Environmental Change, 13(2), 375–388.
Tangermann, S. 2011. Risk management in agriculture and the future of the EU ’ s common agricultural policy risk management in agriculture and the future of the EU’s. International Centre Trade and Sustainable Development (ICTSD) Issue Paper No. 34. Geneva, Switzerland: ICTSD, pp.40
The Montpellier Panel. 2012. Growth with resilience: Opportunities in African agriculture. London, UK: Agriculture for Impact.
Thierfelder, C. and Wall, P. C., 2009. Effects of conservation agriculture techniques on infiltration and soil water content in Zambia and Zimbabwe. Soil and Tillage Research 105, 217–227.
Thornton, P. 2006. Ex ante impact assessment and seasonal climate forecasts: Status and issues. Climate Research, 33(1), 55-65. doi:10.3354/cr033055
Thornton, P. K., Jones, P. G., Ericksen, P. J., and Challinor, A. J. 2011. Agriculture and food systems in sub-Saharan Africa in a 4°C+ world. Philosophical Transactions. Series A, Mathematical, Physical, and Engineering Sciences, 369(1934), 117–136. doi:10.1098/rsta.2010.0246
Tompkins, E. L., and Eakin, H. 2012. Managing private and public adaptation to climate change. Global Environmental Change, 22(1), 3–11.
Tubiello, F.N., Salvatore, M., Condor Golec, R.D., Ferrara, A., Rossi, S., Biancalani, R., Federici, S., Jacobs, H., & Flammini, A. (2014). Agriculture, forestry and other land use emissions by sources and removals by sinks. 1990-2011 analysis. FAO Statistics Division Working Paper Series ESS/14-02. Rome, Italy: FAO.
Turral, H., Burke, J. and Faurès, J.M. 2011. Climate change, water and food security. FAO Water Report No. 36.Rome, FAO. Available at http://www.unwater.org/downloads/unw_ccpol_web.pdf
United Nations Development Program (UNDP). Climate smart agriculture in Africa, e-discussion summary report, 20th February – 4th March 2013. Available at http://www.ipc-undp.org/pressroom/files/ipc819.pdf
Vanlauwe, B., Wendt, J., Giller, K. E., Corbeels, M., Gerard, B., & Nolte, C. (2014). A fourth principle is required to define Conservation Agriculture in sub-Saharan Africa: The appropriate use of fertilizer to enhance crop productivity. Field Crops Research, 155, 10–13.
Verchot, L.V., Van Noordwijk, M., Kandji, S., Tomich, T., Ong, C., Albrecht, A., Mackensen, J., Bantilan, C. Anupama, K.V. and Palm, C. 2007. Climate Change: Linking adaptation and mitigation through agroforestry. Mitigation and Adaptation Strategies for Global Change 12: 901-918.
Vermeulen, S. J., Aggarwal, P. K., Ainslie, A., Angelone, C., Campbell, B. M., Challinor, A. J., Wollenberg, E. 2012. Options for support to agriculture and food security under climate change. Environmental Science & Policy, 15(1)136-144. doi:10.1016/j.envsci.2011.09.003
Vogel, C., Moser, S. C., Kasperson, R. E., and Dabelko, G. D. 2007. Linking vulnerability, adaptation, and resilience science to practice: Pathways, players, and partnerships. Global Environmental Change, 17(3-4), 349–364.
Vrieling, A., Meroni, M., Shee, A., Mude, A. G., Woodard, J., de Bie, C. A. J. M., and Rembold, F. 2014. Historical extension of operational NDVI products for livestock insurance in Kenya. International Journal of Applied Earth Observation and Geoinformation, 28(1), 238–251.
Wang, J., Huang, J., & Rozelle, S. 2010. Climate change and China’s agricultural sector: An overview of impacts, adaptation and mitigation. In ICTSD-IPC Platform on climate change, agriculture and trade. International Center for Trade and Sustainable Development (ICTSD) and International Food & Agricultural Trade Policy Council (IPC). Retrieved from http://dspace.cigilibrary.org/jspui/handle/123456789/29143
Whitbread, A. M., Robertson, M. J., Carberry, P. S., & Dimes, J. P. (2010). How farming systems simulation can aid the development of more sustainable smallholder farming systems in southern Africa. European Journal of Agronomy, 31(1), 51-58. doi:10.1016/j.eja.2009.05.004
Wood, S. A., Jina, A. S., Jain, M., Kristjanson, P., & DeFries, R. S. (2014). Smallholder farmer cropping decisions related to climate variability across multiple regions. Global Environmental Change, 25, 163-172.
116 | Africa Agriculture Status Report 2014
Neufeldt H, Kristjanson P, Thorlakson T, Gassner A, Norton-Griffiths M, Place F, Langford K. (2011). ICRAF Policy Brief 12: Making climate-smart agriculture work for the poor. Nairobi, Kenya. World Agroforestry Centre (ICRAF).
World Bank. 2012. The transformational use of information and communication technologies in Africa. 2012 Summit of African Union Ministers in charge of Communication and Information Technologies, 2–6 September 2012, Khartoum, Sudan
Yacine, N., Sissoko, K., Zougmoré, R., Dieye, K., Amadou, M., Moussa, A.S., Forch, W., Garlick, C., Ochieng, S., Kristjanson, P., Thornton, P.K. 2011. Summary of household baseline survey results – Kaffrine, Senegal. Copenhagen, Denmark: CGIAR Research Program on Climate Change, Agriculture and Food Security (CCAFS).Available online at: www.ccafs.cgiar.org
Yamauchi, F., Yohannes, Y., & Quisumbing, A. R. (2009). Risks, ex-ante actions, and public assistance: Impacts of natural disasters on child schooling in Bangladesh, Ethiopia, and Malawi. IFPRI Discussion Paper, 880(April), pp.29.
Yamauchi, F., Yohannes, Y., & Quisumbing, A. R. 2009. Risks, ex-ante actions, and public assistance: Impacts of natural disasters on child schooling in Bangladesh, Ethiopia, and Malawi. IFPRI Discussion Paper, 880(April), 29. Retrieved from http://www.ifpri.org/pubs/dp/ifpridp00880.asp\nhttp://www.ifpri.org/sites/default/files/publications/ifpridp00880.pdf
Yegbemey, R. N., Yabi, J. A., Tovignan, S. D., Gantoli, G., & Haroll Kokoye, S. E. (2013). Farmers’ decisions to adapt to climate change under various property rights: A case study of maize farming in northern Benin (West Africa). Land Use Policy, 34, 168–175.
Zhang, W., Ricketts, T. H., Kremen, C., Carney, K., & Swinton, S. M. (2007). Ecosystem services and dis-services to agriculture. Ecological Economics, 64(2), 253–260.
Zhou, Y. (2010). Smallholder Agriculture , Sustainability and the Syngenta Foundation. Syngenta Foundation Research Report, 1–15.
Zhou, Y. (2010). Smallholder Agriculture, Sustainability and the Syngenta Foundation. Syngenta Foundation Research Report, 1–15.
Ziervogel, G., Cartwright, A., Tas, A., Adejuwon, J., Zermoglio, F., Shale, M., and Smith, B. (2008). Climate change and adaptation in African agriculture. Training, 4179, 53. doi:10.1002/cnm

Africa Agriculture Status Report 2014 | 117

118 | Africa Agriculture Status Report 2014
Chapter 4 Enabling Adaptation to Climate Variability and Change Across Sub-Saharan Africa

Africa Agriculture Status Report 2014 | 119
KEY MESSAGES
SSA is highly vulnerable to the negative impacts of climate variability and change, and currently has very low adaptive capacity. Coordinated efforts at all levels of policy making – national, sub-regional and continental – are urgently needed to strengthen Africa’s ability to adapt to the likely impacts of climate change, and indeed to help mitigate future problems.
Africa is facing a soil health crisis of immense proportions, which will only be made worse by climate change in the decades ahead. Significant long-term investments – both public and private – are badly needed to restore and conserve Africa’s soils. The scaling up of proven integrated soil fertility management practices holds great promise, as does conservation agriculture and other climate-smart approaches to food production.
Extreme climate events can disrupt seed networks. Greater support of both formal and informal seed networks is needed in order to improve the availability and affordability of seed of improved crop varieties, especially for poor households recovering from extreme climate events.
The diversification of rural livelihoods through farmer participation in high-value production chains has the potential to spread the risks associated with climate change by providing multiple production and marketing options.
A host of policy-related issues needs to be addressed. These relate to seed systems, the uptake of environmentally friendly soil management options, and the improved effectiveness of and access to agricultural output markets. Also of critical importance is genuine reform and implementation of Africa’s land tenure systems, which currently tend to discourage investment by farmers in many climate-smart agricultural practices.
ONE
TWO
THREE
FOUR
FIVE

120 | Africa Agriculture Status Report 2014
IntroductionThe agricultural sector in Africa is dominated by smallholders that make most of their living from growing crops or keeping livestock on small plots of land. Output levels are generally low and insufficient to feed their families throughout the year or to generate any sizable income. African farmers’ outputs are constrained by inherently low soil fertility, poor access to such inputs as seeds of improved crop varieties and affordable fertilizers, and an inadequate transport, storage, and marketing infrastructure that limits access to output markets, among other factors.
The effects of climate change add to the challenge of producing enough food for Africa’s growing population. Climate change is worsening already tight resource constraints through more extreme and variable weather and is decreasing average yields. Smallholder farmers are particularly vulnerable to climatic and economic shocks, and it seems like unpredictable weather and food price shocks have become the new norm. Recent
droughts in the horn of Africa have had devastating effects on crop yields and livestock production, affecting food prices and increasing the vulnerability of the poor. As we seek to feed 2.4 billion people in Africa by 2050, climate change will continue to present further complications to millions of people for whom achieving food security is already problematic.
Policymakers and development practitioners rightly see smallholders as the driving force of economic growth and poverty reduction in Africa. Smallholder farmers on the continent have begun to embrace climate-smart farming practices and technologies in a number of agro-ecologies (see Chapters 1- 3 and Table 4.1) and farming systems, but as climate variability increases, they may need to adapt more rapidly and more comprehensively. This chapter is focused on five key factors that have major effects on smallholder agricultural productivity and profitability: soil health, seed systems, output markets, land tenure, and agricultural policy.
Farming Systems of Sub-Saharan AfricaSmallholder farmers in SSA have established a wide range of farming systems that vary both across and within the region’s major agro-ecological zones (AEZs). A farming system is defined as a population of crops and livestock enterprises that share similar patterns of farm activities, household livelihoods, and interaction between enterprises, such as crop-livestock interactions (Inter-Academy Council, 2009). In Asia, food security is based largely on a single rice/wheat farming system. However, in SSA food security rests on production from multiple farming systems in a wide range of AEZs. Farming systems in SSA are very diverse (see Map), and 16 have been identified so far (Dickson et al., 2001; Garitty et al., 2012). Even at the individual household or farm level, there is considerable diversity in the crops grown and livestock reared.
The major characteristics of the farming systems of SSA are weathered soils of low inherent soil fertility, declining soil fertility due to population growth and a minimal use of external inputs, and rainfed agriculture with highly variable rainfall. Crop yields are very low, often between half a ton to two tons for cereals and legumes. The productivity of these farming systems must be improved in order to feed Africa’s burgeoning population. Four major farming systems will be discussed in this chapter: highland perennial, maize mixed, cereal-root crop mixed, and agro-pastoral systems. The basis for selecting these systems include the human population supported
by them, the number of poor people working these systems, the extent of malnutrition and food insecurity, the potential for agricultural growth, and the potential for adverse impacts due to climate variability and change on the productivity of these systems.
Maize mixed farming systemThis system is popularly described as the engine of rural growth, which is somewhat ironic given that poverty is more prevalent in this farming system than any other. Smallholder farmers account for about 90% of both the population and the cultivated land area under this system. Livelihoods are derived mainly from maize and cattle, with small ruminants and poultry also playing an important role. Legumes – such as groundnuts, soya bean, pigeon pea, cowpea, beans, and Bambara nuts – are commonly grown, and cash crops include coffee, tobacco, cotton and sunflower. There is generally good access to input/output markets due to infrastructure development. Off-farm income is a significant contributor to livelihoods. Extensification (area expansion) has underpinned increases in production, which now averages 1-2 MT/ha of maize and 0.5-1.0 MT/ha of legumes. Despite improved market access, institutional and socioeconomic constraints make it difficult for resource-poor smallholders to
Africa Agriculture Status Report 2014 | 121
readily obtain improved seed and fertilizer, and to sell their produce in output markets. Intensification offers the best promise for improved livelihoods, as demonstrated by Malawi’s intensification of maize production through subsidized maize seed and fertilizer (Denning, 2009). Diversification and off-farm income can also play a critical role in providing livelihoods. Food insecurity, hunger and poverty are usually commonplace in this farming system, affecting especially the 80% of poor farmers who depend on rainfed agriculture. The abundance of natural resources that is often encountered in areas that support this farming system provides the basis for pro-poor agricultural development, if appropriate policies, incentives and institutions are in place to provide public goods and services. The system is subject to high risks of natural disasters and shocks, such as droughts, erratic rainfall, and severe weather events associated with climate change.
Cereal-root crop mixed farming systemThis farming system is also recognized as a major potential source of agricultural growth for Africa and is referred to in West Africa as that region’s future breadbasket area (Garrity et al., 2012). In 2009, the World Bank referred to this system in terms of ‘Awakening Africa’s Giant’. The cereal-root crop mixed farming system has three primary sub-systems: the cereal-root mixed, and roots and tubers, which predominate in West Africa; and the maize-mixed farming system that is found in East and Southern Africa. This is one of the underutilized systems in Africa, with 290 million hectares of land supporting just 25% of the population. Rainfall is highly variable and poor soils pose serious challenges to improving agricultural productivity; in fact, productivity is limited by labor rather than land. This farming system holds considerable potential for increasing productivity using both extensification and intensification strategies. Trees are a significant feature as well, exemplified by parkland agroforestry systems. Vulnerability to climate change-related risks and shocks, such as drought, erratic rainfall, and high temperatures is high in this system.
Agro-pastoral farming systemThis farming system is found throughout the Sahelian belt that crosses from West Africa into East Africa, and also drops down into Southern Africa (see Map). Its main characteristics are low and unreliable rainfall (300-800 mm/year), which is unimodal in West and Southern Africa and bimodal in East Africa. The high variability of rainfall and its uncertainty have negative impacts on
crops, trees, livestock and grazing resources. Drought is a regular phenomenon in this system. Agro-pastoral farmers have long used various strategies to minimize risk and ensure their survival and are accustomed to the need for resilience under the duress of climate variability and change. Due to short cropping seasons, sorghum and millets dominate this farming system, though maize is sometimes emphasized; in fact, the area under maize has been increasing of late. Livestock systems involve cattle, sheep and goats, camels, donkeys and poultry. There is strong crop-livestock interaction through the use of crop residues as fodder and livestock providing manure to maintain soil fertility. Livestock provide a number of important products and services, such as milk and dairy, meat, draft power, transport, and cash income; they also serve as assets and savings, and are used to meet social obligations. Poverty is also widespread in in this system, with 45 million people earning less than US$ 1.25 per day. Agricultural growth has been stagnant or very slow under this farming system, which has resulted in a significant rural to urban migration of about 6% per year. This urbanization is increasing the demand for high-value foods, such as dairy and meat, and this trend is expected to continue in the decades ahead. The major challenge is how to meet this demand through improved crop and livestock productivity. Intensification of crop and livestock production seems promising, but food security is highly vulnerable to climate-related risks and food price volatility is high – which is particularly important given the limited purchasing power of the population supported by this farming system.
Highland perennial systemHighland perennial systems have unique ecological characteristics, though they are limited in scope. This system is located in the East African highlands. It has long rainy periods, and moisture is not a limiting factor for agricultural production. Soils found in this system are relatively fertile. Population density is very high and farm size tends to be very small. This system has the highest potential for agricultural growth and suitability for horticulture, floriculture, coffee, and tea. Intensification has been a major pathway for increasing productivity. Permanent cash crops are combined with such food crops as bananas and maize. These highland areas are characterized by high levels of poverty and malnutrition, despite good access to markets. The major question in the highlands has to do with farm size, and how increasingly small plots are adversely affecting economic viable and the ability to produce marketable surpluses. The negative impacts of climate variability and change are expected to be limited in the highlands, with some reports even projecting increased rainfall and longer growing seasons. However, declining soil fertility, as well as pests and diseases, seriously threaten agricultural intensification.

122 | Africa Agriculture Status Report 2014
Table 4.1 Major characteristics of principle farming systems in SSA
FARMING SYSTEM LOCATIONPOPULATION (MILLION)
PERCENT OF POOR HOUSEHOLDS MAJOR LIVELIHOODS
Maize mixedIn subhumid and semiarid zones; East, Central and Southern Africa
95.6 53.4Maize, tobacco, cotton, legumes, cassava, cattle, goats and poultry and off farm employment
Agro-pastoralSemiarid zones, West, East and Southern Africa
92.8 48.0Sorghum, Pearl millet, maize, pulses, cattle, sheep and goats, poultry and off-farm employment
Cereal-root crop mixed
Subhumid zones, West and Central Africa
50.6 47.0Sorghum, pearl millet, maize, cassava, yams, legumes and cattle
Highland perennial East Africa highlands 65.1 59.0Tea, coffee, banana, maize, beans, dairy, and off-farm employment
Source: Wangai, et al. (2013)
*Poor people are defined as those who earn less than US$ 1.25 per day
Figure 4.1 The major farming systems of sub-Saharan Africa
Source: The Farming Systems of Africa – GAEZ FAO/IIASA, FAOSTAT, Harvest Choice and expert opinion

Africa Agriculture Status Report 2014 | 123
Improving Soil Health by Scaling Up Integrated Soil Fertility Management Technologies The negative effects of climate change have adversely affected the agricultural sector, perhaps more than any other sector that contributes to human livelihoods (Custovic, et al., 2012). In sub-Saharan Africa, where most soils are depleted of nutrients (Babana and Antoun, 2006; Jama and Kiwia, 2009), droughts, flash floods, and the increased temperatures associated with climate change have reduced the productivity of arable lands, consequently leading to severe food insecurity relative to an ever-increasing population (FAOSTAT, 2010; Ndirangu, et al., 2013; Vanlauwe et al., 2010). The gaps between actual and potential yields in most African countries are wider than in Latin America and Asia, and resource-poor smallholder farmers in sub-Saharan Africa are highly vulnerable to the effects of climate change (AGRA, 2014; FAOSTAT, 2010). These farmers must therefore be supported with interventions that can both improve food production and protect their natural resources in order to help them adapt to climate variability and change (Vanlauwe and Zingore, 2011).
Within its first year of operation in 2009, the AGRA’s Soil Health Program realized that demonstrations of technologies alone to improve soil health would not translate into their uptake by smallholder farmers. Many projects have engaged in such demonstration initiatives in the past, but the impacts have been minimal. The problem is that farmers often lack easy access to needed inputs, especially fertilizers, and when they do have access, such inputs are usually beyond the budgets of typical smallholder producers – even in the relatively modest quantities needed for integrated soil fertility management (ISFM). Fertilizers cost between US$ 800-1200/ton at the farm gate, and without targeted subsidies fertilizer use is likely to remain low (AGRA, 2014).
Africa’s soil health challenge cannot be addressed in isolation, or following a business-as-usual approach. When it was established, AGRA’s Soil Health Program embraced an impact goal of “sustainable improvement of the yields of staple food crops produced by 4.0 million smallholder farmers across 13 countries through ISFM interventions” (AGRA Database, 2014). Achieving this outcome requires simultaneously addressing several systemic barriers to increasing productivity and profitability, and working closely with AGRA’s other programs and its many partners to do so. In practical terms, this meant designing a comprehensive initiative that would lead to: greater uptake of improved staple crop varieties and hybrids; better access to affordable credit, more cost-effective storage and transport services, and (especially) to input and output markets;
strengthening the capacity of farmer groups to operate collectively, and thereby exert greater influence at various key points along the agricultural value chain; and to enhance the availability of relevant production, processing and marketing information to smallholder farmers. This integrated initiative was dubbed ‘Going Beyond Demos’ (GBD).
The GBD initiative takes a value chain approach to improving the productivity of a specific crop or crops, and involves engaging with public and private sector organizations to develop and refine input and output markets. The initiative was implemented through existing soil health projects funded by AGRA over a 3-year period; the selected projects targeted between 10,000-50,000 farmers each. Based on lessons learned during implementation, five interrelated interventions were confirmed as essential:
1. Conducting demonstrations and participatory adaptive research to raise awareness and knowledge of appropriate ISFM practices, and to improve technology recommendations for famers;
2. Strengthening farmer cooperatives, associations and groups to increase their ability to provide services desired by their members;
3. Engaging with public and private sector entities in improving access to input and output markets (government interventions at the local level was shown to be particularly important in countries where input subsidy programs were operating;
4. Improving access to finance for the purchase of inputs, especially fertilizers; and
5. Monitoring progress, documenting lessons learned, and using them to continuously improve the program.
These interventions required redesigning existing grants to provide projects with the resources needed to address key constraints using a value chain approach. They also required forging strong partnerships with other stakeholders, beginning with programs within AGRA. Support from AGRA’s other programs – seeds, markets, innovative finance, and FOSCA1 – came in the form of co-funding, as well as technical input into the development of the projects. Interventions also required new private sector partnerships, especially with agro-input dealers, fertilizer producers, and seed companies to ensure that sufficient high quality inputs would be
1. Program for Africa’s Seed Systems (PASS), the Market Access Program, the Innovative Finance initiative, Farmer Organization Support Center in Africa (FOSCA)

124 | Africa Agriculture Status Report 2014
available to smallholders on a timely basis. Buyers and aggregators of produce were also engaged to facilitate marketing and ensure that farmers have sufficient economic incentives to encourage adoption of new climate-resilient technologies. In some cases, farmer organizations were involved in the production of legume seed, and private fertilizer companies as well as national and international agricultural research centers helped to improve rhizobium inoculum supply for the legumes. In some cases, limited funding was provided to improve inoculum production and distribution.
Strengthening farmer organizations was seen as critical for success and was accorded a high priority by the project teams. This required expanding the support base of the projects so that they could advise on issues related to the governance of associations, improved production techniques, and marketing skills, among other things. This meant that each project had to acquire expertise in these areas, which they did largely through partnerships with other programs or by hiring consultants.
Smallholder access to affordable financing for inputs, especially fertilizers, was also seen as critical. The projects tried a number of options, among them: a) out-grower contractual arrangements involving commercial
farms that have nucleus production units, b) contractual schemes with produce buyers that could finance production inputs, c) agro-input dealers that could provide inputs on credit, d) revolving funds managed by farmer associations or by microfinance institutions that fund the provision of production inputs, and d) credit guarantees through banks.
Finally, there was need to strengthen the capacity of project teams to manage activities that go beyond just soil fertility improvement. Required skills included: partnership management; formal monitoring and evaluation of progress, including mapping the uptake of ISFM technologies by farmers; and clearly documenting lessons learned and emerging challenges.
Major OutcomesThe GBD initiative led to a rapid uptake of ISFM technologies. The projects involved deployed a wide range of innovative approaches to address key challenges, especially those associated with financing inputs for farmers (in particular, fertilizer). This work is exemplified by three case studies conducted in different countries for different crops (Box 4.1).
Box 4.1 ‘Going beyond demos’ value chain approaches used to scale up ISFM technologies through strategic partnerships
Tanzania – pigeon-pea cropping project Using a value chain approach, the project sought to scale up productivity of smallholder pigeon pea-maize intercropping systems in Tanzania to 30,000 smallholder farmers. The technology promoted included the use of improved maize and pigeon pea varieties (medium and short-duration types) coupled with the application of fertilizers containing phosphorus, such as the one supplied by the local Minjingu Fertilizer Company that is derived from local phosphate rock deposits.
The project engaged many partners to achieve its targets. These partners agreed to taking on different assignments based on their capacity and experience, and according to the needs assessment done during annual planning and review meetings. Partners included: a) the media, both print and electronic (radio, mobile phones and TV), to create mass awareness; b) frontline agricultural extension staff that facilitated the establishment of on-farm demonstrations (both large and small), which showcased the ‘best-bet’ pigeon pea-maize intercropping practices in different agro-ecologies; c) farmer associations, which provided extension services and access to credit for inputs (seeds and fertilizers) to their members) agro-input dealers, which stocked the seeds and fertilizers needed and through which farmers could redeem their subsidy vouchers; e) the fertilizer industry, especially Minjingu Fertilizer Company, which provided fertilizers for the demonstrations; f) local microfinance institutions, which provided credit to farmers; g) local government, which contributed to widespread awareness and the organization of field days; and h) seed companies (the Krishna, Tanseed and Zenobia seed companies), which were supported by AGRA’s Program for Africa’s Seed Systems to supply some of the required pigeonpea seed. Additional seed (30.4 tons) of popular varieties were bulked for the project through farmer association partners, and

Africa Agriculture Status Report 2014 | 125
at the Selian Agricultural Research Institute (SARI) in Arusha, with the support of ICRISAT, a technical partner in the project.
Agrodealers and farmer associations accessed the seed at half price and sold it to farmers at slightly higher prices to take care of their profit margins and logistical costs. The project linked farmers to large-scale buyers (such as Kilimo Market), and farmers used mobile telephones to monitor market price fluctuations. The project negotiated affordable credit using farmers’ own resources (cooperatives and village banking).
Three years after it started, the program had achieved the following:
• The project directly trained 27,880 farmers on ISFM practices through demos and field days, of which 18,000 (39% of them women) are now using the technologies.
• An estimated 2 million farmers were made aware of ISFM through radio, TV, local newspapers during the 3 years (estimates are based on media coverage).
• A total of 16,688 hectares of land have been put under maize-pigeon pea intercropping and other ISFM practices. This is 80% of the target that was set by the project.
• Maize productivity increased to an average of 3.5 t/ha, up from 1.5 t/ha (effectively doubling yields), while pigeonpea yields increased to 1.4 t/ha from 0.4 t/ha.
• Over three years, a total of 100,128 tons of maize and 70,000 tons of pigeon pea were produced, with a total value of US$ 54 million.
• From the project investments of US$794,700, it can be inferred that for every US$ 1 invested in the project, US$ 68 was generated.
• The project trained about 350 extension service agents from the public extension system on ISFM methods.
• Close to 400 agrodealers received numerous trainings aimed at improving their business links with farmers and for quality assurance.
• A repayment rate of 92% for credit accessed from micro-finance institutions.
Malawi – CDI projectThe Clinton Development Initiative (CDI) project sought to improve the productivity of maize and soybeans through ISFM and better access to markets for 21,000 farmers in northern Malawi. The ISFM technology that was promoted involved rotation of fertilized maize with soybeans that had also received 20 kg P and rhizobium inoculum. As in the Tanzania case, the strategy adopted by the project included capacity development for farmers (through field days, community meetings and radio programs), securing guaranteed supplies of soya for marketing (through signing pre-season contracts) coupled with market intelligence and monitoring of producer prices, securing farm input loans by organizing farmers, and providing anchor-farm support services (including seed multiplication, produce aggregation, warehousing and shipping).
Key partners included local opinion leaders, farmers, district agricultural authorities, the Lilongwe University of Agriculture and Natural Resources, large-scale produce buyers, a local bank (NBS Bank) and an IT firm that provided digitalized farmer profiling.
After three years, project achievements included the following:
• Maize yields increased from an average of 2.0 to 4.6 t/ha, and soybeans from 0.7 to 1.3 t/ha.

126 | Africa Agriculture Status Report 2014
• 18,000 farmers adopted the promoted ISFM technologies and realized significant yield gains of both target crops. About 50% of the beneficiaries are women.
• A total of 9,906 hectares of land are now under ISFM (soybeans in rotation with maize)
• About 35 agricultural extension workers and 14 supervisors have been trained on ISFM and related agronomic practices.
• The number of farmers receiving agronomic and ISFM training reached about 30,200, of which nearly 50% were women.
• About 408 additional farmer associations (clubs) were strengthened relative to those that had already received support at the beginning of the project.
• Farmers sold over 16,000 tons of grain during the project period to contract buyers in a process facilitated by the project.
• A total of 3,216 farmers obtained farm input loans from NBS Bank. All farmers who accessed soya farm input loans applied BIOFIX inoculants to their soya bean crop.
Ghana – SARI projectThis project aimed at scaling up ISFM options in northern Ghana for the maize-soybean rotation system, with a target of 60,000 farmers. The Savannah Agricultural Research Institute (SARI), which led the project, brought on board strategic implementation partners. The Ministry of Food and Agriculture was tasked with strengthening farmer organizations as well as the dissemination of technologies (training of farmers, setting up demonstrations, conducting field days, etc.). To improve access to inputs (fertilizers and seed of improved varieties), the project engaged a local micro-finance institute – Centre for Agriculture and Rural Development International (CARD) – to manage a small credit guarantee fund of US$ 100,000.
Three years after initiation, the project’s achievements included the following:
• The microcredit administered through CARD increased access to inputs for about 4,000 farmers (the credit recovery rate in 2011 was a disappointing 34%, but jumped to a satisfying 100% in 2012).
• Agrodealers were engaged to supply inputs and facilitate recovery of input loans. SARI conducted periodic reviews of progress and managed the communication process with all partners.
• Maize yields increased from an average of 1.5 to 3.5 t/ha, and soybeans from 0.9 to 1.5 t/ha.
• About 117,000 farmers adopted the promoted ISFM technologies, and over 40% of the beneficiaries are women.
• A total of 106,002 hectares of land have been put under ISFM (soybeans and other legumes, like cowpea, in rotation or intercropping with maize).
• About 155 farmer-based organizations, 85 agrodealers and 225 extension agents were trained by the project.
• Rhizobium production was begun in SARI.
• Two M.Sc. Students were trained under the project.
Source: AGRA Database, 2014

Africa Agriculture Status Report 2014 | 127
The benefit of fertilizer use as part of ISFM is evident on farmers’ fields, as demonstrated by the 2012 yield assessment in northern Ghana (Figure 4.2). In the five districts where the SARI project worked, average maize yields under farmers’ practices remained less than 2 t/ha. With the application of just 50% of the
recommended quantity of fertilizer, yields increased by 1.0-1.5 t/ha. Even higher yields were achieved with the full application of the recommended amount, which unfortunately most farmers cannot afford. The cost-benefit ratio turns out to be 1:2, which makes fertilizer use very attractive.
Figure 4.2 Maize yield comparison in farmers’ fields in several districts in northern Ghana
Farmer Practice
1/2 Fertilizer Rate
Full Fertilizer Rate0
0.5
1.0
1.5
2.0
2.5
3.0
3.5
4.0
Tolo
n
Zab
zugu
Gus
hegu
Tam
ale
Met
ro
Wes
t Mam
prus
i
Tolo
n
Zab
zugu
Gus
hegu
Tam
ale
Met
ro
Wes
t Mam
prus
i
Tolo
n
Zab
zugu
Gus
hegu
Tam
ale
Met
ro
Wes
t Mam
prus
i
YIE
LD (T
/HA
)
Source: AGRA Database 2012
The economic impacts of the investments made are significant. For instance, AGRA’s investment of US$ 3.056 million in the three projects managed to reach 126,000 farmers in the target regions. The investment cost per farmer ranged from US$ 17-44. Average yield increased for the target crops: maize – 2-2.6 t/ha; soybeans – 0.6-1.2 t/ha; and pigeon pea – 0.8-1.0 t/ha. Applying these increases to the project’s baseline production figures, each farmer directly reached would have obtained from 1.0 to 2.2 additional tons of maize, 0.1 to 0.8 more tons of soybeans, and 0.1 to 0.3 more tons of pigeon peas per growing season. These figures are based on actual production of farmers using ISFM. The implication is that even if average yields/ha are
high, area under ISFM is still small. This is perhaps an indication of the constraints to access and the affordability of required farm inputs. Conservative estimates of returns on investment (ROI) in these three projects range from US$ 4.80 to US$ 17.30 for every dollar invested by the project, which is indeed attractive. The wide range in the ROIs is due to variations in the number of farmers reached by the projects and their yield differentials between the baselines without and with ISFM interventions 2-3 years later. Soil improvement due to soybean cultivation and its impact on subsequent cropping on the land, though difficult to quantify at the moment, is additional value for money invested.
128 | Africa Agriculture Status Report 2014
Fast facts on fertilizer markets in AfricaFertilizer markets in Africa are fragile and underdeveloped. The reasons are multifaceted: development is held back by real and perceived credit risk; importers and potential manufacturers lack financing and distribution networks; the region lacks of infrastructure to manufacture, import, blend and store product; and farmer demand is dampened by the high cost of fertilizer and limited market information. These are complex and dynamic problems that will elude any top-down, ‘magic bullet’ solutions that may be funded by narrowly targeted development money.
Several supply- and demand-side barriers across the value chain inhibit fertilizer use among smallholder farmers in sub-Saharan Africa. These barriers contribute both to limited availability and high prices that make the use of fertilizer cost-prohibitive among low-income farmers. Barriers to fertilizer use include:
Importation: Upstream, fertilizer importation is often fragmented and inefficient. Outdated national fertilizer use recommendations, the development of strong historic brand names, and the lack of domestic processing facilities often result in the importation of inefficient, over-engineered fertilizer compounds or the production of similarly over-formulated domestic blends manufactured to match the imported compounds. In most countries, importers – cognizant of the small, unpredictably priced markets, as well as higher shipping and storage costs – order in small batches, paying well above international spot prices. The sector is also hurt by poor port infrastructure and limited importer competition.
Internal distribution: Within most SSA countries, poor roads and rail networks lead to high transport costs. A shortage of warehouses hinders importers and distributors from buying when costs are low; it also constrains their ability to assure that adequate stocks are available to smallholder farmers at the right time in the crop cycle. Moreover, banks view agricultural lending as high risk; when credit is made available, it is subject to high interest rates and stringent collateral requirements. Importers and distributors thus have limited access to credit for inventory, storage and operating expenses. They also lack access to technical and business management services that could improve operational efficiency.
Retail: At the retail/cooperative level, there are few agrodealers with market penetration into rural areas, resulting in limited competition. For those few retailers in the supply chain, fertilizer brings small margins compared to other agricultural inputs. Retailers’ ability to carry product is also constrained by expensive credit with high collateral requirements. Low margins on low volumes also discourage the investment of time and effort to build retail fertilizer businesses. Retailers also lack marketing and business management skills, and often do not have the technical knowledge needed to advise farmers on the correct use of fertilizers. These barriers limit supply and prevent the availability of sufficient quantities of the right quality and type of fertilizers, at affordable prices, and at the right time in the planting cycle.
Demand: Smallholder use of fertilizers in SSA is extremely low due to: lack of farmer knowledge of the correct use and benefits of fertilizers; use of inappropriate fertilizers due to outdated fertilizer recommendations that have led to low returns on farmers’ investments; lack of farmer access to agricultural credit; and dampened returns to investments in fertilizers due to low output prices that are in turn attributable to thin markets for crops and few opportunities for adding value. Fertilizer subsidy schemes have been used to increase the profitability and adoption of fertilizers, but have themselves contributed to market distortions and undercut the few existing private sector credit markets.
Strategies for improving farmer access to fertilizers
Demand and supply side strategies are available for African governments to use in order to increase farmer access to fertilizers. For example, targeted or ‘smart’ subsidy programs can be used to increase the use of fertilizer by smallholder farmers. Different countries, depending on specific national and/or local circumstances, use different mechanisms. Some countries prefer the voucher system (Malawi, Tanzania, and Burkina Faso), and some use mobile payment technology and ICT tools (Nigeria). Beyond these approaches, other strategies to consider (not an exhaustive list):
• Extending banking services to rural areas and improving smallholder access to credit (Tanzania looking at piloting a program to reduce the cost of money for agriculture), and putting in place credit guarantees to increase access to finance along agricultural value chains (including for agribusinesses). Farmers and agrodealers will be able to obtain more affordable financing to supply and/or purchase inputs.

Africa Agriculture Status Report 2014 | 129
• Research on new and more productive inputs, such as better blends of fertilizer for different soil types and crops, is critical to enable availability and distribution of fertilizers that will boost yields and increase farmer incomes.
• An enabling environment will encourage investments in local manufacturing (if raw materials are available), blending plants, bulk importation, and bagging in-country, all of which will reduce transportation costs and hence fertilizer prices. This can be done by reforming and strengthening national regulatory systems and policies and, at the regional level, harmonizing regulations to build wider markets and encourage investment.
• Farmers organized into farmer groups or cooperatives are able to make collective purchases and reduce their reliance on ‘middlemen’, and as a result are able to negotiate better prices with fertilizer suppliers.
• Some smallholder farmers participate in out-grower schemes that enable either the commercial farmer that has subcontracted them or the buyers of their produce to assist with access to inputs (seeds and fertilizer) on credit.
• Another strategy is to strengthen the capacities and prevalence of agrodealers in rural areas, reducing the distance farmers must travel to purchase fertilizers and other inputs.
• Improving market information systems is also an important strategic step that will enable farmer groups and individual smallholders access to current and more accurate information about input prices (fertilizers, seed, and others). These same systems help improve farmer access to relevant output market information.
Source: C. Khupe (AFAP), 2014
130 | Africa Agriculture Status Report 2014
Key lessons learned• Microfinance institutions can help jumpstart
access to finance for inputs, especially fertilizers, which are expensive for most farmers. Besides funding, they provide other services, such as storage and marketing of produce. Farmers can pay using their produce instead of cash. However, the scope of micro-financiers is limited as to the number of farmers they can support. For this reason, financing from banks and major financial institutions is necessary, and for such financing to happen, facilitation by a service provider (in this case the project team) is necessary. This facilitation, as the Malawi CDI case demonstrates, includes the identification of reliable buyers of farmers’ produce, strengthening the governance of farmer organizations so that they can be efficient in sourcing input and output markets and in achieving economies of scale, and ensuring that their members are financially literate and can honor contracts.
• While private sector-led value chains are key to scaling up and sustaining impact, facilitation is needed to ensure smallholders are on board. However, if project interventions are not well done, private sector institutions could quickly drop smallholder participants because of the high transaction costs involved, especially in extension and in organizing the farmers into functional groups.
Challenges and opportunities• The 3-year duration of the projects was not
sufficient to implement value chain interventions that targeted many farmers, and that involved
many partners. This is particularly so in countries and regions where there is only one cropping season in a year. It takes time to organize the seed production system, which is particularly difficult for grain legumes that are not readily available from the seed companies. It also takes time to put together the partners needed and to build the trust required to effectively work together. These projects should be implemented over a minimum period of five to six years. The ‘spill-over’ effect of a second phase project could benefit many more farmers in communities neighboring the initial target geographies.
• There can be considerable variation in the performance of the GBD initiative within and across countries, depending on the leadership of the projects and the partnerships they are able to pull together. A lot of effort is needed to strengthen the capacity of project staff, including building their confidence that they can move beyond their comfort zones as agricultural scientists. In this regard, study tours to other successful projects could help, as would joint meetings that allow the exchange of experiences and lessons learned.
• These challenges notwithstanding, there are many lessons and opportunities that the GBD initiative and other similar efforts have created. The main ones: strong partnerships between institutions are necessary for success in strengthening different value chains; farmers knowledgeable about ISFM technologies and willing to engage with other market players are essential; examples of ‘good practices’ as to how to increase smallholder access to inputs (including financing) need to be well documented and shared widely; and it is vitally important to increase the support of governments and their development partners to improve smallholder agriculture in Africa.
Effective Seed Systems to Combat Climate ChangeAgricultural production has been increasing slowly in Africa over the past three decades, but these increases are attributed largely to expanding the land under cultivation, rather than because of increased productivity. Grain yields in SSA are still about one-third of the global average (FAO, 2014), which suggests that that there is significant potential for increasing productivity. A critical challenge confronting governments, policy makers and development practitioners in the region is how to increase food and nutritional security by improving the productivity of the predominantly low-input systems that are typical of smallholder farming in Africa. About 75%
of all farmers in the region are smallholders, who have limited access to productivity-enhancing agricultural inputs, but especially high quality seed and vegetative planting material of superior varieties.
This chapter makes the case that enhanced productivity is critical for mitigating the risks posed by climate change. It also emphasizes the need to increase the use of high quality seed and planting material of well-adapted, improved crop varieties. Case studies are presented that demonstrate the probable negative impacts of climate change, such as the emergence of

Africa Agriculture Status Report 2014 | 131
new and more virulent biotypes of diseases, and how growing superior maize varieties can still result in higher yields. Some success stories from the SSA seed sector are also described that illustrate the steps that can be taken to provide farmers’ with uninterrupted access to quality seed and planting material of adapted, improved cultivars. The need for enhanced plant breeding and improved extension services is also emphasized.
Climate Change Poses Significant Risks to Smallholder Farmers in AfricaChanges in climate, especially changes in precipitation (both its quantity and distribution) and the higher evapotranspiration rates predicted by climate models, will impact agriculture worldwide. While smallholders are not the largest contributors to climate change, they are likely to be among those who bear the brunt of climate change impacts. Compared to their commercial counterparts, smallholder farmers “are more directly dependent on ecosystem services and have less capacity to adapt to changing climate” (IFAD and UNEP, 2013). Over time, climate change is expected to decrease water supplies, accelerate land degradation, and decrease crop yields worldwide (Luis et al., 2008), but African smallholders face an even more immediate challenge. Most African smallholder farmers rely on rainfed agriculture; only about 4% of the continent’s cropland is irrigated (World Bank, 2003). Extreme weather events are expected to rise, especially droughts and flooding that can completely destroy farmers’ crops and livelihoods. Sixty-five percent of African countries have reported weather-related crises, such as severe droughts, within the past ten years (EM-DAT, 2013). Climate change is also blamed for shifts in the beginning, end and length of growing seasons, and for poor distribution of within-season rainfall.
The potentially devastating effects of biotic stresses that can accompany changes in climatic conditions may be more intractable than the consequences of abiotic constraints. Changes in weather patterns are likely to intensify pest and disease pressure on crops, especially as new disease strains and pests emerge among susceptible crops varieties. An example of a burgeoning problem is the maize lethal necrosis (MLN) disease – also known as corn lethal necrosis (CLN) – which is decimating maize fields in East African countries. It is caused by the double infection of maize plants by maize chlorotic mottle virus (MCMV) and any of the Potyviridae spp. cereal viruses, such as the sugarcane mosaic virus (SCMV). The disease was identified in Kenya in 2012, and has since rapidly spread to Uganda, Tanzania and Rwanda; it is expected to quickly spread to other parts of East Africa (Wangai et al., 2013). In Table 4.2, the spread of the disease is
chronicled from the first reported incidence in Peru in 1973, through subsequent identifications in the Americas over the following 16 years, to the reported incidence in faraway China almost four decades later. The most recent incidences in East Africa conclude the portrayal of the worrisome trajectory of this disease to date.
The challenge of sustainably producing enough food for an ever-increasing population is exacerbated by the likely impacts of climate change. The food and nutritional security of SSA – along with that of South Asia – has been identified as the most vulnerable to the effects of climate change (Nelson et al., 2009; Hertel et al., 2010; Tester and Langridge, 2010; Rosegrant, 2011). Ejeta (2009) estimated yield losses of 10-20% for SSA’s most important food crops. Jarvis et al. (2012) also projected significant negative climate change impacts on beans, bananas and sorghum, which are major food security crops in Africa. Interestingly, the conclusion by Foresight (2011) that the deployments of existing tools – including superior crop varieties – could raise yields two- to three-fold provides cause for optimism, as does the projection of significant positive climate change impacts on cassava in the region by Jarvis et al. (2012).
Crop productivity must be enhancedFor African farmers to successfully intensify crop production in sustainable ways, they need access to high quality seed and planting material of a suite of well-adapted improved varieties. These new cultivars need to be genetically diverse, efficient in the use of inputs, resistant to or tolerant of prevalent biotic and abiotic stresses, high yielding, and nutritious. The longer-term food and nutritional security of SSA therefore depends to a large extent on responsive plant breeding programs and effective seed delivery mechanisms. The ready availability of quality seed of superior varieties must be accompanied by appropriate agronomic practices, which in turn requires responsive agricultural extension systems in order to ensure adoption not only of superior varieties, but also good agricultural production practices.
Improved crop varieties will help farmers adapt to climate change – Many modern methods of agricultural intensification can result in adverse environmental effects. Use (and misuse) of mineral fertilizers and pesticides can result in potentially serious pollution of streams, lakes and underground aquifers. The production and use of these inputs relies on non-renewable fossil fuels and is not sustainable in the long run. Improved crop varieties offer farmers sustainable and economically viable alternatives that enable them to avoid or reduce the use of pesticides and soil amendments. Improved seed developed for adaptation to present climatic conditions are unique in their ability to resist or tolerate pests and diseases and

132 | Africa Agriculture Status Report 2014
improve yields without adversely affecting the environment. As illustrated in Figure 4.3, the benefits of superior varieties can help break the vicious cycle of agriculture-based environmental degradation. Farmers in Africa need novel strategies and innovative systems to cope with the effects of climate change, and robust crop improvement and seed delivery systems can cushion farmers against those effects.
The cultivation of improved crop varieties that are resistant to the biotic and abiotic constraints attributable to climate change is a sure way to enhance the resilience of cropping systems threatened by climate variability and change in sub-Saharan Africa. There is ample evidence that superior varieties – usually with enhanced levels of resistance to stresses and/or input-use efficiency – have contributed to decades of increases in global food
production. For instance increases in maize yields of 33-94% have been achieved in the United States over several decades (Device, 1992; 1999; 2005). Also, the dramatic yield increases associated with the first ‘Green Revolution’ cereal crop varieties are well documented. The New Rice for Africa (NERICA) is credited with marked increases in yield in sub-Saharan Africa (Dalton and Gooey, 2003; Diane, 2006; Oaken et al., 2008; Wearies et al., 2008). Similarly, the yields of maize have also been increasing steadily in SSA as a result of the greater adoption of superior varieties (Figure 4.4). Another example can be drawn from Zanzibar (see Box 4.2). These yield increases are the net result of combining enhanced input-use efficiency with tolerance to biotic and abiotic stresses – the same critical constraints associated with climate change.
Table 4.2 The spread of maize lethal necrosis (MLN) disease and/or the co-causative agent, maize chlorotic mottle virus (MCMV), 1973- September 2013 YEAR FIRST REPORTED COUNTRY REFERENCES
1973 Peru MCMV Castillo and Hebert (1974)
1976 USA (Kansas) CLN Niblett and Claflin (1976)
1982 Argentina MCMV Teyssandier et al. (1983)
1983 Brazil MCMV Uyemoto (1983)
1983 Thailand MCMV Cited in Uyemoto (1983)
1987 Mexico MLN Delgadillo-Sanchez and Gaytan-Beltran
1989 USA (Hawaii) MCMV Jiang et al. (1990)
1989 Mexico MCMV Carrera-Martinez et al. (1989)
2011 China (Yunnan Province) MLN Xie et al. (2011)
2012 Kenya MLN, MCMV Wangai et al. (2012)
2012 Tanzania MLN Mahuku and Makumbi D (2012)
UNPUBLISHED REPORTS
2013 Uganda MLN Godfrey Asea (MLN Regional Workshop Nairobi; 2013)
2013 Rwanda MCMV Claver Ngabiyasonga (MLN Workshop July 1, 2013 in Narok)
2013 China (Sichuan Province) MCMV Wu et al. (2013)
Source: Wangai, et al. (2013)

Africa Agriculture Status Report 2014 | 133
Figure 4.3 Breaking the vicious cycle: Improved seed are part of climate-smart agriculture
SMALLHOLDER FARMERS
ENVIRONMENTAL DEGRADATION
CLIMATE CHANGE
SMALLHOLDER AGRICULTURE CAN BE HARMFUL TO ENVIRONMENT
• Deforestation • Erosion • Pollution
CLIMATE CHANGE THREATS TO SMALLHOLDER FARMING
• Extreme weather (flooding, droughts, etc.)
• Pests and diseases
• Depleted groundwater reserves
IMPROVEDSEEDS
Minimizing Damage • Increased yields
• Pest and disease resistance
Improved Resilience • Adaptable varieties (i.e. disease, drought resistance)
• Wider range of crops, diversity
Source: Estimated from Tegemeo Institute/Egerton University household surveys; Y1 is 1997; Y2 is 2000; Y3 is 2004, and Y4 is 2007)
Figure 4.4 Maize yield comparison in farmers’ fields in several districts in northern Ghana
0
500
1000
1500
2000
Y1 Y1 Y1 Y1Y2 Y2 Y2 Y2Y3 Y3 Y3 Y3Y4 Y4 Y4 Y4
PLOTS NOT USING FERTILIZER
Hybrid Seed Hybrid SeedNon -Hybrid Non -Hybrid
PLOTS USING FERTILIZER

134 | Africa Agriculture Status Report 2014
Box 4.2 Adoption of new cassava varieties in ZanzibarCassava is the most widely consumed food crop (after rice) on the island of Zanzibar and is increasingly being grown as a cash crop by farmers who use the additional income to pay school fees and support their families. Prior to 2007, incidences of the devastating cassava brown streak disease (CBSD) depressed cassava yields in the country significantly. The spread of CBSD in the country was correlated with changes in climatic conditions and characterized by the emergence of a new strain that was initially restricted to the coastlines of Eastern Africa (Tanzania and Mozambique). The Rockefeller Foundation, IITA and AGRA, provided support for a rapid breeding scheme that successfully incorporated CBSD resistance into locally adapted varieties. This resulted in new high-yielding varieties that can withstand CBSD and the equally virulent cassava mosaic disease; they are also tolerant to drought, and meet local culinary preferences. Four of these varieties, locally named Kama, Kizimbani, Machui and Mahonda, are now being grown on Zanzibar, and not surprisingly are quickly replacing the older cultivars.
Source: AGRA Annual Report and the Guardian (http://www.ippmedia.com/frontend/?l=65376-)
The positive benefits from cereal breeding can be replicated for the other staple crops being grown by small-scale farmers in SSA. Concerted efforts must be brought to bear therefore on ensuring that farmers have access to high quality seed and vegetative planting material of robust varieties that produce reasonable yields even under extreme weather conditions. Such crop varieties must be input-use efficient; tolerant to myriad abiotic stresses, especially drought, heat and salinity; and must be resistant to pests and diseases. They must also be nutritious. Moreover, climate change is a dynamic phenomenon, and crop breeding must continuously generate new cultivars in order to ensure that emerging threats are met in a timely fashion.
Overall, the adoption of improved crop varieties has resulted in positive impacts on families, as their livelihoods and nutritional status improves. With the adoption of superior crop varieties in Western Kenya, for example, there were marked increases in production and incomes [Tegemeo Institute of Policy and Development, 2010]. Evidence of similar trends abounds in sub-Saharan Africa. For instance, maize yields have steadily increased over the last 10 years in Nigeria as farmers adopted improved varieties, and as they increasingly obtained their seed from reliable sources (FAOSTAT Figure 4.5). Indeed, numerous superior varieties of crops have been bred to increase yields, and to withstand diseases and pests, extreme weather conditions, salinity, and other abiotic stresses. AGRA data show that 464 conventionally bred varieties of staple food crops have been released in different SSA countries over the last 10 years (Table 4.3). Of these releases, 118 were maize hybrids (Figure 4.6). An additional 149 drought-tolerant maize varieties with enhanced water-use efficiency and resistance to prevalent diseases have been bred and released for use by farmers in SSA through the activities of CGIAR Consortium centers, mainly CIMMYT and IITA
(Abate et al., 2013). In addition, other Consortium centers (ICRISAT, CIP and IRRI) have released superior varieties of other crops.
Diversification of crop production systems – Another factor that helps to improve the resilience of smallholders in Africa is increasing crop diversity. The above-mentioned CGIAR Consortium centers have active breeding programs on numerous African crops, including maize, beans, cowpea, cassava, yams, sorghum, millet and sweet potatoes. Additionally, AfricaRice breeds rice varieties targeting the agro-ecologies of the region. Typically, the Consortium centers generate promising advanced breeding lines that are passed on to their counterpart national agricultural research systems for multi-locational testing and eventual release of varieties suitable to specific agro-ecologies. However, well-trained and adequately supported national program breeders are increasingly developing their own superior varieties. This highly successful combination of CGIAR Consortium and national program breeding is providing farmers with a wider spectrum of improved cultivars of for a number of important crops from which they can choose, thereby reducing their dependency on traditionally grown varieties of only a few staple crops (usually maize in East and Southern Africa, for instance).
This enhanced diversity of new elite varieties mitigates farmer risk; if one crop or variety fails, the loss can be buffered by the availability of other crops and replacement varieties. Increased crop diversity also helps to provide for more balanced diets available, enhancing the nutritional status of rural households. More robust crop varieties that are better adapted to stressful production conditions are also enhancing food and nutritional security, as hitherto unusable lands are brought into cultivation. For example, the NERICA series of rice varieties are permitting the cultivation of the crop

Africa Agriculture Status Report 2014 | 135
Figure 4.5 Maize yields in Nigeria
Sources: FAOSTAT, January 2014
Yield
0.0 0.0
0.5
1.0
1.5
2.0
2.5
1.0
2.0
3.0
4.0
5.0
6.0
7.0
8.0
9.0
10.01
96
1
19
64
19
67
19
70
19
73
19
76
19
79
19
82
19
85
19
88
19
91
19
94
19
97
20
00
20
03
20
06
20
09
20
12
MIL
LIO
N H
A &
MT
MT/
HA
Area Production
Table 4.3 Crop varieties released and commercialized between 2007 and 2013, through the support of AGRA’s Program for Africa’s Seed Systems, by country
COUNTRY BANA
NAS
BEAN
S
CASS
AVA
CHIC
KPEA
COW
PEA
FING
ER M
ILLE
T
GROU
ND-N
UT
MAI
ZE
PIGE
ON P
EA
RICE
SORG
HUM
SOYB
EAN
SWEE
T PO
TATO
WHE
AT
TOTA
L
Burkina Faso 4 2 6Ethiopia 2 6 8Ghana 4 3 4 10 6 3 30Kenya 9 9 2 1 4 25 2 4 2 9 67Malawi 4 7 1 12Mali 3 7 2 7 19Mozambique 12 6 4 15 37Nigeria 3 2 5Rwanda 28 6 34Sierra Leone 8 4 12South Sudan 1 3 4Tanzania 12 2 5 1 20Uganda 2 11 7 3 10 11 8 2 54Zambia 4 4Grand Total 2 52 62 2 15 1 18 74 3 29 18 6 24 6 312
Source: AGRA PASS Database, 2014
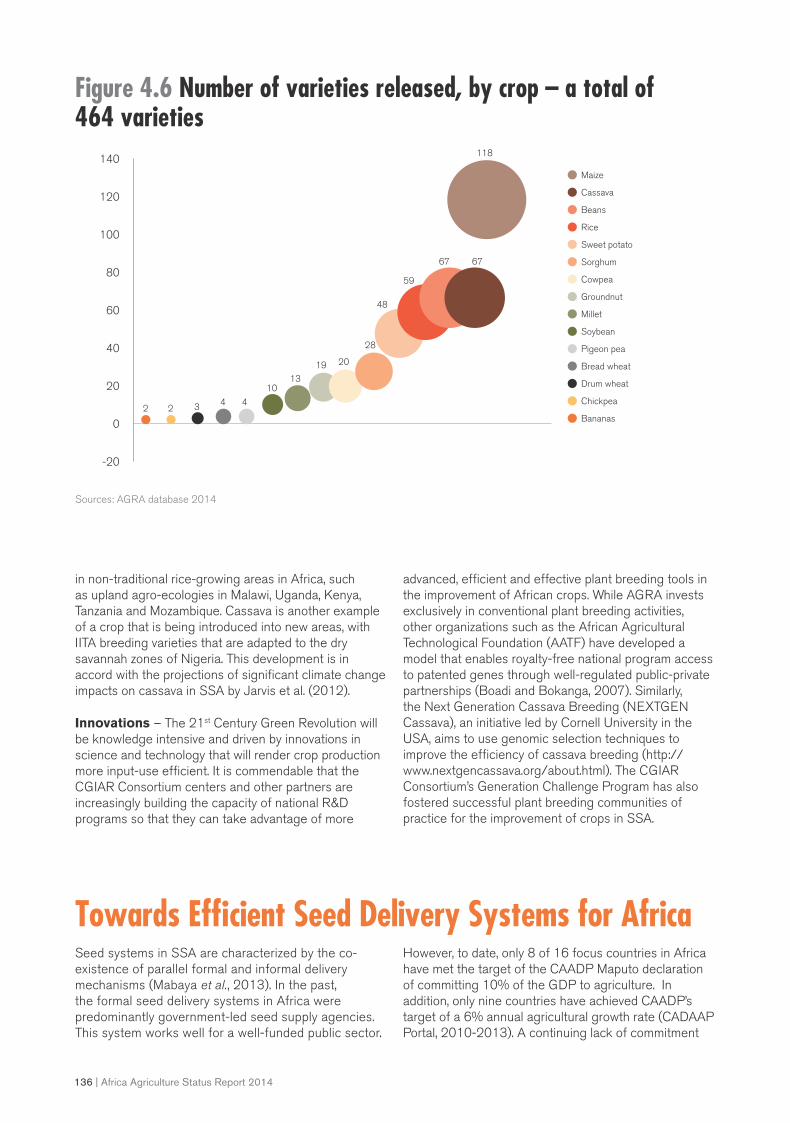
136 | Africa Agriculture Status Report 2014
Figure 4.6 Number of varieties released, by crop – a total of 464 varieties
0
20
40
60
80
100
120
-20
140
2 2Bananas
Cowpea
Chickpea
Sorghum
Drum wheat
Sweet potato
Bread wheat
Rice
Pigeon pea
Beans
Soybean
Cassava
Millet
Maize
Groundnut
3 4 4
13
19 20
28
48
59
67 67
118
10
Sources: AGRA database 2014
in non-traditional rice-growing areas in Africa, such as upland agro-ecologies in Malawi, Uganda, Kenya, Tanzania and Mozambique. Cassava is another example of a crop that is being introduced into new areas, with IITA breeding varieties that are adapted to the dry savannah zones of Nigeria. This development is in accord with the projections of significant climate change impacts on cassava in SSA by Jarvis et al. (2012).
Innovations – The 21st Century Green Revolution will be knowledge intensive and driven by innovations in science and technology that will render crop production more input-use efficient. It is commendable that the CGIAR Consortium centers and other partners are increasingly building the capacity of national R&D programs so that they can take advantage of more
advanced, efficient and effective plant breeding tools in the improvement of African crops. While AGRA invests exclusively in conventional plant breeding activities, other organizations such as the African Agricultural Technological Foundation (AATF) have developed a model that enables royalty-free national program access to patented genes through well-regulated public-private partnerships (Boadi and Bokanga, 2007). Similarly, the Next Generation Cassava Breeding (NEXTGEN Cassava), an initiative led by Cornell University in the USA, aims to use genomic selection techniques to improve the efficiency of cassava breeding (http://www.nextgencassava.org/about.html). The CGIAR Consortium’s Generation Challenge Program has also fostered successful plant breeding communities of practice for the improvement of crops in SSA.
Towards Efficient Seed Delivery Systems for Africa Seed systems in SSA are characterized by the co-existence of parallel formal and informal delivery mechanisms (Mabaya et al., 2013). In the past, the formal seed delivery systems in Africa were predominantly government-led seed supply agencies. This system works well for a well-funded public sector.
However, to date, only 8 of 16 focus countries in Africa have met the target of the CAADP Maputo declaration of committing 10% of the GDP to agriculture. In addition, only nine countries have achieved CAADP’s target of a 6% annual agricultural growth rate (CADAAP Portal, 2010-2013). A continuing lack of commitment
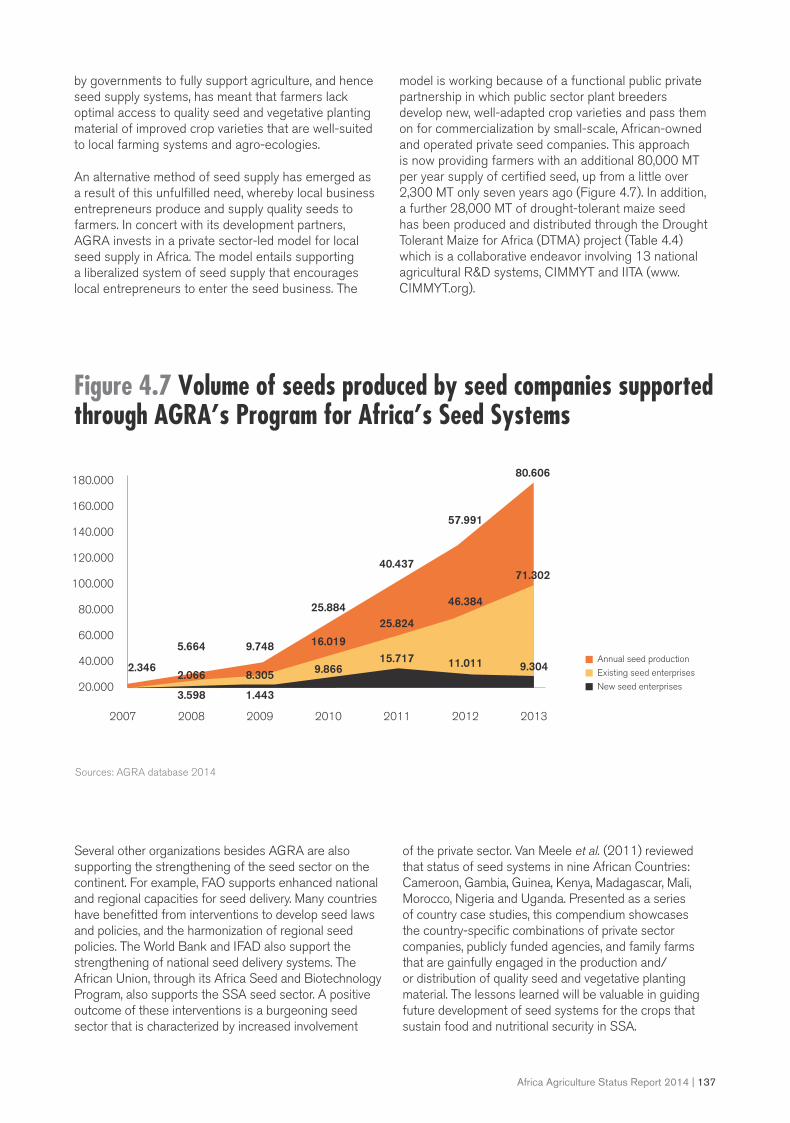
Africa Agriculture Status Report 2014 | 137
by governments to fully support agriculture, and hence seed supply systems, has meant that farmers lack optimal access to quality seed and vegetative planting material of improved crop varieties that are well-suited to local farming systems and agro-ecologies.
An alternative method of seed supply has emerged as a result of this unfulfilled need, whereby local business entrepreneurs produce and supply quality seeds to farmers. In concert with its development partners, AGRA invests in a private sector-led model for local seed supply in Africa. The model entails supporting a liberalized system of seed supply that encourages local entrepreneurs to enter the seed business. The
model is working because of a functional public private partnership in which public sector plant breeders develop new, well-adapted crop varieties and pass them on for commercialization by small-scale, African-owned and operated private seed companies. This approach is now providing farmers with an additional 80,000 MT per year supply of certified seed, up from a little over 2,300 MT only seven years ago (Figure 4.7). In addition, a further 28,000 MT of drought-tolerant maize seed has been produced and distributed through the Drought Tolerant Maize for Africa (DTMA) project (Table 4.4) which is a collaborative endeavor involving 13 national agricultural R&D systems, CIMMYT and IITA (www.CIMMYT.org).
Figure 4.7 Volume of seeds produced by seed companies supported through AGRA’s Program for Africa’s Seed Systems
Sources: AGRA database 2014
20.000
40.000
60.000
80.000
100.000
120.000
140.000
160.000
180.000
2007
2.346
5.664 9.748
25.884
40.437
57.991
80.606
2.066 8.305
16.019
25.824
46.384
71.302
3.598 1.443
9.86615.717 11.011 9.304
2008 2009 2010 2011 2012 2013
Annual seed production
Existing seed enterprises
New seed enterprises
Several other organizations besides AGRA are also supporting the strengthening of the seed sector on the continent. For example, FAO supports enhanced national and regional capacities for seed delivery. Many countries have benefitted from interventions to develop seed laws and policies, and the harmonization of regional seed policies. The World Bank and IFAD also support the strengthening of national seed delivery systems. The African Union, through its Africa Seed and Biotechnology Program, also supports the SSA seed sector. A positive outcome of these interventions is a burgeoning seed sector that is characterized by increased involvement
of the private sector. Van Meele et al. (2011) reviewed that status of seed systems in nine African Countries: Cameroon, Gambia, Guinea, Kenya, Madagascar, Mali, Morocco, Nigeria and Uganda. Presented as a series of country case studies, this compendium showcases the country-specific combinations of private sector companies, publicly funded agencies, and family farms that are gainfully engaged in the production and/or distribution of quality seed and vegetative planting material. The lessons learned will be valuable in guiding future development of seed systems for the crops that sustain food and nutritional security in SSA.

138 | Africa Agriculture Status Report 2014
While it is expected that the volume of seeds marketed by the private sector in Africa will continue to grow as the scope of public sector involvement decreases, there are some food security crops grown by African farmers for which the production and marketing of seed and planting material may not be attractive to business, at least in the near future. An example is cassava. The planting material is bulky, can harbor
diseases and pests, and is difficult to store and transport. The role of national governments in getting clean planting material to farmers will therefore continue to be critical. This could also involve strengthening incentives for the private sector and civil society to produce and distribute planting material, and could involve the further strengthening of public sector seed services.
Table 4.4 Projected seed sale (‘000 t) of drought-tolerant maize varieties in five maize-growing countries of Southern African for 2016
PARAMETERS ANGOLA MALAWI MOZAMBIQUE ZAMBIA ZIMBABWESOUTHERN AFRICA
Total DT seed sale 2.25 6.91 2.6 5.32 11.44 28.54
MEGA-ENVIRONMENTS
Wet lowland 0.05 0.21 1.15 0.53 3.37
Dry lowland 0.43 0.90 0.79 0.4 3.66 5.88
Dry mid-altitude 0.70 0.03 3.09 3.37
Wet low mid-altitude 0.50 1.80 0.37 2.45 2.06 7.19
Wet upper mid-altitude 0.56 3.46 0.26 1.86 2.52 8.11
Highland 0.02 0.55 0.03 0.11 0.63
ALTITUDINAL CLUSTERS
Lowland 0.47 1.11 1.94 1.01 3.66 9.25
Midland 1.76 5.25 0.66 4.31 7.66 18.67
Highland 0.02 0.55 0.03 0.11 0.63
Source: DTMA Highlights 2012/2012
Next Generation of Leaders for Crop Improvement in Sub-Saharan AfricaAfrica needs a continuous injection of new generations of crop scientists, including plant breeders and geneticists to develop high yielding, adapted and climate resilient varieties preferred by smallholder farmers. Fifteen universities in sub-Saharan Africa have been supported by AGRA through generous funding from the Bill & Melinda Gates Foundation to upgrade their faculty, curriculum, and teaching and research facilities into centers of academic excellence devoted to the training of plant breeders
and geneticists at the MSc and PhD levels. The African Centre for Crop Improvement (ACCI) and West African Centre for Crop Improvement (WACCI), respectively, have between them graduated 74 PhD students in plant breeding and genetics over the past seven years. The other 13 MSc regional training programs have graduated 158 students in plant sciences. These new graduates are actively engaged in the development of improved varieties for the varied agro-ecologies and farming systems of different countries in Africa (AGRA Database, 2014) and have to date released 104 varieties of a wide range of crops including maize, rice, sorghum, finger millet, cowpea, beans and , sweet potato. Efforts should be geared towards both sustaining this innovative program and replicating it in other crop improvement disciplines and countries in Africa.

Africa Agriculture Status Report 2014 | 139
Box 4.3 Seed system fit-for-purpose checklist
A seed system is effective when it is fully responsive to the needs of growers. The following questions may be posed of a seed delivery mechanism to deduce whether it is fit-for-purpose:
Is there:
1. A continuing pipeline of new, well-adapted crop varieties being developed?
2. A functioning crop variety testing, registration and release system that injects suitable new varieties into the seed delivery mechanism?
3. An established mechanism for the uptake of R&D outputs, including the production of breeder and foundation seed?
4. A statutory national seed service or, in its stead, private sector entities that provide effective quality control for seed production to ensure that farmers are supplied with seed and planting material of adequate quality?
5. Local seed enterprises that produce high-quality seed and planting material that farmers can purchase?
6. An enabling environment for the development of the seed industry through appropriate legislation and policy, especially in order to establish and enforce regulatory mechanisms, spur innovation and encourage investments in R&D?
Source: C. Mba, 2014
Future PerspectivesWhile the prognosis is that the effects of climate could impact negatively on the already precarious food production systems of sub-Saharan Africa, there is also ample evidence that enhancing farmer access to high-quality seed and vegetative planting material of varieties that are well-suited to local farming systems and agro-ecologies could improve the adaptive capacity of cropping systems. The significant investments made over the years in crop improvement are resulting in the availability of a suite of well-adapted, more robust improved varieties across the continent. A number of these varieties are already contributing to the resilience of cropping systems. Clearly, major constraints still hinder farmer access to seed and planting material of the most suitable varieties, but a combination of formal and informal seed delivery mechanisms, underpinned by responsive crop improvement programs, is ameliorating the situation. To sustain and build upon these gains, it is imperative that investments in the following continue to grow:
1. Approaches that integrate the strengthening of seed systems into overarching sustainable crop
production intensification strategies as part of climate change adaptation mechanisms.
2. The re-orientation of plant breeding goals and programs to emphasize enhanced climate change adaptation. For instance, the trend of targeting elevated tolerance to biotic and abiotic stresses, in addition to increased yields, should be encouraged. The chances of success would be greatly improved through by broadening the genetic base of breeding materials, and by using more efficient breeding techniques.
3. Strengthened seed delivery mechanism that target smallholder famers. For example, governments should create enabling environments for the continued involvement of private seed companies and the fostering of effective public-private partnerships to drive the generation of suitable varieties and effective seed systems.
4. Strengthened human and institutional capacities for crop improvement and extension services, so as to have in place the requisite research and development community to drive innovations that could produce climate-resilient crop varieties.

140 | Africa Agriculture Status Report 2014
Output MarketsThis section examines the nexus between climate change and food markets in Africa and provides a forward-looking perspective on how Africa should respond. The first step is to identify plausible pathways through which climate change is affecting (or is likely to affect) food markets, both from a global and African perspective. How markets in Africa can adapt to these forces and pressures is then considered, before providing recommendations that can help African governments better prepare for climate change impacts on local food markets.
Climate Change and Food Markets NexusIncreasing volatility in global food production and prices – A number of studies project higher and more variable average world food prices resulting from increasingly erratic food production due to climate change. This situation will be compounded by rising demand due to population growth, rapid urbanization, and income growth in developing countries resulting in greater demand for higher protein diets (meat, milk and eggs). Protein-rich diets rely on grain for livestock and dairy production, and thus exert more pressure on grain markets, especially for maize and soybeans. To meet this growing demand by the year 2050, FAO estimates that global agricultural production should increase by 70%, a goal that is likely to be disrupted in highly unpredictable ways by climate change. Rising demand for additional protein in diets, coupled with the use of unsustainable agricultural production methods to meet rising food demand, are likely to exacerbate anthropogenic emissions. The challenge for Africa is how to creatively respond to more unstable world food markets while ensuring maximum emission reductions from agriculture. Simply put, Africa must reconcile achieving household food and nutritional security while reducing anthropogenic emissions from agriculture.
Rising global cost of energy – An issue that has not received a lot of attention is the impact of rising energy prices on global food trade and how that will alter Africa’s comparative advantage in grain production. If world energy prices continue to rise, the cost of transporting grain from global markets to Africa will gradually increase and push world grain prices up, as transport costs are a major component of global food prices. These increases will likely widen the wedge between world market prices and those of inland African markets. They will also increase the value of agricultural land in Africa, more quickly encourage the development of land markets, and push Africa’s production systems towards more self-provisioning of food for growing urban areas rather than
relying on unpredictable world markets. However, for the latter to happen, African governments would need to increase their investments in agriculture, especially in more productive and sustainable production technologies; investments would also be needed in storage facilities and other complementary marketing infrastructure to accommodate additional production.
Connected to rising energy costs have been the large-scale uses of food commodities in biofuel production and the substitution of land away from grain production towards biofuels. For example, grain surpluses in major producing countries (such as the USA and Brazil) are rapidly being absorbed in biofuel production (Rosegrant, et al., 2008; Classman, 2007; Gill and, 2002; Mueller et al., 2011; Abbott et al., 2011). This has added to the demand for grain amidst more erratic weather patterns, thereby contributing to higher world commodity prices.
Climate change and geo-food politics – Supply of food within a country is, among other things, a function of the quantity produced domestically, market access conditions, and the price of imports (which is a function of global demand and supply). However, the demand for basic food in Africa is highly inelastic, which means that small negative changes in surpluses marketed locally and/or import disruptions due to weather shocks will result in immediate increases in local food prices. To fill gaps in supply a country would need to rely on regional and global markets. However, with similar disruptions in production also happening at regional and global levels, grain-deficit countries would likely have difficulty in filling food gaps and thus experience higher food prices.
Since the 2008 food crises, the world has witnessed an increase in geo-food politics, as major grain-producing countries impose export restrictions without regard for the needs of countries that rely on them for food imports. In general, we have seen governments of major grain-producing countries act in the interests of their own counties in order to secure food supplies for their populations at the expense of consumers in other countries. A good recent example is what happened with global wheat prices. Crop failures in Russia, Kazakhstan and Ukraine (major wheat producers accounting for about a third of total production) led to a surge in wheat prices in 2010/11. This was because Russia imposed a ban on grain exports, resulting in panic buying by importers from North Africa and the Middle East, thereby pushing up global wheat prices. Another example would be the ad hoc maize export bans that were imposed in East and Southern Africa in response to weather and/or global grain supply shocks, with no regard of the food needs of neighboring countries. One might expect that a continuation of such behavior will motivate many countries to reduce their dependence on world markets

Africa Agriculture Status Report 2014 | 141
for food and drive them towards food self-sufficiency. This trajectory would encourage governments to invest in bigger buffer stocks or strategic reserves and to intervene in markets in an attempt to stabilize local prices.
These developments may of course be mitigated by consumer income growth. Increasingly volatile food prices may be less politically sensitive if food constitutes an increasingly small portion of consumer incomes. While this has generally been the trend over the past several centuries, the unpredictable nature of climate change and man’s ability to mitigate or adapt to it make very unclear whether the coming decades will see a continuation in the trend of food comprising an ever lower share of consumer expenditures and incomes in developing countries.
More frequent droughts and floods in Africa – The supply of food within a country is, among other things, a function of the quantity produced domestically and the price of imports, which in turn is a function of global demand and supply. Although in some agro-ecological zones, farmers may be able to increase production due to the synergies between increasing rainfall and warmer temperatures, many will struggle to maintain existing levels of production. Also, the number of people who reside along the coasts has been increasing in Africa by about 4% per year (Hinrichsen, 1999), especially in West and North Africa. Excessive rains leading to flooding, especially in such coastal environs as Maputo, Mombasa, Accra, Lagos and Dar es Salaam, has been shown to increase the number of people needing food assistance as the number of refugees increases with bad weather. While food may be available in the country, the disruption of transportation systems may hinder its effective delivery. Local food systems must be able to adapt to such shocks, and there may be need to have more strategically located buffer stocks.
Unlike temperate regions that may experience increased crop yields due to anticipated mean temperature increases, Africa is projected to witness large crop yield losses, second only to Asia. With the exception of some projected positive gains in East Africa, where rising temperatures should benefit grain production, most of sub-Saharan Africa’s food production systems are in tropical zones, making them particularly vulnerable to extreme weather events. The majority of rural Africans (more than 70% of the population) rely on rainfed agriculture for their livelihoods, and rural poverty remains widespread and persistent. These factors limit the continent’s capacity to adapt to the likely impacts of climate variability and change (Boko et al., 2007; Lobell et al., 2008; Thornton et al., 2009).
Africa’s changing agricultural production systems – The perception that Africa is land-abundant (Fischer and Shah, 2010; Hertel, 2011) is beginning to be challenged as the rising population in SSA is
gradually putting pressure on agricultural land, resulting in a decline in mean farm sizes, especially in densely populated areas (Jayne and Muyanga, 2012). Rising population is driving people to move from more densely populated areas to those with fewer people, in search of more and better land as well as jobs. This is propelling the rural to rural migration recently highlighted by Jayne et al. (2014). These dynamics are likely to open up new markets in Africa. If production costs and production variability can be kept relatively low, domestic marketing systems linking African farmers to consumers will provide a great opportunity to Africa. However, if they cannot, then African consumers are likely to face high and volatile food prices based on what is likely to be an increasingly unstable global market for food.
Conclusions and Recommendations There is no doubt that global food trade is one of the most important ways of cushioning local food supply shortfalls in any given country, but with more climate variability and frequent disruptions to global food trade, it may be prudent for African countries to realign their budgets and adequately fund their agricultural sectors in order to move towards self-sufficiency. Trade will remain important, but with the increasing tendency of some major grain producers to impose ad hoc export restrictions in the face of disruptions in production, often with little or no regard for the needs of importing countries, food self-sufficiency may be increasingly necessary in the long run.
The anticipated rise in the cost of food imports due to more frequent global production disruptions and rising energy costs are likely alter the economics of food procurement in ways favorable to local production. Countries should prepare for this eventuality by encouraging productivity growth through the widespread adoption of sustainable, climate-smart production practices. Garnett et al., (2013) recommends that countries should put in place policies supportive of sustainable intensification in order to meet the challenges of increasing demand for food from a growing global population and climate change.
There is also an urgent need to encourage market development to deal with prevalent market failures in Africa. This requires governments to realign their budgets to reflect these objectives by increasing their commitment to investment in public goods that support agricultural growth, such as: road, rail and port infrastructure; irrigation facilities to promote dry season farming; storage and processing facilities; research and development; agricultural extension systems; market information systems; and various institutional changes (Battersby, 2012; Godfray et al., 2010). Such investments will go a long way towards enhancing Africa’s ability to deal with climate shocks.

142 | Africa Agriculture Status Report 2014
In sum, African governments should take a holistic approach to tackling the effects of climate change on food markets. Appropriate policies should be devised and implemented that provide incentives for farmers to strengthen local production systems and the potential for greater food self-sufficiency. In addition, countries need to embrace and promote climate-smart technologies,
use more advanced market instruments for ensuring food security (such as futures contracts), and establish sensibly sized buffer stocks. Finally, governments in sub-Saharan Africa need to put in place consistent and more robust policies that foster the growth of private markets, and in this way attract private investment capital that can complement the investment of public resources.
Climate Change and Land Tenure Systems Agricultural land supports hundreds of millions of people in Africa. It is critical a resource for food and an essential safety net for the rural poor during times of economic instability (FAO, 2010). Land ownership and access have significant implications for agricultural productivity and tenure security in Africa. It is now well known that land tenure insecurity is a critical constraint to improving agricultural productivity and reducing poverty. For many African households, land is a critical resource. In addition to its value for agricultural production for subsistence and exchange incomes, land also provides such basic household needs as wood fuel, organic fertilizer, medicines, housing materials and game meat (Namubiru-Mwaura and Place, 2013).
Land availability and the structure of farming in Africa Out of an estimated total land area of 635 million hectares in SSA, 183 million hectares are under cultivation, while approximately 452 million hectares (about 71%) of additional arable land is uncultivated
(FAO, 2012). Smallholders account for a sizable share of agricultural production and in many instances their contribution is growing. For example, in Kenya, Tanzania, Ethiopia and Uganda, over 75% of total agricultural output is produced by smallholder farmers, those with average farm sizes of about 2.5 hectares (Salami et al., 2010). Uncultivated land could play a critical role in climate change adaptation if backed by secure land ownership and access.
In the last decade, there have been significant changes in the structure and character of African farming. Land access and size of holdings have been affected by growing rural population, changes in infrastructure and market access, rapid urbanization, diversification of rural incomes and activities, investment in new crops and species, and new land policies in some countries such as Ethiopia and Rwanda (Namubiru-Mwaura and Place 2013). These changes, coupled with climate change, will have significant implications for such climate-sensitive systems as agriculture and forest ecosystems.
In most of SSA countries, population pressure and climate change have resulted in two trends: 1) an expansion of land under agriculture (including rangeland and pastures) and 2) a reduction in the average farm size. While rural
Table 4.5 Land-to-person ratio (10 year average) in selected countries SUB-SAHARAN AFRICA 1960-69 1970-79 1980-89 1990-99 2000-09 2010-13
Ethiopia 0.508 0.450 0.363 0.252 0.16 0.16
Kenya 0.459 0.350 0.280 0.229 0.14 0.13
Mozambique 0.389 0.367 0.298 0.249 0.22 0.21
Rwanda 0.215 0.211 0.197 0.161 0.11 0.11
Zambia 1.367 1.073 0.896 0.799 0.26 0.28
Zimbabwe 0.726 0.664 0.583 0.525 0.32 0.31
Source: FAO (2013)

Africa Agriculture Status Report 2014 | 143
population growth in SSA has declined over the past decades from about 2.2% in 1980 to about 1.7% in 2010, the growth rate is still positive and thus contributing to increased demand for land (World Bank, 2013).
Data from FAO (FAOSTAT) indicate that area under agriculture has expanded in most SSA countries and that land to person ratio is decreasing rapidly (Table 4.5) (FAO, 2013). In the case of the Sahelian countries of Mali, Burkina Faso, and Niger, the change in area has been about 20% between 1990 and 2009. In Table 4.4, note that the ratio of land to persons has greatly decreased, with Zambia and Kenya showing the highest change in the ratio (above 70%).
Land Tenure Systems in SSALand tenure in much of Africa is often categorized either as customary/traditional, or state/statutory2. In reality however, the neat distinction between these two models of land tenure is blurred. It is not uncommon to find a range of customary, statutory and hybrid institutions with de jure or de facto authority over land rights co-
existing in the same place, a phenomenon referred to as ‘legal pluralism’. Different land tenure systems have advantages and disadvantages, as shown in Table 4.6.
The existence of legal pluralism is a critical, defining feature of African land tenure. The lack of clear hierarchy or other form of coordination among the different regimes creates confusion and has resulted in land tenure insecurity in many countries. The last few decades have seen changing land use and land ownership patterns that in most cases have not been accompanied by proper reforms and/or implementation of policies and laws (Adam and Turner, 2005; Unruh, 2005).
Lack of clarity around the ownership of trees and land tenure security in SSA is ubiquitous. Tenure insecurity can also be evidenced in the short duration of rights, as in the case of land borrowing, sharecropping or renting. It can also be observed in the lack of clarity of rights and is expressed in numerous conflicts over inheritance, other land transactions, sharing of resources, and boundaries. Furthermore, the lack of formal certificates or titles is one of the barriers preventing smallholders from using land as collateral for accessing formal credit.
Table 4.6 A typology of the main land tenure systems in SSA LAND TENURE SYSTEM DESCRIPTION PROS/CONS
Statutory Public tenure systems – the state assumes responsibility for ensuring access to secure land.
Can be riddled with bureaucratic inertia, inequity in accessing land and corruption. The poor and vulnerable may have access to land but do not have tenure security because the government can expropriate the land at any time.
Private tenure systems vest ownership in the hands of individuals, companies or non-governmental organizations.
May in principle be transparent and efficient if backed by effective land governance and administration frameworks, but may result in land being accessed by only the elite and influential people. Most rural women cannot afford to buy land.
Customary Land Tenure Refers to the communal possession of rights to use and allocate agricultural and grazing land by a group sharing the same cultural identity. A single person usually administers on behalf of the group.
Customary tenure may result in access to land by most individuals in a community; it can be influenced by commercial pressures that erode social cohesion, from which the system derives its legitimacy. Some customary norms discriminate against women.
Hybrid Systems Several tenure categories co-existing on the same piece of land. For example, formal and informal rights may exist for the same holding.
May result in access to land by most individuals in a community but may not enjoy full legal status. Riddled with land tenure insecurity.
Source: FAO, 2013
2. Customary land tenure is characterized by its largely unwritten nature, is based on local practices and norms, and is flexible, negotiable and location specific.

144 | Africa Agriculture Status Report 2014
Addressing climate change issues under these land tenure systems is problematic given the fact that in many SSA countries, and indeed in other parts of Africa, there is a notion that tree planting signifies a claim to land; this prevents the landless from adapting mitigation
measures associated with tree planting (Box 4.4). Afforestation and reforestation projects that require the planting of trees encounter serious problems due to perceived changes in land rights associated with tree planting.
Box 4.4 Tree tenure and climate change adaptationPhiri has been planting the tree Faidherbia albida in his corn, cotton, and tobacco fields in Zambia. This tree has several benefits, including: nitrogen fixation, carbon sequestration, increased food security, and mitigation of the negative impacts of climate change.
Despite its benefits, the uptake of F. albida, which takes 8-12 years to yield benefits, has been slow in Zambia due to tenure insecurity. Like many farmers in the customary systems of Zambia, Phiri has no documentation of his rights to his farmland.
In 2012, the headman allocated Phiri’s land – which he had planted with Faidherbia trees – to a new settler, without compensation. Phiri contested the decision, but the Chief ruled in favor of the new settler. Phiri logged an appeal arguing that he had invested time and money in the trees on the land.
After the appeal, the Chief ultimately decided that the new settler must plant an equivalent number of Faidherbia on Phiri’s other lands and care for them for three years, or the settler will lose the originally allocated plot back to Phiri. Although under the Zambian Constitution the President owns all trees, in local communities the perceived ownership of trees is ambiguous.
Source: USAID, 2014
Statutory versus customary land tenureOne of the main land tenure problems in SSA is the apparent disconnect between statutory land tenure and customary, or informal, land tenure. In many rural areas, the notion of owning land is based on occupancy, use, lineage, and other inborn rights. However African governments often ignore customary tenure systems and regard such areas as part of the public domain, while at the same time lacking the capacity to enforce these claims or to address problems resulting from the claims (Evers et al., 2005) This disconnect has not only compromised development, but has also resulted in low agricultural output (Okoth-Ogendo, 2000). To date in many African countries, the government continues to own a large portion of valuable land even though evidence has shown that this is conducive to mismanagement, underutilization of resources, and corruption. In addition to state ownership of land, tenure insecurity can also be made manifest in the weak assurance of rights, as is faced by migrants in many areas of Africa and very often by women, especially widows.
The dominance of different land tenure systems varies across SSA. For example, customary land rights are dominant in Mali, Zambia, Malawi, Ghana, Burkina Faso, Niger, and in some part of other countries, such as Sierra Leone, Liberia, Nigeria, Tanzania and Mozambique. The common assumption is that customary systems are an impediment to agricultural growth, because it is difficult for famers under these systems to access formal credit and input markets. However, there are several arguments that these systems offer many opportunities to poor households in rural Africa. In countries where customary land tenure exists, it is not uncommon for national land policies and laws to have little relevance on how land is accessed and/or utilized. Instead, land governed under this system is usually accessed through complex social relations governed by local institutions (Knight, 2010). Under customary tenure, land tends to be traditionally held collectively by lineages or families, and in many cases with complex systems of multiple and overlapping rights (Namubiru-Mwaura et al., 2012). Verbal records of these rights are sometimes safeguarded in the memory of local elders.
Opponents of customary land tenure systems, on the other hand, argue that these systems are not inherently egalitarian. They are usually biased against women and

Africa Agriculture Status Report 2014 | 145
favor the rich and powerful, as has been witnessed in Ghana, Liberia, South Africa and Uganda. Moreover, governments can easily abuse these systems because of their lack of legal grounding. Given the importance of customary institutions in rural areas, approaches that harmonize customary and statutory systems need to be put in place to resolve competing claims over resources without disenfranchising vulnerable groups.
Many countries in Africa, including Botswana, Ghana, Malawi, Mali, Mozambique, Uganda and Tanzania, land
policies now support the idea of legally strengthening customary land tenure. Many recent laws protect customary land rights and provide for or allow their registration. Examples include: Uganda’s Land Act 1998 and subsequent amendments; Mozambique’s Land Act 1997; Tanzania’s Land Act and Village Land Act 1999; and Namibia’s Communal Land Reform Act 2002, to mention a few. See Box 4.5 for examples of policy reforms that targeted land tenure problems. Even with these reforms, not all land tenure issues have been addressed in these countries.
Box 4.5 Addressing land tenure problems through policy reformsIn Botswana, the Tribal Land Act (1968) established a system of regional land boards and transferred the land administration and management powers of customary leaders to the boards. The boards included both customary leaders and state officials. Customary practices of the Tswana peoples were also codified and customary land rights elevated to national legislation. The holders of customary rights for residential and plowing purposes enjoy a variety of rights guaranteed by customary land grant certificates, which are both exclusive and heritable. Those granted customary rights are entitled to a certificate of customary land grant. According to the Tribal Land Act, once these rights are acquired they cannot be cancelled without just cause.
In Mozambique, the Lei de Terra (1997) allows anyone living or working on land for 10 years in good faith to have automatic de jure rights of use and benefits relating to the land in question; the law also allows community land to be registered, thereby formalizing communal customary rights. Furthermore, community members may continue to administer and manage their lands under customary land tenure, as long the practices do not contravene national constitutions.
In Ethiopia joint titling was introduced in 2003. Joint titling is believed to help guard against capricious action by one spouse, and protect against the dispossession of women through abandonment, separation, or divorce. As of March 2010, the joint certification program had registered a majority of rural land in the densely populated regions of Amhara (87%), Oromia (85%), SNNP (84%), and Tigray (97%). Recent findings show a modest positive effect of certification on female agricultural productivity, and is also said to have improved household welfare, particularly for female-headed households, and to have reduced land-related conflicts.
Source: Namubiru-Mwaura, 2014
Challenges Arising from Land Tenure Systems for Climate Change Mitigation and Adaptation in SSAAlthough it is difficult to establish direct linkages between climate change and land tenure, it is clear that climate change will affect land use and adaptive interventions that are in turn dependent on land tenure systems. Land policy and tenure systems need to provide for adequate
tenure security, in order to provide incentives for good land and resource management and reduce smallholders’ vulnerability. Furthermore, land tenure systems need to provide sufficient flexibility to allow the adaptation of land rights to evolving land uses and increased demand for land; human displacement and migration, as well as associated growth in land competition and land use conflicts can be expected as a result of climate change.
Climate change will have impacts on: land access and redistribution; urban settlement; the governance of land resources; the reform and development of land institutions; management of common property resources; and land use regulation and environmental protection

146 | Africa Agriculture Status Report 2014
Table 4.7 Climate change and land-related impacts, risks and policy implications
IMPACT TYPESPECIFIC LAND USE IMPACTS
HUMAN IMPACTS WITH TENURE IMPLICATIONS
LAND TENURE/ POLICY IMPLICATION RESEARCH NEEDS
Temperature rise
Initial increases followed by reductions in crop yields
Reduced food production and food security (in tropical regions); changes in land suitability for different crops; increased land competition and exits from agriculture
Tenure security for retention of land holdings investment in improved land use; land reallocation and access due to changes in land suitability
More detailed impact studies for main developing country arable crops and associated livelihood and production systems
Reduced rainfall and greater rainfall variability
Lower moisture availability for agriculture
Reduced food production and food security (tropical regions); increased land competition and exits from agriculture; competition for water use
As above; need for improved water resource management and strengthened governance of remaining productive areas
More detailed region and country impact studies and analysis of: existing adaptive systems; changing requirements for food security, research and extension, migration; options for diversification
Possible increases in rainfall
Possible increases in land and natural resource productivity
Unpredictable, with flood risks; may lead to new opportunities involving in and out migration and resource competition
Formal and informal institutions to manage mobility, land use and tenure change, and regulate conflict where new opportunities emerge
Impacts highly uncertain. Analysis of existing adaptive systems to variability in dry subhumid regions; systems for dryland water and flood management
Sea level rise and increased frequency of storm surges
Coastal and inland flooding; salinization of coastal lands
Urban and rural displacement and migration; declines and losses of coastal and riverine resource and livelihood systems
Greater tenure security to facilitate adaptive management; resettlement and facilitated migration; compensation for land loss; improved land inventory; land sharing and release schemes
More detailed country and regional impact studies; assessment of land availability, resettlement and policy options
Biodiversity loss
Extent and diversity of natural ecosystems
Threats to hunting and gathering and extractive livelihood systems Increased pressures on particular species and ecosystems
Better governance of common lands; conservation of genetic resources and indigenous knowledge
More detailed impact studies linked to assessment of socioeconomic and livelihoods impacts for NR dependent groups
Modified from: Quan and Dyer 2008
(see Table 4.7 for different scenarios). Moreover, it is likely to result in increased land conflict and the potential demands for settlement generated by mass displacement resulting from the growth of natural calamities and, potentially, civil conflict.
Addressing the impacts of climate change on land tenure systems will require mainstreaming of climate change adaptation into national planning and policy frameworks. In some SSA countries, such as Malawi, land policies are being debated and subjected to ongoing processes of reform, which presents an opportunity to ensure that land policies reflect
consideration of likely future demands imposed by climate change.
Farmers need to have assurances that they will be able to work their land under a given certificate of ownership, or a legally recognized long-term lease. It is this assurance that enables them to justify longer-term investments in their land and their farming operations. Moreover, banks require such assurances when farmers ask for credit. Land tenure security is also an important prerequisite for households farming irrigated plots, and for producers wishing to invest in diversification and intensification programs in their communities.

Africa Agriculture Status Report 2014 | 147
Implications of Climate Change for Land Policy in SSAEfforts to address climate change in relation to land tenure will rest on the same principles of good land policies and governance that are widely recognized and promoted by policy makers and international development agencies.
Secure land rights under different land tenure systemsAs explained above, insecure land tenure hampers both local and foreign investment in agriculture and climate change mitigation because of the perceived risks involved when property rights are uncertain. Insecure tenure arrangements create disincentives for people to invest in adaptation activities and to invest in land. The more affluent are better able to benefit from climate change adaptation and mitigation. High quality plots and dwellings with formal tenure are generally unaffordable to the poor in the absence of targeted programs that benefit them directly. Poor people may not be able to introduce and enforce controls and regulations required to manage the resources in their community, resulting in the proliferation of dense informal dwellings.
Unless this trend is changed, it could potentially impact agricultural productivity and growth, and could lead to increased food insecurity because of disincentives for both small- and large-scale farmers to invest in their businesses. Policy makers need to put measures in place that will not only improve access to land but also security of tenure. Where land administration institutions exist, many face serious challenges of insufficient funding, equipment and staff capacity. While good laws and policies will increase opportunities to access, control, and own land, it is important to have appropriate land administration institutions to implement them. Governments should support institutional improvements. An obvious key to success is the willingness of counterpart agencies to embrace the proposed changes in their institutional operations. Affirmative action programs may also be needed to ensure that the very poor will be able to participate in and benefit from the interventions.
In many cases, governments will need to accelerate the provision of secure tenure arrangements to enhance the capacity of households and communities to adapt to the impacts of climate change. This could involve rolling out low-cost programs of tenure regularization and formalization, especially in areas that are likely to suffer impacts on food production or face growing
land competition. Other measures that can strengthen land tenure include group titling or joint management frameworks involving local communities. To respond to these challenges, a number of African states have adopted new policies and laws aimed at restructuring land relations. The models and approaches being used vary greatly, especially in relation to the nature of local-level institutions in the country. While some countries have made great progress in improving land tenure security, efforts by others have been hindered by historical, social, economic and other institutional factors.
Policy makers also need to recognize and appreciate a diversity of tenure systems, balanced with principles of social equity. Policy choices need not necessarily be between customary and statutory law. There are cases in which an integration approach would be more appropriate – building on customary institutions to establish forms of ‘hybrid’ tenure that are in line with constitutional provisions for democracy, human rights and gender equality. The challenge may lie in devising a menu of policy options that would fit the social, economic, historical and religious circumstances of the country in question.
Capacity building is also very important to the success of any efforts to address climate change and land tenure issues. Capacity building needs to be targeted at the right institutional level and could involve: legal literacy and empowerment; advocacy and intervention by government and civil society organizations to facilitate access by the poor to land distribution schemes; and active participation by community and residents’ associations and farmer organizations in planning for adaptation to climate change.
Several key stakeholders (including AGRA, the Land Policy Initiative (LPI) of the African Union/UNECA, and the Global Land Tenure Network, to mention a few) have facilitated, and will continue to expedite, policy reforms to ensure that farmers in Africa, particularly women, have secure access to and tenure of the land they work, so as to encourage investments in the land that are needed to achieve and sustain optimal productivity.
Land access for disadvantaged groupsFor adaptation initiatives to be successful, the poor and disadvantaged in communities need not only access to land, but also ownership rights. Recent studies show that in many countries, even though the land laws and policies mandate equality of men and women under statutory law, the institutions for land administration still discriminate against women, either explicitly or implicitly (FAO, 2010; UNHABITAT, 2008).

148 | Africa Agriculture Status Report 2014
Climate change mitigation and adaption will require measures to protect the poor and vulnerable from loss of livelihood resources. Governments will also need to develop opportunities for the poor to gain direct benefits as a result of climate change mitigation measures, in particular avoided deforestation. Women and other vulnerable groups are likely to be poor, with weak or restricted access to land and natural resource assets, and as a result have limited adaptive capacity. Throughout Africa, women have very limited rights to land. Although many countries have put in place statutory laws that are meant to ensure women’s access to land, yet such legislation is often poorly implemented in rural areas, if at all; customary land tenure is what governs land access and ownership. These important issues need to comprise a major part of the land reforms agenda. There will be a need to target women in the implementation of land policy reforms and climate change adaptation. These efforts will need to be backed by development of better legal frameworks for the regulation of adaptation and mitigation activities.
Equitable rental markets to improve supplies of landLand transactions and/or investments present opportunities for climate change adaptation through better allocation of land to those who can invest in it, access necessary finance, develop irrigation systems, create jobs, adopt new technologies, and increase food security (Unruh, 2008). African governments are increasingly keen to reform policies and regulations that will improve the functioning of rural land markets. They are simultaneously concerned about the risks to the poor or other vulnerable groups of losing one of their main assets through sale. If improvements in land transaction markets are to be achieved, and farmers to benefit from them and from adaptation efforts, there is a need for complementary actions to safeguard their land rights. The need for effective land administration, with acceptable mechanisms for purchase, compensation, and rights of appeal cannot be overemphasized.
Given the fact that different countries in Africa have different histories, environments and cultures, land reforms need to be carefully tailored to local circumstances. New institutions should build on existing customs, as well as the growing body of sound, innovative local practices. Improving land markets and climate change adaption will require building on structures that already exist in local communities, such as customary authorities, community-based institutions, local governments, and other bodies. These may be less costly and more effective in places where the people accept them as legitimate compared to new, untrusted, and not easily understood structures.
Another land policy implication is the need for resettlement planning and a stronger role for the government in land use planning in areas at risk and available for resettlement (Quan and Dyer, 2008). This will require investment in land inventory and land occupation surveys, both in potential resettlement areas and areas at risk of loss, which in turn will require development of dedicated land information systems. Public land acquisition may be needed to impede occupation in at-risk areas and for resettlement, but this is also likely to require schemes for land sharing or release from private ownership, and to promote land rentals and the good use of available public land. In many cases provision of small-scale house and garden plots may be the only options, given high population densities and intense competition for land, and resettlement will need to be accompanied by employment generation and diversification out of farming and dependence on natural resources.
Improved governance in land administration and effective land use regulationLand governance systems that provide improved access and rights to land resources are very important. In some situations, particular individuals or groups may have difficulty accessing land and land markets, which limits their opportunity to acquire rights and use them (Namubiru-Mwaura, 2014). Providing secure access is an important precedent to providing clear, secure and negotiable rights. Policy reforms should be followed by periodic multi-stakeholder reviews that foster dialogue between different stakeholders.
In addition to developing appropriate policies and laws, policy makers in Africa need to ensure the correct implementation of these instruments in order to be able to intervene in land relations in their countries (Deininger and Alemu, 2011). As shown in this report, policy implementation is still problematic. In some countries for example, the implementation of land tenure reforms has been hindered by lack of human and financial resources, which constrains the establishment of appropriate institutions to govern land use. Furthermore, while in some countries legislation is well crafted, the reality on the ground is very different. Women continue to face discrimination when it comes to land, due to sociocultural norms and practices that are often entrenched within the social fabric. It is not uncommon to find that land legislation is not well implemented because state institutions are unable to access rural areas due economic, geographic and linguistic factors. Implementation therefore remains a key concern for land-related activities in Africa.

Africa Agriculture Status Report 2014 | 149
In addition to improving and making land policies ‘climate-smart’, there will be a need to integrate land policy measures into National Adaptation Programs of Action at national and sub-national levels (Quan and Dyer, 2008). All adaptive efforts need to be mainstreamed into national development policies and poverty reduction strategy frameworks, and into government and international agency planning as a whole. Furthermore, when crafting new reforms, policy makers need to carefully consider costs (both financial and time) before reforms are commenced. Long-term budgetary commitments are needed from governments and donors.
ConclusionClimate change cannot be tackled effectively without addressing land tenure and property rights systems. Political will to do so at both the national and local levels is crucial. The rights of local stakeholders to participate in the governance of land and forests and share in the benefits from efforts to mitigate climate change impacts must be clearly defined to ensure that they benefit from investments in mitigation programs. Local stakeholders whose rights and claims are not adequately considered may continue to practice land uses that ultimately negate any additional benefits from climate change mitigation and adaptation.
Policy and Governance – Agricultural Policy Frameworks and Processes for Climate Change Adaptation Governance of natural resources, as well as the development of appropriate technologies for the sustainable management of the natural resource base and the production systems it supports are imperatives for ensuring resilience to the challenges of climate change. By 2020, it is estimated that up to 250 million Africans will experience water stress due to climate change. The Africa Adaptation Gap Report (2013) indicates that Africa will have to face very significant adaptation costs, estimated at US$ 7-15 billion per year by 2020. Elsewhere in this report, it is noted that global surface temperatures are expected to rise by an average of at least 1.5°C by 2050, which is likely to have severe impacts on agricultural productivity, especially in places like SSA, where the capacity to adapt to climate variability and change is limited. The adaptation challenge is likely to be much greater if GHG emissions are not reduced significantly, and if mitigation efforts beyond 2020 fall short of the objective to limit surface temperature increases to well below projected levels.
In addition to the identification of existing indigenous technologies and practices, such as the Zaï for water harvesting in the Sahel (see case study, Chapter 5) and key varieties and breeds that have been selected over generations, new technologies have been and are being developed that could help the millions of Africans escape the adverse impacts of climate change. For example, the International Center for Soil Fertility and Agricultural Development (IFDC) has improved nitrogen fertilizer efficiency and increased rice yields from deep placement of urea in West Africa; and plant breeders at
AfricaRice have identified several traits in rice breeding materials that contribute to drought tolerance, including some found in the indigenous African rice Oryzae glaberrima (Rhodes et al., 2014).
However, the need for an enabling governance and policy system is imperative not only for development of technologies and innovations, but also for their successful adoption and effective use. There is a growing realization that indigenous knowledge, technologies, and practices could contribute significantly to meeting the challenges of climate change. Yet their widespread use is limited by the lack of an enabling policy environment. The nexus between agricultural research, improved technologies and practices, and policy is a key determinant of the resilience of the agricultural sector to climate change, and the sector’s ability to become more productive and support economic growth and development, poverty reduction, and the improvement of livelihoods3.
The major obstacle to integrating climate issues into development activities in Africa has been and still remains the lack of appropriate institutions to facilitate incorporating science into policy.4 Over the last few years, Africa’s negotiating position on climate change has been guided and coordinated by the African Union Assembly, the Committee of African Heads of State and Government on Climate Change (CAHOSCC), the African Ministerial Conference on the Environment (AMCEN), and the African Group of Negotiators (AGN). Moreover, the Regional Economic Communities (RECs),
3. (http://www.uneca.org/acpc/pages/agriculture-and-climate-change).
4. http://www.uneca.org/acpc/pages/adaptation

150 | Africa Agriculture Status Report 2014
as well as the New Partnership for Africa’s Development (NEPAD), have developed strategies for climate change adaptation for their respective regions and the continent, respectively. National governments have developed National Adaptation Programs of Action (NAPA) and National Adaptation Plans of Action, as the case may be. However, a key limitation of these initiatives is their inadequate consideration of science-based evidence, which is a result of weak linkages between researchers and policy makers. Therefore, the development of reliable scientific evidence to inform policy on climate change adaptation, as well as institutionalizing effective dialogue between researchers and policy makers, is crucial to support adaptation to climate change in Africa.
Policy FrameworksThe proliferation of national, regional and continental level plans for coping with climate change in Africa is both a positive and a negative circumstance. It provides scope for establishing a national, regional and continental framework continuum for climate change adaptation. However, the divergence in the level of development of various countries and, in effect, the regions, coupled with disparities in commitment to mainstreaming climate change into national development plans, is undermining achievement of potential gains from coordinated efforts to adapt to climate change across the continent.
The African Ministerial Conference on the Environment (AMCEN), which is a permanent forum where African ministers of the environment discuss mainly matters of relevance to the environment of the continent, was established in December 1985 when African ministers met in Egypt and adopted the Cairo Program for African Cooperation. The mandate of AMCEN includes providing advocacy for environmental protection in Africa and ensuring that agricultural activities and practices meet the food security needs of the region. The 12th Session of the Assembly (February 2009), emphasized the need for international climate change negotiations to give Africa an opportunity to demand for compensation for damages caused by global warming (AMCEN, 2008). The lack of shared commitment to collaborate beyond national interests in favor of regional and continental interests is a challenge to galvanizing a common frontier to demand compensation for damages caused by global warming.
The African Union (AU), in its February 2009 Summit, made a landmark decision for building a common Africa position in preparations for the global climate change conference in Denmark, Copenhagen (December 2009), and for Africa to be represented by one delegation that is empowered to negotiate on behalf of Member
States. Subsequently, at the 13th AU Assembly of Heads of State and Government, in Sirte, Libya (July 2009), the Assembly approved the Conference of African Heads of State and Governments on Climate Change (CAHOSCC), comprising the following countries: Algeria; the Republic of Congo; Ethiopia; Kenya; Mauritius; Mozambique; Nigeria; and Uganda; together with the Chairperson of the AU, Chairperson of AUC, and Chairperson of AMCEN. The country of the host of the Presidency of AMCEN serves as the Coordinator at the Summit level, while the President of AMCEN serves as Coordinator at the Ministerial level. The Chair of the African Group of Negotiators on Climate Change (AGN), who are climate experts elected at the UNFCCC Forum, serves as Coordinator at the Experts’ level. During the Third Conference on Climate Change and Development in Africa (CCDA III), organized in Addis Ababa, Ethiopia (October 21-23, 2013), Member States stressed the need to address climate change because it creates additional challenges for Africa, not only affecting the environment and eco-systems, but also economic prosperity, development, food security and, more generally, African stability and the security of its people. Climate change was recognized as a key driver of violent human conflicts on the continent through the forced migration of populations, rapid population growth and desertification, conflicts caused/exacerbated by water scarcity, competition over resources, the reduction in agricultural output, and increasing food prices.
Despite the potential threat of conflicts arising from its impacts, climate change has not been institutionalized as a security and governance challenge by the AU. The Peace and Security Council of the AU has, within the framework of the African Peace and Security Architecture (APSA), a broad mandate for supporting and facilitating humanitarian action in times of major climate-related disasters. Yet the operationalization of this mandate is nonexistent for reasons related both to lack of funds and (mainly) to the absence of serious consideration of climate change as a potential root cause of conflicts in Africa.
The environment initiative of the New Partnership for Africa’s Development (NEPAD) was launched at the inaugural meeting of the Implementation Committee of Heads of State and Government, held in Abuja, Nigeria (October 23, 2001). The goal of the initiative is to reduce poverty and environmental degradation and thereby ensure sustainable development on the African continent. The Comprehensive Africa Agriculture Development Programme (CAADP) is a framework for agricultural development activities across the African continent under the auspices of the African Union (AU). CAADP supports selected regional economic communities and AU Member States in implementing climate change adaptation strategies in the context of their agricultural development.5
5. (https://www.giz.de/en/worldwide/15891.html)

Africa Agriculture Status Report 2014 | 151
The African Climate Policy Centre (ACPC) addresses the need for greatly improved climate information for Africa and strengthening the use of such information for decision making. This is done by improving analytical capacity, as well as knowledge management and dissemination activities. The ACPC is an integral part of the Climate for Development in Africa (ClimDev-Africa) Programme, which is a joint initiative of the United Nations Economic Commission for Africa (UNECA), the African Union Commission (AUC), and the African Development Bank (AfDB). The ACPC serves Regional Economic Communities, governments and communities across Africa.6
In view of the fact that climate change largely transcends national borders, there is need to develop and foster a cohesive framework that accommodates national interests, which should feed into regional considerations and activities, and eventually into continental level planning. While national socioeconomic considerations should be reflected by regional and continental collaborative initiatives, it should be noted that the cumulative effects of neighboring countries actions regarding climate change are likely to have consequences for individual countries. This adds to the importance of working together not only to help mitigate the impacts of climate change, but also to control activities that may contribute to climate change, or lessen the effectiveness of mitigation efforts. It is worth noting that, even though there is a proliferation of climate change initiatives, particularly at the national level, there are also concerted efforts at the regional and continental levels (through the RECs and NEPAD) to coordinate Africa’s adaptation efforts. The work of the UNFCCC in supporting Least Developed Countries to develop NAPAs has been recognized by the RECs, as well as NEPAD, and initiatives are now underway to align these NAPAs with regional and continental perspectives, and to mainstream climate change into national development efforts. The African continent has embraced the call of the UN Secretary General for the formation of a Global Alliance on Climate-Smart Agriculture. The various regions under the auspices of the RECs are forming regional components of the alliance for Africa under the umbrella of NEPAD. The eventual establishment of regional and, in effect, a continental alliance will provide an appropriate framework for linking up with global initiatives in climate change adaptation for the benefit of Africa and Africans.
Policy Processes and ImplementationA common African voice is absolutely essential if Africa is to successfully demand compensation for the
growing adverse effects of global warming caused mainly by industrialized countries. In the recent past, the AU Assembly has adopted major decisions on Africa’s negotiation structure on climate change. There is increasing realization among the hierarchy of climate change stakeholders at the political level in Africa that the technical competence of the negotiators needs to be backed with political support at the highest levels to have the desired impacts at the global level. Also in a bid to ensure that the African voice on climate change negotiations makes the desired difference, it has been realized that the positions taken by the AU Assembly of Heads of State and Government need to be interpreted technically by the negotiators and translated into negotiating positions and texts. At the 13th AU Assembly of Heads of State and Government, in Sirte, Libya (July 2009) the AU Assembly authorized AU accession to the United Nations Framework Convention on Climate Change (UNFCCC) and the Kyoto Protocol. At the 22nd Ordinary Session of the AU held in Addis Ababa, Ethiopia (January 30-31, 2014), the Assembly applauded CAHOSCC and members for valued and continued commitment in leading Africa’s collective political engagement in global Climate Change negotiations; it also urged Member States to ratify the Doha Amendments to the Kyoto Protocol for the Second Commitment Period to enhance reduction of emission of GHGs.
AMCEN has continued to pay particular attention to the implementation of environmental conventions established in furtherance to Conventions established by the United Nations Conference on Environment and Development (Earth Summit) in 1992, such as the Convention on Biological Diversity and its Cartagena Protocol on Biosafety, the United Nations Convention to Combat Desertification, and the United Nations Framework Convention on Climate Change and its Kyoto Protocol. At its twelfth session held in Johannesburg, South Africa (June 10-12, 2008), AMCEN decided “...to create a comprehensive framework of African climate change programmes, bringing together existing and new intergovernmental decisions and initiatives and programmes in a consolidated manner...”, to be implemented at the regional, sub-regional, national and local levels (AMCEN, 2008). At its 14th session, held in Arusha, Nigeria (September 12-14, 2012), AMCEN requested the legislative bodies of the regional economic communities of Southern African Development Community, East African Community, Economic Community of Central African States, Economic Community of West African States, and other related institutions to support national parliaments in the implementation of Multilateral Environment Agreements.
The conference went further to identify three broad areas of work for adaptation, including: disaster reduction and risk management; sectoral planning
6. (http://www.uneca.org/acpc-0/pages/about-acpc)
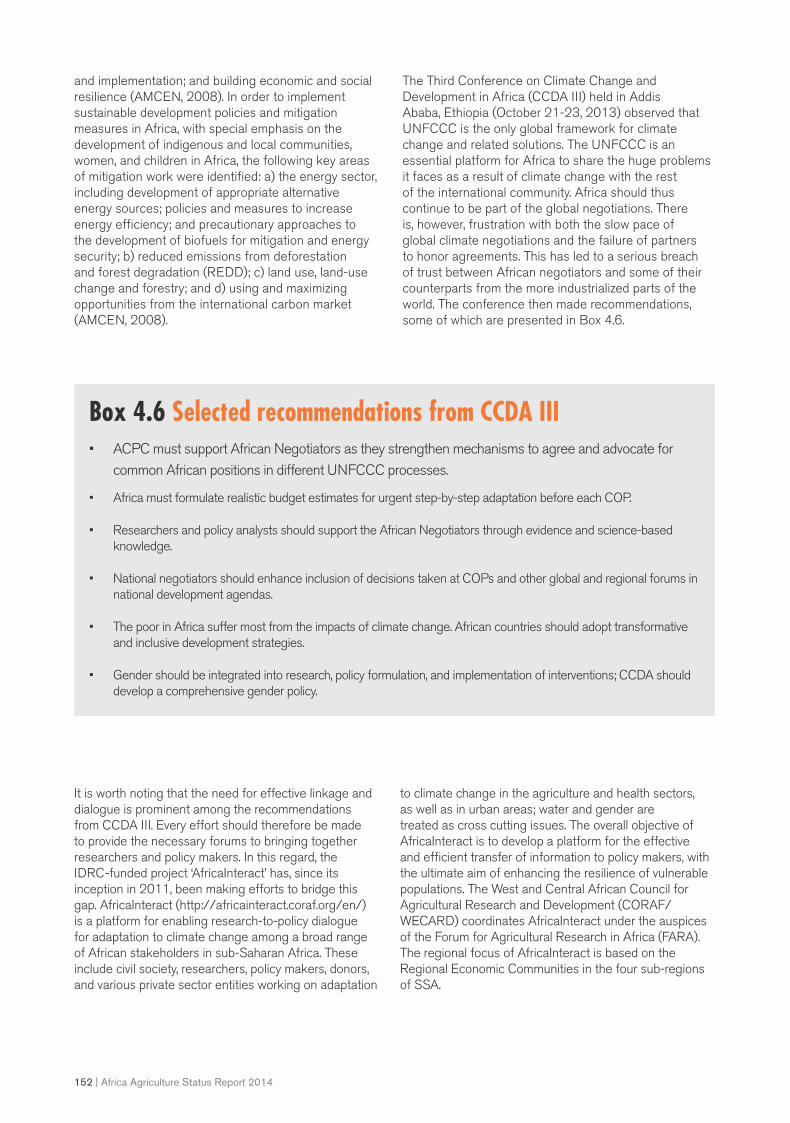
152 | Africa Agriculture Status Report 2014
and implementation; and building economic and social resilience (AMCEN, 2008). In order to implement sustainable development policies and mitigation measures in Africa, with special emphasis on the development of indigenous and local communities, women, and children in Africa, the following key areas of mitigation work were identified: a) the energy sector, including development of appropriate alternative energy sources; policies and measures to increase energy efficiency; and precautionary approaches to the development of biofuels for mitigation and energy security; b) reduced emissions from deforestation and forest degradation (REDD); c) land use, land-use change and forestry; and d) using and maximizing opportunities from the international carbon market (AMCEN, 2008).
The Third Conference on Climate Change and Development in Africa (CCDA III) held in Addis Ababa, Ethiopia (October 21-23, 2013) observed that UNFCCC is the only global framework for climate change and related solutions. The UNFCCC is an essential platform for Africa to share the huge problems it faces as a result of climate change with the rest of the international community. Africa should thus continue to be part of the global negotiations. There is, however, frustration with both the slow pace of global climate negotiations and the failure of partners to honor agreements. This has led to a serious breach of trust between African negotiators and some of their counterparts from the more industrialized parts of the world. The conference then made recommendations, some of which are presented in Box 4.6.
Box 4.6 Selected recommendations from CCDA III• ACPC must support African Negotiators as they strengthen mechanisms to agree and advocate for
common African positions in different UNFCCC processes.
• Africa must formulate realistic budget estimates for urgent step-by-step adaptation before each COP.
• Researchers and policy analysts should support the African Negotiators through evidence and science-based knowledge.
• National negotiators should enhance inclusion of decisions taken at COPs and other global and regional forums in national development agendas.
• The poor in Africa suffer most from the impacts of climate change. African countries should adopt transformative and inclusive development strategies.
• Gender should be integrated into research, policy formulation, and implementation of interventions; CCDA should develop a comprehensive gender policy.
It is worth noting that the need for effective linkage and dialogue is prominent among the recommendations from CCDA III. Every effort should therefore be made to provide the necessary forums to bringing together researchers and policy makers. In this regard, the IDRC-funded project ‘AfricaInteract’ has, since its inception in 2011, been making efforts to bridge this gap. AfricaInteract (http://africainteract.coraf.org/en/) is a platform for enabling research-to-policy dialogue for adaptation to climate change among a broad range of African stakeholders in sub-Saharan Africa. These include civil society, researchers, policy makers, donors, and various private sector entities working on adaptation
to climate change in the agriculture and health sectors, as well as in urban areas; water and gender are treated as cross cutting issues. The overall objective of AfricaInteract is to develop a platform for the effective and efficient transfer of information to policy makers, with the ultimate aim of enhancing the resilience of vulnerable populations. The West and Central African Council for Agricultural Research and Development (CORAF/WECARD) coordinates AfricaInteract under the auspices of the Forum for Agricultural Research in Africa (FARA). The regional focus of AfricaInteract is based on the Regional Economic Communities in the four sub-regions of SSA.

Africa Agriculture Status Report 2014 | 153
In the past three years, AfricaInteract has brought together more than 300 key stakeholders, including policy makers, researchers, civil society, and NGOs involved in climate change adaptation across the four sub-regions of SSA. Furthermore, the project has completed a review of research related to climate change adaptation in the agricultural and health sectors, as well as in urban areas. In addition to highlighting research and policy accomplishments relative to climate change adaptation in the four sub-regions, the review has also identified key research and policy gaps. This body of information will be crucial to informing policy
formulation, as well as pointing towards key areas that need further research attention in order to provide adaptation options. The reviews demonstrate a growing knowledge base on how people and societies across sub-Saharan Africa are responding to changes in climate-related shocks and stressors, and there are signs of emerging best practices and lessons that could be used to support adaptation policies and practices. Importantly, the regional reviews also show a strengthening of research capacity on adaptation and urban areas, agriculture, and health across the four SSA regions.
Box 4.7 Overall findings and recommendations of the AFRICAINTERACT review of research and policy related to climate change in AfricaFirst, there is a need to better understand adaptation actions and their outcomes. There are still important gaps in understanding adaptation solutions, such as the role of technology in supporting just and equitable adaptation outcomes. Similarly, there is a need to better monitor how particular adaptation actions or interventions – whether autonomous or planned by external agents – affect adaptation outcomes for different groups, facilitate learning, and improve the targeting of scarce resources.
Second, there is a need to address gaps in policies and increase policy coherence. Reviews for all themes and regions identified a need for more attention to climate change in sector-specific policies, as well as across sectors. Several of the reviews noted that there is still very little, if any, attention given to climate change in major policy documents and instruments, despite climate change being high on the international agenda over a number of years. This suggests that there are considerable challenges ahead in ensuring that sector policies do not lead to maladaptive development pathways, such as creating technological ‘lock-ins’ that undermine the future capacity of people or societies to adapt. One highlighted example is the urgent need for urban development policies and plans to consider current and future flood risks.
Third, there is a need to ensure improved uptake of research evidence. This is an area with significant challenges. As the regional reviews demonstrated, there is rapidly expanding literature on climate change and urban areas, agriculture and health, and a range of potential adaptation options have been identified in these three areas. Still, a major challenge remains in using this knowledge to inform policy and practice. Several reviews highlighted the need for better coordination, both within research and professional communities, and between research and policy. There is a need to acknowledge complexities and non-linearity in policymaking, and that there are opportunities for meaningful engagement by the research community with policy makers and other decision makers at multiple points throughout the research process. The reviews highlighted the need for researchers to engage with a wider audience and feed into policy processes at earlier stages.
Fourth, there is a need to address gender concerns. The need to better consider gender in adaptation research and policy was highlighted in all themes and across all regions. By and large, gender is framed as an issue relating mainly to women and children, and there is a tendency to view the same groups as victims of climate change with little capacity to act. Arguably, this view may be counterproductive and potentially disempowering for the poorest and most marginal groups. A broader perspective is needed on gender, focusing on the many different roles played by men and women in different social contexts. Some reviews highlighted the need for not only promoting functional needs in terms of relieving work pressure of vulnerable groups, but to also to tackle strategic needs such as increased participation in decision making processes.
Source: Naess, Lars Otto et al., 2014

154 | Africa Agriculture Status Report 2014
Adaptation within agriculture cannot be understood separately from development pathways and larger policy contexts and prioritizations, such as ‘large scale land investments’, some of which are also relevant for the adaptation-mitigation connection (such as biofuel production on productive agricultural land) (Naess, Lars Otto et al., 2014). Using land for growing non-food crops (biofuels), sometimes in the context of ‘land grabbing’ by multinational companies from small-scale farmers, presents opportunities for diversification in response to climate change, increased incomes for rural communities, and increased national GDPs (Brittaine and Lutaladio, 2010; Ngigi, 2009), but Rhodes et al. (2014) in the West Africa review point out that caution is required because these crops may compete with food crops for land, nutrients and water, resulting in landless people and social unrest. They note, however, that biofuel plants like Jatropha are becoming popular in Mali and Ghana. In the Central Africa review, Ngeve et al. (2014) note that emphasis has been put on reducing inappropriate land use changes, such as deforestation and desertification, as well as major anthropogenic sources of carbon dioxide, but this appears unrealistic at a time when plans are also being made by various countries in the region to increase crop production by opening up new land for food and biofuel production.
Key Policy GapsThere is a divergence across African countries in the institutional arrangements for policy formulation and implementation for climate change adaptation. The lack of delineation between climate change and environment-related issues has brought about some confusion, as they tend to be treated as one and the same thing. This is reflected in the current institutional architecture in many countries in SSA, which has been designed mainly to address environmental issues and may not be sufficiently robust to allow for the integration of climate change into the plans, programs, and projects of all relevant sectors of the economy. Some agricultural policies have been commonly applied in response to climate change impacts, such as drought and rainfall variability. Nevertheless, it is important to have strategies that are directly aimed at adapting to climate change hence taking into account the dynamic nature of climate change. At the same time, other sectors need to take into consideration the impacts of climate change on their sectors. This policy gap is clearly elucidated in the review of research and policies for climate change adaptation in SSA by Naess, Lars Otto et al. (2014). The authors emphasize the need for better coordination not only across ministries, such as agriculture and environment, but
also at national and regional scales. Agricultural and environmental policies need to be harmonized since in many countries – national ministries of environment coordinate climate change policies, but climate change adaptation processes occur mostly in the agriculture sector (Mapfumo et al., 2014).
Naess, Lars Otto et al. (2014) also note that there is a critical need to bridge gaps between regional policy formulation and capacities for action planning and implementation at the national and sub-national levels. It is not uncommon to find good policies that are not implemented (Rhodes et al., 2014). Regional policy development must be matched by capacity strengthening at national and regional levels to be effective (Mapfumo et al., 2014). There is a need for increased support for regional organizations, such as ACMAD and AGRHYMET, to build ‘centers of excellence’ around evidence on climate change matters for crop farming, livestock keeping, pastoralism, and fisheries that is utilized in policy formulation and implementation (Rhodes et al., 2014).
It is also important to tap into indigenous knowledge in any effort to improve climate change adaptation and resilience. Some evidence shows that, despite poor governance and policy, some indigenous systems can be efficient and resilient to climate change (Behnke and Carol Kerven, 2011; MacGregor and Hesse, 2013; Letara et al., 2006). For example, the pastoral system of livestock production has been observed to be climate resilient despite the fact that many government policies and strategies have not recognized and supported this system (Hesse et al., 2013). There is therefore a need to recognize the contribution of indigenous knowledge to the preservation, identification and development of appropriate varieties and breeds adapted to climate change. Appropriate intellectual property rights of farmers, herders and fisher folks, as well as appropriate sharing of benefits, will go a long way in fostering an enabling environment for the development and adoption of climate-adapted seeds and breeds.
Policies play an important role in increasing climate change adaptability and resilience. For example, it is now becoming well known that access to adequate inputs, including seed, fertilizer and credit, can be enhanced by appropriate government policies. Good policies are needed to provide opportunities for cost-effective production of appropriate fertilizers that could benefit from economies of scale. Moreover, smart subsidies are likely to make such vital inputs more readily affordable to resource-poor farmers. Malawi, for example, realized a dramatic increase in maize production following the government’s establishment of an enabling fertilizer and seed access policy (Box 4.8).

Africa Agriculture Status Report 2014 | 155
Box 4.8 Supportive policies in Malawi increased maize productionHistorically, African smallholder farmers managed the fertility of their croplands mainly by regularly leaving fields in fallow and, in some regions, by applying animal manure. Having an enabling policy environment that encourages farmers to have and use appropriate agricultural inputs is important.
The fertilizer and seed subsidy program of the government of Malawi is credited with contributing to significant increases in the country’s maize harvest. In 2006, African policymakers came together at the African Fertilizer Summit and resolved that member states should grant targeted subsidies in favor of the fertilizer sector. Many organizations (both national and international), including AGRA, have in recent years called for governments to improve their policy environments to boost fertilizer use in Africa, with subsidies if necessary. Increased fertilizer uptake is an important component in raising crop yields on the continent – on average, farmers in SSA use about 13 kg of fertilizer nutrients per hectare of arable land, compared with the developing country average of 94 kg/ha.
Malawi’s voucher program is the largest in Africa, and is the one most often cited as a smart subsidy success story. Malawi eliminated universal fertilizer subsidies for smallholders in the mid-1990s, but it reintroduced limited subsidies in 1998 through the ‘Starter Pack’ program, which gave all farmers, free of charge, 10-15 kg of fertilizer and enough improved seed to plant 0.1 hectare. After two years, this program was converted into the Targeted Input Program (TIP), which distributed the packs to a targeted group of farmers; the percentage of all farming households in Malawi targeted each year varied from 33-96%, depending on the year. In 2005, the program was redesigned as the Agricultural Inputs Subsidy Program (AISP), a voucher-based universal subsidy program that allows farmers to buy 100 kg of fertilizer at about one-fifth of the market price, thus dramatically increasing both the quantity of fertilizer being subsidized and the fiscal cost of the subsidy. The combination of increased fertilizer use and good rainfall has resulted in substantially increased maize production over the past few years, leading to improved food security and even some maize exports.
Source: Minot and Benson, 2009
Policies also need to be backed by good extension services. Farmers not only need current and continuously updated information on farming methods and the use of new technologies, but also on current input and output market prices. In recent years the Innovations Systems is increasingly being adopted in agricultural research and development, with Innovation Platforms featuring as an effective tool for fostering collaboration in not only the identification of constraints and opportunities, but also identifying appropriate solutions and sharing gains.
Opportunities for Collaboration in Policy MakingMany different stakeholders and institutions, including farmers, private sector entities, public sector organizations, research institutions, educational
institutions, and CSOs play an important role in supporting the adoption of climate-smart agriculture. To effectively support CSA initiatives, national governments not only need to coordinate financing for CSA technologies and practices, but also have the flexibility to plan and work across sectors. The fact that streams of funding are currently largely divided by sectors is problematic because it results in inefficiency and insufficient access to financing for CSA. Financing needs to be structured in ways that maximize the efficiency of climate-smart investments, while still meeting sectoral needs (Shames et al., 2012).
While cross-sectoral linkages, especially those connecting agriculture and climate, are new to SSA, some countries have started responding to this need. For example, in Kenya a model was developed in which a national Climate Change Secretariat, based at the Ministry of Environment and Mineral Resources, coordinates Climate Change Units found within other relevant government ministries, including the Ministry of Agriculture. The mandate of the MoA Climate

156 | Africa Agriculture Status Report 2014
Change Unit is to ensure the mainstreaming of climate change into all of the Ministry’s projects and programs. These types of integrated mechanisms require significant institutional changes, but would be important for drawing together CSA projects that have diverse sources of funds.
Currently, there are public and private capital flows to SSA for climate change mitigation and adaptation activities. For example, developing country governments obtain climate-related financing from multilateral and bilateral sources through budget supports and sovereign loans. Many donors also support activities through their government banks. For example, the French government’s private sector financing arm, PROPARCO, invested EUR 30 million in CDC Climate, half of which will be invested in emission reduction projects in sub-Saharan Africa (CDC Climate and Proparco, 2011). According to the Copenhagen Accord commitments, US$ 100 billion per year by 2020 will be mobilized for a balanced allocation between mitigation and adaptation efforts (Persson, 2011). Of these pledges, it is estimated that US$ 676-766 million will be channeled to SSA for climate change-related activities through multilateral institutions (Shames et al., 2012).
The NEPAD Planning and Coordinating Agency established the NEPAD Climate Change Fund in 2014, with support from the government of Germany. In general terms, the fund aims at strengthening the resilience of African countries to climate change by building national, sub-regional and continental capacity. The current fund will run for an initial period of two years (2014-2015). It offers technical and financial assistance to AU Member States, the RECs, and other institutions.7 In addition, there is a growing cohort of private foundations and international NGOs, such as The Rockefeller Foundation, CARE, Oxfam, and Conservation International that are joining with national NGOs and farmer organizations to invest in CSA. For
example, The Rockefeller Foundation currently supports climate resilience for smallholder farmers through its ‘Developing Climate Change Resilience’ initiative. The Howard G. Buffett Foundation also supports projects that feature conservation agriculture – with adaptation and mitigation benefits – in Tanzania, Burundi, Sierra Leone and Sudan, through a partnership with CARE.
The East African Community (EAC) has also proposed a carbon fund to deal with climate change issues in East Africa. The EAC is funded by equal contributions from its member states, but also from development partners. There are growing opportunities for governments to collaborate with the private sector in the carbon market. Farmers need technical and financial support in enabling them to quantify their carbon stocks and report accordingly for effective participation in the market. Governments can assist greatly by funding national research institutions to develop appropriate tools and methodologies for the measurement of carbon stocks. The private sector can also sponsor such research, which will ultimately provide avenues for efficient carbon trading.
Thus, national governments, regional bodies, and continental organizations all have a stake in effective collaboration that enables appropriate research and supports the creation of enabling policy environments that promote the development of climate-smart technologies and properly functioning markets that will benefit smallholders – those most vulnerable to climate variability and change. Continent-level governing bodies that can influence mitigation and adaptation strategies should be strengthened by the development of a comprehensive and binding response strategy, as well as improvements in early warning systems. African countries should mainstream climate change into development strategies and policies, using a multi-sectorial approach, and the AU needs to support all African countries as Africa becomes ever-more fully engaged in global climate change negotiations.
7. (http://www.nepad.org/climatechangeandsustainabledevelopment/climate-change-fund)

Africa Agriculture Status Report 2014 | 157
ReferencesAbate, T., Menkir, A., MacRobert, J.F., Tesfahun, G., Abdoulaye, T., Setimela, P., Badu-Apraku, B., Makumbi, D., Magorokosho, C., Tarekegne, A. (eds.). 2013. DTMA Highlights for 2012/13. CIMMYT-Kenya.
Abbott, P. C. Hurt, C. and Tyner, W. 2011. What’s Driving Food Prices in 2011? Farm Foundation Issue Report. Oak Brook, USA: Farm Foundation. Pp.47 Downloaded at: http://www.farmfoundation.org/news/articlefiles/1742-FoodPrices_web.pdf Accessed May 24, 2014.
African Ministerial Conference on the Environment (AMCEN). 2008. Report of the 12th session of the ministerial segment held in Johannesburg, South Africa from 10 to 12 June 2008. UNEP/AMCEN/12/9. Nairobi, Kenya: UNEP, pp.31. Available online at: http://www.unep.org/roa/Amcen/Amcen_Events/12th_Session_AMCEN/docs/AMCEN-Ministerial-Segment-Report.pdf
Alliance for a Green Revolution in Africa (AGRA) Database (2014). https://agra.basecamphq.com/projects/12313519-data-sharing-portal/files/cat/127115925
Alliance for a Green Revolution in Africa (AGRA). 2014. Who we are: About the Alliance for a Green Revolution in Africa. Retrieved May 30, 2014 from http://www.agra-alliance.org/who-we-are/about-the-alliance-for-a-green-revolution-in-africa/.
African Ministerial Conference on Environment (AMCEN). 2010. Comprehensive framework of African climate change programmes. AMCEN/SS/IV/INF/3. Nairobi, Kenya: AMCEN Secretariat. pp. 195.
Battersby, J., 2012. Urban food security and climate change: A system of flows. In: Frayne, B., Moser, C. and Ziervogel, G. (eds.). Climate change, assets and food security in southern African cities. Abingdon, UK: Earthscan, pp. 35-56.
Behnke, R. and Kerven, C. 2011. Replacing pastoralism with irrigated agriculture in the Awash Valley, north-eastern Ethiopia: Counting the costs. Paper presented at the International Conference on Future of Pastoralism. Institute of Development Studies, University of Sussex, UK: Future Agricultures Consortium, pp. 40.
Besley, T. 1995. Property rights and investment incentives: Theory and evidence from Ghana. Journal of Political Economy 103(5), 903-937.
Brittaine, R. and Lutaladio, N. 2010. Jatropha, a smallholder bioenergy crop: The potential for pro-poor development. Integrated Crop Management Bulletin 8-2010, Rome, Italy: Food and Agriculture Organization.
Berg, A., De Noblet-Ducoudré, N., Sultan, B., Lengaigne, M. and Guimberteau, M. 2013. Projections of climate change impacts on potential C4 crop productivity over tropical regions. Agricultural and Forest Meteorology, 170, 89-102. DOI: 10.1016/j.agrformet.2011.12.003.
Boadi, R.Y., Bokanga, M. 2007. The African Agricultural Technology Foundation approach to IP Management. In Krattiger, A., Mahoney, R.T., Nelsen, L., Thomson, J.A., Bennett, A.B., Satyanarayana, K., Graff, G.D., Fernandez, C., Kowalski, S.P. (Eds.) Intellectual property management in health and agricultural innovation: A handbook of best practices. Oxford, UK: MIHR, p.1765-1774.
Boko, M., Niang, I., Nyong, A., Vogel, C., Githeko, A., Medany, M., Osman-Elasha, B., Tabo, R., and Yanda, P. 2007. Africa. In Parry, M.L., O.F. Canziani, J.P. Palutikof, P.J. van der Linden, and C.E. Hanson (Eds.) Climate Change 2007: Impacts, Adaptation and Vulnerability. Contribution of Working Group II to the Fourth Assessment Report of the Intergovernmental Panel on Climate Change. Cambridge, UK: Cambridge University Press, pp. 433-467.
Brooks, N., Adger, W.N. and Kelly, P.M. 2005. The determinants of vulnerability and adaptive capacity at the national level and the implications for adaptation. Global Environmental Change, 15(2), 151-163.
Comprehensive Africa Agriculture Development Programme (CADAAP) 2012. Portal 2010-2013: http://www.nepad.org/foodsecurity/agriculture/about. Johannesburg, South Africa: New Partnership For Africa’s Development.
Cassman, K. G. 2007. Climate change, biofuels, and global food security. Environmental Research Letters, 2, 011002. pp. 3 doi:10.1088/1748-9326/2/l/011002.
Calzadilla, A., Zhu, T., Rehdanz, K., Tol, R. and Ringler, C. 2009. Economy wide impacts of climate change on agriculture in sub-Saharan Africa. IFPRI Research Brief 15-15. Washington, DC., USA: IFPRI.
Caisse des Dépôts Climat (CDC) and PRO PARCO. 2011. CDC Climate and PROPARCO unite against climate change. Press Release. 12 May2011. Paris, France: CDC. Available at: http://www.cdcclimat.com/CDC-Climat-and-PROPARCO-unite.html.
Cornway, G. 2009. The science of climate change in Africa. Impacts and adaptation. Discussion paper 1. Imperial College, London: Grantham Institute for Climate Change.
Dalton, T.J. and Guei, R.G. 2003. Productivity gains from rice genetic enhancements in west Africa: Countries and ecologies. World Development 31(2),359-374.
Denning, G., Kabambe, P., Sanchez, P., Malik, A., Flor, R., Harawa, R., Nkhoma, P., Zamba, C., Banda, C., Magombo, C., Keating, M., Wangila, J., Sachs, J. 2009. Input subsidies to improve smallholder maize productivity in Malawi: Toward an African green revolution. Public Library of Science Biology 7(1):e1000023. Doi10.1371/journal.pbio.1000023.
Diagne, A. 2006. Diffusion and adoption of NERICA rice varieties in Côte D’Ivoire. The Developing Economies 44(2), 208–231.

158 | Africa Agriculture Status Report 2014
Dixon, J., Gulliver, A., Gibbon, D. 2001. Farming systems and poverty: Improving farmers’ livelihoods in a changing world. Rome, Italy: Food and Agriculture Organisation. Available at: www.fao.org/farmingsystems/.
Duvick, D.N. 2005. Genetic Progress in Yield of United States Maize (Zea mays L.). Maydica, 50, 193-202.
Duvick, D.N. 1992. Genetic contributions to advances in yield of US maize. Maydica, 37, 69-79.
Duvick, D.N. 1999. Heterosis: Feeding people and protecting natural resources. In Coors, J.G., Pandey, S. (Eds.) The genetics and exploitation of heterosis in crops. Madison, WI, USA: American Society of Agronomy, Inc.
Ejeta G 2009. Revitalizing agricultural research for global food security. Food Security, 1(4), 391-401.
Ensor, J.; Berger, R. 2009. Introduction: understanding community based adaptation. In: Ensor, J.; Berger, R. (Eds.) Understanding climate change adaptation: lessons from community based approaches. Warwickshire, UK: Practical Action Publishing. pp.13.
Fischer, G and Shah, M. 2010. Farmland investments and food security: Statistical annex. Report prepared under the World Bank and International institute for Applied System Analysis, Luxembourg.
Fischer, G. and Heilig, G.K. 1997. Population momentum and the demand on land and water resources. Philosophical Transactions of the Royal Society of London, B 352(1356), 869–889.
Food and Agriculture Organization. 2014. FAOSTAT database http://faostat.fao.org/ Accessed May 2014.
Food and Agriculture Organization (FAO). 2008. Climate change and food security: A framework document. Rome, Italy: FAO.
Food and Agriculture Organization (FAO). 2011. Climate-smart agriculture: Managing ecosystems for sustainable livelihoods. Rome, Italy: FAO, pp.11 Available at: http://www.fao.org/docrep/015/an177e/an177e00.pdf.
Food Security and Nutrition Working Group. 2013. FAO sub-regional emergency office of Eastern and Central Africa. Available at: http://www.fao.org/emergencies/fao-in-ction/projects/detail/en/c/211389/.
Foresight. 2011. The future of food and farming: Final project report. London, UK: The Government Office for Science, pp. 211.
Garnett, T. Appleby, C. M., Balmford, A., Bateman, J.I., and Benton, G.T., Bloomer, P., Burlingame, B., Dawkins, M., Dolan, L., Fraser, D., Herrero, M., Hoffmann, I., Smith, P., Thornton, P. K., Toulmin, C. Vermeulen, S. J. and Godfray H. C. J. 2013. Sustainable intensification in agriculture: premises and policies. Science, 341(6141), pp. 33-34.
Garrity, D., Dixon, J. and Boffa, J.M. 2012. Understanding african farming systems: Science and policy implications. Prepared for Food Security in Africa, Sydney, 29-30 November 2012. Sydney, Australia: Austrilian Center for International Agricultural Research, pp.55.
Gilland, G. B. 2002. World population and food supply: Can food production keep pace with population growth in the next half century? Food Policy, 27(1): 47-63.
Godfray, H.C.J., Beddington, J.R., Crute, I.R., Haddad, L., Lawrence, D., Muir, J.F. Pretty, J., Robinson, S., Thomas, S.M. and Toulmin, C. 2010: Food security: The challenge of feeding 9 billion people. Science, 327(5967), 812-818.
Hansen, J.W. 2002 Realizing the potential benefits of climate prediction to agriculture: issues, approaches, challenges. Agricultural Systems, 74 (3), 309-330.
Henao, J. and Baanante, C. 2006. Agricultural production and soil nutrient mining in Africa. Implications for resource conservation and policy development. Muscle Shoals, AL, USA: International Center for Soil Fertility and Agricultural Development, pp.95.
Hertel, T. 2011. The global supply and demand for agricultural land in 2050: A perfect storm in the making? American Journal of Agricultural Economics, 93(2), 259-275.
Hertel, T.W., Burke, M.B., and Lobell, D.B. 2010 The poverty implications of climate-induced crop yield changes by 2030. Global Environmental Change, 20:577–585.
Hesse, C. Anderson, S. Cotula, L. Skinner, J. and Toulmin, C. 2013. Building climate resilience in the Sahel. London, UK: International Institute for Environment and Development.
Hinrichsen, D. 1999. The coastal population explosion, pp.3. Available at: http://oceanservice.noaa.gov/websites/retiredsites/natdia_pdf/3hinrichsen.pdf. Accessed June 5, 2014.
International Fund for Agricultural Development (IFAD). 2013. Smallholders, food security and the environment. Rome, Italy: IFAD, pp.54.
2Inter- Academy Council. 2009. Realising the promise and potential of African Agriculture.
International Emergency Database, 2009. EM-DAT Database, Centre for the Research on the Epidemiology of Disasters. Accessed Dec 2013. Available at: http://www.emdat.be/search-details-disaster-list
Intergovernmental Panel on Climate Change (IPCC). 2014. Summary for Policymakers. In: Climate Change 2013: The physical science basis. In Stocker, T.F., D. Qin, G.K. Plattner, M. Tignor, S.K. Allen, J. Boschung, A. Nauels, Y. Xia, V. Bex and P.M. Midgley (Eds.). Contribution of Working Group I to the Fifth Assessment Report of the Intergovernmental Panel on Climate Change . Cambridge University Press, Cambridge, UK and New York, NY, USA.
Jarvis, A., Ramirez-Villegas, J., Campo, B.V.H., Navarro-Racines, C. 2012. Is cassava the answer to African climate change adaptation? Tropical Plant Biology 5(1), 9-29.

Africa Agriculture Status Report 2014 | 159
Jayne, T.S. and Chapoto, A. 2006. Emerging structural maize deficits in eastern and southern Africa: Implications for national agricultural strategies. FSRP Policy Synthesis No. 16. Lusaka, Zambia: Food Security Research Project.
Jayne, T.S., Chamberlin, J., and Derek Headey, D. 2014. Land pressures, the evolution of farming systems, and development strategies in Africa: A Synthesis. Food Policy 47, 1-17. DOI: 10.1016/j.foodpol.2014.05.014.
Jayne, T.S., and Muyanga, M. 2012. Land constraints in Kenya’s densely populated rural areas: Implications for food policy and institutional reform. Food Security, 4(3); 399-421.
James, C, 2013. Global status of commercialized biotech/GM crops: 2013. ISAAA Brief No. 45. Ithaca, New York: ISAAA.
Naess, L. O., Jalloh, A., Faye, M.D., Njoya, A., and Roy-Macauley, H. 2014. Synthesis of findings and assessment of gaps in research and policy: Urban areas, agriculture and health. FAC Working Paper.
Letara, J., Hesse, C. and MacGregor, J. 2006. Estimating the economic significance of pastoralism: the example of the nyamachoma sector in Tanzania. Nakuru, Kenya: Resource Conflict Institute, pp.22.
Liu, J., Fritz, S., van Wesenbeeck, C.F.A., Fuchs, M., You, L., Obersteiner, M., and Yang, H. 2008. A spatially explicit assessment of current and future hotspots of hunger in Sub-Saharan Africa in the context of global change. Global and Planetary Change 64 (3-4), 222–235.
Lobell, D. B., Burke, M. B., Tebaldi, C., Mastrandrea, M. D., Falcon, W. P. and Naylor, R.L. 2008. Prioritizing climate change adaptation needs for food security in 2030. Science 319(5863), 607-610.
Lobell, D.B., Schlenker, W. and Costa-Roberts, J. 2011. Climate trends and global crop production since 1980. Science 333(6042), 616-620.
Mabaya, E. Omanga, P. and DeVries, J. 2013. Status of seed systems development in sub-Saharan Africa. Chapter 5: Africa agriculture status report: Focus on staple crops. Nairobi, Kenya: Alliance for Green Revolution in Africa (AGRA), p. 53-68.
MacGregor J. and Hesse C. 2013. Pastoralism Africa’s invisible economic powerhouse? World Economics, 14(1).
Minot, N. and Benson, T. 2009. Fertilizer subsidies in Africa: Are vouchers the answer? IFPRI Issue Brief no. 60, July 2009. Washington, DC: IFPRI.
Mapfumo, P. [et al.] 2014. Review of Research and Policy for Climate Change Adaptation in the Agriculture Sector in Southern Africa. AfricaInteract/FAC.
Mueller, S.A., Anderson, J.E. and Wallington, T.J. 2011. Impact of Biofuel Production and Other Supply and Demand Factors on Food Price increases in 2008. Biomass and Bioenergy, 35, 1623–1632.
Munaag, R. and Andrews, J. 2014. Despite climate change, Africa can feed Africa. African Renewal. Special edition on Agriculture, p.6.
Nelson, G.C., Rosegrant, M.W., Koo, J., Robertson, R., Sulser, T., Zhu, T., Ringler, C., Msangi, S., Palazzo, A., Batka, M., Magalhaes, M., Valmonte-Santos, R., Ewing, M., Lee, D. 2009. Climate change: Impact on agriculture and costs of adaptation. Food Policy Report, No. 21. Washington DC, USA: International Food Policy Research Institute, pp.19.
Nelson, G.C., Rosegrant, M.W., Palazzo, A., Gray, I., Ingersoll, C., Robertson, R. Tokgoz, S. Zhu, T. Sulser, T.B., Ringler, C., Msangi, S., and You, L. 2010. Food security, farming, and climate change to 2050: Scenarios, results, policy options. Washington, DC: International Food Policy Research Institute, pp.155.
Ngeve, J.M., Jalloh, A. and Ndjatsana, M. 2014. Review of research and policy for climate change adaptation in the agriculture Sector in central Africa. AfricaInteract/FAC.
Ngigi, S.N. 2009. Climate change adaptation strategies: Water resources management options for smallholder farming systems in sub-Saharan Africa. New York, USA: The Earth Institute of Columbia University.
Oikeh SO, Nwilene F, Diatta S, Osiname O, Touré A, Okeleye KA: Responses of Upland NERICA Rice to Nitrogen and Phosphorus in Forest Agro ecosystems. Agron. J. 2008, 100:735–741.
Persson, A. 2011.Institutionalising climate adaptation finance under the UNFCCC and beyond: Could an adaptation ‘market’ emerge? Working Paper no. 2011-03. Stockholm: Stockholm Environment Institute.
Rhodes, E.R., Jalloh, A., and A. Diouf, 2014. Review of Research and Policy for Climate Change Adaptation in the Agriculture Sector of West Africa. AfricaInteract/FAC.
Rosegrant MW: Impacts of climate change on food security and livelihoods. In Food security and climate change in dry areas: proceedings of an International Conference, 1-4 February 2010, Amman, Jordan. Edited by Solh M, Saxena MC. International Center for Agricultural Research in the Dry Areas (ICARDA), PO Box 5466, Aleppo, Syria; 2011:24 -26.
Rosegrant, M. W., Cline, S.A., Li, W., Sulser, T. B., Valmonte-Santos, R. A. 2005. Looking ahead long-term prospects for Africa’s agricultural development and food security. 2020 Discussion Paper 41. Washington, DC: International Food Policy Research Institute. http://www.ifpri.org/sites/default/files/pubs/2020/dp/vp41.pdf Accessed May 24, 2014.
Rosegrant, M. W., Zhu, T., Msangi, S., and Sulser, T. 2008. Global scenarios for biofuels: Impact and implications. Review of Agricultural Economics 30(3), 495–505.

160 | Africa Agriculture Status Report 2014
Rosegrant, M., Paisner, M.S., Meijer, S., and Witcover, J. 2001. 2020 Global food outlook: Trends, alternatives and choices. Washington, DC: International Food Policy Research Institute, pp.24. Available at: http://www.ifpri.org/sites/default/files/publications/fpr30.pdf.
Rosenzweig, C. and Parry, M.L. 1994. Potential impact of climate change on world food supply. Nature, 367, 133-138.
Schelenker, W. and Lobell, D.B. 2010. Robust negative impacts of climate change on African agriculture. Environmental Research Letters 5(1). doi:10.1088/1748-9326/5/1/014010.
Shames, S., Friedman, R. and Havemann, T. 2012. Coordinating finance for climate-smart agriculture. Eco agriculture Discussion Paper No. 9 Washington, DC, USA: Eco Agriculture Partners.
Tegemeo Institute of Agricultural Policy and Development. 2010. Kenya baseline study. Report prepared for The Alliance for a Green Revolution in Africa. Nairobi, Kenya: Tegemeo Institute, pp.253.
Tester, M. and Langridge, P. 2010. Breeding technologies to increase crop production in a changing World. Science 327, 818–822.
Thomas, J. A., and Zuberi, T. 2012. Demographic change, the IMPACT model, and food security in sub-Saharan Africa. UNDP Regional Bureau for Africa Working paper.
Thornton, P.K., Jones, P.G., Alagarswamy, G., and Andresen, J. 2009. Spatial variation of crop yield response to climate change in East Africa. Global Environmental Change, 19(1), 54-65.
Tripp and Mensah-Bonsu. 2013. Ghana’s Commercial Seed Sector: New Incentives or Continued Complacency? International Food Policy Research Institute.
Tschakert, P. 2007. Views from the vulnerable: understanding climatic and other stressors in the Sahel. Global Environmental Change 7:381–396.
Van Meele, P., Bentley, J.W. and Guei, R.G. (Eds.) 2011. African seed enterprises: Sowing the seeds of food security. Wallingford, UK: CABI International, pp.266.
Vitale, J.D., Vognan, G., Ouattarra, M., and Traore, O. 2010. The commercial application of GMO crops in Africa: Burkina Faso’s decade of experience with Bt cotton. AgBioForum, 13(4), 320-332. Available at: http://www.agbioforum.org.
Wangai, A. W. Redinbaugh, M. G. Kinyua, Z. M. Miano, D. W. Leley, P. K. Kasina, M., Scheets, K. and Jeffers, D. 2012, Disease notes. American Phytopathological Society, 96(10), p. 1582.
Wheeler, T. and von Braun, J. 2014. Climate Change Impacts on Global Food Security Science 2 August 2013: Vol. 341 no. 6145 pp. 508-513. DOI:10.1126/science.1239402.
Wopereis, M.C.S., Diagne, A., Rodenburg, J., Sié, M., and Somado, E.A. 2008. Why NERICA is a successful innovation for African farmers. Outlook on Agriculture, 37(3),169–176.
World Bank, 2003. World development indicators 2003, Washington, D.C., USA.

Africa Agriculture Status Report 2014 | 161
162 | Africa Agriculture Status Report 2014
Chapter 5 Knowledge Management Systems and Education for Building Smallholder Resilience to Climate Change

Africa Agriculture Status Report 2014 | 163
KEY MESSAGES
Climate Smart Agriculture is clearly knowledge-intensive and for it to be effectively implemented, well designed, inclusive, and innovative knowledge management systems (KMS) are essential.
Scientific experts and farmers working closely together to identify and implement appropriate CSA technologies and practices will lead to mutual accountability, and result in more robust knowledge systems that are useful to both groups.
Co-learning and co-management involving farmers and scientists comprise new and innovative approaches to the development and practical implementation of KMS, and these approaches should be strengthened through education and training.
The use of co-learning and co-management strategies in KMS will improve knowledge quality, affect farmers’ adoption practices and behavior, and increase the application of sustainable farming practices by farmers.
Co-production of knowledge management systems will result in farmer-led solutions being combined with supportive scientific knowledge to adopt CSA and build resilience.
ONE
TWO
FOUR
FIVE
THREE
164 | Africa Agriculture Status Report 2014
IntroductionTwo types of knowledge management systems (KMS) – indigenous (or farmer-led) systems and scientific knowledge management systems, coupled with education and training – combine to produce knowledge that can be used by smallholder farmers to achieve Climate Smart Agriculture (CSA) in an era of changing climate.
From the perspective of smallholder farmers, the keys to effective CSA knowledge management systems include: strengthening their inclusion and leadership roles in these systems; increasing the capacity of extension support services and advisors relative to sharing CSA knowledge; and placing the greatest emphasis on support for local and indigenous knowledge systems. Effective CSA knowledge management requires direct collaboration with farmers, as well as the development of farmer-focused knowledge products. In addition, capacity building should be tailored to the specific needs of each stakeholder group.
This chapter seeks to identify the different sources of knowledge produced from indigenous and scientific knowledge management systems and examines how these systems can be combined to develop a unique KMS that will benefit farmers and researchers alike.
This chapter recommends co-production of knowledge through education and training. Co-production
of knowledge will enhance co-learning and co-management of knowledge about KMS. According to Rariey and Fortun (2010), extreme weather events take a direct toll on agriculture and human livelihoods. Hence, education plays an essential role in increasing the adaptive capacity of communities and nations by enabling individuals to make informed decisions. Quality education designed for the purpose of empowering people to address climate change and live in sustainable ways is vital. All these require reliable agricultural knowledge and information.
This chapter: 1) reviews existing knowledge management systems and models; 2) identifies the key drivers of KMS; 3) identifies the barriers to and opportunities for knowledge production; and 4) examines formal agricultural education and training in Africa. The findings presented here represent a useful starting point for framing a better understanding of how various knowledge management systems may be harnessed to: develop farmer-led solutions in supportive scientific environments; encourage adoption of Climate Smart Agriculture; and build resilience to climate change. Through co-learning and co-management, mutual accountability systems are established between farmers and researchers, changes in the practices and behavior of farmers and researchers are achieved, and the quality of shared knowledge and its application by farmers are enhanced. A case study approach is used.
Knowledge Management Systems and Climate ChangeAn indigenous KMS represents a database that communities can use to record and manage their own information, including traditional or indigenous knowledge (IK). Indigenous knowledge, sometimes referred to as traditional ecological knowledge or local ecological knowledge, has received a lot of attention in the discussions of climate change (Speranza et al., 2010; Codjoe et al., 2013). Orlove et al. (2010) define IK as place-based knowledge that is rooted in local cultures and generally associated with long-settled communities that have strong ties to their natural environment. This knowledge is place-, time-, and culture-specific, and the result of accumulated experiences of a people regarding their natural environment that has been handed down from one generation to the next.
On the other hand, scientific knowledge management systems represent databases that the scientific community often uses to analyze information, including climate data. According to Gibbons et al. (1994), scientific knowledge production should be guided by specifiable consensus as to appropriate cognitive and social practice. Scientific knowledge is defined as the use of empirical observations to conduct research and devise solutions through the advice and input of professionals. Some researchers argue that environmental systems are characterized by complex dynamics, multiple drivers, and a paucity of data; hence action, in the form of expert knowledge, is often required before uncertainties can be resolved (McBride and Burgman, 2012).

Africa Agriculture Status Report 2014 | 165
Knowledge is also produced through formal education and training. Using participatory and innovative approaches to research and training, links between research and technology transfer are established and technological support to farmers allows an adequate flow of information that is more likely to be relevant and to which farmers are more likely to be receptive (Kaimowitz, 1990).
King and McGrath (2002) suggest that developing a notion of learning-led competitiveness is a crucial part of any response to globalization, as well as allowing the performance of education and training institutions to be monitored. The knowledge produced though this system of education and training represents a database that both the scientific community and the traditional community can manage, with the goal of achieving climate smart agriculture in sub-Saharan Africa (SSA).
A number of studies have looked at how best to incorporate all these knowledge sources in the assessments of changes in weather and climate (Lefale, 2009; Alexander et al., 2011; Speranza et al., 2010; Ford, 2012). Mashavave et al. (2013) observed that, despite field-based evidence that most of the technologies applied in smallholder farming can increase yields, adoption levels by farmers have remained low, and this is attributed partly to the wide communication gap between researchers and farmers (Odendo et al. 2006). Agrawal (1995) contends that the grouping of knowledge into scientific and indigenous knowledge is bound to fail because of the heterogeneous nature of these two systems and the dimensions of time and space. Nyong et al. (2007) advised that indigenous knowledge (IK) should complement scientific knowledge systems – not the other way around since farmers use what they already have – since this can lead to the development of effective mitigation and adaptation strategies that are cost effective, participatory and sustainable.
Merging IK and scientific-based knowledge is crucial to enhancing community adaptation and resilience to climatic and environmental hazards (Mecer et al., 2009; Reed et al., 2006). However, Scoones (2009) critiqued research or ‘elite science’ as tending to distant itself from contextual realities and using empirical methods that undermine farmers’ expertise. According to Scoones (2009), such distancing reduces the gains that could be optimized from blending ‘social software and technical hardware’. One such gain is that the process of blending is characterized by a collective exchange process,
whereby both farmers and researchers come to value their shared knowledge and experiences and identify themselves as major actors. Invariably, innovations that provoke changes in agrarian communities are inextricably linked to the fact that local men and women in the process identify themselves as ‘collaborators’ and not ‘recipients’. The underpinning of this stance is that people in an agrarian context are most likely to accept changes that draw significantly on their own knowledge and experiences. Plausible reasons for this include that they tend to have a more holistic perspective on the socioeconomic and cultural factors that characterize their lives (Briggs and Moyo, 2012), and are conscious of the multifaceted implications for livelihoods should they initiate changes in farming practices and behavior. Factoring in such considerations as physical costs, long- or short-term benefits, and the tradeoffs that underlie specific changes in farming practices, is indispensable for achieving acceptability and a sense of ‘duty’ among farmers. Acceptability and duty are critical factors affecting farmers’ uptake of sustainable farming practices.
Hence, the blending of modern science and IK systems co-produced by local and non-local experts through education channels are suggested (Carolan, 2006). Adaptation to climate change requires individuals to be aware of potential changes in the climate and to understand the implications of these changes on their lives. It requires them to assess the risks and to make informed decisions on how to adapt their livelihoods, homes and communities. By including both knowledge systems in climate studies, informed decisions can be made by both the indigenous and the scientific communities. Alexander et al. (2011) state that “...faithfully representing the people, voices, and history that hold much of the richness of indigenous knowledge is difficult, but by opening a pathway for the meaningful exchange of information, it is hoped that efforts to understand, adapt to, and mitigate climate change will be strengthened”.
For smallholder farmers, the key priorities for effective CSA knowledge management systems are: 1) strengthen farmers’ inclusion and leadership in CSA knowledge systems; 2) raise the capacity of extension services and advisors to share CSA knowledge; and 3) give the greatest support to local and IK systems. There is a need for direct collaboration with farmers and farmer-focused knowledge product development. Also, capacity building should be specifically tailored to each stakeholder group.
166 | Africa Agriculture Status Report 2014
Theoretical Review and Conceptual Framework
Review of existing knowledge management systems and modelsIndigenous peoples possess their own valuable knowledge, practices and representations of the natural environment, as well as their own conceptions about how human interactions with nature should be managed. This IK and associated practices provide an important basis for facing the challenges of climate change. There is much to learn from indigenous and community-based approaches and, while indigenous communities will undoubtedly need much support to adapt to climate change, they also have a lot of coping expertise to offer (e.g., through diversified production systems, fallback resources, social solidarity networks, innovation, mitigation and other traditional mechanisms) (Andrea, 2013; FAO, 2010).
To improve responses to climate change, Africa (as a continent, individual countries, and organizations within the continent) needs to more effectively manage climate change knowledge, including IK. Climate change knowledge management is a subset of a knowledge management process consisting of: knowledge creation (its capture and organization); knowledge storage and packaging; knowledge searching and retrieval; knowledge transfer and reuse; and knowledge application, revision and feedback (Maier and Hädrich, 2011; Alavi and Leidner, 2001).
According to Pohl et al. (2010), knowledge co-production processes are numerous, need to be considered systematically, and should be addressed at different levels – including the levels of theory, practice, training and institutions. Knowledge management processes are described below:
1. Knowledge creation – Knowledge creation involves developing new knowledge or replacing existing knowledge, both tacit and explicit. Through research, different knowledge collected from various sources is compiled into a database. Tacit knowledge (e.g., abilities, developed skills, experience, undocumented processes, ‘gut-feelings’, etc.) is highly personal and difficult to capture in writing (Holste and Fields, 2010). Tacit knowledge is rooted in an individual’s experience and values (Nonaka and Konno, 1998). Explicit knowledge is easily articulated and/or captured in writing, is often impersonal and formal in nature, and frequently takes the form of documents, reports, ‘white papers’, catalogues, presentations, patents, formulas, etc. (Nonaka, 1991).
2. Knowledge search/retrieval and storage and packaging – Knowledge retrieval include locating
knowledge residing in various component forms, defining its structure, codifying it, and storing knowledge as part of organizational memory. In this instance, the use of information and communication technologies plays a major role.
3. Knowledge transfer and reuse – Knowledge transfers exist between individuals, individuals to groups, groups to groups, and groups within and across organizations. Through training and mentoring, the knowledge produced is transferred among actors.
4. Knowledge application – This is the integration of knowledge into organizational processes or activities such as directives, organizational routines, and self-contained task teams. The knowledge can be applied through training programs such as farmer field schools or extension programs. New knowledge gained from the application of existing knowledge is collected and stored, and becomes part of the feedback loop.
Effective knowledge management only happens when it is done systematically and comprehensively. As such, knowledge management systems (by default or by design) assist organizations and/or communities achieve maximum benefits from existing and new knowledge. Africa needs knowledge management systems that effectively create, store, transfer, and apply climate change knowledge from indigenous or farmer-led systems, as well as scientific knowledge management systems. To better understand how to create new knowledge management systems, the two existing systems need to be compared and contrasted. Such a comparison was carried out using the Knowledge Management Practice Framework developed by Gallupe (2001) (see Figure 5.1) and based on the work of Gray and Chan (1999). They defined ‘problems’ as the ‘desired states’, and the framework examined knowledge management practices in two dimensions. The first dimension is the process to be supported (problem recognition or problem solving), while the second dimension is the class of problem being solved (new/unique or previously solved). The integration of these dimensions resulted in four classes of knowledge management practices that may be supported by KMS. That is, problems may be viewed as opportunities, threats, or simply as an ‘undesired state’ that needs changing. These are summarized below:
Encouraging serendipity: KMS support for problem recognition – The first class of knowledge management practices involves encouraging serendipity. The knowledge management practices in this quadrant focus on problem identification through the generation

Africa Agriculture Status Report 2014 | 167
and sharing of knowledge. Encouraging serendipity is the notion that the creation and sharing of knowledge can result in the recognition of new or unique problems. Indigenous KMS practices in this quadrant involve demonstration and observation, abstract critical thought, thoughtful stories, lists, and tables (without writing). Cajete (2000) observed that IK systems are not static or unchanging artifacts of a former life way, but rather have been adapting to the contemporary world since contact with others began, and thus they will continue to change. The expert-based knowledge management systems in this quadrant are populated mainly by researchers, and by students working on research papers. Practices include the use of chat rooms, search engines, and other computer-based tools.
Knowledge creation: KMS support for problem solving – The second class of practices involve knowledge creation. The practices in this quadrant address knowledge creation to solve new problems. That is, problems have been identified and now knowledge is being created to solve them. To ensure that the body of knowledge is instantly accessible to the user when needed, indigenous KMS uses constant repetition and practice through training until the knowledge becomes completely tacit – an unreflective skill. One of the most important components of this tacit knowledge or skill set is constant awareness or cognitive mapping (Sheila et. al., 1995). Expert-based knowledge management practices in this quadrant include knowledge forums, communities of practice, and structured brainstorming. KMS to support these practices include discussion forums, management of online user groups, and constrained electronic brainstorming.
Knowledge acquisition: KMS support for knowledge codification and storage – The third class of practices focus on knowledge acquisition. The knowledge management practices in this quadrant deal with the codification, preservation and storage of knowledge. That is, they focus on organizing knowledge, extracting tacit knowledge to make it explicit, and designing schemes to store knowledge so that it can be easily retrieved. The indigenous KMS practices in this quadrant ensure that vast body of detailed data is accurately retained and passed from one generation to the next through encoding of knowledge in songs and rituals. Expert-based KMS practices in this quadrant include such processes as knowledge/data capture, developing knowledge maps, and entering knowledge into document management systems. Knowledge management systems to support these practices include KMS generators such as Lotus Notes and other database management systems. Regular training will ensure effective use of these tools for proper knowledge codification and training.
Mentoring and training: KMS support for knowledge dissemination and sharing – The fourth class of practices includes mentoring and training. The knowledge management practices in this quadrant focus on problem recognition relative to previously solved problems. These practices typically involve transferring or sharing knowledge with others. The intent is that by disseminating knowledge to others, the potential to solve a problem that has occurred before will be greater. Indigenous KMS practices in this quadrant involve group learning and testing sessions and mnemonics. Expert-based KMS practices include
New / Unique
Problem Recognition
Encouraging Serendipity (1)
Knowledge Creation (2)
Mentoring & Training (4)
Knowledge Acquisition (3)
Problem Solving
Previously Solved
CLASS OF PROBLEM
PROBLEM PROCESS
Figure 5.1 Knowledge practices framework for knowledge management systems
Source: adapted from Gallupe, 2001

168 | Africa Agriculture Status Report 2014
mentoring programs, formal training and education programs, and formal knowledge-sharing incentive schemes, as well as group learning. An example would be the role of extension in educating and equipping farmers with information to deal with, cushion and adapt to climate change impacts on agriculture.
Key drivers of knowledge management systems Changes in policy context, fundamental shifts in the scientific basis for research and development (R&D), and shifting funding patterns for agricultural R&D have driven KMS. Pardey et al. (2013) show how that the growth in real public sector agricultural R&D spending has transitioned from an extended period of slowing down to one of no growth or negative growth. This trend is also seen in SSA, which has also lost market share, declining from 10% of the world’s total in 1960 to 6% in 2009. This fall is attributed to less public and private investment in formal forms of R&D. The authors conclude that the incongruous patterns of agricultural research investments and the value of agricultural production today will have implications for the patterns of agricultural productivity and production for decades to come, and especially as climate change introduces additional challenges.
Four primary issues drive KMS (Becerra-Fernandez, et al., 2008):
1. Increasing domain complexity – The Intricacy of internal and external processes, such as the complexity of the knowledge required to complete a specific business process task coupled with increased competition, and the rapid advancement of technology, all contribute to increasing domain complexity (Becerra-Fernandez, et al., 2008). As such, there is a critical need to understand and develop effective organizational and procedural mechanisms that can help to systematically improve performance. According to Becerra-Fernandez, et al. (2008), the nature of the decisions, where they are made, who makes them, the data and information resources required to make and monitor them, and the location of available knowledge to drive them, may sometimes be unknown, unavailable, or both. In recent years, the vulnerability of SSA smallholder farmers has risen due to increasing variability in domain complexity related to climatic conditions, complex terrain (Kleiber et al., 2013), internal community dynamics being influenced by external forces (Briggs and Boyson, 2012), and land degradation and soil fertility management challenges (Reed et al., 2011; Giller et al., 2011)
2. Accelerating market volatility – The pace of change, or volatility, within each market domain has increased rapidly in the past decade (Becerra-Fernandez, et al., 2008). Agricultural commodity prices have experienced sharp increases due to climate change, volatile global food and energy prices, and a reliance on farmers’ and rural communities’ own devices (Gardebroek et al., 2014; Hazell, 2013). According to Hazell (2013), although smallholder farms in Africa are opening up new market opportunities to private sector investments, many smallholders are also missing out on participation in new, higher-value, production and marketing channels (value chains); they also lack ready access to modern inputs, credit, and market outlets. This is due to low individual volumes of production (lack of aggregation), poor market information and contacts, limited ability to meet the high quality and reliability requirements of many high-value buyers, competition from corporate-sized farms, and the inability of smallholder farmers to produce enough food to feed their families, much less surpluses for marketing purposes. In addition, political linkages, regulatory frameworks, lack of timely access to relevant information, unfavorable land tenure arrangements, and a lack of improved infrastructure and support structures all hamper productivity (Hounkonnou et al., 2012).
3. Intensified speed of responsiveness – The time available to respond to subtle changes within and across domains is decreasing (Becerra-Fernandez, et al., 2008). Rapid advances in technology are continually changing the decision-making landscape, and approaches to creating knowledge that is usable by farmers must change accordingly. For example, the absence of state-of-the-art research laboratories has undermined the development of agriculture education and related links to biotechnology. According to Struik et al. (2014), globalization is a primary driver of intensification in agriculture, which leaves most smallholder farmers in Africa unable to compete; they are simply not capable of taking advantage of, and capturing the benefits from, economies of scale. Struik et al. (2014) indicate that there was no visible growth in agricultural productivity in West Africa due to the fact that the knowledge generated by science did not match the knowledge systems of rural communities, even though farmer participatory research approaches were used.
4. Diminishing individual experience – High rates of employee turnover have resulted in individuals with decision-making authority having shorter tenure within their organizations than ever before (Becerra-Fernandez, et al., 2008). Due to this trend, the experience of new decision makers may not be relevant to decisions that need to be made.

Africa Agriculture Status Report 2014 | 169
According to Moss et al. (2010), advances in the science and observation of climate change are providing a clearer understanding of the inherent variability of the Earth’s climate system and its likely response to human and natural influences. There are also very few experts with experience in the science/policy interface. However, being able to adapt effectively to climate change requires that the past experiences and perceptions of individuals be brought to bear. Tanner et al. (2013) argue from
their experience that knowledge management focused on tackling climate change requires much greater use of explicitly collaborative and improvisational learning approaches, rather than conventional supply-driven knowledge platforms. They assert that such learning approaches are better able to situate the climate change and development problem within the diverse range of personal, organizational, and problem contexts in which it is encountered.
Barriers and Opportunities in Knowledge Management Systems and CSA AdaptationKnowledge management as a process faces many challenges. Some of these include information overload; lack of obvious linkages between various pieces or categories of knowledge; diverse information and legacy systems; lack of information documentation; existence of redundant, inconsistent and obsolete information; limited human, fiscal and technological resources; diverse user and organizational interests and needs; established organizational cultures that are difficult to change; organizational politics, competition and lack of cooperation; and dynamic information needs and information seeking behavior (Kwanya, 2009).
Communities have a wealth of knowledge about the local environment, and have been adapting to and coping with change for years. Although this knowledge and associated traditional coping mechanisms may become less effective as climate change leads to greater unpredictability in weather patterns and more extreme weather events, they remain invaluable resources and, in the absence of historical written records, are often the only source of information on such things as rainfall trends. However, co-producing knowledge in interactive ways can help address this challenge, as knowledge from both science and society are combined. The knowledge produced will then be co-managed and co-learned by both the scientific and indigenous communities.
Co-management and co-learning initiatives are critical for ensuring that local and scientific communities harmoniously work together, learn from each other, and feed back the lessons learned into planning processes at all levels. This includes planning at local community levels, as well as in planning research activities and developing new policies and regulations. Resource management approaches that rely only on centralized government interventions have consistently proven inadequate.
Co-management has been defined as a collaborative and participatory process of regulatory decision-making among representatives of user groups, government agencies, and research institutions (Jentoft et al., 1998), or as a resource management partnership in which local users and other stakeholders share power and responsibility with government agencies (Berkes, 2009). Co-learning is the systematic approach to maximizing the synergies between research and teaching activities to capitalize on prior learning and experiences of all involved (Heron et al., 2006).
For many indigenous communities, resilience to the impacts of climate change is rooted in traditional knowledge, as their capacity to adapt to environmental change is based first and foremost on in-depth understanding of the land (McLean, 2012). Local communities make careful observations about their lands, exchange information and experiences, and plan for the future.
To underscore the critical role played by indigenous people and knowledge on climate change issues, the International Indigenous Peoples Forum on Climate Change (IIPFCC) stated “we reiterate the need for recognition of our traditional knowledge, which we have sustainably used and practiced for generations, and the need to integrate such knowledge in global, national and sub-national efforts”, (McLean, 2012). It is now increasingly recognized that, for poor communities, adaptation approaches that are rooted in local knowledge and coping strategies, and in which communities are empowered to take their own decisions, are likely to be far more successful than top-down initiatives. In addition, communities have the right to participate in decisions that affect them.
Co-management can be very empowering for communities. It allows for learning and adaptation by communities and a broad range of stakeholders. It also
170 | Africa Agriculture Status Report 2014
empowers them to participate equally in negotiation and management decisions, and ensures room for all to “negotiate from strength rather than from an underdog position” (Jentoft, 2006). Adaptive co-management and co-learning between local and scientific communities offers a great opportunity for the generation of knowledge that will help local communities adapt to climate change, but more importantly be inclusive in planning processes and have their voices heard at policy levels. Genuine and participatory co-learning will take place when there is respect among the different actors and two-way collaboration under the following attributes (Plummer and Funnell, 2010):
1. Pluralism and communication – Actors from diverse spheres of society (and at multiple levels) and who have varying principal interests enter into a process to generate shared understanding of an issue or problem. This process is grounded in communication and negotiation. Conflict is viewed as an opportunity.
2. Shared decision-making and authority – Transactive decision-making is employed as a basis for achieving decisions. Multiple sources of knowledge are acknowledged. Authority (power) is shared in some configuration among the actors involved.
3. Linkages, levels and autonomy – Actors are connected or linked both within levels (i.e., a community) and across scales (i.e., community, provincial, national). Despite shared interests and commitments, actor autonomy is appropriate at multiple levels. Institutional arrangements therefore encompass multiple levels, as well as retain flexibility.
4. Learning and adaptation – Actions and policies are considered experiments. Feedback provides opportunities for social learning in which outcomes are collectively reflected upon, and modifications to future initiatives are based. Learning may concern routines, values, and policies, and/or critical questions about underlying governance systems. This is sometimes referred to as multiple-loop learning. Capacity to change and adapt develops as trust and knowledge accumulates in the collective social memory.
Although co-management and learning has taken root in other environmental fields, much less has been carried out in the climate arena. This is because certain barriers still exist that makes co-learning and management a challenge. Technical jargon is a major challenge to farmers in terms of interpreting climate information and even through broadcasts. Vague and overly broad information about climate change has led many farmers to not trust meteorological information.
There have been cases in which predictions concerning rainfall have not been accurate and farmers have even taken meteorology stations to court, accusing them of giving false information. While local people are extremely aware of changes in their environment, they often have little knowledge of the global causes and effects of climate change. In all these scenarios, there are no policies enacted to enhance these linkages and promote co-learning. Usually, actions taken in this arena are driven by donor-funded projects or university research, with little support from governments.
Although co-learning and co-management in climate change is relatively new compared to other spheres in development work, there are good models that can be replicated and lessons to share with other efforts. Some communities are working to address climate change by combining their indigenous knowledge with other information sources to try to predict weather events in order to plan for and adapt to the impacts of climate change. NASA is working with local communities to help them access satellite data that they can use at the local scale. An initiative known as PROLINNOVA (Promoting Local Innovation Ecologically Oriented Agriculture and Natural resources Management) promotes the use of Participatory Innovation Development (PID), in which local innovators, supported by researchers, jointly develop knowledge from local communities.
A case in point is drip irrigation in Ethiopia using local resources to mitigate the effects of drought. Christian Aid uses the Community Based Adaptation (CBA) process, with which they enhance scientific data accessible to communities who use this information to adapt and remain in control of the CBA process. Such information is useful for community planning, such as remote sensing observations, satellite pictures, downscaled climate scenarios, and seasonal and long-range weather forecasts. Where these are available, communities need to learn how to interpret them. Participatory climate forecast workshops were held in Zimbabwe, in which forecasts for the coming season, expressed in terms of probabilities rather than firm predictions, were explained to farmers, and then downscaled using farmers’ own historical rainfall data (Christian Aid, 2009).
One approach that has proven effective in sharing scientific knowledge about climate change, including climate smart agriculture, with farmers is the use of easy-to-understand publications, audios, videos, etc., which simplify scientific research into everyday language. One such magazine – Joto Afrika, which is produced by the Arid Lands Information Network (ALIN) – has gained respect among the research community, academicians, educationists, extension workers and even farmers.

Africa Agriculture Status Report 2014 | 171
The Role of Formal Agricultural Education and Training in Africa Formal education and training addresses the knowledge practices framework of Figure 5.1, especially the quadrants related to training and mentoring, knowledge creation, and knowledge acquisition. Education and training include all the above and it is an important part of knowledge management as it results in knowledge acquisition and generation through learning, research and training, as well as supervision. This section addresses the work of several organizations involved in linking farmers to knowledge through education and training.
Temu et al., (2003), describes the linkage between education and society (Figure 5.2). Education can be described as the process of preparing an individual to become a functional and acceptable member of society. Two concepts are in-built within the definition of education: 1) creation of knowledge and experience, and 2) growth and development. Unless tertiary agricultural education (TAE) is able to respond to
societal challenges and expectations, society will have difficulties in understanding the roles of TAE. There is very limited incorporation of climate change issues in the curricula of tertiary agriculture and natural resources management training in SSA. While models are available that predict the likely impacts of climate change, scientists are focused on adaptation and mitigation strategies. Graduating students are therefore at a loss regarding advising farmers on how to deal with climate change.
Education and training A few institutions, including AGRA and The African Network for Agriculture, Agroforestry and Natural Resources Education (ANAFE) are supporting capacity building for trainers and educators in sub-Saharan Africa to address emerging issues such as climate change.
Figure 5.2 Education and societal inter-linkages
Source: Temu et al., 2003
EDUCATIONAL CHANGES
CHANGES RELATED TO THE TEACHING AND LEARNING PROCESS:
• New/improved knowledge• New/improved practices• Livelihood strategies • Economic growth• Care for natural resources and environment
How education influences society:Graduate employmentResearch, outreach and public debates
How society influences education:Development practiceChanges of policiesChanges in financial and institutional arrangements
• Institutional innovation• Relevance of curricula • Relevance and effectiveness of teaching and learning methods,
tools and materials• Education delivery capacity (human resources and learning
facilities)
SOCIETAL CHANGES
LOCAL, NATIONAL AND GLOBAL TRENDS:
172 | Africa Agriculture Status Report 2014
AGRA’s contributions to education and training in Africa AGRA has begun contributing to climate preparedness efforts across the spectrum of education and training through the capacity building initiatives described below. AGRA is investing in the rapid expansion of human capacity in order to bring about a transformation of African agriculture, characterized by dramatic increases in smallholder farming productivity and profitability, higher smallholder incomes, and stronger research capacity in African universities and other institutions. The best way to undertake developing a broad spectrum of skills and experience at various levels is through Africa’s educational institutions. However, due to underinvestment, particularly in tertiary education in agricultural fields, these institutions currently lack the teaching, research and physical capacity to produce the required cadre of professionals. AGRA’s educational programs involve four core components:
1. Providing scholarships to support the training of post-graduate students (MSc and PhD levels) to address the needs of smallholder farmers;
2. Scholarships for short-term vocational training for mid-level professionals to boost their skills in teaching, research, data analysis, and innovation;
3. Institutional support to expand and upgrade existing universities and research centers. This includes grants for professional development, collaborative research, and facility improvement; and
4. Measures to support and enhance research networks so that knowledge generation and dissemination are responsive to stakeholders’ needs and concerns, particularly those of farmers, policy makers, and farmer organizations.
AGRA’s support for education and training contributes to preparing societies to adapt to climate change by providing research and education through training of young agricultural professionals. It also supports the updating of curricula at universities across a diverse range of disciplines, including soil science, agronomy, crop science, extension, and policy. There is need to modify the content of current courses and improve teaching methodologies so as to produce African scientists with the skills needed to deal with existing and emerging challenges more effectively and sustainably. It is important to emphasize the need for colleges and universities to integrate climate change and resilience into their core curricula to provide all students with at least a basic understanding of these issues, in addition to offering specialized courses within particular disciplines. However, the major challenge to curricula review and implementation is resources. Effective lobbying of national governments and donor partners is imperative if the reviewed curricula are to be implemented.
Declining soil fertility, a lack of improved crop varieties adapted to changing climatic conditions, poor institutional arrangements such as markets and supportive policies, and the lack of a critical mass of well-trained professionals are critical issues that must be addressed. The New Partnership for Africa’s Development (NEPAD) has estimated that only 2% of Africa’s agricultural scientists are focused on soil health (FAO, 2002) and, in large part, AGRA believes that this neglect of soil health issues accounts for the past 40-year trend in SAA per capita food production – which has been in a pronounced downward direction (Diagana, 2003). Soil science and the training of soil scientists should take center stage in agriculture, but this is not the case in Africa. The limited numbers of trained specialists are heavily overloaded, and many are either near retirement or already retired. The importance of addressing capacity gaps to enable Africa to achieve its declared target of 6% annual growth in agriculture has been widely articulated within Africa, starting with the Maputo Declaration of 2003. More recently, it was explicitly addressed in the Communiqué from the Ministerial Conference on Higher Education in Agriculture in Africa (CHEA, Kampala, November 2010). From AGRA’s perspective, training agricultural professionals to understand the impacts of climate change and how best to address them remains an imperative as these impacts become increasingly evident across the continent.
To catalyze change, AGRA provides mentorship and grants for MSc and PhD degree training, infrastructure maintenance (computer and laboratory facilities), and curriculum development, as well as vocational training for extension agents, field and laboratory technicians, agrodealers and farmers. As a crosscutting activity, investments in education and training are made in the following areas:
Africa Agriculture Status Report 2014 | 173
Seed systems/crop improvement – These investments focus on the breeding and dissemination to farmers of a wide range of African staple crops to ensure the availability of improved, well-adapted varieties. The adverse effects of climate change in the form of water scarcity (prolonged droughts), floods, and all manner of plant diseases (old and new) and insects are already causing significant yield reductions. AGRA’s seed program is investing in training a new cadre of African plant scientists at 14 universities in 10 countries. These young scientists will be responsible for developing new crop varieties attuned to local needs and changing climates. To date, 380 students have received support for either MSc or PhD training in plant breeding, seed systems, and other crop improvement disciplines; these students hail from 16 SSA countries. So far, graduates have developed over 90 improved varieties of maize, rice, sorghum, beans, groundnut, cassava and sweet potato, with still more to come. To ensure capitalization on indigenous knowledge, varietal development involves farmer participation in plant breeding. Farmer involvement helps breeders to focus on varieties suitable for specific agro-ecologies, and is leading to the development of new early and extra-early varieties of crops that better match shortened rainy periods. New varieties with drought tolerance and specific insect and disease resistance are aligned with existing understanding of the effects of climate change, and are opening opportunities for generating new skills and knowledge needed to respond effectively as the impacts of climate change become more evident. These better-adapted varieties will go a long way in strengthening small farmers’ resilience to climate change.
AGRA-sponsored students, together with their professors, have so far written over 150 publications on various aspects of plant sciences in Africa, resulting in a wealth of new knowledge about African food crops and how to be more effective in improving them. For example, a publication by Asante et al. (2013) documents how participatory rural appraisal (PRA) tools were used to generate reliable and relevant information on farmer perceptions through probing, iteration, observation and preference rating. They concluded that it is imperative to assess farmers’ perceptions and opinions from the beginning of the research process and incorporate them into research programs, as this will enhance the acceptability of research outputs (such as improved varieties).
Addressing soil infertility through cutting-edge training – AGRA’s investments in this area are designed to improve farm-level productivity by increasing farmers’ access to locally appropriate soil nutrients and promoting integrated soil and water management practices. Soil conditions are closely linked to the hydrological cycle, the balance of which will be affected by climate change. New and more volatile rainfall and temperature patterns are likely to impair the supply of nutrients to plants from the soil, as well as the regulation of water flow and quality, and therefore affect crop productivity. Understanding how soils function under different climatic conditions and how to manage them to ensure sustainability is a tremendous challenge, but also a great opportunity for the agricultural sector. AGRA’s dream to move from pale yellow to green crops in Africa will be realized only when the requisite manpower is developed to improve soil fertility management by smallholder farmers. Triggering a green revolution in Africa rests not only on crop improvement, but also on training a cadre of African scientists who will develop the technologies and best practices needed to restore and maintain soil fertility. AGRA strives to prepare students to become critical thinkers, to act as change agents, and to address new and emerging issues. This requires them having a deep understanding of soils and soil processes, in addition to specialized technical skills and knowledge about best practices for responding to changing climatic conditions.
Key to linking universities to society is the need for them to reform their curricula in ways that will produce knowledge and skills that are relevant to society. The curricula of AGRA-supported universities have been reviewed and upgraded to include climate change course modules. This curriculum review process has been participatory and highly consultative, involving such key stakeholders as the partner universities themselves, the Regional Universities Forum for Capacity Building in Agriculture (RUFORUM), ANAFE, selected agribusiness personnel, and NARS scientists and managers. The process has ensured ownership and relevance of the course offerings at partner universities. Periodic monitoring and evaluation of revised curricula is done to continually enhance relevance and quality. For example, research from RUFORUM integrated indigenous knowledge and perceptions of effective communication systems for adaptation to climate change by smallholder farmers of Kilifi District, Kenya (Achiando et al., 2012). The study focused on determining the extent to which agricultural information and communication systems have integrated indigenous knowledge for climate change adaptation by the end users of the information coming from these systems. The results indicate that the existing agricultural information and communication systems are not seen to be effective in disseminating agricultural knowledge to farmers. Agricultural information and communication systems being used by extension providers do encourage feedback from information users, but this feedback does not translate into the needs and priorities of farmers being incorporated into research agendas. Indigenous technical knowledge was found to play a large role in addressing many problems and farmers in Kilifi integrate it into science-based methods for managing climate change challenges, such as floods, drought, erratic rainfall, pest incidences, and heat.
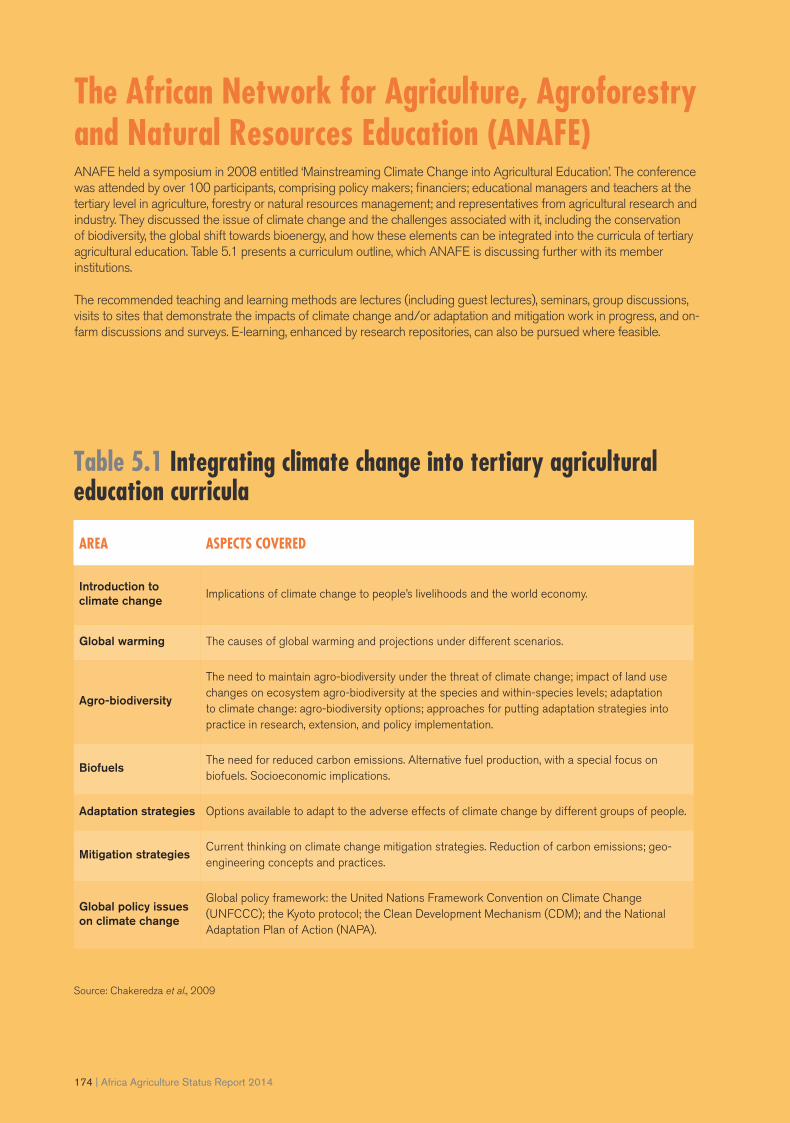
174 | Africa Agriculture Status Report 2014
The African Network for Agriculture, Agroforestry and Natural Resources Education (ANAFE)ANAFE held a symposium in 2008 entitled ‘Mainstreaming Climate Change into Agricultural Education’. The conference was attended by over 100 participants, comprising policy makers; financiers; educational managers and teachers at the tertiary level in agriculture, forestry or natural resources management; and representatives from agricultural research and industry. They discussed the issue of climate change and the challenges associated with it, including the conservation of biodiversity, the global shift towards bioenergy, and how these elements can be integrated into the curricula of tertiary agricultural education. Table 5.1 presents a curriculum outline, which ANAFE is discussing further with its member institutions.
The recommended teaching and learning methods are lectures (including guest lectures), seminars, group discussions, visits to sites that demonstrate the impacts of climate change and/or adaptation and mitigation work in progress, and on-farm discussions and surveys. E-learning, enhanced by research repositories, can also be pursued where feasible.
Table 5.1 Integrating climate change into tertiary agricultural education curricula AREA ASPECTS COVERED
Introduction to climate change
Implications of climate change to people’s livelihoods and the world economy.
Global warming The causes of global warming and projections under different scenarios.
Agro-biodiversity
The need to maintain agro-biodiversity under the threat of climate change; impact of land use changes on ecosystem agro-biodiversity at the species and within-species levels; adaptation to climate change: agro-biodiversity options; approaches for putting adaptation strategies into practice in research, extension, and policy implementation.
Biofuels The need for reduced carbon emissions. Alternative fuel production, with a special focus on biofuels. Socioeconomic implications.
Adaptation strategies Options available to adapt to the adverse effects of climate change by different groups of people.
Mitigation strategiesCurrent thinking on climate change mitigation strategies. Reduction of carbon emissions; geo-engineering concepts and practices.
Global policy issues on climate change
Global policy framework: the United Nations Framework Convention on Climate Change (UNFCCC); the Kyoto protocol; the Clean Development Mechanism (CDM); and the National Adaptation Plan of Action (NAPA).
Source: Chakeredza et al., 2009

Africa Agriculture Status Report 2014 | 175
Case Studies A case studies approach is used in this chapter to demonstrate the implementation of knowledge management systems in African agricultural development. The case studies portray how knowledge is co-produced informally (indigenous knowledge) and formally (formal education and training). They also demonstrate dissemination of knowledge through farmer organizations.
Co-production of knowledge
Case Study: Zaï Technique – Indigenous knowledge for soil and water conservation and erosion control for degraded soilsSince the 1980s, in response to climate change, Sahelian farmers have experimented with various soil and water conservation techniques to restore, maintain or improve soil fertility. One of the most widely used indigenous techniques used by farmers in northern Burkina Faso is the plant-pit system (demi-lunes), or “Zaï” in the local language. Farmers apply the Zaï technique to recover crusted land. The technique was initiated in Mali’s Dogon area and was further developed in northern Burkina Faso by farmers after the drought of the 1980s. The Zaï is a planting pit with a diameter of 20-40 cm and a depth of 10-20 cm (the dimensions depend on the type of soil). Zaï pits are dug during the dry season (November-May) and the number of Zaï pits per hectare can be up to 25,000 (World Bank, 2005). Zaï pits conserve soil and water, and control erosion on already degraded soils.
The advantages of Zaï are that it: 1) captures rain and surface runoff; 2) keeps seeds and organic matter from being washed away; 3) concentrates nutrient and water availability at the beginning of the rainy season; 4) increases yields; and 5) reactivates biological activities in the soil and eventually leads to an improvement in soil structure. If properly executed, the application of the Zaï technique can reportedly increase production by about 500% (World Bank, 2005).
Zaï pits have also been shown to be effective in a highland area of Ethiopia that receives in excess of 1300 mm annual rainfall and where water infiltration into the soil is limited by rapid runoff. Recognizing the high potential for soil erosion, the pits were enlarged to withstand the strong downhill flow of rainfall runoff. In this area, Zaï pits, in combination with additions of nitrogen, increased potato yields 500-2000%; bean yields were increased by 250% (Amede et al., 2011).
In central Burkina Faso, the Association pour la Vulgarisation et l’Appui aux Producteurs Agroécologistes au Sahel (AVAPAS) is providing support to farmers for scaling up the dissemination of the Zaï technique in three provinces. The scale-up has led to the following impacts on local farmers (World Bank, 2005):
• The exchanges between farmers and the AVAPAS team have reinforced the IK that farmers have acquired.
• More than 100 farmers in 32 villages benefited from this IK transfer.
• In the majority of villages, the surplus production realized by farmers was higher than 0.5 t/ha.
• In some provinces, the Zaï technique is the only reason that agricultural production is even possible on highly degraded lands.
The Zaï technology used to conserve water and to restore, maintain and improve soil fertility is a clear case of using IK for agricultural development. Farmer innovators and trainers were the focal persons for extension services. According to Fatondji et al. (2011), the Zaï technology helped improve the wetting front during the cropping period, although a loss of soil nutrients was observed. A serious constraint to the widespread dissemination of improved practices is funding (Kabore-Sawadogo, 2012)
176 | Africa Agriculture Status Report 2014
Dissemination of knowledge produced
Case Study: UGCPA farmer organization of Burkina FasoThe Union of Groups of Marketing of Agricultural Products (UGCPA) has worked with donors and government to implement interventions that are contributing to climate change mitigation. UGCPA was created in 1993 with the main aim of collective marketing of grain surpluses (maize, sorghum, millet, beans, and sesame) and hibiscus flowers produced by its members. Its membership comprises 2,500 producers (1,000 women and 1,500 men) organized into 105 farmer groups distributed across 6 provinces of the Mouhoun Region of Burkina Faso.
The Union’s Agriculture Environmental Service addresses aspects of climate change from two dimensions: biogas production and tree planting. Under the biogas project, farmers are trained how to use animal waste to produce biogas for lighting and cooking. This helps to protect the forests, as women are no longer cutting trees for firewood. Tree planting has several advantages: they absorb nitrogen from the air, which is then translocated through the roots into the soil as nutrients; during the dry season, trees provide shade for crops; in the rainy season, trees shed their leaves and contribute to soil organic matter, thus helping water to percolate into the soil more easily; tree fruits are often used as animal feed and, depending on the type of tree, as food for local people.
Africa Agriculture Status Report 2014 | 177
Conclusions and Recommendations The examples of institutions supporting capacity building and case studies above demonstrate how knowledge management systems can be formally created through research, education and training, and informally through farmers. Important components of knowledge management systems include: smallholder farmers’ awareness of climate change and resulting weather variability; the likely impacts and stresses associated with these changing circumstances; and indigenous knowledge systems in agriculture and the application of IK and skills in adapting to climate change and building resilience. In addition, scientific information derived from empirical research, education and training, are also important sources of knowledge. According to Jones and Sallis (2013), one key to successful knowledge management is the exploitation of all knowledge forms, both formal and informal, which can be achieved by open, knowledge-sharing cultures and processes, linked to appropriate technology. Realizing the potential benefits of the co-production of knowledge, relevant information is put to productive use. Improving co-learning and co-management among actors will establish mutual accountability systems, effect changes in practices and behavior, improve knowledge quality and application, and result in farmer-led solutions in a supportive environment to adopt climate smart agriculture and build resilience. The knowledge produced should be co-managed through networks and co-learned through training centers. AGRA-supported education and training activities provide good example of co-learning.
There are great opportunities to build upon or replicate co-management research and development work already underway in various parts of Africa. Specifically, the following opportunities and recommendations deserve further attention:
• Document indigenous knowledge processes in an honest and critical way so as to improve its credibility and accessibility to large populations. There is a risk of losing IK as more youth move to urban areas.
• Enhanced use of ICT that will bridge the digital divide between local communities and the scientific world. Local African communities have greater access to mobile phones, and hence are able to download satellite images and interpret them for other community members. This is a role that can be played effectively by youth.
• Use of innovative platforms/space. These will be essential in bringing together all stakeholders and providing a forum for learning and exchanging ideas.
• Youth engagement in climate change adaptation and information exchange. There is need to encourage youth (both in and out of school) to be aware of the need to integrate local and scientific knowledge on climate change.
• Policies are needed that will ensure IK is valued and taken into account by scientific communities, and even to develop related curricula in academic institutions.
• Incorporating farmer organizations into information delivery systems. Well-organized farmer groups will be able to receive and pass information to group members and even test new information or knowledge at the local level.
• Experimentation and Innovation needs to be encouraged, as this will enhance adaptation by local communities using various knowledge sources, including scientific knowledge.
• A value chain approach in community-based adaptation will enhance the sustainability of adaptive approaches and improve the livelihoods of community members. Many times, such activities do not focus on business angles and thus become hard to sustain after a given project is completed.
• Availability of climate data. It is now much easier to access climatic data from national, regional and international sources that can be used at local levels.
• A curriculum that addresses climate change training at all levels of African educational systems (primary, secondary, tertiary) should be encouraged
• Introducing farmer field schools through extension services that are focused on CSA technologies and interventions appropriate to different environments should be encouraged.
• Building the resilience of smallholder farmers will require ICT-Based KMS. This will call for intensification of ICT learning among farmers. Develop simple, easy-to-use ICT tools that farmers and other stakeholders can use, taking into account a majority of smallholders are not highly literate in ICT tools.
• Transforming African agriculture requires innovative scientific research and strong efforts to strengthen the teaching of interdisciplinary and multidisciplinary approaches.

178 | Africa Agriculture Status Report 2014
• Agricultural education systems need to be more connected to the new challenges facing rural farming communities and need to build the capacities of youth who can contribute to the transformation of agriculture in Africa.
• Complex challenges need to be addressed in a multidisciplinary manner, involving diverse stakeholders (farmers, government, private sector, civil society organizations and research institutes).
• African governments, development partners and other stakeholders should focus on promoting and investing in a rapid expansion of Africa’s human capacity to lead and bring about the needed transformation of agriculture.
• Africa must invest in people at all levels of society, and in particular, build capacities in all aspects of the agricultural value chains.
• Capacity building is central to ensuring that increased agricultural productivity and more efficient value chains ultimately lead to positive impacts on the livelihoods of the rural poor.
In conclusion, there is a need for countries to pool resources in the context of regional integration and develop centers of excellence related to climate change; such centers will be critical for the delivery of agricultural extensional services or ‘group learning’. Moreover, KMS aimed at reducing post-harvest losses, managing dietary changes, etc., in the face of climate change and environmental stress should be enhanced. Major players, such as donors, the private sector, governments, and civil society, need to cooperate in shaping the KM and education architecture necessary to build the resilience required in African communities to cope with the impacts of climate change.

Africa Agriculture Status Report 2014 | 179
ReferencesAchiando, G. A., Birech, R. & Ocholla, W (2012). Integration of indigenous knowledge and perception of effectiveness of communication systems for adaptation to climate change by smallholder farmers of Kilifi district, Kenya. A research paper presented at RUFORUM Third Biennial Conference, Entebbe, Uganda, 24-28 September 2012, Kampala, Uganda
Agrawal, A. (1995). Dismantling the divide between indigenous and scientific knowledge. Development and change, 26(3), 413-439.
Alavi, M., & Leidner, D. E. (2001). Review: Knowledge management and knowledge management systems: Conceptual foundations and research issues. MIS quarterly, 107-136.
Alexander C, Bynum N, Johnson E, King U, Mustonen T, Neofotis P, Oettle N, Rosenzweig C, Sakakibara C, Shadrin V, Vicarelli M, Waterhouse J, Weeks B. (2011). Linking indigenous and scientific knowledge of climate change. BioScience, 61(6), 477-484.
Amede,T., S.Tarawali., and D.Peden (2011). Zai improves nutrient and water productivity in the Ethiopian Highlands (Special issue: Improving water productivity of crop –livestock systems in drought-proneregions). Experimental Agriculture, 47 (Suppl:1): 7-20
Andrea Egan (2013). Knowledge Management Strategy on Climate Change Adaptation for Cameroon. Africa Adaptation Program, Yaonde, Cameroon
Asante, M. D., Asante, B. O., Acheampong, G. K., Wiredu, A. N., Offei, S. K., Gracen, V., Adu-Dapaah, H., & Danquah, E. Y. (2013). Grain quality and determinants of farmers’ preference for rice varietal traits in three districts of Ghana: Implications for research and policy. Journal of Development and Agricultural Economics, 5(7), 284-294.
Becerra-Fernandez, I., Xia, W., Gudi, A., & Rocha, J. (2008). Task characteristics, knowledge sharing and integration, and emergency management performance: research agenda and challenges. In Proceedings of the 5th International Conference on Information Systems for Crisis Response and Management (ISCRAM 2008), p. 88-92.
Briggs, J., & Moyo, B. (2012). The resilience of Indigenous knowledge in small-scale African agriculture: key drivers. Scottish Geographical Journal, 128(1), 64-80.
Cajete, G. (2000). Indigenous knowledge: The Pueblo metaphor of Indigenous education in Reclaiming Indigenous voice and vision, Ed Marie Battiste, 181-191, University of British Columbia Press, Canada.
Carolan, M. S. (2006). Sustainable agriculture, science and the co-production of ‘expert’ knowledge: The value of interactional expertise. The International Journal of Justice and Sustainability, 11:4, 421-431 Taylor & Francis
Chakeredza, S., Temu, A. B., Yaye A., Makungwa S., Saka J. D. K. (2009). Mainstreaming climate change into agricultural education – Challenges and Perspectives. ICRAF Working Paper no 82. Nairobi, Kenya. World Agroforestry Centre
Christian Aid (2009). ‘Module I: Framework and Approach.’ Christian Aid Adaptation Toolkit: Integrating adaptation to climate change into secure livelihoods. Christian Aid: UK
Codjoe, S. N. A., Owusu, G., & Burkett, V. (2013). Perception, experience, and indigenous knowledge of climate change and variability: the case of Accra, a sub-Saharan African city. Regional Environmental Change, 1-15.
Diagana, Bocar (2013). Land Degradation in SubSaharan Africa: What Explains the Widespread Adoption of Unsustainable Farming Practices? Draft working paper, Department of Agricultural Economics and Economics, Montana State University, Bozeman, MT, USA. http://www.tradeoffs.montana.edu/pdf/SD-BD.pdf
FAO. (2002). NEPAD: Comprehensive Africa Agriculture Development Programme (CAADP). Food and Agricultural Organization (FAO).
FAO. (2010). “Climate-Smart” Agriculture: Policies, Practices and Financing for Food Security, Adaptation and Mitigation. http://www.fao.org/docrep/013/i1881e/i1881e00.pdf Accessed 5 July 14
Ford J D (2012). Indigenous health and climate change. American Journal of Public Health 102:1260–1266
Fatondji, D and Martius, C and Vlek, P.L.G and Bielders, C L and Bationo, A. (2011). Effect of zai soil and water conservation technique on water balance and the fate of nitrate from organic amendments applied: A case of degraded crusted soils in Niger. In Innovations as key to the green revolution in Africa (pp. 1125-1135). Springer Netherlands.
Brent Gallupe (2001). Knowledge management systems: surveying the landscape. International Journal of Management Reviews. 3(1):61 - 77.
Gardebroek, C., Hernandez, M. A., & Robles, L. M. (2014). Market interdependence and volatility transmission among major crops. IFPRI Discussion Paper 01344. Available at http://www.ifpri.org/sites/default/files/publications/ifpridp01344.pdf Accessed 5 July 2014.
Gibbons, M., Limoges, C., Nowotny, H., Schwartzman, S., Scott, P., & Trow, M. (1994). The new production of knowledge: The dynamics of science and research in contemporary societies. Sage.
Giller, K. E., Tittonell, P., Rufino, M. C., Van Wijk, M. T., Zingore, S., Mapfumo, P., & Vanlauwe, B. (2011). Communicating complexity: Integrated assessment of trade-offs concerning soil fertility management within African farming systems to support innovation and development. Agricultural systems, 104(2), 191-203.
180 | Africa Agriculture Status Report 2014
Gray and Chan: Gray, P.H., and Chan, Y.E., (1999). “A Typology of Knowledge Management Practices and Processes”, an unpublished Queen’s University Working Paper
Hazell, P. B. (2013). Options for African agriculture in an era of high food and energy prices. Agricultural Economics, 44(s1), 19-27.
Heron, R. L., Baker, R., & Mcewen, L. (2006). Co-learning: re-linking research and teaching in geography. Journal of Geography in Higher Education, 30(1), 77-87.
Holste, J. S., & Fields, D. (2010). Trust and tacit knowledge sharing and use. Journal of knowledge management, 14(1), 128-140.
Hounkonnou, D., Kossou DK., Kuyper TW., Leeuwis C., Richards P., Röling NG., Sakyi-Dawson O., Van Huis A. (2006). Convergence of sciences: the management of agricultural research for small-scale farmers in Benin and Ghana. NJAS – Wageningen Journal of Life Sciences, 53 (3/4), 343–367. doi: 10.1016/S1573-5214(06)80013-8
Jasanoff, Sheila; Markle, Gerald E.; Peterson, James C.; Pinch, Trevor. (1995). Handbook of Science and Technology Studies. SAGE
Jentoft, S., McCay, B. J., & Wilson, D. C. (1998). Social theory and fisheries co-management. Marine Policy, 22(4), 423-436.
Jentoft, S. (2006). Beyond fisheries management: The Phronetic dimension. Marine Policy 30(6), 671-680.
Jones, G., & Sallis, E. (2013). Knowledge management in education: Enhancing learning & education. Routledge.
Kabore-Sawadogo, S., Ouattara, K., Balima, M., & Ouédraogo, I., Traoré S., Savadogo, M., Gowing, J. (2012). Burkina Faso: a cradle of farm-scale technologies Water Harvesting in Sub-Saharan Africa, Eds William Critchley, John Gowing51-69, Routledge.
Kaimowitz, D. (1990). Making the link: agricultural research and technology transfer in developing countries. Westview Press, with International Service for National Agricultural Research (ISNAR).
King, K., & McGrath, S. (2002). Globalisation, enterprise and knowledge: Education, training and development in Africa. Symposium.
Kleiber, W., Katz, R. W., & Rajagopalan, B. (2013). Daily minimum and maximum temperature simulation over complex terrain. The Annals of Applied Statistics, 7(1), 588-612.
Kwanya,T. (2009). ICT Simplified: a handbook for the communication worker. Nairobi Focus Publishers
Lefale P. F (2009). Ua ‘afa le aso Stormy weather today: traditional ecological knowledge of weather and climate. The Samoa experience. Climatic Change. doi:10.007/s10584-009-9722-z
Maier, R., & Hädrich, T. (2011). Knowledge Management Systems. Edited by David G. Schwartz. Encyclopedia of Knowledge Management, pp 442 – 449
Mashavave, T., Mapfumo, P., Mtambanengwe, F., Gwandu, T., & Siziba, S. (2013). Interaction patterns determining improved information and knowledge sharing among smallholder farmers. African Journal of Agricultural and Resource Economics Volume, 8(1), 1-12.
McBride, M. F., & Burgman, M. A., (2012). What Is Expert Knowledge, How Is Such Knowledge Gathered, and How Do We Use It to Address Questions in Landscape Ecology? Eds: Perera, Ajith H., Drew, C. Ashton, Johnson, Chris J. In Expert Knowledge and Its Application in Landscape Ecology p 11-36
McLean, K. G. (2012). Land use, climate change adaptation and indigenous peoples. United Nations University. UNU Office of Communications, Tokyo, Japan
Mercer, J., Kelman, I., Suchet‐Pearson, S., & Lloyd, K. (2009). Integrating indigenous and scientific knowledge bases for disaster risk reduction in Papua New Guinea. Geografiska Annaler: Series B, Human Geography, 91(2), 157-183.
Moss, R. H., Edmonds, J. A., Hibbard, K. A., Manning, M. R., Rose, S. K., Van Vuuren, D. P., ... & Wilbanks, T. J. (2010). The next generation of scenarios for climate change research and assessment. Nature, 463(7282), 747-756.
Nonaka, I. (1991). The knowledge-creating company. Harvard Business Review, Vol. 69 No. 6,pp. 96-104.
Nonaka, I. and Konno, N. (1998). ‘‘The concept of ‘ba’: building a foundation for knowledge creation’’, California Management Review, Vol. 40 No. 3, pp. 40-54.
Nyong, A., Adesina, F., & Elasha, B. O. (2007). The value of indigenous knowledge in climate change mitigation and adaptation strategies in the African Sahel. Mitigation and Adaptation Strategies for Global Change, 12(5), 787-797.
Odendo M, Ojiem J, Bationo A & Mudeheri M, (2006). On-farm evaluation and scaling-up of soil fertility management technologies in western Kenya. Nutrient Cycling in Agro-ecosystems 76(2-3), 369–81.
Orlove, B., Roncoli, C., Kabugo, M., & Majugu, A. (2010). Indigenous climate knowledge in southern Uganda: the multiple components of a dynamic regional system. Climatic Change, 100: 243-265.
Powell, M. (2003). Information management for development organisations. Oxfam.
Rarieya, M. and Fortun, K. (2010). Food security and seasonal climate information: Kenyan challenges. Sustainability Science, 99-114.
Africa Agriculture Status Report 2014 | 181
Reed, M. S., Dougill, A. J. & Taylor, M. J. (2007) Integrating local and scientific knowledge for adaptation to land degradation: Kalahari rangeland management options, Land Degradation and Development, 18, p. 249–268.
Reed, M. S., Buenemann, M., Atlhopheng, J., Akhtar‐Schuster, M., Bachmann, F., Bastin, G. ... & Verzandvoort, S. (2011). Cross‐scale monitoring and assessment of land degradation and sustainable land management: A methodological framework for knowledge management. Land Degradation & Development, 22(2), 261-271.
Republic of Kenya, (2012). National Climate Change Action Plan: Knowledge Management and Capacity Development Chapter 2.0: Climate Change Knowledge Management Strategy
Roling, N. G., & Jiggins, J. (1998). The ecological knowledge system. Facilitating sustainable agriculture: participatory learning and adaptive management in times of environmental uncertainty. Cambridge University Press, Cambridge, UK, 283-311.
Pardey, P. G., Alston, J. M., & Chan‐Kang, C. (2013). Public agricultural R&D over the past half century: an emerging new world order. Agricultural Economics, 44(s1), 103-113.
Plummer R, Funnell D. (2009). Managing Protected Areas for Sustainable Tourism Prospects for Adaptive Co-Management. J. Sustain. Tour. 2009, 17, 149-168.
Pohl, C., Rist, S., Zimmermann, A., Fry, P., Gurung, G. S., Schneider, F. ... & Wiesmann, U. (2010). Researchers’ roles in knowledge co-production: experience from sustainability research in Kenya, Switzerland, Bolivia and Nepal. Science and Public Policy, 37(4), 267-281.
Scoones, I. ( 2009). Making Science and Technology Work for the Poor. Discussion Paper 010, Future Agricultures Consortium. file:///C:/Users/DELL/AppData/Local/Temp/FAC_Discussion_Paper_010-1.pdf. Accessed May 2014
Speranza C. I, Kiteme B, Ambenje P, Wiesmann U, Mikal S (2010). Indigenous knowledge related to climate variability and change: insights from droughts in semi-arid areas of former Makueni District, Kenya. Climatic Change, 100, 295–315
Struik, P. C., Klerkx, L., van Huis, A., & Röling, N. G. (2014). Institutional change towards sustainable agriculture in West Africa. International journal of agricultural sustainability, (ahead-of-print), 1-11.
Tanner, T.M., Jackson, C., Seballos,F and Clark, J. (2013). Paper. Learning to tackle climate change: Innovative approaches to knowledge sharing and co-production in highly dispersed development organisations. Knowledge Management for Development Journal 9(1): 9 – 23 http://journal.km4dev.org/
Temu, A., Mwanje, I. and Mogotsi, K. (2003). Improving Agriculture and Natural Resources Education in Africa: A stitch in Time. Nairobi, Kenya: World Agroforestry Centre (ICRAF).
World Bank (2005). IK Notes no.80. Burkina Faso: the Zai technique and enhanced agricultural productivity

182 | Africa Agriculture Status Report 2014
Chapter 6 Conclusions and Way Forward

Africa Agriculture Status Report 2014 | 183
A major drag on Africa’s development is the underperformance of the agriculture sector, which accounts for a large proportion of GDP and employment. The sector’s performance is constrained by inherently low soil fertility, poor access to inputs such as improved seeds and fertilizer, governance problems, and insufficient transport, storage, and marketing infrastructure that limits access to output markets, among other factors.
Since the 1980s, public investment in agriculture has declined considerably. Neglect by governments and the donor community has led to a shortage of the resources and technical skills needed to adequately support agricultural development. Many agricultural banks and rural financial services have disappeared, and extension services, applied research, and investment in infrastructure projects have declined since the mid-1980s. Persistent food insecurity, the 2008 global food crises, and extreme weather events, such as the 2011 drought in the Horn of Africa that exposed the vulnerability of smallholders to climate change, are among the factors that have refocused attention on the need to increase investment in agriculture.
Raising agricultural productivity and incomes of smallholder farmers in Africa is essential for reducing poverty and achieving food security. Smallholders comprise a major driver of economic growth, produce 80% of the food in sub-Saharan Africa, and are custodians of ecosystem resources and biodiversity. They are also central to climate change mitigation and adaptation.
In 2004, the InterAcademy Council (IAC) Panel published a report envisioning increased agricultural productivity, improved food security and enhanced sustainability of agroecosystems in Africa. The IAC recommendations included: use of improved agricultural practices; investment in research and knowledge institutions; creating and retaining a new generation of agricultural scientists to perform future research; pro-poor market economies and policies; and initiating a series of innovative pilot programs for enhancing African agriculture. These recommendations have been partially implemented and have led to modest improvements in food security on the continent. However, there is still a wide scope for enhancing the performance of the agriculture sector through spurring agricultural productivity, increasing resilience and adaptation to climate variability and change, reducing GHG emissions, and sequestering carbon in the landscapes.
Climate-smart agriculture (CSA) is a promising approach for addressing the twin challenges of food security and climate change. More productive, resilient, and low-carbon agriculture requires shifts
in the way we manage land, water, nutrients and genetic resources. This report highlights changes in policies, institutions, and financial mechanisms for effective CSA transition in Africa. It emphasizes that the widespread uptake of sustainable practices by smallholders is imperative to: addressing current and future threats to food security; environmental resilience; and reduction of GHG emissions. A future in which smallholder farmers are central to agricultural, economic, environmental, and social agendas will help in addressing poverty, food security and climate challenge. Urgent, solution-oriented actions proposed by this report are summarized here under five major domains:
1. Promote climate-smart, context-driven agroecological approaches and solutions CSA builds on existing experience and knowledge of sustainable agricultural development, and sustainable intensification founded on agroecological approaches is central. Sustainable intensification fosters more efficient resource use, and contributes to adaptation and mitigation through effects on farm productivity and incomes, and reduced emissions per unit of product. Applied CSA technologies need to be context-specific and prioritized according to different landscapes and farming systems. CSA options are often based on proven low-cost practices, are achievable at large scales, and their potentials best realized if integrated. Greater uncertainty due to increased climate variability and change calls for more flexible and rapid response capacity by smallholders. Building resilience means reducing the risk of becoming food-insecure and increasing adaptive capacity to cope with risks and respond to change. This may involve incremental or transformative adaptation options. Incremental changes include: use of improved breeds; better information provision; timely access to production inputs; support to farmers through improved market governance to reduce price volatility; and expanded insurance and safety net programs. Transformative changes can involve major shifts in agricultural production such as from crops to livestock, or sources of livelihoods such as increased reliance on non-farm income.
2. Strengthen national and local institutions to implement climate-smart agriculture Successful CSA implementation requires changes in behavior and strategies, as well as changes in the usual timing of agricultural practices. Without appropriate institutional structures in place, these innovations may overwhelm smallholder farmers. Strong institutional support is required to: promote inclusivity in decision making; improve

184 | Africa Agriculture Status Report 2014
the dissemination of information; provide financial support and access to markets; provide insurance to cope with risks associated with climate shocks and the adoption of new practices; and support farmers’ collaborative actions. Many institutions and stakeholders, including farmers, private sector entities, public sector organizations, research institutes, educational institutions, and Civil Society Organizations play important roles in supporting the adoption of climate-smart agriculture. In addition, national governments not only need to coordinate financing for CSA technologies and practices, but also have the flexibility to plan and work across sectors. Prominent public sector actions that support CSA include: amendment and enforcement of related agricultural policies; the provision of extension services; improvement of relevant infrastructure, e.g., roads and storage facilities; and the collection of national census data useful to CSA initiatives. As markets become increasingly important, private sector players such as the smallholder farmers themselves become significant. However, as it takes too much time and too many resources to reach each individual farmer, approaching producer cooperatives is a good strategy for building a broad base of support for climate-smart practices in the farming community. Producers’ cooperatives and unions are intended to reflect producers’ interests, but their capacity to influence public policies tends to be limited. Nonetheless, close collaboration with producers’ cooperatives or unions has high potential payoffs, as their legitimacy and influence reaches wide networks of farmers. Moreover, there are growing opportunities for inclusive partnerships involving governments, private sector agribusinesses, and development organizations to collaborate on CSA issues such as carbon finance.
3. Build technical capacity and improve knowledge management systems CSA is knowledge intensive, requiring knowledge of technical interventions and practices, the evidence base that will support adoption, and integrated planning for mainstreaming into broader development goals. It is essential to harness opportunities arising from South-South cooperation and from regional integration in order to foster partnerships and build capacity in CSA. There is need for development of reliable scientific evidence to inform policy on climate change adaptation, as well as institutionalizing effective dialogue between researchers and policy makers. Knowledge Management Systems that entail co-learning and co-management by farmers and scientists comprise new and innovative approaches that should be strengthened through investments in education and training. An inclusive approach
to CSA is needed, one that both empowers women and generally reflects differing gender roles, and deliberately aims to involve Africa’s rural youth. Knowledge management should prioritize exchange of knowledge on CSA and agroecological management practices between all stakeholders by building local, national and regional information resources and networks.
4. Raise the level of national investments in agriculture Finite public resources can be more selectively targeted by using the following criteria: For technologies that generate significant private returns, grant funding or loans may be more suitable to overcoming adoption barriers. For technologies such as conservation agriculture that require specific machinery inputs and significant up-front costs, payment for an ecosystem services scheme could be used to support farmers and break the adoption barrier. In some cases, relatively affordable technologies that generate quick and demonstrable benefits may warrant priority and potentially establish some of the channels through which more sophisticated technologies are dispersed in the future. Nationally owned climate-smart agricultural policies and action frameworks will increase adoption of technologies by farmers. There is also the potential for carbon finance to support farmers during the initial period before the trees in agroforestry systems generate an economic return. Larger and more coordinated investments in CSA interventions need to be harnessed and allocated appropriately in order to generate the highest returns for sustainable agricultural growth. Changes taking place in the agricultural sector need to be planned for, including adaptation and mitigation as essential part of developing CSA strategies, investments and financing plans. Increasing agricultural mechanization and investments in rural services for farm machinery should be encouraged in order to enhance food security. Governments should ensure that the Maputo Declaration calling for increasing budgets for agriculture is achieved.
5. Create innovative financing mechanisms Strengthening financing opportunities at all levels and for different risks is important, as is the bundling of insurance and agricultural credits. Mobilize AECF, cooperative banks, and national banks for support leading to a partnership-based approach to innovative financing. There is need to develop a programmatic approach to develop a pipeline of investments in support of climate-smart agriculture, which should be

Africa Agriculture Status Report 2014 | 185
country driven. In assuming a leadership role, governments can better organize resource flows to avoid duplication, fill financing gaps and create synergies. In addition, development partners should agree on implementation arrangements for identified investments based on their comparative advantages; synergies should be identified and collaborative arrangements agreed upon. Directing climate finance to support institutional investments that can accelerate adoption of practices for increasing resource-use efficiency is an important step towards climate-resilient
development in agriculture. Public sector finance for adaptation and mitigation is likely to provide the most important sources of climate finance for CSA in developing countries. Funding sources could include: bilateral donors; multilateral financial institutions; the Global Environment Facility (GEF); and the emerging Green Climate Fund that was established by the UNFCCC, which can channel funds through national policy instruments such as Nationally Appropriate Mitigation Actions (NAMAs) and National Adaptation Program of Actions (NAPAs).

186 | Africa Agriculture Status Report 2014
PART 2Section II. Agriculture Data for Selected Sub-Saharan African Countries

Africa Agriculture Status Report 2014 | 187
Global Food Security Index: Food Security In Sub Saharan Africa Mark Musumba (Columbia University), Chen Chen and Jessica Hellmann (University of Notre Dame)
Food security is at the center stage of the development initiatives to improve agricultural productivity and livelihood in Sub Saharan Africa. In a region where smallholder farmers contribute significantly to domestic production with a potential to increase their yields and improve food security, there is a need to assess the progress of these initiatives and assess the progress of SSA that are mainly net food importers. Food security has been defined as “when all people at all times, have physical, social and economic access to sufficient, safe and nutritious food that meets their dietary needs and food preferences for an active and healthy life” (FAO 2011). Food insecurity can have a lasting effect on entire populations with the dynamic relationship between food insecurity and poor education, bad health and poverty (UNDP 2012). In order to assess the required policies that my assist policy-makers make informed decisions on aspect of food security that their respective country is lacking, we look at the Global Food Security Index that is constructed by the Economist Intelligence Unit.
1 The Global Food Security Index is a measure of food security across 109 countries and considers the core aspects of food security; affordability, availability, quality and safety. The Economist Intelligence Unit (EIU) updates the index on a quarterly basis to adjust for the impact of fluctuating food prices; but for this reporting
we focus on the 2014 annual model report that was published in May 20142. The food price adjustment factor is applied to each country’s affordability score and is based on changes in income growth, exchange rates and global food prices and the countries’ scores improve if food prices fall, and deteriorate if prices rise. The country-specific adjustments and their goal of translating fluctuations in global food prices to the national level, result in different levels of score changes for each country, with vulnerable countries hurt the most by rising prices. All these scores are normalised on a scale of 0-100 where 100=most favourable (EIU 2013).
Table 1 indicated the overall score of the 28 Sub Saharan countries in the analysis of the 109 countries in the annual model. From the data, it shows the countries in Sub Saharan Africa that rank the highest in overall score are South Africa, Botswana, Uganda, Cote D’Ivoire, and Ghana. The countries that are the most insecure in SSA are Democratic Republic of Congo, Chad, Madagascar, Togo, Sudan3, and Burundi. Among regions, SSA remains at the bottom of the index but there have been gains in some countries in terms of overall income in particular Ethiopia and Bostwana (EIU 2014). In a new category that was added to the index ‘Food Loss’, shows that Sub Saharan African countries had the highest rates of food loss with Ghana, Togo, Angola, Benin, and Cameroon, ranking the highest in rank order (EIU 2014).
1. The index was constructed by the EIU and sponsored by DuPont. Please see http://foodsecurityindex.eiu.comfor additional details
2. The annual models produced by EIU are comparable across years while quarterly model reports within a given year area comparable to each other and their respective annual model; but quarterly models are not comparable across years.
3. Please note that Sudan includes both Sudan and South Sudan
Table 1 Overall Score by Country of the Food Security Index as a weighted sum of Affordability Availability and Quality and Safety COUNTRY OVERALL SCORE /100 AFFORDABILITY AVAILABILITY QUALITY AND SAFETYSouth Africa 61.1 57.9 65.3 57.5
Botswana 60.7 55 67.8 55.2
Uganda 45.6 45.4 45 47.7
Cote d’Ivoire 44.7 44.8 52.7 22.2
Ghana 43.1 34.7 48.3 49.8
Kenya 40.1 35.1 44 41.8
Benin 38.4 36.2 41.1 36.6
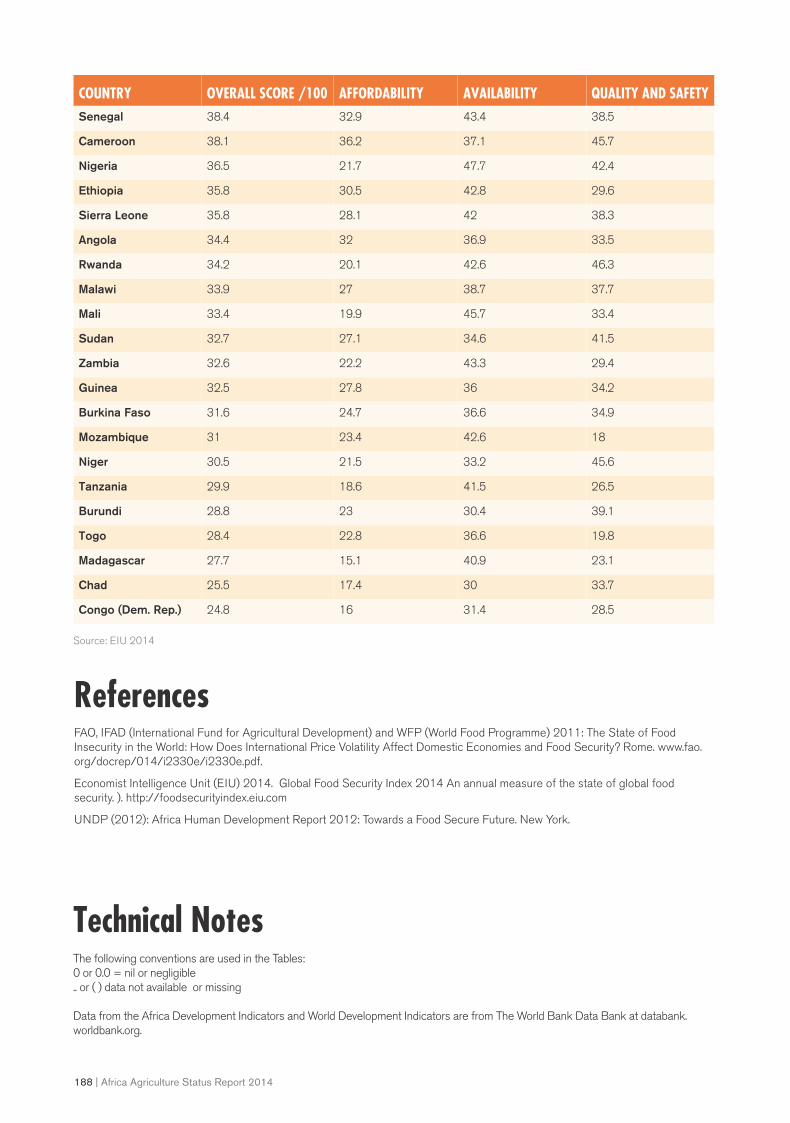
188 | Africa Agriculture Status Report 2014
ReferencesFAO, IFAD (International Fund for Agricultural Development) and WFP (World Food Programme) 2011: The State of Food Insecurity in the World: How Does International Price Volatility Affect Domestic Economies and Food Security? Rome. www.fao.org/docrep/014/i2330e/i2330e.pdf.
Economist Intelligence Unit (EIU) 2014. Global Food Security Index 2014 An annual measure of the state of global food security. ). http://foodsecurityindex.eiu.com
UNDP (2012): Africa Human Development Report 2012: Towards a Food Secure Future. New York.
COUNTRY OVERALL SCORE /100 AFFORDABILITY AVAILABILITY QUALITY AND SAFETYSenegal 38.4 32.9 43.4 38.5
Cameroon 38.1 36.2 37.1 45.7
Nigeria 36.5 21.7 47.7 42.4
Ethiopia 35.8 30.5 42.8 29.6
Sierra Leone 35.8 28.1 42 38.3
Angola 34.4 32 36.9 33.5
Rwanda 34.2 20.1 42.6 46.3
Malawi 33.9 27 38.7 37.7
Mali 33.4 19.9 45.7 33.4
Sudan 32.7 27.1 34.6 41.5
Zambia 32.6 22.2 43.3 29.4
Guinea 32.5 27.8 36 34.2
Burkina Faso 31.6 24.7 36.6 34.9
Mozambique 31 23.4 42.6 18
Niger 30.5 21.5 33.2 45.6
Tanzania 29.9 18.6 41.5 26.5
Burundi 28.8 23 30.4 39.1
Togo 28.4 22.8 36.6 19.8
Madagascar 27.7 15.1 40.9 23.1
Chad 25.5 17.4 30 33.7
Congo (Dem. Rep.) 24.8 16 31.4 28.5
Source: EIU 2014
Technical Notes The following conventions are used in the Tables: 0 or 0.0 = nil or negligible .. or ( ) data not available or missing
Data from the Africa Development Indicators and World Development Indicators are from The World Bank Data Bank at databank.worldbank.org.

Africa Agriculture Status Report 2014 | 189
Population, total (millions) Source: World Development Indicators (WDI), World BankRural population (% of total population) Source: World Development Indicators (WDI), World BankGDP growth (annual %) Source: World Development Indicators (WDI), World BankGDP Per Capita Source: World Development Indicators (WDI), World BankReal agricultural GDP growth rates (%) Source: Africa Development Indicators (ADI), World BankCereal production (metric tons ‘000 ‘) Source: World Development Indicators (WDI), World BankCereal yield (kg per hectare) Source: World Development Indicators (WDI), World BankCrop production index (2004-2006 = 100) Source: World Development Indicators (WDI), World BankFertilizer consumption (kilograms per hectare of arable land) Source: World Development Indicators (WDI), World BankCO2 emissions (metric tons per capita) Source: World Development Indicators (WDI), World BankAgricultural land (‘000 sq. km) Source: World Development Indicators (WDI), World BankCereal cropland (% of land area) Source: Africa Development Indicators (ADI), World BankGross disbursements, agriculture (US$ millions) Arable land (hectares) Source: Africa Development Indicators (ADI), World BankArable land (hectares per person) Source: Africa Development Indicators (ADI), World BankNet official development assistance and official aid received (current US$ millions)Net ODA received per capita (current US$)
Data on Climate change Indicators were obtained from Climate Change Knowledge Portal (http://sdwebx.worldbank.org/climateportal/index.cfm)
Average annual precipitation (1961-1990, mm) Source: Climate Change Knowledge PortalProjected annual temperature change (2045-2065, Celsius) Source: Climate Change Knowledge PortalProjected change in annual hot days/warm nights Source: Climate Change Knowledge PortalProjected change in annual cool days/cold nights Source: Climate Change Knowledge PortalProjected annual precipitation change (2045-2065, mm) Source: Climate Change Knowledge PortalLand area below 5m (% of land area) Source: Climate Change Knowledge PortalPopulation below 5m (% of total) Source: Climate Change Knowledge PortalAccess to improved water source (% of total pop.) Source: Climate Change Knowledge PortalDisaster risk reduction progress score (1-5 scale; 5=best) Source: Climate Change Knowledge Portal
Total Economically Active Population in Agriculture (Thousands) Source: FAOSTAT http://faostat.fao.org)Tables with the data on Research and Development was obtained from (Agricultural Science and Technology Indicators (ASTI). Website www.asti.cgiar.orgAgricultural R&D Spending per Researcher (Millions 2005 PPPUS$)Public Agricultural Research Staff per Million Population
Average travel time to nearest town over 100K (hours) (2000) Average travel time to nearest town over 50K (hours) (2000)Average travel time to nearest town over 20K (hours) (2000)Agriculture Expenditure (% Share of Total Expenditure) – ReSAKSS
Data on agriculture share of total ODA is from the OECD database from website http://www.oecd.orgAgriculture share to total ODA gross disbursements (%)
Micro Indicators:Average size of agricultural land (ha) per householdNumber of agricultural plots per householdAverage size of agricultural land (ha) per householdFertilizer use
Data on micro indicators tables were provided by:Burkina Faso : “Enquête Agricole Permanente”Ghana Living Standards Survey and Ministry of AgricultureKenya Ministry of Agriculture and Central Bureau of Statistics Malawi Ministry of Agriculture and Food Security (MoAFS) Agricultural Statistical Bulletins, Agricultural Crop Production Estimates (APES); Malawi Socio-Economic Database (MASEDA)/National Statistical Office Mali : “Enquête agricole de conjoncture”Niger “Enquête Prévision et Estimation des Récoltes”Rwanda National Agricultural Survey and Ministry of Agriculture and Animal Resources (MINAGRI)Sierra Leone Statistics OfficeUganda National Household Survey 2009/2000; Uganda Census of Agriculture 2008/2009; Tanzania Ministry of Agriculture, Food Security and Cooperatives/Statistics UnitZambia Ministry of Agriculture and Livestock, Agriculture Statistics Bulletin, Central Bureau of StatisticsMozambique Instituto Nacional de Estatísticas (INE) (National Statistics Institute); Trabalho do Inquérito Agrícola (TIA) (Annual agricultural survey), Direcção de Economia, Ministério da Agricultura, Maputo, Moçambique
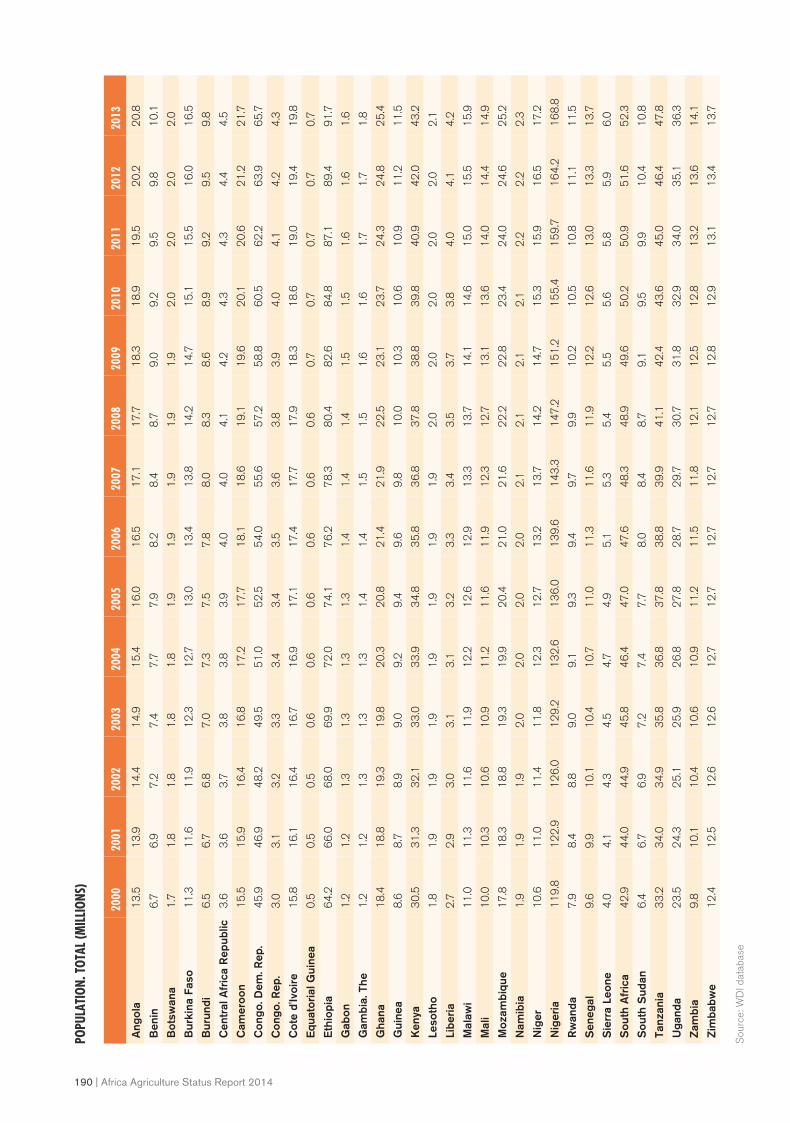
190 | Africa Agriculture Status Report 2014
POPU
LATI
ON. T
OTAL
(MIL
LION
S)
2000
2001
2002
2003
2004
2005
2006
2007
2008
2009
2010
2011
2012
2013
Ang
ola
13
.5
13
.9
14
.4
14
.9
15
.4
16
.0
16
.5
17
.1
17
.7
18
.3
18
.9
19
.5
20
.2
20
.8
Ben
in 6
.7
6.9
7
.2
7.4
7
.7
7.9
8
.2
8.4
8
.7
9.0
9
.2
9.5
9
.8
10
.1
Bot
swan
a 1
.7
1.8
1
.8
1.8
1
.8
1.9
1
.9
1.9
1
.9
1.9
2
.0
2.0
2
.0
2.0
Bur
kina
Fas
o 1
1.3
1
1.6
1
1.9
1
2.3
1
2.7
1
3.0
1
3.4
1
3.8
1
4.2
1
4.7
1
5.1
1
5.5
1
6.0
1
6.5
Bur
undi
6.5
6
.7
6.8
7
.0
7.3
7
.5
7.8
8
.0
8.3
8
.6
8.9
9
.2
9.5
9
.8
Cen
tral
Afr
ica
Rep
ublic
3.6
3
.6
3.7
3
.8
3.8
3
.9
4.0
4
.0
4.1
4
.2
4.3
4
.3
4.4
4
.5
Cam
eroo
n 1
5.5
1
5.9
1
6.4
1
6.8
1
7.2
1
7.7
1
8.1
1
8.6
1
9.1
1
9.6
2
0.1
2
0.6
2
1.2
2
1.7
Con
go. D
em. R
ep.
45
.9
46
.9
48
.2
49
.5
51
.0
52
.5
54
.0
55
.6
57
.2
58
.8
60
.5
62
.2
63
.9
65
.7
Con
go. R
ep.
3.0
3
.1
3.2
3
.3
3.4
3
.4
3.5
3
.6
3.8
3
.9
4.0
4
.1
4.2
4
.3
Cot
e d'
Ivoi
re 1
5.8
1
6.1
1
6.4
1
6.7
1
6.9
1
7.1
1
7.4
1
7.7
1
7.9
1
8.3
1
8.6
1
9.0
1
9.4
1
9.8
Equ
ator
ial G
uine
a 0
.5
0.5
0
.5
0.6
0
.6
0.6
0
.6
0.6
0
.6
0.7
0
.7
0.7
0
.7
0.7
Eth
iopi
a 6
4.2
6
6.0
6
8.0
6
9.9
7
2.0
7
4.1
7
6.2
7
8.3
8
0.4
8
2.6
8
4.8
8
7.1
8
9.4
9
1.7
Gab
on 1
.2
1.2
1
.3
1.3
1
.3
1.3
1
.4
1.4
1
.4
1.5
1
.5
1.6
1
.6
1.6
Gam
bia.
The
1.2
1
.2
1.3
1
.3
1.3
1
.4
1.4
1
.5
1.5
1
.6
1.6
1
.7
1.7
1
.8
Gha
na 1
8.4
1
8.8
1
9.3
1
9.8
2
0.3
2
0.8
2
1.4
2
1.9
2
2.5
2
3.1
2
3.7
2
4.3
2
4.8
2
5.4
Gui
nea
8.6
8
.7
8.9
9
.0
9.2
9
.4
9.6
9
.8
10
.0
10
.3
10
.6
10
.9
11
.2
11
.5
Ken
ya 3
0.5
3
1.3
3
2.1
3
3.0
3
3.9
3
4.8
3
5.8
3
6.8
3
7.8
3
8.8
3
9.8
4
0.9
4
2.0
4
3.2
Leso
tho
1.8
1
.9
1.9
1
.9
1.9
1
.9
1.9
1
.9
2.0
2
.0
2.0
2
.0
2.0
2
.1
Libe
ria
2.7
2
.9
3.0
3
.1
3.1
3
.2
3.3
3
.4
3.5
3
.7
3.8
4
.0
4.1
4
.2
Mal
awi
11
.0
11
.3
11
.6
11
.9
12
.2
12
.6
12
.9
13
.3
13
.7
14
.1
14
.6
15
.0
15
.5
15
.9
Mal
i 1
0.0
1
0.3
1
0.6
1
0.9
1
1.2
1
1.6
1
1.9
1
2.3
1
2.7
1
3.1
1
3.6
1
4.0
1
4.4
1
4.9
Moz
ambi
que
17
.8
18
.3
18
.8
19
.3
19
.9
20
.4
21
.0
21
.6
22
.2
22
.8
23
.4
24
.0
24
.6
25
.2
Nam
ibia
1.9
1
.9
1.9
2
.0
2.0
2
.0
2.0
2
.1
2.1
2
.1
2.1
2
.2
2.2
2
.3
Nig
er 1
0.6
1
1.0
1
1.4
1
1.8
1
2.3
1
2.7
1
3.2
1
3.7
1
4.2
1
4.7
1
5.3
1
5.9
1
6.5
1
7.2
Nig
eria
11
9.8
1
22
.9
12
6.0
1
29
.2
13
2.6
1
36
.0
13
9.6
1
43
.3
14
7.2
1
51
.2
15
5.4
1
59
.7
16
4.2
1
68
.8
Rw
anda
7.9
8
.4
8.8
9
.0
9.1
9
.3
9.4
9
.7
9.9
1
0.2
1
0.5
1
0.8
1
1.1
1
1.5
Sen
egal
9.6
9
.9
10
.1
10
.4
10
.7
11
.0
11
.3
11
.6
11
.9
12
.2
12
.6
13
.0
13
.3
13
.7
Sie
rra
Leon
e 4
.0
4.1
4
.3
4.5
4
.7
4.9
5
.1
5.3
5
.4
5.5
5
.6
5.8
5
.9
6.0
Sou
th A
fric
a 4
2.9
4
4.0
4
4.9
4
5.8
4
6.4
4
7.0
4
7.6
4
8.3
4
8.9
4
9.6
5
0.2
5
0.9
5
1.6
5
2.3
Sou
th S
udan
6.4
6
.7
6.9
7
.2
7.4
7
.7
8.0
8
.4
8.7
9
.1
9.5
9
.9
10
.4
10
.8
Tanz
ania
33
.2
34
.0
34
.9
35
.8
36
.8
37
.8
38
.8
39
.9
41
.1
42
.4
43
.6
45
.0
46
.4
47
.8
Uga
nda
23
.5
24
.3
25
.1
25
.9
26
.8
27
.8
28
.7
29
.7
30
.7
31
.8
32
.9
34
.0
35
.1
36
.3
Zam
bia
9.8
1
0.1
1
0.4
1
0.6
1
0.9
1
1.2
1
1.5
1
1.8
1
2.1
1
2.5
1
2.8
1
3.2
1
3.6
1
4.1
Zim
babw
e 1
2.4
1
2.5
1
2.6
1
2.6
1
2.7
1
2.7
1
2.7
1
2.7
1
2.7
1
2.8
1
2.9
1
3.1
1
3.4
1
3.7
Sou
rce:
WD
I dat
abas
e
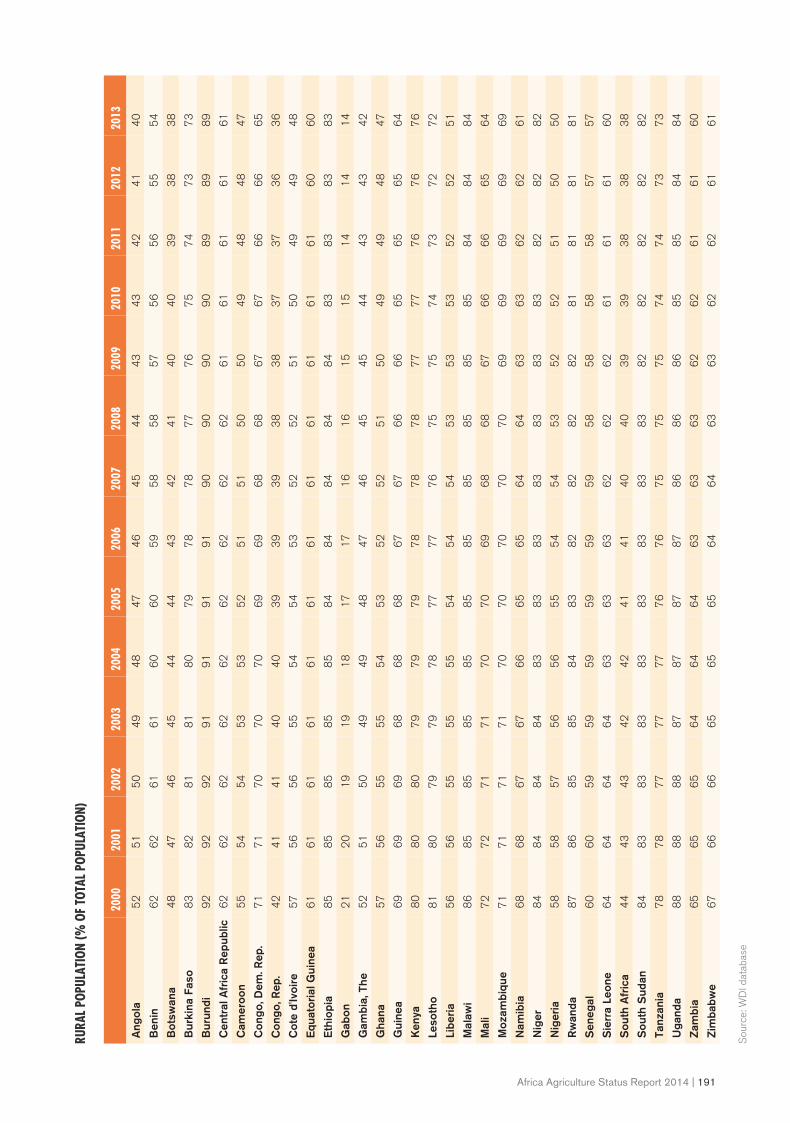
Africa Agriculture Status Report 2014 | 191
RURA
L POP
ULAT
ION
(% O
F TO
TAL P
OPUL
ATIO
N)
2000
2001
2002
2003
2004
2005
2006
2007
2008
2009
2010
2011
2012
2013
Ang
ola
52
5
1
50
4
9
48
4
7
46
4
5
44
4
3
43
4
2
41
4
0
Ben
in 6
2
62
6
1
61
6
0
60
5
9
58
5
8
57
5
6
56
5
5
54
Bot
swan
a 4
8
47
4
6
45
4
4
44
4
3
42
4
1
40
4
0
39
3
8
38
Bur
kina
Fas
o 8
3
82
8
1
81
8
0
79
7
8
78
7
7
76
7
5
74
7
3
73
Bur
undi
92
9
2
92
9
1
91
9
1
91
9
0
90
9
0
90
8
9
89
8
9
Cen
tral
Afr
ica
Rep
ublic
62
6
2
62
6
2
62
6
2
62
6
2
62
6
1
61
6
1
61
6
1
Cam
eroo
n 5
5
54
5
4
53
5
3
52
5
1
51
5
0
50
4
9
48
4
8
47
Con
go, D
em. R
ep.
71
7
1
70
7
0
70
6
9
69
6
8
68
6
7
67
6
6
66
6
5
Con
go, R
ep.
42
4
1
41
4
0
40
3
9
39
3
9
38
3
8
37
3
7
36
3
6
Cot
e d'
Ivoi
re 5
7
56
5
6
55
5
4
54
5
3
52
5
2
51
5
0
49
4
9
48
Equ
ator
ial G
uine
a 6
1
61
6
1
61
6
1
61
6
1
61
6
1
61
6
1
61
6
0
60
Eth
iopi
a 8
5
85
8
5
85
8
5
84
8
4
84
8
4
84
8
3
83
8
3
83
Gab
on 2
1
20
1
9
19
1
8
17
1
7
16
1
6
15
1
5
14
1
4
14
Gam
bia,
The
52
5
1
50
4
9
49
4
8
47
4
6
45
4
5
44
4
3
43
4
2
Gha
na 5
7
56
5
5
55
5
4
53
5
2
52
5
1
50
4
9
49
4
8
47
Gui
nea
69
6
9
69
6
8
68
6
8
67
6
7
66
6
6
65
6
5
65
6
4
Ken
ya 8
0
80
8
0
79
7
9
79
7
8
78
7
8
77
7
7
76
7
6
76
Leso
tho
81
8
0
79
7
9
78
7
7
77
7
6
75
7
5
74
7
3
72
7
2
Libe
ria
56
5
6
55
5
5
55
5
4
54
5
4
53
5
3
53
5
2
52
5
1
Mal
awi
86
8
5
85
8
5
85
8
5
85
8
5
85
8
5
85
8
4
84
8
4
Mal
i 7
2
72
7
1
71
7
0
70
6
9
68
6
8
67
6
6
66
6
5
64
Moz
ambi
que
71
7
1
71
7
1
70
7
0
70
7
0
70
6
9
69
6
9
69
6
9
Nam
ibia
68
6
8
67
6
7
66
6
5
65
6
4
64
6
3
63
6
2
62
6
1
Nig
er 8
4
84
8
4
84
8
3
83
8
3
83
8
3
83
8
3
82
8
2
82
Nig
eria
58
5
8
57
5
6
56
5
5
54
5
4
53
5
2
52
5
1
50
5
0
Rw
anda
87
8
6
85
8
5
84
8
3
82
8
2
82
8
2
81
8
1
81
8
1
Sen
egal
60
6
0
59
5
9
59
5
9
59
5
9
58
5
8
58
5
8
57
5
7
Sie
rra
Leon
e 6
4
64
6
4
64
6
3
63
6
3
62
6
2
62
6
1
61
6
1
60
Sou
th A
fric
a 4
4
43
4
3
42
4
2
41
4
1
40
4
0
39
3
9
38
3
8
38
Sou
th S
udan
84
8
3
83
8
3
83
8
3
83
8
3
83
8
2
82
8
2
82
8
2
Tanz
ania
78
7
8
77
7
7
77
7
6
76
7
5
75
7
5
74
7
4
73
7
3
Uga
nda
88
8
8
88
8
7
87
8
7
87
8
6
86
8
6
85
8
5
84
8
4
Zam
bia
65
6
5
65
6
4
64
6
4
63
6
3
63
6
2
62
6
1
61
6
0
Zim
babw
e 6
7
66
6
6
65
6
5
65
6
4
64
6
3
63
6
2
62
6
1
61
Sou
rce:
WD
I dat
abas
e

192 | Africa Agriculture Status Report 2014
GDP
GROW
TH (A
NNUA
L %)
2000
2001
2002
2003
2004
2005
2006
2007
2008
2009
2010
2011
2012
2013
Ang
ola
3.2
3.0
4.2
13
.85
.21
0.9
18
.32
0.7
22
.61
3.8
2.4
3.4
3.9
5.2
Ben
in5
.34
.96
.24
.43
.93
.12
.93
.84
.65
.02
.72
.63
.55
.4
Bot
swan
a9
.72
.00
.36
.14
.62
.74
.68
.08
.73
.9-7
.88
.66
.24
.3
Bur
kina
Fas
o7
.41
.86
.65
.17
.84
.58
.76
.83
.65
.83
.07
.94
.29
.5
Bur
undi
-1.0
-0.9
2.1
4.4
-1.2
4.8
0.9
5.4
4.8
5.0
3.5
3.8
4.2
4.0
Cen
tral
Afr
ica
Rep
ublic
3.6
-2.5
4.5
3.6
-5.4
6.0
0.9
7.6
8.1
3.9
8.9
6.6
3.3
4.1
Cam
eroo
n4
.44
.24
.54
.04
.03
.72
.33
.22
.83
.61
.93
.34
.14
.6
Con
go, D
em. R
ep.
-4.3
-6.9
-2.1
2.9
5.6
6.7
6.1
5.3
6.3
6.2
2.9
7.1
6.9
7.2
Con
go, R
ep.
-2.6
7.6
3.8
4.6
0.8
3.5
7.8
6.2
-1.6
5.6
7.5
8.8
3.4
3.8
Cot
e d'
Ivoi
re1
.6-3
.70
.0-1
.4-1
.61
.81
.30
.71
.72
.23
.62
.4-4
.79
.5
Equ
ator
ial G
uine
a2
5.7
18
.26
3.4
19
.51
4.0
38
.09
.71
.31
3.1
12
.3-8
.1-1
.35
.03
.2
Eth
iopi
a5
.26
.18
.31
.5-2
.21
3.6
11
.81
0.8
11
.51
0.8
8.8
12
.61
1.2
8.7
Gab
on-8
.9-1
.92
.1-0
.32
.51
.33
.01
.25
.61
.0-2
.96
.77
.15
.6
Gam
bia,
The
6.4
5.5
5.8
-3.3
6.9
7.1
-0.9
1.1
3.6
5.7
6.4
6.5
-4.3
6.1
Gha
na4
.43
.74
.04
.55
.25
.65
.96
.46
.58
.44
.08
.01
5.0
8.8
Gui
nea
3.8
2.5
3.7
5.2
1.2
2.3
3.0
2.5
1.8
4.9
-0.3
1.9
3.9
3.9
Ken
ya2
.30
.63
.80
.52
.95
.15
.96
.37
.01
.52
.75
.84
.44
.6
Leso
tho
0.4
5.1
4.2
0.5
4.7
2.3
2.7
4.3
4.7
5.7
3.4
7.1
2.8
6.5
Libe
ria
22
.92
5.7
22
.13
1.9
-32
.8-5
.19
.59
.81
5.7
10
.51
3.8
10
.99
.11
0.2
Mal
awi
3.0
1.6
-5.0
1.7
5.5
4.9
2.8
2.1
9.5
8.3
9.0
-9.5
4.3
1.9
Mal
i6
.73
.21
2.1
4.2
7.4
2.2
6.1
8.6
4.3
5.0
4.5
5.8
2.7
-0.4
Moz
ambi
que
8.1
1.1
11
.98
.86
.08
.88
.76
.37
.36
.86
.37
.17
.37
.2
Nam
ibia
3.4
3.5
1.2
4.8
4.2
12
.32
.57
.15
.43
.8-1
.56
.66
.06
.7
Nig
er-0
.6-1
.47
.13
.05
.30
.14
.55
.83
.19
.6-0
.78
.42
.31
0.8
Nig
eria
0.5
5.3
4.4
3.8
10
.43
3.7
3.4
8.2
6.8
6.3
6.9
7.8
4.7
6.7
Rw
anda
7.6
8.3
8.7
13
.51
.56
.99
.08
.67
.61
1.2
6.2
6.3
7.5
7.3
Sen
egal
6.3
3.2
4.6
0.7
6.7
5.9
5.6
2.5
4.9
3.7
2.4
4.3
2.1
3.5
Sie
rra
Leon
e-2
.06
.7-7
.12
6.3
9.4
6.4
4.3
5.7
8.0
5.3
3.2
5.4
6.0
15
.2
Sou
th A
fric
a2
.44
.22
.73
.72
.94
.65
.35
.65
.53
.6-1
.53
.13
.62
.5
Sou
th S
udan
....
....
....
....
....
7.0
3.1
2.6
-49
.0
Tanz
ania
4.8
4.9
6.0
7.2
6.9
7.8
7.4
6.7
7.1
7.4
6.0
7.0
6.4
6.9
Uga
nda
8.1
3.1
5.2
8.7
6.5
6.8
6.3
10
.88
.48
.77
.35
.96
.63
.4
Zam
bia
2.2
3.5
4.9
3.3
5.1
5.4
5.3
6.2
6.2
6.0
6.0
7.6
6.8
7.3
Zim
babw
e-0
.8-3
.11
.4-8
.9-1
7.0
-5.8
-5.7
-3.5
-3.7
-17
.76
.01
1.4
11
.95
.3
Sou
rce:
WD
I dat
abas
e

Africa Agriculture Status Report 2014 | 193
GDP
PER
CAPI
TA
2000
2001
2002
2003
2004
2005
2006
2007
2008
2009
2010
2011
2012
2013
Ang
ola
45
5
65
6
62
1
84
0
92
0
1,2
29
1
,70
7
2,4
41
3
,41
3
4,5
96
3
,98
9
4,2
19
5
,15
9
5,5
39
Ben
in 3
69
3
39
3
48
3
79
4
64
5
11
5
33
5
57
6
32
7
39
7
13
6
90
7
46
7
51
Bot
swan
a 3
,17
9
3,2
97
3
,07
8
3,0
07
4
,09
9
4,8
30
5
,29
4
5,3
41
5
,71
2
5,7
47
5
,17
8
6,9
80
7
,69
7
7,2
55
Bur
kina
Fas
o 2
67
2
25
2
35
2
61
3
32
3
71
4
07
4
23
4
75
5
70
5
53
5
93
6
50
6
52
Bur
undi
12
3
13
0
12
8
11
7
10
8
12
2
14
4
15
8
16
3
18
7
19
5
22
0
24
7
25
1
Cen
tral
Afr
ica
Rep
ublic
28
0
25
1
25
2
26
3
29
8
32
6
34
1
36
5
41
3
47
4
46
5
45
7
49
5
47
9
Cam
eroo
n 6
76
5
83
5
89
6
48
7
91
8
93
9
15
9
65
1
,07
0
1,2
11
1
,10
3
1,0
91
1
,20
5
1,2
20
Con
go, D
em. R
ep.
10
3
40
7
15
4
17
6
17
5
19
6
22
1
25
7
28
6
32
7
30
2
33
0
37
3
41
8
Con
go, R
ep.
77
3
1,0
30
8
72
9
20
1
,03
9
1,3
48
1
,71
8
2,1
20
2
,23
3
3,0
59
2
,40
1
2,9
20
3
,41
4
3,1
54
Cot
e d'
Ivoi
re 7
95
6
46
6
42
6
89
8
12
9
03
9
41
9
83
1
,10
3
1,2
82
1
,23
9
1,2
08
1
,24
2
1,2
44
Equ
ator
ial G
uine
a 1
,23
7
2,0
19
2
,73
3
3,2
77
4
,37
0
7,5
27
1
1,4
57
1
3,0
04
1
5,9
44
2
3,4
32
1
3,8
59
1
6,6
43
2
1,9
50
2
2,3
91
Eth
iopi
a 1
18
1
23
1
19
1
10
1
18
1
34
1
60
1
92
2
41
3
22
3
75
3
37
3
51
4
67
Gab
on 3
,89
9
4,1
35
3
,75
4
3,8
37
4
,60
2
5,3
28
6
,28
2
6,7
56
7
,99
4
10
,57
8
7,9
20
9
,36
2
11
,79
2
10
,93
0
Gam
bia,
The
68
3
63
7
54
3
44
3
36
1
41
6
43
4
44
2
52
2
61
2
55
3
56
6
51
8
51
0
Gha
na 4
20
2
65
2
75
3
12
3
76
4
26
5
02
9
30
1
,09
9
1,2
34
1
,09
7
1,3
26
1
,59
4
1,6
46
Gui
nea
40
2
34
2
31
9
32
6
37
4
39
1
30
7
28
8
41
1
43
8
43
5
43
5
45
4
49
3
Ken
ya 4
23
4
06
4
04
3
98
4
40
4
62
5
24
6
12
7
21
7
86
7
71
7
93
8
16
9
33
Leso
tho
43
6
41
5
37
7
34
8
51
0
64
5
71
1
73
6
81
7
82
7
85
9
1,0
83
1
,22
6
1,1
35
Libe
ria
16
1
18
3
17
2
17
5
13
1
14
7
16
6
17
8
21
0
23
1
30
2
32
7
37
7
41
4
Mal
awi
16
1
15
4
14
8
22
3
19
8
20
9
21
3
23
4
26
6
30
2
34
5
36
0
36
4
26
7
Mal
i 2
58
2
36
2
49
3
07
3
89
4
21
4
44
4
97
5
61
6
65
6
61
6
74
7
39
6
96
Moz
ambi
que
25
5
23
6
21
7
21
7
23
5
27
9
31
3
32
9
36
2
43
5
41
4
38
7
51
0
57
0
Nam
ibia
2,0
56
2
,05
9
1,8
36
1
,71
6
2,4
89
3
,29
8
3,5
82
3
,88
6
4,2
47
4
,02
4
4,0
70
5
,11
3
5,6
15
5
,93
1
Nig
er 1
90
1
64
1
71
1
84
2
23
2
40
2
58
2
67
3
02
3
67
3
53
3
60
3
88
3
95
Nig
eria
29
9
37
8
35
0
45
7
51
0
64
6
80
4
1,0
15
1
,13
1
1,3
76
1
,09
1
2,2
94
2
,51
9
2,7
22
Rw
anda
23
1
20
7
19
1
18
7
20
2
22
6
27
4
32
2
37
3
45
7
49
5
51
9
57
5
62
3
Sen
egal
53
5
47
5
48
2
51
3
64
3
73
2
77
3
80
8
94
8
1,0
94
1
,01
8
99
9
1,0
83
1
,02
3
Sie
rra
Leon
e 1
66
1
54
2
51
2
76
2
91
2
90
3
18
3
57
3
99
4
53
4
35
4
48
5
00
6
33
Sou
th A
fric
a 3
,10
3
3,0
20
2
,63
8
2,4
25
3
,62
5
4,6
60
5
,18
6
5,4
07
5
,85
1
5,5
11
5
,65
8
7,1
76
7
,83
1
7,3
14
Sou
th S
udan
..
..
..
..
..
..
..
..
..
1,7
97
1
,39
7
1,6
44
2
,00
2
97
4
Tanz
ania
30
1
30
8
30
6
31
1
32
6
35
0
37
5
36
9
42
1
50
4
50
4
52
5
53
0
60
9
Uga
nda
25
5
25
5
23
3
23
8
23
6
28
6
31
4
33
5
40
0
44
8
45
1
47
2
44
1
55
1
Zam
bia
31
8
32
2
35
3
34
9
39
9
48
7
62
6
90
8
95
3
1,1
75
9
98
1
,22
5
1,4
08
1
,46
3
Zim
babw
e 5
54
5
35
5
38
5
02
4
52
4
57
4
53
4
28
4
15
3
45
6
33
7
23
8
20
9
09
Sou
rce:
WD
I dat
abas
e
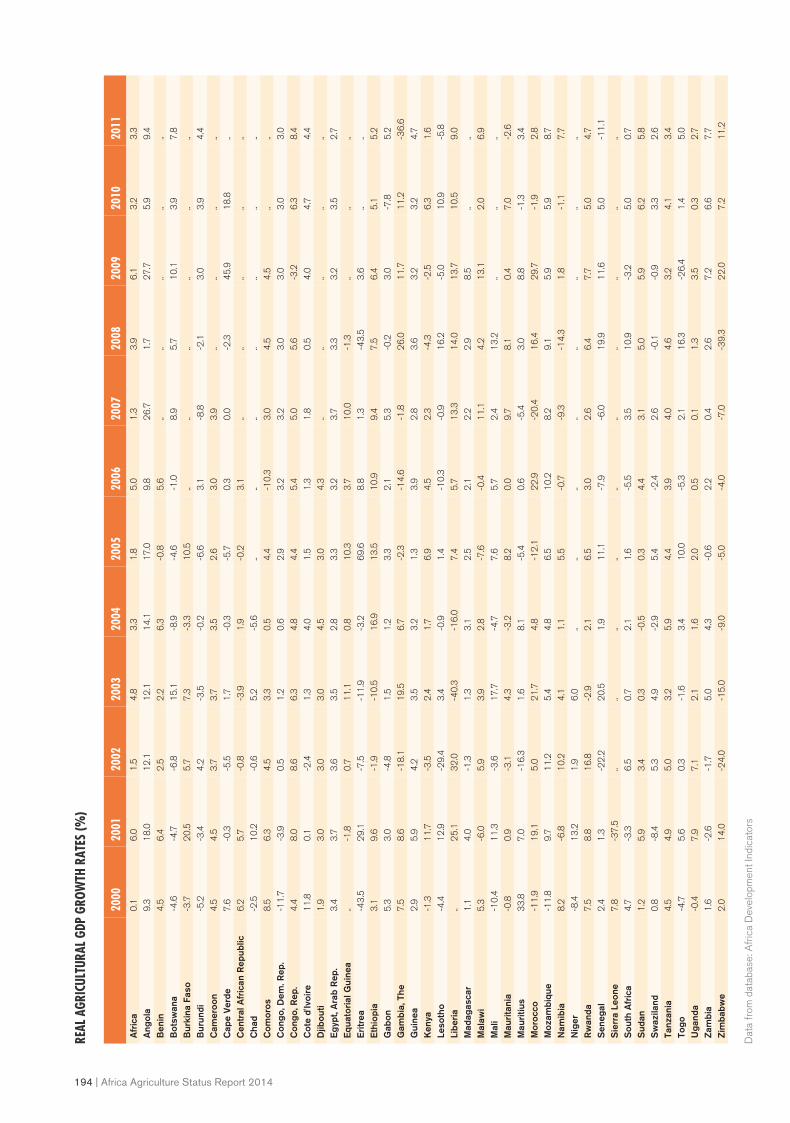
194 | Africa Agriculture Status Report 2014
REAL
AGR
ICUL
TURA
L GDP
GRO
WTH
RAT
ES (%
)
2000
2001
2002
2003
2004
2005
2006
2007
2008
2009
2010
2011
Afr
ica
0.1
6.0
1.5
4.8
3.3
1.8
5.0
1.3
3.9
6.1
3.2
3.3
Ang
ola
9.3
18
.01
2.1
12
.11
4.1
17
.09
.82
6.7
1.7
27
.75
.99
.4B
enin
4.5
6.4
2.5
2.2
6.3
-0.8
5.6
....
....
..B
otsw
ana
-4.6
-4.7
-6.8
15
.1-8
.9-4
.6-1
.08
.95
.71
0.1
3.9
7.8
Bur
kina
Fas
o-3
.72
0.5
5.7
7.3
-3.3
10
.5..
....
....
..B
urun
di-5
.2-3
.44
.2-3
.5-0
.2-6
.63
.1-8
.8-2
.13
.03
.94
.4C
amer
oon
4.5
4.5
3.7
3.7
3.5
2.6
3.0
3.9
....
....
Cap
e V
erde
7.6
-0.3
-5.5
1.7
-0.3
-5.7
0.3
0.0
-2.3
45
.91
8.8
..C
entr
al A
fric
an R
epub
lic6
.25
.7-0
.8-3
.91
.9-0
.23
.1..
....
....
Cha
d-2
.51
0.2
-0.6
5.2
-5.6
....
....
....
..C
omor
os8
.56
.34
.53
.30
.54
.4-1
0.3
3.0
4.5
4.5
....
Con
go, D
em. R
ep.
-11
.7-3
.90
.51
.20
.62
.93
.23
.23
.03
.03
.03
.0C
ongo
, Rep
.4
.48
.08
.66
.34
.84
.45
.45
.05
.6-3
.26
.38
.4C
ote
d'Iv
oire
11
.80
.1-2
.41
.34
.01
.51
.31
.80
.54
.04
.74
.4D
jibou
ti1
.93
.03
.03
.04
.53
.04
.3..
....
....
Egy
pt, A
rab
Rep
.3
.43
.73
.63
.52
.83
.33
.23
.73
.33
.23
.52
.7E
quat
oria
l Gui
nea
..-1
.80
.71
1.1
0.8
10
.33
.71
0.0
-1.3
....
..E
ritr
ea-4
3.5
29
.1-7
.5-1
1.9
-3.2
69
.68
.81
.3-4
3.5
3.6
....
Eth
iopi
a3
.19
.6-1
.9-1
0.5
16
.91
3.5
10
.99
.47
.56
.45
.15
.2G
abon
5.3
3.0
-4.8
1.5
1.2
3.3
2.1
5.3
-0.2
3.0
-7.8
5.2
Gam
bia,
The
7.5
8.6
-18
.11
9.5
6.7
-2.3
-14
.6-1
.82
6.0
11
.71
1.2
-36
.6G
uine
a2
.95
.94
.23
.53
.21
.33
.92
.83
.63
.23
.24
.7K
enya
-1.3
11
.7-3
.52
.41
.76
.94
.52
.3-4
.3-2
.56
.31
.6Le
soth
o-4
.41
2.9
-29
.43
.4-0
.91
.4-1
0.3
-0.9
16
.2-5
.01
0.9
-5.8
Libe
ria
..2
5.1
32
.0-4
0.3
-16
.07
.45
.71
3.3
14
.01
3.7
10
.59
.0M
adag
asca
r1
.14
.0-1
.31
.33
.12
.52
.12
.22
.98
.5..
..M
alaw
i5
.3-6
.05
.93
.92
.8-7
.6-0
.41
1.1
4.2
13
.12
.06
.9M
ali
-10
.41
1.3
-3.6
17
.7-4
.77
.65
.72
.41
3.2
....
..M
auri
tani
a-0
.80
.9-3
.14
.3-3
.28
.20
.09
.78
.10
.47
.0-2
.6M
auri
tius
33
.87
.0-1
6.3
1.6
8.1
-5.4
0.6
-5.4
3.0
8.8
-1.3
3.4
Mor
occo
-11
.91
9.1
5.0
21
.74
.8-1
2.1
22
.9-2
0.4
16
.42
9.7
-1.9
2.8
Moz
ambi
que
-11
.89
.71
1.2
5.4
4.8
6.5
10
.28
.29
.15
.95
.98
.7N
amib
ia8
.2-6
.81
0.2
4.1
1.1
5.5
-0.7
-9.3
-14
.31
.8-1
.17
.7N
iger
-8.4
13
.21
.96
.0..
....
....
....
..R
wan
da7
.58
.81
6.8
-2.9
2.1
6.5
3.0
2.6
6.4
7.7
5.0
4.7
Sen
egal
2.4
1.3
-22
.22
0.5
1.9
11
.1-7
.9-6
.01
9.9
11
.65
.0-1
1.1
Sie
rra
Leon
e7
.8-3
7.5
....
....
....
....
....
Sou
th A
fric
a4
.7-3
.36
.50
.72
.11
.6-5
.53
.51
0.9
-3.2
5.0
0.7
Sud
an1
.25
.93
.40
.3-0
.50
.34
.43
.15
.05
.96
.25
.8S
waz
iland
0.8
-8.4
5.3
4.9
-2.9
5.4
-2.4
2.6
-0.1
-0.9
3.3
2.6
Tanz
ania
4.5
4.9
5.0
3.2
5.9
4.4
3.9
4.0
4.6
3.2
4.1
3.4
Togo
-4.7
5.6
0.3
-1.6
3.4
10
.0-5
.32
.11
6.3
-26
.41
.45
.0U
gand
a-0
.47
.97
.12
.11
.62
.00
.50
.11
.33
.50
.32
.7Z
ambi
a1
.6-2
.6-1
.75
.04
.3-0
.62
.20
.42
.67
.26
.67
.7Z
imba
bwe
2.0
14
.0-2
4.0
-15
.0-9
.0-5
.0-4
.0-7
.0-3
9.3
22
.07
.21
1.2
Dat
a fr
om d
atab
ase:
Afr
ica
Dev
elop
men
t Ind
icat
ors

Africa Agriculture Status Report 2014 | 195
CERE
AL P
RODU
CTIO
N (M
ETRI
C TO
NS ‘0
00 ‘)
2000
2001
2002
2003
2004
2005
2006
2007
2008
2009
2010
2011
2012
2013
Ang
ola
54
1
51
0
58
6
71
7
71
7
71
7
88
5
67
8
78
1
74
2
1,0
16
1
,13
5
1,3
51
4
98
Ben
in 9
74
9
93
9
43
9
26
1
,04
3
1,1
09
1
,15
2
93
3
1,0
20
1
,36
7
1,3
48
1
,33
3
1,5
44
1
,47
3
Bot
swan
a 2
1
25
2
3
35
3
6
27
3
7
44
3
1
37
5
4
50
6
7
54
Bur
kina
Fas
o 2
,70
0
2,2
86
3
,10
9
3,1
19
3
,56
4
2,9
02
3
,65
0
3,6
81
3
,10
9
4,3
59
3
,62
7
4,5
61
3
,66
6
4,8
76
Bur
undi
26
5
24
5
27
3
28
2
27
3
28
0
27
7
28
6
29
1
29
1
30
0
31
3
32
9
25
2
Cen
tral
Afr
ica
Rep
ublic
16
1
16
6
18
3
19
3
20
2
21
0
23
7
22
7
23
7
23
6
25
1
24
9
25
9
26
1
Cam
eroo
n 1
,18
5
1,2
75
1
,35
6
1,4
99
1
,58
7
1,6
84
1
,93
8
2,2
32
2
,36
7
2,4
74
2
,90
6
3,0
12
2
,98
8
2,9
62
Con
go, D
em. R
ep.
1,5
93
1
,57
2
1,5
46
1
,52
0
1,5
21
1
,52
2
1,5
23
1
,52
4
1,5
25
1
,52
6
1,5
27
1
,52
8
1,7
53
1
,84
0
Con
go, R
ep.
10
1
0
18
1
9
23
2
4
22
2
2
21
2
3
24
2
5
27
2
9
Cot
e d'
Ivoi
re 1
,26
4
1,2
86
1
,30
8
1,3
30
1
,33
4
1,3
78
1
,42
5
1,4
42
1
,22
5
1,4
08
1
,42
9
1,4
78
1
,43
7
1,4
96
Eth
iopi
a 8
,39
3
8,0
20
9
,58
6
9,0
00
9
,53
3
10
,14
0
12
,75
0
12
,67
2
12
,23
6
13
,26
0
14
,49
6
15
,53
4
17
,76
1
18
,81
0
Gab
on 2
8
27
2
6
25
3
2
32
3
6
33
3
4
36
4
1
43
4
5
46
Gam
bia,
The
15
1
17
6
20
0
13
9
20
5
22
4
20
6
21
5
15
1
23
5
31
1
36
4
18
3
22
1
Gha
na 1
,68
6
1,7
11
1
,62
7
2,1
55
2
,04
1
1,8
30
1
,94
8
1,9
19
1
,67
3
2,2
97
2
,60
7
2,9
07
2
,61
9
2,8
91
Gui
nea
1,6
56
1
,80
1
1,7
21
1
,84
6
1,9
84
2
,13
6
2,2
90
2
,44
5
2,6
01
2
,74
0
2,6
31
2
,74
3
2,9
47
3
,26
0
Ken
ya 2
,80
2
2,5
91
3
,37
0
3,0
46
3
,35
1
3,1
99
3
,58
5
3,9
37
3
,61
4
2,8
66
2
,89
9
4,3
47
4
,05
9
4,4
83
Leso
tho
17
4
15
0
25
5
15
0
11
6
10
9
11
2
11
9
73
7
4
75
1
73
1
04
3
2
Libe
ria
19
6
18
3
14
5
11
0
10
0
11
0
15
5
16
4
23
2
29
5
29
3
29
6
30
0
30
5
Mal
awi
2,6
36
2
,63
1
1,8
66
1
,71
1
2,1
43
1
,71
8
1,3
02
2
,78
6
3,4
40
2
,84
6
3,8
08
3
,61
0
3,9
25
3
,83
3
Mal
i 2
,89
4
2,3
10
2
,58
4
2,5
32
3
,40
2
2,8
45
3
,39
9
3,6
93
3
,88
6
4,8
15
6
,33
5
6,4
16
5
,77
8
6,6
75
Moz
ambi
que
1,8
15
1
,58
8
1,5
07
1
,36
1
1,5
13
1
,32
8
1,1
43
1
,75
2
1,8
90
2
,20
2
2,2
39
2
,28
6
2,9
32
1
,76
4
Nam
ibia
74
1
21
1
07
1
00
9
7
11
9
10
5
13
6
11
6
11
3
11
2
12
3
14
9
13
9
Nig
er 2
,85
3
2,1
28
3
,16
2
3,2
44
3
,56
8
2,7
30
3
,66
9
4,0
47
3
,85
7
4,8
04
3
,45
1
5,2
03
3
,78
2
4,7
67
Nig
eria
22
,40
5
21
,37
0
20
,09
0
21
,37
3
22
,73
6
24
,32
1
26
,03
1
28
,86
4
27
,17
1
30
,20
9
21
,26
8
24
,65
6
22
,16
6
22
,33
3
Rw
anda
17
9
24
0
28
6
30
8
29
8
31
9
41
3
36
6
35
7
46
6
62
2
74
6
85
7
88
1
Sen
egal
1,1
34
1
,02
7
1,0
23
7
86
1
,45
3
1,0
55
1
,43
4
98
9
77
3
1,7
44
1
,87
2
1,7
69
1
,10
1
1,6
65
Sie
rra
Leon
e 2
80
2
22
3
35
4
66
4
96
6
19
8
25
1
,15
9
65
6
76
0
98
6
1,1
56
1
,20
4
1,2
97
Sou
th A
fric
a 1
0,0
64
1
4,5
27
1
0,7
03
1
3,0
45
1
1,8
16
1
2,0
25
1
4,1
79
9
,44
4
9,5
07
1
5,3
38
1
4,5
77
1
4,6
99
1
2,9
19
1
4,8
09
Tanz
ania
4,0
13
3
,62
7
4,5
41
6
,37
3
4,1
14
6
,70
4
5,3
86
5
,71
9
6,3
13
7
,65
2
5,8
07
8
,63
7
7,8
51
8
,10
7
Uga
nda
2,1
78
2
,11
2
2,3
09
2
,36
8
2,5
08
2
,27
4
2,5
26
2
,55
7
2,6
32
3
,12
9
3,2
04
3
,27
0
3,5
36
3
,54
6
Zam
bia
1,0
03
1
,20
8
94
9
75
5
1,3
65
1
,38
0
1,0
66
1
,60
4
1,5
36
1
,39
4
2,1
97
3
,09
8
3,3
63
3
,19
3
Zim
babw
e 1
,93
8
2,5
19
1
,84
6
90
9
1,3
29
2
,16
9
1,2
57
1
,94
8
1,2
73
6
92
9
11
1
,43
7
1,7
68
1
,23
2
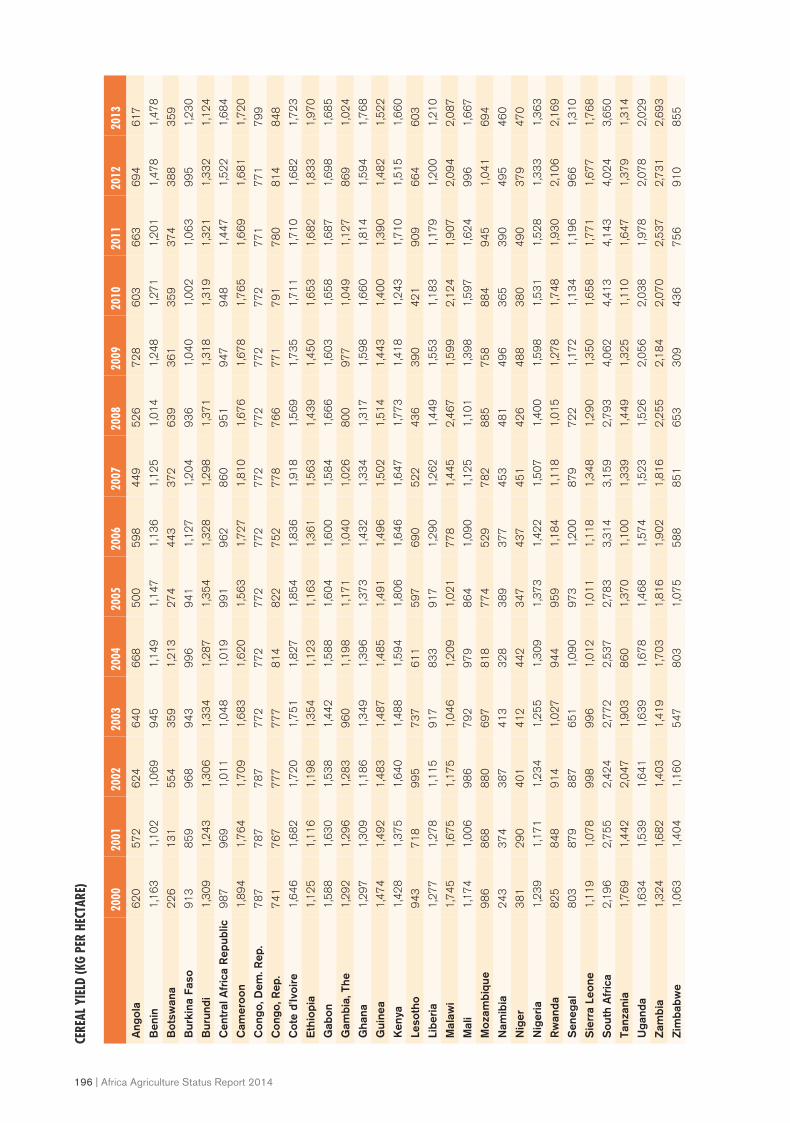
196 | Africa Agriculture Status Report 2014
CERE
AL Y
IELD
(KG
PER
HECT
ARE)
2000
2001
2002
2003
2004
2005
2006
2007
2008
2009
2010
2011
2012
2013
Ang
ola
62
0
57
2
62
4
64
0
66
8
50
0
59
8
44
9
52
6
72
8
60
3
66
3
69
4
61
7
Ben
in 1
,16
3
1,1
02
1
,06
9
94
5
1,1
49
1
,14
7
1,1
36
1
,12
5
1,0
14
1
,24
8
1,2
71
1
,20
1
1,4
78
1
,47
8
Bot
swan
a 2
26
1
31
5
54
3
59
1
,21
3
27
4
44
3
37
2
63
9
36
1
35
9
37
4
38
8
35
9
Bur
kina
Fas
o 9
13
8
59
9
68
9
43
9
96
9
41
1
,12
7
1,2
04
9
36
1
,04
0
1,0
02
1
,06
3
99
5
1,2
30
Bur
undi
1,3
09
1
,24
3
1,3
06
1
,33
4
1,2
87
1
,35
4
1,3
28
1
,29
8
1,3
71
1
,31
8
1,3
19
1
,32
1
1,3
32
1
,12
4
Cen
tral
Afr
ica
Rep
ublic
98
7
96
9
1,0
11
1
,04
8
1,0
19
9
91
9
62
8
60
9
51
9
47
9
48
1
,44
7
1,5
22
1
,68
4
Cam
eroo
n 1
,89
4
1,7
64
1
,70
9
1,6
83
1
,62
0
1,5
63
1
,72
7
1,8
10
1
,67
6
1,6
78
1
,76
5
1,6
69
1
,68
1
1,7
20
Con
go, D
em. R
ep.
78
7
78
7
78
7
77
2
77
2
77
2
77
2
77
2
77
2
77
2
77
2
77
1
77
1
79
9
Con
go, R
ep.
74
1
76
7
77
7
77
7
81
4
82
2
75
2
77
8
76
6
77
1
79
1
78
0
81
4
84
8
Cot
e d'
Ivoi
re 1
,64
6
1,6
82
1
,72
0
1,7
51
1
,82
7
1,8
54
1
,83
6
1,9
18
1
,56
9
1,7
35
1
,71
1
1,7
10
1
,68
2
1,7
23
Eth
iopi
a 1
,12
5
1,1
16
1
,19
8
1,3
54
1
,12
3
1,1
63
1
,36
1
1,5
63
1
,43
9
1,4
50
1
,65
3
1,6
82
1
,83
3
1,9
70
Gab
on 1
,58
8
1,6
30
1
,53
8
1,4
42
1
,58
8
1,6
04
1
,60
0
1,5
84
1
,66
6
1,6
03
1
,65
8
1,6
87
1
,69
8
1,6
85
Gam
bia,
The
1,2
92
1
,29
6
1,2
83
9
60
1
,19
8
1,1
71
1
,04
0
1,0
26
8
00
9
77
1
,04
9
1,1
27
8
69
1
,02
4
Gha
na 1
,29
7
1,3
09
1
,18
6
1,3
49
1
,39
6
1,3
73
1
,43
2
1,3
34
1
,31
7
1,5
98
1
,66
0
1,8
14
1
,59
4
1,7
68
Gui
nea
1,4
74
1
,49
2
1,4
83
1
,48
7
1,4
85
1
,49
1
1,4
96
1
,50
2
1,5
14
1
,44
3
1,4
00
1
,39
0
1,4
82
1
,52
2
Ken
ya 1
,42
8
1,3
75
1
,64
0
1,4
88
1
,59
4
1,8
06
1
,64
6
1,6
47
1
,77
3
1,4
18
1
,24
3
1,7
10
1
,51
5
1,6
60
Leso
tho
94
3
71
8
99
5
73
7
61
1
59
7
69
0
52
2
43
6
39
0
42
1
90
9
66
4
60
3
Libe
ria
1,2
77
1
,27
8
1,1
15
9
17
8
33
9
17
1
,29
0
1,2
62
1
,44
9
1,5
53
1
,18
3
1,1
79
1
,20
0
1,2
10
Mal
awi
1,7
45
1
,67
5
1,1
75
1
,04
6
1,2
09
1
,02
1
77
8
1,4
45
2
,46
7
1,5
99
2
,12
4
1,9
07
2
,09
4
2,0
87
Mal
i 1
,17
4
1,0
06
9
86
7
92
9
79
8
64
1
,09
0
1,1
25
1
,10
1
1,3
98
1
,59
7
1,6
24
9
96
1
,66
7
Moz
ambi
que
98
6
86
8
88
0
69
7
81
8
77
4
52
9
78
2
88
5
75
8
88
4
94
5
1,0
41
6
94
Nam
ibia
24
3
37
4
38
7
41
3
32
8
38
9
37
7
45
3
48
1
49
6
36
5
39
0
49
5
46
0
Nig
er 3
81
2
90
4
01
4
12
4
42
3
47
4
37
4
51
4
26
4
88
3
80
4
90
3
79
4
70
Nig
eria
1,2
39
1
,17
1
1,2
34
1
,25
5
1,3
09
1
,37
3
1,4
22
1
,50
7
1,4
00
1
,59
8
1,5
31
1
,52
8
1,3
33
1
,36
3
Rw
anda
82
5
84
8
91
4
1,0
27
9
44
9
59
1
,18
4
1,1
18
1
,01
5
1,2
78
1
,74
8
1,9
30
2
,10
6
2,1
69
Sen
egal
80
3
87
9
88
7
65
1
1,0
90
9
73
1
,20
0
87
9
72
2
1,1
72
1
,13
4
1,1
96
9
66
1
,31
0
Sie
rra
Leon
e 1
,11
9
1,0
78
9
98
9
96
1
,01
2
1,0
11
1
,11
8
1,3
48
1
,29
0
1,3
50
1
,65
8
1,7
71
1
,67
7
1,7
68
Sou
th A
fric
a 2
,19
6
2,7
55
2
,42
4
2,7
72
2
,53
7
2,7
83
3
,31
4
3,1
59
2
,79
3
4,0
62
4
,41
3
4,1
43
4
,02
4
3,6
50
Tanz
ania
1,7
69
1
,44
2
2,0
47
1
,90
3
86
0
1,3
70
1
,10
0
1,3
39
1
,44
9
1,3
25
1
,11
0
1,6
47
1
,37
9
1,3
14
Uga
nda
1,6
34
1
,53
9
1,6
41
1
,63
9
1,6
78
1
,46
8
1,5
74
1
,52
3
1,5
26
2
,05
6
2,0
38
1
,97
8
2,0
78
2
,02
9
Zam
bia
1,3
24
1
,68
2
1,4
03
1
,41
9
1,7
03
1
,81
6
1,9
02
1
,81
6
2,2
55
2
,18
4
2,0
70
2
,53
7
2,7
31
2
,69
3
Zim
babw
e 1
,06
3
1,4
04
1
,16
0
54
7
80
3
1,0
75
5
88
8
51
6
53
3
09
4
36
7
56
9
10
8
55

Africa Agriculture Status Report 2014 | 197
Sou
rce:
WD
I dat
abas
e
CROP
PRO
DUCT
ION
INDE
X (2
004-
2006
= 1
00)
2000
2001
2002
2003
2004
2005
2006
2007
2008
2009
2010
2011
2012
2013
Ang
ola
42
.9
52
.4
62
.5
73
.5
81
.8
93
.1
10
2.5
1
04
.3
11
9.5
1
25
.7
16
9.0
1
81
.2
20
1.3
1
60
.0
Ben
in 8
2.9
8
9.5
8
9.0
9
8.5
1
02
.1
10
6.8
1
01
.8
91
.4
95
.6
11
4.1
1
11
.8
11
5.8
1
27
.2
13
7.2
Bot
swan
a 8
5.2
9
1.6
9
8.3
1
02
.8
10
4.7
1
09
.2
99
.3
91
.5
74
.9
82
.6
79
.9
89
.9
10
5.3
9
9.3
Bur
kina
Fas
o 7
5.3
6
0.4
8
4.2
8
7.8
9
8.0
8
7.3
1
04
.5
10
8.2
7
7.3
1
19
.3
99
.3
11
9.7
9
7.0
1
26
.3
Bur
undi
94
.9
90
.3
97
.9
10
2.4
1
04
.7
10
1.0
9
8.3
1
00
.7
10
4.3
1
03
.2
11
1.4
1
10
.7
11
0.1
9
6.0
Cen
tral
Afr
ica
Rep
ublic
96
.9
10
0.5
1
04
.2
10
0.9
9
4.9
9
8.6
9
9.7
1
01
.7
10
6.9
1
09
.6
11
5.3
1
11
.6
11
7.4
1
19
.0
Cam
eroo
n 7
5.4
7
7.4
7
8.3
8
0.3
8
3.0
8
5.6
1
03
.5
11
0.9
1
16
.7
12
0.6
1
31
.3
14
4.7
1
51
.6
15
4.1
Con
go, D
em. R
ep.
10
4.7
1
02
.4
10
0.1
9
8.1
9
8.8
9
9.5
1
00
.1
10
0.4
1
01
.4
10
2.3
1
03
.2
99
.5
10
2.7
1
07
.6
Con
go, R
ep.
84
.1
86
.2
87
.8
89
.4
90
.9
95
.7
10
0.2
1
04
.2
10
6.9
1
12
.1
11
6.8
1
15
.1
11
6.8
1
22
.5
Cot
e d'
Ivoi
re 9
4.1
1
01
.6
94
.4
95
.6
94
.3
95
.8
10
0.0
1
04
.2
99
.0
10
5.4
9
8.5
1
02
.8
10
9.1
1
15
.1
Equ
ator
ial G
uine
a 8
9.6
9
3.2
9
3.6
9
1.2
9
5.0
9
6.4
1
00
.4
10
3.2
1
12
.4
10
9.2
1
14
.3
11
1.2
1
12
.6
11
6.4
Eth
iopi
a 7
0.9
7
4.5
8
0.5
7
8.5
8
2.0
8
9.1
1
05
.6
10
5.4
1
08
.0
11
3.4
1
26
.4
13
7.0
1
45
.6
15
2.2
Gab
on 9
3.9
9
8.1
9
5.2
9
6.7
9
7.2
9
7.8
9
9.9
1
02
.3
10
4.8
1
09
.6
11
3.5
1
17
.9
11
9.4
1
22
.4
Gam
bia,
The
91
.0
10
0.7
1
11
.2
64
.3
84
.7
10
9.5
9
2.1
9
8.5
6
4.5
1
00
.6
12
3.2
1
40
.8
84
.2
10
8.4
Gha
na 8
0.7
7
8.8
8
1.4
9
0.3
9
2.9
9
7.4
1
00
.0
10
2.7
1
00
.4
11
2.0
1
22
.0
12
4.8
1
28
.7
13
6.3
Gui
nea
81
.6
84
.9
84
.3
89
.1
93
.4
98
.2
10
0.8
1
01
.0
10
4.6
1
09
.2
10
8.5
1
11
.1
11
5.1
1
21
.5
Ken
ya 8
4.5
7
7.0
8
7.0
8
7.2
8
7.9
8
6.6
1
04
.7
10
8.7
1
09
.2
10
9.0
1
12
.7
12
7.0
1
20
.2
17
2.9
Leso
tho
11
8.1
1
12
.7
14
6.1
1
08
.0
95
.2
10
1.1
9
8.4
1
00
.6
90
.7
90
.9
84
.0
12
6.5
1
07
.1
85
.7
Libe
ria
95
.4
10
0.0
9
7.9
9
7.5
9
6.1
1
00
.9
10
4.9
9
4.3
1
09
.0
10
3.5
9
3.0
9
6.0
9
9.3
9
9.3
Mal
awi
84
.2
98
.7
10
6.6
8
2.4
9
5.1
9
8.8
8
3.7
1
17
.5
13
4.2
1
34
.9
15
8.0
1
56
.2
15
9.0
1
70
.9
Mal
i 9
0.4
6
9.4
9
0.9
8
4.2
1
08
.0
95
.9
10
4.3
9
9.8
1
02
.7
11
3.2
1
33
.5
13
7.8
1
35
.8
14
9.6
Moz
ambi
que
84
.9
77
.0
84
.5
89
.7
96
.7
10
0.1
9
3.3
1
06
.6
11
0.9
1
10
.2
12
2.1
1
57
.8
16
8.5
1
69
.0
Nam
ibia
68
.2
80
.2
83
.0
82
.1
87
.4
99
.5
94
.9
10
5.6
1
07
.9
10
5.1
1
04
.4
11
1.3
1
18
.2
11
7.0
Nig
er 7
1.7
6
3.6
8
2.3
9
4.8
1
03
.5
82
.1
10
3.4
1
14
.6
12
1.8
1
61
.2
11
8.9
1
80
.5
15
3.3
1
72
.7
Nig
eria
78
.5
79
.4
78
.8
82
.8
88
.1
94
.9
99
.7
10
5.4
9
6.2
1
03
.1
88
.4
10
0.2
1
00
.6
10
6.2
Rw
anda
73
.3
83
.6
81
.1
10
1.3
9
4.2
9
3.3
1
00
.9
10
5.8
1
05
.2
10
9.7
1
38
.6
14
6.7
1
59
.9
17
1.3
Sen
egal
10
9.5
1
10
.7
10
3.3
6
1.4
9
5.1
9
4.7
1
13
.8
91
.6
80
.1
13
5.5
1
48
.1
16
2.7
1
02
.7
13
0.2
Sie
rra
Leon
e 4
6.1
4
2.4
4
9.2
5
8.4
8
4.4
9
3.0
9
2.2
1
14
.8
98
.2
10
4.3
1
29
.0
14
7.9
1
54
.0
16
0.7
Sou
th A
fric
a 9
5.3
1
02
.5
94
.0
10
2.6
9
9.0
1
00
.7
10
5.5
9
3.8
9
3.1
1
13
.3
10
9.0
1
07
.7
10
7.5
1
12
.1
Tanz
ania
67
.9
66
.6
72
.9
95
.6
80
.6
96
.9
96
.8
10
6.3
1
08
.4
10
6.1
1
09
.2
12
8.2
1
37
.3
14
6.7
Uga
nda
91
.8
92
.8
98
.9
10
2.4
1
02
.8
10
2.0
9
9.9
9
8.1
1
01
.0
10
5.3
1
06
.4
10
9.4
1
11
.3
10
6.7
Zam
bia
77
.0
71
.7
69
.9
69
.8
86
.9
93
.8
98
.7
10
7.6
1
09
.1
10
6.4
1
35
.8
15
4.1
1
71
.3
17
6.4
Zim
babw
e 1
33
.4
15
7.1
1
41
.0
10
7.4
1
07
.2
11
5.5
8
8.3
9
6.2
9
4.3
8
8.3
8
3.1
8
7.8
1
07
.1
10
4.4

198 | Africa Agriculture Status Report 2014
FERT
ILIZ
ER C
ONSU
MPT
ION
(KIL
OGRA
MS
PER
HECT
ARE
OF A
RABL
E LA
ND)
2003
2004
2005
2006
2007
2008
2009
2010
2011
Ang
ola
1.6
59
1
.78
9
4.5
02
2
.26
1
3.6
60
3
.30
5
8.2
59
1
.07
6
2.0
03
Ben
in 1
6.3
67
0
.80
2
0.0
53
0
.45
4
0.0
13
0
.24
6
0.3
08
6
.47
9
0.4
65
Bur
kina
Fas
o 0
.42
8
10
.39
1
12
.54
1
15
.24
4
13
.40
4
10
.10
1
9.3
78
9
.45
2
9.4
29
Bur
undi
1.3
44
0
.30
4
1.1
12
3
.54
6
3.1
67
1
.84
5
2.0
79
1
.50
7
3.3
04
Cam
eroo
n 9
.76
9
8.1
55
1
1.0
63
7
.99
9
9.0
32
8
.62
3
6.5
57
6
.66
6
4.9
59
Con
go, D
em. R
ep.
-
0.2
75
0
.20
8
0.0
68
0
.45
5
0.6
35
0
.94
0
0.5
04
0
.67
2
Con
go, R
ep.
-
-
2.6
51
0
.06
5
0.0
53
0
.35
9
0.7
47
4
.57
8
0.5
52
Cot
e d'
Ivoi
re 3
1.0
19
3
0.4
32
2
7.2
19
1
7.7
80
2
2.7
73
2
3.9
90
1
8.2
12
1
5.3
08
3
2.2
04
Eth
iopi
a 1
7.4
61
5
.70
2
11
.66
4
11
.30
7
11
.53
8
16
.80
9
16
.67
1
18
.10
6
22
.81
4
Gab
on 5
.57
8
3.6
12
5
.10
8
8.3
45
8
.45
8
9.0
58
1
0.5
17
1
2.0
22
3
.16
0
Gam
bia,
The
-
9.1
00
7
.96
2
9.6
09
1
0.8
26
8
.97
7
4.2
61
6
.34
3
7.3
00
Gha
na 3
.74
6
6.8
39
1
3.2
01
5
.99
9
20
.06
0
17
.76
0
14
.55
0
19
.17
9
17
.85
7
Gui
nea
1.0
04
0
.79
4
1.0
30
0
.92
0
0.8
84
1
.21
4
1.2
98
0
.63
4
1.0
66
Ken
ya 2
7.3
13
3
3.0
97
2
7.6
81
3
4.3
27
3
3.1
55
3
6.3
95
3
3.2
88
3
1.8
57
3
0.3
47
Mal
awi
29
.71
4
31
.07
7
34
.40
6
30
.49
2
36
.82
5
41
.71
9
35
.38
3
29
.32
3
32
.99
7
Mal
i -
-
5
2.0
42
1
5.6
92
1
7.5
01
3
1.0
50
2
2.4
82
6
.08
4
19
.60
0
Moz
ambi
que
5.9
78
0
.73
6
2.2
60
1
.58
6
4.7
40
2
.88
3
12
.84
4
4.2
66
8
.90
9
Nam
ibia
3.9
03
1
.41
1
3.2
05
1
.91
2
2.8
46
2
.46
5
0.2
86
1
.59
0
4.4
34
Nig
er 0
.61
1
0.2
93
0
.24
0
0.3
87
0
.52
7
0.3
54
0
.15
3
0.3
53
0
.50
1
Nig
eria
4.8
12
6
.71
7
4.8
21
7
.40
3
9.9
85
4
.14
9
5.7
18
4
.95
2
5.6
81
Rw
anda
-
2.2
39
1
.81
9
3.0
47
3
.44
5
8.0
22
8
.95
3
1.1
93
0
.07
7
Sen
egal
11
.60
4
10
.75
5
12
.50
2
9.7
11
2
.19
3
2.0
49
2
.28
4
4.9
49
7
.58
4
Sou
th A
fric
a 6
1.2
05
5
5.1
50
6
0.2
88
4
7.3
31
6
2.3
36
6
1.0
22
5
6.2
93
5
5.7
74
5
3.2
11
Tanz
ania
3.7
00
4
.45
6
5.2
89
5
.75
4
5.3
98
5
.07
2
4.6
77
7
.52
5
6.5
74
Uga
nda
1.3
33
1
.59
5
1.4
72
0
.96
7
1.2
54
1
.20
0
2.9
42
2
.08
3
1.7
19
Zam
bia
26
.07
5
26
.17
3
29
.90
5
27
.98
4
25
.67
7
32
.33
4
38
.65
7
27
.31
7
26
.80
8
Zim
babw
e 3
5.8
98
4
0.2
29
2
2.8
44
2
1.9
12
3
2.9
18
2
6.8
34
2
2.0
98
2
7.3
76
2
5.8
53
Sou
rce:
WD
I dat
abas
e

Africa Agriculture Status Report 2014 | 199
Sou
rce:
Min
istr
ies
of A
gric
ultu
re a
nd B
urea
u of
Sta
tistic
s
AVER
AGE
SIZE
OF
AGRI
CULT
URAL
LAND
(HA)
PER
HOU
SEHO
LD
2000
2001
2002
2003
2004
2005
2006
2007
2008
2009
2010
2011
2012
2013
Bur
undi
....
....
....
....
....
....
0.8
0
.8
Bur
kina
Fas
o3
.6
3.3
3
.4
3.3
3
.3
3.3
3
.5
..5
.0
....
....
Cam
eroo
n..
....
....
....
2.4
..
....
....
..
Eth
iopi
a..
....
....
....
....
....
1.8
..
..
Gha
na1
.3
1.2
1
.2
1.2
1
.2
1.2
1
.2
1.2
1
.2
1.2
1
.2
1.2
1
.2
..
Ken
ya..
....
....
0.7
..
....
....
....
..
Mal
awi
0.9
0
.9
0.9
0
.9
0.8
0
.8
0.8
0
.8
0.8
0
.7
0.7
0
.7
0.7
..
Mal
i5
.0
3.1
2
.3
4.4
4
.5
2.9
4
.0
4.0
4
.1
5.7
4
.3
4.9
..
Moz
ambi
que
1.4
..
1.6
1
.6
..1
.8
1.6
1
.7
1.6
1
.5
1.0
..
Nig
er..
....
....
3.1
2
.7
2.9
2
.8
3.0
2
.9
2.8
..
Nig
eria
....
....
....
....
....
..2
.4
2.2
..
Rw
anda
....
....
....
....
0.5
..
....
..0
.2
Tanz
ania
....
..2
.0
2.0
..
....
2.0
..
..2
.4
....
Uga
nda
....
....
1.7
..
....
1.3
..
1.3
1
.3
..
Sou
rce:
Min
istr
ies
of A
gric
ultu
re a
nd B
urea
u of
Sta
tistic
s
NUM
BER
OF A
GRIC
ULTU
RAL P
LOTS
PER
HOU
SEHO
LD
2000
2001
2002
2003
2004
2005
2006
2007
2008
2009
2010
2011
2012
2013
Bur
undi
....
....
....
....
....
....
6.6
6
.2
Bur
kina
Fas
o8
.5
8.0
7
.8
7.7
7
.8
..7
.8
7.9
1
2.0
..
....
..
Gha
na2
.0
2.0
2
.0
2.0
2
.0
2.0
2
.0
2.0
2
.0
2.0
2
.0
2.0
2
.0
..
Mal
awi
2.3
2
.2
2.2
2
.1
2.1
2
.0
2.0
1
.9
1.9
1
.8
1.8
1
.7
1.7
..
Mal
i3
.6
3.4
3
.1
3.4
3
.3
2.9
4
.4
3.2
3
.2
4.5
3
.8
3.5
..
..
Nig
er..
....
....
3.3
3
.0
2.6
2
.8
2.1
2
.6
2.4
..
..
Uga
nda
....
....
..7
.2
....
..3
.8
..3
.8
3.4
..
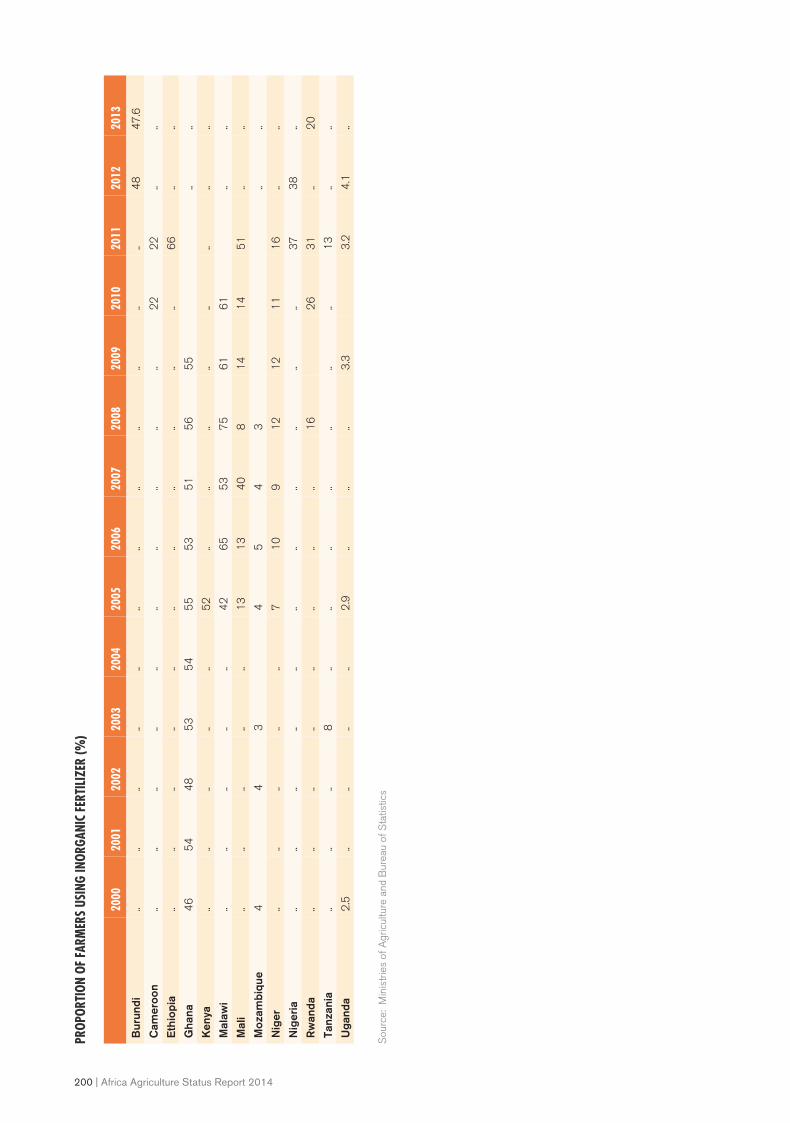
200 | Africa Agriculture Status Report 2014
Sou
rce:
Min
istr
ies
of A
gric
ultu
re a
nd B
urea
u of
Sta
tistic
s
PROP
ORTI
ON O
F FA
RMER
S US
ING
INOR
GANI
C FE
RTIL
IZER
(%)
2000
2001
2002
2003
2004
2005
2006
2007
2008
2009
2010
2011
2012
2013
Bur
undi
....
....
....
....
....
....
48
47
.6
Cam
eroo
n..
....
....
....
....
..2
22
2..
..
Eth
iopi
a..
....
....
....
....
....
66
....
Gha
na4
65
44
85
35
45
55
35
15
65
5..
..
Ken
ya..
....
....
52
....
....
....
....
Mal
awi
....
....
..4
26
55
37
56
16
1..
..
Mal
i..
....
....
13
13
40
81
41
45
1..
..
Moz
ambi
que
44
34
54
3..
..
Nig
er..
....
....
71
09
12
12
11
16
....
Nig
eria
....
....
....
....
....
..3
73
8..
Rw
anda
....
....
....
....
16
26
31
..2
0
Tanz
ania
....
..8
....
....
....
..1
3..
..
Uga
nda
2.5
....
....
2.9
....
..3
.33
.24
.1..

Africa Agriculture Status Report 2014 | 201
Clim
ate
Cha
nge
Dat
a (S
ourc
e: h
ttp:
//da
ta.w
orld
bank
.org
/dat
a-ca
talo
g/cl
imat
e-ch
ange
)
CLIM
ATE
DATA
CLIM
ATE
EXPO
SURE
TO
IMPA
CTS
RESI
LIEN
CE
Avera
ge an
nual
precip
itatio
n (1
961-1
990,
mm)
Projec
ted an
nual
tempe
rature
ch
ange
(204
5-206
5, Ce
lsius)
Projec
ted ch
ange
in an
nual
hot d
ays/
warm
nigh
tsPro
jected
chan
ge in
annu
al co
ol da
ys/c
old ni
ghts
Projec
ted an
nual
precip
itatio
n ch
ange
(204
5-206
5, m
m)La
nd ar
ea be
low 5m
(%
of lan
d area
)Po
pulat
ion be
low
5m (%
of to
tal)
Acce
ss to
impro
ved w
ater s
ource
(% of
total
pop.)
Disas
ter ris
k red
uctio
n prog
ress
score
(1-5
scale;
5=b
est)
2011
2011
2011
2011
2011
1990
- 20
0019
9020
0019
9019
9520
0020
0520
0820
11
Ang
ola
10
10
2.1
to 2
.77
.0 /
20
.2-2
.2 /
-2
.6-8
9 to
75
0.2
10
.21
2.0
62
.06
36
36
41
47
50
..
Bur
undi
12
18
2.1
to 2
.47
.8 /
26
.2-2
.1 /
-2
.8-2
1 to
20
60
.00
0.0
00
.00
0.0
07
07
17
27
27
23
.25
Ben
in1
03
92
.0 to
2.5
5.5
/ 1
9.2
-2.3
/ -
2.6
-20
7 to
97
1.1
61
.16
14
.07
14
.07
56
61
66
72
75
..
Bur
kina
Fas
o7
48
2.2
to 2
.85
.3 /
16
.6-2
.1 /
-2
.6-2
29
to 8
80
.00
0.0
00
.00
0.0
04
14
96
07
07
6..
Bot
swan
a4
16
2.5
to 3
.34
.7 /
12
.8-1
.8 /
-2
.1-1
06
to 2
40
.00
0.0
00
.00
0.0
09
39
49
49
59
53
Cen
tral
Afr
ican
Rep
ublic
13
43
2.1
to 2
.44
.7 /
22
.5-2
.3 /
-2
.4-7
3 to
10
00
.00
0.0
00
.00
0.0
05
86
06
36
56
7..
Cot
e d'
Ivoi
re1
34
81
.8 to
2.4
7.1
/ 2
2.9
-2.4
/ -
2.5
-12
5 to
73
0.1
90
.19
3.3
63
.25
76
77
78
79
80
2.5
Cam
eroo
n1
60
42
.1 to
2.4
6.2
/ 2
2.0
-2.4
/ -
2.4
-71
to 1
15
0.0
80
.08
0.3
50
.35
50
57
64
71
74
..
Con
go, R
ep.
16
46
2.0
to 2
.39
.1 /
26
.5-2
.3 /
-2
.7-4
0 to
13
40
.05
0.0
50
.97
0.9
7..
..7
07
17
1..
Eth
iopi
a8
48
2.1
to 2
.56
.6 /
21
.4-2
.0 /
-2
.7-4
2 to
79
0.6
70
.67
0.3
90
.39
17
22
28
35
38
..
Gab
on1
83
11
.8 to
2.2
13
.7 /
26
.9-2
.6 /
-2
.9-5
1 to
14
80
.54
0.5
45
.92
5.9
2..
84
85
86
87
..
Gha
na1
18
71
.8 to
2.4
6.6
/ 2
2.1
-2.4
/ -
2.5
-15
9 to
83
0.7
70
.77
2.3
22
.30
54
63
71
78
82
3.2
5
Gam
bia,
The
83
72
.1 to
2.7
6.7
/ 1
6.8
-2.3
/ -
2.6
-87
to 2
61
6.5
81
6.5
83
2.0
63
3.4
17
47
98
48
99
2..
Ken
ya6
92
1.9
to 2
.18
.1 /
25
.0-2
.0 /
-2
.90
to 1
44
0.2
40
.24
1.3
21
.35
43
48
52
56
59
4
Libe
ria
23
91
1.7
to 2
.21
0.2
/ 2
5.3
-2.7
/ -
2.7
-11
5 to
81
0.3
50
.35
3.3
53
.35
58
61
65
67
68
..
Leso
tho
78
92
.0 to
2.5
3.7
/ 1
0.1
-1.6
/ -
1.9
-66
to 8
90
.00
0.0
00
.00
0.0
06
16
47
48
38
52
.5
Mal
i2
82
2.5
to 3
.15
.5 /
12
.8-2
.0 /
-2
.5-1
42
to 4
30
.00
0.0
00
.00
0.0
02
93
64
45
15
6..
Moz
ambi
que
10
31
1.9
to 2
.45
.0 /
15
.0-2
.2 /
-2
.5-6
9 to
61
1.8
31
.83
6.4
66
.48
36
38
42
45
47
4
Mal
awi
11
81
2.0
to 2
.53
.6 /
15
.9-2
.1 /
-2
.5-5
3 to
91
0.0
00
.00
0.0
00
.00
40
51
63
74
80
1.7
5
Nam
ibia
28
52
.2 to
2.9
5.8
/ 1
3.1
-1.9
/ -
2.2
-67
to 2
30
.29
0.2
92
.31
2.9
06
47
38
18
89
2..
Nig
er1
51
2.4
to 2
.85
.4 /
12
.2-1
.8 /
-2
.4-7
1 to
36
0.0
00
.00
0.0
00
.00
35
39
42
45
48
..
Nig
eria
11
50
2.0
to 2
.55
.5 /
19
.0-2
.2 /
-2
.5-1
28
to 8
90
.54
0.5
43
.03
3.0
34
75
05
35
75
84
Rw
anda
12
12
2.1
to 2
.48
.3 /
26
.4-2
.2 /
-2
.8-1
2 to
21
10
.00
0.0
00
.00
0.0
06
86
76
76
66
5..
Sen
egal
68
72
.0 to
2.7
7.1
/ 1
6.9
-2.3
/ -
2.6
-12
4 to
37
4.4
64
.46
14
.38
14
.77
61
63
65
68
69
2.7
5
Sie
rra
Leon
e2
52
61
.8 to
2.3
9.2
/ 2
4.0
-2.7
/ -
2.6
-96
to 1
28
3.0
03
.00
4.8
75
.06
..5
75
55
14
93
Som
alia
28
21
.9 to
2.2
9.5
/ 2
1.2
-2.2
/ -
2.8
-4 to
11
10
.57
0.5
71
.77
2.1
5..
21
23
28
30
..
Togo
11
68
1.9
to 2
.56
.0 /
21
.5-2
.4 /
-2
.5-1
75
to 1
00
0.5
80
.58
6.1
26
.12
49
52
55
58
60
..
Tanz
ania
10
71
1.9
to 2
.26
.2 /
21
.6-2
.1 /
-2
.8-9
to 1
67
0.1
80
.18
1.2
81
.29
55
54
54
54
54
3.5
Uga
nda
11
80
2.1
to 2
.36
.4 /
25
.6-2
.1 /
-2
.8-1
3 to
22
40
.00
0.0
00
.00
0.0
04
35
05
76
46
7..
Sou
th A
fric
a4
95
1.9
to 2
.74
.1 /
10
.4-1
.7 /
-2
.0-7
8 to
33
0.1
30
.13
0.5
10
.50
83
84
86
89
91
..
Con
go, D
em. R
ep.
15
43
2.1
to 2
.46
.4 /
24
.7-2
.1 /
-2
.7-4
8 to
12
80
.02
0.0
20
.04
0.0
44
54
44
44
54
6..
Zam
bia
10
20
2.1
to 2
.74
.0 /
17
.7-2
.0 /
-2
.5-5
4 to
94
0.0
00
.00
0.0
00
.00
49
51
54
58
60
3.7
5
Zim
babw
e6
92
2.2
to 2
.93
.8 /
13
.2-1
.9 /
-2
.3-8
1 to
24
0.0
00
.00
0.0
00
.00
78
79
80
82
82
..

202 | Africa Agriculture Status Report 2014
Sou
rce:
WD
I dat
abas
e
CO2
EMIS
SION
S (M
ETRI
C TO
NS P
ER C
APIT
A)
2000
2001
2002
2003
2004
2005
2006
2007
2008
2009
2010
2011
Ang
ola
0.6
8
0.6
9
0.6
8
0.8
5
0.5
9
1.1
8
1.1
6
1.3
0
1.4
2
1.4
5
1.4
7
1.5
6
Ben
in 0
.23
0
.23
0
.24
0
.28
0
.30
0
.32
0
.29
0
.46
0
.52
0
.50
0
.51
0
.55
Bot
swan
a 2
.06
2
.44
2
.43
2
.48
2
.33
2
.36
2
.46
2
.45
2
.45
2
.58
2
.25
2
.66
Bur
kina
Fas
o 0
.08
0
.09
0
.08
0
.08
0
.09
0
.08
0
.08
0
.10
0
.12
0
.12
0
.11
0
.11
Bur
undi
0.0
4
0.0
5
0.0
3
0.0
3
0.0
2
0.0
3
0.0
2
0.0
2
0.0
2
0.0
3
0.0
2
0.0
3
Cen
tral
Afr
ica
Rep
ublic
0.0
7
0.0
7
0.0
7
0.0
7
0.0
6
0.0
5
0.0
5
0.0
6
0.0
6
0.0
6
0.0
6
0.0
6
Cam
eroo
n 0
.20
0
.22
0
.21
0
.20
0
.22
0
.22
0
.20
0
.21
0
.31
0
.28
0
.33
0
.35
Con
go, D
em. R
ep.
0.0
5
0.0
4
0.0
3
0.0
3
0.0
3
0.0
4
0.0
4
0.0
4
0.0
5
0.0
5
0.0
4
0.0
5
Con
go, R
ep.
0.2
7
0.3
4
0.2
7
0.2
2
0.3
2
0.3
4
0.4
1
0.3
7
0.3
8
0.3
8
0.4
7
0.4
9
Cot
e d'
Ivoi
re 0
.40
0
.42
0
.47
0
.44
0
.32
0
.45
0
.45
0
.40
0
.38
0
.38
0
.31
0
.31
Equ
ator
ial G
uine
a 0
.94
0
.88
5
.79
9
.03
1
0.5
8
8.9
0
7.8
1
7.6
5
7.5
0
6.8
4
6.8
3
6.7
2
Eth
iopi
a 0
.08
0
.09
0
.06
0
.06
0
.07
0
.07
0
.07
0
.07
0
.07
0
.08
0
.08
0
.07
Gab
on 1
.20
0
.86
1
.42
1
.38
1
.01
1
.31
1
.51
1
.40
1
.61
1
.06
0
.05
1
.65
Gam
bia,
The
0.2
2
0.2
2
0.2
2
0.2
4
0.2
3
0.2
3
0.2
2
0.2
3
0.2
6
0.2
6
0.2
7
0.2
8
Gha
na 0
.36
0
.33
0
.36
0
.38
0
.38
0
.35
0
.33
0
.42
0
.43
0
.37
0
.31
0
.37
Gui
nea
0.1
5
0.1
5
0.1
5
0.1
5
0.1
5
0.1
4
0.1
2
0.1
2
0.1
2
0.1
2
0.1
2
0.1
1
Ken
ya 0
.33
0
.33
0
.29
0
.24
0
.20
0
.22
0
.24
0
.26
0
.26
0
.26
0
.31
0
.30
Leso
tho
..
..
..
..
..
..
..
..
0.0
0
0.0
1
0.0
1
0.0
1
Libe
ria
0.1
5
0.1
5
0.1
7
0.1
6
0.1
7
0.2
0
0.2
3
0.2
2
0.1
9
0.1
6
0.1
4
0.2
0
Mal
awi
0.0
9
0.0
8
0.0
8
0.0
7
0.0
8
0.0
8
0.0
7
0.0
7
0.0
7
0.0
8
0.0
7
0.0
8
Mal
i 0
.05
0
.05
0
.05
0
.05
0
.05
0
.05
0
.05
0
.05
0
.05
0
.05
0
.05
0
.04
Moz
ambi
que
0.0
7
0.0
7
0.0
8
0.0
8
0.1
0
0.0
9
0.0
9
0.0
9
0.1
1
0.1
0
0.1
1
0.1
2
Nam
ibia
0.9
0
0.8
7
1.0
4
0.9
0
0.9
5
0.9
8
1.1
4
1.1
3
1.1
6
1.7
0
1.4
8
1.4
6
Nig
er 0
.10
0
.07
0
.07
0
.07
0
.07
0
.08
0
.06
0
.06
0
.06
0
.06
0
.07
0
.09
Nig
eria
0.3
7
0.6
4
0.6
6
0.7
6
0.7
0
0.7
1
0.7
5
0.6
9
0.6
5
0.6
1
0.4
6
0.4
9
Rw
anda
0.0
9
0.0
8
0.0
8
0.0
8
0.0
7
0.0
7
0.0
6
0.0
5
0.0
6
0.0
5
0.0
5
0.0
5
Sen
egal
0.3
8
0.4
0
0.4
3
0.4
4
0.4
7
0.4
8
0.5
2
0.4
1
0.4
5
0.4
4
0.4
6
0.5
5
Sie
rra
Leon
e 0
.07
0
.10
0
.13
0
.14
0
.14
0
.13
0
.11
0
.14
0
.12
0
.12
0
.12
0
.12
Sou
th A
fric
a 8
.64
8
.38
8
.08
7
.59
8
.21
9
.08
8
.31
8
.80
9
.07
9
.38
1
0.0
3
9.0
4
Tanz
ania
0.0
8
0.0
8
0.0
9
0.1
0
0.1
0
0.1
2
0.1
4
0.1
5
0.1
5
0.1
5
0.1
5
0.1
5
Uga
nda
0.0
6
0.0
6
0.0
6
0.0
6
0.0
6
0.0
7
0.0
8
0.0
9
0.1
0
0.1
0
0.1
0
0.1
1
Zam
bia
0.1
8
0.1
8
0.1
8
0.1
9
0.1
9
0.1
9
0.2
0
0.1
9
0.1
4
0.1
5
0.1
7
0.1
8
Zim
babw
e 1
.28
1
.11
1
.00
0
.94
0
.84
0
.78
0
.85
0
.81
0
.80
0
.64
0
.68
0
.72
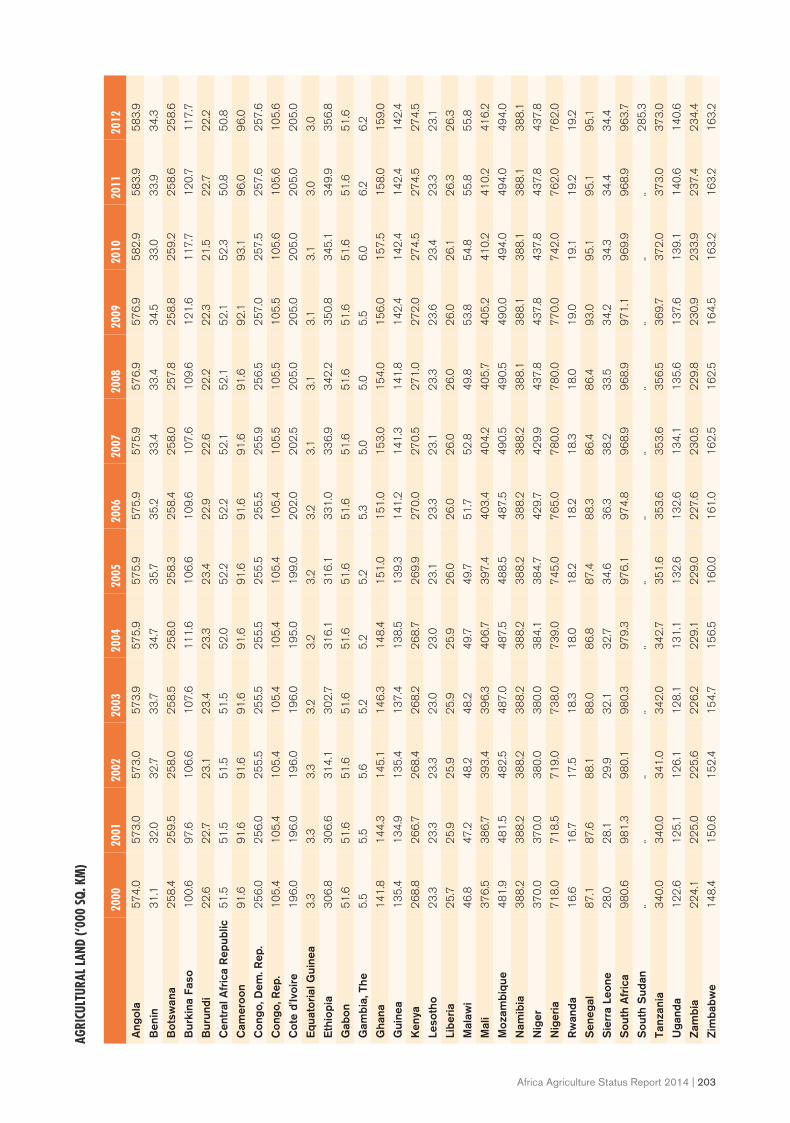
Africa Agriculture Status Report 2014 | 203
AGRI
CULT
URAL
LAND
(‘00
0 SQ
. KM
)
2000
2001
2002
2003
2004
2005
2006
2007
2008
2009
2010
2011
2012
Ang
ola
57
4.0
5
73
.0
57
3.0
5
73
.9
57
5.9
5
75
.9
57
5.9
5
75
.9
57
6.9
5
76
.9
58
2.9
5
83
.9
58
3.9
Ben
in 3
1.1
3
2.0
3
2.7
3
3.7
3
4.7
3
5.7
3
5.2
3
3.4
3
3.4
3
4.5
3
3.0
3
3.9
3
4.3
Bot
swan
a 2
58
.4
25
9.5
2
58
.0
25
8.5
2
58
.0
25
8.3
2
58
.4
25
8.0
2
57
.8
25
8.8
2
59
.2
25
8.6
2
58
.6
Bur
kina
Fas
o 1
00
.6
97
.6
10
6.6
1
07
.6
11
1.6
1
06
.6
10
9.6
1
07
.6
10
9.6
1
21
.6
11
7.7
1
20
.7
11
7.7
Bur
undi
22
.6
22
.7
23
.1
23
.4
23
.3
23
.4
22
.9
22
.6
22
.2
22
.3
21
.5
22
.7
22
.2
Cen
tral
Afr
ica
Rep
ublic
51
.5
51
.5
51
.5
51
.5
52
.0
52
.2
52
.2
52
.1
52
.1
52
.1
52
.3
50
.8
50
.8
Cam
eroo
n 9
1.6
9
1.6
9
1.6
9
1.6
9
1.6
9
1.6
9
1.6
9
1.6
9
1.6
9
2.1
9
3.1
9
6.0
9
6.0
Con
go, D
em. R
ep.
25
6.0
2
56
.0
25
5.5
2
55
.5
25
5.5
2
55
.5
25
5.5
2
55
.9
25
6.5
2
57
.0
25
7.5
2
57
.6
25
7.6
Con
go, R
ep.
10
5.4
1
05
.4
10
5.4
1
05
.4
10
5.4
1
05
.4
10
5.4
1
05
.5
10
5.5
1
05
.5
10
5.6
1
05
.6
10
5.6
Cot
e d'
Ivoi
re 1
96
.0
19
6.0
1
96
.0
19
6.0
1
95
.0
19
9.0
2
02
.0
20
2.5
2
05
.0
20
5.0
2
05
.0
20
5.0
2
05
.0
Equ
ator
ial G
uine
a 3
.3
3.3
3
.3
3.2
3
.2
3.2
3
.2
3.1
3
.1
3.1
3
.1
3.0
3
.0
Eth
iopi
a 3
06
.8
30
6.6
3
14
.1
30
2.7
3
16
.1
31
6.1
3
31
.0
33
6.9
3
42
.2
35
0.8
3
45
.1
34
9.9
3
56
.8
Gab
on 5
1.6
5
1.6
5
1.6
5
1.6
5
1.6
5
1.6
5
1.6
5
1.6
5
1.6
5
1.6
5
1.6
5
1.6
5
1.6
Gam
bia,
The
5.5
5
.5
5.6
5
.2
5.2
5
.2
5.3
5
.0
5.0
5
.5
6.0
6
.2
6.2
Gha
na 1
41
.8
14
4.3
1
45
.1
14
6.3
1
48
.4
15
1.0
1
51
.0
15
3.0
1
54
.0
15
6.0
1
57
.5
15
8.0
1
59
.0
Gui
nea
13
5.4
1
34
.9
13
5.4
1
37
.4
13
8.5
1
39
.3
14
1.2
1
41
.3
14
1.8
1
42
.4
14
2.4
1
42
.4
14
2.4
Ken
ya 2
68
.8
26
6.7
2
68
.4
26
8.2
2
68
.7
26
9.9
2
70
.0
27
0.5
2
71
.0
27
2.0
2
74
.5
27
4.5
2
74
.5
Leso
tho
23
.3
23
.3
23
.3
23
.0
23
.0
23
.1
23
.3
23
.1
23
.3
23
.6
23
.4
23
.3
23
.1
Libe
ria
25
.7
25
.9
25
.9
25
.9
25
.9
26
.0
26
.0
26
.0
26
.0
26
.0
26
.1
26
.3
26
.3
Mal
awi
46
.8
47
.2
48
.2
48
.2
49
.7
49
.7
51
.7
52
.8
49
.8
53
.8
54
.8
55
.8
55
.8
Mal
i 3
76
.5
38
6.7
3
93
.4
39
6.3
4
06
.7
39
7.4
4
03
.4
40
4.2
4
05
.7
40
5.2
4
10
.2
41
0.2
4
16
.2
Moz
ambi
que
48
1.9
4
81
.5
48
2.5
4
87
.0
48
7.5
4
88
.5
48
7.5
4
90
.5
49
0.5
4
90
.0
49
4.0
4
94
.0
49
4.0
Nam
ibia
38
8.2
3
88
.2
38
8.2
3
88
.2
38
8.2
3
88
.2
38
8.2
3
88
.2
38
8.1
3
88
.1
38
8.1
3
88
.1
38
8.1
Nig
er 3
70
.0
37
0.0
3
80
.0
38
0.0
3
84
.1
38
4.7
4
29
.7
42
9.9
4
37
.8
43
7.8
4
37
.8
43
7.8
4
37
.8
Nig
eria
71
8.0
7
18
.5
71
9.0
7
38
.0
73
9.0
7
45
.0
76
5.0
7
80
.0
78
0.0
7
70
.0
74
2.0
7
62
.0
76
2.0
Rw
anda
16
.6
16
.7
17
.5
18
.3
18
.0
18
.2
18
.2
18
.3
18
.0
19
.0
19
.1
19
.2
19
.2
Sen
egal
87
.1
87
.6
88
.1
88
.0
86
.8
87
.4
88
.3
86
.4
86
.4
93
.0
95
.1
95
.1
95
.1
Sie
rra
Leon
e 2
8.0
2
8.1
2
9.9
3
2.1
3
2.7
3
4.6
3
6.3
3
8.2
3
3.5
3
4.2
3
4.3
3
4.4
3
4.4
Sou
th A
fric
a 9
80
.6
98
1.3
9
80
.1
98
0.3
9
79
.3
97
6.1
9
74
.8
96
8.9
9
68
.9
97
1.1
9
69
.9
96
8.9
9
63
.7
Sou
th S
udan
..
..
..
..
..
..
..
..
..
..
..
..
28
5.3
Tanz
ania
34
0.0
3
40
.0
34
1.0
3
42
.0
34
2.7
3
51
.6
35
3.6
3
53
.6
35
6.5
3
69
.7
37
2.0
3
73
.0
37
3.0
Uga
nda
12
2.6
1
25
.1
12
6.1
1
28
.1
13
1.1
1
32
.6
13
2.6
1
34
.1
13
5.6
1
37
.6
13
9.1
1
40
.6
14
0.6
Zam
bia
22
4.1
2
25
.0
22
5.6
2
26
.2
22
9.1
2
29
.0
22
7.6
2
30
.5
22
9.8
2
30
.9
23
3.9
2
37
.4
23
4.4
Zim
babw
e 1
48
.4
15
0.6
1
52
.4
15
4.7
1
56
.5
16
0.0
1
61
.0
16
2.5
1
62
.5
16
4.5
1
63
.2
16
3.2
1
63
.2

204 | Africa Agriculture Status Report 2014
CERE
AL C
ROPL
AND
(% O
F LA
ND A
REA)
2000
2001
2002
2003
2004
2005
2006
2007
2008
2009
2010
2011
Ang
ola
0.7
0.8
0.9
0.9
1.2
1.2
1.2
1.2
0.8
1.4
1.4
1.6
Ben
in8
.07
.88
.78
.18
.69
.07
.48
.99
.79
.49
.39
.3B
otsw
ana
0.3
0.1
0.2
0.1
0.2
0.1
0.2
0.1
0.2
0.3
0.2
0.3
Bur
kina
Fas
o9
.71
1.7
12
.11
3.1
11
.31
1.8
11
.21
2.1
15
.31
3.2
15
.71
3.5
Bur
undi
7.7
8.1
8.2
8.2
8.1
8.1
8.6
8.3
8.6
8.8
9.2
9.7
Cam
eroo
n1
.51
.71
.92
.12
.32
.42
.63
.03
.13
.53
.63
.8C
entr
al A
fric
an R
epub
lic0
.30
.30
.30
.30
.30
.40
.40
.40
.40
.40
.30
.3C
had
1.4
1.7
1.4
1.6
1.4
1.9
2.0
2.1
2.0
2.0
2.0
2.0
Com
oros
9.6
9.6
10
.51
1.0
11
.19
.21
0.2
8.5
10
.21
0.5
11
.61
2.7
Con
go, D
em. R
ep.
0.9
0.9
0.9
0.9
0.9
0.9
0.9
0.9
0.9
0.9
0.9
1.0
Con
go, R
ep.
0.0
0.1
0.1
0.1
0.1
0.1
0.1
0.1
0.1
0.1
0.1
0.1
Cot
e d'
Ivoi
re2
.42
.42
.42
.32
.32
.42
.42
.52
.62
.62
.72
.7E
thio
pia
7.2
8.0
6.7
8.5
9.1
9.8
8.1
8.5
9.2
8.8
9.2
10
.1G
abon
0.1
0.1
0.1
0.1
0.1
0.1
0.1
0.1
0.1
0.1
0.1
0.1
Gam
bia,
The
13
.41
5.4
14
.31
6.9
18
.91
9.5
20
.71
8.6
23
.82
9.3
31
.92
0.8
Gha
na5
.76
.07
.06
.45
.96
.06
.35
.66
.36
.97
.07
.2G
uine
a4
.94
.75
.15
.45
.86
.26
.67
.07
.78
.18
.38
.2G
uine
a-B
issa
u5
.85
.75
.04
.64
.84
.94
.84
.95
.25
.06
.06
.3K
enya
3.3
3.6
3.6
3.7
3.1
3.8
4.2
3.6
3.6
4.1
4.5
4.7
Leso
tho
6.9
8.4
6.7
6.3
6.0
5.3
7.5
5.5
6.3
5.9
6.3
5.2
Libe
ria
1.5
1.3
1.2
1.2
1.2
1.2
1.3
1.7
2.0
2.6
2.6
2.6
Mad
agas
car
2.4
2.4
2.4
2.4
2.5
2.6
2.8
2.8
3.1
3.5
3.6
3.8
Mal
awi
16
.71
6.8
17
.41
8.8
17
.91
7.8
20
.51
4.8
18
.91
9.0
20
.11
9.9
Mal
i1
.92
.12
.62
.82
.72
.62
.72
.92
.83
.33
.34
.8N
amib
ia0
.40
.30
.30
.40
.40
.30
.40
.30
.30
.40
.40
.3N
iger
5.8
6.2
6.2
6.4
6.2
6.6
7.1
7.2
7.8
7.2
8.4
7.9
Nig
eria
20
.01
7.9
18
.71
9.1
19
.52
0.1
21
.02
1.3
20
.81
5.2
17
.71
8.2
Rw
anda
11
.51
2.7
12
.21
2.8
13
.51
4.2
13
.31
4.2
14
.81
4.4
15
.71
7.8
Sen
egal
6.1
6.0
6.3
6.9
5.6
6.2
5.8
5.6
7.7
8.6
7.7
5.9
Sie
rra
Leon
e2
.94
.76
.56
.88
.51
0.3
12
.07
.17
.98
.39
.11
0.0
Som
alia
0.9
0.8
0.9
0.9
1.2
1.2
1.1
0.7
0.9
0.9
0.9
0.9
Sou
th A
fric
a4
.33
.63
.93
.83
.63
.52
.52
.83
.12
.72
.92
.6S
udan
2.7
3.6
3.2
4.2
2.3
5.2
3.8
3.9
3.9
4.0
3.3
..Ta
nzan
ia2
.82
.53
.85
.45
.55
.54
.84
.96
.55
.95
.96
.5To
go1
2.9
13
.01
3.0
12
.91
3.4
13
.51
4.4
14
.41
5.0
15
.71
6.2
15
.9U
gand
a6
.97
.07
.27
.57
.88
.08
.48
.68
.99
.29
.81
0.1
Zam
bia
1.0
0.9
0.7
1.1
1.0
0.8
1.2
0.9
0.9
1.4
1.6
1.6
Zim
babw
e4
.64
.14
.34
.35
.25
.55
.95
.05
.85
.44
.95
.0

Africa Agriculture Status Report 2014 | 205
CERE
AL C
ROPL
AND
(% O
F LA
ND A
REA)
2000
2001
2002
2003
2004
2005
2006
2007
2008
2009
2010
2011
Ang
ola
0.7
0.8
0.9
0.9
1.2
1.2
1.2
1.2
0.8
1.4
1.4
1.6
Ben
in8
.07
.88
.78
.18
.69
.07
.48
.99
.79
.49
.39
.3B
otsw
ana
0.3
0.1
0.2
0.1
0.2
0.1
0.2
0.1
0.2
0.3
0.2
0.3
Bur
kina
Fas
o9
.71
1.7
12
.11
3.1
11
.31
1.8
11
.21
2.1
15
.31
3.2
15
.71
3.5
Bur
undi
7.7
8.1
8.2
8.2
8.1
8.1
8.6
8.3
8.6
8.8
9.2
9.7
Cam
eroo
n1
.51
.71
.92
.12
.32
.42
.63
.03
.13
.53
.63
.8C
entr
al A
fric
an R
epub
lic0
.30
.30
.30
.30
.30
.40
.40
.40
.40
.40
.30
.3C
had
1.4
1.7
1.4
1.6
1.4
1.9
2.0
2.1
2.0
2.0
2.0
2.0
Com
oros
9.6
9.6
10
.51
1.0
11
.19
.21
0.2
8.5
10
.21
0.5
11
.61
2.7
Con
go, D
em. R
ep.
0.9
0.9
0.9
0.9
0.9
0.9
0.9
0.9
0.9
0.9
0.9
1.0
Con
go, R
ep.
0.0
0.1
0.1
0.1
0.1
0.1
0.1
0.1
0.1
0.1
0.1
0.1
Cot
e d'
Ivoi
re2
.42
.42
.42
.32
.32
.42
.42
.52
.62
.62
.72
.7E
thio
pia
7.2
8.0
6.7
8.5
9.1
9.8
8.1
8.5
9.2
8.8
9.2
10
.1G
abon
0.1
0.1
0.1
0.1
0.1
0.1
0.1
0.1
0.1
0.1
0.1
0.1
Gam
bia,
The
13
.41
5.4
14
.31
6.9
18
.91
9.5
20
.71
8.6
23
.82
9.3
31
.92
0.8
Gha
na5
.76
.07
.06
.45
.96
.06
.35
.66
.36
.97
.07
.2G
uine
a4
.94
.75
.15
.45
.86
.26
.67
.07
.78
.18
.38
.2G
uine
a-B
issa
u5
.85
.75
.04
.64
.84
.94
.84
.95
.25
.06
.06
.3K
enya
3.3
3.6
3.6
3.7
3.1
3.8
4.2
3.6
3.6
4.1
4.5
4.7
Leso
tho
6.9
8.4
6.7
6.3
6.0
5.3
7.5
5.5
6.3
5.9
6.3
5.2
Libe
ria
1.5
1.3
1.2
1.2
1.2
1.2
1.3
1.7
2.0
2.6
2.6
2.6
Mad
agas
car
2.4
2.4
2.4
2.4
2.5
2.6
2.8
2.8
3.1
3.5
3.6
3.8
Mal
awi
16
.71
6.8
17
.41
8.8
17
.91
7.8
20
.51
4.8
18
.91
9.0
20
.11
9.9
Mal
i1
.92
.12
.62
.82
.72
.62
.72
.92
.83
.33
.34
.8N
amib
ia0
.40
.30
.30
.40
.40
.30
.40
.30
.30
.40
.40
.3N
iger
5.8
6.2
6.2
6.4
6.2
6.6
7.1
7.2
7.8
7.2
8.4
7.9
Nig
eria
20
.01
7.9
18
.71
9.1
19
.52
0.1
21
.02
1.3
20
.81
5.2
17
.71
8.2
Rw
anda
11
.51
2.7
12
.21
2.8
13
.51
4.2
13
.31
4.2
14
.81
4.4
15
.71
7.8
Sen
egal
6.1
6.0
6.3
6.9
5.6
6.2
5.8
5.6
7.7
8.6
7.7
5.9
Sie
rra
Leon
e2
.94
.76
.56
.88
.51
0.3
12
.07
.17
.98
.39
.11
0.0
Som
alia
0.9
0.8
0.9
0.9
1.2
1.2
1.1
0.7
0.9
0.9
0.9
0.9
Sou
th A
fric
a4
.33
.63
.93
.83
.63
.52
.52
.83
.12
.72
.92
.6S
udan
2.7
3.6
3.2
4.2
2.3
5.2
3.8
3.9
3.9
4.0
3.3
..Ta
nzan
ia2
.82
.53
.85
.45
.55
.54
.84
.96
.55
.95
.96
.5To
go1
2.9
13
.01
3.0
12
.91
3.4
13
.51
4.4
14
.41
5.0
15
.71
6.2
15
.9U
gand
a6
.97
.07
.27
.57
.88
.08
.48
.68
.99
.29
.81
0.1
Zam
bia
1.0
0.9
0.7
1.1
1.0
0.8
1.2
0.9
0.9
1.4
1.6
1.6
Zim
babw
e4
.64
.14
.34
.35
.25
.55
.95
.05
.85
.44
.95
.0
ARAB
LE LA
ND (%
OF
LAND
ARE
A)
2000
2001
2002
2003
2004
2005
2006
2007
2008
2009
2010
2011
2012
Ang
ola
2.4
2
.4
2.4
2
.5
2.6
2
.6
2.6
2
.6
2.7
2
.7
3.2
3
.3
3.3
Ben
in 2
0.4
2
1.1
2
1.7
2
2.6
2
3.5
2
4.4
2
3.9
2
2.2
2
2.2
2
3.1
2
1.7
2
2.5
2
2.9
Bot
swan
a 0
.4
0.6
0
.4
0.4
0
.3
0.4
0
.4
0.4
0
.3
0.5
0
.6
0.5
0
.5
Bur
kina
Fas
o 1
4.6
1
3.5
1
6.8
1
7.2
1
8.6
1
6.8
1
7.9
1
7.2
1
7.9
2
2.3
2
0.8
2
1.9
2
0.8
Bur
undi
37
.4
37
.4
38
.0
38
.4
38
.6
38
.4
37
.2
37
.0
36
.2
36
.6
37
.8
35
.8
35
.8
Cen
tral
Afr
ica
Rep
ublic
3.1
3
.1
3.1
3
.1
3.1
3
.1
3.1
3
.1
3.1
3
.1
3.1
2
.9
2.9
Cam
eroo
n 1
2.6
1
2.6
1
2.6
1
2.6
1
2.6
1
2.6
1
2.6
1
2.6
1
2.6
1
2.6
1
2.6
1
3.1
1
3.1
Con
go, D
em. R
ep.
3.0
3
.0
3.0
3
.0
3.0
3
.0
3.0
3
.0
3.0
3
.0
3.0
3
.0
3.0
Con
go, R
ep.
1.4
1
.4
1.4
1
.4
1.4
1
.4
1.4
1
.4
1.4
1
.4
1.5
1
.5
1.5
Cot
e d'
Ivoi
re 8
.8
8.8
8
.8
8.8
8
.5
8.8
8
.8
8.8
9
.1
9.1
9
.1
9.1
9
.1
Equ
ator
ial G
uine
a 4
.6
4.6
4
.6
4.6
4
.6
4.6
4
.6
4.6
4
.6
4.7
4
.7
4.6
4
.6
Eth
iopi
a 1
0.0
1
0.0
1
0.7
9
.6
10
.9
10
.9
12
.4
12
.9
13
.4
14
.0
13
.6
13
.9
14
.6
Gab
on 1
.3
1.3
1
.3
1.3
1
.3
1.3
1
.3
1.3
1
.3
1.3
1
.3
1.3
1
.3
Gam
bia,
The
23
.7
27
.7
31
.6
27
.7
30
.6
31
.1
32
.6
29
.0
29
.9
36
.8
42
.3
44
.5
44
.5
Gha
na 1
6.9
1
7.4
1
7.8
1
8.4
1
8.4
1
7.6
1
7.6
1
8.5
1
8.9
1
9.8
2
0.4
2
0.7
2
1.1
Gui
nea
9.0
8
.7
9.0
9
.7
10
.1
10
.4
11
.2
11
.2
11
.4
11
.6
11
.6
11
.6
11
.6
Ken
ya 9
.0
8.6
9
.0
8.9
9
.0
9.2
9
.2
9.3
9
.3
9.3
9
.7
9.7
9
.7
Leso
tho
10
.7
10
.9
10
.9
9.9
9
.9
10
.2
10
.6
10
.0
10
.7
11
.8
11
.0
10
.6
10
.1
Libe
ria
3.9
3
.9
3.9
3
.9
3.9
3
.9
3.9
4
.0
4.0
4
.2
4.5
4
.7
4.7
Mal
awi
28
.6
29
.2
30
.2
30
.2
31
.8
31
.8
33
.9
35
.0
31
.8
36
.1
37
.1
38
.2
38
.2
Mal
i 3
.7
3.8
3
.8
4.0
4
.9
4.1
4
.6
4.7
4
.8
4.7
5
.1
5.1
5
.6
Moz
ambi
que
5.0
5
.0
5.1
5
.7
5.7
5
.8
5.7
6
.1
6.1
6
.1
6.6
6
.6
6.6
Nam
ibia
1.0
1
.0
1.0
1
.0
1.0
1
.0
1.0
1
.0
1.0
1
.0
1.0
1
.0
1.0
Nig
er 1
1.0
1
1.0
1
1.0
1
1.0
1
1.1
1
1.2
1
1.2
1
1.2
1
1.8
1
1.8
1
1.8
1
1.8
1
1.8
Nig
eria
32
.9
32
.9
32
.9
35
.1
35
.1
36
.2
38
.4
40
.6
41
.2
40
.6
37
.3
39
.5
39
.5
Rw
anda
35
.1
36
.5
40
.5
45
.2
44
.3
45
.4
45
.2
45
.7
44
.6
48
.7
49
.0
49
.5
49
.5
Sen
egal
15
.6
15
.8
16
.2
16
.1
15
.5
15
.8
16
.5
15
.5
15
.5
19
.0
20
.0
20
.0
20
.0
Sie
rra
Leon
e 6
.8
6.8
9
.4
12
.4
13
.1
15
.7
18
.1
20
.8
14
.1
15
.1
15
.2
15
.4
15
.4
Sou
th A
fric
a 1
1.3
1
1.4
1
1.3
1
1.3
1
1.2
1
1.0
1
0.9
1
0.4
1
0.4
1
0.6
1
0.4
1
0.3
9
.9
Tanz
ania
9.8
9
.7
9.6
9
.7
9.6
1
0.7
1
1.0
1
1.0
1
1.3
1
2.8
1
3.0
1
3.1
1
3.1
Uga
nda
25
.5
26
.5
27
.0
28
.0
29
.3
29
.8
29
.8
30
.5
31
.3
32
.3
33
.0
33
.8
33
.8
Zam
bia
3.9
3
.8
3.7
3
.5
3.9
3
.8
3.7
4
.1
4.0
4
.1
4.5
5
.0
4.6
Zim
babw
e 9
.1
9.3
9
.3
9.4
9
.4
9.8
1
0.0
1
0.4
1
0.4
1
0.9
1
0.6
1
0.6
1
0.6
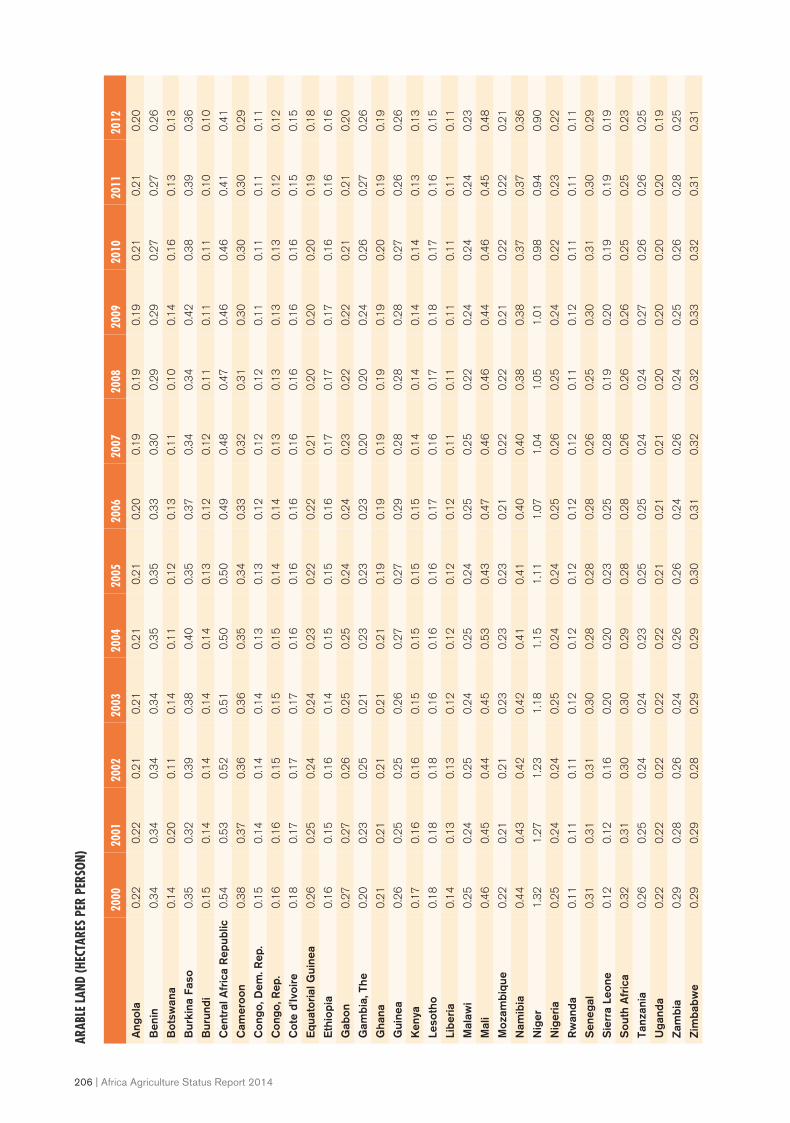
206 | Africa Agriculture Status Report 2014
ARAB
LE LA
ND (H
ECTA
RES
PER
PERS
ON)
2000
2001
2002
2003
2004
2005
2006
2007
2008
2009
2010
2011
2012
Ang
ola
0.2
2
0.2
2
0.2
1
0.2
1
0.2
1
0.2
1
0.2
0
0.1
9
0.1
9
0.1
9
0.2
1
0.2
1
0.2
0
Ben
in 0
.34
0
.34
0
.34
0
.34
0
.35
0
.35
0
.33
0
.30
0
.29
0
.29
0
.27
0
.27
0
.26
Bot
swan
a 0
.14
0
.20
0
.11
0
.14
0
.11
0
.12
0
.13
0
.11
0
.10
0
.14
0
.16
0
.13
0
.13
Bur
kina
Fas
o 0
.35
0
.32
0
.39
0
.38
0
.40
0
.35
0
.37
0
.34
0
.34
0
.42
0
.38
0
.39
0
.36
Bur
undi
0.1
5
0.1
4
0.1
4
0.1
4
0.1
4
0.1
3
0.1
2
0.1
2
0.1
1
0.1
1
0.1
1
0.1
0
0.1
0
Cen
tral
Afr
ica
Rep
ublic
0.5
4
0.5
3
0.5
2
0.5
1
0.5
0
0.5
0
0.4
9
0.4
8
0.4
7
0.4
6
0.4
6
0.4
1
0.4
1
Cam
eroo
n 0
.38
0
.37
0
.36
0
.36
0
.35
0
.34
0
.33
0
.32
0
.31
0
.30
0
.30
0
.30
0
.29
Con
go, D
em. R
ep.
0.1
5
0.1
4
0.1
4
0.1
4
0.1
3
0.1
3
0.1
2
0.1
2
0.1
2
0.1
1
0.1
1
0.1
1
0.1
1
Con
go, R
ep.
0.1
6
0.1
6
0.1
5
0.1
5
0.1
5
0.1
4
0.1
4
0.1
3
0.1
3
0.1
3
0.1
3
0.1
2
0.1
2
Cot
e d'
Ivoi
re 0
.18
0
.17
0
.17
0
.17
0
.16
0
.16
0
.16
0
.16
0
.16
0
.16
0
.16
0
.15
0
.15
Equ
ator
ial G
uine
a 0
.26
0
.25
0
.24
0
.24
0
.23
0
.22
0
.22
0
.21
0
.20
0
.20
0
.20
0
.19
0
.18
Eth
iopi
a 0
.16
0
.15
0
.16
0
.14
0
.15
0
.15
0
.16
0
.17
0
.17
0
.17
0
.16
0
.16
0
.16
Gab
on 0
.27
0
.27
0
.26
0
.25
0
.25
0
.24
0
.24
0
.23
0
.22
0
.22
0
.21
0
.21
0
.20
Gam
bia,
The
0.2
0
0.2
3
0.2
5
0.2
1
0.2
3
0.2
3
0.2
3
0.2
0
0.2
0
0.2
4
0.2
6
0.2
7
0.2
6
Gha
na 0
.21
0
.21
0
.21
0
.21
0
.21
0
.19
0
.19
0
.19
0
.19
0
.19
0
.20
0
.19
0
.19
Gui
nea
0.2
6
0.2
5
0.2
5
0.2
6
0.2
7
0.2
7
0.2
9
0.2
8
0.2
8
0.2
8
0.2
7
0.2
6
0.2
6
Ken
ya 0
.17
0
.16
0
.16
0
.15
0
.15
0
.15
0
.15
0
.14
0
.14
0
.14
0
.14
0
.13
0
.13
Leso
tho
0.1
8
0.1
8
0.1
8
0.1
6
0.1
6
0.1
6
0.1
7
0.1
6
0.1
7
0.1
8
0.1
7
0.1
6
0.1
5
Libe
ria
0.1
4
0.1
3
0.1
3
0.1
2
0.1
2
0.1
2
0.1
2
0.1
1
0.1
1
0.1
1
0.1
1
0.1
1
0.1
1
Mal
awi
0.2
5
0.2
4
0.2
5
0.2
4
0.2
5
0.2
4
0.2
5
0.2
5
0.2
2
0.2
4
0.2
4
0.2
4
0.2
3
Mal
i 0
.46
0
.45
0
.44
0
.45
0
.53
0
.43
0
.47
0
.46
0
.46
0
.44
0
.46
0
.45
0
.48
Moz
ambi
que
0.2
2
0.2
1
0.2
1
0.2
3
0.2
3
0.2
3
0.2
1
0.2
2
0.2
2
0.2
1
0.2
2
0.2
2
0.2
1
Nam
ibia
0.4
4
0.4
3
0.4
2
0.4
2
0.4
1
0.4
1
0.4
0
0.4
0
0.3
8
0.3
8
0.3
7
0.3
7
0.3
6
Nig
er 1
.32
1
.27
1
.23
1
.18
1
.15
1
.11
1
.07
1
.04
1
.05
1
.01
0
.98
0
.94
0
.90
Nig
eria
0.2
5
0.2
4
0.2
4
0.2
5
0.2
4
0.2
4
0.2
5
0.2
6
0.2
5
0.2
4
0.2
2
0.2
3
0.2
2
Rw
anda
0.1
1
0.1
1
0.1
1
0.1
2
0.1
2
0.1
2
0.1
2
0.1
2
0.1
1
0.1
2
0.1
1
0.1
1
0.1
1
Sen
egal
0.3
1
0.3
1
0.3
1
0.3
0
0.2
8
0.2
8
0.2
8
0.2
6
0.2
5
0.3
0
0.3
1
0.3
0
0.2
9
Sie
rra
Leon
e 0
.12
0
.12
0
.16
0
.20
0
.20
0
.23
0
.25
0
.28
0
.19
0
.20
0
.19
0
.19
0
.19
Sou
th A
fric
a 0
.32
0
.31
0
.30
0
.30
0
.29
0
.28
0
.28
0
.26
0
.26
0
.26
0
.25
0
.25
0
.23
Tanz
ania
0.2
6
0.2
5
0.2
4
0.2
4
0.2
3
0.2
5
0.2
5
0.2
4
0.2
4
0.2
7
0.2
6
0.2
6
0.2
5
Uga
nda
0.2
2
0.2
2
0.2
2
0.2
2
0.2
2
0.2
1
0.2
1
0.2
1
0.2
0
0.2
0
0.2
0
0.2
0
0.1
9
Zam
bia
0.2
9
0.2
8
0.2
6
0.2
4
0.2
6
0.2
6
0.2
4
0.2
6
0.2
4
0.2
5
0.2
6
0.2
8
0.2
5
Zim
babw
e 0
.29
0
.29
0
.28
0
.29
0
.29
0
.30
0
.31
0
.32
0
.32
0
.33
0
.32
0
.31
0
.31
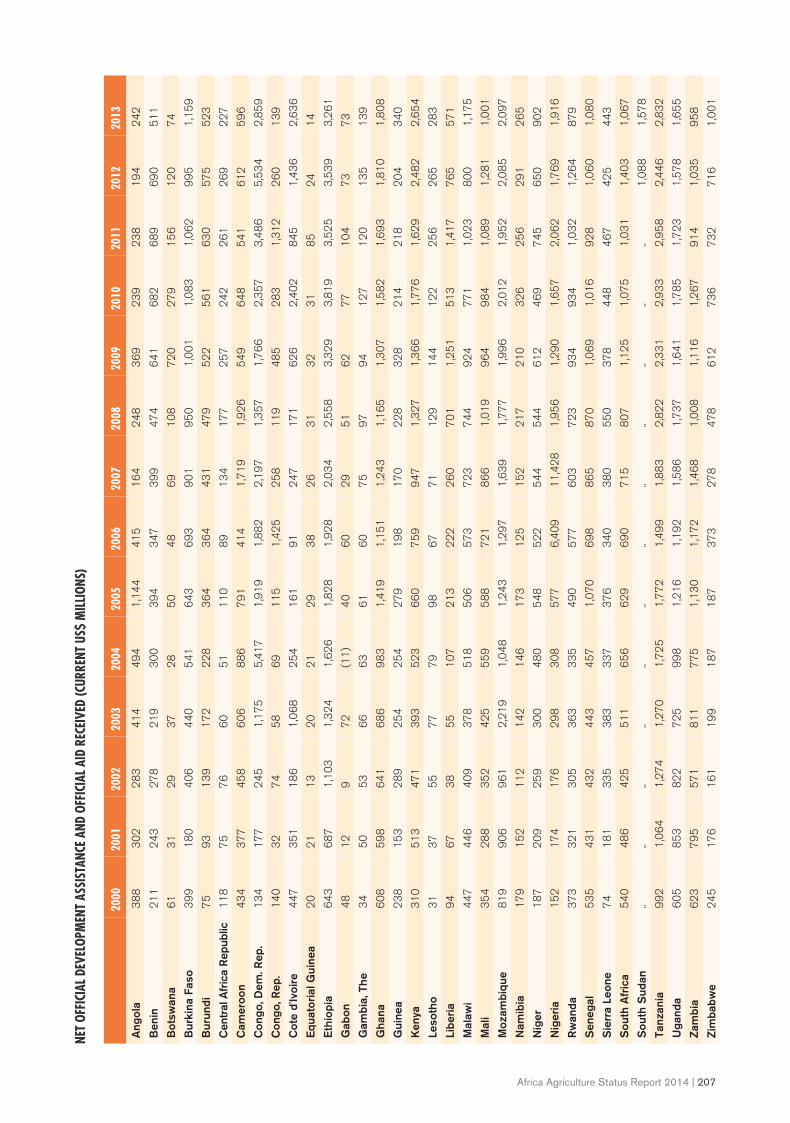
Africa Agriculture Status Report 2014 | 207
NET
OFFI
CIAL
DEV
ELOP
MEN
T AS
SIST
ANCE
AND
OFF
ICIA
L AID
REC
EIVE
D (C
URRE
NT U
S$ M
ILLI
ONS)
2000
2001
2002
2003
2004
2005
2006
2007
2008
2009
2010
2011
2012
2013
Ang
ola
38
8
30
2
28
3
41
4
49
4
1,1
44
4
15
1
64
2
48
3
69
2
39
2
38
1
94
2
42
Ben
in 2
11
2
43
2
78
2
19
3
00
3
94
3
47
3
99
4
74
6
41
6
82
6
89
6
90
5
11
Bot
swan
a 6
1
31
2
9
37
2
8
50
4
8
69
1
08
7
20
2
79
1
56
1
20
7
4
Bur
kina
Fas
o 3
99
1
80
4
06
4
40
5
41
6
43
6
93
9
01
9
50
1
,00
1
1,0
83
1
,06
2
99
5
1,1
59
Bur
undi
75
9
3
13
9
17
2
22
8
36
4
36
4
43
1
47
9
52
2
56
1
63
0
57
5
52
3
Cen
tral
Afr
ica
Rep
ublic
11
8
75
7
6
60
5
1
11
0
89
1
34
1
77
2
57
2
42
2
61
2
69
2
27
Cam
eroo
n 4
34
3
77
4
58
6
06
8
86
7
91
4
14
1
,71
9
1,9
26
5
49
6
48
5
41
6
12
5
96
Con
go, D
em. R
ep.
13
4
17
7
24
5
1,1
75
5
,41
7
1,9
19
1
,88
2
2,1
97
1
,35
7
1,7
66
2
,35
7
3,4
86
5
,53
4
2,8
59
Con
go, R
ep.
14
0
32
7
4
58
6
9
11
5
1,4
25
2
58
1
19
4
85
2
83
1
,31
2
26
0
13
9
Cot
e d'
Ivoi
re 4
47
3
51
1
86
1
,06
8
25
4
16
1
91
2
47
1
71
6
26
2
,40
2
84
5
1,4
36
2
,63
6
Equ
ator
ial G
uine
a 2
0
21
1
3
20
2
1
29
3
8
26
3
1
32
3
1
85
2
4
14
Eth
iopi
a 6
43
6
87
1
,10
3
1,3
24
1
,62
6
1,8
28
1
,92
8
2,0
34
2
,55
8
3,3
29
3
,81
9
3,5
25
3
,53
9
3,2
61
Gab
on 4
8
12
9
7
2
(11
) 4
0
60
2
9
51
6
2
77
1
04
7
3
73
Gam
bia,
The
34
5
0
53
6
6
63
6
1
60
7
5
97
9
4
12
7
12
0
13
5
13
9
Gha
na 6
08
5
98
6
41
6
86
9
83
1
,41
9
1,1
51
1
,24
3
1,1
65
1
,30
7
1,5
82
1
,69
3
1,8
10
1
,80
8
Gui
nea
23
8
15
3
28
9
25
4
25
4
27
9
19
8
17
0
22
8
32
8
21
4
21
8
20
4
34
0
Ken
ya 3
10
5
13
4
71
3
93
5
23
6
60
7
59
9
47
1
,32
7
1,3
66
1
,77
6
1,6
29
2
,48
2
2,6
54
Leso
tho
31
3
7
55
7
7
79
9
8
67
7
1
12
9
14
4
12
2
25
6
26
5
28
3
Libe
ria
94
6
7
38
5
5
10
7
21
3
22
2
26
0
70
1
1,2
51
5
13
1
,41
7
76
5
57
1
Mal
awi
44
7
44
6
40
9
37
8
51
8
50
6
57
3
72
3
74
4
92
4
77
1
1,0
23
8
00
1
,17
5
Mal
i 3
54
2
88
3
52
4
25
5
59
5
88
7
21
8
66
1
,01
9
96
4
98
4
1,0
89
1
,28
1
1,0
01
Moz
ambi
que
81
9
90
6
96
1
2,2
19
1
,04
8
1,2
43
1
,29
7
1,6
39
1
,77
7
1,9
96
2
,01
2
1,9
52
2
,08
5
2,0
97
Nam
ibia
17
9
15
2
11
2
14
2
14
6
17
3
12
5
15
2
21
7
21
0
32
6
25
6
29
1
26
5
Nig
er 1
87
2
09
2
59
3
00
4
80
5
48
5
22
5
44
5
44
6
12
4
69
7
45
6
50
9
02
Nig
eria
15
2
17
4
17
6
29
8
30
8
57
7
6,4
09
1
1,4
28
1
,95
6
1,2
90
1
,65
7
2,0
62
1
,76
9
1,9
16
Rw
anda
37
3
32
1
30
5
36
3
33
5
49
0
57
7
60
3
72
3
93
4
93
4
1,0
32
1
,26
4
87
9
Sen
egal
53
5
43
1
43
2
44
3
45
7
1,0
70
6
98
8
65
8
70
1
,06
9
1,0
16
9
28
1
,06
0
1,0
80
Sie
rra
Leon
e 7
4
18
1
33
5
38
3
33
7
37
6
34
0
38
0
55
0
37
8
44
8
46
7
42
5
44
3
Sou
th A
fric
a 5
40
4
86
4
25
5
11
6
56
6
29
6
90
7
15
8
07
1
,12
5
1,0
75
1
,03
1
1,4
03
1
,06
7
Sou
th S
udan
..
..
..
..
..
..
..
..
..
..
..
..
1,0
88
1
,57
8
Tanz
ania
99
2
1,0
64
1
,27
4
1,2
70
1
,72
5
1,7
72
1
,49
9
1,8
83
2
,82
2
2,3
31
2
,93
3
2,9
58
2
,44
6
2,8
32
Uga
nda
60
5
85
3
82
2
72
5
99
8
1,2
16
1
,19
2
1,5
86
1
,73
7
1,6
41
1
,78
5
1,7
23
1
,57
8
1,6
55
Zam
bia
62
3
79
5
57
1
81
1
77
5
1,1
30
1
,17
2
1,4
68
1
,00
8
1,1
16
1
,26
7
91
4
1,0
35
9
58
Zim
babw
e 2
45
1
76
1
61
1
99
1
87
1
87
3
73
2
78
4
78
6
12
7
36
7
32
7
16
1
,00
1
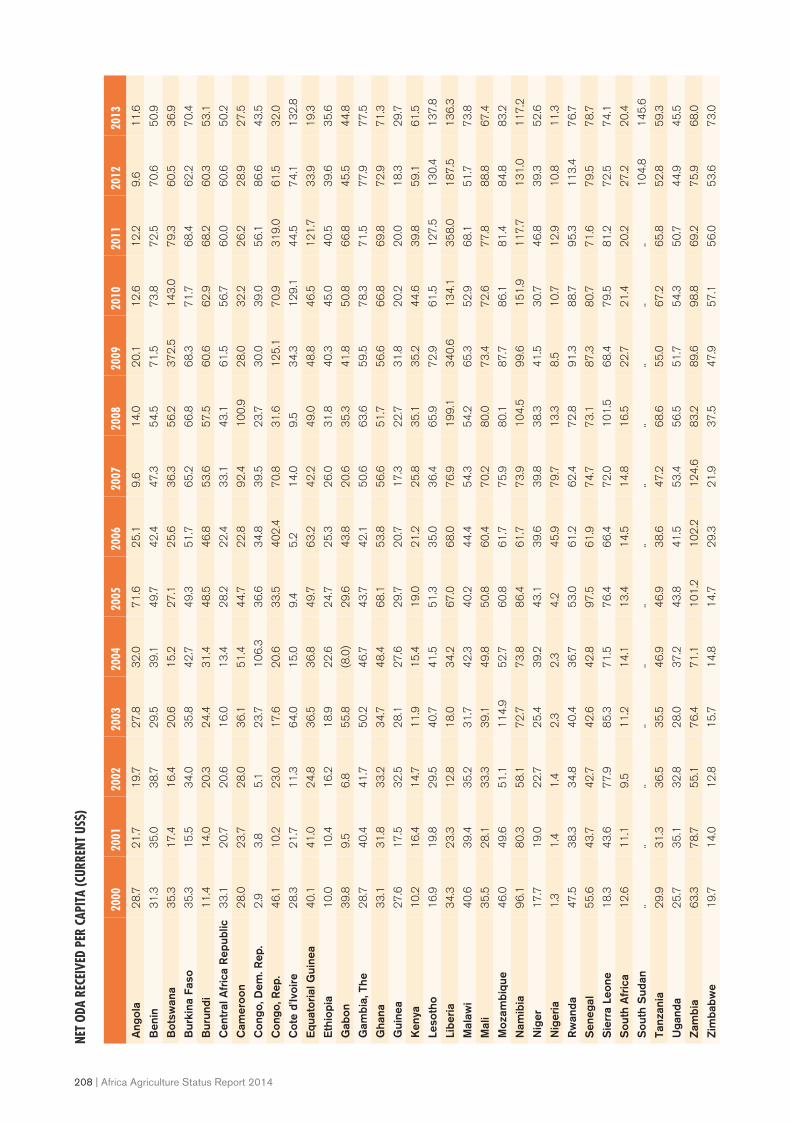
208 | Africa Agriculture Status Report 2014
NET
ODA
RECE
IVED
PER
CAP
ITA
(CUR
RENT
US$
)
2000
2001
2002
2003
2004
2005
2006
2007
2008
2009
2010
2011
2012
2013
Ang
ola
28
.7
21
.7
19
.7
27
.8
32
.0
71
.6
25
.1
9.6
1
4.0
2
0.1
1
2.6
1
2.2
9
.6
11
.6
Ben
in 3
1.3
3
5.0
3
8.7
2
9.5
3
9.1
4
9.7
4
2.4
4
7.3
5
4.5
7
1.5
7
3.8
7
2.5
7
0.6
5
0.9
Bot
swan
a 3
5.3
1
7.4
1
6.4
2
0.6
1
5.2
2
7.1
2
5.6
3
6.3
5
6.2
3
72
.5
14
3.0
7
9.3
6
0.5
3
6.9
Bur
kina
Fas
o 3
5.3
1
5.5
3
4.0
3
5.8
4
2.7
4
9.3
5
1.7
6
5.2
6
6.8
6
8.3
7
1.7
6
8.4
6
2.2
7
0.4
Bur
undi
11
.4
14
.0
20
.3
24
.4
31
.4
48
.5
46
.8
53
.6
57
.5
60
.6
62
.9
68
.2
60
.3
53
.1
Cen
tral
Afr
ica
Rep
ublic
33
.1
20
.7
20
.6
16
.0
13
.4
28
.2
22
.4
33
.1
43
.1
61
.5
56
.7
60
.0
60
.6
50
.2
Cam
eroo
n 2
8.0
2
3.7
2
8.0
3
6.1
5
1.4
4
4.7
2
2.8
9
2.4
1
00
.9
28
.0
32
.2
26
.2
28
.9
27
.5
Con
go, D
em. R
ep.
2.9
3
.8
5.1
2
3.7
1
06
.3
36
.6
34
.8
39
.5
23
.7
30
.0
39
.0
56
.1
86
.6
43
.5
Con
go, R
ep.
46
.1
10
.2
23
.0
17
.6
20
.6
33
.5
40
2.4
7
0.8
3
1.6
1
25
.1
70
.9
31
9.0
6
1.5
3
2.0
Cot
e d'
Ivoi
re 2
8.3
2
1.7
1
1.3
6
4.0
1
5.0
9
.4
5.2
1
4.0
9
.5
34
.3
12
9.1
4
4.5
7
4.1
1
32
.8
Equ
ator
ial G
uine
a 4
0.1
4
1.0
2
4.8
3
6.5
3
6.8
4
9.7
6
3.2
4
2.2
4
9.0
4
8.8
4
6.5
1
21
.7
33
.9
19
.3
Eth
iopi
a 1
0.0
1
0.4
1
6.2
1
8.9
2
2.6
2
4.7
2
5.3
2
6.0
3
1.8
4
0.3
4
5.0
4
0.5
3
9.6
3
5.6
Gab
on 3
9.8
9
.5
6.8
5
5.8
(8
.0)
29
.6
43
.8
20
.6
35
.3
41
.8
50
.8
66
.8
45
.5
44
.8
Gam
bia,
The
28
.7
40
.4
41
.7
50
.2
46
.7
43
.7
42
.1
50
.6
63
.6
59
.5
78
.3
71
.5
77
.9
77
.5
Gha
na 3
3.1
3
1.8
3
3.2
3
4.7
4
8.4
6
8.1
5
3.8
5
6.6
5
1.7
5
6.6
6
6.8
6
9.8
7
2.9
7
1.3
Gui
nea
27
.6
17
.5
32
.5
28
.1
27
.6
29
.7
20
.7
17
.3
22
.7
31
.8
20
.2
20
.0
18
.3
29
.7
Ken
ya 1
0.2
1
6.4
1
4.7
1
1.9
1
5.4
1
9.0
2
1.2
2
5.8
3
5.1
3
5.2
4
4.6
3
9.8
5
9.1
6
1.5
Leso
tho
16
.9
19
.8
29
.5
40
.7
41
.5
51
.3
35
.0
36
.4
65
.9
72
.9
61
.5
12
7.5
1
30
.4
13
7.8
Libe
ria
34
.3
23
.3
12
.8
18
.0
34
.2
67
.0
68
.0
76
.9
19
9.1
3
40
.6
13
4.1
3
58
.0
18
7.5
1
36
.3
Mal
awi
40
.6
39
.4
35
.2
31
.7
42
.3
40
.2
44
.4
54
.3
54
.2
65
.3
52
.9
68
.1
51
.7
73
.8
Mal
i 3
5.5
2
8.1
3
3.3
3
9.1
4
9.8
5
0.8
6
0.4
7
0.2
8
0.0
7
3.4
7
2.6
7
7.8
8
8.8
6
7.4
Moz
ambi
que
46
.0
49
.6
51
.1
11
4.9
5
2.7
6
0.8
6
1.7
7
5.9
8
0.1
8
7.7
8
6.1
8
1.4
8
4.8
8
3.2
Nam
ibia
96
.1
80
.3
58
.1
72
.7
73
.8
86
.4
61
.7
73
.9
10
4.5
9
9.6
1
51
.9
11
7.7
1
31
.0
11
7.2
Nig
er 1
7.7
1
9.0
2
2.7
2
5.4
3
9.2
4
3.1
3
9.6
3
9.8
3
8.3
4
1.5
3
0.7
4
6.8
3
9.3
5
2.6
Nig
eria
1.3
1
.4
1.4
2
.3
2.3
4
.2
45
.9
79
.7
13
.3
8.5
1
0.7
1
2.9
1
0.8
1
1.3
Rw
anda
47
.5
38
.3
34
.8
40
.4
36
.7
53
.0
61
.2
62
.4
72
.8
91
.3
88
.7
95
.3
11
3.4
7
6.7
Sen
egal
55
.6
43
.7
42
.7
42
.6
42
.8
97
.5
61
.9
74
.7
73
.1
87
.3
80
.7
71
.6
79
.5
78
.7
Sie
rra
Leon
e 1
8.3
4
3.6
7
7.9
8
5.3
7
1.5
7
6.4
6
6.4
7
2.0
1
01
.5
68
.4
79
.5
81
.2
72
.5
74
.1
Sou
th A
fric
a 1
2.6
1
1.1
9
.5
11
.2
14
.1
13
.4
14
.5
14
.8
16
.5
22
.7
21
.4
20
.2
27
.2
20
.4
Sou
th S
udan
..
..
..
..
..
..
..
..
..
..
..
..
10
4.8
1
45
.6
Tanz
ania
29
.9
31
.3
36
.5
35
.5
46
.9
46
.9
38
.6
47
.2
68
.6
55
.0
67
.2
65
.8
52
.8
59
.3
Uga
nda
25
.7
35
.1
32
.8
28
.0
37
.2
43
.8
41
.5
53
.4
56
.5
51
.7
54
.3
50
.7
44
.9
45
.5
Zam
bia
63
.3
78
.7
55
.1
76
.4
71
.1
10
1.2
1
02
.2
12
4.6
8
3.2
8
9.6
9
8.8
6
9.2
7
5.9
6
8.0
Zim
babw
e 1
9.7
1
4.0
1
2.8
1
5.7
1
4.8
1
4.7
2
9.3
2
1.9
3
7.5
4
7.9
5
7.1
5
6.0
5
3.6
7
3.0

Africa Agriculture Status Report 2014 | 209
GROS
S DI
SBUR
SEM
ENTS
, AGR
ICUL
TURE
(US$
MIL
LION
S)
2002
2003
2004
2005
2006
2007
2008
2009
2010
2011
2012
2013
Ang
ola
5.2
8
.8
3.6
5
.3
15
.2
16
.3
34
.6
32
.2
30
.4
29
.4
16
.0
..
Ben
in 9
.3
13
.8
22
.3
23
.7
30
.0
29
.3
37
.8
48
.3
39
.6
59
.4
37
.5
0.3
Bot
swan
a 0
.6
0.4
0
.5
0.6
0
.6
8.1
1
.7
1.4
0
.9
0.7
1
.6
..
Bur
kina
Fas
o 3
0.4
5
1.4
4
6.7
5
5.5
5
7.0
6
8.0
8
5.1
8
0.7
9
5.9
1
27
.1
15
6.5
..
Bur
undi
3.0
3
.4
6.4
7
.3
25
.0
24
.2
15
.5
25
.6
27
.1
29
.7
52
.5
..
Cam
eroo
n 2
9.5
1
7.1
4
4.9
1
8.2
3
9.2
6
6.7
2
1.6
2
4.0
4
7.9
3
7.0
3
5.3
..
Con
go, D
em. R
ep.
18
.8
6.5
1
3.3
2
3.2
2
2.5
2
3.5
3
7.7
5
1.9
6
8.8
8
4.8
8
5.1
..
Con
go, R
ep.
0.8
0
.5
0.5
1
.5
0.0
8
.3
3.8
2
.8
3.3
5
.5
6.0
..
Cot
e d'
Ivoi
re 7
2.2
2
1.7
5
.5
2.7
1
4.0
5
.6
94
.9
57
.0
61
.0
49
.4
13
.6
0.5
Equ
ator
ial G
uine
a 0
.3
0.3
0
.3
0.3
0
.0
0.6
0
.5
0.5
0
.4
1.5
1
.0
..
Eth
iopi
a 4
5.4
7
5.0
7
6.4
6
7.0
6
3.0
8
3.5
7
5.3
3
94
.2
16
7.0
1
54
.3
18
6.5
..
Gab
on 4
.1
4.2
4
.9
10
.7
3.4
2
0.6
6
.2
4.0
1
6.7
1
4.3
5
.5
..
Gam
bia,
The
10
.8
19
.7
12
.2
6.2
5
.2
5.3
8
.0
16
.5
7.3
9
.3
7.1
0
.8
Gha
na 2
6.7
4
5.4
4
9.6
7
1.1
6
6.7
7
9.3
1
41
.4
14
2.2
2
19
.9
23
2.8
1
80
.8
0.3
Gui
nea
19
.0
27
.9
12
.8
12
.2
9.6
2
1.6
1
6.7
2
3.2
1
0.7
1
4.8
1
0.3
0
.4
Ken
ya 2
5.2
4
0.1
3
4.5
2
8.0
7
6.2
9
3.5
1
08
.6
89
.6
13
2.8
1
39
.5
14
7.6
0
.1
Leso
tho
3.7
5
.8
2.6
0
.4
0.9
0
.5
0.1
1
.2
0.4
2
.5
1.1
..
Libe
ria
0.0
0
.0
0.5
1
.9
0.8
1
.7
10
.1
22
.7
12
.1
23
.4
18
.9
..
Mal
awi
12
.6
50
.4
42
.5
68
.4
53
.7
75
.7
70
.0
69
.7
10
5.8
1
08
.0
10
6.9
..
Mal
i 3
9.3
5
1.9
6
5.4
7
4.9
6
9.7
1
11
.0
10
4.6
1
47
.0
19
8.9
2
36
.9
14
7.4
..
Moz
ambi
que
36
.5
37
.3
41
.7
85
.1
76
.9
73
.9
13
7.0
9
0.6
1
24
.8
10
7.1
1
27
.7
2.4
Nam
ibia
6.5
1
0.9
1
1.6
9
.3
7.4
7
.4
5.2
6
.0
10
.0
14
.5
14
.6
..
Nig
er 1
9.5
2
7.8
4
1.0
4
6.3
4
9.4
4
1.5
4
0.7
3
3.8
6
0.1
4
9.3
5
5.1
..
Nig
eria
3.3
5
.4
8.5
1
6.3
4
4.9
2
8.2
2
8.0
3
5.6
7
7.5
8
0.2
7
5.2
..
Rw
anda
8.9
9
.8
18
.4
19
.0
29
.8
32
.4
50
.2
34
.0
10
7.4
1
08
.5
78
.4
..
Sen
egal
40
.6
57
.4
54
.0
45
.9
59
.5
61
.7
58
.9
63
.6
85
.4
10
8.5
8
3.4
0
.8
Sie
rra
Leon
e 1
.7
1.7
5
.6
3.6
4
.0
4.1
1
1.6
2
0.8
4
7.3
1
9.4
2
3.0
..
Sou
th A
fric
a 9
.1
9.2
8
.5
13
.9
15
.9
24
.5
15
.4
10
.7
20
.2
10
.1
17
.3
..
Sou
th S
udan
..
..
..
..
..
..
..
..
..
28
.5
38
.2
..
Tanz
ania
35
.3
71
.6
10
0.7
8
5.4
1
11
.0
11
1.9
1
64
.2
15
1.5
1
97
.3
11
7.8
1
40
.0
..
Uga
nda
18
.7
31
.0
75
.2
93
.6
10
2.8
1
58
.0
12
4.3
1
33
.1
72
.3
10
3.3
1
34
.6
0.0
Zam
bia
17
.5
27
.9
27
.2
38
.5
41
.6
45
.6
54
.4
44
.1
39
.2
41
.3
63
.6
0.0
Zim
babw
e 5
.3
4.4
1
1.3
5
.1
4.4
1
6.1
8
.2
46
.3
53
.3
81
.0
77
.5
..
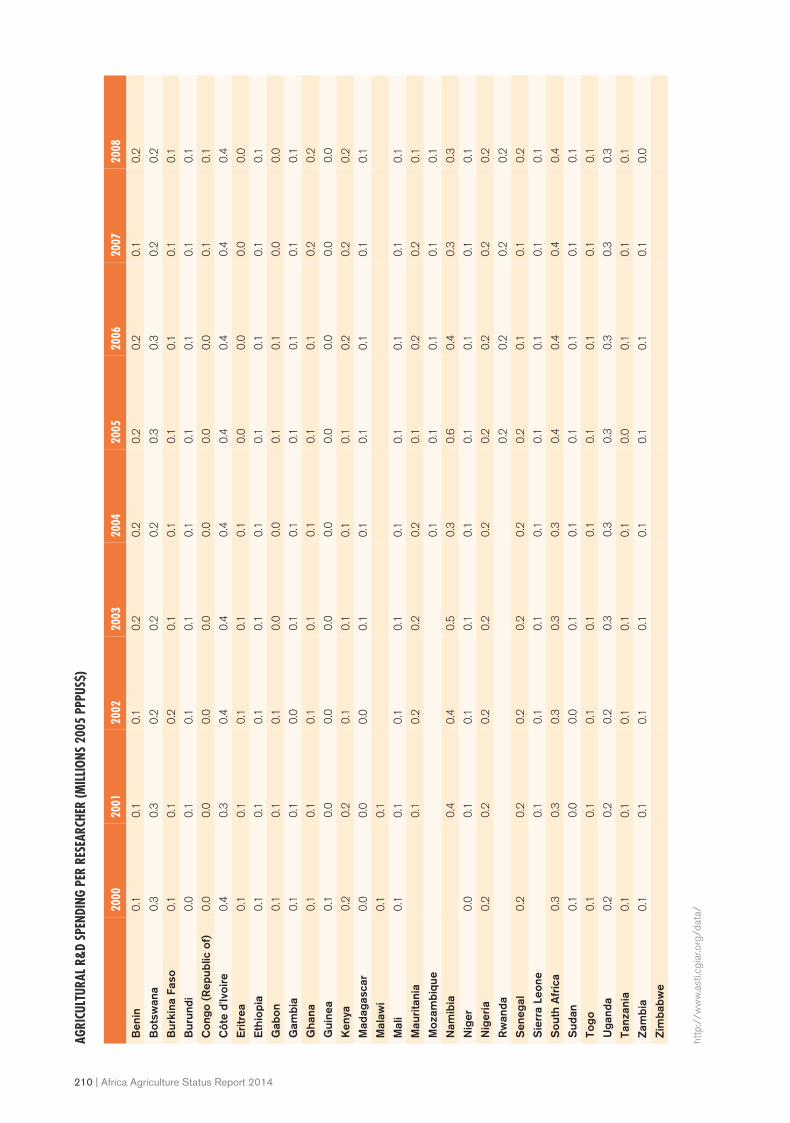
210 | Africa Agriculture Status Report 2014
AGRI
CULT
URAL
R&D
SPE
NDIN
G PE
R RE
SEAR
CHER
(MIL
LION
S 20
05 P
PPUS
$)
2000
2001
2002
2003
2004
2005
2006
2007
2008
Ben
in0
.10
.10
.10
.20
.20
.20
.20
.10
.2
Bot
swan
a0
.30
.30
.20
.20
.20
.30
.30
.20
.2
Bur
kina
Fas
o0
.10
.10
.20
.10
.10
.10
.10
.10
.1
Bur
undi
0.0
0.1
0.1
0.1
0.1
0.1
0.1
0.1
0.1
Con
go (
Rep
ublic
of)
0.0
0.0
0.0
0.0
0.0
0.0
0.0
0.1
0.1
Côt
e d'
Ivoi
re0
.40
.30
.40
.40
.40
.40
.40
.40
.4
Eri
trea
0.1
0.1
0.1
0.1
0.1
0.0
0.0
0.0
0.0
Eth
iopi
a0
.10
.10
.10
.10
.10
.10
.10
.10
.1
Gab
on0
.10
.10
.10
.00
.00
.10
.10
.00
.0
Gam
bia
0.1
0.1
0.0
0.1
0.1
0.1
0.1
0.1
0.1
Gha
na0
.10
.10
.10
.10
.10
.10
.10
.20
.2
Gui
nea
0.1
0.0
0.0
0.0
0.0
0.0
0.0
0.0
0.0
Ken
ya0
.20
.20
.10
.10
.10
.10
.20
.20
.2
Mad
agas
car
0.0
0.0
0.0
0.1
0.1
0.1
0.1
0.1
0.1
Mal
awi
0.1
0.1
Mal
i0
.10
.10
.10
.10
.10
.10
.10
.10
.1
Mau
rita
nia
0.1
0.2
0.2
0.2
0.1
0.2
0.2
0.1
Moz
ambi
que
0.1
0.1
0.1
0.1
0.1
Nam
ibia
0.4
0.4
0.5
0.3
0.6
0.4
0.3
0.3
Nig
er0
.00
.10
.10
.10
.10
.10
.10
.10
.1
Nig
eria
0.2
0.2
0.2
0.2
0.2
0.2
0.2
0.2
0.2
Rw
anda
0.2
0.2
0.2
0.2
Sen
egal
0.2
0.2
0.2
0.2
0.2
0.2
0.1
0.1
0.2
Sie
rra
Leon
e0
.10
.10
.10
.10
.10
.10
.10
.1
Sou
th A
fric
a0
.30
.30
.30
.30
.30
.40
.40
.40
.4
Sud
an0
.10
.00
.00
.10
.10
.10
.10
.10
.1
Togo
0.1
0.1
0.1
0.1
0.1
0.1
0.1
0.1
0.1
Uga
nda
0.2
0.2
0.2
0.3
0.3
0.3
0.3
0.3
0.3
Tanz
ania
0.1
0.1
0.1
0.1
0.1
0.0
0.1
0.1
0.1
Zam
bia
0.1
0.1
0.1
0.1
0.1
0.1
0.1
0.1
0.0
Zim
babw
e
http
://w
ww
.ast
i.cgi
ar.o
rg/d
ata/
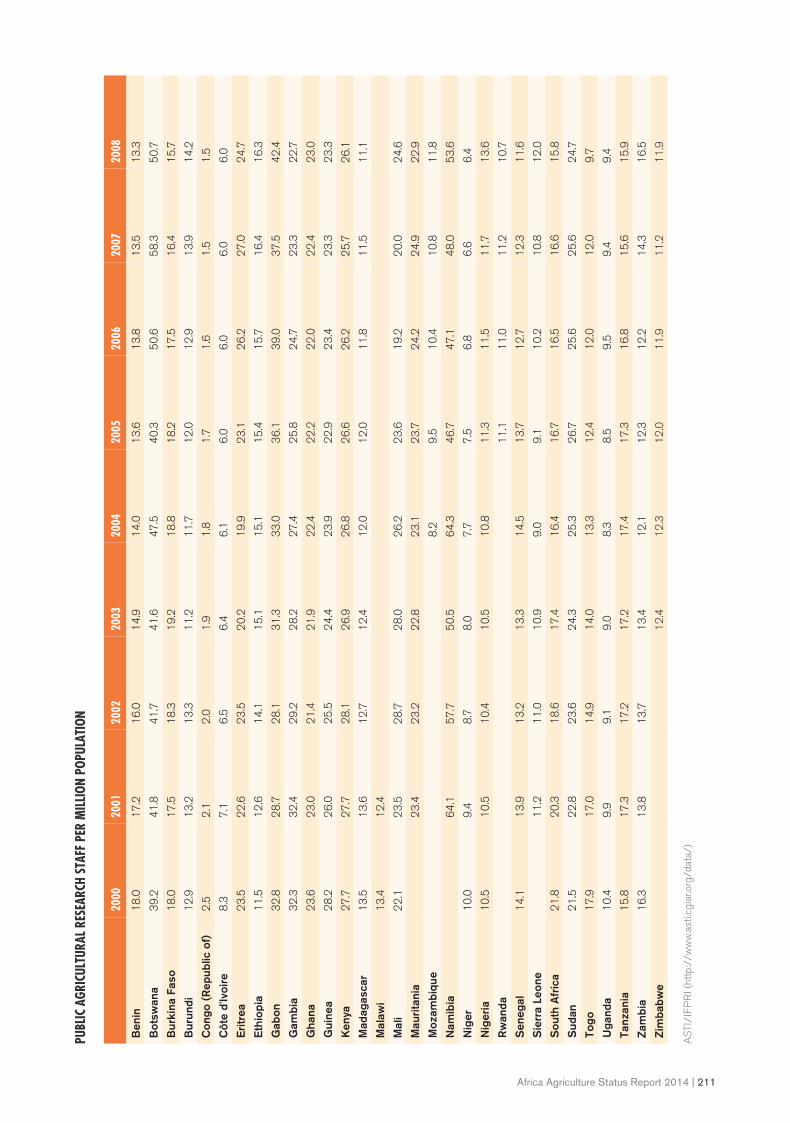
Africa Agriculture Status Report 2014 | 211
PUBL
IC A
GRIC
ULTU
RAL R
ESEA
RCH
STAF
F PE
R M
ILLI
ON P
OPUL
ATIO
N
2000
2001
2002
2003
2004
2005
2006
2007
2008
Ben
in1
8.0
17
.21
6.0
14
.91
4.0
13
.61
3.8
13
.51
3.3
Bot
swan
a3
9.2
41
.84
1.7
41
.64
7.5
40
.35
0.6
58
.35
0.7
Bur
kina
Fas
o1
8.0
17
.51
8.3
19
.21
8.8
18
.21
7.5
16
.41
5.7
Bur
undi
12
.91
3.2
13
.31
1.2
11
.71
2.0
12
.91
3.9
14
.2
Con
go (
Rep
ublic
of)
2.5
2.1
2.0
1.9
1.8
1.7
1.6
1.5
1.5
Côt
e d'
Ivoi
re8
.37
.16
.56
.46
.16
.06
.06
.06
.0
Eri
trea
23
.52
2.6
23
.52
0.2
19
.92
3.1
26
.22
7.0
24
.7
Eth
iopi
a1
1.5
12
.61
4.1
15
.11
5.1
15
.41
5.7
16
.41
6.3
Gab
on3
2.8
28
.72
8.1
31
.33
3.0
36
.13
9.0
37
.54
2.4
Gam
bia
32
.33
2.4
29
.22
8.2
27
.42
5.8
24
.72
3.3
22
.7
Gha
na2
3.6
23
.02
1.4
21
.92
2.4
22
.22
2.0
22
.42
3.0
Gui
nea
28
.22
6.0
25
.52
4.4
23
.92
2.9
23
.42
3.3
23
.3
Ken
ya2
7.7
27
.72
8.1
26
.92
6.8
26
.62
6.2
25
.72
6.1
Mad
agas
car
13
.51
3.6
12
.71
2.4
12
.01
2.0
11
.81
1.5
11
.1
Mal
awi
13
.41
2.4
Mal
i2
2.1
23
.52
8.7
28
.02
6.2
23
.61
9.2
20
.02
4.6
Mau
rita
nia
23
.42
3.2
22
.82
3.1
23
.72
4.2
24
.92
2.9
Moz
ambi
que
8.2
9.5
10
.41
0.8
11
.8
Nam
ibia
64
.15
7.7
50
.56
4.3
46
.74
7.1
48
.05
3.6
Nig
er1
0.0
9.4
8.7
8.0
7.7
7.5
6.8
6.6
6.4
Nig
eria
10
.51
0.5
10
.41
0.5
10
.81
1.3
11
.51
1.7
13
.6
Rw
anda
11
.11
1.0
11
.21
0.7
Sen
egal
14
.11
3.9
13
.21
3.3
14
.51
3.7
12
.71
2.3
11
.6
Sie
rra
Leon
e1
1.2
11
.01
0.9
9.0
9.1
10
.21
0.8
12
.0
Sou
th A
fric
a2
1.8
20
.31
8.6
17
.41
6.4
16
.71
6.5
16
.61
5.8
Sud
an2
1.5
22
.82
3.6
24
.32
5.3
26
.72
5.6
25
.62
4.7
Togo
17
.91
7.0
14
.91
4.0
13
.31
2.4
12
.01
2.0
9.7
Uga
nda
10
.49
.99
.19
.08
.38
.59
.59
.49
.4
Tanz
ania
15
.81
7.3
17
.21
7.2
17
.41
7.3
16
.81
5.6
15
.9
Zam
bia
16
.31
3.8
13
.71
3.4
12
.11
2.3
12
.21
4.3
16
.5
Zim
babw
e1
2.4
12
.31
2.0
11
.91
1.2
11
.9
AS
TI/I
FP
RI (
http
://w
ww
.ast
i.cgi
ar.o
rg/d
ata/
)
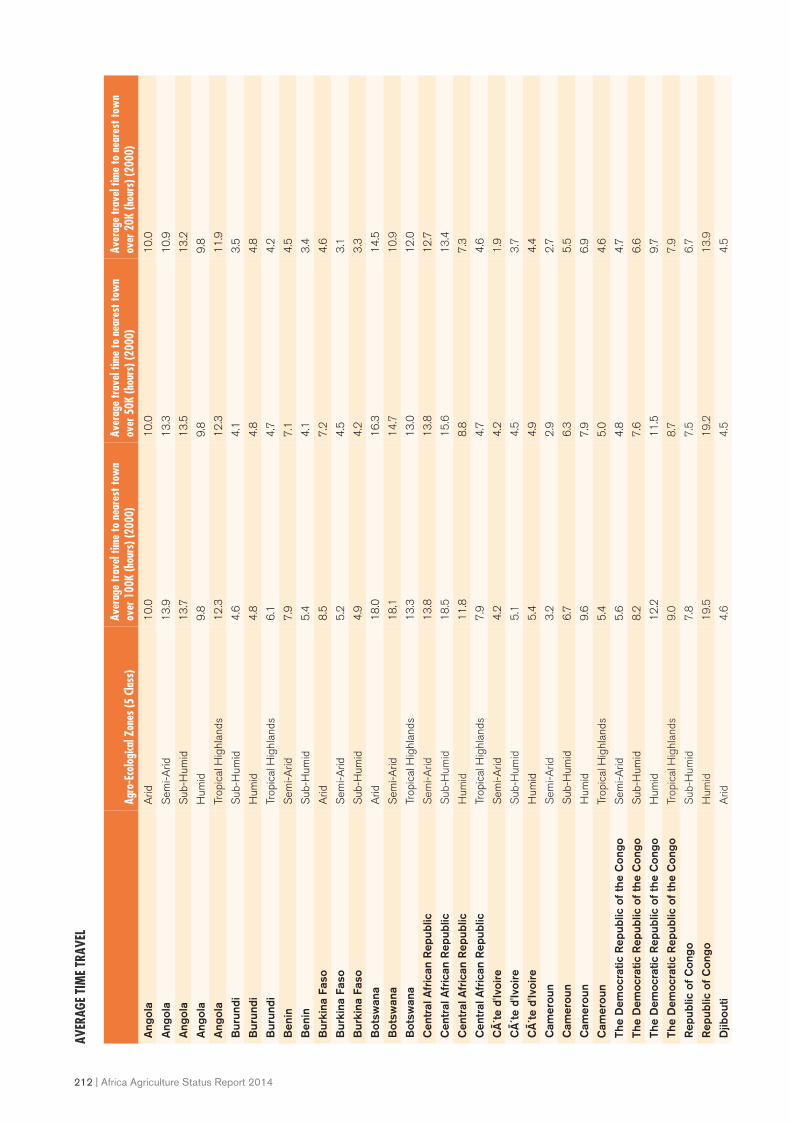
212 | Africa Agriculture Status Report 2014
AVER
AGE
TIM
E TR
AVEL
Agro
-Eco
logi
cal Z
ones
(5 C
lass
)Av
erag
e tra
vel t
ime
to n
eare
st to
wn
over
100
K (h
ours
) (20
00)
Aver
age
trave
l tim
e to
nea
rest
tow
n ov
er 5
0K (h
ours
) (20
00)
Aver
age
trave
l tim
e to
nea
rest
tow
n ov
er 2
0K (h
ours
) (20
00)
Ang
ola
Arid
10
.01
0.0
10
.0
Ang
ola
Sem
i-Arid
13
.91
3.3
10
.9
Ang
ola
Sub
-Hum
id1
3.7
13
.51
3.2
Ang
ola
Hum
id9
.89
.89
.8
Ang
ola
Trop
ical
Hig
hlan
ds1
2.3
12
.31
1.9
Bur
undi
Sub
-Hum
id4
.64
.13
.5
Bur
undi
Hum
id4
.84
.84
.8
Bur
undi
Trop
ical
Hig
hlan
ds6
.14
.74
.2
Ben
inS
emi-A
rid7
.97
.14
.5
Ben
inS
ub-H
umid
5.4
4.1
3.4
Bur
kina
Fas
oA
rid8
.57
.24
.6
Bur
kina
Fas
oS
emi-A
rid5
.24
.53
.1
Bur
kina
Fas
oS
ub-H
umid
4.9
4.2
3.3
Bot
swan
aA
rid1
8.0
16
.31
4.5
Bot
swan
aS
emi-A
rid1
8.1
14
.71
0.9
Bot
swan
aTr
opic
al H
ighl
ands
13
.31
3.0
12
.0
Cen
tral
Afr
ican
Rep
ublic
Sem
i-Arid
13
.81
3.8
12
.7
Cen
tral
Afr
ican
Rep
ublic
Sub
-Hum
id1
8.5
15
.61
3.4
Cen
tral
Afr
ican
Rep
ublic
Hum
id1
1.8
8.8
7.3
Cen
tral
Afr
ican
Rep
ublic
Trop
ical
Hig
hlan
ds7
.94
.74
.6
CÃ
´te d
'Ivoi
reS
emi-A
rid4
.24
.21
.9
CÃ
´te d
'Ivoi
reS
ub-H
umid
5.1
4.5
3.7
CÃ
´te d
'Ivoi
reH
umid
5.4
4.9
4.4
Cam
erou
nS
emi-A
rid3
.22
.92
.7
Cam
erou
nS
ub-H
umid
6.7
6.3
5.5
Cam
erou
nH
umid
9.6
7.9
6.9
Cam
erou
nTr
opic
al H
ighl
ands
5.4
5.0
4.6
The
Dem
ocra
tic R
epub
lic o
f th
e C
ongo
Sem
i-Arid
5.6
4.8
4.7
The
Dem
ocra
tic R
epub
lic o
f th
e C
ongo
Sub
-Hum
id8
.27
.66
.6
The
Dem
ocra
tic R
epub
lic o
f th
e C
ongo
Hum
id1
2.2
11
.59
.7
The
Dem
ocra
tic R
epub
lic o
f th
e C
ongo
Trop
ical
Hig
hlan
ds9
.08
.77
.9
Rep
ublic
of
Con
goS
ub-H
umid
7.8
7.5
6.7
Rep
ublic
of
Con
goH
umid
19
.51
9.2
13
.9
Djib
outi
Arid
4.6
4.5
4.5

Africa Agriculture Status Report 2014 | 213
Agro
-Eco
logi
cal Z
ones
(5 C
lass
)Av
erag
e tra
vel t
ime
to n
eare
st to
wn
over
100
K (h
ours
) (20
00)
Aver
age
trave
l tim
e to
nea
rest
tow
n ov
er 5
0K (h
ours
) (20
00)
Aver
age
trave
l tim
e to
nea
rest
tow
n ov
er 2
0K (h
ours
) (20
00)
Djib
outi
Trop
ical
Hig
hlan
ds6
.16
.16
.1
Eri
trea
Arid
9.5
8.1
7.6
Eri
trea
Sem
i-Arid
6.9
5.6
5.5
Eri
trea
Trop
ical
Hig
hlan
ds7
.47
.16
.3
Eth
iopi
aA
rid1
1.3
11
.09
.6
Eth
iopi
aS
emi-A
rid1
2.6
11
.19
.5
Eth
iopi
aS
ub-H
umid
17
.21
4.9
13
.4
Eth
iopi
aH
umid
16
.01
4.2
12
.8
Eth
iopi
aTr
opic
al H
ighl
ands
10
.48
.87
.8
Gab
onS
ub-H
umid
15
.41
5.4
12
.5
Gab
onH
umid
18
.11
7.8
14
.0
Gha
naS
emi-A
rid1
.81
.71
.2
Gha
naS
ub-H
umid
5.0
4.2
3.5
Gha
naH
umid
5.1
4.6
3.7
Gui
nea
Sem
i-Arid
5.5
5.3
4.8
Gui
nea
Sub
-Hum
id4
.33
.93
.2
Gui
nea
Hum
id3
.43
.02
.8
Gui
nea
Trop
ical
Hig
hlan
ds3
.23
.23
.2
Gam
bia
Sem
i-Arid
4.7
3.1
2.5
Gui
nea-
Bis
sau
Sem
i-Arid
4.0
3.8
3.2
Gui
nea-
Bis
sau
Sub
-Hum
id5
.65
.64
.1
Equ
ator
ial G
uine
aH
umid
8.1
4.9
4.7
Equ
ator
ial G
uine
aTr
opic
al H
ighl
ands
7.4
3.7
3.7
Ken
yaA
rid1
0.6
7.9
7.0
Ken
yaS
emi-A
rid1
1.4
9.8
8.8
Ken
yaS
ub-H
umid
7.8
7.3
6.5
Ken
yaH
umid
2.2
2.2
1.6
Ken
yaTr
opic
al H
ighl
ands
5.7
5.5
4.6
Libe
ria
Sub
-Hum
id3
.22
.32
.1
Libe
ria
Hum
id6
.46
.34
.8
Leso
tho
Trop
ical
Hig
hlan
ds1
3.0
12
.81
2.6
Mad
agas
car
Sem
i-Arid
10
.67
.85
.9
Mad
agas
car
Sub
-Hum
id7
.76
.45
.0
Mad
agas
car
Hum
id9
.98
.06
.0
Mad
agas
car
Trop
ical
Hig
hlan
ds6
.96
.15
.0
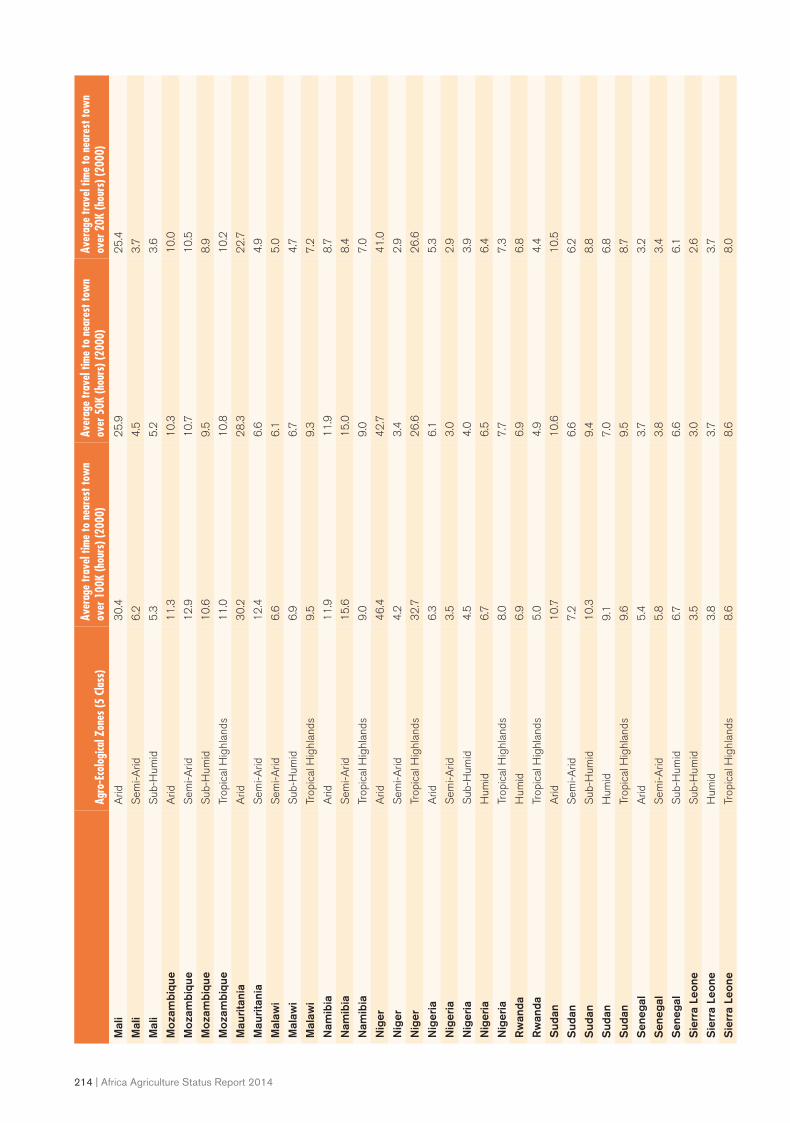
214 | Africa Agriculture Status Report 2014
Agro
-Eco
logi
cal Z
ones
(5 C
lass
)Av
erag
e tra
vel t
ime
to n
eare
st to
wn
over
100
K (h
ours
) (20
00)
Aver
age
trave
l tim
e to
nea
rest
tow
n ov
er 5
0K (h
ours
) (20
00)
Aver
age
trave
l tim
e to
nea
rest
tow
n ov
er 2
0K (h
ours
) (20
00)
Mal
iA
rid3
0.4
25
.92
5.4
Mal
iS
emi-A
rid6
.24
.53
.7
Mal
iS
ub-H
umid
5.3
5.2
3.6
Moz
ambi
que
Arid
11
.31
0.3
10
.0
Moz
ambi
que
Sem
i-Arid
12
.91
0.7
10
.5
Moz
ambi
que
Sub
-Hum
id1
0.6
9.5
8.9
Moz
ambi
que
Trop
ical
Hig
hlan
ds1
1.0
10
.81
0.2
Mau
rita
nia
Arid
30
.22
8.3
22
.7
Mau
rita
nia
Sem
i-Arid
12
.46
.64
.9
Mal
awi
Sem
i-Arid
6.6
6.1
5.0
Mal
awi
Sub
-Hum
id6
.96
.74
.7
Mal
awi
Trop
ical
Hig
hlan
ds9
.59
.37
.2
Nam
ibia
Arid
11
.91
1.9
8.7
Nam
ibia
Sem
i-Arid
15
.61
5.0
8.4
Nam
ibia
Trop
ical
Hig
hlan
ds9
.09
.07
.0
Nig
erA
rid4
6.4
42
.74
1.0
Nig
erS
emi-A
rid4
.23
.42
.9
Nig
erTr
opic
al H
ighl
ands
32
.72
6.6
26
.6
Nig
eria
Arid
6.3
6.1
5.3
Nig
eria
Sem
i-Arid
3.5
3.0
2.9
Nig
eria
Sub
-Hum
id4
.54
.03
.9
Nig
eria
Hum
id6
.76
.56
.4
Nig
eria
Trop
ical
Hig
hlan
ds8
.07
.77
.3
Rw
anda
Hum
id6
.96
.96
.8
Rw
anda
Trop
ical
Hig
hlan
ds5
.04
.94
.4
Sud
anA
rid1
0.7
10
.61
0.5
Sud
anS
emi-A
rid7
.26
.66
.2
Sud
anS
ub-H
umid
10
.39
.48
.8
Sud
anH
umid
9.1
7.0
6.8
Sud
anTr
opic
al H
ighl
ands
9.6
9.5
8.7
Sen
egal
Arid
5.4
3.7
3.2
Sen
egal
Sem
i-Arid
5.8
3.8
3.4
Sen
egal
Sub
-Hum
id6
.76
.66
.1
Sie
rra
Leon
eS
ub-H
umid
3.5
3.0
2.6
Sie
rra
Leon
eH
umid
3.8
3.7
3.7
Sie
rra
Leon
eTr
opic
al H
ighl
ands
8.6
8.6
8.0

Africa Agriculture Status Report 2014 | 215
Agro
-Eco
logi
cal Z
ones
(5 C
lass
)Av
erag
e tra
vel t
ime
to n
eare
st to
wn
over
100
K (h
ours
) (20
00)
Aver
age
trave
l tim
e to
nea
rest
tow
n ov
er 5
0K (h
ours
) (20
00)
Aver
age
trave
l tim
e to
nea
rest
tow
n ov
er 2
0K (h
ours
) (20
00)
Som
alia
Arid
10
.91
0.8
9.9
Som
alia
Sem
i-Arid
7.4
6.9
6.8
Som
alia
Trop
ical
Hig
hlan
ds7
.87
.87
.8
Sw
azila
ndS
emi-A
rid6
.04
.43
.7
Sw
azila
ndS
ub-H
umid
7.5
4.2
3.9
Sw
azila
ndTr
opic
al H
ighl
ands
8.2
4.2
4.1
Cha
dA
rid3
3.4
32
.43
1.8
Cha
dS
emi-A
rid8
.57
.45
.8
Cha
dS
ub-H
umid
7.4
7.4
6.6
Cha
dTr
opic
al H
ighl
ands
47
.24
7.2
46
.3
Togo
Sem
i-Arid
0.4
0.4
0.2
Togo
Sub
-Hum
id6
.53
.83
.1
Togo
Hum
id5
.02
.62
.4
Tanz
ania
Sem
i-Arid
9.7
7.5
7.4
Tanz
ania
Sub
-Hum
id1
2.4
10
.51
0.2
Tanz
ania
Hum
id6
.83
.03
.0
Tanz
ania
Trop
ical
Hig
hlan
ds1
0.0
9.1
8.9
Uga
nda
Sub
-Hum
id9
.66
.45
.7
Uga
nda
Hum
id5
.84
.03
.5
Uga
nda
Trop
ical
Hig
hlan
ds7
.34
.94
.4
Sou
th A
fric
aA
rid8
.65
.94
.5
Sou
th A
fric
aS
emi-A
rid6
.65
.64
.5
Sou
th A
fric
aS
ub-H
umid
5.8
5.5
3.7
Sou
th A
fric
aH
umid
6.0
6.0
5.5
Sou
th A
fric
aTr
opic
al H
ighl
ands
5.0
4.2
3.5
Zam
bia
Sem
i-Arid
14
.21
1.8
9.8
Zam
bia
Sub
-Hum
id1
3.7
12
.39
.6
Zam
bia
Trop
ical
Hig
hlan
ds1
2.4
10
.39
.0
Zim
babw
eA
rid8
.57
.66
.7
Zim
babw
eS
emi-A
rid6
.45
.34
.9
Zim
babw
eS
ub-H
umid
4.7
4.7
4.7
Zim
babw
eTr
opic
al H
ighl
ands
3.5
3.1
3.1
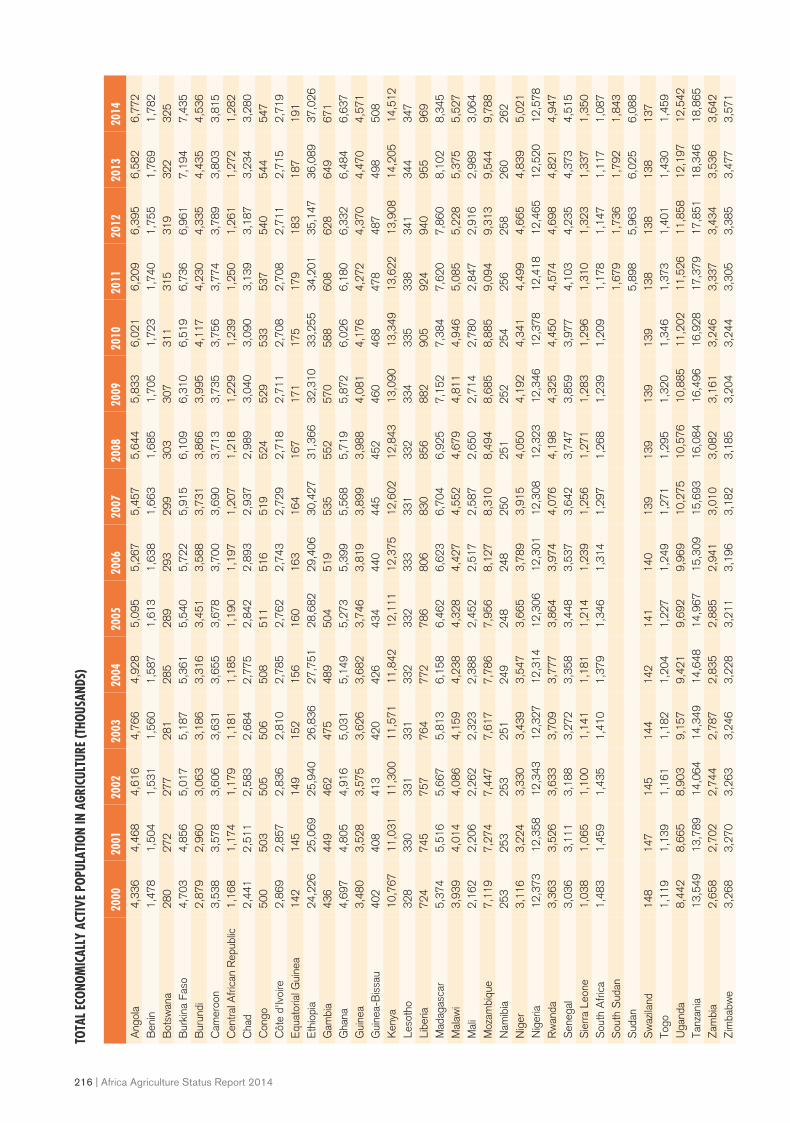
216 | Africa Agriculture Status Report 2014
TOTA
L ECO
NOM
ICAL
LY A
CTIV
E PO
PULA
TION
IN A
GRIC
ULTU
RE (T
HOUS
ANDS
)
2000
2001
2002
2003
2004
2005
2006
2007
2008
2009
2010
2011
2012
2013
2014
Ang
ola
4,3
36
4,4
68
4,6
16
4,7
66
4,9
28
5,0
95
5,2
67
5,4
57
5,6
44
5,8
33
6,0
21
6,2
09
6,3
95
6,5
82
6,7
72
Ben
in 1
,478
1
,504
1
,531
1
,560
1
,587
1
,613
1
,638
1
,663
1
,685
1
,705
1
,723
1
,740
1
,755
1
,769
1
,782
B
otsw
ana
280
2
72
277
2
81
285
2
89
293
2
99
303
3
07
311
3
15
319
3
22
325
B
urki
na F
aso
4,7
03
4,8
56
5,0
17
5,1
87
5,3
61
5,5
40
5,7
22
5,9
15
6,1
09
6,3
10
6,5
19
6,7
36
6,9
61
7,1
94
7,4
35
Bur
undi
2,8
79
2,9
60
3,0
63
3,1
86
3,3
16
3,4
51
3,5
88
3,7
31
3,8
66
3,9
95
4,1
17
4,2
30
4,3
35
4,4
35
4,5
36
Cam
eroo
n 3
,538
3
,578
3
,606
3
,631
3
,655
3
,678
3
,700
3
,690
3
,713
3
,735
3
,756
3
,774
3
,789
3
,803
3
,815
C
entra
l Afr
ican
Rep
ublic
1,1
68
1,1
74
1,1
79
1,1
81
1,1
85
1,1
90
1,1
97
1,2
07
1,2
18
1,2
29
1,2
39
1,2
50
1,2
61
1,2
72
1,2
82
Cha
d 2
,441
2
,511
2
,583
2
,684
2
,775
2
,842
2
,893
2
,937
2
,989
3
,040
3
,090
3
,139
3
,187
3
,234
3
,280
C
ongo
500
5
03
505
5
06
508
5
11
516
5
19
524
5
29
533
5
37
540
5
44
547
C
ôte
d'Iv
oire
2,8
69
2,8
57
2,8
36
2,8
10
2,7
85
2,7
62
2,7
43
2,7
29
2,7
18
2,7
11
2,7
08
2,7
08
2,7
11
2,7
15
2,7
19
Equ
ator
ial G
uine
a 1
42
145
1
49
152
1
56
160
1
63
164
1
67
171
1
75
179
1
83
187
1
91
Eth
iopi
a 2
4,22
6 2
5,06
9 2
5,94
0 2
6,83
6 2
7,75
1 2
8,68
2 2
9,40
6 3
0,42
7 3
1,36
6 3
2,31
0 3
3,25
5 3
4,20
1 3
5,14
7 3
6,08
9 3
7,02
6 G
ambi
a 4
36
449
4
62
475
4
89
504
5
19
535
5
52
570
5
88
608
6
28
649
6
71
Gha
na 4
,697
4
,805
4
,916
5
,031
5
,149
5
,273
5
,399
5
,568
5
,719
5
,872
6
,026
6
,180
6
,332
6
,484
6
,637
G
uine
a 3
,480
3
,528
3
,575
3
,626
3
,682
3
,746
3
,819
3
,899
3
,988
4
,081
4
,176
4
,272
4
,370
4
,470
4
,571
G
uine
a-B
issa
u 4
02
408
4
13
420
4
26
434
4
40
445
4
52
460
4
68
478
4
87
498
5
08
Ken
ya 1
0,76
7 1
1,03
1 1
1,30
0 1
1,57
1 1
1,84
2 1
2,11
1 1
2,37
5 1
2,60
2 1
2,84
3 1
3,09
0 1
3,34
9 1
3,62
2 1
3,90
8 1
4,20
5 1
4,51
2 Le
soth
o 3
28
330
3
31
331
3
32
332
3
33
331
3
32
334
3
35
338
3
41
344
3
47
Libe
ria 7
24
745
7
57
764
7
72
786
8
06
830
8
56
882
9
05
924
9
40
955
9
69
Mad
agas
car
5,3
74
5,5
16
5,6
67
5,8
13
6,1
58
6,4
62
6,6
23
6,7
04
6,9
25
7,1
52
7,3
84
7,6
20
7,8
60
8,1
02
8,3
45
Mal
awi
3,9
39
4,0
14
4,0
86
4,1
59
4,2
38
4,3
28
4,4
27
4,5
52
4,6
79
4,8
11
4,9
46
5,0
85
5,2
28
5,3
75
5,5
27
Mal
i 2
,162
2
,206
2
,262
2
,323
2
,388
2
,452
2
,517
2
,587
2
,650
2
,714
2
,780
2
,847
2
,916
2
,989
3
,064
M
ozam
biqu
e 7
,119
7
,274
7
,447
7
,617
7
,786
7
,956
8
,127
8
,310
8
,494
8
,685
8
,885
9
,094
9
,313
9
,544
9
,788
N
amib
ia 2
53
253
2
53
251
2
49
248
2
48
250
2
51
252
2
54
256
2
58
260
2
62
Nig
er 3
,116
3
,224
3
,330
3
,439
3
,547
3
,665
3
,789
3
,915
4
,050
4
,192
4
,341
4
,499
4
,665
4
,839
5
,021
N
iger
ia 1
2,37
3 1
2,35
8 1
2,34
3 1
2,32
7 1
2,31
4 1
2,30
6 1
2,30
1 1
2,30
8 1
2,32
3 1
2,34
6 1
2,37
8 1
2,41
8 1
2,46
5 1
2,52
0 1
2,57
8 R
wan
da 3
,363
3
,526
3
,633
3
,709
3
,777
3
,864
3
,974
4
,076
4
,198
4
,325
4
,450
4
,574
4
,698
4
,821
4
,947
S
eneg
al 3
,036
3
,111
3
,188
3
,272
3
,358
3
,448
3
,537
3
,642
3
,747
3
,859
3
,977
4
,103
4
,235
4
,373
4
,515
S
ierr
a Le
one
1,0
38
1,0
65
1,1
00
1,1
41
1,1
81
1,2
14
1,2
39
1,2
56
1,2
71
1,2
83
1,2
96
1,3
10
1,3
23
1,3
37
1,3
50
Sou
th A
fric
a 1
,483
1
,459
1
,435
1
,410
1
,379
1
,346
1
,314
1
,297
1
,268
1
,239
1
,209
1
,178
1
,147
1
,117
1
,087
S
outh
Sud
an 1
,679
1
,736
1
,792
1
,843
S
udan
5,8
98
5,9
63
6,0
25
6,0
88
Sw
azila
nd 1
48
147
1
45
144
1
42
141
1
40
139
1
39
139
1
39
138
1
38
138
1
37
Togo
1,1
19
1,1
39
1,1
61
1,1
82
1,2
04
1,2
27
1,2
49
1,2
71
1,2
95
1,3
20
1,3
46
1,3
73
1,4
01
1,4
30
1,4
59
Uga
nda
8,4
42
8,6
65
8,9
03
9,1
57
9,4
21
9,6
92
9,9
69
10,
275
10,
576
10,
885
11,
202
11,
526
11,
858
12,
197
12,
542
Tanz
ania
13,
549
13,
789
14,
064
14,
349
14,
648
14,
967
15,
309
15,
693
16,
084
16,
496
16,
928
17,
379
17,
851
18,
346
18,
865
Zam
bia
2,6
58
2,7
02
2,7
44
2,7
87
2,8
35
2,8
85
2,9
41
3,0
10
3,0
82
3,1
61
3,2
46
3,3
37
3,4
34
3,5
36
3,6
42
Zim
babw
e 3
,268
3
,270
3
,263
3
,246
3
,228
3
,211
3
,196
3
,182
3
,185
3
,204
3
,244
3
,305
3
,385
3
,477
3
,571

Email: [email protected]