AFFORDABLE HOUSING VIABILITY STUDY · affordable housing viability study. ... 7 Sutton Road Hall...
109
AFFORDABLE HOUSING VIABILITY STUDY OXFORD CITY COUNCIL June 2011
Transcript of AFFORDABLE HOUSING VIABILITY STUDY · affordable housing viability study. ... 7 Sutton Road Hall...

AFFORDABLE HOUSING VIABILITY STUDY
OXFORD CITY COUNCIL
June 2011

2
Contents
1 EXECUTIVE SUMMARY 3
2 INTRODUCTION 6
PART A
3 PROPERTY MARKET REVIEW 9
4 HOUSE PRICE FORECASTS 2010-2015 16
5 DEVELOPMENT FINANCE AND DEVELOPER CONFIDENCE 20
PART B
6 AFFORDABLE HOUSING DEFINITIONS 22
7 AFFORDABLE HOUSING NEED 24
8 PART B: CONCLUSIONS 31
PART C
9 PART C: INTRODUCTION 34
10 RESIDENTIAL METHODOLOGY – Private Units 35
11 RESIDENTIAL METHODOLOGY – Affordable Units 42
15 PART C: CONCLUSIONS 106
16 CONCLUSIONS 109
Appendices
Appendix 1 - Affordability charts
Appendix 2 - Summary of affordability need and location of existing affordable housing stock
Appendix 3 - Summary of Choice Based Lettings criteria
Appendix 4 - New build development in Oxford
Appendix 5 - Indicative unit values
Appendix 6 - Indicative £/sqft rates
Appendix 7 - Indicative affordable unit values
Appendix 8 - Financial modelling assumptions in relation to each site
Appendix 9 - Description of Existing Use Value (EUV) in relation of each site
Appendix 10 - S106 cost assumptions in relation to each site
Appendix 11 - Summary of appraisal inputs and outputs in relation to each site

3
1 EXECUTIVE SUMMARY
1.1 King Sturge has been instructed by Oxford City Council (OCC) to undertake an affordable housing viability study. This focuses on how affordable housing requirements impact on the viability of development in Oxford.
1.2 The report is divided into three sections – Part A which provides an overview of the property market; Part B which considers the affordable housing sector; and Part C which details the financial modelling.
1.3 Part A
1.4 The property market review concludes that Oxford has strong demand for all types of housing, as evidenced by the relatively high property values compared with other parts of the south-east. Whilst values appear to have been more resilient to the impact of the economic conditions over the last two to three years, the Oxford residential market broadly follows national trends which, in the main, is expected to improve in the period between 2011 and 2015. In terms of development finance and developer confidence, the evidence suggests that currently lenders are more willing to finance small housing schemes, as opposed to large housing or apartment-led schemes.
1.5 Part B
1.6 This section outlines the definitions of affordable housing and assesses the need for this by looking a number of sources. The three most common affordable housing tenures are social rent, shared ownership and intermediate rent.
1.7 The affordable housing sector in England is currently undergoing a period of reform, in terms of how it is financed, developed and regulated. This is as a result of the Comprehensive Spending Review (CSR), announced in October 2010, and the Localism Bill published in December 2010.
1.8 In essence, this means Social Housing Grant (SHG) is being reduced, whilst allowing Registered Providers (RPs) greater access to increased income from the rents charged from the new emerging affordable housing tenure to be known as ‘affordable rent’ -which will be in addition to the three existing tenures outlined above. We understand however that OCC will continue to prioritise the provision of social rent over other affordable products when negotiating planning obligations.
1.9 Based on data available from Hometrack as well as discussions with Registered Providers which are operational within Oxford and the Housing and Communities Department at OCC, the report demonstrates that affordability of housing is a major issue.
4
1.10 Part C
1.11 Part C relates to the testing undertaken to assess whether the provision of 50% affordable housing is viable, by using fourteen sample sites provided to us by OCC.
• The first model is based on a specified mix for each of the site which is fully compliant with the Balance of Dwellings SPD. Of the fourteen sample sites, nine are able to deliver 50% affordable housing on-site.
• The second model which considers the level of financial contributions that a development can support in-lieu of on-site provision, considers three different scenarios.
o The first scenario, which assumes 100% market housing on-site, and a financial contribution equivalent to the uplift in land value from a scheme comprising 50% affordable housing, suggests all the sites but one are viable.
o The second scenario, which is in accordance with OCC’s affordable housing policy and states the in-lieu payment equates to the cost of acquiring a site and the costs associated with developing it for affordable housing, suggests only two of the fourteen sites are viable.
o The third scenario, which is based on a contribution equivalent to 15% of the GDV, suggests eleven of the fourteen sites are viable.
1.12 Each model was based on a number of assumptions as set out within Part C. This includes no grant funding and full S106 costs. There are a number of factors which can have an impact on whether a scheme is viable or not. These include the number and type of dwellings, the size of the site, its location within Oxford, its existing use, the Code for Sustainable Homes level achieved and any abnormal costs.
1.13 Conclusion
1.14 The findings suggest that 50% affordable housing provision, with an 80:20 tenure split in favour of social rent, is achievable in most instances. As such, we recommend that the policy of 50% affordable housing provision applies on qualifying sites applies unless it is transparently demonstrated this level of affordable housing will jeopardise the financial viability of the scheme.
1.15 In assessing the viability of a non-policy compliant scheme, the applicant should provide a benchmark in the form of an Existing Use Value (EUV), or Alternative Use Value (AUV), against which the residual of the proposed development is assessed. For a scheme to be considered ‘viable’, it is generally expected that the residual value of the proposed scheme exceeds the EUV or AUV by an appropriate margin. However, there may be instances where the EUV/AUV is not exceeded for a justifiable reason – in these instances, the applicant’s reasoning should be fully substantiated.
5
1.16 The affordable housing sector is undergoing a significant period of change and it is too early to say what the full implications of these will be. At the time of writing, the detail relating to this tenure is still emerging. We therefore recommend that OCC keep any details or relevant changes to national planning policy, or the delivery of the proposed affordable rent regime under close review as work on the Development Plan Documents (DPDs) progresses.
1.17 In summary, King Sturge has undertaken a thorough assessment of housing viability in Oxford to inform OCC’s emerging affordable housing planning policy. We anticipate that this will in turn deliver the maximum number of affordable homes whilst achieving OCC’s wider goals.
6
2 INTRODUCTION
2.1 King Sturge has been instructed by Oxford City Council (OCC) to undertake an affordable housing viability study. The study focuses on how affordable housing requirements impact on the viability of development in Oxford. The key considerations informing the study relate to:
• The percentage of affordable housing that is viable on market-led, mixed tenure sites; and
• The size of site which triggers the requirement to provide affordable housing– this is referred to as the “site size threshold”.
2.2 The study also considers financial contributions in lieu of on-site affordable housing provision. This issue is particularly relevant to the smaller sites whereby the practicalities of delivering on-site provision are more challenging.
2.3 These issues form the main focus of the study, the aim of which is to provide robust and measured evidence to support the affordable housing policies within the emerging LDF Sites and Housing Development Plan Document (DPD).
2.4 The affordable housing study is underpinned by a bespoke financial model that has been designed to assess the financial viability of bringing residential development forward in Oxford. The financial model has been applied to a sample of fourteen actual development sites that have been selected to reflect the types of location that are being developed in Oxford.
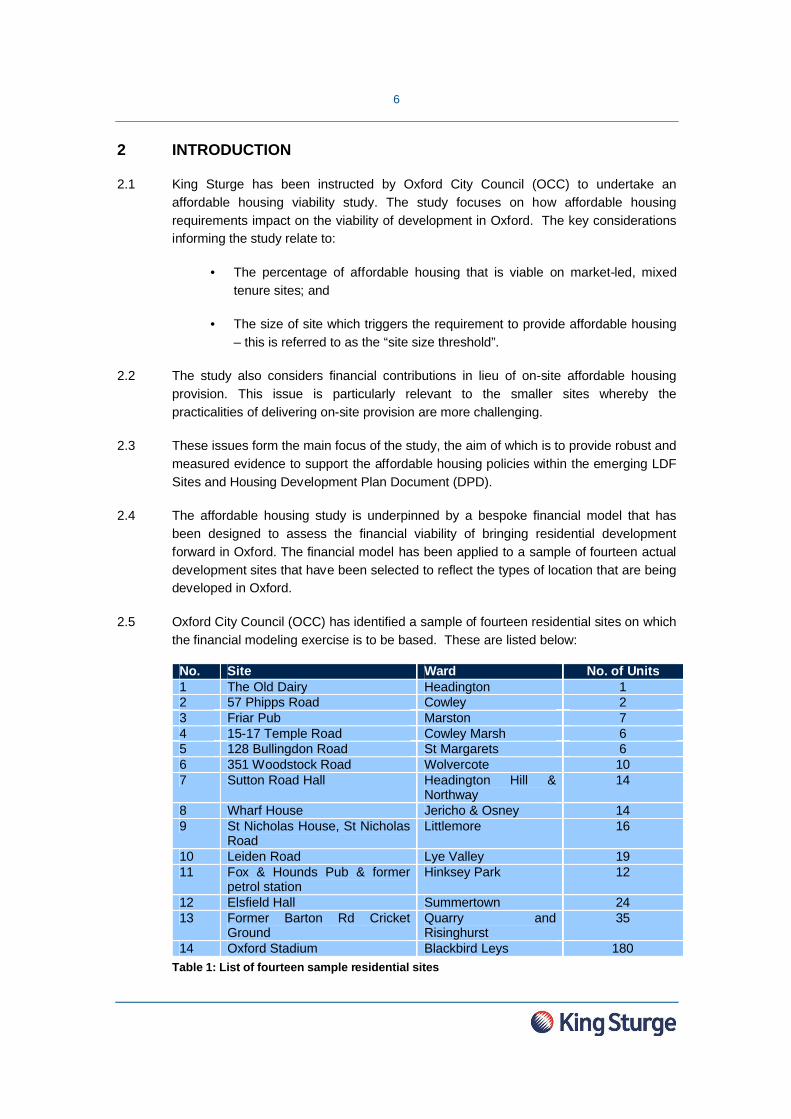
2.5 Oxford City Council (OCC) has identified a sample of fourteen residential sites on which the financial modeling exercise is to be based. These are listed below:
No. Site Ward No. of Units1 The Old Dairy Headington 12 57 Phipps Road Cowley 23 Friar Pub Marston 74 15-17 Temple Road Cowley Marsh 65 128 Bullingdon Road St Margarets 66 351 Woodstock Road Wolvercote 107 Sutton Road Hall Headington Hill &
Northway14
8 Wharf House Jericho & Osney 149 St Nicholas House, St Nicholas
RoadLittlemore 16
10 Leiden Road Lye Valley 1911 Fox & Hounds Pub & former
petrol stationHinksey Park 12
12 Elsfield Hall Summertown 2413 Former Barton Rd Cricket
GroundQuarry and Risinghurst
35
14 Oxford Stadium Blackbird Leys 180Table 1: List of fourteen sample residential sites

7
2.6 King Sturge has undertaken an assessment of residential values in the different wards across Oxford, in addition to considering affordability of housing based on household incomes and average entry level house prices. The model is also based on a range of other robust assumptions relating to the practicalities of delivering housing in the City.
2.7 This report provides a detailed assessment of the viability of affordable housing provision in Oxford, with financial analysis relating to the sample sites, to inform the conclusions.
2.8 The structure of the report is as follows:
Part A details the Oxford property market and how this relates to the wider regional and UK market (Section 2); the forecast for the property market from 2010 – 2015 (Section 3); followed by commentary of development finance and developer confidence (Section 4).
Part B relates to the provision of affordable housing within Oxford. Section 5 defines the different affordable housing tenures. Section 6 comprises an assessment of affordability and sets out the conclusions from discussions with Registered Providers of affordable housing, operational within Oxford and with OCC as Local Housing Authority (LHA). Section 7 concludes this section which details the emerging changes to the affordable housing sector.
Part C relates to the financial modeling used to test the viability of the proposed policy. Sections 9, 10 and 11 detail the methodology and assumptions used to determine the private housing values, affordable housing values and the financial model respectively. The results of viability analysis in respect of the fourteen residential sites are detailed in Section 12. Section 13 outlines the implications of financial contributions in-lieu of on-site provision. Section 14 outlines the conclusions from Part C.
Section 15 sets out our overall conclusions.
2.9 The Comprehensive Spending Review announced in October 2010, and the Localism Bill published in December 2010 has introduced reforms in terms of the how the affordable housing sector is financed, developed and regulated in England.
2.10 The research and analysis which supports this report was undertaken prior to the announcements regarding Affordable Rents, and it is still too early to say what the full implications of the changes will be. However, it is understood that OCC will continue to prioritise the provision of social rent over other affordable housing products when negotiating planning obligations - and the study reflects this. This includes the assumption of nil grant funding and full S106 costs.
2.11 Summary
2.12 On behalf of OCC, King Sturge has undertaken a thorough assessment of housing viability in Oxford. This will inform OCC’s emerging planning policy framework which

8
seeks to maximise the number of affordable homes delivered, whilst achieving a broad balance of housing types and tenures and optimising the energy efficiency and sustainability of new developments.
9
3 PROPERTY MARKET REVIEW
3.1 Introduction
3.2 Part A presents the context in which the affordable housing viability assessment has been undertaken. This analysis was completed incorporating data from the final Quarter of 2010.
3.3 Section 2, 3 and 4 considers the existing market at local and national levels as well as the relationship between the Oxford market and the wider property market in the UK.
3.4 Market Overview
3.5 In broad terms the residential market in Oxford has followed the trends seen elsewhere in Oxfordshire, the South East and the UK over the past three to five years. This broad trend was initially that of strong positive house price growth in the period building up to 2007 with high transaction levels. However, prices then fell and transaction levels slowed following the impact of the global credit crisis in late-2007. There is evidence that central Oxford was slower to suffer from the downturn and also that price falls were more muted than in many other locations, such evidence will be considered in detail in the following paragraphs.
3.6 The housing market in Oxford picked up in early 2009 and has remained reasonably strong until the final quarter of 2010, when a slight price fall has been experienced. There is evidence that some property prices in Oxford are back to around 2007 peak levels, this is a key distinguishing feature that differentiates Oxford from the market elsewhere in the UK.
3.7 The Oxford City Housing Market
3.8 We are able to provide commentary and statistics on the Oxford City housing market by using data provided by Hometrack1. With between one and three thousand property transactions a year, data series for Oxford should be regarded as reasonably robust and broadly reliable.
3.9 We have compared Oxford with Oxfordshire, the South East and England & Wales where appropriate. It should be noted that the source of the non-Oxford data is Land Registry so whilst broad comparisons between the datasets should be reasonably reliable, they are not directly comparable in terms of source information. The data we
1 It should be noted that when used for smaller geographical areas such as cities, Hometrack data is not as reliable/robust
as it is when applied to larger areas. This issue arises due to the smaller sampling size.

10
Average house price comparisons
0
50,000
100,000
150,000
200,000
250,000
300,000
350,000
400,000
Jan
02
Jul 0
2
Jan
03
Jul 0
3
Jan
04
Jul 0
4
Jan
05
Jul 0
5
Jan
06
Jul 0
6
Jan
07
Jul 0
7
Jan
08
Jul 0
8
Jan
09
Jul 0
9
Jan
10
Jul 1
0
Ave
rage
hou
se p
rice
(£)
Oxford Oxfordshire South East Eng & WalesSource : King Sturge, Hometrack, Land Registry
have from Hometrack on Oxford is only available for January and July each year and therefore any price change analysis uses only these dates for comparison purposes2.
3.10 The average house price in Oxford, at around £354,500, is more than twice the national average of £167,000. It is also significantly higher than the Oxfordshire average of £239,000 and the South East average of £212,000. These basic facts provide some illustration of the essential strength of the housing market in Oxford when compared to sub-regional and regional averages.
3.11 The average price of a residential property in Oxford increased from £200,000 in January 2002 to a peak of £343,000 in July 2008 but then fell back to £313,000 in July 2009 before increasing to £354,500 in July 2010. Such figures demonstrate the extent of the recovery in values experienced in Oxford during 2010 with values exceeding the 2008 peak.
3.12
Graph 1: Average house price comparisons
3.13 The key general trends in house prices in Oxford have been similar to broader markets in recent years. In particular, the city appears to have tracked the national trends in house price growth and declines. Such evidence is very important context to the
2 Please note that Hometrack data defines Oxford as the postcodes OX1, OX2, OX3 and OX4.

11
affordable housing study because it suggests that the housing market in Oxford is heavily influenced by wider macro-economic circumstances.
3.14 However, despite these general trends there are a few notable facts and differences relating to Oxford City which warrant further interrogation. The first difference is that the Hometrack data suggests that prices in Oxford continued to rise during the first half of 2008, when prices elsewhere were falling in the wake of the global credit crisis commencing in late 2007. Very significantly, prices in Oxford increased by an average 2.2% during the period January 2008 to July 2008, whereas there were price falls of between 3 and 5% in Oxfordshire, the South East and England & Wales. This trend is very important because it suggests that the market in the City was “decoupled” from wider trends (as manifested in the county, regional and national markets) during this short period.
3.15 Analysis also suggests that house prices in Oxford fell by less than other areas from the January or July 2008 peak and the low in July 2009. The average peak to trough price fall in Oxford was 8.7% between July 2008 and July 2009. This compares with the substantially higher 13.6% peak to trough decline in Oxfordshire, a 15.5% average fall in the South East and a 14.7% average drop in England & Wales although these falls were all for the period January 2008 and July 2009. Such statistics illustrate that Oxford broadly followed national and regional trends, but suggest that the City was clearlymore resilient in response to downward pressures on prices.
3.16 There is also evidence that the recovery in house prices since July 2009 has been stronger in Oxford compared to elsewhere. The average price increase from the July 2009 trough to July 2010 in Oxford has been 13.2%, notably higher than the 9.7% rise in Oxfordshire, the 9.4% increase in the South East and the 6.8% in England & Wales. This also highlights a broader trend that the recovery in house prices has been stronger in the south of England when compared to other regions, most notably in the north of England.
3.17 Analysis also reveals that the average house price in Oxford is now higher than it was in 2008 – a characteristic that has not been replicated in Oxfordshire, the South East or England & Wales and a clear example of the exceptional characteristics of the market in Oxford.
3.18 The aforementioned statistics suggest that the central Oxford residential market experiences a degree of “insulation” from external economic and sentiment factors. In broad terms the Oxford residential market still follows national and regional trends although the degree of price changes can be somewhat different. The relative market resilience experienced in Oxford when compared to other geographic areas is illustrative of the strength of the residential market in the area. In terms of investor/developer confidence, this relative strength can only be a positive thing.Ultimately, the downside risk of investing in Oxford should be perceived as relatively lowlevel when compared with other cities elsewhere in the country.

12
3.19 Very significantly, the resilience in the Oxford residential property market that has been identified through trends in Hometrack data and has also been endorsed throughinterviews with various estate agents in Oxford, who also unanimously confirmed a number of other traits of the residential markets in Oxford and of surrounding areas. The agents contacted in undertaking this exercise are as follows:
• Oakley, Buckell & Ballard
• Stuart Birkenshaw, Connells
• Edwin Allen, Chancellors
• Graham MacDonald, Kemp & KempDawn
3.20 Interviews undertaken during October 2010 confirmed the trend that the Oxford housing market was initially quite slow to react to the negative impact of the global credit crunch of late-2007. Indeed prices continued to increase in late-2007 and the first several months of 2008.
3.21 Interviews also confirmed that peak to trough price falls, which began in mid 2008 were less marked in Oxford than when compared to surrounding areas in Oxfordshire. A number of estate agents suggested that price falls of circa 20% were widespread in surrounding areas but that prices in central Oxford fell by closer to 10%.
3.22 The Oxford estate agent interviews additionally supported the view that some property prices in Oxford have recently returned to above peak 2007 levels. This is a clear example of a deviation from wider trends and a further example of the inherent strength of the residential development market in the City.
3.23 Local agents concurred that, fundamentally, there was a lack of housing in central Oxford and that this supply-side constraint exerted upward pressure on prices and contributed strongly to supporting property values - whatever the state of the wider economic landscape. Agents also stated that strong and sustained demand from the professional employment sector within Oxford also supported prices. Notable employers such as the NHS hospitals, the universities, science parks and automotive industries provided a steady turnover of staff and hence property demand.
3.24 Overall, this analysis of recent residential property values in Oxford has illustrated some very important market dynamics. Most importantly, whilst Oxford broadly follows national trends, there is also clear evidence of a degree of “insulation” in Oxford from macro-economic trends for the economy at national level. Such evidence will have a positive impact on investor confidence and should ultimately result in relatively good values and high volumes of applications and completions.
3.25 Such evidence also suggests that it is reasonable to take a ‘bullish’ approach when calibrating any national or regional intelligence to the Oxford City context. For example issues such as developer profit margins, finance rates and consultants fees can all be

13
adjusted to account for the perceived risk of developing in a particular location, the assumptions in the financial model have been specifically tailored to the Oxford context whilst ensuring that conservative approaches are taken to ensure a robust policy evidence base.
3.26 Oxford City Housing Market Detail
3.27 Having provided some details on overall price trends in Oxford, the following paragraphs drill down and provide some additional background and detail relating to the specifics of the local market. The details will be used to form an opinion on the per sq ft values for the different types of residential property that will be appraised through the financial modeling exercise.
3.28 The chart below shows how the typical price per sq ft has changed over the past few years. The average price is presently £297 per sq ft and has increased from £255 per sq ft over the past year.
Oxford City average house prices (£psf)
0
50
100
150
200
250
300
350
400
Jan
02
Jul 0
2
Jan
03
Jul 0
3
Jan
04
Jul 0
4
Jan
05
Jul 0
5
Jan
06
Jul 0
6
Jan
07
Jul 0
7
Jan
08
Jul 0
8
Jan
09
Jul 0
9
Jan
10
Jul 1
0
£psf
Average (£psf)Source : King Sturge, Hometrack
Graph 2: Oxford City average house prices
3.29 The average price of a detached house in Oxford is currently £594,000 and this has increased from £526,000 at the beginning of 2010. A typical semi-detached house is now selling for £386,000, a terraced house £333,000 and a flat/maisonette for £231,000.

14
Oxford City average house prices by property type (1)
0
100,000
200,000
300,000
400,000
500,000
600,000
700,000Ja
n 02
Jul 0
2
Jan
03
Jul 0
3
Jan
04
Jul 0
4
Jan
05
Jul 0
5
Jan
06
Jul 0
6
Jan
07
Jul 0
7
Jan
08
Jul 0
8
Jan
09
Jul 0
9
Jan
10
Jul 1
0
£
Flats/Masionettes Terraced Semi-detached DetachedSource : King Sturge, Hometrack
Graph 3: Oxford City average house prices by property type
3.30 The average price of a one bedroom flat in Oxford is currently £178,000 while a two bedroom flat is selling for £248,000. A typical two bedroom house is now selling for £268,000, a three bedroom house £314,000 and a four bedroom house for £508,000.
3.31 This information is invaluable in understanding the values for the different residential development sites that will be appraised. However, it needs to be combined with some assessment of value geographies in different neighbourhoods across the Oxford, before any final assumptions for the financial model are confirmed.
3.32 The Oxford Housing Market in Q4 2010
3.33 As per the analysis of recent trends, the current housing market in Oxford is exhibiting several similar traits to the wider UK and regional housing markets.
3.34 For example, there are signs that the UK housing market rally during much of 2009 and the first half of 2010 has come to an end. Government austerity measures and the2010 Budget, as well as further concerns surrounding global and European economies, have dampened demand while the abolition of HIPS has led to a rise in properties coming to the market (with this supply-side change creating downward pressures on values). Consumer confidence has also weakened during this time, due to concerns over the threat of a double-dip recession occurring as a consequence of the retrenchment in public expenditure.

15
3.35 Current market conditions have meant that UK house prices are now falling despite strong price rises during Q2. The three month trend in UK house price growth, the most reliable measure of current house price movements, turned negative in August. This was the first time it had descended into negative territory since February 2010.
3.36 Local estate agents confirmed that average residential prices in Oxford had fallen marginally in recent months suggesting that Oxford was following the broad UK trend of house price falls noted above.
3.37 Mortgage lending in the UK slowed only marginally in July and has been broadly stable for over a year now. The level of mortgage approvals, at 111,000 a month, is around 62% below the 2006 average and 55% below the average of the ten years 2000-2009. (Source: Bank of England (BoE) mortgage lending data non-seasonally-adjusted).Such figures demonstrate the extent to which lending conditions have tightened since the “credit crunch” in late 2007.
3.38 Summary on the Residential Property Market
3.39 This section has explored the residential property market in Oxford in detail. It has demonstrated that whilst the residential market tends to broadly follow national trends, there are certain unique features of the market which suggest that Oxford is “insulated” from wider economic and market conditions.
3.40 This identified “insulation” phenomenon and the general strength of the market in Oxford has implications for the financial appraisal of affordable housing policy options in Oxford and the appropriateness of policy solutions.

16
4 HOUSE PRICE FORECASTS 2010-2015
4.1 Introduction
4.2 This section provides an indication of likely future trends in house price growth. This evidence is relevant to the applicability of affordable policy solutions in the future.
4.3 House Price Forecasts
4.4 The outlook for UK house prices over the next 18 months is quite weak. Although the economy is expanding again following the domestic economic recession and global credit crisis, a raft of government austerity measures as well as restrictive mortgage lending conditions are unlikely to be supportive of strong positive house price growth.
4.5 Around half a million public sector jobs are expected to be lost over the next few years with a knock on impact on the private sector too. Higher taxation and public sector pay freezes will also conspire to constrain household confidence.
4.6 Our central forecast is that UK house prices will fall slightly on average during the second half of 2010 leaving price growth for the year as a whole at around 0%.
4.7 2011 is also likely to be a challenging environment for the housing market as the UK slowly emerges from recession and is constrained by government austerity measures;2011 could also see the base rate start rising again. We expect UK house prices to be broadly flat during 2011 as a whole.
4.8 We see the medium-term outlook for house prices as more positive. We expect price growth to accelerate as the widening supply and demand gap exerts its influence on pricing and the improving UK economy provides greater demand and support to prices. UK house prices are forecast to rise by 3-6% pa during 2012-2015 with London and the South seeing higher growth.
4.9 In the early years of our forecast (2010-2012) we believe that the downside risks slightly outweigh the upside risks, but in the later years (2013-15) we believe that the upside risks are greater and that house price growth could easily be stronger than in our central forecast.
4.10 We expect average house prices in southern England to grow slightly faster than the UK over the next five years as the supply constraints and the stronger economic and demand profile exert their influence on the market.
4.11 We would expect house prices in Oxford to follow a similar pattern to that of the South. Given the slightly more robust behaviour of Oxford prices compared to regional prices it could be argued that Oxford house price growth will be around 1-2% higher than the South average presented below. On balance, however, we recommend using the forecasts for the South for Oxford. This represents a very conservative and robust base position for the financial modeling exercise.

17
4.12 A summary of our UK and regional house price forecasts is shown in the table and chart below.
2010 2011 2012 2013 2014 2015
UK 0% 0% 3% 5% 6% 5%
Greater London 2% 3% 7% 9% 9% 7%
South 1% 1% 4% 6% 6% 5%
Midlands & North -1% -2% 1% 4% 5% 5%
Table 2: UK and regional house price forecasts
UK residential price forecasts
-20
-15
-10
-5
0
5
10
15
2007 2008 2009 2010 2011 2012 2013 2014 2015
% c
hang
e pa
Source : King Sturge
Graph 4: UK residential price forecasts
4.13 The table and charts below illustrate the lower and upper case scenarios for house price growth in the South, which we believe are appropriate lower and upper case scenarios for house price growth in Oxford.
4.14 Although we believe that midland and northern regions are more vulnerable than southern regions to house price falls over the next few years, there remains a significant risk that house prices in the south could fall during 2011. Given this scenario 2012 is likely to be a mixed year with some price falls and some price rises

18
with sustained positive price growth not returning until 2013. This is our lower case scenario.
4.15 Although there is presently plenty of negative and downbeat news surrounding the economy and house prices, we have seen in the past how resilient the housing market can be. It is quite plausible that house prices could continue to rise modestly over the next couple of years and that price growth could accelerate stronger in the latter part of our forecast period. This is more likely to be the case in southern locations due to stronger economic profile reasons while the undersupply of housing issue is likely to build as time passes and provide upward pressure on house prices during the latter part of the forecast period. This is our upper case scenario.
4.16 Our scenario forecasts also reflect that we believe there is slightly greater downside risk to our central case forecasts than upside risk, especially in the first 2-3 years.
4.17 A summary of our central case, lower case and upper case scenarios for house prices in the South and Oxford are shown in the table below.
2010 2011 2012 2013 2014 2015
South/Oxford – Lower case -1% -3% 0% 3% 4% 3%
South/Oxford – Central case 1% 1% 4% 6% 6% 5%
South/Oxford – Upper case 3% 3% 6% 7% 8% 6%
Table 3: House price forecast for Oxford
4.18 A graphical illustration of house price forecasts is presented below.
Residential price forecast scenarios – South/Oxford
-4
-2
0
2
4
6
8
10
2010 2011 2012 2013 2014 2015
% c
hang
e pa
Lower case Central case Upper case
Source : King Sturge
Graph 5: Residential price forecast scenarios – South/Oxford
19
4.19 Summary on Price Growth Forecasts
4.20 Or central case, lower case and upper case scenarios for house prices in the South and Oxford show that in the main residential values are expected to increase in the period to 2015. The forecasts of revenue growth inform our conclusions on the viability of affordable housing requirements in this study.

20
5 DEVELOPMENT FINANCE AND DEVELOPER CONFIDENCE
5.1 Development Finance Market
5.2 In broad terms the marketplace for housing development finance is currently quite restrictive but within this there are a number of key trends and characteristics.
5.3 Lenders are generally far happier to finance housing schemes as opposed to apartment developments. When they will consider apartment schemes they favour small schemes of 10-15 units, but will give greater consideration to larger schemes if they have significant commercial elements such as a Tesco or a Sainsbury’s on the ground floor. There are very few lenders in the market for apartment led schemes and their rates and fees are not attractive.
5.4 On housing schemes, as opposed to apartment schemes, housebuilders with rolling finance facilities are often quite confident in progressing developments. They are far happier to progress developments that offer greater certainty of selling completed units whilst more marginal schemes remain on the sidelines. Several housebuilders are prepared to progress small developments but larger schemes are less likely to progress.
5.5 Aside from the main housebuilders, a few lenders will consider financing small housing schemes but again are significantly more cautious about anything on a larger scale.
5.6 Looking forward, we believe that banks will remain cautious regarding lending. They consider themselves over-exposed to property and are very conscious of the downside risks. We believe they will maintain this approach until such time as they perceive themselves as missing out on favourable opportunities and this could be sometime after the residential market has had an established period of recovery and stability.
5.7 Qualitative Commentary on Developer Attitudes
5.8 At national level, the attitudes of developers regarding the medium to long term prospects for the housing and property markets in the UK are starting to recover from the trough in confidence that was apparent during the worst of the recession. The prevailing attitude is best described as a state of ‘cautious optimism’. This term captures the emerging confidence in the economic recovery, coupled with some residual nervousness, which is further fuelled by the Coalition Government’s stance on the retrenchment in public expenditure.
5.9 On the fringes of mainstream opinion there are a minority of developers that continue to be very nervous regarding the threat of a ‘double-dip’ recession, resulting from reduced public expenditure. However, counterbalancing such attitudes a small number of developers remain very bullish about medium to long term market growth.

21
5.10 In this context, those larger house-builders with more healthy balance sheets are tentatively returning to the market, particularly in those areas particularly in the South East where values have been relatively high historically. In addition, small-medium sized developers specialising in schemes of less than 15 dwellings (in higher value locations across the South East) appear to be increasingly active.
5.11 As discussed in the preceding paragraphs the residential development market in Oxford exhibits various characteristics that are unique to the City. In particular the city has been identified as being “insulated” to some degree from wider trends at macro-economic level.
5.12 This “insulation” has a positive impact on developer confidence in Oxford. This is clearly reflected by the fact that average residential property values have returned to pre-2007 high.
5.13 Summary
5.14 The commentary on development finance and developer confidence has informed the assumptions and inputs in our financial model. Most importantly, we have based finance rates and developer profit margins which are in keeping with the wider financial market sentiment at the time of writing.

22
6 AFFORDABLE HOUSING DEFINITIONS
6.1 Introduction
6.2 This section provides definitions of affordable housing and the different tenures.
6.3 PPS3 Housing states that, “Affordable Housing includes social rent and intermediate housing, provided to specified eligible households whose needs are not met by the market. Affordable housing should:
• Meet the needs of eligible households including availability at a cost low enough for them to afford, determined by local incomes and local house prices; and
• Include provision for the home to remain at an affordable price for future eligible households or, if these restrictions are lifted, for the subsidy to be recycled for alternative housing provision.”
6.4 We understand that further to this, the definition of affordable housing within OCC’s LDF Core Strategy is, “Dwellings at a rent or price that can be afforded by people who are in housing need and would otherwise be accommodated by the Council.’
6.5 Definition of Affordable Housing Tenures
6.6 For each of the sample sites, we have considered social rent, shared ownership and intermediate rental values. Whilst OCC’s current planning policy only makes explicit reference to social rent and shared ownership, intermediate rent is also included within our assessment. Brief descriptions of these three types of affordable tenure are outlined below.
6.7 Social Rent – This is rented housing which is owned and managed by the local authorities and Registered Providers. The guideline target rents are regulated by the Homes and Communities Agency (HCA) and are determined through a national rent regime. Rents differ depending on location within England, unit size, market value of the unit, and relative county earnings. The rents are also subject to a rent cap which is set by the HCA and tracks Retail Price Index (RPI) + 0.5% per annum. This type of tenure may also include rented housing owned or managed by other persons and provided under equivalent rental arrangements, as agreed with the local authority or the Homes and Communities Agency (HCA) as a condition of Social Housing Grant (SHG).
6.8 Shared Ownership – This tenure is generally aimed at first time buyers who are unable to purchase the 100% interest of a property. Shared ownership schemes enable purchasers to acquire a 25%-75% interest stake in their home, and often include options which enable homeowners to increase their interest over time by staircasing (the process of acquiring greater proportions of equity). The purchaser typically pays a mortgage on the share of the property which they own, and rent to the RP, which is generally charged at a rate of up to 2.75% of the unsold equity. We understand that

23
within Oxford, all shared ownership units must initially be offered on the basis of a 25% equity stake and forms the basis of the assumptions set out in Section 9, 10 and 11 of this report.
6.9 Intermediate Rent – This form of tenure enables new or refurbished properties to be rented at more than social rent rates, but less than Market Rent (MR). The amount a tenant pays is generally related to specific affordability criteria set by each local authority, though the HCA states this should be about 80% of what would be paid to a private landlord. This type of tenure is often associated with key worker accommodation but there are a range of products associated with this tenure which enable tenants to occupy certain dwellings and/or acquire an equity stake in a property after a given time period.
6.10 Following the Comprehensive Spending Review announced last October, and the Localism Bill published in December, the affordable housing sector is undergoing a process of reform. The significance of this is discussed in further detail in Section 7. A result of these announcements is the emergence of a new affordable tenure.
6.11 Affordable Rent – As set out in PPS3, this tenure is defined as, “Rented housing provided by registered providers of social housing, that has the same characteristics as social rented housing, except that it is outside the national rent regime, but is subject to other rent controls that require it to be offered to eligible households at a rent of up to 80% of local Market Rents”.
6.12 OCC has expanded on this definition, drawing on the more detailed guidance contained in HCA’s Affordable Housing Framework 2011-15. OCC’s definition is as follows:“Affordable Rent units have similar characteristics as social rent housing, except that it is outside the national rent regime, thus subject to other rent controls that require it to be offered to eligible households at a rent of up to 80% of local market rents, on a minimum two year fixed tenancy. Providers will be expected to consider the Local Housing Allowance for the area and any cap on total household benefit payments when setting rents.”
6.13 The research and analysis for this report was undertaken prior to the announcements relating to the proposed new affordable housing tenure, ‘Affordable Rent’. At the time of writing, the detail relating to this tenure is still emerging. We therefore recommend that OCC keep any details or relevant changes to national planning policy, or the delivery of the proposed affordable rent regime under close review as work on the Development Plan Documents (DPDs) progresses.

24
7 AFFORDABLE HOUSING NEED
7.1 Oxford is a desirable but expensive place in which to acquire a property. Access to affordable homes can be an issue for many people. The socio-economic data and conclusions from discussions with RPs who are operational within Oxford, presented within this section, illustrate the need for and the importance of, affordable housing within the city.
7.2 Affordability Methodology
7.3 This section considers the affordability of homes within Oxford.
7.4 Socio-economic data from Hometrack (November 2010), provided the evidence base upon which an affordability analysis was undertaken for Oxford as a whole, in addition to each of the individual 24 wards.
7.5 Using this data, we were able to determine what salary a first time buyer or householdwith:
• a mortgage based on 3.5 times the total salary; and
• a 25% deposit;
would require in order to purchase an ‘entry level flat’ in each ward.
7.6 An ‘entry level flat’ is defined as an average lower quartile value flat within the specified area. Hometrack has calculated this based on historic sales data by dwelling type.
7.7 According to Nomis (2009), the average gross weekly earning for full time workers who live in Oxford is £495.90 per week. This equates to an average earning of £25,786 per annum.
7.8 Results
7.9 The analysis shows that in all of Oxford’s 24 wards, in accordance with the assumptions listed in paragraph 6.5, an entry level flat is unaffordable for a first time buyer on an average salary.
7.10 The data collated enabled the percentage of households within each ward with earnings of less than £25,000 pa to be identified, in addition to the number of households with above average earnings but less than that required to acquire an entry level flat. Collectively, these figures equate to the number of households within each ward which are currently unable to purchase an entry level flat – the number unable to acquire an entry level family sized house is inevitably higher.
7.11 The graph below is representative of affordability within Oxford, by showing the numberof households and the average earnings needed in order to acquire an average entry level property.

25
Graph 6: Affordability of housing within Oxford
7.12 In accordance with paragraph 7.5, the pie chart below shows that of the 70,823 households (Hometrack, 2010), within Oxford3:
3 We understand that OCC’s Council Tax records show 58,594 households within Oxford. We therefore assume that the total number of households as listed on Hometrack includes student accommodation. In any event, this analysis does not affect the financial modelling and conclusions of this report.

26
• 38% earn less than £25,000 per annum; and
• 30% earn more than the average salary but less than the salary required (£35,000-£40,000) to purchase an average entry level flat (£163,333) in Oxford.
This suggests that affordability of housing is an issue for 68% of all households in Oxford.
Oxford
38%
30%
32%% of households withearnings <£25K
% of households withearnings £25K> but <than entry level for flat% of households withearnings above entrylevel for flat
Graph 7: Graph to demonstrate affordability of housing within Oxford
7.13 Please refer to Appendix 1 for pie charts and affordability graphs in respect of all 24 wards within Oxford. Please refer to Appendix 2 and 3 for commentary in relation to affordable housing need and where existing affordable housing slock is currently situated.
7.14 Discussions with Affordable Housing Providers
7.15 In addition to extensive research of the Oxford property market, we held discussions with the following five RPs which are operational and recognised within the city, during November 2010.
• A2Dominion • Catalyst Housing Group • Oxford Citizens Housing Association • SOHA • Thames Valley Housing Association
7.16 The primary objective of the discussions was to obtain an understanding of how the RPs perceive affordable housing delivery within Oxford. The questions were focused around a number of key topics including the RPs’ view on existing planning policy; the constraints that they, and developers, currently face when delivering affordable housing;

27
the different affordable tenures which are available; issues regarding the management of affordable units post construction, and what could be done differently in future.
7.17 Summary of Discussions
7.18 We have collated the transcripts from the discussions and summarise the key themes below.
7.19 Planning – The RP’s are of the opinion that the requirement for 50% affordable housing is too high. In their opinion, the requirement currently impinges on the viability of development and dissuades developers from either bringing schemes forward or progressing new opportunities within Oxford. Whilst it is appreciated that if this threshold was lowered, less affordable housing would be delivered compared with the existing policy - in reality, it may actually increase the number of affordable homes which are being brought forward.
7.20 RPs are of the view that the Balance of Dwellings Supplementary Planning Document (SPD) is not sensitive to market and commercial conditions. For example, imposing the requirement for affordable family dwellings on city centre sites is considered to be restrictive and not a reflection of what is most appropriate for this area. In the RPs’ opinion, this SPD further dissuades developers from either bringing schemes forward, or pursuing new development opportunities. The RPs feel that there should be greater case-by-case consideration given to development schemes, and that the proposed mix of dwellings should be addressed relative to the context of the site.
7.21 Rather than the Council seeking to prescribe the number and type of units, the RPs feel more affordable housing would be delivered if developers had greater freedom to determine the mix of dwelling types and tenures for their site. The developer should then justify this by submitting a comprehensive viability assessment as part of pre-application discussions and/or the planning application. The assessment can subsequently be interrogated by the Housing and Planning Teams and their advisors.
7.22 Tenure Split – The existing policy has a strong emphasis on social rent, for which the RPs agree there is a pronounced need. However, where shared ownership units have become available, these have proved to be very successful with units selling extremely quickly. Given the current uncertainty following the Comprehensive Spending Review and what this means for rents in addition to Social Housing Grant (SHG), there is a shared view amongst the RPs that OCC will need to take a more flexible approach when considering affordable tenures within the context of proposed residential developments. A more flexible approach may also help the viability of developments and therefore encourage developers to bring forward schemes and progress new opportunities.
7.23 The RPs state that two bedroom units, specifically two bedroom houses are the most popular type of home for shared ownership. They are of the view that larger family units do not work for shared ownership on the grounds of affordability.

28
7.24 Sustainability - In terms of construction, the RPs consider that units built to Code Level 4 are adequate and deliverable in commercial terms. By imposing a higher code level requirement, there is a concern that the additional related cost will impinge on the number of affordable homes which can be delivered. Whilst it is acknowledged that there are schemes within wider Oxfordshire which are built to a higher code level, for example A2D’s Ecotown (Level 5), this is likely to only be achieved as a result of cross-subsidy from the private element of the scheme.
7.25 Management - RPs are of the view that neither they, nor developers, favour true pepper potting of affordable units within developments, as owner-occupiers as well as tenants feel equally unsettled by the mix of occupiers. In terms of managing the affordable units post construction, they prefer small ‘clusters’ of affordable units.
7.26 Further, from a management point of view, early consultation and involvement between the developer and RPs is essential to the success of the scheme.
7.27 In summary, the RPs agree that demand for affordable homes in Oxford currently greatly exceeds supply. However, they are of the view that a requirement for 50% affordable is too high and the difficulties this creates are compounded by the 80:20 tenure split in favour of social rent units, in addition to the requirements set out within the Balance of Dwellings SPD.
7.28 Going forward, the RPs are of the view that OCC needs to be more flexible and have a greater willingness to depart from policy where commercial viability dictates that a policy-compliant scheme is not deliverable. Whilst this approach may mean less affordable housing is delivered in comparison to a theoretical policy compliant scheme, in reality it may be more likely that a greater number of units are brought forward.
7.29 Discussion with OCC Head of Service, Housing and Communities Department
7.30 Further to the conversations conducted with RPs which are operational within Oxford, we held a discussion with the OCC’s Head of Service within the Communities and Housing Department in May 2011.
7.31 As with the discussions with RP’s, the primary objective of this conversation was to obtain an understanding of how the Council department which specifically deals with affordable housing provision in Oxford perceives the delivery of this. A summary of the topics covered is as follows:
7.32 Planning - The Community Housing Service considers the target of 50% affordable housing provision to be challenging, but necessary. To achieve this, they have where possible, endeavoured to work with RP’s to assist them in obtaining grant funding as well as contributing Council funds to enable the acquisition of land or completed units. This approach has enabled OCC to deliver over 1,200 affordable units in Oxford since 2004.

29
7.33 They are of the opinion that the Balance of Dwellings SPD is a mechanism which ensures the delivery of unit types which are most needed i.e. family accommodation. This results in the reduced likelihood of a potential surplus of dwelling types for which there is less demand - for example, one bedroom flats. However, OCC recognises the mix contained within the SPD is not appropriate in every instance and they have taken a more flexible approach to address a specific need in a certain location if required.
7.34 Tenure and Unit Type - There is a high demand for social rent units within Oxford, and they therefore consider the tenure split of 80:20 in favour of social rent is the most appropriate target mix. However, they do appreciate there is an unsatisfied demand for shared ownership homes within Oxford.
7.35 In terms of preferred social rent unit types, those which are most in demand are two -four bedroom houses. That said, there is also a demand for homes in excess of four bedrooms.
7.36 With regard to shared ownership, the traditional one and two bedroom flats continue to be popular. The view is that demand for larger shared ownership units remains relatively untested, but the Housing and Communities Department is of the opinion it is likely there would be demand for these should they be forthcoming.
7.37 Despite the high number of Keyworkers employed within Oxford, the Housing and Communities Department is of the opinion that accommodation aimed specifically at this group is not in high demand. They attribute this mainly to the relatively high costs which the occupier incurs in this type of accommodation. As a result, it is more cost effective for the potential occupier to either acquire a shared ownership unit or rent within the private market.
7.38 Management - The Housing and Communities Department does not have a firm view on how affordable units should be managed on the basis that every scheme is different. However, since the introduction of Choice Based Lettings system, they are of the view there has been a decrease in management issues and voids. The Housing and Communities Department is also aware of RP’s preferences in terms of management, such as entrances which are tenure specific and clustering of different tenures. As such, OCC prefer to consider management issues on a scheme by scheme basis.
7.39 Sustainability - OCC are keen to maximise the number of affordable homes provided whilst promoting environmental awareness and reducing costs for occupiers of affordable housing. However they recognise that delivering housing at Sustainable Code for Homes Level 4 and 5 results in increased build costs. As such, they support sustainability initiatives wherever possible but appreciate that in the short to medium term, the costs may limit opportunities to deliver affordable homes which achieve the highest Code Level.
7.40 Overall, the Housing and Communities Department is of the opinion that the current policies help to ensure affordable housing need continues to be addressed within

30
Oxford. However, there is an appreciation that there may be instances when a more flexible approach is required as a result of specific site or scheme issues.
7.41 Summary
7.42 The socio-economic data and discussions with RP’s which are operational within Oxfordand the Head of Service within OCC’s Communities and Housing Department,demonstrates there is a clear need for the provision of affordable housing within the city.

31
8 PART B: CONCLUSIONS
8.1 Future Changes to Affordable Housing Sector
8.2 As this report relates to the development of affordable housing policy, we can not consider the policy proposal without commenting on the proposed changes to the social housing policy, which will change the face of its composition as it is currently known.
8.3 The affordable housing sector is undergoing a process of reform in how social housing is financed, developed and regulated in England. This is as a result of the Comprehensive Spending Review announced in October 2010, and the Localism Bill published in December. Together, these two programmes will introduce the greatest changes since private finance was introduced to the sector in the 1988 Housing Act.
8.4 In essence, public subsidy in the form of Social Housing Grant (SHG) is being reduced, and replaced by allowing Registered Providers (RPs) access to increased income from rents charged, and therefore more private borrowing.
8.5 Capital spending on affordable housing has been roughly halved for the Spending Review period, 2011-15 compared with the previous programme for 2008-11 – from £8.4bn and £4.5bn. Of this latter amount, about half is already allocated to specific schemes that should be delivered on site in 2011 and 2012. The real amount therefore left available for new grant allocations, is much lower than in recent years, and is likely to be weighted towards the end of the review period, in 2013-15.
8.6 The key compensating reform is the introduction of “Affordable Rents” that will be set at up to 80% of market rents. These will be much higher in most areas, certainly in London and the South East, than social rents set under the existing “target rent” regime.
8.7 However, not all RPs will be allowed to charge these higher rents – access to higher rent levels will be restricted to HCA development partners who, under new “investment contracts”, will be able to charge Affordable Rents on newly developed properties, and potentially also on a proportion of their relets of existing homes. Access to SHG will also be limited to these development partners.
8.8 The new investment contracts will be negotiated individually between RPs and the HCA, and seem likely to create a system in which developing RPs each have to work to slightly different sets of rules for their development programmes. No details of these contracts are available at the time of writing, and no details of the new grant rates have been published.
8.9 Nevertheless, the Spending Review introduced a new target of 150,000 new affordable homes over the 2011-15 period, which on average is slightly ahead of the actual delivery of new affordable homes last year, when average grant rates were much higher. The government recognises that the need for more affordable homes is becoming ever more acute. Demand is high and rising, but supply is very low.

32
8.10 When Affordable Rents are charged, and where these are higher than current social rents, the value of social housing properties (assessed on the basis on Existing Use Value for Social Housing or EUV-SH), is likely to increase. In London and the South-East, we think such increases could be very significant.
8.11 However, there will be factors at work to constrain any potential increase in values. Higher rents will only flow from new tenants and not existing, so the increase in income will be limited and gradual. Whilst higher rents will mean higher net incomes, RPs are likely to experience an increase in their operating costs under the Affordable Rent regime, and may also see reduced re-let rates, higher voids, and higher risk in their cashflows, leading to higher discount rates in social housing valuations.
8.12 In parallel with the rent reforms, the government is also introducing reform of housing tenancies, housing benefit and the wider welfare system. Its aims are to improve the ability of people on housing waiting lists to access affordable homes; to cut the total housing benefit bill; and, in the longer term, to limit the total amount any one person or household can receive in benefit.
8.13 In particular, new social housing tenancies will be for fixed terms, rather than for life. There will be new caps on housing benefit introduced in April; and Local Housing Allowances will be set at a maximum of the 30th percentile of local market rents, compared with the 50th percentile under the current system. It will therefore not be simple for RPs as going straight to 80% of market rent in all areas.
8.14 All these changes are currently the subject of emerging government guidance and are under review by RPs, local authorities and funders in the housing sector. At the time of writing, it is therefore too early to assess with confidence any potential increase in value or planning negotiations at this stage, by either RPs, developers or local authorities.
8.15 With this in mind, our conclusions based on what is known regarding affordable housing provision, as set out in Section 6 and 7, are as follows:
8.16 Flexibility
8.17 Given the shortage of suitable development land within Oxford, the issues associated with affordability, the current uncertainty in relation to rents for social units and the availability of grant funding, a more flexible approach will be need to be taken by all parties involved in the development process to ensure the delivery of affordable housing.
8.18 A practical and flexible approach will need to be taken regarding the viability of proposed residential schemes. If not, there is a risk that significantly less development will be brought forward and as such, a very limited amount of affordable housing will be delivered as part of private schemes.
8.19 A flexible approach will also need to be taken when considering which affordable tenure is most appropriate for each site. Demand for social rent and shared ownership units is
33
likely to remain high, and following the CSR, the provision for the new affordable rent tenure will enable some of the need to be addressed.
8.20 Affordable Tenures
8.21 There is high demand for social rent units within Oxford. Of this type of tenure, one and two bedroom properties are in the highest demand, but there is also a clear need for family accommodation.
8.22 There is also high demand for shared ownership units within Oxford. Whilst one bedroom units are popular, two bedroom units are the most in demand. Properties with three or more bedrooms are generally not considered to be suitable because of local affordability levels.
8.23 Affordability
8.24 Given the shortage of suitable development land within Oxford, the affordability of housing is a significant issue. As a result, there is high demand for all types of affordable tenure within the city including social rent, shared ownership and intermediate rent. This in turn means a robust affordable housing policy is required.
8.25 However, as demonstrated earlier within the report, there are differences between the 24 wards in Oxford. The research we have undertaken suggests that a policy which is both more responsive to the needs of these smaller areas within the city, and one which will acknowledge tenure and dwelling mix on a case by case basis may prove more effective.
8.26 Summary
8.27 As identified within this report, there is a clear need for affordable housing within Oxford but pronounced challenges face its future delivery. Greater flexibility, increased emphasis on case-by-case scrutiny and an awareness of commercial implications for development are fundamental.

34
9 PART C: INTRODUCTION
9.1 This section outlines the methodology, outputs and conclusions in relation to the financial modelling exercise.
9.2 The section first addresses the methodology in relation to how the private residential values, the affordable unit values and the Existing Use Values have been assessed. This is followed by an explanation of the method used in respect of each policy option and the assumptions used within the financial model (Section 10, 11 and 12).
9.3 Section 13 outlines the results of the viability analysis for each of the fourteen sample residential sites. Section 14 details the conclusions relating to the financial contributions in-lieu of on-site provision.
9.4 Section 15 sets out the conclusions and recommendations from the viability work undertaken.

35
10 RESIDENTIAL METHODOLOGY – Private Units
10.1 Introduction
10.2 This section of the report outlines the general trends associated with market values. In order to ensure robust inputs into the financial viability model, a more detailed profile of private residential values in Oxford has been built up as based on our knowledge as at November 2010.
10.3 As with any city, the values in Oxford vary significantly depending upon the specificlocality. Within our assessment, we have scrutinised evidence at micro rather than macro levels, in order to provide the most accurate depiction of both the city’s private and affordable residential unit values. This is explained in more detail below.
10.4 Scope of the Market Value Assessment
10.5 The City of Oxford comprises the following 24 wards:
Table 4: Electoral wards within Oxford
Barton and Sandhills Littlemore
Blackbird Leys Lye Valley
Carfax Marston
Churchill North
Cowley Northfield Brook
Cowley Marsh Quarry and Risinghurst
Headington Rose Hill and Iffley
Headington Hill and Northway St Clement’s
Hinksey Park St Margaret’s
Holywell St Mary’s
Iffley Fields Summertown
Jericho and Osney Wolvercote

36
10.6 The location of these 24 wards is shown on the map below:
Map 1: Location of electoral wards within Oxford

37
10.7 Oxford City Council (OCC) has provided us with the following sample of fourteen residential sites on which the financial modeling exercise is to be based.
No. Site Ward No. of Units
1 The Old Dairy Headington 1
2 57 Phipps Road Cowley 2
3 Friar Pub Marston 7
4 15-17 Temple Road Cowley Marsh 6
5 128 Bullingdon Road St Margarets 6
6 351 Woodstock Road Wolvercote 10
7 Sutton Road Hall Headington Hill &
Northway
14
8 Wharf House Jericho & Osney 14
9 St Nicholas House, St
Nicholas Road
Littlemore 16
10 Leiden Road Lye Valley 19
11 Fox & Hounds Pub &
former petrol station
Hinksey Park 12
12 Elsfield Hall Summertown 24
13 Former Barton Road
Cricket Ground
Quarry and Risinghurst 35
14 Oxford Stadium Blackbird Leys 180Table 5: List of fourteen sample residential sites
10.8 Whilst the sample sites do not cover all 24 wards, given the well known constraints associated with the limited land supply in Oxford, OCC consider this sample to be illustrative of the diverse cross section of development sites which may potentially come forward in the future.
10.9 The main varying factors between the fourteen sites are as follows:
• Location – including variations in proximity to the city centre; ring road; and key access
routes;
• Size of the site;
• Proposed density of development;
• Surrounding land uses;
• Nature and characteristic of the surrounding and proposed residential accommodation;
and
• Proximity to key employers, such as hospitals, universities and manufacturers.

38
10.10 We acknowledge that some of the sites have already been developed, some are under construction, whilst others have yet to be cleared. For the purpose of the model, the existing value of recently developed sites is assumed as the value of the use prior to development. All the assumptions relating to the financial model have been set out within Section 11.
10.11 Method Statement
10.12 In order to establish meaningful unit values which can be inputted into the financial model, we have formulated private and affordable values on a site by site basis for a range of different dwelling types. Given the variations between the sites it is not appropriate to take a uniform approach to affordable housing across Oxford. A case by case consideration of each of thesites will ensure the most robust outputs.
10.13 As mentioned, the analysis of the residential unit values focuses on the fourteen sites as listed. For each of the sites, values for the following type of units were determined:
• 1 bedroom flat (50sqm/540sqft);
• 2 bedroom flat (67sqm/720sqft);
• 2 bedroom house (75sqm/800sqft);
• 3 bedroom house (95sqm/1,000sqft); and
• 4 bedroom house (100sqm/1,076sqft).
10.14 Unit values for five bedroom houses (120sqm/1,291sqft) have also been determined for four of the sites – Leiden Road; Fox & Hounds; Elsfield Hall; and Barton Road.
10.15 A strict comparison method of valuation has been used to determine indicative private unit values for each of the dwelling types, at each of the sample sites. Relevant market data was obtained from the property database ‘Hometrack’. This source is the leading comprehensive online valuation service which contains detailed information in relation to sold and let values for properties within the UK, in addition to a range of socio-economic data.
10.16 For each of the fourteen sample sites, we generated a comparable evidence report. This report provided details of the properties within an approximate half mile radius from each respective site, which have been sold or valued for mortgage purposes within the last six months. The reports provide details in relation to dwelling type, sold prices or mortgage value, and the date of completion or valuation. A number of the listed properties have a greater level of detail provided such as the number of bedrooms and reception rooms, the date of construction and floor area. Where this information was forthcoming, an analysis was undertaken on what different property types were either sold or valued at. This enabled an understanding of the indicative £/sq ft value for each of the sites.
10.17 It should be noted that some areas have experienced comparatively few transactions or valuations within recent months thus resulting in a small sample size. Further to this, some areas have a high concentration of one particular dwelling type which means that the comparables for the full range of dwelling types are more limited.

39
10.18 To support the data generated by Hometrack, discussions were held with local agents operational within Oxford. The purpose of this was to reinforce the understanding of the values we had established, and to explain any anomalies.
10.19 Regard was also paid to the limited number of new build developments which are currently being brought forward in Oxford. Please refer to Appendix 4 for full details. Analysis of properties which are currently on the market, and the respective asking prices, was also considered.
10.20 Following this, we formed a judgment on unit values for each dwelling type at each of thesample sites.
10.21 Results
10.22 Having collated all the available evidence and assessed each site in turn, we allocated a value range to each dwelling type, at each site. The value range for each unit type, at each site spans £20,000. Please refer to Appendix 5 for the full range of the indicative value ranges for each unit type, at each site.
10.23 The table below shows the mid point of the indicative value range for each dwelling type.
Indicative Unit Values 1 bed flat (£)
2 bed flat (£)
2 bed house
(£)
3 bed house
(£)
4 bed house
(£)
5 bed house
(£)
1 Headington Old Dairy 190,000 220,000 285,000 330,000 365,000 n/a
2 Marston Friar Pub 180,000 210,000 235,000 265,000 290,000 n/a
3 Cowley Marsh Temple Road 185,000 215,000 240,000 260,000 290,000 n/a
4 St Margaret’s Bullingdon Road 170,000 210,000 260,000 285,000 325,000 n/a
5 Wolvercote Woodstock Road 210,000 240,000 335,000 490,000 590,000 n/a
6Headington Hill & Northway Sutton Road 170,000 200,000 230,000 260,000 280,000 n/a
7 Jericho & Osney Wharf House 260,000 330,000 390,000 440,000 490,000 n/a
8 Littlemore St Nicholas 200,000 230,000 235,000 270,000 310,000 n/a
9 Lye Valley Leiden Road 165,000 195,000 210,000 260,000 290,000 320,000
10 Hinksey Park Fox and Hounds 195,000 225,000 270,000 310,000 360,000 400,000
11 Summertown Elsfield Hall 205,000 235,000 300,000 410,000 480,000 530,000
12 Quarry & RisinghurstBarton Road Ground 180,000 200,000 290,000 330,000 370,000 410,000
13 Blackbird LeysGreyhound Stadium 140,000 160,000 190,000 210,000 240,000 n/a
14 Cowley Phipps Road 175,000 205,000 230,000 260,000 280,000 n/a

40
Table 6: Indicative unit values for each unit type, at each of the fourteen sample sites
10.24 Where sufficient information has been forthcoming, the average £/sq ft for residential property has been calculated. This is in very general terms and for indicative purposes only. The following plan illustrates the variation in values across Oxford. Please refer to Appendix 6 for a table detailing the £/sqft values for each site.
Map 2: Indicative £/sqft for residential units, at each of the sample sites.
10.25 Conclusions
10.26 Of the fourteen sample sites considered and from the research undertaken based on the data and information available, we are of the opinion that the areas with the highest residential values are located in Wolvercote, Summertown, Headington, Jericho & Osney and Hinksey Park. We consider this to be mainly attributable to either the location being very central; being

41
situated with convenient access to the ring road; or proximity to key employers such as the universities and hospitals; or a predominance of larger family homes.
10.27 The sites with the lowest unit values are located in Blackbird Leys. We consider this to be mainly attributable to the higher proportion of social housing, smaller units (including starter homes and flats), and the overall character of the neighbourhood.
10.28 The results are consistent with our conclusions from the site visit, results of the market research, and discussions with Officers at OCC.

42
11 RESIDENTIAL METHODOLOGY – Affordable Units
11.1 Introduction
11.2 In order to determine the estimated affordable housing unit values to be inputted into the affordable housing financial model, we have adopted the following methodology. The values and associated assumptions are based on our knowledge as at November 2010.
11.3 Social Rent Methodology
11.4 The value for social rented accommodation is based upon capitalised rents at appropriate yields after deductions for major repairs, voids / bad debts, management, maintenance and service charge.
11.5 In order to estimate the indicative rents, a formula has been used which is as set out in the guidance by the Housing Corporation, now HCA. This applies a 70% weighting to relative average county annual earnings and a 30% weighting to relative capital values of the units as at January 1999. An adjustment factor for the number of bedrooms in the respective properties is also made. We have ensured that our adopted target rents are in line with the rent cap levels as stated in the HCA's guidance on target rent caps (Rents, rent differentials and service charges for housing associations – November 2009).
11.6 The calculation of indicative rents, assume that the units have been completed and are available for rent in the current market.
11.7 Our assumptions regarding the adopted yield for capitalisation (5.5%) and outgoings (30%) are based on our knowledge and experience of the affordable housing market in the area. The summation of all the components has been adopted as proxies for “Market Values” for each unit type, and on the assumption that the market is restricted to the affordable housing providers. Finally, the proxy value as a percentage of Market Value (assuming the unit were private) has been taken and incorporated within the model for indicative purposes.
11.8 Please note that no SHG or internal subsidy has been assumed as additional revenue. However, we acknowledge that in practice, some form of additional funding may be available which would subsequently have a positive impact on the Gross Development Values (GDV’s) and therefore the respective land values.
11.9 Shared Ownership Methodology
11.10 The value of the shared ownership accommodation is based on the assumption that the RP will sell a percentage of the equity of a given residential unit and charge rent on the retained equity. In accordance with OCC policy, we have assumed that 25% equity will be sold to prospective purchasers, with rent on the unsold equity charged at 2.5%. We have capitalised the rental income into perpetuity at 5.25%.
11.11 Our valuation of the completed scheme has provided the proxy unit values for the affordable housing units.
11.12 As with the social rent unit values, no SHG or internal subsidy has been assumed as additional revenue.
43
11.13 Intermediate Market Rent Methodology
11.14 In order to form an opinion of the unit rental values for the completed units, research was carried out into recent property lettings within the Oxford. The research consisted of an analysis of average rents for each ward as provided on Hometrack, in addition to local agents’ views, our experience of valuing similar property and the collation of asking rents for each ward.
11.15 In order to provide an initial indication of intermediate rental rates, the Market Rents for each of the relevant units has been discounted by 20%.
11.16 To determine the proxy unit value for each dwelling type at each site, outgoings of 20% were assumed and we capitalised the income at 6%.
11.17 As with the social rent and shared ownership unit values, we have assumed no SHG or internal subsidy as additional revenue.
11.18 Results
11.19 Please refer to Appendix 7 for a detailed table which sets out the unit values for social rent, shared ownership and intermediate rent properties based on the assumptions listed above. Based on the assumptions detailed above, the assessment process shows that the:
• social rent proxy values equate to approximately 30% of the indicative private
residential unit value;
• shared ownership proxy values equate to approximately 60% of the indicative
private residential unit values; and
• intermediate rent proxy values equate to approximately 58% of the indicative
private residential unit values.
11.20 We stress that the percentages are not uniform in every instance and differ significantly according to area and values. These percentages of private values are a somewhat crude snapshot, however, we consider it to be highly appropriate for the purposes of this financial modelling exercise. Please refer to the table in Appendix 7 which expresses all the affordable unit values as a percentage of the indicative private residential unit value.
11.21 As the social rent and shared ownership unit values are both derived to varying extents from the indicative private residential unit values, those wards with the highest private residential values have the highest social rent and shared ownership values.
11.22 As shown in the table within Appendix 7, the values for the intermediate rent units are much more consistent between the wards. We attribute this trend to less variance across Oxford in terms of rental values relative to private sales values.

44
11.23 Summary on Affordable Housing Values
11.24 The affordable housing values, expressed as a proportion of market value, form key inputs to the financial model that underpins this study.

45
12 FINANCIAL MODELLING METHODOLOGY AND ASSUMPTIONS
12.1 Introduction
12.2 This section provides a description of the financial appraisal methodology and assumptions. In each instance we have endeavoured to use robust and realistic assumptions that accurately reflect the realities of delivering residential development in Oxford. This approach ensures the financial analysis and resulting policy options are consistent with market conditions in Oxford.
12.3 Financial Modelling Methodology
12.4 The commercial approach to assessing the financial viability of residential development is to undertake a residual appraisal to arrive at a land value. Where the residual land value (RLV) is sufficiently greater than the existing use value (EUV), it is assumed that residential development is financially viable (this issue is discussed in more detail below). The financial model reflects an industry standard approach to appraising residential development schemes.
12.5 The methodology for this particular study has involved constructing a single model for financially appraising each of the fourteen sample residential development sites. The model is sufficiently flexible to enable the appraisal assumptions to be varied for different sites.
12.6 The appraisal calculates the land value after all development costs are deducted from the gross revenue generated by the hypothetical development of the site in question. As such, the land value produced is a direct function of the appraisal inputs regarding development costs and revenue/income.
12.7 It should be noted that the inputs into the appraisals will be specific to each site. Residential values, affordable housing values and S106 contributions are examples of assumptions which can vary between sites and in different locations. Appendix 8 provides details of the assumptions which have been assumed for all sites with regard to the development appraisals.
12.8 Secondly, financial appraisals which are based on the residual valuation method are recognised as being sensitive. As such, when considering appraisals, small changes to the inputs canresult in a significant effect on the land value.
12.9 A diagrammatic illustration of the residual approach is presented below. This diagram illustrates that land value is established by deducting the total construction costs, S106 contributions, finance charges and developer profit margin from the total development value (referred to as the Gross Development Value). This approach assumes that the amount left over would be the figure that a developer would pay for the site in question.

46
12.10 Within each of the boxes identified in the diagram above, there are a range of assumptions informing the financial model. The following sections provide details regarding the key revenue and cost assumptions.
12.11 Revenue Assumptions
12.12 Gross Development Value (GDV) – The GDV for a site is calculated by multiplying the total area of value-generating floorspace by the capital receipts, for the units in question. The approach is best illustrated by looking at an indicative worked scheme on a very simple hypothetical site. For example, the GDV of a site comprising five units, all being four-bedroom houses for private sale, with an identified value of £400,000 each, would be calculated by multiplying the number of units by the sales value (5 x £400,000); to give a GDV of £2,000,000.
12.13 Affordable Housing Values – The example below illustrates how the GDV is calculated for each proposed development. We discuss in detail how the capital values for the affordable housing units are established in Section 11. Full details of the values of the affordable housing units are presented at Appendix 5 to this report.
12.14 The table below presents a very simple worked example of how the calculation in relation to GDV incorporating affordable housing values work. This is purely indicative and does not reflect the actual mix of units that would be expected on a site.
12.15 The hypothetical site relates to a scheme in Northway comprising 40 units, of which 50% are to be affordable.
• The 20 market units are assumed as being three bedroom properties with a market value of £260,000.
• For the purpose of this worked example the 20 affordable units are assumed as being two bedroom flats with values that have been identified as £121,429 for shared ownership properties and £61,595 for social rented units.
Total Development Value
Total Construction Cost
Less
Less
Planning Obligations/S106
Finance
Developer’s Profit
RESIDUAL LAND VALUE
Less
Less
EQUALS

47
• It is assumed that 80% of the affordable provision will be social rent and 20% will be shared ownership.
12.16 This approach to calculating GDV provides a clear and robust indication of the value-generating potential of a particular site to inform the financial model.
12.17 As discussed in Section 10, we have adopted the comparable method of valuation and utilised Hometrack data to inform the average values for different unit types. In our approach, we have been sensitive to value geographies across Oxford; as one would expect, there is considerable pricing differential between different neighbourhoods.
12.18 Cost Assumptions
12.19 Construction Costs – The costs of construction and the standard of construction need to be fully reflected in the financial appraisal.
12.20 Code for Sustainable Homes - For the purpose of this exercise we have assumed that all development is undertaken to the DCLG’s Code for Sustainable Homes Level 4 (CfSH4) for both flats and houses.
12.21 We have adopted a base build rate of £99 per sq ft for flats and £85 per sq ft for houses (to include an allowance for foundations). These rates are based on BCIS data and anecdotal evidence. Every housebuilder/developer will argue different cost assumptions for different schemes (depending on location, specification etc), but we feel that these rates are reasonable and robust. The approach to calculating construction costs includes multiplying the ‘per sq ft’ build rate by the size of the scheme (in sq ft). For example, the calculation applicable to a 4,000 sq ft house would be 4,000 x £99 = £396,000.
12.22 We have also included an additional allowance per dwelling to provide for 20% on-site renewable energy provision (£7,000 per house; £5,000 per flat). These assumptions are based on recent anecdotal evidence for photovoltaic. This additional allowance for on-site renewables (over and above the assumptions regarding the increment to base build costs for achieving CSH4) represents a conservative estimate. It is widely believed that economies of scale and further cost improvements in sustainable construction methods may reduce these costs in the coming years. On balance we feel that a cautious approach is sensible at this time.
12.23 It is important to note that major ‘abnormal costs’ such as those relating to remediation and servicing can only be identified as due diligence on a particular site is brought forward. Where substantial remediation costs are required this will need to be considered through site-specific
Units/ Price
Market ValueShared Ownership
ValueSocial Rented
ValueTotal GDV
40 x (3
bed) @
£260,000
each
20 x £260,000 =
£5,200,0004 x £121,429 =
£485,716
16 x £61,595 =
£985,520
£5,200,000 +
£485,716 +
£985,520 =
£6,671,236

48
negotiations. No specific assumptions regarding servicing and decontamination costs have been included in this study.
12.24 Furthermore, no costs have been included to account for abnormal site servicing or access. Given the types of sites that are likely to be coming forward in Oxford over the LDF period, this is an entirely reasonable assumption for the purpose of this study.
12.25 Professional Fees - We have assumed both the contingency and professional fees at 10% of build costs. Marketing costs are at 1.5% of sales values and agent's and legal fees are 1% and 0.5% respectively. In practice one might expect, certainly for the larger sites, the housebuilder to undertake at least some of the sales / agency work in-house to drive down the professional fees and contingency costs. However, this position is difficult to reflect in a robust appraisal assumption and, therefore, we have elected to use standard appraisal assumptions as inputs to the financial model.
12.26 Finance – As discussed in Section 4, current macro-economic conditions have a significant bearing on the availability of development finance. Terms offered by lenders require significantly higher levels of equity by the developer which has constrained the amount of development across the UK. Within the financial model we have assumed a conservative rate of 7% per annum with a 2% arrangement fee on each draw down of debt. This assumption is entirely consistent with conditions in the current market. We have also assumed that 40% of funding is from equity (to reflect the credit conditions in the UK).
12.27 Developer’s Profit – The level of profit is a reflection of risk the developer takes on. We have assumed a conservative rate of profit on cost at 20%. This reflects the analysis in Section 4 of this report regarding the levels of developer confidence in what is still a turbulent market. The model calculates developer’s profit on the private build costs including the base construction, CfSH uplift, professional fees, contingency, marketing costs and interest payments.
The profit on cost is not calculated on any costs relating to affordable housing. This is on the basis that the developer is not taking any risk with the delivery of affordable housing as the model assumes the developer has agreed a purchase price and date of transfer for the affordable stock. As such, it is not appropriate to calculate a developer’s profit on the provision of affordable housing.
It should be noted that the 20% profit on cost applied does not include an allowance for contractor’s margin. It is assumed that this is included within the base construction costs and therefore the model makes an allowance for contractor’s margin for the affordable accommodation provided.
12.28 Land Value – As discussed in the methodology section above, the appraisal output in respect of the proposed development, is the Residual Land Value (RLV). The level of the RLV will dictate whether the landowner will be incentivised to either sell the site (for development) or seek to lead on the redevelopment of the site. The decision on whether to develop is firstly based on whether the RLV is higher than the Existing Use Value (EUV).
12.29 From a developer’s perspective, when negotiating with a prospective land owner they will attempt to factor in all the possible development costs in order to minimise the residual and associated payment to the landowner. It is up to the developer to pitch an offer at an appropriate level which is sufficient to induce the land owner to sell, but not so high as to
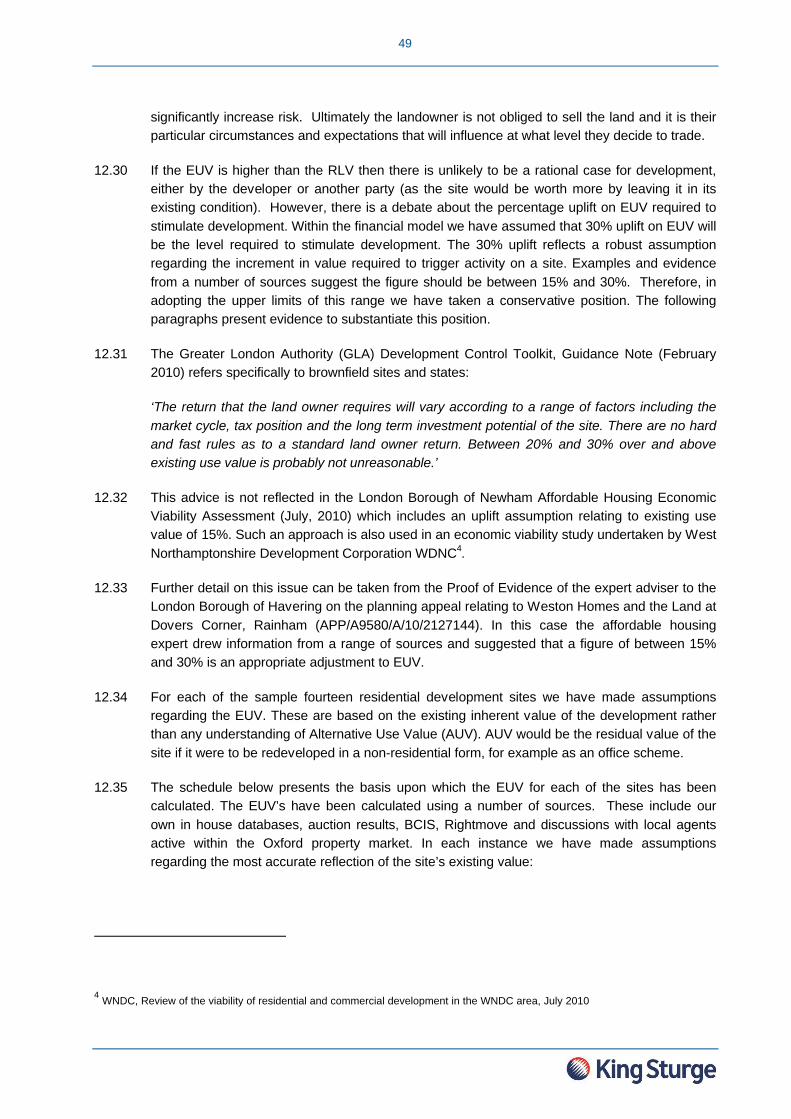
49
significantly increase risk. Ultimately the landowner is not obliged to sell the land and it is their particular circumstances and expectations that will influence at what level they decide to trade.
12.30 If the EUV is higher than the RLV then there is unlikely to be a rational case for development,either by the developer or another party (as the site would be worth more by leaving it in its existing condition). However, there is a debate about the percentage uplift on EUV required to stimulate development. Within the financial model we have assumed that 30% uplift on EUV will be the level required to stimulate development. The 30% uplift reflects a robust assumption regarding the increment in value required to trigger activity on a site. Examples and evidence from a number of sources suggest the figure should be between 15% and 30%. Therefore, in adopting the upper limits of this range we have taken a conservative position. The following paragraphs present evidence to substantiate this position.
12.31 The Greater London Authority (GLA) Development Control Toolkit, Guidance Note (February 2010) refers specifically to brownfield sites and states:
‘The return that the land owner requires will vary according to a range of factors including the market cycle, tax position and the long term investment potential of the site. There are no hard and fast rules as to a standard land owner return. Between 20% and 30% over and above existing use value is probably not unreasonable.’
12.32 This advice is not reflected in the London Borough of Newham Affordable Housing Economic Viability Assessment (July, 2010) which includes an uplift assumption relating to existing use value of 15%. Such an approach is also used in an economic viability study undertaken by West Northamptonshire Development Corporation WDNC4.
12.33 Further detail on this issue can be taken from the Proof of Evidence of the expert adviser to the London Borough of Havering on the planning appeal relating to Weston Homes and the Land at Dovers Corner, Rainham (APP/A9580/A/10/2127144). In this case the affordable housing expert drew information from a range of sources and suggested that a figure of between 15% and 30% is an appropriate adjustment to EUV.
12.34 For each of the sample fourteen residential development sites we have made assumptions regarding the EUV. These are based on the existing inherent value of the development rather than any understanding of Alternative Use Value (AUV). AUV would be the residual value of the site if it were to be redeveloped in a non-residential form, for example as an office scheme.
12.35 The schedule below presents the basis upon which the EUV for each of the sites has been calculated. The EUV’s have been calculated using a number of sources. These include our own in house databases, auction results, BCIS, Rightmove and discussions with local agents active within the Oxford property market. In each instance we have made assumptions regarding the most accurate reflection of the site’s existing value:
4 WNDC, Review of the viability of residential and commercial development in the WNDC area, July 2010

50
Table 7: Summary of the EUV assumption for each of the sample sites
12.36 Please refer to Appendix 9 for the assumptions which have been made with regard to the calculation of the EUVs.
12.37 Planning Obligations - In terms of S106 we have been supplied with the S106 costs for each site by Oxford City Council and these have been incorporated into each of the different scenarios modelled. For the purpose of this exercise, the threshold for 10 dwellings has been disregarded on basis that OCC wanted the appraisals to test the outcome should CIL be applied to every new home. The S106 costs assume full costs apply to all sites, including allowances for education, libraries, waste management, transport, social and health care, sports, open space and public art.
12.38 The value of the S106 charge is varied according to the size of the dwelling. Therefore, as one would expect the contributions for a four bedroom house are higher than for a one bedroom flat. Attached at Appendix 10 are the S106 contributions which have been assumed in respect of each site.
12.39 Summary of Appraisal Inputs and Outputs – Please refer to Appendix 11 to view a summary of the appraisal inputs and outputs in respect of each site.
No. Site Existing Use Assumption
Existing Use Value (EUV)
1 The Old Dairy Light industrial £10,1002 57 Phipps Road Detached 2 storey
residential dwelling £280,000
3 Friar Pub Valued as a Public House £155,5054 15-17 Temple Road Existing garden £50,0005 128 Bullingdon Road Office space £171,0006 351 Woodstock Road Four bedroom property £400,0007 Sutton Road Hall Light Industrial/ Storage £114,0008 Wharf House Industrial development site £247,1009 St Nicholas House,
St Nicholas RoadIndustrial development site £383,005
10 Leiden Road Health Centre and Hostel £782,22011 Fox & Hounds Pub &
former petrol stationValued as a Public House £317,120
12 Elsfield Hall Office development site £578,00013 Former Barton Rd
Cricket GroundAmenity Space £252,000
14 Oxford Stadium Driving School £880,000

51
13 AFFORDABLE HOUSING VIABILITY ANALYSIS
13.1 Introduction
13.2 This section of the report presents the conclusions of the affordable housing viability analysis in Oxford. It presents the appraisal findings for each of the fourteen residential sample sites and provides conclusions on the viability of affordable housing requirements in Oxford.
13.3 It is important to note that the financial model has been undertaken on the basis of a 50% policy requirement for affordable housing, which is in accordance with OCC’s adopted LDF Core Strategy 2026.
13.4 The Balance of Dwellings SPD generally prescribes a minimum number of family homes, or the retention of family homes where residential conversion take place, to meet the Council’s objective of balanced communities. The precise mix depends on the location within Oxford, reflecting where there are particular pressures on the balance of dwellings on a local basis.
13.5 This section of the report considers the financial viability of on-site affordable housing provision. The potential for securing financial contributions “in lieu” of on-site provision of affordable housing is considered in the following section of this report.
13.6 In establishing the viability for each of the scenarios we have applied the S106 requirements as provided by Oxford City Council.
13.7 The following paragraphs set out the results of the financial model for on-site affordable housing provision on each of the sample fourteen sites.
13.8 The abbreviations contained below can be explained as follows:
• DPHa – Dwellings per Hectare;
• AH – Affordable Housing;
• SR – Social rented affordable accommodation; and
• SO – Shared ownership affordable accommodation.

52
13.9 Oxford Stadium
13.10 Oxford Stadium is in Blackbird Leys and is currently used a greyhound track along with a driving school. The table below summarises the proposed housing mix that has been appraised in relation to this site. This housing mix is fully compliant with Oxford City Council’s Balance of Dwellings SPD.
13.11 The table below presents the findings of the financial model assuming that the full costs from the S106 SPD are applicable to the site.
Residual Land Value
Existing Use Value
Existing Use Value with 30% uplift
Difference between RLV and
(EUV + Uplift)Conclusion
-£231,184 £880,000 £1,144,000 - £1,375,184
The RLV is substantially lower than the EUV + uplift.
The site is not viable.
Site Oxford Stadium Area ha 3.59
Housing DPHa Ha Dwellings Medium Density 50 3.59 180
Dwelling Type Units 10 - 24 4 - 9 180 01 bed 18% 10% 32 02 bed 30% 15% 54 03 bed 33% 55% 58 04 bed 20% 20% 36 0
100% 100% 180 0
Dwelling Type Market AH SR SO Units 50% 50% 80% 20%1 bed 16.0 16.0 13.0 3.02 bed 27.0 27.0 22.0 5.03 bed 29.0 29.0 23.0 6.04 bed 18.0 18.0 14.0 4.0Total 90.0 90.0 72.0 18.0
Split Dwellings

53
Site B arton Road , Forme r cric k et ground , Area ha 1 .06
Housing D PHa Ha Dwel lin gs Med ium Den si ty 33 1.06 35
Dwel lin g Typ e Uni ts 1 0 - 24 4 - 9 35 01 be d 10% 15% 3 02 be d 25% 30% 9 03 be d 45% 50% 16 04 be d 15% 5% 5 05 be d 5% 0% 2 0
1 00% 100% 35 0
Dwel lin g Typ e M arket AH SR S O Uni ts 50% 50% 80% 20 %1 be d 2.0 2.0 2.0 0.02 be d 4.0 5.0 4.0 1.03 be d 8.0 8.0 6.0 2.04 be d 3.0 2.0 2.0 0.05 be d 1.0 0.0 0.0 0.0Total 1 8.0 17.0 14.0 3.0
S pl it Dwel lin gs
13.12 Barton Road, Former Cricket Club
13.13 Barton Road Cricket Club is in Quarry and Risinghurst and is used as amenity space. The table below summarises the proposed housing mix that has been appraised in relation to this site. This housing mix is fully compliant with Oxford City Council’s Balance of Dwellings SPD.
13.14 The table below presents the findings of the financial model assuming that the full costs from the S106 SPD are applicable to the site.
Residual Land Value
Existing Use Value
Existing Use Value with 30% uplift
Difference between RLV and
(EUV + Uplift)Conclusion
£1,802,807 £252,000 £327,600 £1,475,207
The RLV is higher than the EUV + uplift. The site is
viable.

54
Site L eid en Ro ad Area ha 0 .52
Housing D PHa Ha Dwel lin gs Med ium Den si ty 36 0.52 19
Dwel lin g Typ e Uni ts 1 0 - 24 4 - 9 19 01 be d 10% 15% 2 02 be d 25% 30% 5 03 be d 45% 50% 8 04 be d 15% 5% 3 05 be d 5% 0% 1 0
1 00% 100% 19 0
Dwel lin g Typ e M arket AH SR S O Uni ts 50% 50% 80% 20 %1 be d 1.0 1.0 1.0 0.02 be d 2.0 3.0 2.0 1.03 be d 4.0 4.0 3.0 1.04 be d 2.0 1.0 1.0 0.05 be d 1.0 0.0 0.0 0.0Total 1 0.0 9.0 7.0 2.0
S pl it Dwel lin gs
13.15 Leiden Road
13.16 Leiden Road is in Lye Valley and is currently used as a health care and hostel facility. The table below summarises the proposed housing mix that has been appraised in relation to this site. This housing mix is fully compliant with Oxford City Council’s Balance of Dwellings SPD.
13.17 The table below presents the findings of the financial model assuming that the full costs from the S106 SPD are applicable to the site.
Residual Land Value
Existing Use Value
Existing Use Value with 30% uplift
Difference between RLV and
(EUV + Uplift)Conclusion
£450,911 £782,220 £1,016,886 - £565,975
The RLV is substantially lower than the EUV + uplift.
The site is not viable.
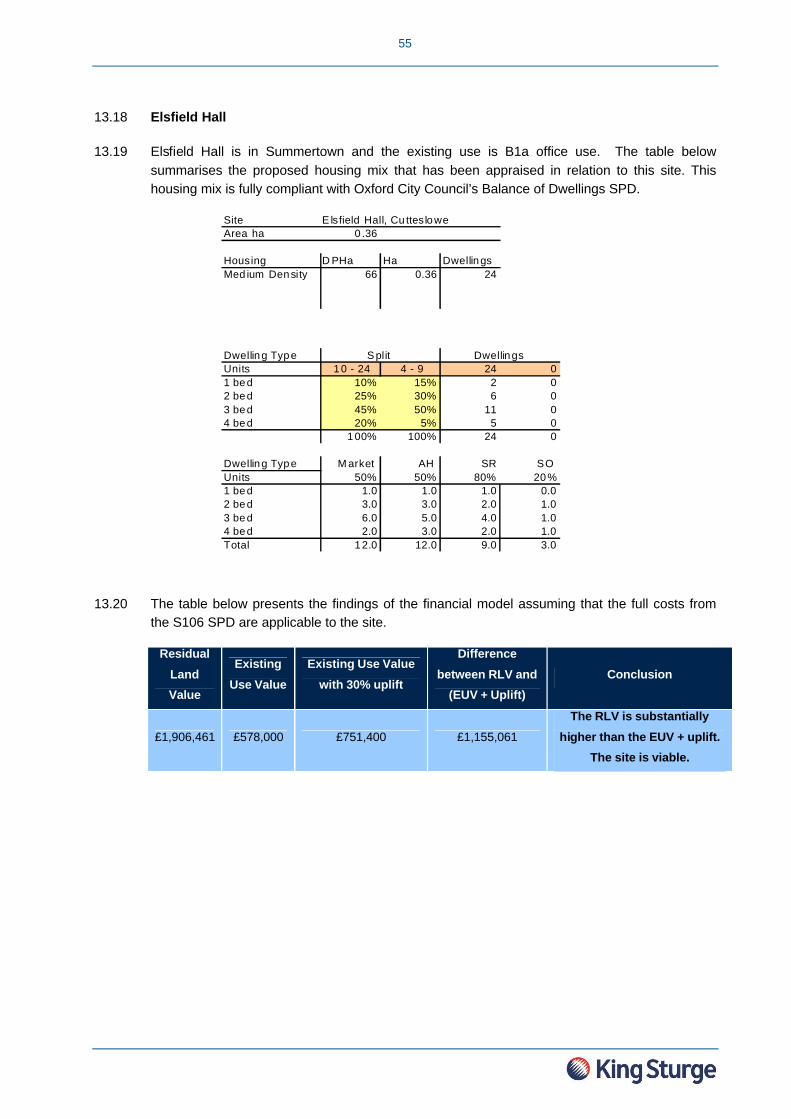
55
Site E lsfield Hall, Cu ttesloweArea ha 0 .36
Housing D PHa Ha Dwellings Med ium Density 66 0.36 24
Dwelling Type Units 10 - 24 4 - 9 24 01 bed 10% 15% 2 02 bed 25% 30% 6 03 bed 45% 50% 11 04 bed 20% 5% 5 0
100% 100% 24 0
Dwelling Type M arket AH SR SO Units 50% 50% 80% 20%1 bed 1.0 1.0 1.0 0.02 bed 3.0 3.0 2.0 1.03 bed 6.0 5.0 4.0 1.04 bed 2.0 3.0 2.0 1.0Total 12.0 12.0 9.0 3.0
S plit Dwellings
13.18 Elsfield Hall
13.19 Elsfield Hall is in Summertown and the existing use is B1a office use. The table belowsummarises the proposed housing mix that has been appraised in relation to this site. This housing mix is fully compliant with Oxford City Council’s Balance of Dwellings SPD.
13.20 The table below presents the findings of the financial model assuming that the full costs from the S106 SPD are applicable to the site.
Residual Land Value
Existing Use Value
Existing Use Value with 30% uplift
Difference between RLV and
(EUV + Uplift)Conclusion
£1,906,461 £578,000 £751,400 £1,155,061
The RLV is substantially higher than the EUV + uplift.
The site is viable.
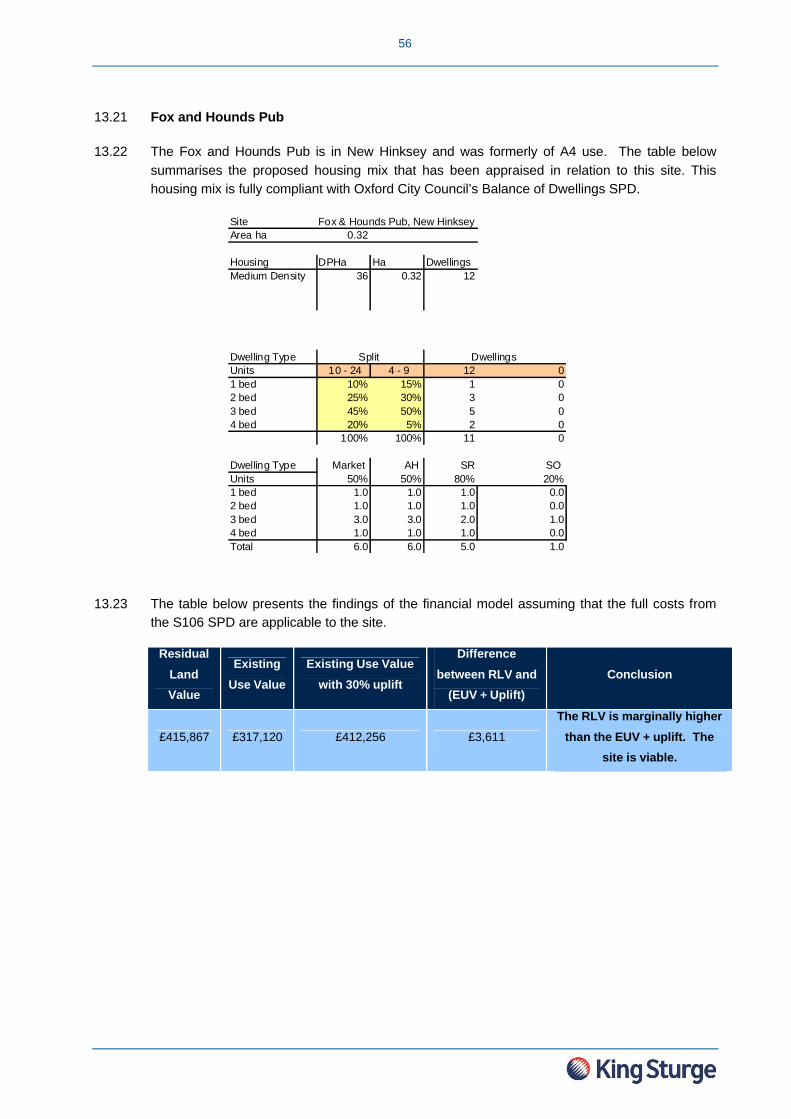
56
Site Fox & Hounds Pub, New Hinksey Area ha 0.32
Housing DPHa Ha Dwellings Medium Density 36 0.32 12
Dwelling Type Units 10 - 24 4 - 9 12 01 bed 10% 15% 1 02 bed 25% 30% 3 03 bed 45% 50% 5 04 bed 20% 5% 2 0
100% 100% 11 0
Dwelling Type Market AH SR SO Units 50% 50% 80% 20%1 bed 1.0 1.0 1.0 0.02 bed 1.0 1.0 1.0 0.03 bed 3.0 3.0 2.0 1.04 bed 1.0 1.0 1.0 0.0Total 6.0 6.0 5.0 1.0
Split Dwellings
13.21 Fox and Hounds Pub
13.22 The Fox and Hounds Pub is in New Hinksey and was formerly of A4 use. The table belowsummarises the proposed housing mix that has been appraised in relation to this site. This housing mix is fully compliant with Oxford City Council’s Balance of Dwellings SPD.
13.23 The table below presents the findings of the financial model assuming that the full costs from the S106 SPD are applicable to the site.
Residual Land Value
Existing Use Value
Existing Use Value with 30% uplift
Difference between RLV and
(EUV + Uplift)Conclusion
£415,867 £317,120 £412,256 £3,611
The RLV is marginally higher than the EUV + uplift. The
site is viable.

57
Site Nicholas House, LittlemoreArea ha 0.31
Housing DPHa Ha Dwellings Medium Density 50 0.31 16
Dwelling Type Units 10 - 24 4 - 9 16 01 bed 10% 15% 2 02 bed 25% 30% 4 03 bed 45% 50% 7 04 bed 20% 5% 3 0
100% 100% 16 0
Dwelling Type Market AH SR SO Units 50% 50% 80% 20%1 bed 1.0 1.0 1.0 0.02 bed 2.0 2.0 2.0 0.03 bed 3.0 4.0 3.0 1.04 bed 2.0 1.0 1.0 0.0Total 8.0 8.0 7.0 1.0
Split Dwellings
13.24 St Nicholas House
13.25 St Nicholas House is in Littlemore and was formerly an industrial development site. The table below summarises the proposed housing mix that has been appraised in relation to this site. This housing mix is fully compliant with Oxford City Council’s Balance of Dwellings SPD.
13.26 The table below presents the findings of the financial model assuming that the full costs from the S106 SPD are applicable to the site.
Residual Land Value
Existing Use Value
Existing Use Value with 30% uplift
Difference between RLV and
(EUV + Uplift)Conclusion
£591,564 £383,005 £497,907 £93,658
The RLV is higher than the EUV + uplift. The site is
viable.

58
Site Wharf House, Jericho Area ha 0.2
Flatted DPHa Ha Dwellings High Density 70 0.2 14
Dwelling Type Units 10 - 24 4 - 9 14 01 bed 10% 15% 1 02 bed 25% 30% 4 03 bed 45% 50% 6 04 bed 20% 5% 3 0
100% 100% 14 0
Dwelling Type Market AH SR SO Units 50% 50% 80% 20%1 bed 0.0 1.0 1.0 0.02 bed 2.0 2.0 2.0 0.03 bed 3.0 3.0 2.0 1.04 bed 2.0 1.0 1.0 0.0Total 7.0 7.0 6.0 1.0
Split Dwellings
13.27 Wharf House, Jericho
13.28 Wharf House is in Jericho and Osney and is an industrial site. The table below summarises the proposed housing mix that has been appraised in relation to this site. This housing mix is fully compliant with Oxford City Council’s Balance of Dwellings SPD.
13.29 The table below presents the findings of the financial model assuming that the full costs from the S106 SPD are applicable to the site.
Residual Land Value
Existing Use Value
Existing Use Value with 30% uplift
Difference between RLV and
(EUV + Uplift)Conclusion
£1,419,533 £247,100 £321,230 £1,098,303
The RLV is substantially higher than the EUV + uplift.
The site is viable.

59
Site S utton Road, Northway Area ha 0 .18
Housing D PHa Ha Dwellings Med ium Density 75 0.18 14
Dwelling Type Units 10 - 24 4 - 9 14 01 bed 10% 15% 1 02 bed 25% 30% 4 03 bed 45% 50% 6 04 bed 20% 5% 3 0
100% 100% 14 0
Dwelling Type M arket AH SR SO Units 50% 50% 80% 20%1 bed 0.0 1.0 1.0 0.02 bed 2.0 2.0 2.0 0.03 bed 3.0 3.0 2.0 1.04 bed 2.0 1.0 1.0 0.0Total 7.0 7.0 6.0 1.0
S plit Dwellings
13.30 Sutton Road
13.31 Sutton Road is in Headington Hill and Northway and is a former school which is currently used to store furniture. The table below summarises the proposed housing mix that has been appraised in relation to this site. This housing mix is fully compliant with Oxford City Council’s Balance of Dwellings SPD.
13.32 The table below presents the findings of the financial model assuming that the full costs from the S106 SPD are applicable to the site.
Residual Land Value
Existing Use Value
Existing Use Value with 30% uplift
Difference between RLV and
(EUV + Uplift)Conclusion
£339,948 £114,000 £148,200 £191,748
The RLV is higher than the EUV + uplift. The site is
viable.

60
Site 351 W oodstock Road Area ha 0 .12
Flatted D PHa Ha Dwellings Med ium Density 85 0.12 10
Dwelling Type Units 10 - 24 4 - 9 10 01 bed 10% 15% 1 02 bed 25% 30% 3 03 bed 45% 50% 5 04 bed 20% 5% 1 0
100% 100% 10 0
Dwelling Type M arket AH SR SO Units 50% 50% 80% 20%1 bed 1.0 1.0 1.0 0.02 bed 1.0 1.0 1.0 0.03 bed 2.0 2.0 1.0 1.04 bed 1.0 1.0 1.0 0.0Total 5.0 5.0 4.0 1.0
S plit Dwellings
13.33 351 Woodstock Road
13.34 351 Woodstock Road is a developed site. The table below summarises the proposed housing mix that has been appraised in relation to this site. This housing mix is fully compliant with Oxford City Council’s Balance of Dwellings SPD.
13.35 The table below presents the findings of the financial model assuming that the full costs from the S106 SPD are applicable to the site.
Residual Land Value
Existing Use Value
Existing Use Value with 30% uplift
Difference between RLV and
(EUV + Uplift)Conclusion
£911,939 £400,000 £520,000 £391,939
The RLV is substantially higher than the EUV + uplift.
The site is viable.

61
13.36 128 Bullingdon Road
13.37 128 Bullingdon Road is in St Margarets and the existing use is B8 warehousing use. The table below summarises the proposed housing mix that has been appraised in relation to this site. This housing mix is fully compliant with Oxford City Council’s Balance of Dwellings SPD.
13.38 The table below presents the findings of the financial model assuming that the full costs from the S106 SPD are applicable to the site.
Residual Land Value
Existing Use Value
Existing Use Value with 30% uplift
Difference between RLV and
(EUV + Uplift)Conclusion
£164,424 £171,000 £222,300 -£57,876
The RLV is lower than the EUV + uplift. The site is not
viable.
Site 128 Bullingdon Road Area ha 0.12
Housing DPHa Ha Dwellings Medium Density 50 0.12 6
Dwelling Type Units 10 - 24 4 - 9 6 01 bed 12% 15% 1 02 bed 13% 25% 2 03 bed 50% 45% 2 04 bed 25% 15% 1 0
100% 100% 6 0
Dwelling Type Market AH SR SO Units 50% 50% 80% 20%1 bed 0.0 1.0 1.0 0.02 bed 1.0 1.0 1.0 0.03 bed 1.0 1.0 0.0 1.04 bed 1.0 0.0 0.0 0.0Total 3.0 3.0 2.0 1.0
Split Dwellings
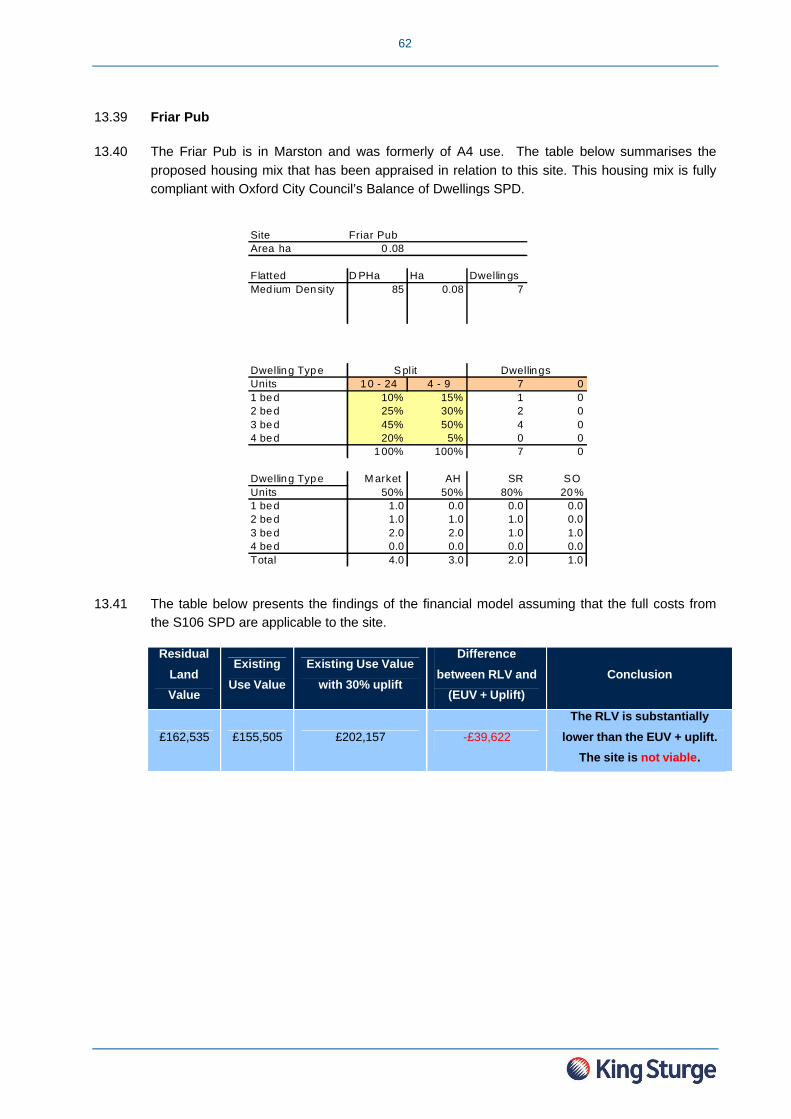
62
Site Friar Pub Area ha 0 .08
Flatted D PHa Ha Dwellings Med ium Density 85 0.08 7
Dwelling Type Units 10 - 24 4 - 9 7 01 bed 10% 15% 1 02 bed 25% 30% 2 03 bed 45% 50% 4 04 bed 20% 5% 0 0
100% 100% 7 0
Dwelling Type M arket AH SR SO Units 50% 50% 80% 20%1 bed 1.0 0.0 0.0 0.02 bed 1.0 1.0 1.0 0.03 bed 2.0 2.0 1.0 1.04 bed 0.0 0.0 0.0 0.0Total 4.0 3.0 2.0 1.0
S plit Dwellings
13.39 Friar Pub
13.40 The Friar Pub is in Marston and was formerly of A4 use. The table below summarises the proposed housing mix that has been appraised in relation to this site. This housing mix is fully compliant with Oxford City Council’s Balance of Dwellings SPD.
13.41 The table below presents the findings of the financial model assuming that the full costs from the S106 SPD are applicable to the site.
Residual Land Value
Existing Use Value
Existing Use Value with 30% uplift
Difference between RLV and
(EUV + Uplift)Conclusion
£162,535 £155,505 £202,157 -£39,622
The RLV is substantially lower than the EUV + uplift.
The site is not viable.

63
13.42 Temple Heights
13.43 Temple Heights is in Cowley and was formerly a garden to a private dwelling. The table belowsummarises the proposed housing mix that has been appraised in relation to this site. This housing mix is fully compliant with Oxford City Council’s Balance of Dwellings SPD.
13.44 The table below presents the findings of the financial model assuming that the full costs from the S106 SPD are applicable to the site.
Residual Land Value
Existing Use Value
Existing Use Value with 30% uplift
Difference between RLV and
(EUV + Uplift)Conclusion
£148,794 £50,000 £65,000 £83,794
The RLV is substantially higher than the EUV + uplift.
The site is viable.
Site Temple Heights Cowley Marsh Area ha 0.07
Flatted DPHa Ha Dwellings Medium Density 85 0.07 6
Dwelling Type Units 10 - 24 4 - 9 6 01 bed 12% 15% 1 02 bed 13% 25% 2 03 bed 50% 45% 2 04 bed 25% 15% 1 0
100% 100% 6 0
Dwelling Type Market AH SR SO Units 50% 50% 80% 20%1 bed 0.0 1.0 1.0 0.02 bed 1.0 1.0 1.0 0.03 bed 1.0 1.0 0.0 1.04 bed 1.0 0.0 0.0 0.0Total 3.0 3.0 2.0 1.0
Split Dwellings

64
Site 57 Ph ipps R oad Area ha 0 .03
Housing D PHa Ha Dwellings Med ium Density 50 0.03 2
Dwelling Type Units 10 - 24 4 - 9 2 01 bed 10% 15% 1 02 bed 25% 30% 0 03 bed 45% 50% 1 04 bed 20% 5% 0 0
100% 100% 2 0
Dwelling Type M arket AH SR SO Units 50% 50% 80% 20%1 bed 0.0 1.0 1.0 0.02 bed 0.0 0.0 0.0 0.03 bed 1.0 0.0 0.0 0.04 bed 0.0 0.0 0.0 0.0Total 1.0 1.0 1.0 0.0
S plit Dwellings
13.45 Phipps Road
13.46 Phipps Road is in Cowley and was formerly a detached two storey dwelling. The table belowsummarises the proposed housing mix that has been appraised in relation to this site. This housing mix is fully compliant with Oxford City Council’s Balance of Dwellings SPD.
13.47 The table below presents the findings of the financial model assuming that the full costs from the S106 SPD are applicable to the site.
Residual Land Value
Existing Use Value
Existing Use Value with 30% uplift
Difference between RLV and
(EUV + Uplift)Conclusion
£50,807 £280,000 £364,000 - £313,193
The RLV is substantially lower than the EUV + uplift.
The site is not viable.

65
Site The Old Dairy Area ha 0.01
Housing DPHa Ha Dwellings High Density 120 0.01 1
Dwelling Type Units 10 - 24 4 - 9 1 01 bed 10% 15% 0 02 bed 25% 30% 0 03 bed 45% 50% 1 04 bed 20% 5% 0 0
100% 100% 1 0
Dwelling Type Market AH SR SO Units 50% 50% 80% 20%1 bed 0.0 0.0 0.0 0.02 bed 0.0 0.0 0.0 0.03 bed 1.0 0.0 0.0 0.04 bed 0.0 0.0 0.0 0.0Total 1.0 0.0 0.0 0.0
Split Dwellings
13.48 Old Dairy
13.49 The Old Dairy site is located in Headington and was formerly of industrial use. The table belowsummarises the proposed housing mix that has been appraised in relation to this site. This housing mix is fully compliant with Oxford City Council’s Balance of Dwellings SPD.
13.50 The table below presents the findings of the financial model assuming that the full costs from the S106 SPD are applicable to the site.
Residual Land Value
Existing Use Value
Existing Use Value with 30% uplift
Difference between RLV and
(EUV + Uplift)Conclusion
£147,921 £10,100 £13,130 £134,791
The RLV is substantially higher than the EUV + uplift.
The site is viable.

66
13.51 Summary and Conclusions
13.52 The two tables below provide a summary of the results for the viability scenario based on the assumptions outlined above. Under the ‘Difference between RLV and EUV + 30%’ column, where the figures appear black this shows that the development is viable; however where the figure is red and in brackets this shows the proposed development is unviable.
SiteNumber of Units Residual
Land Value (RLV) (£)
Existing Use Value (EUV) (£)
% Uplift EUV + 30% Uplift (£)Difference
between RLV and EUV +
30% (£) Private Affordable
Oxford Stadium
90 90 (231,184) 880,000 30% 1,144,000 (1,375,184)
Barton former cricket club
18 17 1,802,807 252,000 30% 327,600 1,475,207
Leidon Road 10 9 450,911 782,220 30% 1,016,886 (565,975)
Elsfield Hall 12 12 1,906,461 578,000 30% 751,400 1,155,061
Fox & Hounds Pub, New Hinksey
6 6 415,867 317,120 30% 412,256 3,611
Nicholas House, Littlemore
8 8 591,564 383,005 30% 497,907 93,658
Wharf House, Jericho
7 7 1,419,533 247,100 30% 321,230 1,098,303
Sutton Rd 7 7 339,948 114,000 30% 148,200 191,748
351 Woodstock Road
5 5 911,939 400,000 30% 520,000 391,939
128 Bullingdon Rd.
3 3 164,424 171,000 30% 222,300 (57,876)
Friar Pub 4 3 162,535 155,505 30% 202,157 (39,622)
Temple Heights
3 3 148,794 50,000 30% 65,000 83,794
Phipps Road 1 1 50,807 280,000 30% 364,000 (313,193)
The Old Dairy
1 0 147,921 10,100 30% 13,130 134,791
Table 8: Summary of results relating to Model 1

67
Summary of Results
No. of Sites <10 Units >10 UnitsNon Viable 5 Sites 3/5 Sites 2/9 SitesViable 9 Sites 2/5 Sites 7/9 Sites
% Non Viable 36% Table 9: Summary of results
13.53 Of the five sites which are not viable, three are situated in Cowley, Blackbird Leys and Lye Valley, in the south east of Oxford where the residential sales values tend to be lower than in other wards across the City. The other two sites which are not viable are located in the Marston ward - to the east of the City – and in St. Margaret’s ward - which is situated in the north of Oxford. The results suggest that it is the values which can be attributed to the units which have the greatest influence on viability – as opposed to the size of sites or number of units.

68
14 FINANCIAL CONTRIBUTIONS IN LIEU OF ON-SITE PROVISION
14.1 Introduction
14.2 The potential for financial contributions to affordable housing, “in lieu” of on-site provision is considered in this section of the report.
14.3 Three different “in lieu” of on-site provision scenarios have been modeled, which are as follows:
14.4 The first scenario assumes 100% market housing on-site and a financial contribution equivalent to the uplift in land value resulting from a scheme with 50% affordable housing.
14.5 The second scenario has regard to the Oxford City Council’s affordable housing policy. This policy states that financial contributions “in lieu” of on-site provision will be the equivalent of purchasing a site (the methodology for calculating the site purchase price is explained below) on which to develop the affordable housing, in addition to the full development costs of developing the affordable housing. The anticipated cost of the land together with the development costs will then form the level of financial contribution for each site.
14.6 The third scenario tests the proposed formula put forward by OCC whereby “in-lieu” of on-site provision the serviced land required for the affordable housing would be provided free of charge. On this basis, the financial contribution of 15% of the sales value of all of the new homes on a development site would be required i.e. 15% of the GDV.
14.7 These scenarios depart from the guidance in the Planning Obligations SPD and looks at the impact of higher S106 costs on sites of all sizes. This involves applying the full S106 requirements from the SPD to all sites - not just those sites of ten dwellings and above. This represents a very conservative assumption regarding contributions to social infrastructure on small sites.
14.8 Methodology for Calculating the Site Purchase Price for Scenario Two
14.9 The Council’s current affordable housing policy states that financial contributions “in lieu” of on-site provision will be the equivalent of purchasing a site on which to develop the affordable housing, in addition to the full development costs of developing the affordable housing. We have therefore calculated the anticipated site purchase price which would need to be paid to develop the affordable housing. The anticipated cost purchase price of the land together with the development costs will then form the level of financial contribution for each site. The table at 14.12 provides a summary of the purchase prices which have been calculated for each of the sites.
14.10 In calculating the purchase price for each of the sites we have looked at the mean value for land with residential consent within Oxford which is £4,002,965 per Ha (£1,620,000 per Acre) (source: www.voa.gov.uk). Once the mean land value was determined the mean values for each of the dwellings types was established throughout Oxford (Source: Land Registry). These property values were then analysed to give an average value for a residential property within Oxford. This meant that we had our average site within Oxford with mean property values and a mean land value against which to benchmark the sites within the study.

69
14.11 The next step in the analysis was to compare the sites against the benchmark. This was undertaken by calculating the average property value for each individual site and then the difference in the average value for each site was calculated against the mean site. This then provided a basis on which the land value per acre could be calculated for each site. The final stage in the calculation was to calculate the land value per site using the different site areas.

70
14.12 Table 10: Anticipated Site Purchase Price Calculations of Scenario Two
Ward SiteValues Average
Property Value
Difference Land Vale/Acre
Site Area/ Acres
Total Land Value
1 bed 2 bed 3 bed 4 bed 5 bed
Headington The Old Dairy £190,000 £220,000 £330,000 £365,000 £ - £276,250 90% £1,457,736 0.02 £ 29,155
Cowley 57 Phipps Rd £175,000 £205,000 £260,000 £280,000 £ - £230,000 75% £1,213,681 0.07 £ 84,958
Marston Friar Pub £180,000 £210,000 £265,000 £290,000 £ - £236,250 77% £1,246,661 0.20 £ 249,332
Cowley Marsh 15-17 Temple Rd £185,000 £215,000 £260,000 £290,000 £ - £237,500 77% £1,253,257 0.17 £ 213,054
St Margarets 128 Bullingdon Rd £170,000 £210,000 £285,000 £325,000 £ - £247,500 81% £1,306,026 0.30 £ 391,808
Wolvercote 351 Woodstock Rd £210,000 £240,000 £490,000 £590,000 £ - £382,500 125% £2,018,404 0.30 £ 605,521
Headington Hill& Northway Sutton Road Hall £170,000 £200,000 £260,000 £280,000 £ - £227,500 74% £1,200,489 0.44 £ 528,215
Jericho & Osney Wharf House £260,000 £330,000 £440,000 £490,000 £ - £380,000 124% £2,005,212 0.49 £ 982,554
Littlemore St Nicholas House £200,000 £230,000 £270,000 £310,000 £ - £252,500 82% £1,332,410 0.77 £1,025,956
Lye Valley Leiden Road £165,000 £195,000 £260,000 £290,000 £320,000 £246,000 80% £1,298,111 1.28 £1,661,582
Hinksey Park Fox and Hounds Pub £195,000 £225,000 £310,000 £360,000 £400,000 £298,000 97% £1,572,508 0.79 £1,242,281
Summertown Elsfield Hall £205,000 £235,000 £410,000 £480,000 £530,000 £372,000 121% £1,962,997 0.89 £1,747,067
Quarry & Risinghurst Former Cricket Ground £180,000 £200,000 £330,000 £370,000 £410,000 £298,000 97% £1,572,508 2.62 £4,119,971
Blackbird Leys Oxford Stadium £140,000 £160,000 £210,000 £240,000 £ - £187,500 61% £ 989,414 8.87 £8,776,099 Mean Site £200,000 £245,000 £325,000 £365,000 £400,000 £307,000 Mean Site £1,620,000 1.00 £1,620,000

71
14.13 The following paragraphs set out the results of the model which considers the potential for securing financial contributions ‘in-lieu’ of on-site provision of affordable housing for each of the scenarios, in respect of the fourteen sample sites.
14.14 Oxford Stadium
14.15 Oxford Stadium is in Blackbird Leys and is currently used as a greyhound track and a driving school. The table below summarises the housing mix that has been appraised in relation to this site. This housing mix is fully compliant with Oxford City Council’s Balance of Dwellings SPD.
14.16 The following table presents a summary of the financial results for this site under Scenario 1. This scenario assumes S106 costs as provided by Oxford City Council.
Residual Land Value with 100%
Private Housing
Residual Land Value with 50%
Affordable Housing
Existing Use Value with 30% uplift
Potential Contribution Conclusion
£6,968,645 £0 £1,144,000 £6,968,645The RLV is substantially
higher than the EUV + uplift. The site is viable.
Site Oxford Stadium Area ha 3.59
Housing DPHa Ha Dwellings Medium Density 50 3.59 180
Dwelling Type Units 10 - 24 4 - 9 180 01 bed 18% 10% 32 02 bed 30% 15% 54 03 bed 33% 55% 58 04 bed 20% 20% 36 0
100% 100% 180 0
Dwelling Type Market AH SR SO Units 100% 0% 80% 20%1 bed 32.0 0.0 0.0 0.02 bed 54.0 0.0 0.0 0.03 bed 58.0 0.0 0.0 0.04 bed 36.0 0.0 0.0 0.0Total 180.0 0.0 0.0 0.0
Split Dwellings

72
14.17 The following table presents a summary of the financial results for this site under Scenario 2, which involves applying the Planning Obligations SPD. This scenario assumes S106 costs as provided by Oxford City Council.
Land Cost Build Cost Residual Land Value
Potential Contribution
Difference between RLV and Potential
ContributionConclusion
£8,776,099 £21,158,221 £6,968,645 £29,934,320 -£22,965,675
The contribution is
higher than the RLV. The
site is not viable.
14.18 The following table presents a summary of the financial results for this site under Scenario 3, which involves applying the Preferred Options Paper. This scenario assumes S106 costs as provided by Oxford City Council.
Gross Development
Value
Potential Contribution
(15% of GDV)
Gross Residual
Land Value (without
AffordableContribution)
Net Residual Land Value
(with Affordable
Contribution)
EUV including 30% Uplift
Difference between Net
RLV and EUV
Conclusion
£33,940,000 £5,091,000 £6,968,645 £1,877,645 £1,144,000 £733,645The EUV is lower than
the Net RLV. The site isviable.

73
14.19 Former Cricket Club, Barton Road
14.20 Barton Road Cricket Club is in Quarry and Risinghurst and is used as amenity space. The table below summarises the housing mix that has been appraised in relation to this site. This housing mix is fully compliant with Oxford City Council’s Balance of Dwellings SPD.
14.21 The following table presents a summary of the financial results for this site under Scenario 1. This scenario assumes S106 costs as provided by Oxford City Council.
Residual Land Value with 100%
Private Housing
Residual Land Value with 50%
Affordable Housing
Existing Use Value with 30% uplift
Potential Contribution Conclusion
£4,308,648 £1,802,807 £327,600 £2,505,841The RLV is substantially
higher than the EUV + uplift. The site is viable.
Site Former cricket ground, Headington Area ha 1.06
Housing DPHa Ha Dwellings Medium Density 33 1.06 35
Dwelling Type Units 10 - 24 4 - 9 35 01 bed 10% 15% 3 02 bed 25% 30% 9 03 bed 45% 50% 16 04 bed 15% 5% 5 05 bed 5% 0% 2 0
100% 100% 35 0
Dwelling Type Market AH SR SO Units 100% 0% 80% 20%1 bed 3.0 0.0 0.0 0.02 bed 9.0 0.0 0.0 0.03 bed 16.0 0.0 0.0 0.04 bed 5.0 0.0 0.0 0.05 bed 2.0 0.0 0.0 0.0Total 35.0 0.0 0.0 0.0
Split Dwellings

74
14.22 The following table presents a summary of the financial results for this site under Scenario 2, which involves applying the Planning Obligations SPD. This scenario assumes S106 costs as provided by Oxford City Council.
Land Cost Build Cost Residual Land Value
Potential Contribution
Difference between RLV and Potential
ContributionConclusion
£4,119,971 £4,352,881 £4,308,648 £8,472,852 -£4,164,204
The contribution is higher than the RLV. The site is
not viable.
14.23 The following table presents a summary of the financial results for this site under Scenario 3, which involves applying the Preferred Options Paper. This scenario assumes S106 costs as provided by Oxford City Council.
Gross Development
Value
Potential Contribution
(15% of GDV)
Gross Residual
Land Value (without
AffordableContribution)
Net Residual Land Value
(with Affordable
Contribution)
EUV including 30% Uplift
Difference between Net
RLV and EUV
Conclusion
£10,029,000 £1,504,350 £4,308,648 £2,804,298 £327,600 £2,476,698The EUV is lower than
the Net RLV. The site isviable.
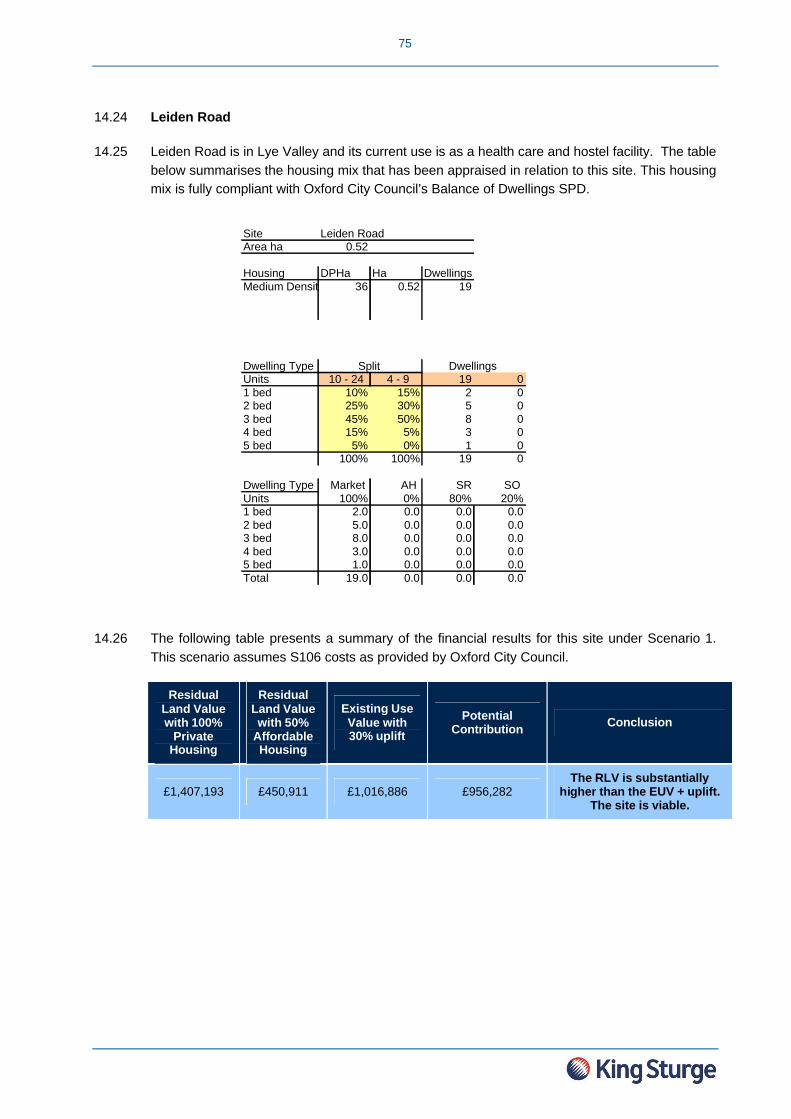
75
Site Leiden Road Area ha 0.52
Housing DPHa Ha Dwellings Medium Density 36 0.52 19
Dwelling Type Units 10 - 24 4 - 9 19 01 bed 10% 15% 2 02 bed 25% 30% 5 03 bed 45% 50% 8 04 bed 15% 5% 3 05 bed 5% 0% 1 0
100% 100% 19 0
Dwelling Type Market AH SR SO Units 100% 0% 80% 20%1 bed 2.0 0.0 0.0 0.02 bed 5.0 0.0 0.0 0.03 bed 8.0 0.0 0.0 0.04 bed 3.0 0.0 0.0 0.05 bed 1.0 0.0 0.0 0.0Total 19.0 0.0 0.0 0.0
Split Dwellings
14.24 Leiden Road
14.25 Leiden Road is in Lye Valley and its current use is as a health care and hostel facility. The table below summarises the housing mix that has been appraised in relation to this site. This housing mix is fully compliant with Oxford City Council’s Balance of Dwellings SPD.
14.26 The following table presents a summary of the financial results for this site under Scenario 1. This scenario assumes S106 costs as provided by Oxford City Council.
Residual Land Value with 100%
Private Housing
Residual Land Value with 50%
Affordable Housing
Existing Use Value with 30% uplift
Potential Contribution Conclusion
£1,407,193 £450,911 £1,016,886 £956,282The RLV is substantially
higher than the EUV + uplift. The site is viable.

76
14.27 The following table presents a summary of the financial results for this site under Scenario 2, which involves applying the Planning Obligations SPD. This scenario assumes S106 costs as provided by Oxford City Council.
Land Cost Build Cost Residual Land Value
Potential Contribution
Difference between RLV and Potential
ContributionConclusion
£1,661,582 £2,425,784 £1,407,193 £4,087,366 -£2,680,173
The contribution is higher than the RLV. The site is
not viable.
14.28 The following table presents a summary of the financial results for this site under Scenario 3, which involves applying the Preferred Options Paper. This scenario assumes S106 costs as provided by Oxford City Council.
Gross Development
Value
Potential Contribution
(15% of GDV)
Gross Residual
Land Value (without
Affordable Contribution)
Net Residual Land Value
(with Affordable
Contribution)
EUV including 30% Uplift
Difference between Net
RLV and EUV
Conclusion
£4,575,000 £686,250 £1,407,193 £720,943 £1,016,886 -£295,943The EUV is higher than the Net RLV. The site is
not viable.

77
14.29 Elsfield Hall
14.30 Elsfield Hall is in Summertown and the existing use is B1a office use. The table belowsummarises the housing mix that has been appraised in relation to this site. This housing mix is fully compliant with Oxford City Council’s Balance of Dwellings SPD.
14.31 The following table presents a summary of the financial results for this site under Scenario 1. This scenario assumes S106 costs as provided by Oxford City Council.
Residual Land Value with 100%
Private Housing
Residual Land Value with 50%
Affordable Housing
Existing Use Value with 30% uplift
Potential Contribution Conclusion
£4,298,860 £1,906,461 £751,400 £2,392,399The RLV is substantially
higher than the EUV + uplift. The site is viable.
Site Elsfield Hall, CuttesloweArea ha 0.36
Housing DPHa Ha Dwellings Medium Density 66 0.36 24
Dwelling Type Units 10 - 24 4 - 9 24 01 bed 10% 15% 2 02 bed 25% 30% 6 03 bed 45% 50% 11 04 bed 20% 5% 5 0
100% 100% 24 0
Dwelling Type Market AH SR SO Units 100% 0% 80% 20%1 bed 2.0 0.0 0.0 0.02 bed 6.0 0.0 0.0 0.03 bed 11.0 0.0 0.0 0.04 bed 5.0 0.0 0.0 0.0Total 24.0 0.0 0.0 0.0
Split Dwellings

78
14.32 The following table presents a summary of the financial results for this site under Scenario 2, which involves applying the Planning Obligations SPD. This scenario assumes S106 costs as provided by Oxford City Council.
Land Cost Build Cost Residual and Value
Potential Contribution
Difference between RLV and Potential
ContributionConclusion
£1,747,067 £3,102,780 £4,298,860 £4,849,847 -£550,987
The contribution is higher than the RLV. The
site is not viable.
14.33 The following table presents a summary of the financial results for this site under Scenario 3, which involves applying the Preferred Options Paper. This scenario assumes S106 costs as provided by Oxford City Council.
Gross Development
Value
Potential Contribution
(15% of GDV)
Gross Residual
Land Value (without
Affordable Contribution)
Net Residual Land Value
(with Affordable
Contribution)
EUV including 30% Uplift
Difference between Net
RLV and EUV
Conclusion
£8,730,000 £1,309,500 £4,298,860 £2,989,360 £751,400 £2,237,960The EUV is lower than
the Net RLV. The site isviable.

79
14.34 Fox and Hounds Pub
14.35 The Fox and Hounds Pub is in New Hinksey and was formerly of A4 use. The table belowsummarises the housing mix that has been appraised in relation to this site. This housing mix is fully compliant with Oxford City Council’s Balance of Dwellings SPD.
14.36 The following table presents a summary of the financial results for this site under Scenario 1. This scenario assumes S106 costs as provided by Oxford City Council.
Residual Land Value with 100%
Private Housing
Residual Land Value with 50%
Affordable Housing
Existing Use Value with 30% uplift
Potential Contribution Conclusion
£1,283,933 £415,867 £412,256 £868,066The RLV is substantially
higher than the EUV + uplift. The site is viable.
Site Fox & Hounds Pub, New Hinksey Area ha 0.32
Housing DPHa Ha Dwellings Medium Density 36 0.32 12
Dwelling Type Units 10 - 24 4 - 9 12 01 bed 10% 15% 2 02 bed 25% 30% 3 03 bed 45% 50% 5 04 bed 20% 5% 2 0
100% 100% 12 0
Dwelling Type Market AH SR SO Units 100% 0% 80% 20%1 bed 2.0 0.0 0.0 0.02 bed 3.0 0.0 0.0 0.03 bed 5.0 0.0 0.0 0.04 bed 2.0 0.0 0.0 0.0Total 12.0 0.0 0.0 0.0
Split Dwellings
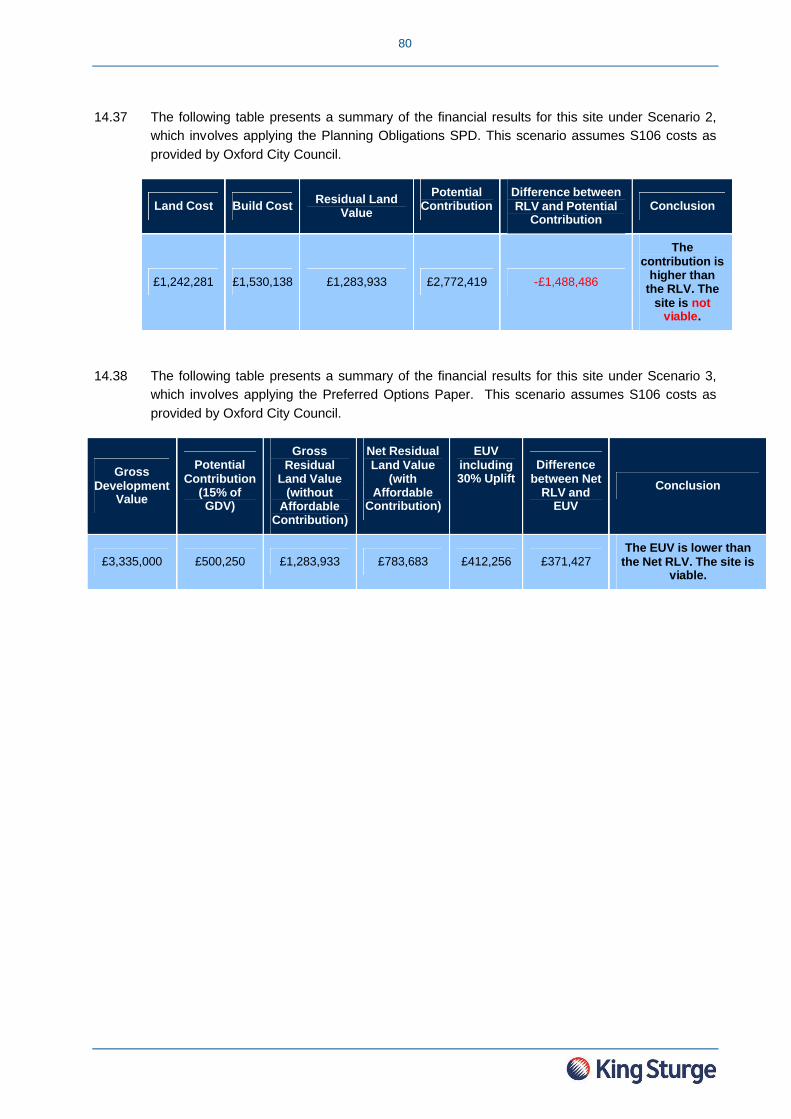
80
14.37 The following table presents a summary of the financial results for this site under Scenario 2, which involves applying the Planning Obligations SPD. This scenario assumes S106 costs as provided by Oxford City Council.
Land Cost Build Cost Residual Land Value
Potential Contribution
Difference between RLV and Potential
ContributionConclusion
£1,242,281 £1,530,138 £1,283,933 £2,772,419 -£1,488,486
The contribution is
higher than the RLV. The
site is not viable.
14.38 The following table presents a summary of the financial results for this site under Scenario 3, which involves applying the Preferred Options Paper. This scenario assumes S106 costs as provided by Oxford City Council.
Gross Development
Value
Potential Contribution
(15% of GDV)
Gross Residual
Land Value (without
Affordable Contribution)
Net Residual Land Value
(with Affordable
Contribution)
EUV including 30% Uplift
Difference between Net
RLV and EUV
Conclusion
£3,335,000 £500,250 £1,283,933 £783,683 £412,256 £371,427The EUV is lower than
the Net RLV. The site isviable.
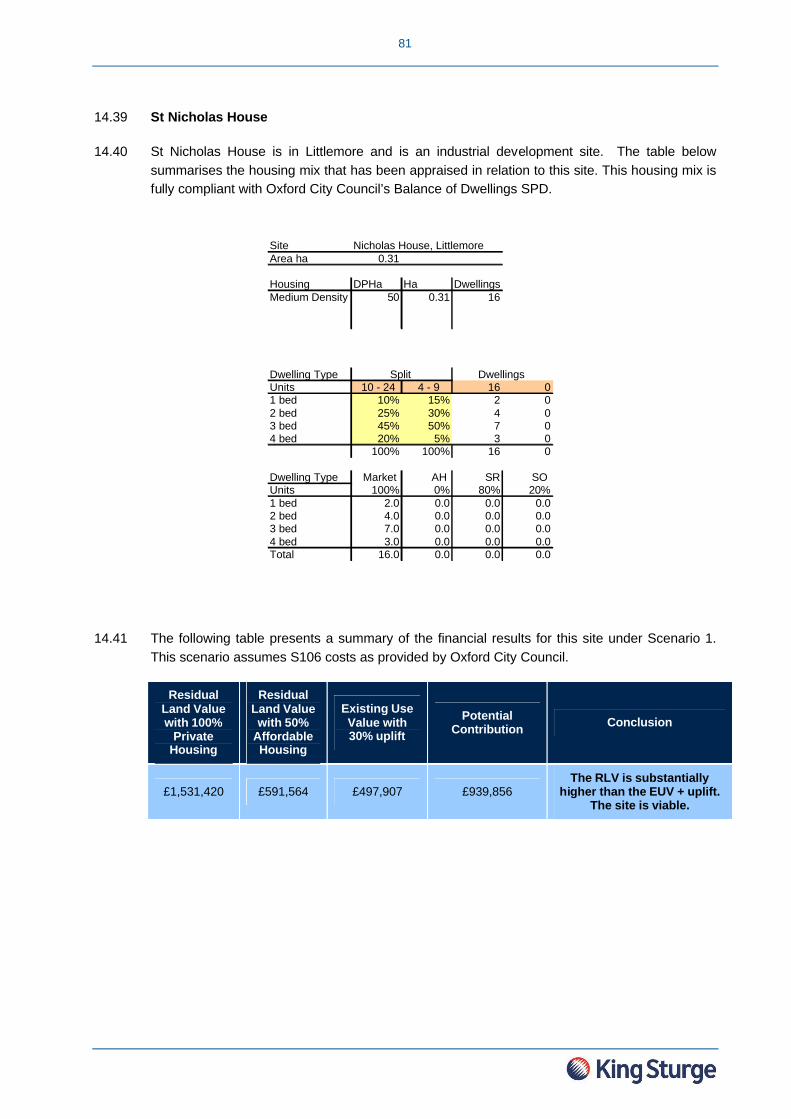
81
14.39 St Nicholas House
14.40 St Nicholas House is in Littlemore and is an industrial development site. The table belowsummarises the housing mix that has been appraised in relation to this site. This housing mix is fully compliant with Oxford City Council’s Balance of Dwellings SPD.
14.41 The following table presents a summary of the financial results for this site under Scenario 1. This scenario assumes S106 costs as provided by Oxford City Council.
Residual Land Value with 100%
Private Housing
Residual Land Value with 50%
Affordable Housing
Existing Use Value with 30% uplift
Potential Contribution Conclusion
£1,531,420 £591,564 £497,907 £939,856The RLV is substantially
higher than the EUV + uplift. The site is viable.
Site Nicholas House, LittlemoreArea ha 0.31
Housing DPHa Ha Dwellings Medium Density 50 0.31 16
Dwelling Type Units 10 - 24 4 - 9 16 01 bed 10% 15% 2 02 bed 25% 30% 4 03 bed 45% 50% 7 04 bed 20% 5% 3 0
100% 100% 16 0
Dwelling Type Market AH SR SO Units 100% 0% 80% 20%1 bed 2.0 0.0 0.0 0.02 bed 4.0 0.0 0.0 0.03 bed 7.0 0.0 0.0 0.04 bed 3.0 0.0 0.0 0.0Total 16.0 0.0 0.0 0.0
Split Dwellings

82
14.42 The following table presents a summary of the financial results for this site under Scenario 2, which involves applying the Planning Obligations SPD. This scenario assumes S106 costs as provided by Oxford City Council.
Land Cost Build Cost Residual Land Value
Potential Contribution
Difference between RLV and Potential
ContributionConclusion
£1,025,956 £1,940,220 £1,531,420 £2,966,176 -£1,434,756
The contribution is
higher than the RLV. The
site is not viable.
14.43 The following table presents a summary of the financial results for this site under Scenario 3, which involves applying the Preferred Options Paper. This scenario assumes S106 costs as provided by Oxford City Council.
Gross Development
Value
Potential Contribution
(15% of GDV)
Gross Residual
Land Value (without
Affordable Contribution)
Net Residual Land Value
(with Affordable
Contribution)
EUV including 30% Uplift
Difference between Net
RLV and EUV
Conclusion
£4,140,000 £621,000 £1,531,420 £910,420 £497,907 £412,514The EUV is lower than
the Net RLV. The site isviable.
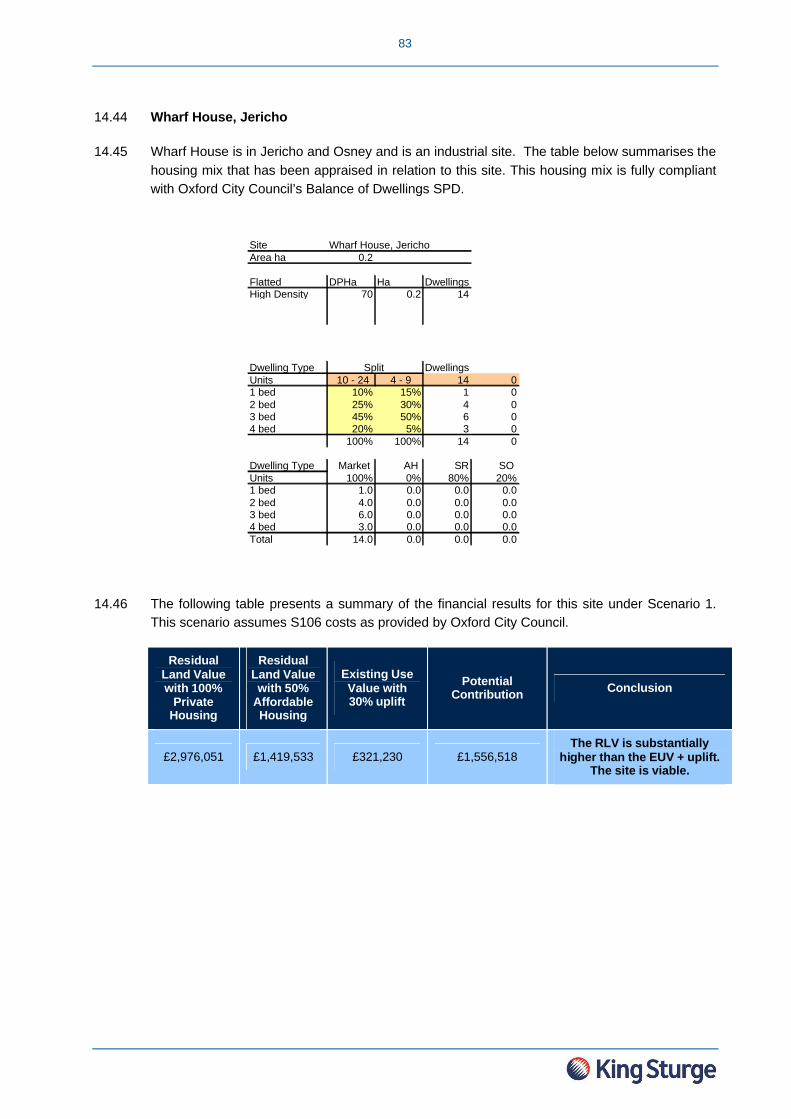
83
14.44 Wharf House, Jericho
14.45 Wharf House is in Jericho and Osney and is an industrial site. The table below summarises the housing mix that has been appraised in relation to this site. This housing mix is fully compliant with Oxford City Council’s Balance of Dwellings SPD.
14.46 The following table presents a summary of the financial results for this site under Scenario 1. This scenario assumes S106 costs as provided by Oxford City Council.
Residual Land Value with 100%
Private Housing
Residual Land Value with 50%
Affordable Housing
Existing Use Value with 30% uplift
Potential Contribution Conclusion
£2,976,051 £1,419,533 £321,230 £1,556,518The RLV is substantially
higher than the EUV + uplift. The site is viable.
Site Wharf House, Jericho Area ha 0.2
Flatted DPHa Ha Dwellings High Density 70 0.2 14
Dwelling Type Units 10 - 24 4 - 9 14 01 bed 10% 15% 1 02 bed 25% 30% 4 03 bed 45% 50% 6 04 bed 20% 5% 3 0
100% 100% 14 0
Dwelling Type Market AH SR SO Units 100% 0% 80% 20%1 bed 1.0 0.0 0.0 0.02 bed 4.0 0.0 0.0 0.03 bed 6.0 0.0 0.0 0.04 bed 3.0 0.0 0.0 0.0Total 14.0 0.0 0.0 0.0
Split Dwellings

84
14.47 The following table presents a summary of the financial results for this site under Scenario 2, which involves applying the Planning Obligations SPD. This scenario assumes S106 costs as provided by Oxford City Council.
Land Cost Build Cost Residual Land
ValuePotential
ContributionDifference between RLV and Potential
ContributionConclusion
£982,554 £1,864,007 £2,976,051 £2,846,561 £129,490
The contribution is less than the RLV. The site
is viable.
14.48 The following table presents a summary of the financial results for this site under Scenario 3, which involves applying the Preferred Options Paper. This scenario assumes S106 costs as provided by Oxford City Council.
Gross Development
Value
Potential Contribution
(15% of GDV)
Gross Residual
Land Value (without
Affordable Contribution)
Net Residual Land Value
(with Affordable
Contribution)
EUV including 30% Uplift
Difference between Net
RLV and EUV
Conclusion
£5,690,000 £853,500 £2,976,051 £2,122,551 £321,230 £1,801,321The EUV is lower than
the Net RLV. The site isviable.

85
14.49 Sutton Road
14.50 Sutton Road is in Headington Hill and Northway and is a former school which is currently used to store furniture. The table below summarises the housing mix that has been appraised in relation to this site. This housing mix is fully compliant with Oxford City Council’s Balance of Dwellings SPD.
14.51 The following table presents a summary of the financial results for this site under Scenario 1. This scenario assumes S106 costs as provided by Oxford City Council.
Residual Land Value with 100%
Private Housing
Residual Land Value with 50%
Affordable Housing
Existing Use Value with 30% uplift
Potential Contribution Conclusion
£1,124,912 £339,948 £148,200 £784,964The RLV is substantially
higher than the EUV + uplift. The site is viable.
Site Sutton Road, Northway Area ha 0.18
Housing DPHa Ha Dwellings Medium Density 75 0.18 14
Dwelling Type Units 10 - 24 4 - 9 14 01 bed 10% 15% 1 02 bed 25% 30% 4 03 bed 45% 50% 6 04 bed 20% 5% 3 0
100% 100% 14 0
Dwelling Type Market AH SR SO Units 100% 0% 80% 20%1 bed 1.0 0.0 0.0 0.02 bed 4.0 0.0 0.0 0.03 bed 6.0 0.0 0.0 0.04 bed 3.0 0.0 0.0 0.0Total 14.0 0.0 0.0 0.0
Split Dwellings
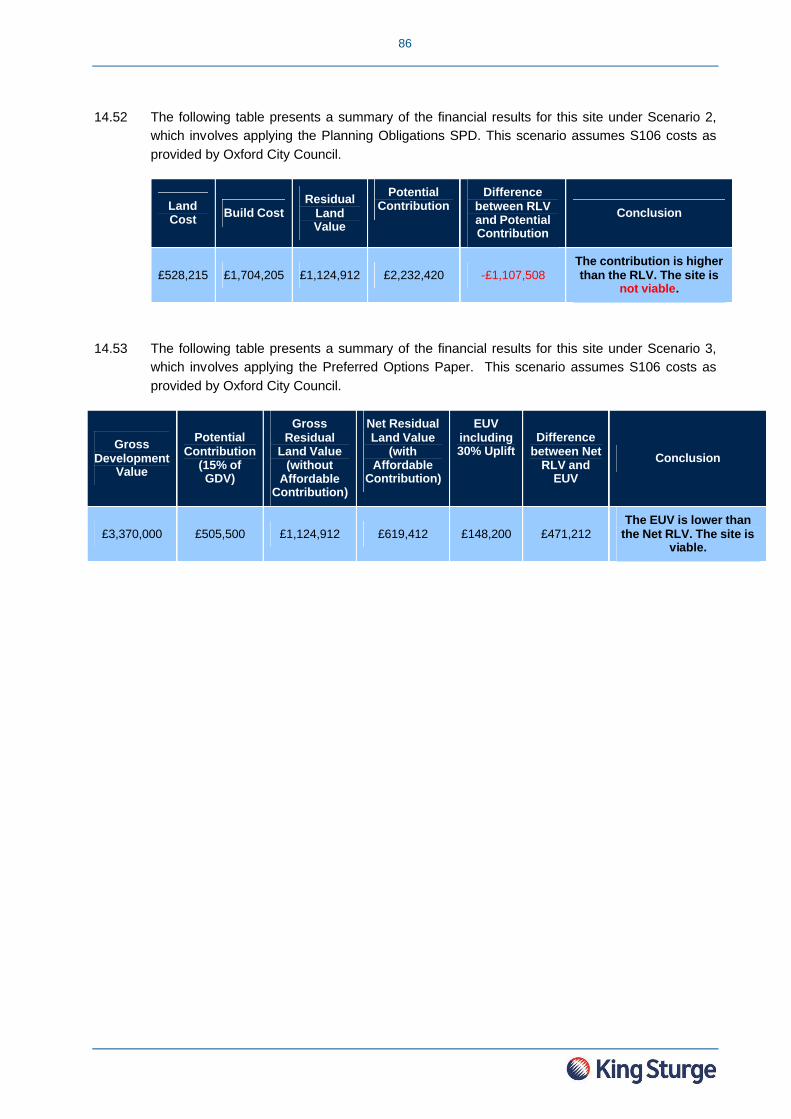
86
14.52 The following table presents a summary of the financial results for this site under Scenario 2, which involves applying the Planning Obligations SPD. This scenario assumes S106 costs as provided by Oxford City Council.
Land Cost Build Cost
Residual Land Value
Potential Contribution
Difference between RLV and Potential Contribution
Conclusion
£528,215 £1,704,205 £1,124,912 £2,232,420 -£1,107,508The contribution is higher than the RLV. The site is
not viable.
14.53 The following table presents a summary of the financial results for this site under Scenario 3, which involves applying the Preferred Options Paper. This scenario assumes S106 costs as provided by Oxford City Council.
Gross Development
Value
Potential Contribution
(15% of GDV)
Gross Residual
Land Value (without
Affordable Contribution)
Net Residual Land Value
(with Affordable
Contribution)
EUV including 30% Uplift
Difference between Net
RLV and EUV
Conclusion
£3,370,000 £505,500 £1,124,912 £619,412 £148,200 £471,212The EUV is lower than
the Net RLV. The site isviable.
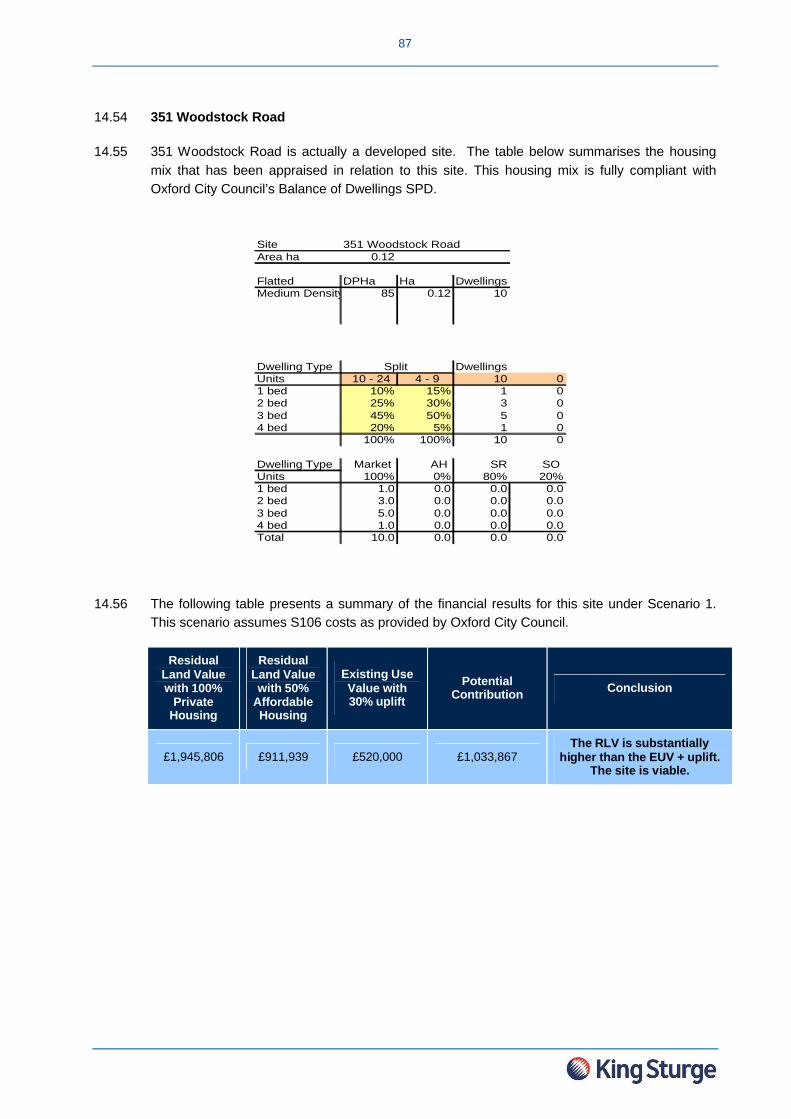
87
14.54 351 Woodstock Road
14.55 351 Woodstock Road is actually a developed site. The table below summarises the housing mix that has been appraised in relation to this site. This housing mix is fully compliant with Oxford City Council’s Balance of Dwellings SPD.
14.56 The following table presents a summary of the financial results for this site under Scenario 1. This scenario assumes S106 costs as provided by Oxford City Council.
Residual Land Value with 100%
Private Housing
Residual Land Value with 50%
Affordable Housing
Existing Use Value with 30% uplift
Potential Contribution Conclusion
£1,945,806 £911,939 £520,000 £1,033,867The RLV is substantially
higher than the EUV + uplift. The site is viable.
Site 351 Woodstock Road Area ha 0.12
Flatted DPHa Ha Dwellings Medium Density 85 0.12 10
Dwelling Type Units 10 - 24 4 - 9 10 01 bed 10% 15% 1 02 bed 25% 30% 3 03 bed 45% 50% 5 04 bed 20% 5% 1 0
100% 100% 10 0
Dwelling Type Market AH SR SO Units 100% 0% 80% 20%1 bed 1.0 0.0 0.0 0.02 bed 3.0 0.0 0.0 0.03 bed 5.0 0.0 0.0 0.04 bed 1.0 0.0 0.0 0.0Total 10.0 0.0 0.0 0.0
Split Dwellings

88
14.57 The following table presents a summary of the financial results for this site under Scenario 2, which involves applying the Planning Obligations SPD. This scenario assumes S106 costs as provided by Oxford City Council.
Land Cost Build Cost Residual Land
ValuePotential
ContributionDifference between RLV and Potential
ContributionConclusion
£605,521 £1,254,737 £1,945,806 £1,860,258 £85,548
The contribution is less than the RLV. The site
is viable.
14.58 The following table presents a summary of the financial results for this site under Scenario 3, which involves applying the Preferred Options Paper. This scenario assumes S106 costs as provided by Oxford City Council.
Gross Development
Value
Potential Contribution
(15% of GDV)
Gross Residual
Land Value (without
Affordable Contribution)
Net Residual Land Value
(with Affordable
Contribution)
EUV including 30% Uplift
Difference between Net
RLV and EUV
Conclusion
£3,771,500 £565,725 £1,945,806 £1,380,081 £520,000 £860,081The EUV is lower than
the Net RLV. The site isviable.

89
14.59 128 Bullingdon Road
14.60 128 Bullingdon Road is in St Margarets and the existing use is B8 warehousing use. The table below summarises the housing mix that has been appraised in relation to this site. This housing mix is fully compliant with Oxford City Council’s Balance of Dwellings SPD.
14.61 The following table presents a summary of the financial results for this site under Scenario 1. This scenario assumes S106 costs as provided by Oxford City Council.
Residual Land Value with 100%
Private Housing
Residual Land Value with 50%
Affordable Housing
Existing Use Value with 30% uplift
Potential Contribution Conclusion
£403,390 £164,424 £222,300 £238,966The RLV is substantially
higher than the EUV + uplift. The site is viable.
Site 128 Bullingdon Road Area ha 0.12
Housing DPHa Ha Dwellings Medium Density 50 0.12 6
Dwelling Type Units 10 - 24 4 - 9 6 01 bed 12% 15% 1 02 bed 13% 25% 2 03 bed 50% 45% 2 04 bed 25% 15% 1 0
100% 100% 6 0
Dwelling Type Market AH SR SO Units 100% 0% 80% 20%1 bed 1.0 0.0 0.0 0.02 bed 2.0 0.0 0.0 0.03 bed 2.0 0.0 0.0 0.04 bed 1.0 0.0 0.0 0.0Total 6.0 0.0 0.0 0.0
Split Dwellings
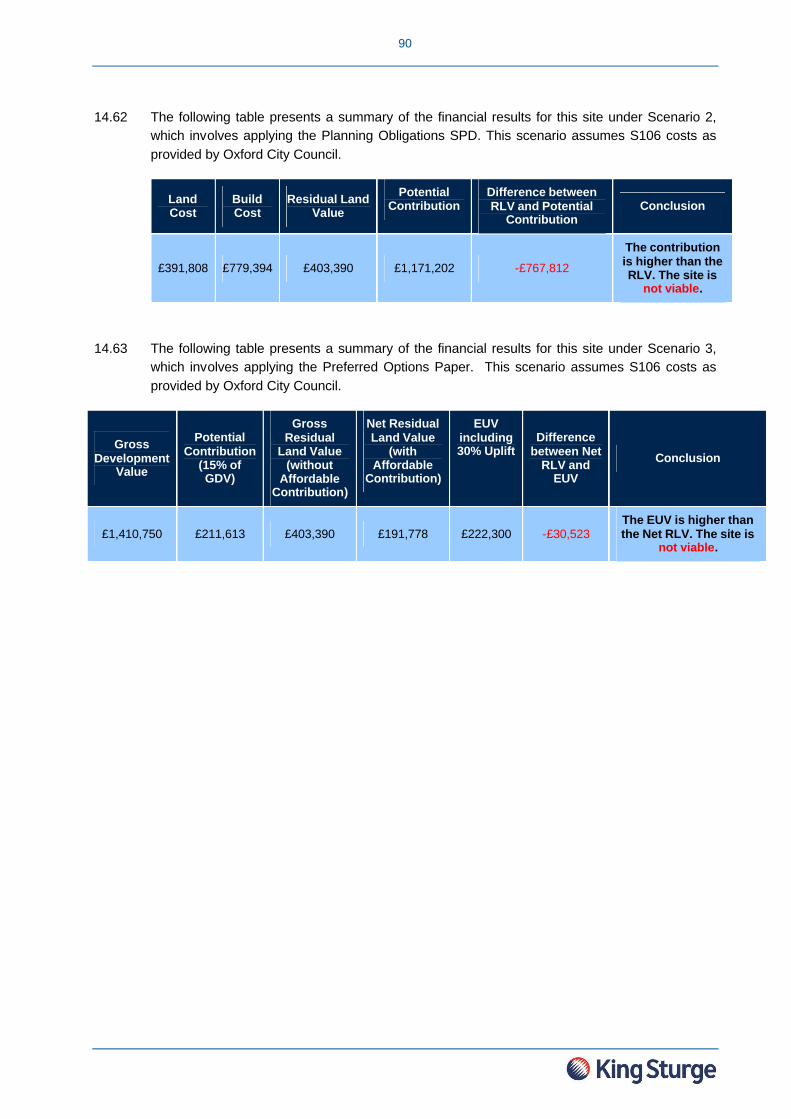
90
14.62 The following table presents a summary of the financial results for this site under Scenario 2, which involves applying the Planning Obligations SPD. This scenario assumes S106 costs as provided by Oxford City Council.
Land Cost
Build Cost
Residual Land Value
Potential Contribution
Difference between RLV and Potential
ContributionConclusion
£391,808 £779,394 £403,390 £1,171,202 -£767,812
The contribution is higher than the RLV. The site is
not viable.
14.63 The following table presents a summary of the financial results for this site under Scenario 3, which involves applying the Preferred Options Paper. This scenario assumes S106 costs as provided by Oxford City Council.
Gross Development
Value
Potential Contribution
(15% of GDV)
Gross Residual
Land Value (without
Affordable Contribution)
Net Residual Land Value
(with Affordable
Contribution)
EUV including 30% Uplift
Difference between Net
RLV and EUV
Conclusion
£1,410,750 £211,613 £403,390 £191,778 £222,300 -£30,523The EUV is higher than the Net RLV. The site is
not viable.

91
Site Friar Pub Area ha 0.08
Flatted DPHa Ha Dwellings Medium Density 85 0.08 7
Dwelling Type Units 10 - 24 4 - 9 7 01 bed 10% 15% 1 02 bed 25% 30% 2 03 bed 45% 50% 4 04 bed 20% 5% 0 0
100% 100% 7 0
Dwelling Type Market AH SR SO Units 100% 0% 80% 20%1 bed 1.0 0.0 0.0 0.02 bed 2.0 0.0 0.0 0.03 bed 4.0 0.0 0.0 0.04 bed 0.0 0.0 0.0 0.0Total 7.0 0.0 0.0 0.0
Split
14.64 Friar Pub
14.65 The Friar Pub is in Marston and was formerly of A4 use. The table below summarises the housing mix that has been appraised in relation to this site. This housing mix is fully compliant with Oxford City Council’s Balance of Dwellings SPD.
14.66 The following table presents a summary of the financial results for this site under Scenario 1. This scenario assumes the S106 costs provided by Oxford City Council.
Residual Land Value with 100%
Private Housing
Residual Land Value with 50%
Affordable Housing
Existing Use Value with 30% uplift
Potential Contribution Conclusion
£446,152 £162,535 £202,157 £283,617The RLV is substantially
higher than the EUV + uplift. The site is viable.

92
14.67 The following table presents a summary of the financial results for this site under Scenario 2, which involves applying the Planning Obligations SPD. This scenario assumes the S106 costs as provided by Oxford City Council.
Land Cost
Build Cost
Residual Land Value
Potential Contribution
Difference between RLV and Potential
ContributionConclusion
£249,332 £874,874 £446,152 £1,124,206 -£678,054
The contribution is higher than the RLV. The site is
not viable.
14.68 The following table presents a summary of the financial results for this site under Scenario 3, which involves applying the Preferred Options Paper. This scenario assumesS106 costs as provided by Oxford City Council.
Gross Development
Value
Potential Contribution
(15% of GDV)
Gross Residual
Land Value (without
Affordable Contribution)
Net Residual Land Value
(with Affordable
Contribution)
EUV including 30% Uplift
Difference between Net
RLV and EUV
Conclusion
£1,577,000 £236,550 £446,152 £209,602 £202,157 £7,446The EUV is lower than
the Net RLV. The site isviable.

93
14.69 Temple Heights
14.70 Temple Heights is in Cowley and is an existing garden to a residential dwelling. The table below summarises the housing mix that has been appraised in relation to this site. This housing mix is fully compliant with Oxford City Council’s Balance of Dwellings SPD.
14.71 The following table presents a summary of the financial results for this site under Scenario 1. This scenario assumes S106 costs as provided by Oxford City Council.
Residual Land Value with 100%
Private Housing
Residual Land Value with 50%
Affordable Housing
Existing Use Value with 30% uplift
Potential Contribution Conclusion
£396,371 £148,794 £65,000 £247,577The RLV is substantially
higher than the EUV + uplift. The site is viable.
Site Temple Heights Cowley Marsh Area ha 0.07
Flatted DPHa Ha Dwellings Medium Density 85 0.07 6
Dwelling Type Units 10 - 24 4 - 9 6 01 bed 12% 15% 1 02 bed 13% 25% 2 03 bed 50% 45% 2 04 bed 25% 15% 1 0
100% 100% 6 0
Dwelling Type Market AH SR SO Units 100% 0% 80% 20%1 bed 1.0 0.0 0.0 0.02 bed 2.0 0.0 0.0 0.03 bed 2.0 0.0 0.0 0.04 bed 1.0 0.0 0.0 0.0Total 6.0 0.0 0.0 0.0
Split Dwellings

94
14.72 The following table presents a summary of the financial results for this site under Scenario 2, which involves applying the Planning Obligations SPD. This scenario assumes S106 costs as provided by Oxford City Council.
Land Cost
Build Cost
Residual Land Value
Potential Contribution
Difference between RLV and
Potential Contribution
Conclusion
£213,054 £734,473 £396,371 £947,527 -£551,156The contribution is
higher than the RLV. The site is not viable.
14.73 The following table presents a summary of the financial results for this site under Scenario 3, which involves applying the Preferred Options Paper. This scenario assumes S106 costs as provided by Oxford City Council.
Gross Development
Value
Potential Contribution
(15% of GDV)
Gross Residual
Land Value (without
Affordable Contribution)
Net Residual Land Value
(with Affordable
Contribution)
EUV including 30% Uplift
Difference between Net
RLV and EUV
Conclusion
£1,353,750 £203,063 £396,371 £193,309 £65,000 £128,309The EUV is lower than
the Net RLV. The site isviable.

95
14.74 Phipps Road
14.75 Phipps Road is in Cowley and was formerly a detached two storey dwelling. The table belowsummarises the housing mix that has been appraised in relation to this site. This housing mix is fully compliant with Oxford City Council’s Balance of Dwellings SPD.
14.76 The following table presents a summary of the financial results for this site under Scenario 1. This scenario assumes S106 costs as provided by Oxford City Council.
Residual Land Value with 100%
Private Housing
Residual Land Value with 50%
Affordable Housing
Existing Use Value with 30% uplift
Potential Contribution Conclusion
£136,876 £50,807 £280,000 £86,069The RLV is substantially
lower than the EUV + uplift. The site is not viable.
Site 57 Phipps Road Area ha 0.03
Housing DPHa Ha Dwellings Medium Density 50 0.03 2
Dwelling Type Units 10 - 24 4 - 9 2 01 bed 10% 15% 1 02 bed 25% 30% 0 03 bed 45% 50% 1 04 bed 20% 5% 0 0
100% 100% 2 0
Dwelling Type Market AH SR SO Units 100% 0% 80% 20%1 bed 1.0 0.0 0.0 0.02 bed 0.0 0.0 0.0 0.03 bed 1.0 0.0 0.0 0.04 bed 0.0 0.0 0.0 0.0Total 2.0 0.0 0.0 0.0
Split Dwellings

96
14.77 The following table presents a summary of the financial results for this site under Scenario 2, which involves applying the Planning Obligations SPD. This scenario assumes S106 costs as provided by Oxford City Council.
Land Cost
Build Cost
Residual Land Value
Potential Contribution
Difference between RLV and Potential
ContributionConclusion
£84,958 £208,662 £136,876 £293,620 -£156,744
The contribution is higher than the RLV. The site is
not viable.
14.78 The following table presents a summary of the financial results for this site under Scenario 3, which involves applying the Preferred Options Paper. This scenario assumes S106 costs as provided by Oxford City Council.
Gross Development
Value
Potential Contribution
(15% of GDV)
Gross Residual
Land Value (without
Affordable Contribution)
Net Residual Land Value
(with Affordable
Contribution)
EUV including 30% Uplift
Difference between Net
RLV and EUV
Conclusion
£413,500 £62,025 £136,876 £74,851 £364,000 -£289,149The EUV is higher than the Net RLV. The site is
not viable.

97
Site The Old Dairy Area ha 0.01
Housing DPHa Ha Dwellings High Density 120 0.01 1
Dwelling Type Units 10 - 24 4 - 9 1 01 bed 10% 15% 0 02 bed 25% 30% 0 03 bed 45% 50% 1 04 bed 20% 5% 0 0
100% 100% 1 0
Dwelling Type Market AH SR SO Units 50% 50% 80% 20%1 bed 0.0 0.0 0.0 0.02 bed 0.0 0.0 0.0 0.03 bed 1.0 0.0 0.0 0.04 bed 0.0 0.0 0.0 0.0Total 1.0 0.0 0.0 0.0
Split Dwellings
14.79 Old Dairy
14.80 The Old Dairy site is located in Headington and was formerly in industrial use. The table belowsummarises the housing mix that has been appraised in relation to this site. This housing mix is in full compliance with Oxford City Council’s Balance of Dwellings SPD.
14.81 The following table presents a summary of the financial results for this site under Scenario 1. This scenario involves S106 costs as provided by Oxford City Council.
Residual Land Value with 100%
Private Housing
Residual Land Value with 50%
Affordable Housing
Existing Use Value with 30% uplift
Potential Contribution Conclusion
£147,921 £147,921 £13,130 £zeroThe RLV is substantially
higher than the EUV + uplift. The site is viable.

98
14.82 The following table presents a summary of the financial results for this site under Scenario 2, which involves applying the Planning Obligations SPD. This scenario involves S106 costs as provided by Oxford City Council.
Land Cost
Build Cost
Residual Land Value
Potential Contribution
Difference between RLV and Potential
ContributionConclusion
£29,155 £130,416 £147,921 £159,571 -£11,650
The contribution is higher than the RLV. The site is
not viable.
14.83 The following table presents a summary of the financial results for this site under Scenario 3, which involves applying the Preferred Options Paper. This scenario assumes S106 costs as provided by Oxford City Council.
Gross Development
Value
Potential Contribution
(15% of GDV)
Gross Residual
Land Value (without
Affordable Contribution)
Net Residual Land Value
(with Affordable
Contribution)
EUV including 30% Uplift
Difference between Net
RLV and EUV
Conclusion
£330,000 £49,500 £147,921 £98,421 £13,130 £85,291The EUV is lower than
the Net RLV. The site isviable.

99
14.84 Summary and Conclusions
14.85 The tables below provide a summary of the results relating to Scenario 1, 2 and 3 ‘cash in-lieu’ of on-site affordable housing provision.
14.86 Scenario 1 Results
14.87 The tables overleaf provide a summary of the results with regard to Scenario 1 ‘cash in-lieu’ of on-site affordable housing provision. The figures contained within the ‘Difference between RLV and (EUV + 30% Uplift) (£)’ column govern a site’s viability under this scenario. If a site is viable the value in the ‘Difference between RLV and (EUV + 30% Uplift) (£)’ column will be positive and black; if the site is not viable the figure will be red and in brackets.
14.88 The results show that where 100% of the on-site provision is private, there is only one site which is unviable in terms of providing a financial contribution in-lieu of on-site provision of affordable housing. This is situated within the Cowley ward, in the south-east of Oxford.
14.89 Although the analysis for the Oxford Stadium provides a contribution of £7.20 million, it should be noted that this figure is inflated using this analysis. The 50% affordable scenario model provides a negative land value; therefore when the difference between the residual land values in-lieu of on-site provision scenario 1 model and the 50% affordable on-site model are undertaken, this provides an inflated contribution level.
14.90 This scenario generates a total contribution of £19,093,851; however the potential contribution from the non-viable site (Phipps Road) should be discounted which leaves a potential contribution of £19,007,782.
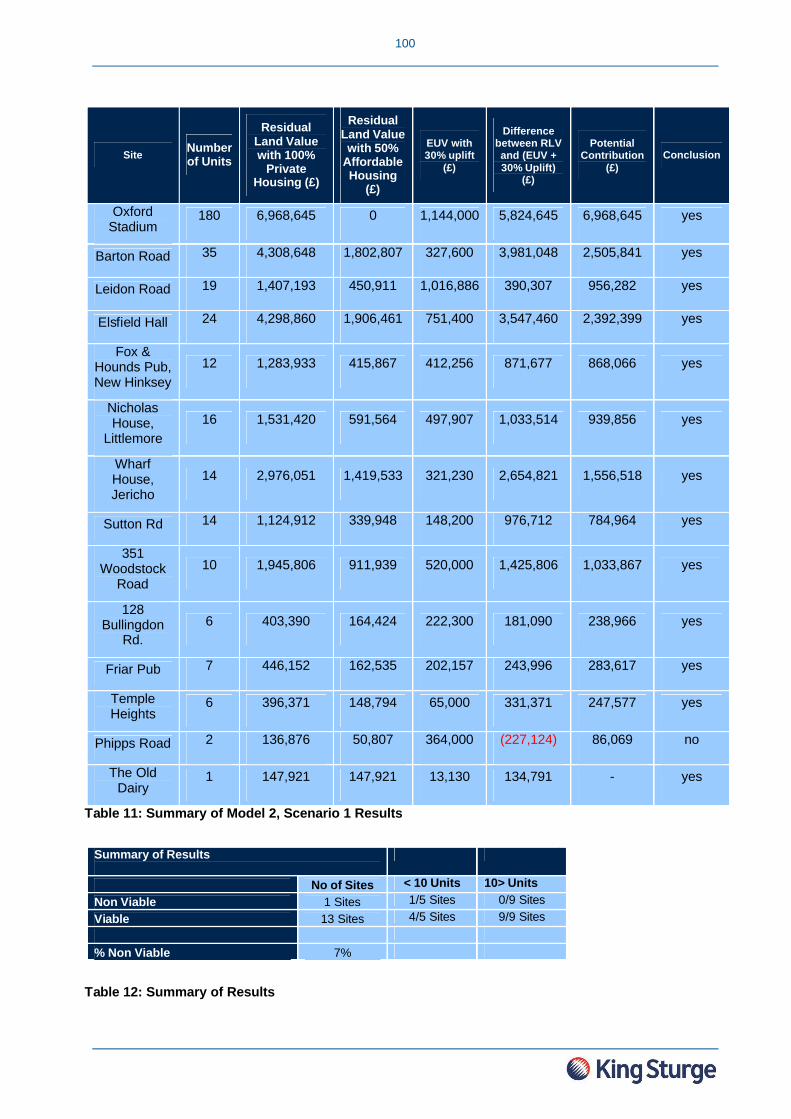
100
Site Number of Units
Residual Land Value with 100%
Private Housing (£)
Residual Land Value with 50%
Affordable Housing
(£)
EUV with 30% uplift
(£)
Difference between RLV and (EUV + 30% Uplift)
(£)
Potential Contribution
(£)Conclusion
Oxford Stadium
180 6,968,645 0 1,144,000 5,824,645 6,968,645 yes
Barton Road 35 4,308,648 1,802,807 327,600 3,981,048 2,505,841 yes
Leidon Road 19 1,407,193 450,911 1,016,886 390,307 956,282 yes
Elsfield Hall 24 4,298,860 1,906,461 751,400 3,547,460 2,392,399 yes
Fox & Hounds Pub, New Hinksey
12 1,283,933 415,867 412,256 871,677 868,066 yes
Nicholas House,
Littlemore16 1,531,420 591,564 497,907 1,033,514 939,856 yes
Wharf House, Jericho
14 2,976,051 1,419,533 321,230 2,654,821 1,556,518 yes
Sutton Rd 14 1,124,912 339,948 148,200 976,712 784,964 yes
351 Woodstock
Road10 1,945,806 911,939 520,000 1,425,806 1,033,867 yes
128 Bullingdon
Rd.6 403,390 164,424 222,300 181,090 238,966 yes
Friar Pub 7 446,152 162,535 202,157 243,996 283,617 yes
Temple Heights
6 396,371 148,794 65,000 331,371 247,577 yes
Phipps Road 2 136,876 50,807 364,000 (227,124) 86,069 no
The Old Dairy
1 147,921 147,921 13,130 134,791 - yes
Table 11: Summary of Model 2, Scenario 1 Results
Table 12: Summary of Results
Summary of Results
No of Sites < 10 Units 10> UnitsNon Viable 1 Sites 1/5 Sites 0/9 SitesViable 13 Sites 4/5 Sites 9/9 Sites
% Non Viable 7%

101
14.91 Scenario 2 Results
14.92 The tables overleaf provide a summary of the results with regard to Scenario 2 ‘cash in-lieu’ of on-site affordable housing provision. The figures contained within the ‘Difference between RLV and Potential Contribution’ column govern a site’s viability under this scenario. If a site is viable, the figure in the ‘Difference between RLV and Potential Contribution’ column will be positive and black; if the site is not viable the figure will be red and in brackets.
14.93 The tables show that when considering the policy compliant approach, there are only two sites which are viable in terms of provided financial contributions in-lieu of on-site provision within Oxford. These are situated within Wolvercote and Jericho and Osney wards, situated to the north of the city.
14.94 This scenario generates a total contribution of £63,718,345 for all the sites; however the potential contribution from the viable sites is only £4,706,819.
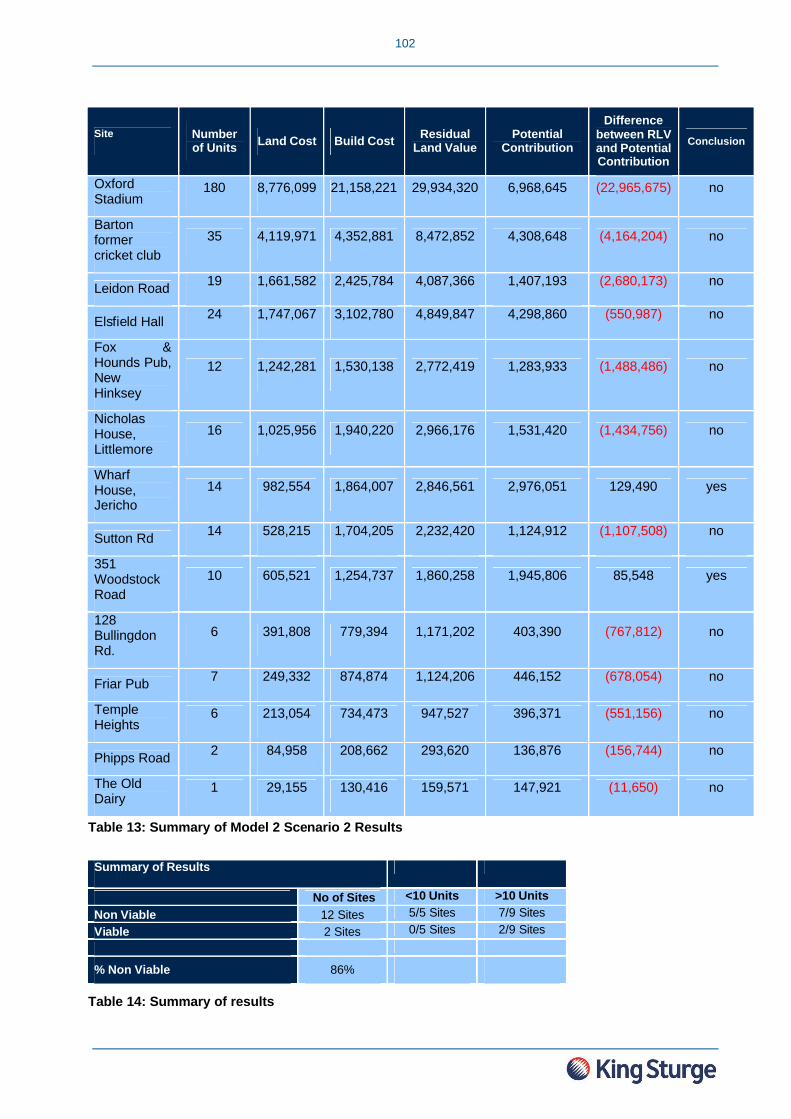
102
Site Number of Units Land Cost Build Cost Residual
Land ValuePotential
Contribution
Difference between RLV and Potential Contribution
Conclusion
Oxford Stadium
180 8,776,099 21,158,221 29,934,320 6,968,645 (22,965,675) no
Barton former cricket club
35 4,119,971 4,352,881 8,472,852 4,308,648 (4,164,204) no
Leidon Road 19 1,661,582 2,425,784 4,087,366 1,407,193 (2,680,173) no
Elsfield Hall 24 1,747,067 3,102,780 4,849,847 4,298,860 (550,987) no
Fox & Hounds Pub, New Hinksey
12 1,242,281 1,530,138 2,772,419 1,283,933 (1,488,486) no
Nicholas House, Littlemore
16 1,025,956 1,940,220 2,966,176 1,531,420 (1,434,756) no
Wharf House, Jericho
14 982,554 1,864,007 2,846,561 2,976,051 129,490 yes
Sutton Rd 14 528,215 1,704,205 2,232,420 1,124,912 (1,107,508) no
351 Woodstock Road
10 605,521 1,254,737 1,860,258 1,945,806 85,548 yes
128 Bullingdon Rd.
6 391,808 779,394 1,171,202 403,390 (767,812) no
Friar Pub 7 249,332 874,874 1,124,206 446,152 (678,054) no
Temple Heights
6 213,054 734,473 947,527 396,371 (551,156) no
Phipps Road 2 84,958 208,662 293,620 136,876 (156,744) no
The Old Dairy
1 29,155 130,416 159,571 147,921 (11,650) no
Table 13: Summary of Model 2 Scenario 2 Results
Table 14: Summary of results
Summary of Results
No of Sites <10 Units >10 UnitsNon Viable 12 Sites 5/5 Sites 7/9 SitesViable 2 Sites 0/5 Sites 2/9 Sites
% Non Viable 86%

103
14.95 Scenario 3 Results
14.96 The following tables provide a summary of the results with regard to Scenario 3 ‘cash in-lieu’ of on-site affordable housing provision. The figures contained within the ‘Difference between Net RLV and EUV’ column govern a site’s viability under this scenario. If a site is viable then the figure in the ‘Difference between Net RLV and EUV’ column will be positive and black and if the site is not viable then the figure will be red and in brackets.
14.97 As shown in the tables overleaf, when testing the proposed formula put forward by OCC, eleven sites are viable in terms of providing financial contributions in-lieu of on-site provision within Oxford. However three sites are currently not viable. These are Bullingdon Road, Leidon Road and Phipps Road. That said, the Bullingdon Road property is not viable by circa £30,000; it would therefore not take a large improvement in the market for this site to become viable.
14.98 This scenario generates a total contribution of circa £12,400,000 for all the sites; however the potential contribution from the viable sites is only circa £11,440,000.

104
Site Number of Units
Gross Development
Value
Potential Contribution
(15% of GDV)
Gross Residual
Land Value
(without AffordableContrib)
Net Residual Land Value
(with Affordable
Contribution)
EUV including 30% Uplift
Difference between Net RLV and EUV
Viable
Oxford Stadium 180 33,940,000 5,091,000 6,968,645 1,877,645 1,144,000 733,645 yes
BartonRoad 35 10,029,000 1,504,350 4,308,648 2,804,298 327,600 2,476,698 yes
Leidon Road 19 4,575,000 686,250 1,407,193 720,943 1,016,886 (295,943) no
Elsfield Hall 24 8,730,000 1,309,500 4,298,860 2,989,360 751,400 2,237,960 yes
Fox & Hounds
Pub, New Hinksey
12 3,335,000 500,250 1,283,933 783,683 412,256 371,427 yes
Nicholas House,
Littlemore16 4,140,000 621,000 1,531,420 910,420 497,907 412,514 yes
Wharf House, Jericho
14 5,690,000 853,500 2,976,051 2,122,551 321,230 1,801,321 yes
Sutton Rd 14 3,370,000 505,500 1,124,912 619,412 148,200 471,212 yes
351 Woodstock
Road10 3,771,500 565,725 1,945,806 1,380,081 520,000 860,081 yes
128 Bullingdon
Rd.6 1,410,750 211,613 403,390 191,778 222,300 (30,523) no
Friar Pub 7 1,577,000 236,550 446,152 209,602 202,157 7,446 yes
Temple Heights 6 1,353,750 203,063 396,371 193,309 65,000 128,309 yes
Phipps Road 2 413,500 62,025 136,876 74,851 364,000 (289,149) no
The Old Dairy 1 330,000 49,500 147,921 98,421 13,130 85,291 yes
Table 16: Summary of Model 2 Scenario 2 Results

105
Table 17: Summary of Results
Summary of Results
No. of Sites <10 Units >10 UnitsNon Viable 3 Sites 2/5 Sites 1/9 SitesViable 11 Sites 3/5 Sites 8/9 Sites
% Non Viable 21%
106
15 PART C: CONCLUSIONS
15.1 We have tested whether the policy requirement of providing 50% affordable housing, in accordance with adopted Oxford City Council’s LDF Core Strategy 2026, is viable. We have done this through financial analysis involving a series of robust and realistic assumptions.
15.2 In order to test the viability we were provided with fourteen sample sites situated within different wards across Oxford. The viability of affordable housing in respect of each site has been considered using the two different models as follows:
1) Based on the specified mix, whether the provision of 50% affordable housing on-site isviable.
2) Based on the specified mix, the level of financial contributions which the development can support ‘in-lieu’ of on-site affordable provision. Three scenarios were considered in respect of this model.
o The first scenario assumes 100% market housing on-site and a financial contribution equivalent to the uplift in land value arising from 100% market housing compared with if 50% affordable housing were provided.
o The second scenario is in accordance with Oxford City Council’s current affordable housing policy - based on 50% affordable housing.
The policy states that financial contributions “in lieu” of on-site provision will be the equivalent of purchasing a site on which to develop the affordable housing provision, as well as the full development costs associated with developing the affordable housing. The anticipated cost of the land together with the development costs will be the level of financial contribution required.
o The third scenario is in accordance with a proposed formula put forward by OCC – based on a contribution equivalent to 15% of the GDV.
15.3 Model 1 – On-site provision of affordable housing
15.4 The financial analysis undertaken in respect of the first model, suggests that nine of the fourteen sites are able to deliver 50% affordable housing on-site. Of the five sites which are not viable, three were situated in the south east of Oxford with one situated in Marston ward to the east and one in St Margaret’s ward in the north. In total, the viable sites could collectively provide 65 affordable housing units.
15.5 It should be noted that when considering the viability of a development where there is 50% affordable housing provision, two of the sites which are not viable - 128 Bullingdon Road and the Friar Pub - are considered unviable by a margin of less than £60,000. As such, a relatively marginal improvement in market conditions would enable the delivery of a policy compliant level of affordable housing on these sites.
15.6 The remaining three sites which not able to deliver 50% of affordable housing based on the proposed schemes - Leidon Road, Phipps Road and Oxford Stadium – are currently unviable by

107
a margin in excess of £300,000. As such, based on the assumptions used within the model, a more significant improvement in market conditions would be required to enable the provision of 50% affordable housing on these sites.
15.7 Model 2 – Financial contribution in-lieu of on-site affordable housing provision
15.8 Whilst the Council’s policy is to seek on-site affordable housing provision on sites where there are ten or more dwellings, as requested by the Council, we have modeled three scenarios relating to financial contributions in-lieu of on-site affordable housing provision for all the sample sites. Our conclusions from this are as follows:
15.9 When considering Model 2, Scenario 1, only one site – Phipps Road – is considered unviable, and therefore unable to make a contribution to contribution to affordable housing. The remaining thirteen sites can provide a total contribution towards affordable housing of £19million.
15.10 When considering Model 2, Scenario 2, which has regard to Oxford City Council’s affordable housing policy, only two of the fourteen sites are considered viable - 351 Woodstock Road and Wharf House, Jericho. These two sites provide enough revenue to purchase an equivalent parcel of land and cover the total build costs of the affordable units. The two viable sites provide an overall contribution of £4.71 million.
15.11 Of the remaining sites only one - the Old Diary - is marginally unviable with a deficit of £11,650. Therefore, a relatively small improvement in market conditions would enable this development to make a contribution. All the remaining sites are unviable by a margin in excess of £150,000. As such, based on the assumptions used within the model, a significant improvement in market conditions would be required for them to be able to make an in-lieu contribution.
15.12 When considering Model 2, Scenario 3, which has regard to Oxford City Council’s Housing Options Paper, three of the fourteen sites are considered unviable – 128 Bullingdon Road, Leidon Road and Phipps Road. The remaining eleven sites provide enough revenue to contribute 15% of the GDV and produce a net residual land value which is higher than the EUV with a 30% uplift. The eleven viable sites provide an overall contribution of £11.44 million.
15.13 Of the unviable sites only one – 128 Bullingdon Road - is marginally unviable with a deficit of £30,523. Therefore, based on the assumptions used within the model, a relatively small improvement in market conditions would enable this development to make a contribution. All the remaining sites are unviable by a margin in excess of £280,000. As such, a significant improvement in market conditions would be required for them to be able to make an in-lieu contribution.
15.14 Critical Site Viability Factors
15.15 The financial analysis undertaken demonstrates there are a number of critical factors which govern a site’s viability in providing 50% affordable housing on-site. These critical factors include site area, the existing use and the site’s location within the City. Other factors which can have an impact is the Code for Sustainable Homes level achieved and its subsequent impact on build cost, in addition to other abnormal costs including infrastructure and remediation works.

108
15.16 The location of the site and its direct link with residential values is the most important critical factor in determining site viability. For example, based on the research, residential values are lowest within the Blackbird Leys ward, and viability may therefore be more of an issue in this area.
15.17 On some of the smaller sites which accommodate fewer than ten dwellings, it is not alwaysviable to provide 50% affordable housing on-site. This is because the revenue generated by a lower proportion of private sector houses is less likely to cross-subsidise the provision of a policy complaint level of affordable housing on-site. This critical factor is demonstrated at the Phipps Road site within the Cowley ward, where based on the assumptions, providing one private and one affordable unit is not viable.
15.18 When purchasing a site for residential development, the EUV will govern the price paid for the site. Therefore if the EUV is a high value use, for example, an occupied health care facility, the relative attractiveness of an alternative use of market and affordable housing may be less attractive than sites with a low use value. This is demonstrated by the Leidon Road site, situated within Lye Valley. Based on our assumptions, this site is not able to support 50% affordable provision on-site, as the EUV is significantly more than if the site was an empty development site.
15.19 In addition, abnormal costs such as remediation or infrastructure works may impact on viability. The Council propose as their preferred option that Part L Building Regulations are complied with in respect of energy efficiency from 2013. The requirement for 20% renewable energy to be provided off site has been factored into the site appraisals within this study. That said, there may be impact on build costs if the developer is seeking to achieve the highest Code for Sustainable Homes level.
15.20 In summary, this section demonstrates there are a number of factors which may impact on viability and that these can not be generalised. As such, case-by-case consideration of each site and proposed scheme is required.
109
16 CONCLUSIONS
16.1 In accordance with OCC’s instructions, this report considers how the proposed affordable housing policy requirements impact on the viability of new development in Oxford in association with S106 contributions. The aim is to enable OCC to have a consistent policy which provides clarity to developers on their requirements.
16.2 Part A of this report considered the Oxford property market, and how this relates to the wider regional and UK markets.
16.3 Part B discussed affordable housing specifically. This part considered the different affordable housing tenures, issues associated with the affordability of housing in Oxford, and the emerging changes to the affordable housing sector.
16.4 Part C related to the financial modelling which tests the proposed policy. The viability of a sample comprising fourteen residential sites has been assessed to determine the likely deliverability of affordable housing. In assessing viability, both on-site provision and contributions in-lieu of on-site provision have been tested.
16.5 It has been demonstrated that 50% affordable housing provision, with 80:20 tenure split in favour of social rent is achievable in a number of instances. We acknowledge that 50% affordable housing provision is not financially viable in every instance involving new residential developments. As such, based on the findings resulting from the financial modelling, we recommend that the policy of 50% affordable housing provision applies, and should be delivered, unless it can be demonstrated in a transparent, open book format that in providing 50% affordable housing provision, the economic viability of the scheme is jeopardised.
16.6 In assessing the viability of a non-policy compliant scheme, the applicant should provide a benchmark in the form of an Existing Use Value (EUV), or Alternative Use Value (AUV), against which the residual of the proposed development is assessed. For a scheme to be considered ‘viable’, it is generally expected that the residual value of the proposed scheme exceeds the EUV or AUV by an appropriate margin – within this report, we have assumed 30%. However this is not fixed and there may be instances where the residual land value does not exceed the EUV/AUV for a justifiable reason, for example, due to unique characteristics of the site or the proposed scheme. In these instances, the Council should expect the applicant’s reasoning to be fully substantiated.
16.7 As noted within the report, the future of affordable housing is currently subject to reforms in terms of how this will be financed, developed and regulated in England. As it is still too early to say what the full implications of this will be, we recommend that OCC keep any details or relevant changes to national planning policy, or the delivery of the proposed affordable rent regime under close review as work on the Development Plan Documents (DPDs) progresses.
16.8 In summary, King Sturge has undertaken a thorough assessment of housing viability in Oxford, which will inform the emerging affordable housing policy being brought forward by the Council. In turn, we anticipate that this will inform OCC’s emerging affordable housing policy which will help deliver the maximum number of affordable homes for the City, whilst achieving a broad balance of housing types and tenures and optimising the energy efficiency and sustainability of new developments.