Aerospace & Defence Investment Opportunites by Frost & Sullivan
21
GIL EUROPE GIL EUROPE Aerospace & Aerospace & Defence Defence May May 2012 2012 Dio Papiomytis Principal Consultant
-
Upload
frost-sullivan -
Category
Business
-
view
1.950 -
download
1
Transcript of Aerospace & Defence Investment Opportunites by Frost & Sullivan

GIL EUROPEGIL EUROPE
Aerospace & Aerospace & DefenceDefence
May May 20122012
Dio PapiomytisPrincipal Consultant

Commercial Aviation

� Rising Middle Class in EMs
� Shift in buying habits (mobile)
� Shift in consumptionhabits (e.g. IFE)
� Rising Middle Class in EMs
� Shift in buying habits (mobile)
� Shift in consumptionhabits (e.g. IFE)
• Shift in passenger behaviour-> focus on travel experience
• Rising fuel costs and green tax-> Green practices / tech
• Poor financial results -> Efficiency seeking (hybrids,
asset management, etc.)
• Shift in passenger behaviour-> focus on travel experience
• Rising fuel costs and green tax-> Green practices / tech
• Poor financial results -> Efficiency seeking (hybrids,
asset management, etc.)
Major Trends in CA Segments
• Requirements forlow emissions / fuelconsumption-> New aircraft programmes/ technologies (composites,MEA-AEA, engines)
• Rising backlog / pressure on supply chains-> restructuring
• Low unit margins-> Aftermarket focus
• Requirements forlow emissions / fuelconsumption-> New aircraft programmes/ technologies (composites,MEA-AEA, engines)
• Rising backlog / pressure on supply chains-> restructuring
• Low unit margins-> Aftermarket focus
• Commercialisation of operations
-> restructuring-> requirement for ROI
• Caps on aeronautical charges-> focus on non-aero revenues
-> Peer benchmarking-> Situational awareness (BI)
• Passenger at the core of operations-> Geolocation / LBS
• Commercialisation of operations
-> restructuring-> requirement for ROI
• Caps on aeronautical charges-> focus on non-aero revenues
-> Peer benchmarking-> Situational awareness (BI)
• Passenger at the core of operations-> Geolocation / LBS

Acknowledged Inefficiencies
Aircraft / GSE damage - $4.3B
Lost Baggage - $3B
Airline Earnings (or lack of) – 2003-12
FOD Damage- $1B
+ Lost assets, low productivity, dispersed
data, surplus inventories,
high capex, high fuel consumption…
+ Lost assets, low productivity, dispersed
data, surplus inventories,
high capex, high fuel consumption…
Source: IATA

Investment Attractiveness
HIGH
GROUND HANDLINGAttributesMarket Size: $35B
AVIONICSAttributesMarket Size: $5B
CABIN INTERIORS
AttributesMarket Size: $5BGrowth 2012-16: 8.5%Op. Margins: 14%Concentration: Mid-High
Major Trend: Consolidation
AIRPORTSAttributesMarket Size: $74BGrowth 2012-16: 6%Op. Margins: 17%Concentration: Very Low
Major Trend: Commercialisation
IT
AttributesMarket Size: $10BGrowth 2012-16: 10%Op. Margins: 5.5%Concentration: Low
Major Trend: Integration
MRO
AttributesMarket Size: $48B
MID
LOW
AIRLINES
AttributesMarket Size: $550BGrowth 2012-16: 8.2%Op. Margins: 1.3%Concentration: Very Low
Major Trend: Consolidation
AIRCRAFT OEMs
AttributesMarket Size: $100BGrowth 2012-16: 9.3%Op. Margins: 3.95%Concentration: Very HighMajor Trend: Supply Chain Optimisation
Market Size: $35BGrowth 2012-16: 7%Op. Margins:4.4%Concentration: Very Low
Major Trend: Consolidation
ENGINE OEMs
AttributesMarket Size: $34BGrowth 2012-16: 10.5%Op. Margins: 10%Concentration: Very HighMajor Trend: Aftermarket Services (MRO / FHM)
Market Size: $5BGrowth 2012-16: 6.4%Op. Margins: 11%Concentration: Mid-High
Major Trend: Expansion
Market Size: $48BGrowth 2012-16: 3.5%Op. Margins: 7%Concentration: Mid-High
Major Trend: Alliances
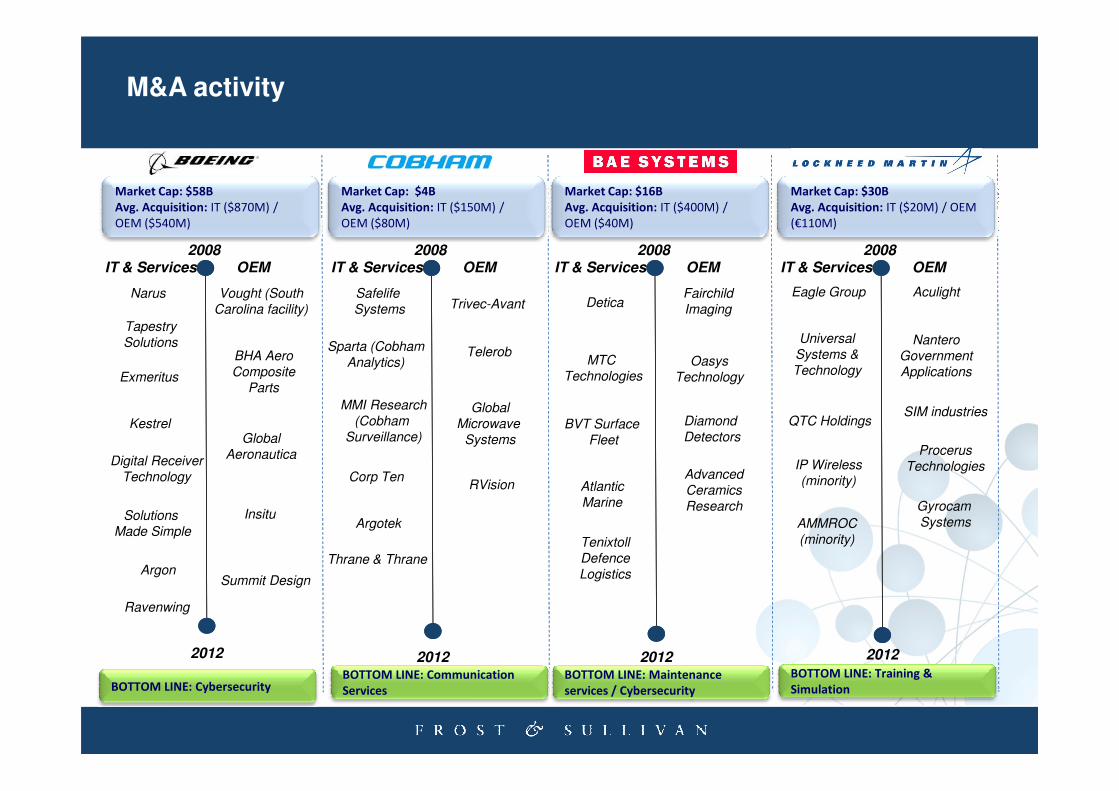
M&A activity
2008
IT & Services OEM
Narus
Tapestry
Solutions
Exmeritus
Vought (South
Carolina facility)
Market Cap: $58B
Avg. Acquisition: IT ($870M) /
OEM ($540M)
2008
IT & Services OEM
Sparta (Cobham
Analytics)
Safelife
Systems Trivec-Avant
Telerob
Market Cap: $4B
Avg. Acquisition: IT ($150M) /
OEM ($80M)
2008
IT & Services OEM
MTC
Technologies
Fairchild
Imaging
Oasys
Technology
Market Cap: $16B
Avg. Acquisition: IT ($400M) /
OEM ($40M)
2008
IT & Services OEM
Market Cap: $30B
Avg. Acquisition: IT ($20M) / OEM
(€110M)
Eagle Group Aculight
Nantero
Government
Applications
Universal
Systems &
TechnologyBHA Aero
Composite
Parts
Detica
2012
Kestrel
Digital Receiver
Technology
Solutions
Made Simple
Argon
Ravenwing
Global
Aeronautica
Insitu
Summit Design
2012
MMI Research
(Cobham
Surveillance)
Corp Ten
2012
BVT Surface
Fleet
Diamond
Detectors
Advanced
Ceramics
Research
Atlantic
Marine
2012
BOTTOM LINE: CybersecurityBOTTOM LINE: Communication
Services
Argotek
Global
Microwave
Systems
Thrane & Thrane
RVision
BOTTOM LINE: Maintenance
services / Cybersecurity
Tenixtoll
Defence
Logistics
BOTTOM LINE: Training &
Simulation
QTC HoldingsSIM industries
Procerus
Technologies
Gyrocam
Systems
IP Wireless
(minority)
AMMROC
(minority)

M&A activity
2008
IT & Services OEM
L-1 Identity
Solutions
GE Homeland
Protection
Market Cap: $15.5B
Avg. Acquisition: IT (n/a) / OEM
($700M)
2008
IT & Services OEM
HARCO Labs
McKechnie
Aerospace
Telair’s Actuation
Business
Market Cap: $6.4B
Avg. Acquisition: IT (n/a) / OEM
($180M)
2008
IT & Services OEM
Kongsberg’s
Aviation Assets
B&R Machine &
Tool
Market Cap: $3B
Avg. Acquisition: IT (n/a) / OEM
($240M)
2008
IT & Services OEM
Market Cap: $16B
Avg. Acquisition: IT (n/a) / OEM
($300M)
TEAC
Aerospace
Merritt Tool
Aviation
Network
ServicesSkyline
Industries
Recon/Optical’s
2012 2012
Amsafe
Global
Holdings
2012 2012
BOTTOM LINE: Security BOTTOM LINE: Aerospace Tier 2 BOTTOM LINE: Aerostructures BOTTOM LINE: Aerospace Tier 2
SNPE Materiaux
Energetiques
SDU Identification
JV: Sagembat
Defence
JV: Snecbat
Engine
Semco
Instruments
CEF Industries
Aircraft Parts
Corporation
ACME
Schneller
Holdings
Merritt Tool
Mexmil Company
Fabritech
Saygrove
Defence &
Aerospace
Vought Aircraft
Industries
Recon/Optical’s
Assets
Cloud Cap
Technology
Crompton
Technology
Winslow
Marine Products
Microtecnica
AIS Global
Dukes Inc
MRO MRO MRO

Market Opportunities
� Electro-Mechanical Actuation
� Composites and Applications
� PMA
Manufacturing IT Aftermarket
� Business Integration
� Asset Management Solutions (Airport, MRO)
� Cloud Computing
� Asset Management (off-balance sheet)
� Equipment Condition Monitoring
� PMA
� (Welding) services
� Ground Support Equipment (scale) –buyout and roll up
� Cloud Computing
� Aircraft Connectivity (Satellite / Wireless)
� Geolocation & Airport LBS

Defence

30%
70%
Budget
allocated to
Procurement
Other
Operating
Costs
Global Defence Budget Forecast by Region (2011-2020)
0
200
400
600
800
1000
1200
1400
1600
1800
2011 2012 2013 2014 2015 2016 2017 2018 2019 2020
Global Defence Expenditure (2011-2020)
Global Defence Budgets: A cost conscious approach
In U
SD
Bill
ion
• Defence budget continues to grow steadily, driven by EMs
• Cost conscious technology acquisition – focus on Equipment TLCM
• Decline in Supply R&D spending
• Suppliers increasingly looking towards new geographies and new sectors (e.g. Security due to similar customer requirements)
North America Europe APAC Middle East Latin America Africa
439 438 438444
451458
466
476
486
496
400
410
420
430
440
450
460
470
480
490
500
510
2011 2012 2013 2014 2015 2016 2017 2018 2019 2020
Global Defence Procurement Spending Forecast (2011-2020)
CARG = 1.2%CARG = 1.2%
In U
SD
Bill
ion

1
3
2
High(>10%)
CA
GR
fo
r V
erti
cal M
arkets
Sectors with highest total growth potential
Unmanned Systems1
Military Airlift
2 Force Protection
3
Combat Aircraft4
5 Land Combat Systems
1
2
Key Defence Markets: Tactical Surveillance and C4ISTAR reassure their supremacy as key segments of growth Key Defence Markets
3
6
9
5
8
7
4
Small (<$2 billion)
Large(>$5 Billion)
Market Size of Vertical Markets
Low(0-5%)
CA
GR
fo
r V
erti
cal M
arkets
Medium($2-$5 Billion)
Medium(5-10%) 6 Soldier Modernisation
7
8
Strategic & Tactical Comms
9
Training and Simulation
Command and Control
CAGR is calculated from 2010 - 2014
1 Tactical Surveillance
2 C4ISTAR

• Companies looking to expand their Unmanned Systems product offerings through partnering and acquisition
• The UAS industry in the U.S. is highly concentrated with approximately 80 percent of the market held by four companies (General Atomics, Northrop Grumman, Boeing and Aerovironment)
• Large UAVs are expected to see just over 2.07% CAGR between 2011-2020, whilst Small and Mini UAVs expect over 12.2%. APAC is expected to be fastest growing market in the next decade.
Unmanned
Systems
Unmanned
Systems
Key Technology FocusMarket FocusUnmanned Aerial Systems
Total Military UAS Spending Forecast – Split by Region (2011-2020)
Where to invest?
• New technologies can be found within universities and SMEs
• Companies with multi-application solutions for the civil UAS market (i.e. firefighting, border surveillance, broadcasting, agriculture)

Growth Potential of Opportunities
HighUAS
Ground Mobile
C4ISR Market: Priority Product Areas 2011-2020
C4ISR
• Estimated to be worth over $15B in 2020, C4ISR solutions continue to be priority in MoD spending due to the rapid technological developments
• Europe will grow at1.0% CAGR between 2011-2020, with APAC and ME expected to reach 7% and 6% CAGR respectively
Market FocusC4ISR
Where to Invest?
Attractiveness of Opportunities
Low Medium High
Low
Medium
Force Tracking
VehicleC2
System
Low Priority Medium Priority High Priority
SDR
Multi-bandRadar
Ground
Station
AirborneConsoles
SystemsSubmarine
SystemsCombatships
Fire ControlSystem
SATCOM
SystemsFast Jets
SystemsTransport
planesSystemsRotary Wings
SystemsPetrol ships
Datalinks MANET
R&TSystem
Soldier Device
• Focus on innovation and integration capabilities are key for suppliers. Suppliers with modular and COTS products have a competitive advantage.
• EMs with a relatively young C4ISR industry and heavy modernisation requirements in APAC, ME and LATAM (e.g. Embraer-Atechpartial acquisition)
• Tier 2 and 3 suppliers with early wins but in search of further funding

Security

Integrated Security one of the major Global Trends
Integrated
SecurityIncreasing
Innovation
Increased
Technological
Sophistication
Shift in Global
Balance of Power
Green Buildings
Top Ten Future Trends Affecting Security
$ B
illio
ns
Global Civil Security Spending by Region, 2010 - 2020
153045607590
105120135150165180195210
46 50 53 54.5 55 56 58 60 61 65 66
32 36 37 38 38.5 40 44 45 46 47 483032 33 34 36 40 42 45 47 48 50
810 11 12 14 15
17 19 20 22 25
45 6 8 9 8
88 9
1015
Top Ten Global Trends
Smart
Architecture &
Management
New Energy
Aging PopulationImproved IT
BackbonePreventative
Healthcare
�The global security market size is $140 billion and is expected to reach $200 billion by 2020.
�Growth is primarily driven by the US and EMs such as APAC and Middle East
�This excludes cyber security spending (est. $60B, to grow to $140B)
015
2010 2011 2012 2013 2014 2015 2016 2017 2018 2019 2020
46 50
North America Europe
APAC (Including India and China) Middle East
South America
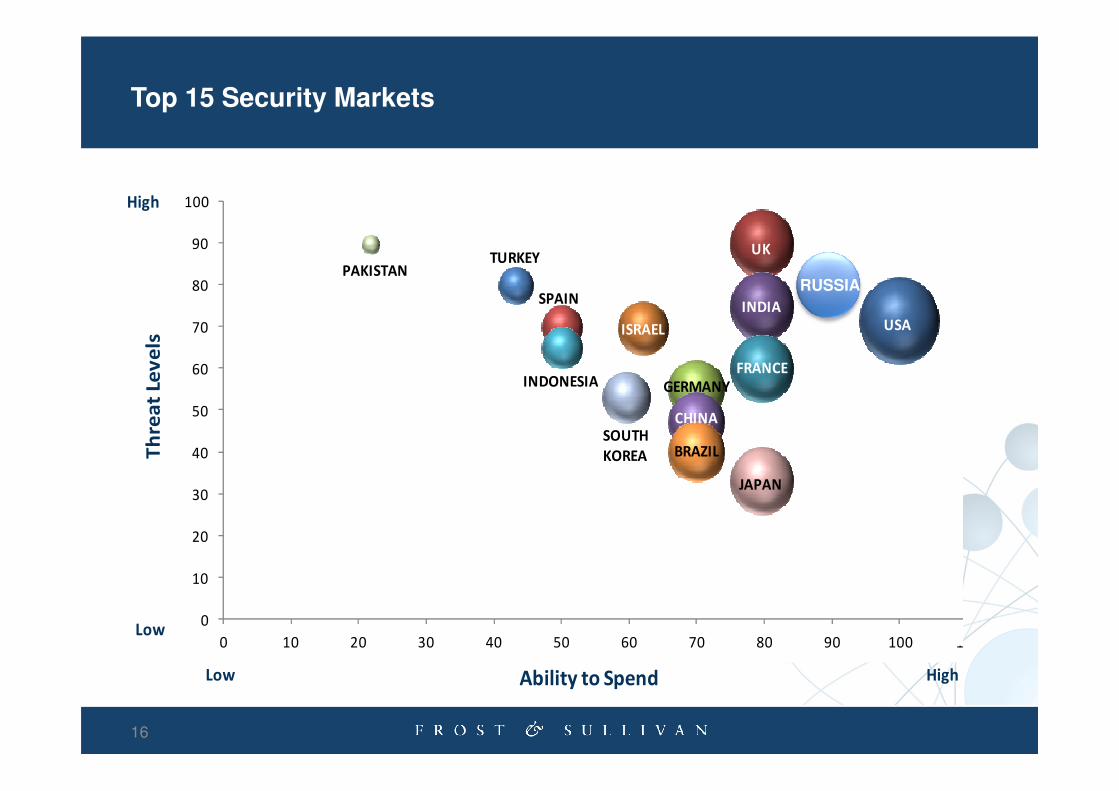
Top 15 Security Markets
High
Th
rea
t Le
ve
ls
60
70
80
90
100
USA
UK
INDIA
FRANCE
PAKISTAN
GERMANY
ISRAEL
TURKEY
INDONESIA
SPAINRUSSIA
16
Low
Th
rea
t Le
ve
ls
HighAbility to SpendLow
0
10
20
30
40
50
0 10 20 30 40 50 60 70 80 90 100 110
JAPAN
GERMANY
CHINA
BRAZILSOUTH
KOREA

Growth Segments
Infrastructure: Government-backed
projects to prove resilient to economic
recession
Education
Government: National and International
organizations (IATA, ICAO, EUROCONTROL) are
unwilling to reduce security investments in favour of
cost cutting.
High
(>10%)
CA
GR
fo
r V
ert
ica
l M
ark
ets
Healthcare
Gaming and
CasinosLow - Negative
(-5%-5%)
CA
GR
fo
r V
ert
ica
l M
ark
ets
Medium
(5-10%)
Large
Market Size of Vertical Markets
MediumSmall
billion)
Healthcare
Banking and FinanceCommercial
Residential

Emerging Technologies / Practices
Biometrics is increasingly becoming standard in Governmental
applications (e.g. e-passports etc)
The growing importance of integration of security systems with other building management systems has led to the growth of PSIM solutions. Increasingly used to protect critical infrastructure, PSIM
has gained some traction in commercial security as well.
IP-surveillance and the use of multi-mega pixel technology has driven growth for IT storage solutions (SAN/NAS/DAS), reducing the cost per GB of storage and enabling end users to record and
store more video at lower operational cost
Hig
h G
row
th
IP Storage (SAN/NAS/DAS)
High Resolution Cameras
Video Analytics
Biometrics
PSIM
Security as a Service: Following the trend of moving security systems into more IT-related
areas, vendors are focusing on providing managed services (remote monitoring/
management).
Lo
w G
row
th
Mature Technology Emerging Technology
SaaS(Security/Software as a
Service)
Electronic Access Control
IP Cameras
DVRs/NVRs
Analytics
Analogue Cameras
Intrusion Detection

Safe Cities
Integration of existing and new security infrastructure to optimise resources, reduce traffic congestion, improve services to citizens and businesses, and make the city smarter, more secure, and more efficient
New York
Los Angeles
London
TokyoShanghai
Beijing
SeoulHong Kong
Singapore
Moscow
São Paulo
Washington D.C.
Atlanta
San Francisco
Miami
Houston
Toronto
Mumbai
Sydney
PhoenixDenver
Buenos Aires Minneapolis
Madrid Busan
Metro
ChongqingJakarta
Boston
Extr
em
e
Cert
ain
tyH
igh
C
ert
ain
ty
Mexico City
19
Osaka
Chicago
GuangzhouDetroit
BangkokRio de Janeiro
Dallas
Philadelphia
Melbourne
SeattleIstanbul
Pittsburgh
San Diego
TampaTianjin
Metro Manila
Paris
Fukuoka
St. Petersburg
Milan
CairoCleveland
Manchester
St. Louis
Monterrey
Vienna
Baltimore
Basic Level of Surveillancedeployment and Integration
Healthy Economy Strong Economy Powerful Economy
Hig
h
Cert
ain
tyS
tro
ng
C
ert
ain
ty
Source: Frost & Sullivan analysis.
Deployment and Integration of Surveillance and Response
capabilities
Deployment and Integration of Detection , Response and
Mitigation capabilities
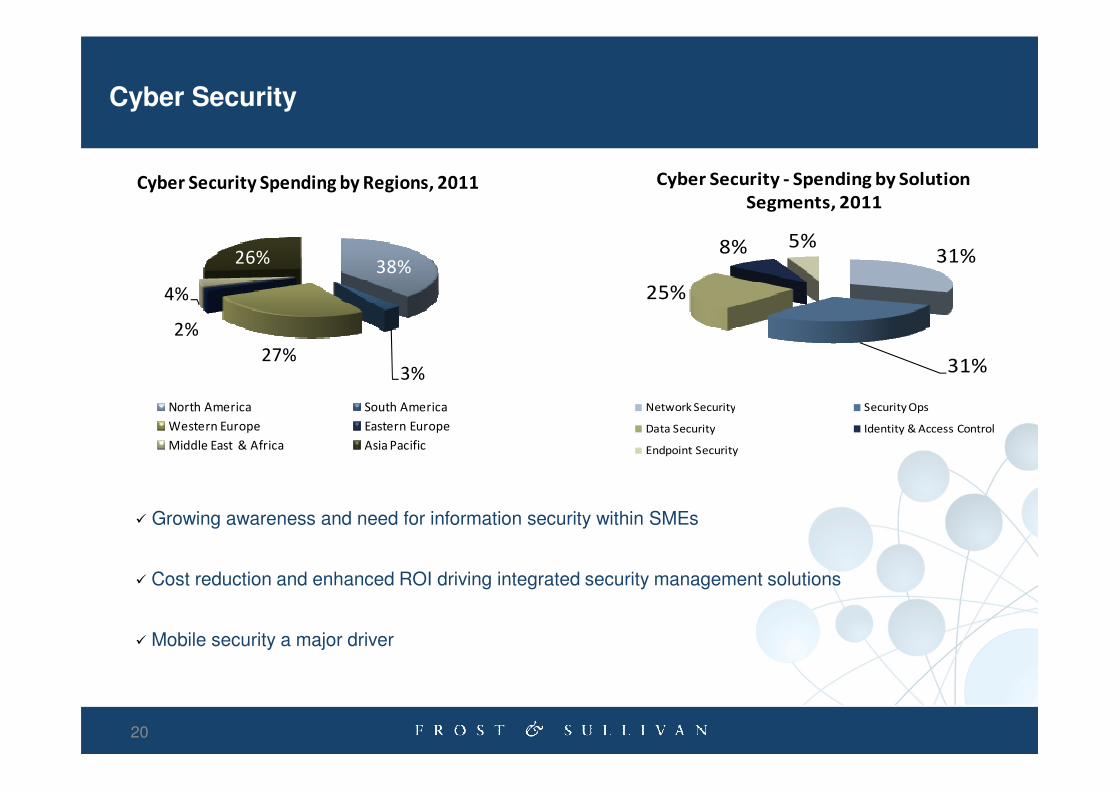
Cyber Security
38%
3%27%
2%
4%
26%
Cyber Security Spending by Regions, 2011
31%
31%
25%
8% 5%
Cyber Security - Spending by Solution
Segments, 2011
20
North America South America
Western Europe Eastern Europe
Middle East & Africa Asia Pacific
Network Security Security Ops
Data Security Identity & Access Control
Endpoint Security
� Growing awareness and need for information security within SMEs
� Cost reduction and enhanced ROI driving integrated security management solutions
� Mobile security a major driver

Conclusions
COMMERCIAL AVIATION:
� Changing business models and supply chain shifts across commercial aviation markets
� Opportunities in Services and Aftermarket
DEFENCE:
�Stable defence budgets, with focus on TLCM
21
� Opportunities in Mini UAVs and Communications
SECURITY:
� High growth market, driven by Critical Infrastructure projects and Cyber
� Opportunities in Integration and Managed Services (SaaS)