AEROGROW INTERNATIONAL, INC.
43
UNITED STATES SECURITIES AND EXCHANGE COMMISSION Washington, DC 20549 FORM 10-Q (MARK ONE) X QUARTERLY REPORT PURSUANT TO SECTION 13 OR 15(d) OF THE SECURITIES EXCHANGE ACT OF 1934 For the quarterly period ended September 30, 2020 OR ☐ TRANSITION REPORT PURSUANT TO SECTION 13 OR 15(d) OF THE SECURITIES EXCHANGE ACT For the transition period from ______________ to ______________ Commission File No. 001-33531 AEROGROW INTERNATIONAL, INC. (Exact Name of Registrant as specified in its charter) NEVADA 46-0510685 (State or other jurisdiction of incorporation or organization) (IRS Employer Identification Number) 5405 Spine Rd, Boulder, Colorado 80301 (Address of principal executive offices) (Zip Code) (303) 444-7755 (Registrant’s telephone number, including area code) Securities registered pursuant to Section 12(b) of the Act: None Securities registered pursuant to Section 12(g) of the Act: Title of each class Trading Symbol(s) Name of each exchange on which registered Common Stock, par value $0.001 per share AERO OTCQB Indicate by check mark whether the registrant (1) has filed all reports required to be filed by Section 13 or 15(d) of the Securities Exchange Act of 1934 during the preceding 12 months (or for such shorter period that the registrant was required file such reports), and (2) has been subject to such filing requirements for the past 90 days. Yes X No ☐ Indicate by check mark whether the registrant has submitted electronically every Interactive Data File required to be submitted pursuant to Rule 405 of Regulation S-T (§232.405 of this chapter) during the preceding 12 months (or for such shorter period that the registrant was required to submit such files). Yes X No ☐ Indicate by check mark whether the registrant is a large accelerated filer, an accelerated filer, a non-accelerated filer, or a smaller reporting company. See the definitions of "large accelerated filer,” "accelerated filer” and "smaller reporting company” in Rule 12b-2 of the Exchange Act. Large accelerated filer ☐ Accelerated filer ☐ Non-accelerated filer X Smaller reporting company X Emerging growth company ☐ If an emerging growth company, indicate by check mark if the registrant has elected not to use the extended transition period for complying with any new or revised financial accounting standards provided pursuant to Section 13(a) of the Exchange Act. ☐ Indicate by check mark whether the registrant is a shell company (as defined in Rule 12b-2 of the Exchange Act). Yes ☐ No X Number of shares of issuer’s common stock outstanding as of November 9, 2020: 34,328,036
Transcript of AEROGROW INTERNATIONAL, INC.

UNITED STATESSECURITIES AND EXCHANGE COMMISSION
Washington, DC 20549
FORM 10-Q
(MARK ONE)
X QUARTERLY REPORT PURSUANT TO SECTION 13 OR 15(d) OF THE SECURITIES EXCHANGE ACT OF 1934 For the quarterly period ended September 30, 2020
OR
☐☐ TRANSITION REPORT PURSUANT TO SECTION 13 OR 15(d) OF THE SECURITIES EXCHANGE ACT For the transition period from ______________ to ______________
Commission File No. 001-33531
AEROGROW INTERNATIONAL, INC.(Exact Name of Registrant as specified in its charter)
NEVADA 46-0510685
(State or other jurisdictionof incorporation or organization)
(IRS EmployerIdentification Number)
5405 Spine Rd, Boulder, Colorado 80301
(Address of principal executive offices) (Zip Code)
(303) 444-7755(Registrant’s telephone number, including area code)
Securities registered pursuant to Section 12(b) of the Act:
None
Securities registered pursuant to Section 12(g) of the Act: Title of each class Trading Symbol(s) Name of each exchange on which registered
Common Stock, par value $0.001 per share AERO OTCQB
Indicate by check mark whether the registrant (1) has filed all reports required to be filed by Section 13 or 15(d) of the Securities Exchange Act of 1934 during the preceding 12months (or for such shorter period that the registrant was required file such reports), and (2) has been subject to such filing requirements for the past 90 days. Yes X No☐ Indicate by check mark whether the registrant has submitted electronically every Interactive Data File required to be submitted pursuant to Rule 405 of Regulation S-T (§232.405 ofthis chapter) during the preceding 12 months (or for such shorter period that the registrant was required to submit such files). Yes X No ☐ Indicate by check mark whether the registrant is a large accelerated filer, an accelerated filer, a non-accelerated filer, or a smaller reporting company. See the definitions of "largeaccelerated filer,” "accelerated filer” and "smaller reporting company” in Rule 12b-2 of the Exchange Act. Large accelerated filer ☐ Accelerated filer ☐
Non-accelerated filer X Smaller reporting company XEmerging growth company ☐
If an emerging growth company, indicate by check mark if the registrant has elected not to use the extended transition period for complying with any new or revised financialaccounting standards provided pursuant to Section 13(a) of the Exchange Act. ☐ Indicate by check mark whether the registrant is a shell company (as defined in Rule 12b-2 of the Exchange Act). Yes ☐ No X
Number of shares of issuer’s common stock outstanding as of November 9, 2020: 34,328,036

AeroGrow International, Inc.TABLE OF CONTENTSFORM 10-Q REPORTSeptember 30, 2020
PART I Financial Information Item 1. Financial Statements 3 Condensed Balance Sheets as of September 30, 2020 (Unaudited) and March 31, 2020 3 Condensed Statements of Operations for the Three and Six Months Ended September 30, 2020 and 2019 (Unaudited) 4 Condensed Statements of Changes in Stockholders’ Equity for the Three Months Ended September 30, 2020 and 2019 (Unaudited) 5 Condensed Statements of Changes in Stockholders’ Equity for the Six Months Ended September 30, 2020 and 2019 (Unaudited) 5 Condensed Statements of Cash Flows for the Six Months Ended September 30, 2020 and 2019 (Unaudited) 6 Notes to the Condensed Financial Statements (Unaudited) 7 Item 2. Management’s Discussion and Analysis of Financial Condition and Results of Operations 20Item 3. Quantitative and Qualitative Disclosures About Market Risk 35Item 4. Controls and Procedures 35 PART II Other Information Item 1. Legal Proceedings 36Item 1A. Risk Factors 36Item 2. Unregistered Sales of Equity Securities and Use of Proceeds 37Item 3. Defaults Upon Senior Securities 37Item 4. Mine Safety Disclosures 38Item 5. Other Information 38Item 6. Exhibits 38 Signatures 39

Table of Contents PART I - FINANCIAL INFORMATION Item 1. Condensed Financial Statements
AEROGROW INTERNATIONAL, INC.CONDENSED BALANCE SHEETS
September 30,
2020 March 31,
2020
(in thousands, except share and per share data) (Unaudited) (Derived from
Audited Statements) ASSETS Current assets
Cash $ 3,815 $ 9,046 Restricted cash 15 15 Accounts receivable, net of allowance for doubtful accounts of $694 and $376 at September 30, 2020 and March 31,
2020, respectively 6,217 3,422 Other receivables 391 257 Inventory, net 12,849 4,788 Prepaid expenses and other 3,773 1,392
Total current assets 27,060 18,920 Property and equipment and intangible assets, net of accumulated depreciation of $5,789 and $5,467 at September 30, 2020
and March 31, 2020, respectively 2,142 1,229 Operating lease right-of-use 1,158 1,229 Deposits 754 669
Total assets $ 31,114 $ 22,047 LIABILITIES AND STOCKHOLDERS' EQUITY Current liabilities
Accounts payable $ 5,583 $ 2,332 Accounts payable related party 1,075 2,396 Accrued expenses 3,842 2,308 Finance lease liability 7 29 Notes payable related party 2,000 - Debt associated with sale of intellectual property 14 17 Operating lease liability-current portion 141 58
Total current liabilities 12,662 7,140 Long term liabilities
Notes payable related party 900 900 Operating lease liability 1,129 1,201 Other liability - 297
Total liabilities 14,691 9,538 Commitments and contingencies Stockholders' equity
Preferred stock, $.001 par value, 20,000,000 shares authorized, 0 issued and outstanding at September 30, 2020 and 2019,respectively - -
Common stock, $.001 par value, 750,000,000 shares authorized, 34,328,036 shares issued and outstanding at September30, 2020 and March 31, 2020 34 34
Additional paid-in capital 140,817 140,817 Accumulated deficit (124,428) (128,342)
Total stockholders' equity 16,423 12,509 Total liabilities and stockholders' equity $ 31,114 $ 22,047
See accompanying notes to the condensed financial statements.
3

Table of Contents
AEROGROW INTERNATIONAL, INC.CONDENSED STATEMENTS OF OPERATIONS
(Unaudited)
Three Months ended
September 30, Six Months ended
September 30, (in thousands, except per share data) 2020 2019 2020 2019 Net revenue $ 14,310 $ 4,423 $ 30,721 $ 8,898 Cost of revenue 8,403 2,958 17,457 5,977
Gross profit 5,907 1,465 13,264 2,921 Operating expenses
Research and development 294 276 595 487 Sales and marketing 2,888 1,369 5,703 2,772 General and administrative 1,406 893 2,980 1,787 Total operating expenses 4,588 2,538 9,278 5,046
Income (loss) from operations 1,319 (1,073) 3,986 (2,125) Other (expense), net
Interest expense – related party (24) (52) (47) (54)Other (expense), net (29) (1) (25) (5)Total other (expense), net (53) (53) (72) (59)
Net income (loss) $ 1,266 $ (1,126) $ 3,914 $ (2,184)Net income (loss) per share, basic and diluted $ 0.04 $ (0.03) $ 0.11 $ (0.06) Weighted average number of common shares outstanding, basic and
diluted 34,328 34,328 34,328 34,328
See accompanying notes to the condensed financial statements. 4

Table of Contents
AEROGROW INTERNATIONAL, INC.STATEMENT OF CHANGES IN STOCKHOLDERS’ EQUITY
Three months ended September 30, 2020 Additional Total (in thousands, Preferred Stock Common Stock Paid-in Accumulated Stockholders except share data) Shares Amount Shares Amount Capital (Deficit) Equity Balances, June 30, 2020 - $ - 34,328,036 $ 34 $ 140,817 $ (125,694) $ 15,157 Net income - - - - - 1,266 1,266 Balances, September 30, 2020 - $ - 34,328,036 $ 34 $ 140,817 $ (124,428) $ 16,423 Three months ended September 30, 2019 Additional Total (in thousands, Preferred Stock Common Stock Paid-in Accumulated Stockholders except share data) Shares Amount Shares Amount Capital (Deficit) Equity Balances, June 30, 2019 - $ - 34,328,036 $ 34 $ 140,817 $ (128,457) $ 11,394 Net income - - - - - (1,126) (1,126)Balances, September 30, 2019 - $ - 34,328,036 $ 34 $ 140,817 $ (130,583) $ 10,268
Six months ended September 30, 2020 Additional Total (in thousands, Preferred Stock Common Stock Paid-in Accumulated Stockholders except share data) Shares Amount Shares Amount Capital (Deficit) Equity Balances, March 31, 2020 - $ - 34,328,036 $ 34 $ 140,817 $ (128,342) $ 12,509 Net income - - - - - 3,914 3,914 Balances, September 30, 2020 - $ - 34,328,036 $ 34 $ 140,817 $ (124,428) $ 16,423 Six months ended September 30, 2019 Additional Total (in thousands, Preferred Stock Common Stock Paid-in Accumulated Stockholders except share data) Shares Amount Shares Amount Capital (Deficit) Equity Balances, March 31, 2019 - $ - 34,328,036 $ 34 $ 140,817 $ (128,399) $ 12,452 Net income - - - - - (2,184) (2,184)Balances, September 30, 2019 - $ - 34,328,036 $ 34 $ 140,817 $ (130,583) $ 10,268
See accompanying notes to the condensed financial statements.
5

Table of Contents
AEROGROW INTERNATIONAL, INC.CONDENSED STATEMENTS OF CASH FLOWS
(Unaudited)
Six Months Ended
September 30, 2020 2019 (in thousands) Cash flows from operating activities:
Net income (loss) $ 3,914 $ (2,184)Adjustments to reconcile net loss to net cash used by operations:
Depreciation and amortization expense 322 264 Amortization of lease liability and right-of-use asset 82 63 Bad debt expense 236 33 Inventory allowance 109 (15)Accretion of debt associated with sale of intellectual property (9) (13)
Change in operating assets and liabilities: (Increase) decrease in accounts receivable (3,031) 1,344 (Increase) decrease in other receivable (134) 99 (Increase) in inventory (8,170) (2,953)(Increase) in prepaid expense and other (2,481) (961)Decrease (increase) in deposits 15 (731)Increase in accounts payable and accounts payable related party 1,930 516 Increase (decrease) in accrued expenses and other liability 1,243 (143)Increase in accrued interest-related party - 16 (Decrease) in customer deposits - (57)
Net cash (used) by operating activities (5,974) (4,722)Cash flows from investing activities:
Purchases of equipment (1,235) (396)Net cash (used) by investing activities (1,235) (396)Cash flows from financing activities:
Proceeds from notes payable-related party 2,000 4,400 Repayment of capital lease (22) (26)
Net cash provided by financing activities 1,978 4,374 Net (decrease) in cash (5,231) (744)Cash and cash equivalents and restricted cash, beginning of period 9,061 1,756 Cash and cash equivalents and restricted cash, end of period $ 3,830 $ 1,012
See supplemental disclosures below and the accompanying notes to the condensed financial statements.
6

Table of Contents Continued from previous page
Six months endedSeptember 30,(in thousands)
2020 2019 Cash paid during the year for:
Interest-related party $ 47 $ - Income taxes $ - $ -
Supplemental disclosure of non-cash investing and financing activities: Initial recognition of right-of-use asset (Note 8) $ - $ 805 Initial lease liability arising from right-of-use asset (Note 8) $ - $ 805
7

Table of Contents
AEROGROW INTERNATIONAL, INC.NOTES TO THE CONDENSED FINANCIAL STATEMENTS
(Unaudited)
1. Description of the Business AeroGrow International, Inc. (collectively, the "Company,” "AeroGrow,” "we,” "our,” or "us”) was incorporated in the State of Nevada on March 25, 2002. The Company’sprincipal business is developing, marketing, and distributing advanced indoor aeroponic garden systems designed and priced to appeal to the consumer gardening, cooking andsmall indoor appliance markets worldwide. The Company manufactures, distributes and markets ten different models of its AeroGarden systems in multiple colors, as well as over40 varieties of seed pod kits and a full line of accessory products through multiple channels, including retail distribution (via online retail outlets and brick and mortar) storefronts,catalogue and direct-to-consumer sales primarily in the United States and Canada, as well as selected countries in Europe. 2. Basis of Presentation, Liquidity and Summary of Significant Accounting Policies Basis of PresentationThe unaudited interim financial statements of the Company included herein have been prepared in accordance with the rules and regulations of the Securities and ExchangeCommission ("SEC”) for interim reporting including the instructions to Form 10-Q and Rule 10-01 of Regulation S-X. These condensed statements do not include all disclosuresrequired by accounting principles generally accepted in the United States of America ("U.S. GAAP”) for annual audited financial statements and should be read in conjunctionwith the Company’s audited financial statements and related notes included in the Company’s Annual Report on Form 10-K for the year ended March 31, 2020, ("Fiscal 2020”), asfiled with the SEC on June 23, 2020. In the opinion of management, the accompanying unaudited interim financial statements reflect all adjustments, including recurring adjustments, necessary to present fairly thefinancial position of the Company at September 30, 2020, the results of operations for the three and six months ended September 30, 2020 and 2019, and the cash flows for the sixmonths ended September 30, 2020 and 2019. The results of operations for the three and six months ended September 30, 2020 are not necessarily indicative of the expected resultsof operations for the fiscal year ended March 31, 2021 ("Fiscal 2021”) or any future period. In this regard, the Company’s business has historically been highly seasonal, withapproximately 60.6% of revenues in the fiscal year ended March 31, 2020 ("Fiscal 2020”) occurring in the five consecutive calendar months from September throughJanuary. During the six-month period ended September 30, 2020, the Company has further expanded its distribution channels and invested in necessary inventory and overhead inanticipation of the Fiscal 2021 peak sales season. The balance sheet as of March 31, 2020 is derived from the Company’s audited financial statements. LiquiditySources of funding to meet prospective cash requirements during Fiscal 2021 include the Company’s existing cash balances, cash flow from operations, and borrowings under theCompany’s debt arrangements, as discussed in Note 3. We may need to seek additional debt or equity capital, however, to address the seasonal nature of our working capitalneeds, enable us to increase the scale of our business and provide a cash reserve against contingencies. There can be no assurance we will be able to raise additional capital. SeeNote 10 for subsequent events. Significant Accounting Policies Use of EstimatesThe preparation of financial statements in conformity with U.S. GAAP requires management to make estimates and assumptions that affect the reported amounts of assets andliabilities and disclosure of contingent assets and liabilities at the date of the financial statements and the reported amounts of revenues and expenses during the reportingperiod. Actual results could differ from those estimates. It is reasonably possible that a change in the Company’s estimates could occur in the near term as additional or newinformation becomes available. Net Income (Loss) per Share of Common StockThe Company computes net income (loss) per share of common stock in accordance with Accounting Standards Codification ("ASC”) 260. ASC 260 requires companies withcomplex capital structures to present basic and diluted earnings per share ("EPS”). Basic EPS is measured as the income or loss available to common stockholders divided by theweighted average shares of common stock outstanding for the period. Diluted EPS is similar to basic EPS, but presents the dilutive effect on a per share basis of potential commonstock equivalents (e.g., convertible securities, options, and warrants) as if such securities had been converted into common stock at the beginning of the periods presented.Securities that have an anti-dilutive effect (i.e., those that increase income per share or decrease loss per share) are excluded from the calculation of diluted EPS include: employeestock options to purchase zero and 11,000 shares of common stock for the three months ended September 30, 2020 and September 30, 2019, respectively.
8
Table of Contents Concentrations of RiskASC 825-10-50-20 requires disclosure of significant concentrations of credit risk regardless of the degree of such risk. Cash:The Company maintains cash depository accounts with financial institutions. The amount on deposit with several financial institutions exceeded the federally insured limit of$250,000 as of September 30, 2020. The Company has not historically incurred any losses related to these deposits. The financial institutions are highly rated, financially soundand the risk of loss is minimal. Customers and Accounts Receivable:For the three months ended September 30, 2020, the Company had two customers, Amazon.com and Best Buy, which represented 31.4% and 10.4% of net revenue,respectively. For the three months ended September 30, 2019, the Company had two customers, Amazon.com, and Macy’s, which represented 25.0% and 14.8% of net revenue,respectively. For the six months ended September 30, 2020, the Company had one customer, Amazon.com, which represented 35.4% of the Company’s net revenue. For the sixmonths ended September 30, 2019, the Company had two customers, Amazon.com, and Macy’s, which represented 35.1% and 10.4% of the Company’s net revenue, respectively. As of September 30, 2020, the Company had four customers, Amazon.com, Best Buy, Woot!, and Macy’s that represented 31.3%, 23.6%, 11.7% and 10.2%, respectively, of theCompany’s outstanding accounts receivable. As of March 31, 2020, three customers, Amazon.com, Amazon.ca and Bed, Bath and Beyond, represented 39.9%, 20.7% and 10.4%,respectively, of outstanding accounts receivable. The Company believes that all receivables from these customers are collectible. Suppliers:For the three months ended September 30, 2020, the Company purchased inventories and other inventory-related items from one supplier totaling $10.3 million. For the threemonths ended September 30, 2019, the Company purchased inventories and other inventory-related items from one supplier totaling $5.0 million. For the six months endedSeptember 30, 2020, the Company purchased $16.1 million of inventories and other inventory-related items from one supplier. For the six months ended September 30, 2019, theCompany purchased $6.4 million of inventories and other inventory-related items from one supplier. The purchase of inventories and other inventory-related items is tied toanticipated timing and amount of sales for our highly seasonal business and payment terms with our suppliers. The Company’s primary contract manufacturers are located in China. As a result, the Company may be subject to political, currency, regulatory, transportation/shipping, third-party labor, spread and virulence of diseases such as the global COVID-19 pandemic and weather/natural disaster risks. Although the Company believes alternate sources ofmanufacturing could be obtained, these risks and any potential loss of supply could have an adverse impact on operations, especially in the short term. Fair Value of Financial Instruments The Company follows the guidance in ASC 820, Fair Value Measurements and Disclosures ("ASC 820”), as it relates to the fair value of its financial assets and liabilities. ASC 820provides for a standard definition of fair value to be used in new and existing pronouncements. This guidance requires disclosure of fair value information about certain financialinstruments (insurance contracts, real estate, goodwill and taxes are excluded) for which it is practicable to estimate such values, whether or not these instruments are included inthe balance sheet at fair value. The fair values presented for certain financial instruments are estimates that, in many cases, may differ significantly from the amounts that could berealized upon immediate liquidation. Fair value is defined as the price that would be received to sell an asset or paid to transfer a liability (i.e., exit price) in an orderly transaction between market participants. ASC 820also provides a hierarchy for determining fair value, which emphasizes the use of observable market data whenever available. The three broad levels defined by the hierarchy are asfollows, with the highest priority given to Level 1 as these are the most reliable, and the lowest priority given to Level 3: ● Level 1 – Quoted prices in active markets for identical assets.
● Level 2 – Quoted prices for similar assets in active markets, quoted prices for identical or similar assets in markets that are not active, or other inputs that areobservable or can be corroborated by observable market data, including model-derived valuations.
● Level 3 – Unobservable inputs that are supported by little or no market activity.
9

Table of Contents The carrying value of financial instruments including cash, receivables and accounts payable and accrued expenses and notes payable related party, approximates their fair valueat September 30, 2020 and March 31, 2020 due to the relatively short-term nature of these instruments. The Company’s intellectual property liability carrying value was determined by utilizing Level 3 inputs. As discussed below in Notes 3 and 4, this liability was incurred inconjunction with the Company’s strategic alliance with Scotts Miracle-Gro. As of September 30, 2020 and March 31, 2020, the fair value of the Company’s sale of the intellectualproperty liability was estimated using the discounted cash flow method, which is based on expected future cash flows, discounted to present value using a discount rate of 15%. As of September 30, 2020, the Company did not have any financial assets or liabilities that were measured at fair value on a recurring basis subsequent to initial recognition. Accounts Receivable and Allowance for Doubtful AccountsThe Company sells its products to retailers and directly to consumers. Direct-to-consumer transactions are primarily paid by credit card. Retailer sales terms vary by customer, butgenerally range from net 30 days to net 60 days. Accounts receivable are reported at net realizable value and net of the allowance for doubtful accounts. The Company uses theallowance method to account for uncollectible accounts receivable. The Company’s allowance estimate is based on a review of the current status of trade accounts receivable,which resulted in an allowance of $694,000 and $376,000 at September 30, 2020 and March 31, 2020, respectively. Other ReceivablesIn conjunction with the Company’s processing of credit card transactions for its direct-to-consumer sales activities and as security with respect to the Company’s performance forcredit card refunds and charge backs, the Company is required to maintain a cash reserve with Fidelity Information Services, the Company’s credit card processor. This reserve isequal to 5% of the credit card sales processed during the previous six months. As of September 30, 2020 and March 31, 2020, the balance in this reserve account was $391,000 and$257,000, respectively. Advertising and Production CostsThe Company expenses all production costs related to advertising, including print, television, and radio advertisements when the advertisement has been broadcast or otherwisedistributed. In contrast, the Company records media and marketing costs related to its direct-to-consumer advertisements and catalogues, inclusive of postage and printing costsand related direct-response advertising costs, in accordance with ASC 340-20 Capitalized Advertising Costs. As prescribed by ASC 340-20-25, direct-to-consumer advertisingcosts incurred are reported as assets and are amortized over the estimated period of the benefits, based on the proportion of current period revenue from the advertisement toprobable future revenue. As the Company has continued to expand its retail distribution channel, the Company has expanded its advertising to include online gateway and portal advertising, as well asplacement in third party catalogues. Advertising expense for the three and six months ended September 30, 2020 and 2019 were as follows:
Three Months EndedSeptember 30,(in thousands)
Six Months EndedSeptember 30,(in thousands)
2020 2019 2020 2019 Direct-to-consumer $ 774 $ 93 $ 1,788 $ 188 Retail 857 339 1,174 755 Other 5 - 5 1 Total advertising expense $ 1,636 $ 432 $ 2,967 $ 944 As of September 30, 2020 and March 31, 2020, the Company had deferred $119,000 and $84,000, respectively, related to media and advertising costs, including the catalogue costsdescribed above. The costs are included within the "prepaid expenses and other” line of the balance sheets.
10

Table of Contents InventoryInventories are valued at the lower of cost, determined on the basis of standard costing, which approximates the first-in, first-out method, or net realizable value. When theCompany is the manufacturer, raw materials, labor, and manufacturing overhead are included in inventory costs. The Company records the raw materials at delivered cost. Standardlabor and manufacturing overhead costs are applied to the finished goods based on normal production capacity. A majority of the Company’s products are manufacturedoverseas and are recorded at standard cost, which includes product costs for purchased and manufactured products, and freight and transportation costs for inbound freight frommanufacturers. Inventory values at September 30, 2020 and March 31, 2020 were as follows:
September 30, March 31,
2020
(in thousands) 2020
(in thousands) Finished goods $ 10,414 $ 3,191 Raw materials 2,435 1,597 Total inventory $ 12,849 $ 4,788
The Company determines an inventory obsolescence reserve based on management’s historical experience and establishes reserves against inventory according to the age of theproduct. As of September 30, 2020 and March 31, 2020, the Company had reserved $260,000 and $151,000, respectively for inventory obsolescence. The inventory values areshown net of these reserves. LeasesAt lease inception, the Company determines whether an arrangement is or contains a lease. Operating leases are included in operating lease right-of-use ("ROU”) assets, currentoperating lease liabilities, and noncurrent operating lease liabilities in the financial statements. ROU assets represent the Company’s right to use leased assets over the term of thelease. Lease liabilities represent the Company’s contractual obligation to make lease payments over the lease term. For operating leases, ROU assets and lease liabilities arerecognized at the commencement date. The lease liability is measured as the present value of the lease payments over the lease term using: (i) the rate implicit in the lease if it isdeterminable, or (ii) alternatively, if the rate is not determinable from the lease, the Company’s incremental borrowing rate at the commencement date of the lease to determine thepresent value of the lease payments. Operating ROU assets are calculated as the present value of the remaining lease payments, plus unamortized initial direct costs and anyprepayments, less any unamortized lease incentives received. Lease terms may include renewal or extension options to the extent they are reasonably certain to be exercised. Theassessment of whether renewal or extension options are reasonably certain to be exercised is made at lease commencement. Factors considered in determining whether an option isreasonably certain of exercise include, but are not limited to, the value of any leasehold improvements, the value of renewal rates compared to market rates, and the presence offactors that would cause a significant economic penalty to the Company if the option were not exercised. Lease expense is recognized on a straight-line basis over the lease term.The Company has elected not to recognize an ROU asset and obligation for leases with an initial term of twelve months or less. The expense associated with short-term leases isincluded in lease expense in the statement of operations. For finance leases, after lease commencement the lease liability is measured on an amortized cost basis and increased to reflect interest on the liability and decreased to reflect thelease payment made during the period. Interest on the lease liability is determined each period during the lease term as the amount that results in a constant period discount rate onthe remaining balance of the liability. The ROU asset is subsequently measured at cost, less any accumulated amortization and any accumulated impairment losses. Amortizationon the ROU asset is recognized over the period from the commencement date to the earlier of (1) the end of the useful life of the ROU asset, or (2) the end of the lease term. Todetermine the present value of finance leases the Company uses a 10.0% discount rate, which is the rate specified in the lease agreement, or the incremental borrowing rate, asappropriate. To the extent a lease arrangement includes both lease and non-lease components, the components are accounted for separately. The Company has various operating leases primarily for office space and other distribution centers, some of which include escalating lease payments and options to extend orterminate the lease. The Company determines if a contract is a lease at the inception of the arrangement. The exercise of lease renewal option is at the Company’s sole discretionand options are recognized when it is reasonably certain the Company will exercise the option. The Company’s leases have remaining terms of less than one year to sevenyears. The Company does not have lease agreements with residual value guarantees, sale leaseback terms or material restrictive covenants.
11

Table of Contents Operating lease ROU assets and liabilities are recognized at commencement date of lease agreements greater than one year based on the present value of lease payments over thelease term. Lease expense is recognized on a straight-line basis over the lease term and variable lease costs are expensed as incurred. Revenue RecognitionThe Company currently has two operating and reportable segments: (i) the Direct-to-Consumer segment, which is comprised of sales directly from our website, mail order orcustomer calls to our customer service department; and (ii) the Retail segment, which is comprised of all sales related to retailers, including where possession of our product istaken and sold by the retailer in store or online, and drop ship orders that process from the retailer and drop directly to our warehouse for us to ship on behalf of the retailer. The majority of the Company’s revenue is recognized when it satisfies a single performance obligation by transferring control of its products and the risk of loss to a customer.Control is generally transferred when the Company’s products are either shipped or delivered based on the terms contained within the underlying contracts or agreements. TheCompany’s general payment terms are short-term in duration. The Company does not have significant financing components or payment terms. The Company did not have anymaterial unsatisfied performance obligations as of September 30, 2020 or March 31, 2020. The Company excludes from revenues all taxes assessed by a governmental authority that are imposed on the sale of its products and collected from customers. There were no changes to the Company’s accounting for variable consideration under ASC 606. However, the classification of net realizable accounts receivable from a liability to acontra asset results in a change in presentation on the balance sheet. Promotional and other allowances (variable consideration), which are recorded as a reduction to net sales,primarily include consideration given to retail customers, including, but not limited to, the following: ● discounts granted off list prices to support price promotions to end-consumers by retailers;● the Company’s agreed share of fees given directly to retailers for advertising, in-store marketing and promotional activities; and● incentives given to the Company’s retailers for achieving or exceeding certain predetermined purchases (i.e., rebates). The Company executes promotional allowance programs with retailers through separate agreements in the ordinary course of business. These agreements generally provide forone or more of the arrangements described above and are of varying durations, ranging from one day to one year. The Company’s promotional and other allowances are calculatedbased on various programs with retail customers, and accruals are established during the year for anticipated liabilities. These accruals are based on agreed upon terms, as well asthe Company’s historical experience with similar programs, and require management’s judgment with respect to estimating consumer participation and retail customer performancelevels. Differences between estimated and actual expenses for promotional and other allowance costs have historically been insignificant and are recognized in earnings in theperiod such differences are determined. The Company records estimated reductions to revenue for customer and distributor programs and incentive offerings, including promotions, rebates, and other volume-basedincentives, based on historical rates. Certain incentive programs require the Company to estimate the number of customers who will actually redeem the incentive based on ourhistorical industry experience. As of September 30, 2020 and March 31, 2020, the Company reduced accounts receivable $1.0 million and $744,000, respectively, as an estimate forthe foregoing deductions and allowances within the "accounts receivable, net” and "accrued expenses” lines of the condensed balance sheet, respectively. Warranty and Return ReservesThe Company records warranty liabilities at the time of sale for the estimated costs that may be incurred under its basic warranty program. The specific warranty terms andconditions vary depending upon the product sold, but generally include technical support, repair parts, and labor for periods up to one year. Factors that affect the Company’swarranty liability include the number of installed units currently under warranty, historical and anticipated rates of warranty claims on those units, and cost per claim to satisfy theCompany’s warranty obligation. Based upon the foregoing, the Company has recorded a provision for potential future warranty costs of $256,000 and $226,000 as of September 30,2020 and March 31, 2020, respectively.
12

Table of Contents The Company reserves for known and potential returns from customers and associated refunds or credits related to such returns based upon historical experience. In certain cases,retail customers are provided a fixed allowance, usually in a range of 1% to 2%, to cover returned goods and this allowance is deducted from payments made to us by suchcustomers. As of September 30, 2020 and March 31, 2020, the Company has recorded a reserve for customer returns of $449,000 and $430,000, respectively. Additionally, theCompany calculates specific returns for any customers that are deemed to have a right of return and the customer specific calculation is reviewed for reasonableness at the end ofeach period. These expenses are recorded as an offset to the accounts receivable line of the condensed balance sheets. Segments of an Enterprise and Related InformationU.S. GAAP utilizes a management approach based on allocating resources and assessing performance as the source of the Company’s reportable segments. U.S. GAAP alsorequires disclosures about products and services, geographic areas and major customers. At present, the Company operates in two segments, Direct-to-Consumer and RetailSales. Recently Issued Accounting PronouncementsIn June 2016, the FASB issued ASU 2016-13, "Financial Instruments – Credit Losses: Measurement of Credit Losses on Financial Instruments,” which requires entities to estimateall expected credit losses for certain types of financial instruments, including trade receivables, held at the reporting date based on historical experience, current conditions, andreasonable and supportable forecasts. The updated guidance also expands the disclosure requirements to enable users of financial statements to understand the entity’sassumptions, models and methods for estimating expected credit losses over the entire contractual term of the instrument from the date of initial recognition of that instrument.This guidance is effective for fiscal years beginning after December 15, 2022, including interim periods within that reporting period, and early adoption is permitted. The Companyis in the process of evaluating the potential impact of this new guidance on the Company’s financial statements and related disclosures.
3. Notes Payable, Long Term Debt and Current Portion – Long Term Debt The following represents the changes to our Notes Payable and Long Term Debt for the periods presented. For a more detailed discussion on our previously outstanding NotesPayable, Long Term Debt and Current Portion – Long Term Debt, refer to the Company’s Annual Report on Form 10-K for the year ended March 31, 2020, as filed with the SEC onJune 23, 2020. As of September 30, 2020 and March 31, 2020, the outstanding balance of the Company’s notes payable and debt, including accrued interest, is as follows:
September 30,2020
(in thousands)
March 31,2020
(in thousands) Notes payable and debt-related party 2,915 915 Sale of intellectual property liability (see Note 4) 14 24
Total notes payable and debt 2,929 939 Less current portion – long term debt 2,029 39
Long term debt $ 900 $ 900 Scotts Miracle-Gro Term Loan Agreements On August 3, 2020, the Company renewed a Working Capital Term Loan Agreement with Scotts Miracle-Gro due June 30, 2021. Under Term Loan, Scotts Miracle-Gro agreed toprovide up to $7.5 million of capital in increments of $500,000. The Term Loan Agreement is secured by a lien on the assets of the Company. Interest is charged at the stated rate of10% per annum and is payable, in cash, quarterly in arrears at the end of each September, December, March and June. The funds provided under the Term Loan are used forgeneral working capital and to acquire inventory to support anticipated growth as the Company expands its retail and its direct-to-consumer sales channels. The Term Loanpermits prepayment and re-borrowing without penalty or premium, and as of September 30, 2020, the Company had borrowed $2.0 million under the Term Loan. The Term LoanAgreement was filed as an exhibit to the Company’s Quarterly Report on Form 10-Q filed with the SEC on August 11, 2020. Refer to Note 10 "Subsequent Events” for additionalinformation regarding the term loan.
13

Table of Contents On June 20, 2019, the Company entered into a Real Estate Term Loan Agreement in the principal amount of up to $1.5 million with Scotts Miracle-Gro. The funding provided capitalto fund real estate related lease obligations. The proceeds were made available as needed in increments of $100,000, not to exceed $1.5 million, with a due date of March 31, 2022.Interest is charged at the stated rate of 10% and is paid quarterly in arrears on each of April 30, July 31, October 31 and January 31. As of September 30, 2020, the Company hadborrowed $900,000 under the Real Estate Term Loan. Liability Associated with Scotts Miracle-Gro Transaction The Company and Scotts Miracle-Gro, the owner of approximately 80.5% of the Company’s outstanding common stock, have entered into an Intellectual Property Sale Agreement,a Technology License Agreement, a Brand License Agreement, and a Supply Chain Services Agreement, each of which has been filed with the SEC. The Intellectual Property SaleAgreement and the Technology License constitute an agreement to sell future revenue because: (i) the Company received cash from Scotts Miracle-Gro and agreed to pay, for adefined period, a specified percentage of its revenue; and (ii) the Company has significant involvement in the generation of its revenue. As a result, the excess paid over net bookvalue is classified as debt and is being amortized under the effective interest method. As of September 30, 2020 and March 31, 2020, a liability of $14,000 and $24,000, respectively,was recorded on the condensed balance sheets for the Intellectual Property Sale Agreement. As of September 30, 2020 and March 31, 2020, the Company has accrued $620,000 and$1.5 million, respectively, as a liability for the Technology Licensing Agreement, and has expensed $620,000 and $176,000 for the quarters ended September 30, 2020 and September30, 2019, respectively. The accrual is calculated as 2% of the annual net sales and recorded as a liability. The accrued liability for the Brand License Agreement, which equal to 5%of all seed pod kit and related sales, totaled to $455,000 and $922,000 as of September 30, 2020 and March 31, 2020, respectively. In addition, the Company has expensed $455,000and $140,000 for the quarters ended September 30, 2020 and September 30, 2019, respectively. 4. Scotts Miracle-Gro Transactions – Convertible Preferred Stock, Warrants and Other Transactions Series B Convertible Preferred Stock and Related Transactions On April 22, 2013, the Company entered into a Securities Purchase Agreement with SMG Growing Media, Inc., a wholly owned subsidiary of Scotts Miracle-Gro (NYSE: "SMG”), aworldwide marketer of branded consumer lawn and garden products. Pursuant to the Securities Purchase Agreement, Scotts Miracle-Gro acquired 2,649,007 shares of theCompany’s Series B Convertible Preferred Stock, par value $0.001 per share (the "Series B Preferred Stock”) and a warrant to purchase up to 80% of the Company’s common stock(the "Warrant,”) for an aggregate purchase price of $4.0 million. The Securities Purchase Agreement, Certificates of Designations for the Series B Preferred Stock, Form of Warrant,Indemnification Agreement, Investor’s Rights Agreement and Voting Agreement were filed as exhibits to a Current Report on Form 8-K filed with the SEC on April 23, 2013. OnNovember 29, 2016 Scotts Miracle-Gro fully exercised the Warrant and, by its terms, the Series B Preferred Stock automatically converted into the Company’s common stock. ScottsMiracle-Gro currently owns approximately 80.5% of the Company’s outstanding common stock. Upon demand by Scotts Miracle-Gro, the Company must use its best efforts to file a Registration Statement on Form S-3, or, if the Company is not eligible for Form S-3, on Form S-1(collectively, the "Registration Statement”), within 120 calendar days after receipt of Scotts Miracle-Gro’s demand for registration. The Company must use its best efforts to causethe Registration Statement to become effective as soon as possible thereafter. In conjunction with the private offering described above, the Company and Scotts Miracle-Gro also agreed to enter an Intellectual Property Sale Agreement, a Technology LicenseAgreement, a Brand License Agreement, and a Supply Chain Services Agreement. The Intellectual Property Sale Agreement and the Technology License constitute an agreementof sales of future revenues. For more details regarding these agreements, please refer to Note 3 "Scotts Miracle-Gro Transactions” to the financial statements included in theCompany’s Annual Report on Form 10-K, as filed with the SEC on June 23, 2020. See also Note 3 above for the Term Loan with Scotts Miracle-Gro. 5. Equity Compensation Plans For the three and six months ended September 30, 2020 and September 30, 2019, the Company did not grant options to purchase shares of common stock under the Company’s2005 Equity Compensation Plan (the "2005 Plan”) and no new options will be granted under this plan until a new plan is adopted.
14

Table of Contents During the three months and six months ended September 30, 2020, 11,000 shares of common stock were cancelled or expired and during the three months and six months endedSeptember 30, 2019, 93,000 options to purchase shares of common stock were cancelled or expired and no shares of common stock were issued upon exercise of outstanding stockoptions under the 2005 Plan. As of September 30, 2020, the Company had no unvested outstanding options to purchase shares of the Company’s common stock; all outstanding options have expired and noadditional compensation expense will be recognized. 6. Income Taxes The Company follows the guidance in ASC 740, Accounting for Uncertainty in Income Taxes ("ASC 740”), which clarifies the accounting for uncertainty in income taxesrecognized in an enterprise’s financial statements. This interpretation defines the minimum recognition threshold a tax position is required to meet before being recognized in thefinancial statements. Deferred income taxes are recognized for the tax consequences in future years of differences between the tax basis of assets and liabilities and their financial reporting amounts atthe end of each period, based on enacted laws and statutory rates applicable to the periods in which the differences are expected to affect taxable income. Any liability for actualtaxes to taxing authorities is recorded as income tax liability. A valuation allowance is established against such assets where management is unable to conclude more likely than not that such asset will be realized. As of September 30, 2020and March 31, 2020, the Company recognized a valuation allowance equal to 100% of the net deferred tax asset balance and the Company has no unrecognized tax benefits relatedto uncertain tax positions. 7. Related Party Transactions See Note 6 "Related Party Transactions” of Form 10-K for the year ended March 31, 2020, as filed with the SEC on June 23, 2020 for a detailed discussion of related partytransactions. On August 3, 2020, AeroGrow entered into a Working Capital Term Loan Agreement in the principal amount of up to $7.5 million and on June 20, 2019 AeroGrow entered in a RealEstate Term Loan Agreement in the principal amount of up to $1.5 million with Scotts Miracle-Gro. Under both loan agreements, interest is charged at the stated rate of 10% perannum and is paid quarterly in arrears. See Note 3 "Notes Payable, Long Term Debt and Current Portion – Long Term Debt” above. 8. Leases The Company recognized operation lease ROU assets and lease liabilities based on the present value of remaining minimum lease payments. For the discount rate assumption, theimplicit rate was not readily determinable in the Company’s lease agreements. Therefore, the Company used an estimated incremental borrowing rate, in determining the presentvalue of lease payments. If at lease inception, the Company considers the exercising of a renewal option to be reasonably certain, the Company will included the extended term inthe calculation of the right-of-use asset and lease liability. The Company elected the practical expedients available under ASC 842 and applied them consistently to all applicable leases. The Company did not apply ASC 842 to any leaseswith a remaining term of 12 months or less. For these leases, no asset or liability was recorded and lease expense continues to be recognized on a straight-line basis over the leaseterm. As allowed by the practical expedients, the Company does not reassess whether any expired or existing contracts are or contain leases, does not reassess the leaseclassification for any expired or existing leases and does not reassess initial direct costs for existing leases. The table below sets forth supplemental Balance Sheet information for the Company’s leases.
September 30,
2020 (in thousands) Assets Operating lease ROU $ 1,158 Liabilities Operating lease, current 141 Operating lease, noncurrent 1,129 Total lease liabilities $ 1,270
15

Table of Contents As of September 30, 2020, the weighted average remaining lease term for operating leases was 7 years, and the weighted average discount rate was 10%. The table below sets forth the future cash payments under such agreements for the remaining years are as follows:
Year Ending Operating Leases Financing Leases (in thousands) (in thousands) March 31, 2021 $ 131 $ 7 March 31, 2022 266 - March 31, 2023 275 - March 31, 2024 285 - March 31, 2025 294 - Thereafter 460 - Total lease payments $ 1,711 $ 7 Less: amount of lease payments representing interest (441) - Present value of future minimum lease payments 1,270 7 Less: current obligations under leases (141) (7)Long-term lease obligations $ 1,129 $ -
Rent expense for the three months ended September 30, 2020 and 2019 was $147,000 and $136,000, respectively. Rent expense for the six months ended September 30, 2020 and 2019was $292,000 and $264,000, respectively. 9. Segment Information The Company has determined that its reportable segments are those that are based on its method of internal reporting and the perspective of the chief operating decision maker.The Company has two reportable segments, Retail Sales and Direct-to-Consumers. The Company evaluates performance based on the primary financial measure of contributionmargin ("segment profit”), which reflects the income or loss from operations before corporate expenses, non-operating income, net interest expense, and income taxes. TheCompany does not have any individually identified assets regarding specific segments as all processes to manufacture products are not different based on segment. Three Months Ended September 30, 2020 (dollar amounts in thousands) Direct-to-consumer Retail Corporate/Other Consolidated Net sales $ 5,051 $ 9,259 $ - $ 14,310 Cost of revenue 3,059 5,344 - 8,403 Gross profit 1,992 3,915 - 5,907 Gross profit percentage 39.4% 42.3% - 41.3%Sales and marketing (1) 783 891 159 1,833 Segment profit 1,209 3,024 (159) 28.5 Segment profit percentage 23.9% 32.7% - 28.5% (1) Sales and marketing expense includes advertising, trade shows, media production and promotional products and other as discussed in the sales and marketing section of theMD&A. See Item 2 below. Three Months Ended September 30, 2019 (dollar amounts in thousands) Direct-to-consumer Retail Corporate/Other Consolidated Net sales $ 1,628 $ 2,795 $ - $ 4,423 Cost of revenue 920 2,038 - 2,958 Gross profit 708 757 - 1,465 Gross profit percentage 43.5% 27.1% - 33.1%Sales and marketing (1) 110 463 147 720 Segment profit 598 294 (147) 745 Segment profit percentage 36.7% 10.5% - 16.8% (1) Sales and marketing expense includes advertising, trade shows, media production and promotional products and other as discussed in the sales and marketing section of theMD&A. See Item 2 below.
16

Table of Contents Six Months Ended September 30, 2020 (dollar amounts in thousands) Direct-to-consumer Retail Corporate/Other Consolidated Net sales $ 14,107 $ 16,614 $ - $ 30,721 Cost of revenue 7,913 9,544 - 17,457 Gross profit 6,194 7,070 - 13,264 Gross profit percentage 43.9% 42.6% - 43.2%Sales and marketing (1) 1,857 1,242 372 3,471 Segment profit 4,337 5,828 (372) 1,395 Segment profit percentage 30.7% 35.1% - 31.9% (1) Sales and marketing expense includes advertising, trade shows, media production and promotional products and other as discussed in the sales and marketing section of theMD&A. See Item 2 below Six Months Ended September 30, 2019 (dollar amounts in thousands) Direct-to-consumer Retail Corporate/Other Consolidated Net sales $ 3,530 $ 5,368 $ - $ 8,898 Cost of revenue 2,309 3,668 - 5,977 Gross profit 1,221 1,700 - 2,921 Gross profit percentage 34.6% 31.7% - 32.8%Sales and marketing (1) 142 1,065 319 1,526 Segment profit 1,079 635 (319) 1,395 Segment profit percentage 30.6% 11.8% - 15.7% (1) Sales and marketing expense includes advertising, trade shows, media production and promotional products and other as discussed in the sales and marketing section of theMD&A. See Item 2 below 10. Subsequent Events As reported in a Current Report on Form 8-K filed with the SEC on October 8, 2020, the Company entered a non-binding Letter of Intent ("LOI”) with The Scotts Miracle-Gro, datedOctober 2, 2020, setting forth the terms for a transaction in which Scotts would acquire all of the outstanding shares of Common Stock it does not currently own, subject to thesatisfaction of various customary conditions. The LOI provides that the transaction would be structured as a merger pursuant to which the shareholders of AeroGrow other thanScotts would receive consideration of $3.00 per share in cash. As reported in a Current Report on Form 8-K filed with the SEC on November 12, 2020, AeroGrow International, Inc., a Nevada corporation (the "Company”), entered into anAgreement and Plan of Merger (the "Merger Agreement”) with SMG Growing Media, Inc., an Ohio corporation ("Parent”), AGI Acquisition Sub, Inc., a Nevada corporation anddirect, wholly-owned subsidiary of Parent ("Merger Sub” and, together with Parent, the "Purchaser Parties”), and, solely for the purposes stated in Section 6.4 of the MergerAgreement, The Scotts Miracle-Gro Company, an Ohio corporation ("Scotts Miracle-Gro”), relating to the proposed acquisition of the Company by Parent. The Merger Agreement provides that, upon the terms and subject to the conditions set forth therein, Merger Sub will be merged with and into the Company (the "Merger”) withthe Company continuing as the surviving corporation in the Merger, and, at the effective time of the Merger (the "Effective Time”) each share of common stock of the Company,par value $0.001 per share (the "Common Stock”) (other than Excluded Shares and Dissenting Shares (each as defined in the Merger Agreement)), issued and outstandingimmediately prior to the Effective Time will be automatically converted into the right to receive $3.00 in cash, without interest thereon and subject to any required withholding oftaxes (the "Merger Consideration”), and will be cancelled.
17

Table of Contents Based on the recommendation of the special committee (the "Special Committee”) of the board of directors of the Company (the "Board”), consisting solely of independent anddisinterested directors, the Board unanimously (i) adopted and approved the Merger Agreement and the transactions contemplated by the Merger Agreement (including theMerger), (ii) determined the Merger Agreement and the transactions contemplated by the Merger Agreement (including the Merger) to be in the best interests of, and fair to, theCompany and its stockholders and (iii) determined the Merger Consideration to be the "fair value” of the Common Stock as of the date of the Merger Agreement, having beendetermined by the Special Committee’s independent financial advisor and the Special Committee using customary and current valuation concepts and techniques generallyemployed for similar businesses in the context of a merger and without discounting for lack of marketability or minority status. Stockholders of the Company will be asked to voteon the approval of the Merger Agreement at a special stockholders meeting that will be held on a date to be announced (the "Special Meeting”). The closing of the Merger issubject to, among other conditions, the approval of the Merger Agreement by a majority of the outstanding shares of Common Stock entitled to vote on such matter (the"Company Stockholder Approval”). Purchaser Parties and their respective affiliates currently beneficially own approximately 80% of the Company’s outstanding shares ofCommon Stock. Approval of the holders of at least a majority of the shares of Common Stock not beneficially owned by the Purchaser Parties and their respective affiliates is notrequired under Nevada law for the Company to complete the Merger. Consummation of the Merger is not subject to a financing condition. In addition to the Company Stockholder Approval condition, consummation of the Merger is also subject to various customary conditions, including, but not limited to, theobtainment of any necessary regulatory approvals. The Company is subject to customary restrictions on its ability to initiate, solicit, propose or knowingly encourage or otherwise knowingly facilitate Acquisition Proposals (asdefined in the Merger Agreement) from third parties and to provide any information or data concerning the Company or access to the Company‘s properties, books and records toany person in connection with any Acquisition Proposal or any inquiry, proposal or offer that would reasonably be expected to lead to an Acquisition Proposal, with customaryexceptions regarding the Board’s fiduciary duties under applicable law. The Board has recommended that the Company’s stockholders vote to adopt and approve the MergerAgreement and the transactions contemplated thereby (including the Merger), subject to certain customary exceptions regarding the Board’s fiduciary duties under applicable law. The Merger Agreement contains certain termination rights, including the right of the Company to terminate the Merger Agreement to accept a Superior Proposal (as defined in theMerger Agreement). In addition, subject to certain exceptions and limitations set forth in the Merger Agreement, either party may terminate the Merger Agreement if the Merger isnot consummated by March 31, 2021. The Company has made customary representations, warranties and covenants in the Merger Agreement, including, among others, covenants (1) to conduct its business in theordinary course during the period between the Signing Date and the Effective Time, (2) not to engage in certain types of transactions during this period unless agreed to in writingby Parent, (3) to convene and hold the Special Meeting for the purpose of obtaining the Company Stockholder Approval, (4) subject to certain conditions, not to withhold,withdraw, qualify or modify (or publicly propose or resolve to withhold, withdraw, qualify or modify), in a manner adverse to Parent, the recommendation of the Board that theCompany’s stockholders vote affirmatively at the Special Meeting to approve the Merger Agreement and the Merger, and (5) to cooperate with Parent to use their respectivereasonable best efforts to take or cause to be taken all actions necessary or advisable to obtain any required antitrust approval for the Merger. The foregoing summary of the Merger Agreement does not purport to be complete and is subject to, and qualified in its entirety by, the full text of the Merger Agreement, which isattached as Exhibit 2.1 to this Current Report on Form 8-K and incorporated by reference herein. The Merger Agreement has been included to provide investors with information regarding its terms. It is not intended to provide any other factual information about the Company.The representations, warranties and covenants contained in the Merger Agreement were made only for purposes of the Merger Agreement as of the specific dates therein, weresolely for the benefit of the parties to the Merger Agreement, may be subject to limitations agreed upon by the contracting parties, including being qualified by confidentialdisclosures made for the purposes of allocating contractual risk between the parties to the Merger Agreement instead of establishing these matters as facts, and may be subject tostandards of materiality applicable to the contracting parties that differ from those applicable to investors.
18

Table of Contents Investors are not third-party beneficiaries under the Merger Agreement and should not rely on the representations, warranties and covenants or any descriptions thereof ascharacterizations of the actual state of facts or condition of the parties thereto or any of their respective subsidiaries or affiliates. Moreover, information concerning the subjectmatter of representations and warranties may change after the date of the Merger Agreement, which subsequent information may or may not be fully reflected in the Company’spublic disclosures. As disclosed in Note 3 above, the proceeds under the SMG Working Capital Term Loan are made available in increments of at least $500,000 with a due date of March 31, 2020. Asof November 9, 2020, the Company had borrowed an aggregate of $3.5 million in principal under the SMG Working Capital Term Loan, a $1.5 million increase over the $2.0 millionprincipal balance as of September 30, 2020.
19

Table of Contents Item 2. Management’s Discussion and Analysis of Financial Condition and Results of Operations The discussion contained herein is for the three and six months ended September 30, 2020 and September 30, 2019. The following discussion should be read in conjunction withthe financial statements of AeroGrow International, Inc. (the "Company,” "AeroGrow,” "we,” "our,” or "us”) and the notes to the financial statements included in Item 1 above inthis Quarterly Report on Form 10-Q for the period ended September 30, 2020 (this "Quarterly Report”). The following discussion contains forward-looking statements within themeaning of Section 27A of the Securities Act of 1933, and Section 21E of the Securities Exchange Act of 1934, as amended (the "Exchange Act”), including statements that includewords such as "anticipates,” "expects,” "intends,” "plans,” "believes,” "may,” "will,” or similar expressions that are intended to identify forward-looking statements. In addition,any statements that refer to expectations, projections, or other characterizations of future events or circumstances, including any underlying assumptions, are forward-lookingstatements. Such statements include, but are not limited to, statements regarding our intent, belief, or current expectations regarding our strategies, plans, and objectives, ourproduct release schedules, our ability to design, develop, manufacture, and market products, the ability of our products to achieve or maintain commercial acceptance, our ability toobtain financing and/or generate cash flow sufficient to fund our future operations, and our ability to continue as a going concern. Such statements are not guarantees of futureperformance and are subject to risks, uncertainties, and assumptions that are difficult to predict. Therefore, our actual results could differ materially and adversely from thoseexpressed in any forward-looking statements as a result of various factors. Factors that could cause or contribute to the differences are discussed in this Item 2. Management’sDiscussion and Analysis of Financial Condition and Results of Operations and in Item 1A. "Risk Factors” of our Annual Report on Form 10-K for the year ended March 31,2020. Except as required by applicable law or regulation, we undertake no obligation to revise or update any forward-looking statements contained in this Quarterly Report. Theinformation contained in this Quarterly Report is not a complete description of our business or the risks associated with an investment in our common stock. Each reader shouldcarefully review and consider the various disclosures we made in this Quarterly Report and in our other filings with the U.S. Securities and Exchange Commission ("SEC”). Overview AeroGrow International, Inc. was formed as a Nevada corporation in March 2002. The Company’s principal business is developing, marketing, and distributing advanced indooraeroponic garden systems designed and priced to appeal to the consumer gardening, cooking and small indoor appliance markets worldwide. The Company’s principal activitiesfrom its formation through March 2006, consisted of product research and development, market research, business planning, and raising the capital necessary to fund theseactivities. In December 2005, the Company commenced initial production of its AeroGarden system and, in March 2006, began shipping these systems to retail and cataloguecustomers. The Company manufactures, distributes and markets eight different models of its AeroGarden systems in multiple colors, as well as over 40 varieties of seed pod kitsand a full line of accessory products through multiple channels including online retail distribution, in-store retail distribution, catalogue and direct-to-consumer sales primarily inthe United States and Canada, as well as selected countries in Europe. In April 2013, we entered into a Securities Purchase Agreement and strategic alliance with a wholly owned subsidiary of The Scotts Miracle-Gro Company (collectively with itssubsidiary, "SMG” or "Scotts Miracle-Gro”). Pursuant to the Securities Purchase Agreement, we issued (i) 2.6 million shares of Series B Convertible Preferred Stock, par value$0.001 per share (the "Series B Preferred Stock”); and (ii) a warrant to purchase up to 80% of the Company’s common stock for an aggregate purchase price of $4.0 million. Inaddition, as part of the strategic alliance, we entered into several other agreements with Scotts Miracle-Gro, including: (i) an Intellectual Property Sale Agreement; (ii) a TechnologyLicensing Agreement; (iii) a Brand License Agreement; and (iv) a Supply Chain Management Agreement. In November 2016, Scotts Miracle-Gro fully exercised the Warrant and, byits terms, the Series B Preferred Stock automatically converted into the Company’s common stock. Scotts Miracle-Gro currently owns approximately 80.5% of the Company’soutstanding common stock. Pursuant to the Intellectual Property Agreement, we agreed to sell all intellectual property associated with our hydroponic products (the "Hydroponic IP”), other than theAeroGrow and AeroGarden trademarks, free and clear of all encumbrances, to Scotts Miracle-Gro for $500,000. Scotts Miracle-Gro has the right to use the AeroGrow andAeroGarden trademarks in connection with the sale of products incorporating the Hydroponic IP. In addition to the total working capital infusion of approximately $4.5 million fromthe Securities Purchase Agreement and Intellectual Property Sale Agreement, as amended, the strategic alliance allows us to use the globally recognized and highly trustedMiracle-Gro brand name. We believe that the strategic alliance also gives Scotts Miracle-Gro an entry into the burgeoning indoor gardening market, while providing AeroGrow abroad base of support in marketing, distribution, supply chain logistics, R&D and sourcing. We have also used our strategic alliance with Scotts Miracle-Gro to re-establish ourpresence in the retail and international sales channels. In Fiscal 2020, we amended the Brand License Agreement with Scotts Miracle-Gro to allow us to remove the Miracle-Grobrand from AeroGardens, thereby eliminating the cost associated with this portion of the agreement.
20

Table of Contents On August 3, 2020, the Company entered into a Working Capital Term Loan Agreement in the principal amount of up to $7.5 million with Scotts Miracle-Gro. The proceeds will bemade available as needed in increments of $500,000, and the Company may pay down and reborrow during the Term Loan, not to exceed $7.5 million with a due date of June 30,2021. The Term Loan Agreement is secured by a lien on the assets of the Company. Interest will be charged at the stated rate of 10% per annum and will be paid, in cash, quarterlyin arrears at the end of each September, December, March and June. The funding provides general working capital and is being used to acquire inventory in advance of theCompany’s peak selling season for our retail and its direct-to-consumer sales channels. See Note 3 "Notes Payable, Long Term Debt and Current Portion – Long Term Debt” toour condensed financial statements. As reported in a Current Report on Form 8-K filed with the SEC on October 8, 2020, the Company entered a non-binding Letter of Intent ("LOI”) with The Scotts Miracle-Gro, datedOctober 2, 2020, setting forth the terms for a transaction in which Scotts would acquire all of the outstanding shares of Common Stock it does not currently own, subject to thesatisfaction of various customary conditions. The LOI provides that the transaction would be structured as a merger pursuant to which the shareholders of AeroGrow other thanScotts would receive consideration of $3.00 per share in cash. As reported in a Current Report on Form 8-K filed with the SEC on November 12, 2020, AeroGrow International, Inc., a Nevada corporation (the "Company”), entered into anAgreement and Plan of Merger (the "Merger Agreement”) with SMG Growing Media, Inc., an Ohio corporation ("Parent”), AGI Acquisition Sub, Inc., a Nevada corporation anddirect, wholly-owned subsidiary of Parent ("Merger Sub” and, together with Parent, the "Purchaser Parties”), and, solely for the purposes stated in Section 6.4 of the MergerAgreement, The Scotts Miracle-Gro Company, an Ohio corporation ("Scotts Miracle-Gro”), relating to the proposed acquisition of the Company by Parent. The Merger Agreement provides that, upon the terms and subject to the conditions set forth therein, Merger Sub will be merged with and into the Company (the "Merger”) withthe Company continuing as the surviving corporation in the Merger, and, at the effective time of the Merger (the "Effective Time”) each share of common stock of the Company,par value $0.001 per share (the "Common Stock”) (other than Excluded Shares and Dissenting Shares (each as defined in the Merger Agreement)), issued and outstandingimmediately prior to the Effective Time will be automatically converted into the right to receive $3.00 in cash, without interest thereon and subject to any required withholding oftaxes (the "Merger Consideration”), and will be cancelled. Results of Operations Three Months Ended September 30, 2020 and September 30, 2019 Summary OverviewSales results during the first six months of our fiscal year (April-September), are historically variable and can be impacted by load-in timing before the holiday season, whichfluctuates year to year, however, for the current year our sales growth is driven primarily by continued strength of the business, customer acceptance and knowledge of thecategory, and growing demand for our product and sales to a new account BestBuy. For the three months ended September 30, 2020, total revenue was $14.3 million, an increase of223.5%, or $9.9 million, relative to the same period in the prior year. The increase was due to continued sales into the online channels, including Amazon.com, Kohls.com, CanadianTire and BestBuy, as well as increased interest in indoor gardening, at-home meal preparation and access to healthy, safe and fresh food. Additionally, sales in our direct-to-consumer channel increased 210.2%, or $3.4 million, primarily due to continued momentum from our general advertising and marketing campaign, and an increase in our establisheduser base. In addition to our continued momentum from prior periods, as we saw amplified demand in the indoor gardening market from customers seeking healthy, fresh food. For the three months ended September 30, 2020, total dollar sales of AeroGarden units increased by 269.2% from the prior year period due to increased sales in the retail and direct-to-consumer channels and earlier ordering for programs with existing customers, in advance of the peak holiday season. Seed pod kit and accessory sales increased by 106.3%over prior year period as our established base of AeroGardeners continues to grow. AeroGarden sales, net of allowances, represented 76.3% of total revenue, as compared to62.8% in the prior year period. This percentage increase, on a product line basis, was attributable to timing of sales to retail accounts, as discussed above. Seed pod kit andaccessory sales increased $1.7 million or 106.3%. As a percent of total sales, seed pod kit and accessory sales decreased to 23.7% from 37.2%, primarily due to a large increase inthe purchase of an AeroGarden.
21

Table of Contents The Company continues to spend advertising dollars in order to strategically build market awareness and enhance initiatives implemented in the prior year. For the fiscal yearending March 31, 2021 ("Fiscal 2021”), we intend to expand consumer awareness of the AeroGrow brand and product line. During the three months ended September 30, 2020, weincurred $1.6 million in advertising expenditures, a $1.2 million or 278.7% year-over-year increase compared to the prior year period. This was primarily due to an increase in ourdirect-to-consumer pay-per-click and retail marketing campaigns and expanded digital marketing. The advertising expenditures were divided as follows: ● Direct-to-consumer advertising increased $681,000 from $93,000 to $774,000 during the three months ended September 30, 2020, primarily reflecting an increase in spending
from pay-per-click and digital display advertising campaigns such as Google Ads and Facebook. Efficiency, as measured by dollars of direct-to-consumer sales generatedper dollar of related advertising expense, decreased to $6.53 for the three months ended September 30, 2020, as compared to $17.50 for the same period in Fiscal 2020.
● Retail advertising increased $518,000 from $339,000 to $857,000 for the three months ended September 30, 2020 and September 30, 2019, respectively, as the Company
continued to invest in driving product awareness through: (i) platforms made available by our retailers; (ii) various promotional programs to increase product awarenesswith our housewares channel of retail accounts, including catalogues and email campaigns; and (iii) web-based advertising programs (e.g. including online retailcatalogues, website banner ads, email blasts, targeted search campaigns, etc.).
Our gross profit percentage for the three months ended September 30, 2020 was 41.3%, up from 33.1% in the prior year period due to higher demand during the COVID pandemic,and increased sales prices, , fewer planned discount programs in our sales channels due to lower inventory levels, and supply chain efficiencies that were not in place in the prioryear. In aggregate, our total operating expenses increased 80.8% or $2.0 million year-over-year, principally as a result of an increase in sales in the current year. Gross spendingfluctuated in the following areas: ● A $1.2 million increase in advertising costs to promote all sales channels;● A $878,000 increase in personnel expenses, primarily due to the calculation on our company-wide incentive that scales as our growth increases and an increase in headcount;● A $174,000 increase in legal and consulting expenses, as the Company considers and analyzes strategic alternatives proposed by Scotts Miracle-Gro; and● A $78,000 increase in bad debt and depreciation expense. These increases were partially offset by: ● A $140,000 decrease in a variety of general operating accounts, including office related expenses, such as repairs and maintenance, telephone, courier fees, and new product
testing and development; and● A $136,000 decrease in Company-wide travel. Due to the increased order volume driven by better marketing and earlier load-in orders, and decreased operating expenses as a percentage of revenue, we generated an operatingincome of $1.3 million for the three months ended September 30, 2020, as compared to operating loss of $1.1 million in the prior year period. Other expense for the three months ended September 30, 2020 and September 30, 2019 totaled to a net other expense of $53,000 in both periods. The net other expense is primarilyattributable to foreign exchange losses and interest expense on the outstanding loan. The net income for the three months ended September 30, 2020 increased to $1.3 million, as compared to a loss of $1.1 million in the prior year. The increase in net income resultedfrom increases in overall sales in retail accounts, primarily due to more pre-holiday load-in sales to retailers, increased direct-to-consumer sales, along with increased gross margins,and decreased operating expenses as a percentage of revenue.
22

Table of Contents The following table sets forth, as a total percentage of sales, our financial results for the three months ended September 30, 2020 and the three months ended September 30, 2019:
Three Months Ended September 30, 2020 2019 Net revenue
Direct-to-consumer 35.3% 36.8%Retail 64.3% 61.6%International 0.4% 1.6%Total net revenue 100.0% 100.0%
Cost of revenue 58.7% 66.9%Gross profit percentage 41.3% 33.1%
Operating expenses
Research and development 2.1% 6.3%Sales and marketing 20.2% 30.9%General and administrative 9.8% 20.2%Total operating expenses 32.1% 57.4%
Profit (loss) income from operations 9.2% (24.3)% RevenueFor the three months ended September 30, 2020, revenue totaled $14.3 million, a year-over-year increase of 223.5% or $9.9 million, from the three months ended September 30, 2019.
Three Months EndedSeptember 30,(in thousands)
Net Revenue 2020 2019 Direct-to-consumer $ 5,051 $ 1,628 Retail 9,205 2,725 International 54 70 Total $ 14,310 $ 4,423
Direct-to-consumer sales for the three months ended September 30, 2020 totaled $5.1 million, up $3.4 million or 210.2% from the prior year period. This increase was caused bycontinued momentum of growth from prior periods amplified by demand in indoor gardening of customers seeking healthy, fresh food and uncertainties in the food supply chainduring COVID-19. We continued driving direct-to-consumer awareness during our non-peak season through our focus on advertising that drives sales, follow-on direct sales tocustomers that have previously purchased AeroGardens, and continued momentum from general brand awareness campaigns. Sales to retailer customers for the three months ended September 30, 2020 totaled $9.2 million, up $6.5 million from the prior year period, principally reflecting organic growth in ourexisting retail accounts, namely Amazon.com, Kohl’s and Canadian Tire, earlier program load-in sales with Woot!, and sales to one new account, Best Buy, in advance of the peakholiday season. International sales totaled $54,000, down from $70,000 in the prior year period.
23

Table of Contents Our products consist of AeroGardens, and seed pod kits and accessories. A summary of the sales of these two product categories for the three months ended September 30, 2020and September 30, 2019 is as follows:
Three Months Ended September 30,
(in thousands) 2020 2019 Product revenue
AeroGardens $ 12,565 $ 3,403 Seed pod kits and accessories 3,393 1,644 Discounts, allowances and other (1,648) (624)Total $ 14,310 $ 4,423
% of total revenue AeroGardens 87.8% 76.9%Seed pod kits and accessories 23.7% 37.2%Discounts, allowances and other (11.5)% (14.1)%Total 100.0% 100.0%
AeroGarden sales increased $9.2 million, or 269.2%, from the prior year period, reflecting: (i) increased retail channel sales as the AeroGarden gained customer acceptance from newand existing customers, primarily Amazon.com, Kohl’s, Woot! and BestBuy.com; (ii) increased sales in Direct-to-consumer channels; and (iii) continued focus on specificadvertising, including pay-per-click, and general awareness campaigns toward the general population, which informed buyers about our products. The increase in seed pod kit andaccessory sales, from $1.6 million to $3.4 million, principally reflects the overall increase in our established base of AeroGardens and sales to retail customers at brick-and-mortarstores. For the three months ended September 30, 2020, sales of seed pod kits and accessories represented 23.7% of total revenue, as compared to 37.2% in the prior year period,as a result of the significant increase in the AeroGarden retail sales in the current year. Other revenue, which is comprised primarily of grow club revenue, shipping revenue,accruals and deductions, decreased as a percent of the total to (11.5)% from (14.1)% in the prior year period, due to lower estimated returns and select and more effective use ofdiscounts for in-store retail accounts. Cost of RevenueCost of revenue for the three months ended September 30, 2020 totaled $8.4 million, an increase of $5.4 million from the three months ended September 30, 2019, due to increasedsales volume. Cost of revenue includes product costs for purchased and manufactured products, freight costs for inbound freight from manufacturers, costs related towarehousing and the shipping of products to customers, credit card processing fees for direct sales, and duties and customs applicable to imported products. As a percent of totalrevenue, cost of revenue represented 58.7% of revenue as compared to 66.9% for the quarter ended September 30, 2019. The decrease in costs as a percent of revenue wasprimarily due to increases in sales prices as we offered fewer discounts, as well as realizing efficiencies and economies of scale in the supply chain. In the prior year, we generated adisproportionate amount of sales related to specific deals, such as Amazon’s Prime Day, which typically have compressed margins, one-time fees related to establishing a newwarehouse location, and additional warehouse fees for product preparation, which did not occur in the current period. Gross ProfitOur gross profit varies based upon the factors affecting net revenue and cost of revenue (as discussed above), as well as the mix of our revenue that comes from the retail, direct-to-consumer, and international channels. In a direct-to-consumer sale, we recognize as revenue the full consumer purchase price for the product. In retail and international sales,by comparison, we recognize as revenue the wholesale price for the product that we charge to the retailer or international distributor. Media costs associated with direct sales areincluded in sales and marketing expenses. As a result, international sales generally have lower gross margins and retailer margins will fluctuate with changes in programs designedto drive sales. The gross profit percentage for the quarter ended September 30, 2020 was 41.3% as compared to 33.1% for the quarter ended September 30, 2019. The increase inour gross profit was primarily attributable to the changes to our customer and product mix within both the retail and direct-to-consumer, driving sales without as much discounting,higher sales and resulting economies of scale. Additionally, in the prior year we experienced several supply chain and warehouse issues that caused friction and increased costs.
24
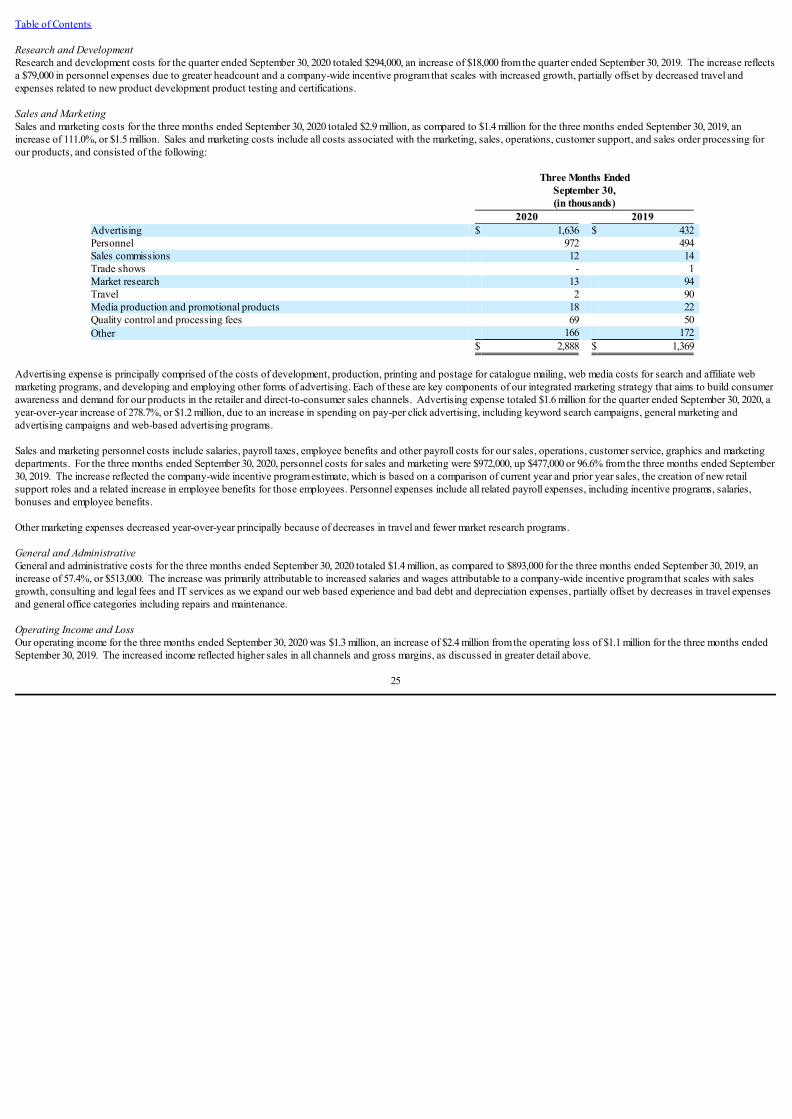
Table of Contents Research and DevelopmentResearch and development costs for the quarter ended September 30, 2020 totaled $294,000, an increase of $18,000 from the quarter ended September 30, 2019. The increase reflectsa $79,000 in personnel expenses due to greater headcount and a company-wide incentive program that scales with increased growth, partially offset by decreased travel andexpenses related to new product development product testing and certifications. Sales and MarketingSales and marketing costs for the three months ended September 30, 2020 totaled $2.9 million, as compared to $1.4 million for the three months ended September 30, 2019, anincrease of 111.0%, or $1.5 million. Sales and marketing costs include all costs associated with the marketing, sales, operations, customer support, and sales order processing forour products, and consisted of the following:
Three Months EndedSeptember 30,(in thousands)
2020 2019 Advertising $ 1,636 $ 432 Personnel 972 494 Sales commissions 12 14 Trade shows - 1 Market research 13 94 Travel 2 90 Media production and promotional products 18 22 Quality control and processing fees 69 50 Other 166 172 $ 2,888 $ 1,369
Advertising expense is principally comprised of the costs of development, production, printing and postage for catalogue mailing, web media costs for search and affiliate webmarketing programs, and developing and employing other forms of advertising. Each of these are key components of our integrated marketing strategy that aims to build consumerawareness and demand for our products in the retailer and direct-to-consumer sales channels. Advertising expense totaled $1.6 million for the quarter ended September 30, 2020, ayear-over-year increase of 278.7%, or $1.2 million, due to an increase in spending on pay-per click advertising, including keyword search campaigns, general marketing andadvertising campaigns and web-based advertising programs. Sales and marketing personnel costs include salaries, payroll taxes, employee benefits and other payroll costs for our sales, operations, customer service, graphics and marketingdepartments. For the three months ended September 30, 2020, personnel costs for sales and marketing were $972,000, up $477,000 or 96.6% from the three months ended September30, 2019. The increase reflected the company-wide incentive program estimate, which is based on a comparison of current year and prior year sales, the creation of new retailsupport roles and a related increase in employee benefits for those employees. Personnel expenses include all related payroll expenses, including incentive programs, salaries,bonuses and employee benefits. Other marketing expenses decreased year-over-year principally because of decreases in travel and fewer market research programs. General and AdministrativeGeneral and administrative costs for the three months ended September 30, 2020 totaled $1.4 million, as compared to $893,000 for the three months ended September 30, 2019, anincrease of 57.4%, or $513,000. The increase was primarily attributable to increased salaries and wages attributable to a company-wide incentive program that scales with salesgrowth, consulting and legal fees and IT services as we expand our web based experience and bad debt and depreciation expenses, partially offset by decreases in travel expensesand general office categories including repairs and maintenance. Operating Income and LossOur operating income for the three months ended September 30, 2020 was $1.3 million, an increase of $2.4 million from the operating loss of $1.1 million for the three months endedSeptember 30, 2019. The increased income reflected higher sales in all channels and gross margins, as discussed in greater detail above.
25

Table of Contents Net Income and LossFor the three months ended September 30, 2020, we recorded a net income of $1.3 million as compared to a net loss of $1.1 million for the three months ended September 30, 2019. Segment ResultsWe report our segment information in the same way that management assesses the business and makes decision regarding the allocations of resources in accordance with theSegment Reporting Topic of the Financial Accounting Standards Board Accounting Standards Codification (ASC). Factors considered in determining our reportable segmentsinclude the nature of the business activities, the reports provided to the Company’s chief operating decision maker (CODM) for operating and administrative activities, availableinformation and information that is presented to our Board of Directors.
The Company’s CODM has been identified as the Chief Executive Officer because he has final authority over the performance assessment and resource allocation decisions. TheCODM: (i) regularly receives discrete financial information about each reportable segment, (ii) uses all such information for performance assessment and resource allocationdecisions; and (iii) evaluates the performance of and allocates resources based upon the contribution margins of each segment. As a result, we divide our business into two reportable segments: Direct-to-Consumer and Retail. This division of reportable segments is consistent with how the segments reportto and are managed by the chief operating decision maker of the Company. The Company evaluates performance based on the primary financial measure of contribution margin("segment profit”). Segment profit reflects the income or loss from operations before corporate expenses, non-operating income, net interest expense, and income taxes. Three Months Ended September 30, 2020 (dollar amounts in thousands) Direct-to-consumer Retail Corporate/Other Consolidated Net sales $ 5,051 $ 9,259 $ - $ 14,310 Cost of revenue 3,059 5,344 - 8,403 Gross profit 1,992 3,915 - 5,907 Gross profit percentage 39.4% 42.3% - 41.3%Sales and marketing (1) 783 891 159 1,833 Segment profit 1,209 3,024 (159) 28.5 Segment profit percentage 23.9% 32.7% - 28.5% (1) Sales and marketing expense includes advertising, trade shows, media production and promotional products and other as discussed in the sales and marketing section. Three Months Ended September 30, 2019 (dollar amounts in thousands) Direct-to-consumer Retail Corporate/Other Consolidated Net sales $ 1,628 $ 2,795 $ - $ 4,423 Cost of revenue 920 2,038 - 2,958 Gross profit 708 757 - 1,465 Gross profit percentage 43.5% 27.1% - 33.1%Sales and marketing (1) 110 463 147 720 Segment profit 598 294 (147) 745 Segment profit percentage 36.7% 10.5% - 16.8% (1) Sales and marketing expense includes advertising, trade shows, media production and promotional products and other as discussed in the sales and marketing section.
26
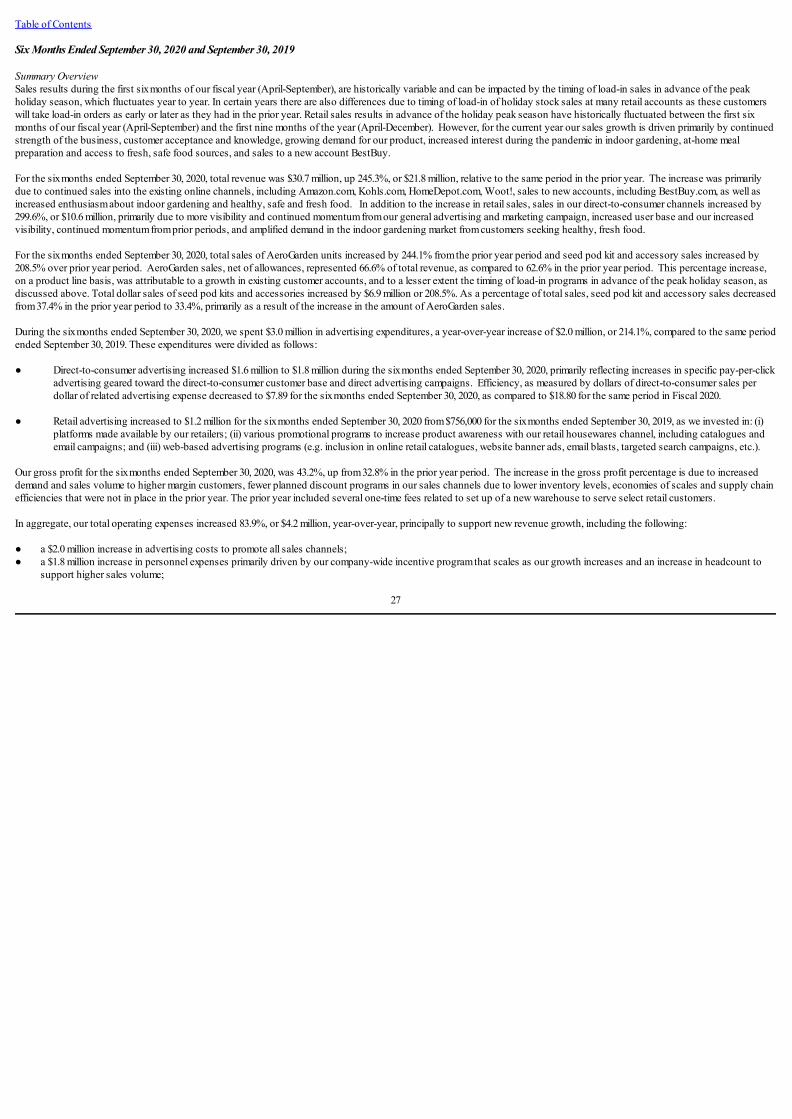
Table of Contents Six Months Ended September 30, 2020 and September 30, 2019 Summary OverviewSales results during the first six months of our fiscal year (April-September), are historically variable and can be impacted by the timing of load-in sales in advance of the peakholiday season, which fluctuates year to year. In certain years there are also differences due to timing of load-in of holiday stock sales at many retail accounts as these customerswill take load-in orders as early or later as they had in the prior year. Retail sales results in advance of the holiday peak season have historically fluctuated between the first sixmonths of our fiscal year (April-September) and the first nine months of the year (April-December). However, for the current year our sales growth is driven primarily by continuedstrength of the business, customer acceptance and knowledge, growing demand for our product, increased interest during the pandemic in indoor gardening, at-home mealpreparation and access to fresh, safe food sources, and sales to a new account BestBuy. For the six months ended September 30, 2020, total revenue was $30.7 million, up 245.3%, or $21.8 million, relative to the same period in the prior year. The increase was primarilydue to continued sales into the existing online channels, including Amazon.com, Kohls.com, HomeDepot.com, Woot!, sales to new accounts, including BestBuy.com, as well asincreased enthusiasm about indoor gardening and healthy, safe and fresh food. In addition to the increase in retail sales, sales in our direct-to-consumer channels increased by299.6%, or $10.6 million, primarily due to more visibility and continued momentum from our general advertising and marketing campaign, increased user base and our increasedvisibility, continued momentum from prior periods, and amplified demand in the indoor gardening market from customers seeking healthy, fresh food. For the six months ended September 30, 2020, total sales of AeroGarden units increased by 244.1% from the prior year period and seed pod kit and accessory sales increased by208.5% over prior year period. AeroGarden sales, net of allowances, represented 66.6% of total revenue, as compared to 62.6% in the prior year period. This percentage increase,on a product line basis, was attributable to a growth in existing customer accounts, and to a lesser extent the timing of load-in programs in advance of the peak holiday season, asdiscussed above. Total dollar sales of seed pod kits and accessories increased by $6.9 million or 208.5%. As a percentage of total sales, seed pod kit and accessory sales decreasedfrom 37.4% in the prior year period to 33.4%, primarily as a result of the increase in the amount of AeroGarden sales.
During the six months ended September 30, 2020, we spent $3.0 million in advertising expenditures, a year-over-year increase of $2.0 million, or 214.1%, compared to the same periodended September 30, 2019. These expenditures were divided as follows: ● Direct-to-consumer advertising increased $1.6 million to $1.8 million during the six months ended September 30, 2020, primarily reflecting increases in specific pay-per-click
advertising geared toward the direct-to-consumer customer base and direct advertising campaigns. Efficiency, as measured by dollars of direct-to-consumer sales perdollar of related advertising expense decreased to $7.89 for the six months ended September 30, 2020, as compared to $18.80 for the same period in Fiscal 2020.
● Retail advertising increased to $1.2 million for the six months ended September 30, 2020 from $756,000 for the six months ended September 30, 2019, as we invested in: (i)
platforms made available by our retailers; (ii) various promotional programs to increase product awareness with our retail housewares channel, including catalogues andemail campaigns; and (iii) web-based advertising programs (e.g. inclusion in online retail catalogues, website banner ads, email blasts, targeted search campaigns, etc.).
Our gross profit for the six months ended September 30, 2020, was 43.2%, up from 32.8% in the prior year period. The increase in the gross profit percentage is due to increaseddemand and sales volume to higher margin customers, fewer planned discount programs in our sales channels due to lower inventory levels, economies of scales and supply chainefficiencies that were not in place in the prior year. The prior year included several one-time fees related to set up of a new warehouse to serve select retail customers. In aggregate, our total operating expenses increased 83.9%, or $4.2 million, year-over-year, principally to support new revenue growth, including the following: ● a $2.0 million increase in advertising costs to promote all sales channels;● a $1.8 million increase in personnel expenses primarily driven by our company-wide incentive program that scales as our growth increases and an increase in headcount to
support higher sales volume;
27

Table of Contents ● a $330,000 increase in legal and consulting expenses related to the consideration and analysis of strategic alternatives posed by Scotts Miracle-Gro; and● a $249,000 increase in bad debt and depreciation expense. These increases were partially offset by a $247,000 decrease in company-wide travel. Our operating income increased $6.1 million to $4.0 million for the six months ended September30, 2020, from an operating loss of $2.1 million in the prior year period, primarily as a result of increased sales with existing customers, sales to new customers, decreased operatingexpenses as a percentage of revenue and increased margins. Other expense for the six months ended September 30, 2020 totaled to a net other expense of $73,000, as compared to net other expense of $59,000 in the prior year period. Thecurrent year other expense is attributable to an increase in foreign exchange losses and interest expense on the outstanding loans. In the prior year period, net other expense wasprimarily attributable to interest expense, offset by foreign exchange gains. The net income for the six months ended September 30, 2020 was $3.9 million, as compared to the $2.2 million loss in the prior year. The increased net income is due to increases inoverall sales, for both retail accounts direct-to-consumer sales, along with increased gross margins, and decreased operating expenses as a percentage of revenue. The following table sets forth, as a total percentage of sales, our financial results for the six months ended September 30, 2020, and the six months ended September 30, 2019:
Six Months Ended
September 30, 2020 2019 Net revenue
Direct-to-consumer 45.9% 39.7%Retail 53.3% 58.1%International 0.8% 2.2%Total net revenue 100.0% 100.0%
Cost of revenue 56.8% 67.2%Gross profit 43.2% 32.8%
Operating expenses
Research and development 1.9% 5.5%Sales and marketing 18.6% 31.1%General and administrative 9.7% 20.1%Total operating expenses 30.2% 56.7%
Income (loss) income from operations 13.0% (23.9)% RevenueFor the six months ended September 30, 2020, revenue totaled $30.7 million, a year-over-year increase of 245.3% or $21.8 million, from the six months ended September 30, 2019.
Six Months EndedSeptember 30,(in thousands)
Net Revenue 2020 2019 Direct-to-consumer $ 14,107 $ 3,530 Retail 16,385 5,168 International 229 200 Total $ 30,721 $ 8,898
28

Table of Contents Direct-to-consumer sales for the six months ended September 30, 2020, totaled 14.1 million, up $10.6 million or 299.6%, from the prior year period. This increase was caused bycontinued momentum of growth from prior periods amplified by demand in indoor gardening of customers seeking healthy, fresh food and uncertainties in the food supply chainduring COVID-19. We continued driving direct-to-consumer awareness during our non-peak season through our focus on advertising that drives increased direct-to-consumerawareness, better promotional scheduling, follow-on direct sales to customers that have previously purchased AeroGardens, and continued momentum from general brandawareness campaigns. Sales to retailer customers for the six months ended September 30, 2020, totaled $16.4 million, up $11.2 million, or 217.0%, from the prior year period, principally reflecting: (i) organicgrowth in our existing retail accounts, namely Amazon.com, Kohl’s and Canadian Tire; (ii) earlier program load-in with Woot!; and (iii) sales to one new account, Best Buy, all ofwhich began in advance of the peak holiday season. Historically, load-in sales in advance of the peak holiday season to both online and brick-and-mortar stores vary between thisquarter and the next quarter. International sales for the six months ended September 30, 2020, totaled $229,000, an increase of $29,000 from the prior year period. Our products consist of AeroGardens, and seed pod kits and accessories. A summary of the sales of these two product categories for the six months ended September 30, 2020and September 30, 2019 is as follows:
Six Months Ended
September 30, 2020 2019 Product revenue (in thousands) (in thousands)
AeroGardens $ 23,429 $ 6,809 Seed pod kits and accessories 10,259 3,325 Discounts, allowances and other (2,967) (1,236)Total $ 30,721 $ 8,898
% of total revenue AeroGardens 76.3% 76.5%Seed pod kits and accessories 33.4% 37.4%Discounts, allowances and other (9.7)% (13.9)%Total 100.0% 100.0%
AeroGarden sales increased $16.6 million, or 244.1%, from the prior year period, reflecting an increase in the organic growth from existing customers, demand of customers seekinghealthy, safe gardening items and sales of AeroGardens in our direct-to-consumer channel. The increase in seed pod kit and accessory sales, which increased by $6.9 million, or208.5%, principally reflects the continued focus on acquiring new AeroGarden customers, who have historically purchased seed pod kits and accessories after purchasing andusing new AeroGardens. For the six months ended September 30, 2020, sales of seed pod kits and accessories represented 33.4% of total revenue, as compared to 37.4% in theprior year period. The percentage decrease is due to the relatively larger increase in AeroGarden purchases. Other revenue, which is comprised primarily of grow club revenue,shipping revenue, accruals and deductions, decreased as a percent of the total to (9.7)% from (13.9)% in the prior year period due to lower retail sales estimated returns, deductionsfor sales allowances and future discounts for in-store retail accounts. Cost of RevenueCost of revenue for the six months ended September 30, 2020 totaled $17.5 million, an increase of $11.5 million, from the six months ended September 30, 2019, due to increased salesvolume. Cost of revenue includes product costs for purchased and manufactured products, freight costs for inbound freight from manufacturers, costs related to warehousing andthe shipping of products to customers, credit card processing fees for direct sales, and duties and customs applicable to imported products. As a percent of total revenue, cost ofrevenue represented 56.8% of revenue as compared to 67.2% for the prior year period. Gross ProfitOur gross profit varies based upon the factors affecting net revenue and cost of revenue as discussed above, as well as the mix of our revenue that comes from the retail, direct-to-consumer, and international channels. In a direct-to-consumer sale, we recognize as revenue the full consumer purchase price for the product. In retail and international sales, bycomparison, we recognize as revenue the wholesale price for the product that we charge to the retailer or international distributor. Media costs associated with direct sales areincluded in sales and marketing expenses. As a result, retail and international sales generally have lower gross profits than direct-to-consumer sales. The gross profit for the sixmonths ended September 30, 2020, was 43.2% as compared to 32.8% for the six months ended September 30, 2019. The increase in our gross profit percentage was primarily due tochanges in customer demand and product mix within both the retail and direct-to-consumer channels, driving sales without as much discounting, higher overall sales volume andeconomies of scale in our supply chain.
29
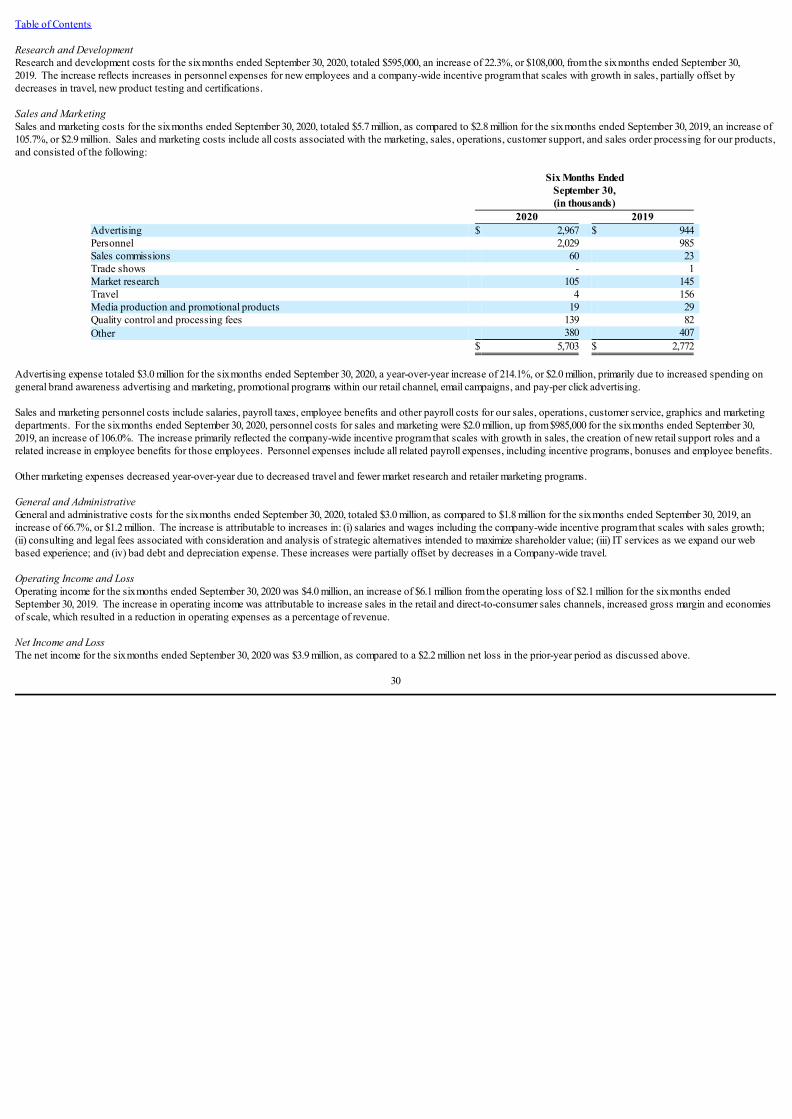
Table of Contents Research and DevelopmentResearch and development costs for the six months ended September 30, 2020, totaled $595,000, an increase of 22.3%, or $108,000, from the six months ended September 30,2019. The increase reflects increases in personnel expenses for new employees and a company-wide incentive program that scales with growth in sales, partially offset bydecreases in travel, new product testing and certifications. Sales and MarketingSales and marketing costs for the six months ended September 30, 2020, totaled $5.7 million, as compared to $2.8 million for the six months ended September 30, 2019, an increase of105.7%, or $2.9 million. Sales and marketing costs include all costs associated with the marketing, sales, operations, customer support, and sales order processing for our products,and consisted of the following:
Six Months EndedSeptember 30,(in thousands)
2020 2019 Advertising $ 2,967 $ 944 Personnel 2,029 985 Sales commissions 60 23 Trade shows - 1 Market research 105 145 Travel 4 156 Media production and promotional products 19 29 Quality control and processing fees 139 82 Other 380 407 $ 5,703 $ 2,772
Advertising expense totaled $3.0 million for the six months ended September 30, 2020, a year-over-year increase of 214.1%, or $2.0 million, primarily due to increased spending ongeneral brand awareness advertising and marketing, promotional programs within our retail channel, email campaigns, and pay-per click advertising. Sales and marketing personnel costs include salaries, payroll taxes, employee benefits and other payroll costs for our sales, operations, customer service, graphics and marketingdepartments. For the six months ended September 30, 2020, personnel costs for sales and marketing were $2.0 million, up from $985,000 for the six months ended September 30,2019, an increase of 106.0%. The increase primarily reflected the company-wide incentive program that scales with growth in sales, the creation of new retail support roles and arelated increase in employee benefits for those employees. Personnel expenses include all related payroll expenses, including incentive programs, bonuses and employee benefits. Other marketing expenses decreased year-over-year due to decreased travel and fewer market research and retailer marketing programs. General and AdministrativeGeneral and administrative costs for the six months ended September 30, 2020, totaled $3.0 million, as compared to $1.8 million for the six months ended September 30, 2019, anincrease of 66.7%, or $1.2 million. The increase is attributable to increases in: (i) salaries and wages including the company-wide incentive program that scales with sales growth;(ii) consulting and legal fees associated with consideration and analysis of strategic alternatives intended to maximize shareholder value; (iii) IT services as we expand our webbased experience; and (iv) bad debt and depreciation expense. These increases were partially offset by decreases in a Company-wide travel. Operating Income and LossOperating income for the six months ended September 30, 2020 was $4.0 million, an increase of $6.1 million from the operating loss of $2.1 million for the six months endedSeptember 30, 2019. The increase in operating income was attributable to increase sales in the retail and direct-to-consumer sales channels, increased gross margin and economiesof scale, which resulted in a reduction in operating expenses as a percentage of revenue. Net Income and LossThe net income for the six months ended September 30, 2020 was $3.9 million, as compared to a $2.2 million net loss in the prior-year period as discussed above.
30
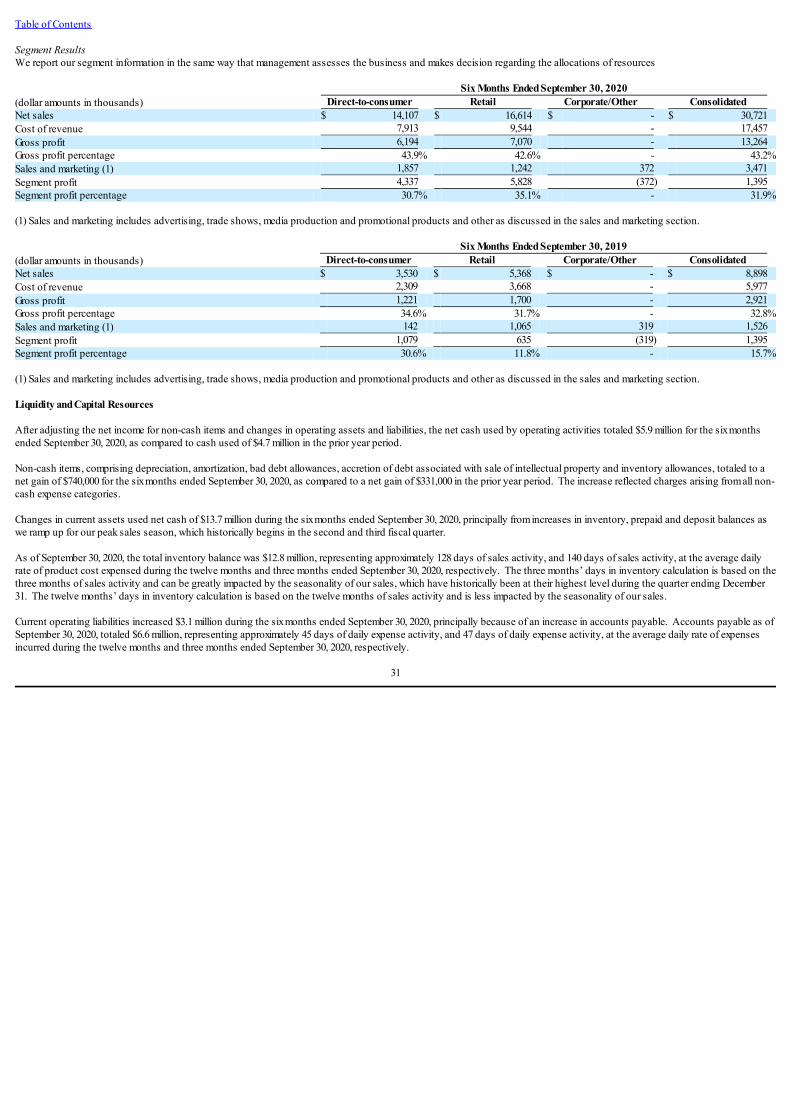
Table of Contents Segment ResultsWe report our segment information in the same way that management assesses the business and makes decision regarding the allocations of resources Six Months Ended September 30, 2020 (dollar amounts in thousands) Direct-to-consumer Retail Corporate/Other Consolidated Net sales $ 14,107 $ 16,614 $ - $ 30,721 Cost of revenue 7,913 9,544 - 17,457 Gross profit 6,194 7,070 - 13,264 Gross profit percentage 43.9% 42.6% - 43.2%Sales and marketing (1) 1,857 1,242 372 3,471 Segment profit 4,337 5,828 (372) 1,395 Segment profit percentage 30.7% 35.1% - 31.9% (1) Sales and marketing includes advertising, trade shows, media production and promotional products and other as discussed in the sales and marketing section. Six Months Ended September 30, 2019 (dollar amounts in thousands) Direct-to-consumer Retail Corporate/Other Consolidated Net sales $ 3,530 $ 5,368 $ - $ 8,898 Cost of revenue 2,309 3,668 - 5,977 Gross profit 1,221 1,700 - 2,921 Gross profit percentage 34.6% 31.7% - 32.8%Sales and marketing (1) 142 1,065 319 1,526 Segment profit 1,079 635 (319) 1,395 Segment profit percentage 30.6% 11.8% - 15.7% (1) Sales and marketing includes advertising, trade shows, media production and promotional products and other as discussed in the sales and marketing section. Liquidity and Capital Resources After adjusting the net income for non-cash items and changes in operating assets and liabilities, the net cash used by operating activities totaled $5.9 million for the six monthsended September 30, 2020, as compared to cash used of $4.7 million in the prior year period. Non-cash items, comprising depreciation, amortization, bad debt allowances, accretion of debt associated with sale of intellectual property and inventory allowances, totaled to anet gain of $740,000 for the six months ended September 30, 2020, as compared to a net gain of $331,000 in the prior year period. The increase reflected charges arising from all non-cash expense categories. Changes in current assets used net cash of $13.7 million during the six months ended September 30, 2020, principally from increases in inventory, prepaid and deposit balances aswe ramp up for our peak sales season, which historically begins in the second and third fiscal quarter. As of September 30, 2020, the total inventory balance was $12.8 million, representing approximately 128 days of sales activity, and 140 days of sales activity, at the average dailyrate of product cost expensed during the twelve months and three months ended September 30, 2020, respectively. The three months’ days in inventory calculation is based on thethree months of sales activity and can be greatly impacted by the seasonality of our sales, which have historically been at their highest level during the quarter ending December31. The twelve months’ days in inventory calculation is based on the twelve months of sales activity and is less impacted by the seasonality of our sales. Current operating liabilities increased $3.1 million during the six months ended September 30, 2020, principally because of an increase in accounts payable. Accounts payable as ofSeptember 30, 2020, totaled $6.6 million, representing approximately 45 days of daily expense activity, and 47 days of daily expense activity, at the average daily rate of expensesincurred during the twelve months and three months ended September 30, 2020, respectively.
31

Table of Contents Net investment activity used $1.2 million of cash in the current year period, principally due to purchases of equipment as we change supply manufacturers and introduce newproducts. Net financing activity provided net cash of $2.0 million during the six months ended September 30, 2020, principally due to the Term Loan and payments on the capital lease. CashAs of September 30, 2020, we had a cash balance of $3.8 million, of which $15,000 was restricted as collateral for various corporate obligations. This compares to a cash balance of$9.1 million as of March 31, 2020, of which $15,000 was restricted. The decrease in cash is primarily attributable to the purchase of inventory in the current quarter to meet peakseason sales demand, particularly current period load-in sales with new and expanded brick-and-mortar retail customers. Borrowing AgreementsAs of September 30, 2020 and March 31, 2020, we have $2.9 million and $900,000, respectively, of outstanding long-term debt. We have entered into a Working Capital Term LoanAgreement in the principal amount of up to $7.5 million and Real Estate Term Loan Agreement in the principal amount of up to $1.5 million with Scotts Miracle-Gro. As ofSeptember 30, 2020 and March 31, 2020, the outstanding balance of our note payable and debt, including accrued interest, was as follows:
September 30,
2020 March 31,
2020 (in thousands) (in thousands) Notes payable and debt-related party $ 2,915 $ 915
Total debt 2,915 915 Less current portion – long term debt 2,015 15
Long term debt $ 900 $ 900 After September 30, 2020, we borrowed an additional $1.5 million under the Working Capital Term Loan, bringing the total principal amount due under both loans to $4.4 million. Cash Requirements We generally require cash to: ● fund our operations and working capital requirements;● develop and execute our product development and market introduction plans;● execute our sales and marketing plans;● fund research and development efforts; and● pay debt obligations as they come due. At this time, we do not expect to enter into additional capital leases to finance major purchases. In addition, we do not currently have any binding commitments with third partiesto obtain any material amount of equity or debt financing other than the financing arrangements described in this report.
32
Table of Contents Assessment of Future Liquidity and Results of Operations LiquidityTo assess our ability to fund ongoing operating requirements, we developed assumptions regarding operating cash flow. Critical sources of funding, and key assumptions andareas of uncertainty include: ● our cash of $3.8 million ($15,000 of which is restricted as collateral for our various corporate obligations) as of September 30, 2020;● our cash of $2.8 million ($15,000 of which is restricted as collateral for our various corporate obligations) as of November 9, 2020;● the continued support of, and extensions of credit by, our suppliers and lenders, including, but not limited to, the Working Capital Term Loan of up to $7.5 million and
Real Estate Term Loan of up to $1.5 million, both from Scotts Miracle-Gro, of which we had borrowed an aggregate of approximately $2.9 million and $4.4 million of thecombined $9.0 million in principal amount as of September 30, 2020 and November 9, 2020, respectively;
● our historical pattern of increased sales between September and March, and lower sales volume from April through August;● the level of spending necessary to support our planned initiatives; and● our sales to consumers, retailers, and international distributors, and the resulting cash flow from operations, which will depend in great measure on the success of our
direct-to-consumer sales initiatives, and the acceptance of the product at our various retail distribution customers. On August 3, 2020, the Company entered into a Working Capital Term Loan Agreement in the principal amount of up to $7.5 million with Scotts Miracle-Gro. The proceeds will bemade available as needed in increments of $500,000, the Company may pay down and reborrow during the Term Loan, not to exceed $7.5 million with a due date of June 30,2021. The Term Loan Agreement is secured by a lien on the assets of the Company and interest is charged at the stated rate of 10% per annum to be paid quarterly in arrears incash, at the end of each September, December, March and June. The funds provide general working capital and is being used for the purpose of acquiring inventory to supportanticipated growth as the Company expands its retail and its direct-to-consumer sales channels. We have borrowed an aggregate $3.5 million as of November 9, 2020 and canreborrow amounts repaid against the $7.5 million loan in order to purchase inventory during our peak selling season. See Note 3 "Notes Payable, Long Term Debt and CurrentPortion – Long Term Debt” to our condensed financial statements. On June 20, 2019, the Company entered into a Real Estate Term Loan Agreement in the principal amount of up to $1.5 million with Scotts Miracle-Gro. The funding provides capitalto fund real estate related lease obligations. The proceeds will be made available as needed in increments of $100,000 not to exceed $1.5 million with a due date of March 31, 2022.Interest will be charged at the stated rate of 10% and will be paid quarterly in arrears on each of April 30, July 31, October 31 and January 31. As of September 30, 2020, theCompany had borrowed $900,000 under the Real Estate Term Loan. See Note 3 "Notes Payable, Long Term Debt and Current Portion – Long Term Debt” to our condensed financialstatements. Based on these facts and assumptions, we believe our existing cash and cash equivalents, along with the Term Loan Agreement and the cash generated by our anticipated resultsfrom operations, will be sufficient to meet our operating needs for the next twelve months.
33

Table of Contents Results of OperationsThere are several factors that could affect our future results of operations. These factors include, but are not limited to, the following: ● the effectiveness of our consumer marketing efforts in generating both direct-to-consumer sales, and sales to consumers by our retailer customers;● uncertainty regarding the impact of macroeconomic conditions, including the COVID pandemic, on consumer spending;● uncertainty regarding the capital markets and our access to sufficient capital to support our current and projected scale of operations;● the seasonality of our business, in which we have historically experienced higher sales volume during the fall and winter months (September through March);● a continued, uninterrupted supply of product from our third-party manufacturing suppliers in China;● the success of our relationship with Scotts Miracle-Gro, and● uncertainty of appropriate exit strategies with retail customers regardless of the contractual obligations. Off-Balance Sheet Arrangements We do not have any off-balance sheet financing arrangements or liabilities, guarantee contracts, retained or contingent interest in transferred assets, and have not entered into anycontracts for financial derivative such as futures, swaps, and options.
34
Table of Contents Item 3. Quantitative and Qualitative Disclosures About Market Risk Interest Rate Risk Our interest income is most sensitive to fluctuations in the general level of U.S. interest rates. As such, changes in U.S. interest rates affect the interest earned on our cash, cashequivalents, and short-term investments, and the value of those investments. Due to the short-term nature of our cash equivalents and investments, we have concluded that achange in interest rates does not pose a material market risk to us with respect to our interest income. Our debt carries fixed interest rates and therefore changes in the general levelof market interest rates will not impact our interest expense during the terms of our existing debt arrangements. Foreign Currency Exchange Risk We transact business primarily in U.S. currency. Although we purchase our products in U.S. dollars, the prices charged by our suppliers in Asia are predicated upon their cost forcomponents, labor and overhead. Therefore, changes in the valuation of the U.S. dollar in relation to the Chinese currencies may cause our manufacturers to raise prices of ourproducts which could reduce our profit margins. In future periods, it is possible that we could be exposed to fluctuations in foreign currency exchange rates on accounts receivable from sales and net monetary assetsdenominated in foreign currencies and liabilities. To date, however, virtually all of our transactions have been denominated in U.S. dollars. Foreign Import Tariff Risk We purchase a significant portion of supplies from suppliers outside the United States. The United States and other countries have levied tariffs and taxes on certain goods.Further tariffs, additional taxes, or trade barriers may increase our selling and/or manufacturing costs, decrease margins, reduce the competitiveness of our products, or inhibit ourability to sell products or purchase necessary supplies, which could have a material adverse effect on our business, results of operations, or financial conditions. Item 4. Controls and Procedures (a) Evaluation of Disclosure Controls and Procedures Disclosure controls and procedures are designed to ensure that information required to be disclosed in the reports filed or submitted by the Company under the SecuritiesExchange Act of 1934 (the "Exchange Act”), is recorded, processed, summarized, and reported, within the time periods specified in the rules and forms of the SEC. Disclosurecontrols and procedures include, without limitation, controls and procedures designed to ensure that information required to be disclosed in the reports filed under the ExchangeAct is accumulated and communicated to the Company’s management, including its principal executive and financial officer, as appropriate, to allow timely decisions regardingrequired disclosure. The Company carried out an evaluation, under the supervision and with the participation of its management, including its principal executive officer and principal financial officer,of the effectiveness of the design and operation of the Company’s disclosure controls and procedures as of the end of the period covered by this report. Based upon and as of thedate of that evaluation, the Company’s principal executive officer and financial officer concluded that the Company’s disclosure controls and procedures are effective to ensurethat information required to be disclosed in the reports the Company files and submits under the Exchange Act is recorded, processed, summarized and reported within the timeperiods specified in the SEC’s rules and forms. (b) Changes in Internal Controls There were no changes in the Company’s internal controls or in other factors that could have significantly affected those controls during the three months ended September 30,2020.
35
Table of Contents PART II - OTHER INFORMATION Item 1. Legal Proceedings None. Item 1A. Risk Factors Our operations and financial results are subject to various risks and uncertainties that could adversely affect our business, results of operations, financial condition, future results,and the trading price of our common stock. In addition to the other information set forth in this Quarterly Report and the risk factors noted below, you should also carefullyconsider the factors described in "Part I. Item 1A. Risk Factors” of our Annual Report on Form 10-K for the year ended March 31, 2020, which could materially affect our business,results of operations, financial condition, future results, and the trading price of our common stock. The announcement and pendency of the Merger may have an adverse effect on our business, financial condition, operating results and cash flows. On November 11, 2020, we entered into the Merger Agreement with Parent, Merger Sub, and, solely for the purposes stated in Section 6.4 of the Merger Agreement, Scotts Miracle-Gro, relating to the proposed acquisition of the Company by Parent. Upon consummation of the Merger pursuant to the Merger Agreement, the Company will continue as thesurviving corporation as a direct, wholly-owned subsidiary of Parent and an indirect, wholly-owned subsidiary of Scotts Miracle-Gro. Upon the terms and subject to the conditions set forth in the Merger Agreement, at the Effective Time, each share of the Company’s common stock (other than Excluded Sharesand Dissenting Shares (each as defined in the Merger Agreement)), issued and outstanding immediately prior to the Effective Time will be automatically converted into the right toreceive $3.00 in cash, without interest thereon and subject to any required withholding of taxes, and will be cancelled. Uncertainty about the effect of the proposed Merger on our employees, partners, customers and other third parties may disrupt our sales and marketing or other key businessactivities and may have a material adverse effect on our business, financial condition, operating results and cash flows. Current and prospective employees may experienceuncertainty about their roles following the Merger, and this may have an effect on our corporate culture. There can be no assurance we will be able to attract and retain key talentto the same extent that we have previously been able to attract and retain employees. Any loss or distraction of such employees could have a material adverse effect on ourbusiness, financial condition and operating results. In addition, we have devoted, and will continue to devote, significant management and other internal resources towards thecompletion of the Merger and planning for integration, which could materially adversely affect our business, financial condition, operating results and cash flows. Parties withwhich we have business relationships may experience uncertainty as to the future of such relationships and may delay or defer certain business decisions, seek alternativerelationships with third parties or seek to alter their present business relationships with us. Parties with whom we otherwise may have sought to establish business relationshipsmay seek alternative relationships with third parties. The Merger Agreement generally requires us to operate our business in the ordinary course pending consummation of the proposed Merger and generally restricts us from takingcertain specified actions until the Merger is completed. These restrictions may affect our ability to execute our business strategies, to respond effectively to competitive pressuresand industry developments, and to attain our financial and other goals and may otherwise harm our business, financial condition, operating results and cash flows. The failure to complete the Merger in a timely manner or at all could negatively impact the market price of our common stock as well as adversely affect our business,financial condition, operating results and cash flows. Completion of the Merger is subject to conditions beyond our control that may prevent, delay or otherwise adversely affect its completion in a material way, including therequirement that the Merger Agreement and the transactions contemplated thereby (including the Merger) be approved by a majority of the outstanding shares of our commonstock entitled to vote on such matter at the Special Meeting.
36
Table of Contents The Merger cannot be completed until the conditions to closing are satisfied or (if permissible under applicable law) waived. These conditions will be more fully described in theCompany’s proxy statement on Schedule 14A related to the Merger and the Special Meeting to be filed with the Securities and Exchange Commission (the "Proxy Statement”). Wecannot guarantee that the closing conditions set forth in the Merger Agreement will be satisfied or, even if satisfied, that no event of termination will take place. In the event thatthe Merger is not completed for any reason, the holders of our common stock will not receive any payment for their shares of common stock in connection with the proposedMerger. Instead, we will remain an independent public company and the holders of our common stock will continue to own their shares of stock. If the Merger or a similar transaction is not completed, the share price of our common stock may drop to the extent that the current market price of our common stock reflects anassumption that a transaction will be completed. Furthermore, if the Merger is significantly delayed or not completed, we may suffer other consequences that could adversely affect our business, results of operations and stockprice, including the following: ● we would have incurred significant costs in connection with the Merger that we would be unable to recover; ● we may be subject to negative publicity or be negatively perceived by the investment or business communities; ● we may be subject to legal proceedings related to any delay or failure to complete the Merger;
● any disruptions to our business resulting from the announcement and pendency of the Merger, including any adverse changes in our relationships with our customers,suppliers, other business partners and employees, may continue or intensify in the event the Merger is not consummated; and
● we may not be able to take advantage of alternative business opportunities or effectively respond to competitive pressures. There can be no assurance that our business, financial condition, operating results and cash flows will not be adversely affected, as compared to our condition prior to theannouncement of the Merger, if the Merger is not consummated. The Merger Agreement contains provisions that could discourage or deter a potential competing acquirer that might be willing to pay more to effect an alternativetransaction with us. The Merger Agreement contains provisions that, subject to certain exceptions, limit our ability to initiate, solicit or knowingly encourage, or engage in discussions or negotiationswith respect to, or provide non-public information in connection with, a proposal from a third party with respect to an alternative transaction. It is possible that these or otherprovisions in the Merger Agreement might discourage a potential competing acquirer that might have an interest in acquiring all or a significant part of our company fromconsidering or proposing an acquisition or might result in a potential competing acquirer proposing to pay a lower per share price to acquire our common stock than it mightotherwise have proposed to pay. Additional information regarding these restrictions will be provided in the Proxy Statement. Litigation challenging the Merger Agreement may prevent the Merger from being consummated at all or within the expected timeframe and may result in substantial costs tous. Lawsuits may be filed against us, our board of directors or other parties to the Merger Agreement, challenging our acquisition by Parent or making other claims in connectiontherewith. Such lawsuits may be brought by our purported stockholders and may seek, among other things, to enjoin consummation of the Merger. One of the conditions to theconsummation of the Merger is the absence of certain orders or laws enjoining, preventing or otherwise prohibiting, restraining or making unlawful the consummation of theMerger and the other transactions contemplated by the Merger Agreement. As such, if the plaintiffs in any such potential lawsuits are successful in obtaining an injunctionprohibiting us from completing the Merger on the agreed upon terms, then such injunction may prevent the Merger from becoming effective, or from becoming effective within theexpected timeframe. Item 2. Unregistered Sales of Equity Securities and Use of Proceeds None. Item 3. Defaults Upon Senior Securities None.
37

Table of Contents Item 4. Mine Safety Disclosures Not applicable. Item 5. Other Information None.
Item 6. Exhibits
ExhibitNumber
Description
2.1 Agreement and Plan of Merger, dated as of November 11, 2020, by and among AeroGrow International, Inc., SMG Growing Media, Inc., AGI Acquisition Sub, Inc.
and solely for the purposes stated in Section 6.4, The Scotts Miracle-Gro Company (incorporated by reference to Exhibit 2.1 to our Current Report on Form 8-K,filed November 12, 2020)
3.1 Articles of Incorporation of the Company (incorporated by reference to Exhibit 3.1 of our Current Report on Form 8-K/A-2, filed November 16, 2006)3.2 Certificate of Amendment to Articles of Incorporation, dated June 25, 2002 (incorporated by reference to Exhibit 3.2 of our Current Report on Form 8-K/A-2, filed
November 16, 2006)3.3 Certificate of Amendment to Articles of Incorporation, dated November 3, 2002 (incorporated by reference to Exhibit 3.3 of our Current Report on Form 8-K/A-2,
filed November 16, 2006)3.4 Certificate of Change to Articles of Incorporation, dated January 31, 2005 (incorporated by reference to Exhibit 3.4 of our Current Report on Form 8-K/A-2, filed
November 16, 2006)3.5 Certificate of Amendment to Articles of Incorporation, dated July 27, 2005 (incorporated by reference to Exhibit 3.5 of our Current Report on Form 8-K/A-2, filed
November 16, 2006)3.6 Certificate of Amendment to Articles of Incorporation, dated February 24, 2006 (incorporated by reference to Exhibit 3.6 of our Current Report on Form 8-K/A-2,
filed November 16, 2006)3.7 Certificate of Amendment to Articles of Incorporation, certified May 3, 2010 (incorporated by reference to Exhibit 3.7 of our Quarterly Report on Form 10-Q, filed
August 12, 2010)3.8 Certificate of Amendment to Articles of Incorporation, dated May 1, 2012 (incorporated by reference to Exhibit 3.8 of our Quarterly Report on Form 10-Q, filed
August 10, 2012)3.9 Amended and Restated Bylaws of the Registrant (incorporated by reference to Exhibit 3.1 of our Current Report on Form 8-K, filed September 26, 2008)3.10 Amendment to Bylaws (incorporated by reference to Exhibit 3.9 of our Annual Report on Form 10-K for the fiscal year ended March 31, 2009, filed July 6, 2009)3.11 Amendment No. 2 to Bylaws (incorporated by reference to Exhibit 3.1 of our Current Report on Form 8-K, filed April 23, 2013)4.1 Form of Certificate of Common Stock of Registrant (incorporated by reference to Exhibit 4.1 of our Current Report on Form 8-K, filed September 5, 2007)4.2 Investor Rights Agreement by and between the Company and SMG Growing Media, Inc., dated April 22, 2013 (incorporated by reference to Exhibit 4.1 of our
Current Report on Form 8-K filed April 23, 2013)10.1 Term Loan and Security Agreement by and among AeroGrow and The Scotts Company, LLC, dated August 3, 2020 (incorporated by reference to Exhibit 10.1 of
our Current Report on Form 8-K, filed August 7, 2020)10.2 Fourth Amendment to the Technology License Agreement (incorporated by reference to Exhibit 10.2 of our Current Report on Form 8-K, filed July 11, 2018)
31.1* Certifications of the Chief Executive Officer Under Section 302 of the Sarbanes-Oxley Act.31.2* Certifications of the Chief Financial Officer Under Section 302 of the Sarbanes-Oxley Act.32.1* Certifications of the Chief Executive Officer Under Section 906 of the Sarbanes-Oxley Act.32.2* Certifications of the Chief Financial Officer Under Section 906 of the Sarbanes-Oxley Act.
101.INS* XBRL Instance Document101.SCH* XBRL Taxonomy Extension Schema Document101.CAL* XBRL Taxonomy Extension Calculation Linkbase Document101.DEF* XBRL Taxonomy Extension Definition Linkbase Document101.LAB* XBRL Taxonomy Extension Label Linkbase Document101.PRE* XBRL Taxonomy Extension Presentation Linkbase Document
* Filed herewith.
38

Table of Contents
SIGNATURES In accordance with the requirements of the Securities Exchange Act of 1934 the registrant has duly caused this report to be signed on its behalf by the undersigned thereunto dulyauthorized. AeroGrow International, Inc. Date: November 16, 2020 /s/ J. Michael Wolfe By: J. Michael Wolfe Its: President and Chief Executive Officer
(Principal Executive Officer Date: November 16, 2020 /s/Grey H. Gibbs By: Grey H. Gibbs Its: Senior Vice President Finance and Accounting
(Principal Accounting Officer)
39

EXHIBIT 31.1
CERTIFICATIONS OF THE CHIEF EXECUTIVE OFFICERUNDER SECTION 302 OF THE SARBANES-OXLEY ACT
I, J. Michael Wolfe certify that: 1. I have reviewed this report on Form 10-Q for the period ended September 30, 2020 of AeroGrow International, Inc.; 2. Based on my knowledge, this report does not contain any untrue statement of a material fact or omit to state a material fact necessary to make the statements made, in lightof the circumstances under which such statements were made, not misleading with respect to the period covered by this report; 3. Based on my knowledge, the financial statements, and other financial information included in this report, fairly present in all material respects the financial condition,results of operations and cash flows of the registrant as of, and for, the periods presented in this report; 4. The registrant’s other certifying officer and I are responsible for establishing and maintaining disclosure controls and procedures (as defined in Exchange Act Rules 13a-15(e) and 15d-15(e)) and internal control over financial reporting (as defined in Exchange Act Rules 13a-15(f) and 15d-15(f)) for the registrant and have:
(a) Designed such disclosure controls and procedures, or caused such disclosure controls and procedures to be designed under our supervision, to ensure thatmaterial information relating to the registrant, including its consolidated subsidiaries, is made known to us by others within those entities, particularly during the period in whichthis report is being prepared;
(b) Designed such internal control over financial reporting, or caused such internal control over financial reporting to be designed under our supervision, to provide
reasonable assurance regarding the reliability of financial reporting and the preparation of financial statements for external purposes in accordance with generally acceptedaccounting principles;
(c) Evaluated the effectiveness of the registrant’s disclosure controls and procedures and presented in this report our conclusions about the effectiveness of the
disclosure controls and procedures, as of the end of the period covered by this report based on such evaluation; and (d) Disclosed in this report any change in the registrant’s internal control over financial reporting that occurred during the registrant’s most recent fiscal quarter (the
registrant’s fourth fiscal quarter in the case of an annual report) that has materially affected, or is reasonably likely to materially affect, the registrant’s internal control over financialreporting; and
5. The registrant’s other certifying officer and I have disclosed, based on our most recent evaluation of internal control over financial reporting, to the registrant’s auditorsand the audit committee of the registrant’s board of directors (or persons performing the equivalent functions):
(a) All significant deficiencies and material weaknesses in the design or operation of internal control over financial reporting which are reasonably likely to adverselyaffect the registrant’s ability to record, process, summarize and report financial information; and
(b) Any fraud, whether or not material, that involves management or other employees who have a significant role in the registrant’s internal control over financial
reporting.
Date: November 16, 2020 By: /s/ J. Michael Wolfe J. Michael Wolfe President and Chief Executive Officer (Principal Executive Officer)
EXHIBIT 31.2
CERTIFICATIONS OF THE CHIEF FINANCIAL OFFICERUNDER SECTION 302 OF THE SARBANES-OXLEY ACT
I, Grey H. Gibbs, certify that: 1. I have reviewed this report on Form 10-Q for the period ended September 30, 2020 of AeroGrow International, Inc.; 2. Based on my knowledge, this report does not contain any untrue statement of a material fact or omit to state a material fact necessary to make the statements made, in lightof the circumstances under which such statements were made, not misleading with respect to the period covered by this report; 3. Based on my knowledge, the financial statements, and other financial information included in this report, fairly present in all material respects the financial condition,results of operations and cash flows of the registrant as of, and for, the periods presented in this report; 4. The registrant’s other certifying officer and I are responsible for establishing and maintaining disclosure controls and procedures (as defined in Exchange Act Rules 13a-15(e) and 15d-15(e)) and internal control over financial reporting (as defined in Exchange Act Rules 13a-15(f) and 15d-15(f)) for the registrant and have:
(a) Designed such disclosure controls and procedures, or caused such disclosure controls and procedures to be designed under our supervision, to ensure thatmaterial information relating to the registrant, including its consolidated subsidiaries, is made known to us by others within those entities, particularly during the period in whichthis report is being prepared;
(b) Designed such internal control over financial reporting, or caused such internal control over financial reporting to be designed under our supervision, to provide
reasonable assurance regarding the reliability of financial reporting and the preparation of financial statements for external purposes in accordance with generally acceptedaccounting principles;
(c) Evaluated the effectiveness of the registrant’s disclosure controls and procedures and presented in this report our conclusions about the effectiveness of the
disclosure controls and procedures, as of the end of the period covered by this report based on such evaluation; and (d) Disclosed in this report any change in the registrant’s internal control over financial reporting that occurred during the registrant’s most recent fiscal quarter (the
registrant’s fourth fiscal quarter in the case of an annual report) that has materially affected, or is reasonably likely to materially affect, the registrant’s internal control over financialreporting; and
5. The registrant’s other certifying officer and I have disclosed, based on our most recent evaluation of internal control over financial reporting, to the registrant’s auditorsand the audit committee of the registrant’s board of directors (or persons performing the equivalent functions):
(a) All significant deficiencies and material weaknesses in the design or operation of internal control over financial reporting which are reasonably likely to adverselyaffect the registrant’s ability to record, process, summarize and report financial information; and
(b) Any fraud, whether or not material, that involves management or other employees who have a significant role in the registrant’s internal control over financial
reporting. Date: November 16, 2020 By: /s/Grey H. Gibbs Grey H. Gibbs Senior Vice President Finance and Accounting
(Principal Accounting Officer)

EXHIBIT 32.1
CERTIFICATIONS OF THE CHIEF EXECUTIVE OFFICERUNDER SECTION 906 OF THE SARBANES-OXLEY ACT
In connection with the Quarterly Report of AeroGrow International, Inc. (the "Company”) on Form 10-Q for the period ended September 30, 2020 (the "Report”), as filedwith the Securities and Exchange Commission, I, J. Michael Wolfe, Chief Executive Officer of the Company, certify, pursuant to 18 U.S.C. Section 1350, as adopted pursuant toSection 906 of the Sarbanes-Oxley Act of 2002, that:
(1) The Report fully complies with the requirements of Section 13(a) or 15(d) of the Securities Exchange Act of 1934; and
(2) The information contained in the Report fairly presents, in all material respects, the financial condition and results of operations of the Company as of and for theperiod covered by this Report. Date: November 16, 2020 By: /s/ J. Michael Wolfe J. Michael Wolfe President and Chief Executive Officer
(Principal Executive Officer)

EXHIBIT 32.2
CERTIFICATIONS OF THE CHIEF FINANCIAL OFFICERUNDER SECTION 906 OF THE SARBANES-OXLEY ACT
In connection with the Quarterly Report of AeroGrow International, Inc. (the "Company”) on Form 10-Q for the period ended September 30, 2020 (the "Report”), as filedwith the Securities and Exchange Commission, I, Grey H. Gibbs, Senior Vice President Finance and Accounting of the Company, certify, pursuant to 18 U.S.C. Section 1350, asadopted pursuant to Section 906 of the Sarbanes-Oxley Act of 2002, that:
(1) The Report fully complies with the requirements of Section 13(a) or 15(d) of the Securities Exchange Act of 1934; and
(2) The information contained in the Report fairly presents, in all material respects, the financial condition and results of operations of the Company as of and for theperiod covered by this Report. Date: November 16, 2020 By: /s/Grey H. Gibbs Grey H. Gibbs Senior Vice President Finance and Accounting
(Principal Accounting Officer)