
AerodynaDlic Drag of Road Vehicles Past, Present, and...
7
The 1933 Pierce Silver Arrow had many of the aerodynamic features usually credited to the 1934 Chrysler Airflow. The AerodynaDlic Drag of Road Vehicles Past, Present, and Future by William H. Bettes AERODYNAMIC drag is the force opposite to the direction of motion that acts on a body moving through air - sayan automobile or a truck - and retards its movement. The engine power, which can be read as fuel consumption, needed to overcome aerodynamic drag makes the aerody- namic design of road vehicles a very timely issue and one that must be considered. Drag is only one of the aerodynamic forces acting on vehicles; the others are the lift force and the side force. Since these forces and the mo- ments associated with their axes (rolling, yawing, and pitching) are dependent on the square of the velocity of the vehicle relative to the airstream and on some geometric aspects of the vehicle it- self, it is useful to describe these forces in terms of nondimensional coefficients that apply over a wide velocity range. While only aerodynamic drag will be discussed here, the other forces and moments should not be neglected in the design stages. For example, the combination of the lift coefficient and the pitching moment coefficient describes how a vehicle will behave on wet roads with respect to hydroplaning. And a combination of the yawing and rolling moment coefficients is used to determine how a car will behave in a crosswind. The drag coefficient (CD) is a measure of the 4 ENGINEERING & SCIENCE I JANUARY 1982 vehicle's aerodynamic efficiency. (Aerodynamic drag = (pf2) Co • A • V2, where p is air density, A is the projected frontal area of the body, and V is velocity.) Even though aerodynamic drag is critically dependent on the velocity, it is only the product Co times A that the designer can control. The reason aerodynamic losses are so relative to engine power is that the power re- quired to overcome these losses is a function of the cube of the velocity. In most of my discussion I will be considering highway driving, because, at highway speeds, overcoming aerodynamic drag is responsible for more than 50 percent of fuel con- sumption. In city driving, that is, stop-and-start driving below 20 mph, it is primarily vehicle weight that contributes to fuel consumption; beyond that, in the stage between city and high- way (called the urban driving cycle), overcoming aerodynamic drag accounts for approximately 25 percent of fuel consumption. Wind tunnels have played an important role in determining the aerodynamic drag of road vehi- cles. Caltech's low-speed winq tunnel with a 10- foot-diameter test section, located in the Graduate Aeronautical Laboratories (GALCIT), was built 51 years ago and has been operating continuously ever since. Essentially all of the early work in this wind tunnel was restricted to aircraft-related re-
-
Upload
trankhuong -
Category
Documents
-
view
213 -
download
0
Transcript of AerodynaDlic Drag of Road Vehicles Past, Present, and...
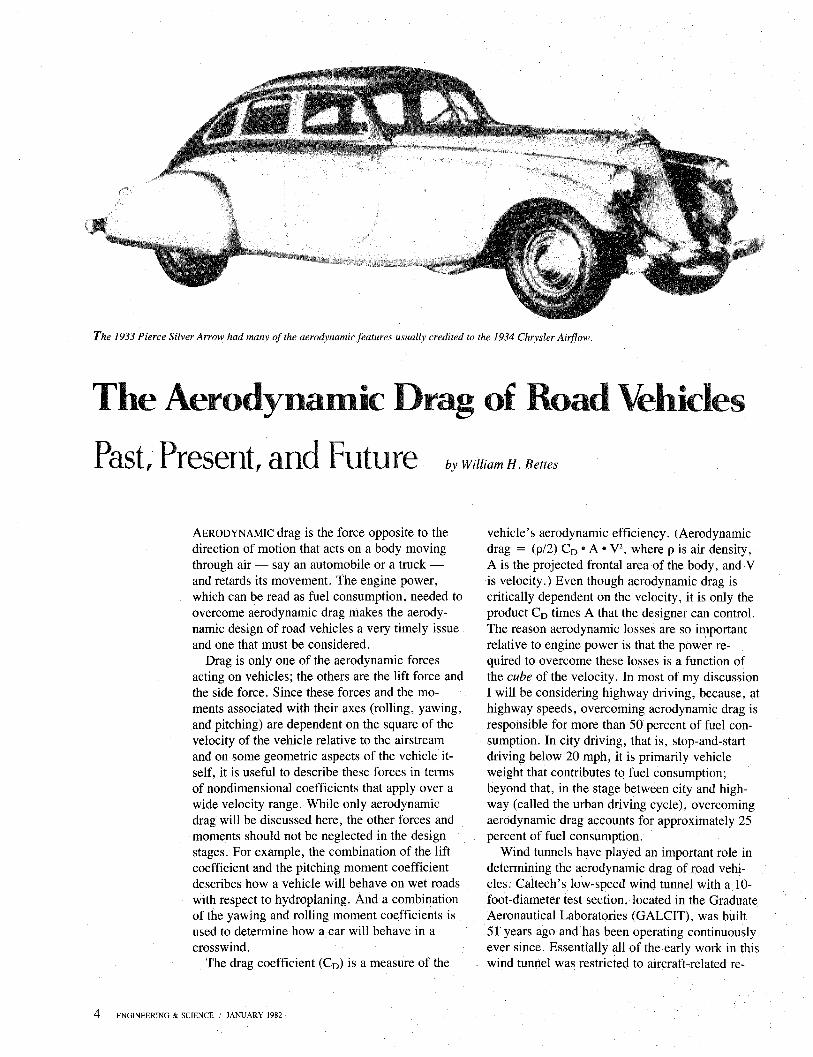
The 1933 Pierce Silver Arrow had many of the aerodynamic features usually credited to the 1934 Chrysler Airflow.
The AerodynaDlic Drag of Road Vehicles
Past, Present, and Future by William H. Bettes
AERODYNAMIC drag is the force opposite to the direction of motion that acts on a body moving through air - sayan automobile or a truck -and retards its movement. The engine power, which can be read as fuel consumption, needed to overcome aerodynamic drag makes the aerodynamic design of road vehicles a very timely issue and one that must be considered.
Drag is only one of the aerodynamic forces acting on vehicles; the others are the lift force and the side force. Since these forces and the moments associated with their axes (rolling, yawing, and pitching) are dependent on the square of the velocity of the vehicle relative to the airstream and on some geometric aspects of the vehicle itself, it is useful to describe these forces in terms of nondimensional coefficients that apply over a wide velocity range. While only aerodynamic drag will be discussed here, the other forces and moments should not be neglected in the design stages. For example, the combination of the lift coefficient and the pitching moment coefficient describes how a vehicle will behave on wet roads with respect to hydroplaning. And a combination of the yawing and rolling moment coefficients is used to determine how a car will behave in a crosswind.
The drag coefficient (CD) is a measure of the
4 ENGINEERING & SCIENCE I JANUARY 1982
vehicle's aerodynamic efficiency. (Aerodynamic drag = (pf2) Co • A • V2, where p is air density, A is the projected frontal area of the body, and V is velocity.) Even though aerodynamic drag is critically dependent on the velocity, it is only the product Co times A that the designer can control. The reason aerodynamic losses are so i~portant relative to engine power is that the power required to overcome these losses is a function of the cube of the velocity. In most of my discussion I will be considering highway driving, because, at highway speeds, overcoming aerodynamic drag is responsible for more than 50 percent of fuel consumption. In city driving, that is, stop-and-start driving below 20 mph, it is primarily vehicle weight that contributes to fuel consumption; beyond that, in the stage between city and highway (called the urban driving cycle), overcoming aerodynamic drag accounts for approximately 25 percent of fuel consumption.
Wind tunnels have played an important role in determining the aerodynamic drag of road vehicles. Caltech's low-speed winq tunnel with a 10-foot-diameter test section, located in the Graduate Aeronautical Laboratories (GALCIT), was built 51 years ago and has been operating continuously ever since. Essentially all of the early work in this wind tunnel was restricted to aircraft-related re-
search and development, but for the past 24 years it has also been used as a design tool in the development of area lighting, buildings and other structures, wind turbines, oil drilling rigs, life rafts, ships and boats, and ground-proximity vehicles (including hovercraft, trains, trucks, automobiles and motorcycles). The technical material, most of it from our wind tunnel tests, that supports the statements and conclusions in this article was not able to be included here.
Road vehicles; which are bluff bodies that exhibit substantially separated flows (where the airstream no longer holds onto the body but pulls away) over complex geometries, can only be treated experimentally, since even the most sophisticated analytical means fail to predict the location of flow separation and reattachment. In the design of aircraft, for example, every effort is made to eliminate flow separations over the body, since these separations lead to increased drag. Automobiles, on the other hand, have to be blunt front and rear in order to provide sufficient interior space for seating and still be able to maneuver tight turns and parking. The airflow over an automobile separat~s in regions of abrupt geometric transitions in front as well as over the large rear area.
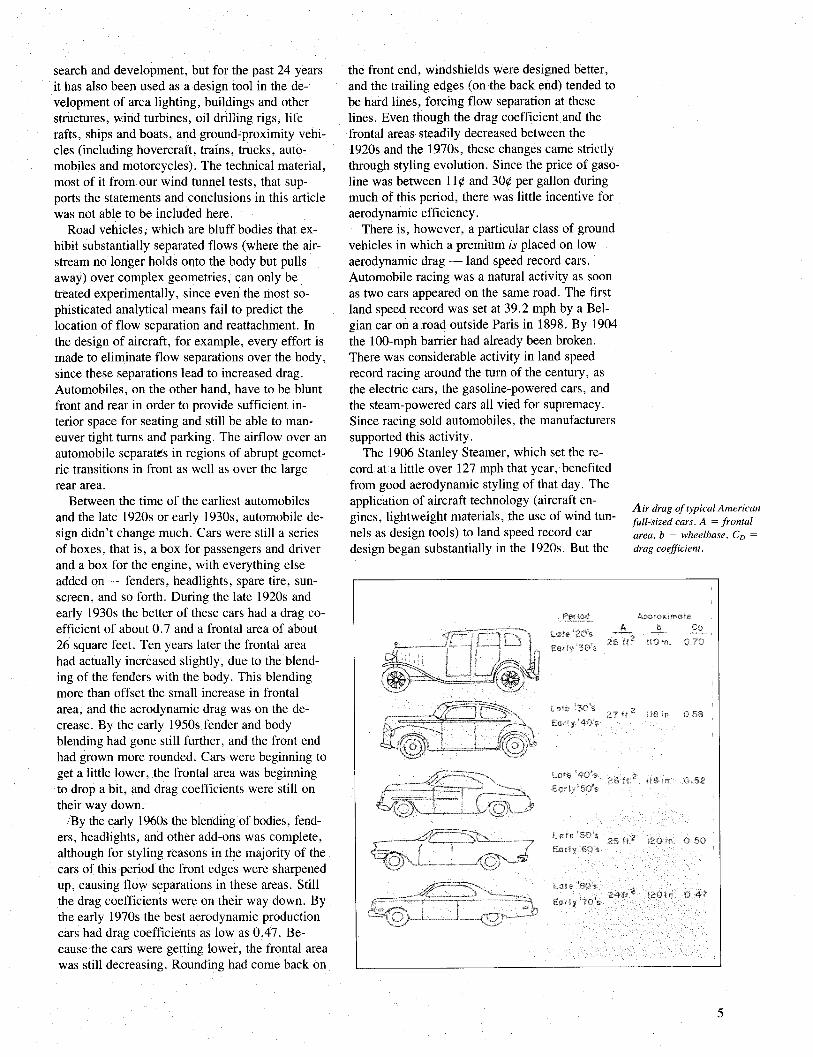
Between the time of the earliest automobiles and the late 1920s or early 1930s, automobile design didn't change much. Cars were still a series of boxes, that is, a box for passengers and driver and a box for the engine, with everything else added on - fenders, headlights, spare tire, sunscreen, and so forth. During the late 1920s and early 1930s the better of these cars had a drag coefficient of about 0.7 and a frontal area of about 26 square feet. Ten years later the frontal area had actually increased slightly, due to the blending of the fenders with the body. This blending more than offset the small increase in frontal area, and the aerodynamic drag was on the decrease. By the early 1950sfender and body blending had gone still further, and the front end had grown more rounded. Cars were beginning to get a little lower, the frontal area was beginning to drop a bit, and drag coefficients were still on their way down.
/By the early 1960s the blending of bodies, fenders, headlights, and other add-ons was complete, although for styling reasons in the majority of the cars of this period the front edges were sharpened up, causing flow separations in these areas. Still the drag coefficients were on their way down. By the early 1970s the best aerodynamic production cars had drag coefficients as low as 0.47. Because the cars were getting lower, the frontal area was still decreasing. Rounding had come back on
the front end, windshields were designed better, and the trailing edges (on the back end) tended to be hard lines, forcing flow separation at these lines. Even though the drag coefficient and the frontal areas steadily decreased between the 1920s and the 1970s, these changes came strictly through styling evolution. Since the price of gasoline was between 11 ¢ and 30¢ per gallon during much of this period, there was little incentive for aerodynamic efficiency.
There is, however, a particular class of ground vehicles in which a premium is placed on low aerodynamic drag - land speed record cars. Automobile racing was a natural activity as soon as two cars appeared on the same road. The first land speed record was set at 39.2 mph by a Belgian car on a road outside Paris in 1898. By 1904 the lOO-mph barrier had already been broken. There was considerable activity in land speed record racing around the tum of the century, as the electric cars, the gasoline-powered cars, and the steam-powered cars all vied for supremacy. Since racing sold automobiles, the manufacturers supported this activity.
The 1906 Stanley Steamer, which set the record at a little over 127 mph that year, benefited from good aerodynamic styling of that day. The application of aircraft technology (aircraft engines, lightweight materials, the use of wind tunnels as design tools) to land speed record car design began substantially in the 1920s. But the
Air drag of typical American full-sized cars. A = frontal area, b = wheelbase, CD =
drag coefficient.
5
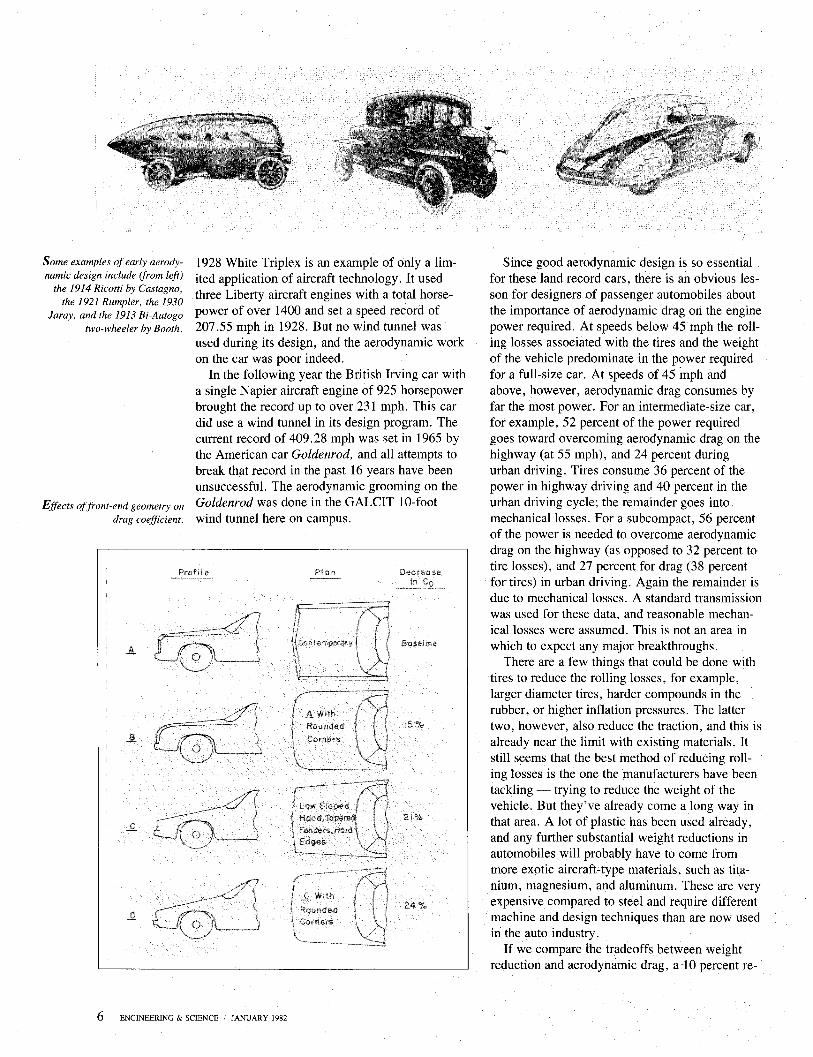
Some examples of early aerodynamic design include (from left)
the 1914 Ricotti by Castagno, the 1921 Rumpler, the 1930
Jaray, and the 1913 Bi-Autogo two-wheeler by Booth,
Effects offront-end geometry on drag coefficient.
1928 White Triplex is an example of only a limited application of aircraft technology, It used three Liberty aircraft engines with a total horsepower of over 1400 and set a speed record of 207,55 mph in 1928. But no wind tunnel was used during its design, and the aerodynamic work on the car was poor indeed.
In the following year the British Irving car with a single Napier aircraft engine of 925 horsepower brought the record up to over 231 mph. This car did use a wind tunnel in its design program. The current record of 409.28 mph was set in 1965 by the American car Goldenrod, and all attempts to break that record in the past 16 years have been unsuccessful. The aerodynamic grooming on the Goldenrod was done in the GALeIT lO-foot wind tunnel here on campus.
Profile
Baseline
15
24
6 ENGINEERING & SCIENCE I JANUARY 1982
Since good aerodynamic design is so essential for these land record cars, there is an obvious lesson for designers of passenger automobiles about the importance of aerodynamic drag on the engine power required. At speeds below 45 mph the rolling losses associated with the tires and the weight of the vehicle predominate in the power required for a full-size car. At speeds of 45 mph and above, however, aerodynamic drag consumes by far the most power. For an intermediate-size car, for example, 52 percent of the power required goes toward overcoming aerodynamic drag on the highway (at 55 mph), and 24 percent during urban driving. Tires consume 36 percent of the power in highway driving and 40 percent in the urban driving cycle; the remainder goes into mechanical losses. For a SUbcompact, 56 percent of the power is needed to overcome aerodynamic drag on the highway (as opposed to 32 percent to tire losses), and 27 percent for drag (38 percent fortires) in urban driving. Again the remainder is due to mechanical losses. A standard transmission was used for these data, and reasonable mechanicallosses were assumed. This is not an area in which to expect any major breakthroughs.
There are a few things that could be done with tires to reduce the rolling losses, for example, larger diameter tires, harder compounds in the rubber, or higher inflation pressures. The latter two, however, also reduce the traction, and this is already near the limit with existing materials. It still seems that the best method of reducing rolling losses is the one the manufacturers have been tackling - trying to reduce the weight of the vehicle. But they've already come a long way in that area. A lot of plastic has been used already, and any further substantial weight reductions in automobiles will probably have to come from more exotic aircraft-type materials, such as titanium, magnesium, and aluminum. These are very expensive compared to steel and require different machine and design techniques than are now used in the auto industry.
If we compare the tradeoffs between weight reduction and aerodynamic drag, a ·10 percent re-
duction in the drag coefficient (with no change in frontal area) would yield approximately a 5 percent fuel economy improvement in a subcompact on the highway. This same improvement would require a 16 percent weight reduction, which is substantial. The same 10 percent drag reduction in an intermediate car would require a reduction of22 percent in weight for equal fuel economy improvement.
While further weight reduction on autos as we now know them will be difficult, there are a number of ways to achieve easily that 10 percent drag reduction and much more by aerodynamic design. In the lO-foot wind tunnel here at Caltech we have worked on the various areas of the automobile that contribute to its aerodynamic drag. Based on data from the wind tunnel, the largest drag coefficient reductions can be gained by altering the geometry of the front end. We can use as a baseline a 1980 car characterized by the hard lines on its front end and slab sides that the stylists chose to use to give it its character. Simply by rounding the comers of the front end, both in plan and profile (elevation) views, you could reduce the drag of that baseline car by about 15 percent. If it were necessary to retain the hard lines, sloping the front end both in elevation and plan would reduce the drag over the baseline configuration by 21 percent. This is because the favorable pressure gradients along the sides and over the hood would make separation caused by those hard lines reattach very quickly, and the positive pressures built up on the fronts would be much less than they are on the baseline vehicle. By combining the two approaches - rounding and sloping - we could reduce the drag of a typical 1980 automobile by about 24 percent.
The windshield also offers room for improvement, although there are problems associated with changes here. Eliminating the partitions (Apillars) between windshield and side window and rounding it into one surface at the comers and top would pick up about 3 percent in the drag coefficient. This would probably necessitate a fixed side window, or at least its forward portion. It's
difficult to seal in this area without creating a potential for leaks and consequent wind noise. Combining this approach with a decrease in the slope and plan radius would gain a 6 percent reduction in drag. The result would look like a sleek GT car. A larger windshield brings the problem of increased solar heat inside, but no law dictates the slope angle of windshields.
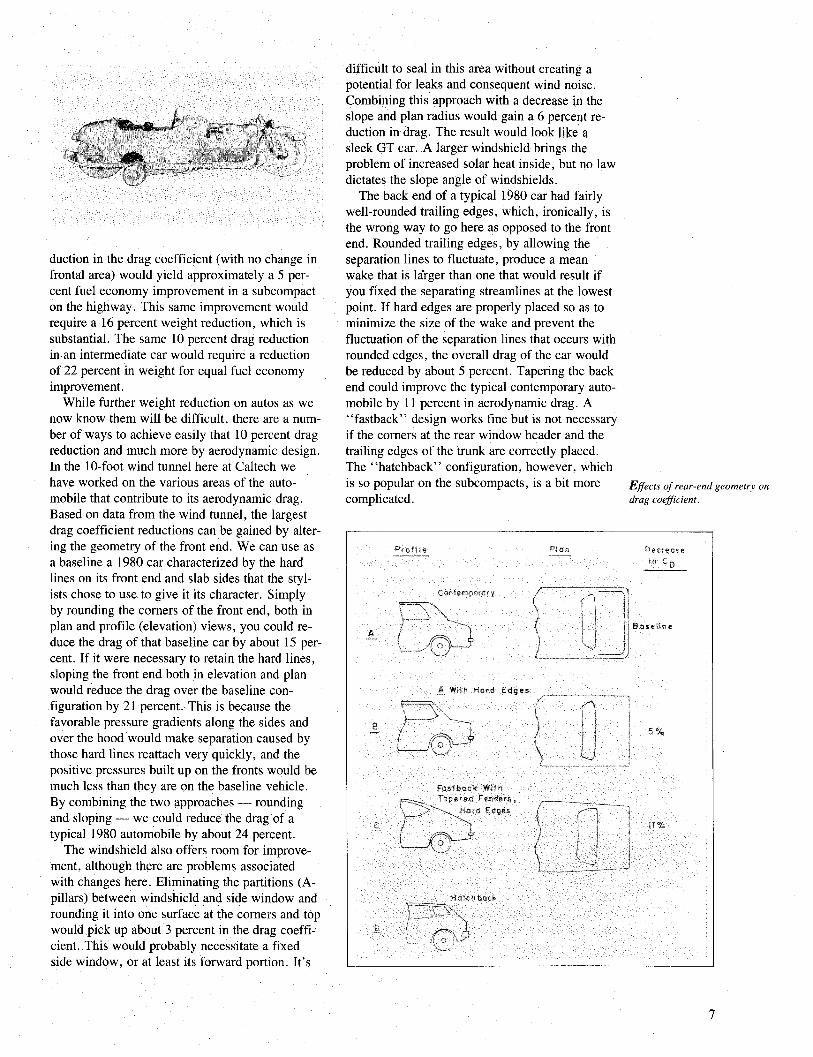
The back end of a typical 1980 car had fairly well~rounded trailing edges, which, ironically, is the wrong way to go here as opposed to the front end. Rounded trailing edges, by allowing the separation lines to fluctuate, produce a mean wake that is larger than one that would result if you fixed the separating streamlines at the lowest point. If hard edges are properly placed so as to minimize the size of the wake and prevent the fluctuation of the separation lines that occurs with rounded edges, the overall drag of the car would be reduced by about 5 percent. Tapering the back end could improve the typical contemporary automobile by 11 percent in aerodynamic drag. A "fastback" design works fine but is not necessary if the comers at the rear window header and the trailing edges of the trunk are correctly placed. The "hatchback" configuration, however, which is so popular on the subcompacts, is a bit more complicated.
Profile
A
Contemporary
~ Wilh Hard Edges
FastbaCK With Fenders r
Edges
bock
Plan
Effects of rear-end geometry on drag coefficient.
Decrease
9aseHne
7
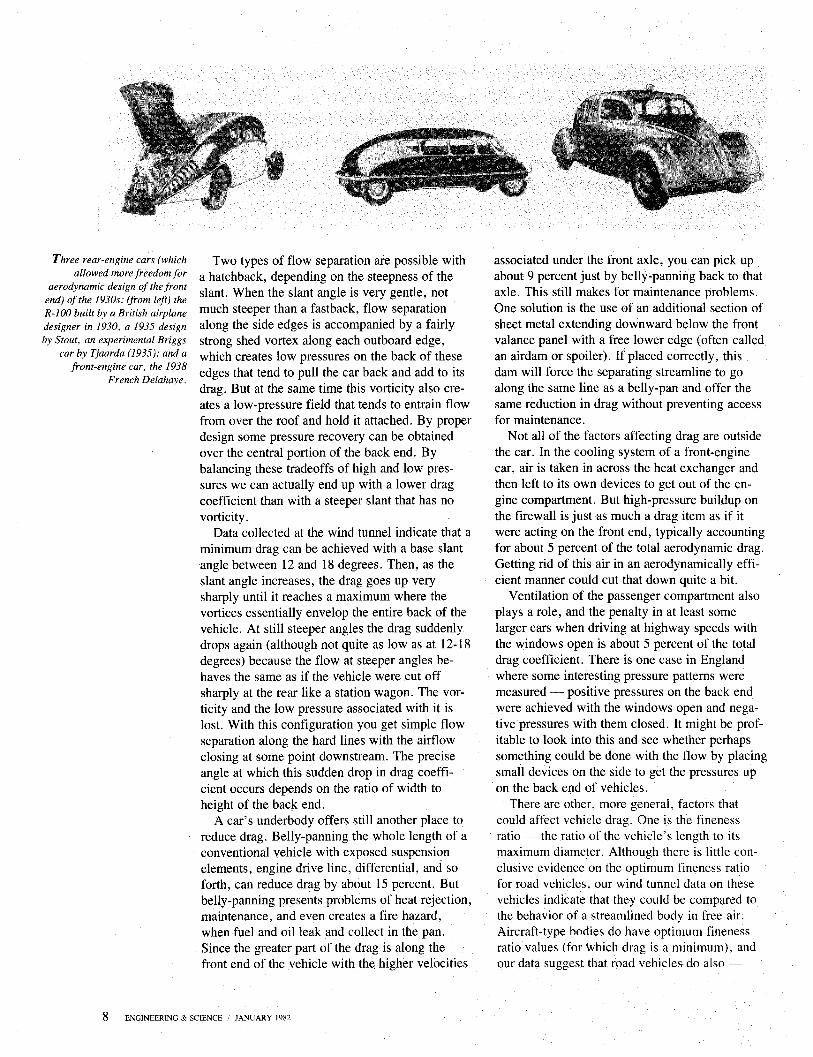
Three rear-engine cars (which allowed more freedom for
aerodynamic design of the front end) of the 1930s: (from left) the R-JOO built by a British airplane designer in 1930, a 1935 design by Stout, an experimental Briggs
car by Tjaarda (1935); and a front-engine car, the 1938
French Delahaye.
Two types of flow separation are possible with a hatchback, depending on the steepness of the slant. When the slant angle is very gentle, not much steeper than a fastback, flow separation along the side edges is accompanied by a fairly strong shed vortex along each outboard edge, which creates low pressures on the back of these edges that tend to pull the car back and add to its drag. But at the same time this vorticity also creates a low-pressure field that tends to entrain flow from over the roof and hold it attached. By proper design some pressure recovery can be obtained over the central portion of the back end. By balancing these tradeoffs of high and low pressures we can actually end up with a lower drag coefficient than with a steeper slant that has no vorticity.
Data collected at the wind tunnel indicate that a minimum drag can be achieved with a base slant angle between 12 and 18 degrees. Then, as the slant angle increases, the drag goes up very sharply until it reaches a maximum where the vortices essentially envelop the entire back of the vehicle. At still steeper angles the drag suddenly drops again (although not quite as low as at 12-18 degrees) because the flow at steeper angles behaves the same as if the vehicle were cut off sharply at the rear like a station wagon. The vorticity and the low pressure associated with it is lost. With this configuration you get simple flow separation along the hard lines with the airflow closing at some point downstream. The precise angle at which this sudden drop in drag coefficient occurs depends on the ratio of width to height of the back end.
A car's underbody offers still another place to reduce drag. Belly-panning the whole length of a conventional vehicle with exposed suspension elements, engine drive line, differential, and so forth, can reduce drag by about 15 percent. But belly-panning presents problems of heat rejection, maintenance, and even creates a fire hazard, when fuel and oil leak and collect in the pan. Since the greater part of the drag is along the front end of the vehicle with the higher velocities
8 ENGINEERING & SCIENCE / JANUARY 1982
associated under the front axle, you can pick up about 9 percent just by belly~panning back to that axle. This still makes for maintenance problems. One solution is the use of an additiona.l section of sheet metal extending downward below the front valance panel with a free lower edge (often called an airdam or spoiler). If placed correctly, this dam will force the separating streamline to go along the same line as a belly-pan and offer the same reduction in drag without preventing access for maintenance.
Not all of the factors affecting drag are outside the car. In the cooling system of a front-engine car, air is taken in across the heat exchanger and then left to its own devices to get out of the engine compartment. But high-pressure buildup on the firewall is just as much a drag item as if it were acting on the front end, typically accounting for about 5 percent of the total aerodynamic drag. Getting rid of this air in an aerodynamically efficient manner could cut that down quite a bit.
Ventilation of the passenger compartment also plays a role, and the penalty in at least some larger cars when driving at highway speeds with the windows open is about 5 percent of the total drag coefficient. There is one case in England where some interesting pressure patterns were measured - positive pressures on the back end were achieved with the windows open and neg ativepressures with them closed. It might be profitable to look into this and see whether perhaps something could be done with the flow by placing small devices on the side to get the pressures up on the back end of vehicles.
There are other, more general, factors that could affect vehicle drag. One is the fineness ratio - the ratio of the vehicle's length to its maximum diameter: Although there is little conclusive evidence on the optimum fineness ratio for road vehicles, our wind tunnel data on these vehicles indicate that they could be compared to the behavior of a streamlined body in free air. Aircraft-type bodies do have optimum fineness ratio values (for which drag is a minimum), and our data suggest that road vehicles· do also -
probably somewhere between 2.8 and 3.6. Another fac tor that could affect vehicle drag is
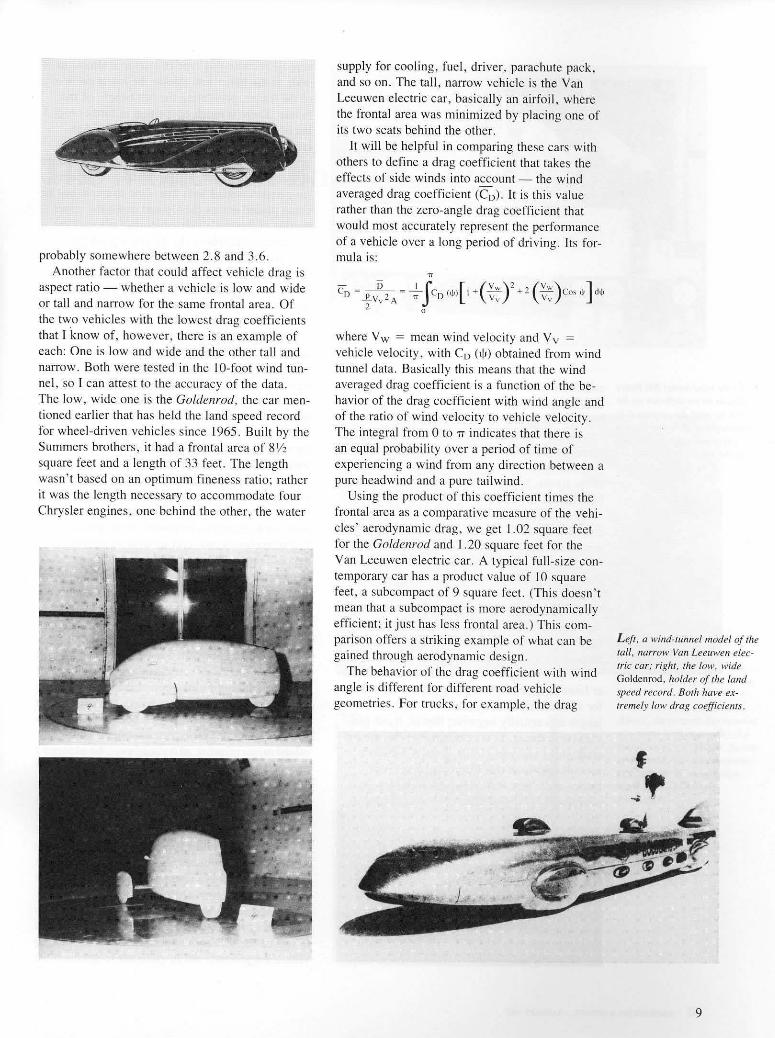
aspect ratio - whe ther a vehicle is low and wide or tall and narrow for the same frontal area. Of the two vehicles with the lowest drag coeffic ients that I 'know of. however , there is an example of each: One is low and wide and the other tall and narrow. Both were tested in the IO-foot wind tunnel , so I can attest to the accuracy of the data. The low, wide one is the Goldenrod. the car mentioned earlier that has he ld the land speed record for wheel-driven vehicles since 1965. Built by Ihe Summers brothers, it had a fronta l area of 8V2 square feet and a length of 33 feet. The lenglh wasn' t based on an optimum fineness ratio; rather it was the length necessary to accommodate four Chrysler engines, one behind Ihe other , the water
supply for cooling . fuel, driver, parachute pack. and so on. The tall , narrow vehicle is the Van Leeuwen electric car, basically an a irfoil , where the frontal area was minimized by placing one of its two seats behind the other.
It will be he lpful in comparing Ihese cars with others to define a drag coefficient that takes the effects of side winds into account - the wind averaged drag coefficient (CD)' It is this va lue rather than the zero-angle drag coeffic ient that would most accurately represent the performance of a vehicle over a long period of driving. Its formula is:
TI
- D IS [(vw)' ,(vw ) ] CD - .-e.vv
2 A '" n CD (ob) I + ~ + - v:; Cos dr dolt
, 0
where V w = mean wind velocity and V v = vehicle velocity, wilh CD (t/I) obtained from wind tunnel data. Basica ll y this means that the wind averaged drag coeffic ient is a function of the behavior of the drag coe ffic ient with wind angle and of the ratio of wind velocity to vehic le velocity. The integral from 0 to 'IT indicates that there is an equal probability over a pe riod of time of experiencing a wind from any direction between a pure headwind and a pure tailwind .
Using the product of this coefficient times the frontal area as a comparat ive measure of the vehicles aerodynamic drag, we gel 1.02 square feel for Ihe Goldellrod and 1.20 square feet for the Van Leeuwen electric car. A typical full- size contemporary car has a product va lue o f 10 square feel , a subcompacl of 9 square feet. (This doesn' t mean that a subcompact is more aerodynamica lly effic ient: it just has less fronta l area.) This comparison offers a striking example of what can be gained through aerodynamic design.
The behavior o r Ihe drag coeffic ienl with wind angle is different for different road vehicle geometries. For trucks. for example, the drag
L eft. a wind-Illt/nel model of the tall, narrow V(m Leeuwen decIric car; right, the low, wide Goldenrod. holder of the land speed record. Both I/Gl'e extremely low drag coeJJiciems.
9
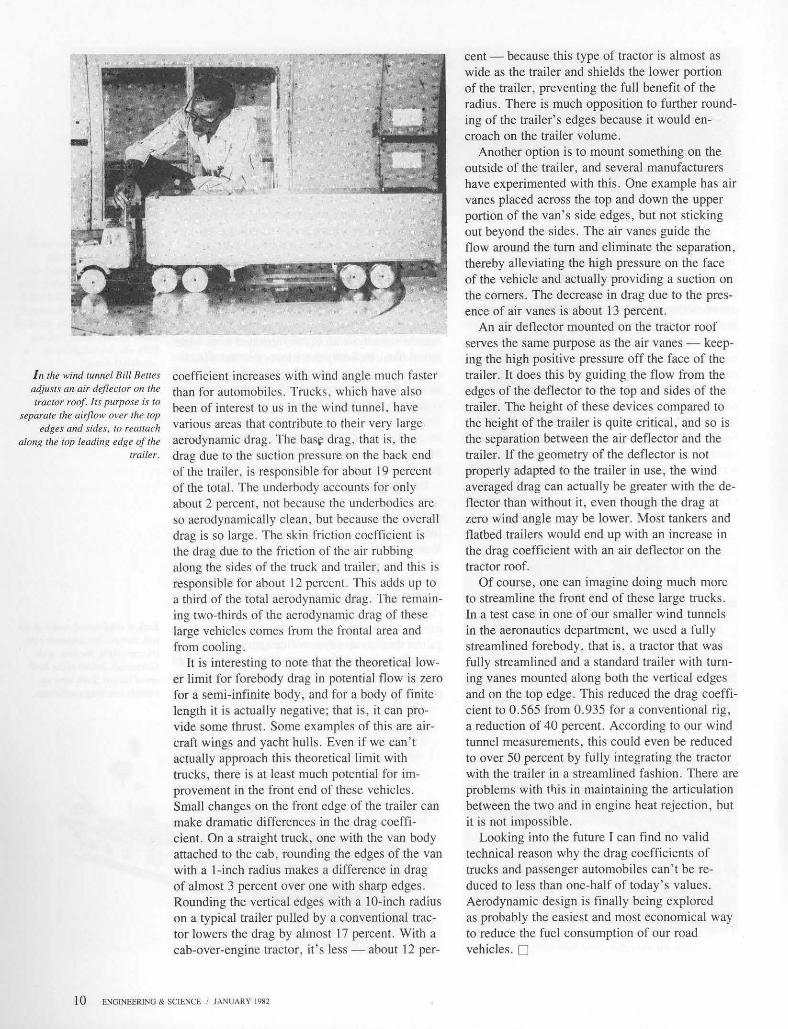
In the wind runnel 8ill Bettes adjusts an air deflector 011 the tractor roof. lu purpose is to
separate the airflow over the top edges and sides. to reattach
along the lOp leading edge of the trailer.
coefficient increases with wind angle much faster than for automobiles. Trucks, which have also been of interest to us in the wind tunnel, have various areas that contribute to their very large aerodynamic drag. The bas~ drag. that is , the drag due to the suction pressure on the back end of the trailer, is responsible for about 19 percent of the total. The underbody accounts l'or only about 2 percent, not because the underbodies are so aerodynamically clean, but because the overall drag is so large. The skin friction coefficient is the drag due to the friction of the air mbbing along the sides of the truck and trailer, and this is responsible for about 12 percent. This adds up to a third of the total aerodynamic drag. The remaining two-thirds of the aerodynamic drag of these large vehicles comes from the frontal area and from cooling.
It is interesting to note that the theoretical lower limit for forebody drag in potential flow is zero for a semi-infinite body, and for a body of finite length it is actually negative; that is, it can provide some thrust. Some examples of this are aircraft wings and yacht hulls. Even if we can't actually approach this theoretical limit with trucks, there is at least much potential for improvement in the front end of these vehicles. Small changes on the front edge of the trailer can make dramatic differences in the drag coefficient. On a straight truck, one with the van body attached to the cab, rounding the edges of the van with a I-inch radius makes a difference in drag of almost 3 percent over one with sharp edges. Rounding the vertical edges with a IO-inch radius on a typical trailer pulled by a conventional tractor lowers the drag by almost 17 pcrcent. With a cab-over-engine tractor, it's less - about 12 per-
10 ENGINEERING & SCIENCE I JANUARY 1982
cent - because this type of tractor is almost as wide as the trailer and shields the lower portion of the trailer, preventing the full benefit of the radius. There is much opposition to further rounding of the trailer's edges because it would encroach on the trailer volume .
Another option is to mount something on the olltside of the trailer, and several manufacturers have experimented with this. One example has air vanes placed across the top and down the upper portion of the van's side edges, but not sticking out beyond the sides. The air vanes guide the flow around the tum and eliminate the separation, thereby alleviating the high pressure on the face of the vehicle and actually providing a suction on the corners. The decrease in drag due to the presence of air vanes is about 13 percent.
An air deflector mounted on the tractor roof serves the same purpose as the air vanes - keeping the high positive pressure off the face of the trailer. It does this by guiding the flow from the edges of the deflector to the top and sides of the trailer. The height of these devices compared to the height of the trailer is quite critical, and so is the separation between the air deflector and the trailer. [f the geometry of the deflector is not properly adapted to the trailer in use , the wind averaged drag can actually be greater with the deflector than without it, even though the drag at zero wind angle may be lower. Most tankers and flatbed trailers would end up with an increase in the drag coefficient with an air deflector on the tractor roof.
Of course, one can imagine doing much more to streamline the front end of these large trucks. In a test case in one of our smaller wind tunnels in the aeronautics department , we used a fully streamlined forebody , that is , a tractor that was fully streamlined and a standard trailer with turning vanes mounted along both the vertical edges and on the top edge. This reduced the drag coefficient to 0.565 from 0.935 for a conventional rig, a reduction of 40 percent. According to our wind tunnel measurements, this could even be reduced to over 50 percent by fully integrating the tractor with the trailer in a streamlined fashion. There are problems with tl,is in maintaining the articulation between the two and in engine heat rejection, but it is not impossible.
Looking into the future I can find no valid technical reason why the drag coefficients of trucks and passenger automobi les can 't be reduced to less than one-half of today's values. Aerodynamic design is finally being explored as probably the easiest and most economical way to reduce the fuel consumption of our road vehicles. D