Aero Engineering 315 Lesson 32 Energy Height and Specific Excess Power (P s )
23
Aero Engineering 315 Lesson 32 Energy Height and Specific Excess Power (P s )
-
Upload
jeremy-stone -
Category
Documents
-
view
249 -
download
4
Transcript of Aero Engineering 315 Lesson 32 Energy Height and Specific Excess Power (P s )
Aero Engineering 315
Lesson 32
Energy Height and Specific Excess Power (Ps)

Important Safety Tip… Fighter Design project due next time Turn in hard copy of:
Cover page w/contribution and documentation blanks filled in
Neatly handwritten sample calculations for the equations
The final versions of the “Design,” “Performance Calculations,” and the three “Charts” sheets from your spreadsheet
Typed or neatly handwritten answers to the discussion question
An electronic copy of your final spreadsheet emailed to me—label your file: name_name – FDP.xls

Lesson 32 Objectives Calculate Energy Height Calculate max zoom altitude From Ps plot find ROC, Vmax, subsonic and
supersonic absolute ceilings, and zoom altitude From the equations calculate Ps and ROC/
acceleration capability Sketch supersonic and subsonic Ps plots
Know how they change with throttle, weight, load factor, and configuration
Sketch min time to climb profile on Ps plot List factors affecting aerial combat
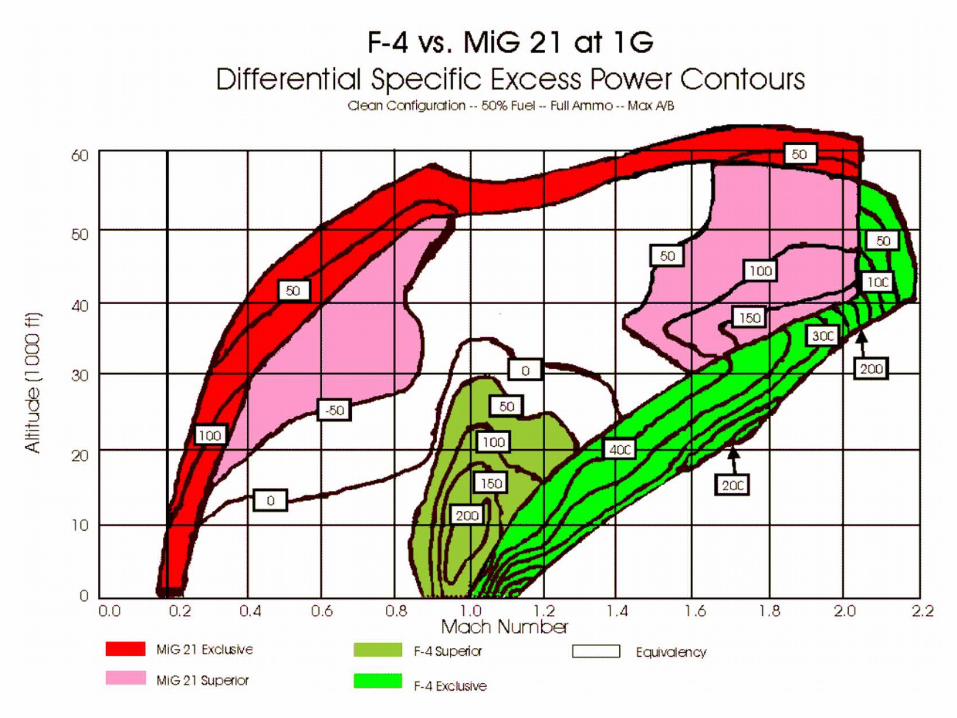
Explain how Ps plots are used to determine tactics

A little of the Ps “Big Picture”
V-n diagrams Show limits of aircraft performance BUT they only show instantaneous performance—
you can’t determine the sustainability of a maneuver from a V-n diagram
Energy height Simply mechanical energy divided by weight
Ps
Determines ability to climb or accelerate and provides a measure of sustained performance

Energy Height = Mechanical Energy
Energy Height is a measure of the total mechanical energy (potential + kinetic) of an aircraft
In order to compare airplanes we normalize (i.e. divide) by the weight (mg) so it becomes weight-specific energy…
Energy Height
E = mgh + mV2/2
He = h + V2
2g

He = zoom capability
Energy Height Plot
Plot curves of constant energy height
It’s what every pilot knows: you can trade airspeed for altitude (or vice versa) and the more you have of
both, the more energy
h
V
1 2
3
H = conste
10,000 ’
20,000 ’
50,000 ’ H = 50,000 fte
Zoom
Dive
He = h + V2
2g
Vmax dive = (2 g He)1/2
802 ft/s 1135 ft/s 1794 ft/s
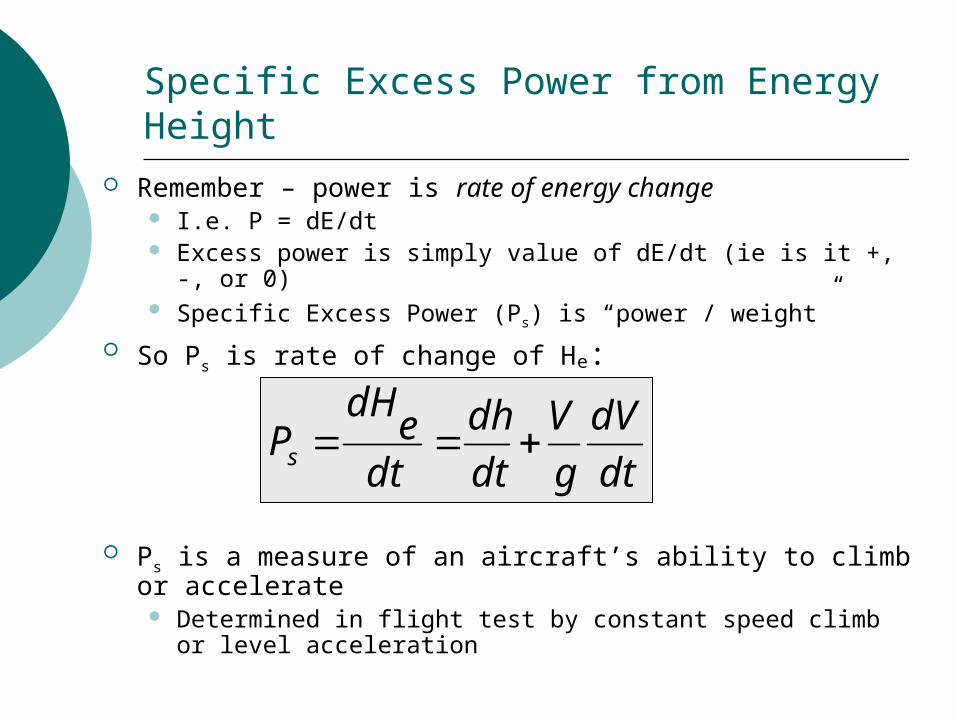
Specific Excess Power from Energy Height Remember – power is rate of energy change
I.e. P = dE/dt Excess power is simply value of dE/dt (ie is it +, -, or 0) Specific Excess Power (Ps) is “power / weight”
So Ps is rate of change of He:
Ps is a measure of an aircraft’s ability to climb or accelerate Determined in flight test by constant speed climb or level
acceleration
dt
dV
g
V
dt
dh
dte
dHPs

From our previous lessons, excess power is
And specific excess power is
So
Ps from A/C performance
WDTVWPdt
dV
g
V
dt
dhP xs /)(/
= V(T - D)
WPx
W
Px = V(T – D)

Ps Concepts
o If Ps is positive, the aircraft can: Climb Accelerate Or both
o If Ps is negative, the aircraft must: Descend Decelerate Or both
o If Ps = 0, the aircraft will stabilize in straight and level, unaccelerated flight
o We plot Ps overlayed on an energy height plot

Ps Charts
The Ps chart is valid for:o 1 weight
o Increasing weight shrinks ploto 1 load factor
o Increased “g” shrinks ploto 1 configuration
o Increasing CDo (“dirty”
configuration) shrinks ploto 1 throttle setting
o Lower thrust shrinks plot

Example:Effect of Load Factor on Ps plot
0
10000
20000
30000
40000
50000
60000
70000
80000
0 200 400 600 800 1000 1200
True Airspeed, V, knots
Alt
itu
de
and
En
erg
y H
eig
ht,
ft
CONFIGURATION50% Internal Fuel2 AIM-9 MissilesMaximum ThrustWeight: 21737 lbsn = 5
0
10000
20000
30000
40000
50000
60000
70000
80000
0 200 400 600 800 1000 1200
True Airspeed, V, knots
Alt
itu
de
and
En
erg
y H
eig
ht,
ft
Max
imum
Lif
t
CONFIGURATION50% Internal Fuel2 AIM-9 MissilesMaximum ThrustWeight: 21737 lbsn = 1
Minimum Time toClimb Profile
Lines of Constant Energy Height
n = 1 g n = 5 g’s

Ps Charts
o Absolute ceilings (subsonic and supersonic)
o “Zoom” ceilingo “Dive” speedo Maximum speed (right edge)o Stall speeds (left edge)o Reachability region (left of max He)o Sustainability region (on or inside Ps = 0)
What information can I get from a Ps chart?

SUPERSONICABSOLUTE CEILING
SUBSONICABSOLUTE CEILING
ZOOMCEILING
MA
X S
PE
ED
DIVESPEED
q limit
Stall limit

Streak Eagle

Application:Minimum Time to Climb
PdH
dt
dh
dt
V
g
dV
dtse
Recall:
To get minimum time to climb, we must maximize climb rate (dHe/dt). Thus, we must cross each energy heightcurve at the maximum possible specific excess power.

Minimum Time to Climb Profile(subsonic)
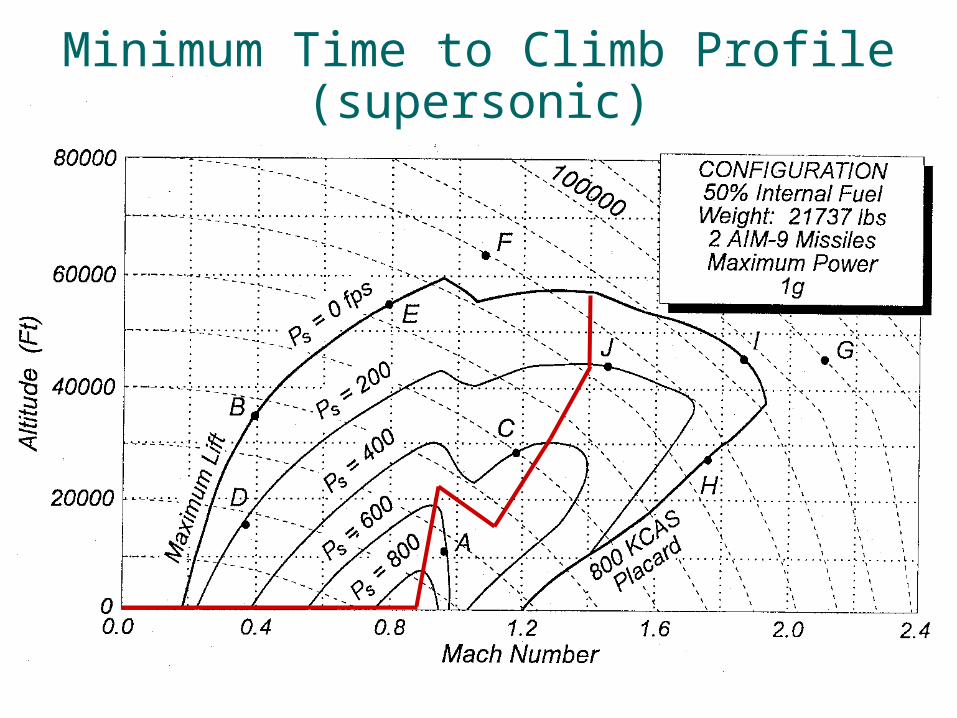
Minimum Time to Climb Profile(supersonic)

Maximum Energy Gaining Profile with Zoom
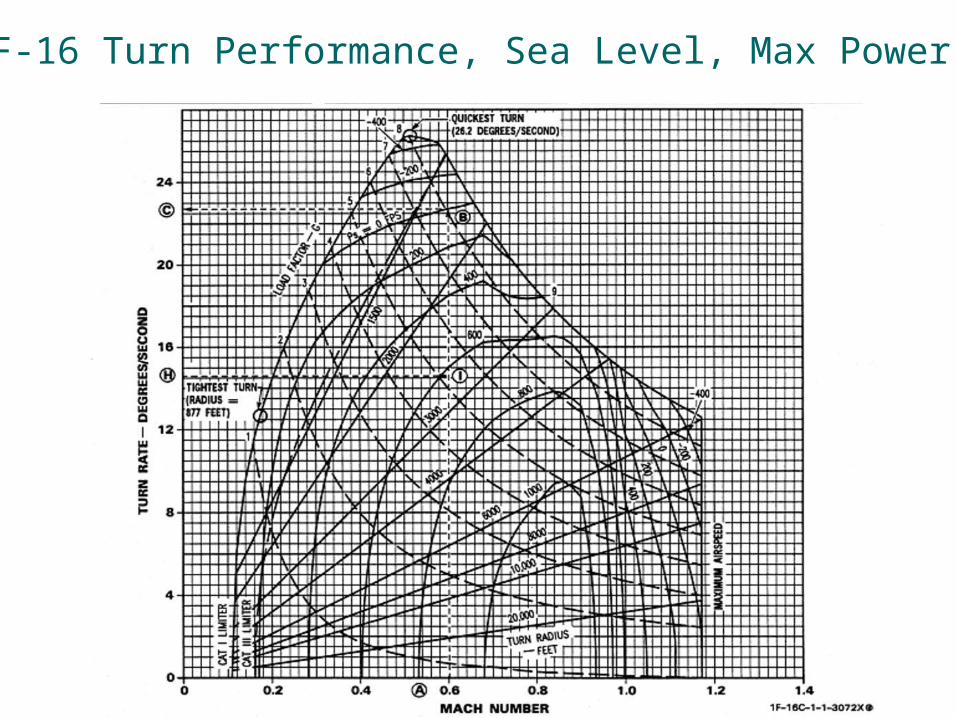
F-16F-16 Turn Performance, Sea Level, Max Power
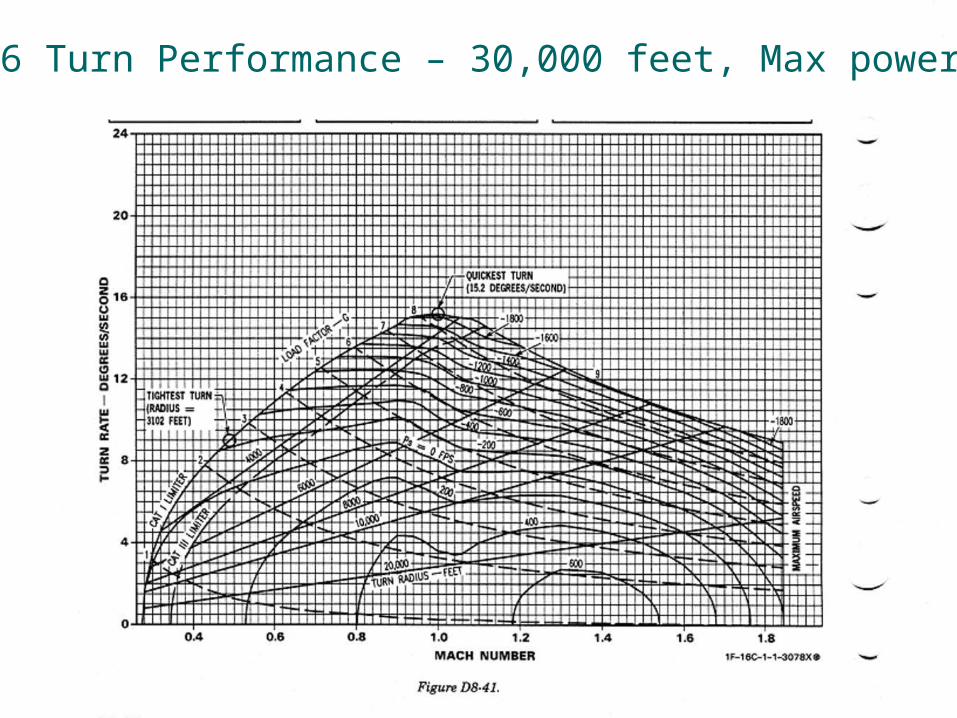
F-16 Turn Performance – 30,000 feet, Max power


Next Lesson (33)… Prior to class
Review objectives for lessons 23 - 32 Complete problems #26 -42 Bring your questions
In Class Collect Fighter Design Projects Pre-GR review