Taking Pictures Seriously A Reply to Hessel MiedemaPictures Seriously a Reply to Hessel Miedema

Adverse Effects of Long Term Exposure
to Road Traffic Noise

Acknowledgements
The studies presented in this thesis were performed at the Netherlands Organisation for
Applied Scientific Research (TNO), Delft, The Netherlands, in close collaboration with
University Medical Center Groningen (UMCG), Groningen, the Netherlands, and
ErasmusMC, Rotterdam, The Netherlands.
Part of the studies reported in this thesis have been made possible by financial support
from by the Netherlands Ministry of Housing, Spatial Planning and the Environment
(VROM).
The GLOBE study is carried out by the Department of Public Health of the Erasmus
University Medical Center in Rotterdam, in collaboration with Municipal Public Health
Service in the study region (GGD Brabant-Zuidoost). The study has been and is supported
by grants of the Ministry of Public Health, Welfare and Sport, the Sick Fund Council, The
Netherlands Organization for Advancement of Research, Erasmus University, and the
Health Research and Development Council. We thank the Municipality Eindhoven for
kindly providing data.
The Prevention of Renal and Vascular End-stage Disease (PREVEND) study is carried out
by the University Medical Center Groningen (UMCG). The PREVEND Study has been
made possible by grants of the Dutch Kidney Foundation. We thank the Municipality of
Groningen for kindly providing data.
Part of the work on the effects of a quiet side was made possible by financial support by
the Life+ program of the European Commission (project QSIDE, LIFE09 ENV/NL/000423).
ISBN: 978-94-6299-033-3
Cover design: Ridderprint BV, Ridderkerk, the Netherlands
Lay-out and photography: Erik de Kluizenaar
Printed by: Ridderprint BV, Ridderkerk, the Netherlands
© 2015 Yvonne de Kluizenaar, Delft, The Netherlands
For all articles published or accepted, the copyright has been transferred to the
respective publisher. No part of this thesis may be reproduced, stored in a retrieval
system, or transmitted in any form or by any means without written permission from the
author or, when appropriate, from the publisher.

Adverse Effects of Long Term Exposure
to Road Traffic Noise
Effecten van langetermijnblootstelling
aan wegverkeersgeluid
Proefschrift
ter verkrijging van de graad van doctor aan de
Erasmus Universiteit Rotterdam
op gezag van de
rector magnificus
Prof.dr. H.A.P. Pols
en volgens besluit van het College voor Promoties.
De openbare verdediging zal plaatsvinden op
woensdag 8 april 2015 om 15.30 uur
Yvonne de Kluizenaar
geboren te Eindhoven

Promotiecommissie
Promotoren: Prof.dr. J.P. Mackenbach
Prof.dr. P.E. de Jong
Overige leden: Prof.dr. H. Tiemeier
Prof.dr. H. Boersma
Prof.dr. S. Stansfeld
Copromotor: Dr. H.M.E. Miedema

Contents
Chapter 1 Introduction 7
Chapter 2
Road traffic noise and sleep
23
Chapter 3
Road traffic noise and hypertension
43
Chapter 4
Road traffic noise, air pollution and cardiovascular
events
65
Chapter 5A
Urban road traffic noise and annoyance: the effect of
a quiet façade
89
Chapter 5B
Road traffic noise and annoyance: a quantification of
the effect of quiet side exposure at dwellings
107
Chapter 6
General discussion
127
Chapter 7
Summary – Samenvatting
165
Chapter 8
About the author
List of Publications
PhD Portfolio
Dankwoord
175


Chapter 1
Introduction


Introduction
9
1.1 Noise as an environmental health problem
Road traffic is a prominent source of environmental noise exposure in urbanized areas.
Because of its common presence, traffic is a source of exposure that is not easy to avoid.
As a consequence, it is affecting a substantial proportion of residents in their homes, and
in their living environment more in general. In view of reducing the number of people
affected by environmental noise exposure, the European Environmental Noise Directive
(END) was adopted in 2002, geared towards the assessment and management of
environmental noise.
Over the last decades it has become increasingly recognised that environmental noise
exposure in the living environment may lead to adverse health effects. Annoyance and
sleep disturbance, mainly related to road traffic noise, are considered to be the most
prominent noise effects (WHO, 2011). For these effects exposure response relationships
have been established (Miedema and Oudshoorn, 2001; Miedema and Vos, 2007).
During the last decades, in laboratory studies, field studies and epidemiological studies,
it has been studied if and how noise exposure may lead to further adverse health effects.
Evidence for a relationship between long term exposure to noise and stress related
health effects, including cardiovascular disease, is increasing (Babisch et al., 2008; WHO,
2011; Van Kempen and Babisch, 2012; Basner et al., 2013; Babisch, 2014).
In the Netherlands, road traffic noise has shown to be a prominent source of noise
exposure and related annoyance. The 6th
national ‘Annoyance Inventory’ (In Dutch:
‘Inventarisatie Verstoringen’), a large face-to-face questionnaire study conducted in 2008
(N > 1200), identified road traffic noise as the main source of noise annoyance in the
Netherlands, amongst a broad range of other source types evaluated (including rail and
air traffic, neighbour and ‘outdoor activity’, industry, building and construction, and
recreational activity). Furthermore, road traffic noise was found to affect a considerable
proportion of inhabitants (with 18 % annoyed; 6 % highly annoyed), followed by noise
from neighbours (with 14 % annoyed; 5 % highly annoyed) (Van Poll et al., 2011). The
percentage of the population exposed to road traffic noise levels exceeding 55 dB Lden
has been estimated to be approximately 30 % in the Netherlands (Van Kempen and
Houthuijs, 2008). Based on the existing exposure-response relationships for annoyance
and sleep disturbance (Miedema and Oudshoorn, 2001; Miedema and Vos, 2007) the
number of people highly annoyed and highly sleep disturbed in the Netherlands was
estimated at 640,000 and 290,000, respectively (Van Kempen and Houthuijs, 2008).

Chapter 1
10
Because of the large numbers of people affected, the estimated total burden of disease
attributable to environmental noise is rather high. The WHO estimated the amount of
healthy life years that are lost every year due to traffic related noise in the Western part
of Europe to be at least one million. From all health effects that were taken into account
in this study, sleep disturbance and annoyance, mostly related to road traffic noise
exposure, were estimated to comprise the main burden of environmental noise (WHO,
2011).
Noise takes a prominent place between other environmental risk factors. In 2011, the
European Environmental Burden of Disease (EBoDE) working group estimated the
environmental burden of disease for nine prominent environmental stressors, in six
European countries, including the Netherlands. For the Netherlands, this study estimated
traffic noise to be the second most important environmental stressor, after particulate
matter, amongst a range of environmental stressors considered, including particulate
matter (PM2.5), traffic noise, second hand smoke (SHS), radon, dioxins, lead, ozone,
benzene, and formaldehyde (Hanninen and Knol eds., 2011). In a RIVM report on trends
in the environmental burden of disease (Knol and Staatsen, 2005), the burden related to
road traffic noise was estimated to increase between 2000 and 2020, up to a level
comparable to the burden related to traffic accidents.
Despite abatement measures, road traffic noise is expected to be a persistent
environmental health problem in the Netherlands. While between 2000 and 2010 noise
exposure from main roads in the Netherlands (In Dutch: rijkswegen) and railway traffic
has decreased by measures such as the use of lower emitting road surface types and
placement of noise screens, road traffic noise exposure related to the other parts of the
road network, particularly in the built environment, typically has increased over the
years (CBS, PBL and Wageningen UR, 2012). With the current trend of increasing
urbanization (Hilbers et al, 2011; Cohen, 2006), and the large numbers of residents
involuntary affected, road traffic noise exposure may be expected to be a persistent
environmental health problem not only in the Netherlands, but worldwide. With the
increasing amount of information becoming available on the adverse effects of
environmental noise, the need for a higher level of protection of residents is becoming
more widely recognised.
A working group of noise experts, set up by the European Commission to provide
guidance on cost-effectiveness of noise reduction measures, recommended that to
effectively reduce road traffic noise exposure a combination of both (internationally
defined) source oriented measures and exposure oriented measures is needed. It was

Introduction
11
concluded that, while source related measures may have the potential to be by far the
most effective, especially for road traffic, exposure measures are necessary in addition to
effectively tackle the problem (WG HSEA, 2005).
1.2 Pathways for health effects of long term noise exposure
The hypothesized pathway leading from noise exposure to cardiovascular health effects
involves stress responses that may, in the long term, cause adverse health effects (Figure
1.1). Noise can be viewed as a stressor, inducing physiological effects either directly or
indirectly through disturbance of sleep, communication, or activities. Exposure to noise
may affect the autonomic nervous system and the endocrine system, subsequently
inducing biological responses such as changes in heart rate and levels of stress hormones
(e.g., Evans and Lepore, 1993; Ising et al., 1999; Babisch, 2002; WHO, 2011). It has been
hypothesized that this may, possibly in combination with other factors, lead to increases
in biological risk factors (e.g., blood lipids, blood pressure, blood glucose, blood
viscosity), which may in the long term increase the risk of manifestations of
cardiovascular diseases such as hypertension, arteriosclerosis, ischemic heart disease
and stroke (Babisch, 2001, Babisch, 2002; Basner et al., 2013). Long term cardiovascular
health endpoints in relation to environmental noise exposure that have been studied
mostly, include hypertension and ischemic heart disease (Basner et al., 2013). Recently,
epidemiological studies have found indications for an association between road traffic
noise and stroke (Sørensen et al., 2011; Floud et al., 2013). The number of large
epidemiological studies is however still limited, and one important potential confounder
that has not been taken into account in most studies is air pollution, which has also been
linked to cardiovascular outcomes. This has raised the question if and to what extent
associations found for road traffic noise in epidemiological studies, may in part be
explained by air pollution and vice versa.

Chapter 1
12
Figure 1.1 The noise reaction model: hypothesized pathway for the effects of road
traffic noise (adapted from Babisch, 2002)
1.3 Objectives
This thesis focuses on the long term effects of road traffic noise. Central research
questions that are investigated are:
1. What is the association between long term night time road traffic noise exposure
(Lnight) and self-reported sleep problems, including the after effect (medication use,
morning tiredness)?
2a. What is the association between road traffic noise and the prevalence of
hypertension, taking air pollution into account?
2b. What is the association between road traffic noise and the incidence of
cardiovascular events, taking air pollution into account?
3. Does a relatively quiet façade reduce adverse effects of exposure: How does
exposure at the least exposed side of dwellings affect annoyance?

Introduction
13
The first aim contributes to further exploring the hypothesized mechanism for the effects
of road traffic noise. The second aim contributes to increasing insight in the effects of
road traffic noise, taking into account air pollution as a potentially important
confounder. The third aim contributes towards a more complete characterisation of
personal exposure, as well as providing insight into the potential impact of reducing
noise exposure at the least exposed side, as an effect abatement measure. In the
following paragraphs (1.4, 1.5 and 1.6) these 3 topics are discussed in more detail.
1.4 Noise induced sleep disturbance as a pathway
One of the above mentioned hypothesized pathways through which noise exposure may
lead to adverse health effects in the long term, involves the disturbance of sleep (Babisch
et al., 2002; WHO, 2009).
Sleep is commonly recognised as important for human functioning. During sleep people
recover both physically and mentally, and there is increasing evidence that sleep benefits
memory consolidation (Marshall and Born, 2007; Drosopoulos et al., 2007). It has
become commonly recognised that sleep affects cognitive performance. In addition,
experimental studies have shown effects of sleep loss on changes in the immune and
endocrine systems, as well as inflammatory changes. Insufficient sleep related
alterations in established cardiovascular risk factors (e.g., blood pressure and
inflammation) have been hypothesised to underlie the relationship with cardiovascular
pathogenesis (e.g., Mullington et al., 2009; Faraut et al., 2012). In line with the findings
from experimental studies, epidemiological studies have shown associations between
long term sleep complaints and increased morbidity, including cardiovascular disease
(Schwartz et al., 1999; Leineweber et al., 2003; Mullington et al., 2009; Faraut et al.,
2012).
It is well known that exposure to noise can adversely affect sleep (WHO, 2009).
Laboratory studies and field studies have shown effects of night time noise exposure on
several aspects of sleep (Passchier-Vermeer and Passchier, 2000; HCN, 2004; WHO,
2009). Effects include arousal responses during sleep (e.g., Carter et al., 1994), self-
reported noise induced awakenings, and reduced sleep quality (e.g., Öhrström et al.,
2006a; Passchier-Vermeer et al., 2007), body movements (e.g., Horne et al., 2004;
Passchier-Vermeer et al., 2007), heart rate responses (e.g., Griefahn et al., 2008) and

Chapter 1
14
indices of autonomic nervous system responses (e.g., Graham et al., 2009). From a
review of available evidence, the WHO concluded that there is sufficient evidence for the
following biological effects of noise during sleep: changes in heart rate, arousals, sleep
stage changes and awakening. Furthermore, evidence was considered sufficient for a
causal relationship between night time noise exposure and self-reported sleep
disturbance, increased medicine use, increase in body movements and (environmental)
insomnia (WHO, 2009).
While some responses, such as awakening reactions, may be subject to some extent of
habituation, autonomic and endocrine responses have been observed to not completely
habituate over time (Griefahn, 2008; Review by Pirrera et al., 2010), and noise induced
cardiac responses and motility were found in residents that have lived near a major road
for years (Hofman et al., 1995; Passchier-Vermeer et al., 2007; Graham et al., 2009).
What the long term effects are of chronic noise exposure on sleep and health, however,
cannot be fully answered by short term laboratory experiments or field studies alone. To
date, only a limited number of epidemiological studies have investigated the relationship
between long-term exposure to road traffic and road traffic noise at home and sleep
problems in the general population. Kageyama et al (1997), for example, found an
association between living near a busy road and insomnia, based on cross sectional
analyses of survey data of 3600 Japanese women. They found an exposure response
relationship between night time traffic volume and the risk of insomnia for subjects living
close to main roads. In this study however, — although it seems plausible that this
association may be explained by night time traffic noise — no noise exposure data was
available to further investigate this association. Furthermore, it remains unclear to what
extent this association may be generalised to other populations and other countries.
Bluhm et al (2004) studied the association between road traffic noise and noise related
sleep disturbances (awakenings and/or difficulty falling asleep) in a Swedish survey of
approximately 657 subjects. They found an association between road traffic noise
exposure and self-reported traffic noise related sleep disturbance. However, in this
survey, questions explicitly referred to traffic noise, and it is not clear to what extent the
subjects attitude towards the source may have affected the results. Furthermore, it is
unclear if and to what extent these reported disturbances may affect subjects the next
day.

Introduction
15
1.5 Combined exposure: road traffic noise and air pollution
Some health endpoints, including cardiovascular health effects, have been associated to
both noise and air pollution. From the literature there is support for a causal role of both
exposures. For environmental noise exposure, this has been discussed in 1.1. For air
pollution exposure however, there is also an increasingly large body of evidence, linking
both short term increases of air pollution as well as long term exposure to air pollution,
to cardiovascular morbidity (reviews by Brook et al., 2010; Brook and Rajagopalan, 2010;
Janssen et al., 2011; WHO, 2012). As road traffic is not only a major source of noise, but
also a source of air pollution components (e.g., particulate matter), in urban areas these
exposures are to some extent related (e.g., Allen et al., 2009; Davies et al, 2009; Can et
al., 2011; Foraster et al., 2011). A topic that has received growing interest in recent years
is the effect of combined exposure to environmental noise and air pollution, as it has
now become more broadly recognised that these exposures may confound or interact
with each other. To date however, still only a limited number of studies have
investigated the relationship between exposure and their effects on cardiovascular
health outcomes in combination (e.g., review by Tetreault et al., 2013). Insight in the
relative contribution of road traffic noise and air pollution is relevant to policy makers, as
reduction of road traffic noise exposure and air pollution may require different types of
measures. Measures designed to reduce air pollution exposure, may not affect noise
exposure and vice versa. For example, emission control measures such as the catalytic
converter to reduce vehicular emissions of air pollution, are not designed to reduce noise
exposure and its adverse health effects.
1.6 Beneficial effects of a relatively quiet side to the dwelling
Conventional measures that may be implemented locally to reduce exposure to road
traffic noise, include lower emission road pavement, noise screens, or traffic related
measures (e.g., speed control, reducing traffic intensity, reducing heavy duty traffic in
urban areas etc.).
Typically, in residential areas, there may be practical limitations to the suitability and
applicability of such measures. For example, for obvious reasons, noise screens may
generally not be desirable in residential areas, as they may adversely affect accessibility
and visual quality. At the same time, even after the application of lower emission road
pavement, noise exposure levels may still remain (too) high. Furthermore, road surface

Chapter 1
16
measures require maintenance to remain effective. Therefore, smart combination of
multiple measures may be required to optimize the sound environment and thereby
reduce the adverse effects of noise exposure.
Currently, exposure is typically characterised by the noise level at the most exposed
façade of dwellings. The above measures are designed to reduce this noise level.
However, in addition there is a range of factors not affecting this noise level, while
having an effect on the total personal exposure of residents (and thereby the effects),
such as the level of acoustical insulation of the building envelope, exposure at the least
exposed façade etc. From previous studies, there are indications that the availability of a
quiet side to the dwelling, access to quietness in the surrounding living area, and
insulation may have the potential to significantly reduce effects (Öhrström et al., 2006b;
Gidlöf-Gunnarsson et al., 2007 and 2010; Amundsen et al., 2011). However, insight in the
effects of these factors on noise exposure related adverse effects is still limited.
Reducing exposure not only at the most exposed façade, but also at the least exposed
façade may be an effective way to reduce adverse effects. It has been hypothesized, that
the availability of a relatively quiet façade to a dwelling may reduce adverse effects of
noise exposure by offering a ‘way out’ from the noise to the inhabitants (Miedema and
Borst, 2006). For example, by providing the option to spend time or sleep at the quieter
side of the dwelling. While there is support for this hypothesis (Öhrström et al., 2006b),
to date evidence is still limited. To allow evaluation of effectiveness of measures,
confirmation of previous findings as well as a better quantification of the effect of
exposure at the ‘quiet’ side is needed.
1.7 Important challenges when investigating the research questions
Studying the long term effects of road traffic noise is challenging in many ways. A
number of challenges are described below.
First of all, the relative contribution of environmental exposures (including
environmental noise and air pollution) to manifest diseases (including cardiovascular
morbidity), is typically small compared to the well-known prominent risk factors (e.g.,
obesity, smoking, inactive life style). This complicates the identification and
quantification of the effects. The implication of this difficulty, is that a design is needed
which allows such investigation. It means for instance, that a large population is needed,
with a sufficient number of ‘cases’ of the health effect being studied, and adequate

Introduction
17
information is needed on this endpoint. Furthermore, for the investigation of long term
health effects of exposure, preferably a prospective design is used, as prospective
studies are better capable to take into account the sequence in time: If persons with
higher exposure show a higher risk of developing the disease under study as compared
to persons with a lower exposure, there is more ground to assume that exposure and
effect may indeed be causally related.
In addition, detailed information is needed on the variation in individual exposure of
subjects within the study population. Assessment of exposure for a large population is
not straightforward. While theoretically, it might be preferable to have measurement
data on individual long term road traffic noise exposure at the home, this is practically
and cost wise not feasible. Over the last decade, the development of advanced GIS
(Geographic Information System) techniques and exposure modelling has created new
opportunities for research on the association between (differences in) long term traffic
noise and air pollution exposure levels and adverse health effects.
Spatial differences in exposure are important, as a population of residents of an urban
agglomeration experiences similar fluctuations in time. However, as spatial differences in
exposure may be related to spatial differences in population characteristics (e.g., socio
economic status, life style, etc.), which in turn may be risk factors for the health effect
under study, adjustment for potential confounding is needed.
Furthermore, similar exposure has different effects on different persons, with stronger
effects in certain potentially more vulnerable groups (e.g., elderly, persons with pre-
existing disease). This underlines the importance of not restricting the investigation of
effects of exposure to the general population only, but in addition paying attention to
potentially vulnerable subgroups.
1.8 Outline of thesis
This thesis is divided into six chapters. Chapter 2 describes results from a large
population study into the association between long term night time road traffic noise
exposure and self-reported sleep problems. Chapter 3 presents results of a large
population study into the association between road traffic noise and hypertension.
Chapter 4 describes the results of our study into the association between road traffic
noise and air pollution and the incidence of cardiovascular events. Chapter 5 investigates
the potential beneficial effect of having a relatively quiet façade to the dwelling. Finally,

Chapter 1
18
Chapter 6 comprises of a general discussion of our results and the results of previous
studies performed in this research area, and provides suggestions for future research.
References
Allen RW, Davies H, Cohen MA, Mallach G, Kaufman JD, Adar SD. The spatial relationship between
traffic-generated air pollution and noise in 2 US cities. Environ Res. 2009;109(3):334–342.
Amundsen AH, Klaeboe R, Aasvang GM. The Norwegian façade insulation study: the efficacy of
façade insulation in reducing noise annoyance due to road traffic. J Acoust Soc Am. 2011;129:1381-
1389.
Babisch W, Fromme H, Beyer A, Ising H. Increased catecholamine levels in urine in subjects
exposed to road traffic noise. The role of stress hormones in noise research. Environ Int.
2001;26:475–481.
Babisch W. The Noise/Stress Concept, Risk Assessment and Research Needs. Noise Health
2002;4(16);1–11.
Babisch W. Road traffic noise and cardiovascular risk. Noise Health 2008;10(38):27–33.
Babisch W. Updated exposure-response relationship between road traffic noise and coronary heart
diseases: A meta-analysis. Noise Health 2014;16:1–9.
Basner M, Babisch W, Davis A, Brink M, Clark C, Janssen S, Stansfeld S. Auditory and non-auditory
effects of noise on health. Lancet 2013; doi: 10.1016/S0140-6736(13)61613-X.
Bluhm G, Nordling E, and Berglind N. Road traffic noise and annoyance—An increasing
environmental health problem. Noise Health 2004;6:43–49.
Brook RD, Rajagopalan S, Pope CA, Brook JR, Bhatnagar A, Diez-Roux AV, Holguin F, Hong Y,
Luepker RV, Mittleman MA, Peters A, Siscovick D, Smith SC, Whitsel L, Kaufman JD and on behalf of
the American Heart Association Council on Epidemiology and Prevention, Council on the Kidney in
Cardiovascular Disease, and Council on Nutrition, Physical Activity and Metabolism. Particulate
Matter Air Pollution and Cardiovascular Disease: An Update to the Scientific Statement From the
American Heart Association. Circulation 2010;121:2331–2378.
Brook RD, and Rajagopalan S. Particulate matter air pollution and atherosclerosis. Curr Atheroscler
Rep. 2010;12:291–300.
Can A, Rademaker M, Van Renterghem T, Mishra V, Van Poppel M, Touhafi A, Theunis J, De Baets
B, Botteldooren D. Correlation analysis of noise and ultrafine particle counts in a street canyon.
Science Total Environ. 2011;409;564–572.

Introduction
19
CBS, PBL, Wageningen UR (2012). Geluidsbelasting woningen door weg- en railverkeer, 2000-2010
(indicator 0295, versie 07, 19 september 2012). www.compendiumvoordeleefomgeving.nl. CBS,
Den Haag; Planbureau voor de Leefomgeving, Den Haag/Bilthoven en Wageningen UR,
Wageningen.
Cohen B. Urbanization in developing countries: Current trends, future projections, and key
challenges for sustainability. Technol Soc. 2006;28:63–80.
Davies HW, Vlaanderen JJ, Henderson SB, Brauer M. Correlation between coexposures to noise and
air pollution from traffic sources. Occup Environ Med. 2009;66:347–350.
Drosopoulos S, Schulze C, Fischer S and Born J. Sleep’s function in the spontaneous recovery and
consolidation of memories. J Exp Psychol Gen. 2007;136:169–183.
European Commission, DG Environment. 2002. Directive 2002/49/EC of the European Parliament
and of the Council. Brussels: EU/DG Environment. http://ec.europa.eu/environment/noise/
Evans GW and Lepore SJ. Non-auditory Effects of Noise on Children: A Critical Review. Child Youth
Environ. 1993;10(1):42-72.
Faraut B, Boudjeltia KZ, VanHamme L, Kerkhofs M. Immune, inflammatory and cardiovascular
consequences of sleep restriction and recovery. Sleep Med Rev. 2012;16;137–149.
Floud S, Blangiardo M, Clark C, De Hoogh K, Babisch W, Houthuijs D, Swart W, Pershagen G,
Katsouyanni K, Velonakis M, Vigna-Taglianti F, Cadum E and Hansel AL. Exposure to aircraft and
road traffic noise and associations with heart disease and stroke in six European countries: a cross-
sectional study. Environ Health 2013;12(89):11pp.
Foraster M, Deltell A, Basagana X, Medina-Ramon M, Aguilera I, Bouso L, Grau M, Phuleria HC,
Rivera M, Slama R, Sunyer J, Targa J, Künzli N. Local determinants of road traffic noise levels versus
determinants of air pollution levels in a Mediterranean city. Environ Res. 2011;111:177–183.
Gidlöf Gunnarsson A. and Öhrström E. Noise and well-being in urban residential environments: The
potential role of perceived availability to nearby green areas. Landscape Urban Plan. 2007;83:115–
126.
Gidlöf-Gunnarsson A. and Öhrström E.: Attractive “quiet” courtyards: a potential modifier of urban
residents responses tot road traffic noise? Int J Environ Res. Public Health 2010;7:3359–3375.
Graham JMA, Janssen SA, Vos H, and Miedema HME. Habitual traffic noise at home reduces
cardiac parasympathetic tone during sleep. Int J Psychophysiol. 2009;72:179–186.
Griefahn B, Bröde P, Marks A, and Basner M. Autonomic arousals related to traffic noise during
sleep. Sleep. 2008;31;569–577.
Hänninen O and Knol A (Eds). EBoDE-Report. European Perspectives on Environmental Burden of
Disease. Estimates for Nine Stressors in Six European Countries. National Institute for Health and

Chapter 1
20
Welfare (THL), Report 1/2011. 86 pp. Helsinki, Finland 2011. ISBN 978-952-245-412-6 (printed),
ISBN 978-952-245-413-3 (PDF).
HCN. (Health Council of The Netherlands; Gezondheidsraad). The influence of night.time noise on
sleep and health. Report No. 2004/14E, HCN, 2004 Den Haag.
Hilbers H, Snellen D, Daalhuizen F, De Jong A, Ritsema van Eck J, Zondag B. (PBL) Nederland in
2040: een land van regio’s. Ruimtelijke Verkenning 2011, Den Haag, 2011: Planbureau voor de
Leefomgeving. PBL publicatienummer: 500169001.
Hofman WF, Kumar A, and Tulen JHM. Cardiac reactivity to traffic noise during sleep in man. J
Sound Vib. 1995;179:577–589.
Horne JA, Pankhurst FL, Reyner LA, Hume K, and Diamond ID. A field study of sleep disturbance:
Effects of aircraft noise and other factors on 5,742 nights of actimetrically monitored sleep in a
large subject sample. Sleep 1994;17:146–159.
Ising H, Babisch W, Günther T. Work noise as a risk factor in myocardial infarction. J Clin Basic
Cardiol. 1999;2:64–68.
Janssen NAH, Hoek G, Simic-Lawson M, Fischer P, Van Bree L, Ten Brink H, Keuken M, Atkinson RW,
Anderson HR, Brunekreef B, and Cassee FR. Black carbon as an additional indicator of the adverse
health effects of airborne particles compared with PM10 and PM2.5. Environ Health Perspect.
2011;119(12):1691–1699.
Kageyama T, Kabuto M, Nitta H, Kurokawa Y, Taira K, Suzuki S, and Takemoto T. A population study
on risk factors for insomnia among adult Japanese women: A possible effect of road traffic volume.
Sleep. 1997;20:963–971.
Knol AB and Staatsen BAM. Trends in the environmental burden of disease in the Netherlands
1980 – 2020. RIVM report 500029001, 2005.
Leineweber C, Kecklund G, Janszky I, Akerstedt T, Orth-Gomer K. Poor sleep increases the
prospective risk for recurrent events in middle-aged women with coronary disease The Stockholm
Female Coronary Risk Study. J Psychosom Res. 2003;54:121– 127.
Marks, A. and Griefahn, B. Associations between noise sensitivity and sleep, subjectively evaluated
sleep quality, annoyance, and performance after exposure to nocturnal traffic noise. Noise Health.
2007;9:1–7.
Marshall L and Born J. The contribution of sleep to hippocampus-dependent memory
consolidation. Trends Cogn Sci. 2007;11:442–450.
Miedema H.M.E. and Oudshoorn C.G.M. Annoyance from transportation noise: relationships with
exposure metrics DNL and DENL and their confidence intervals. Environ Health Perspect.
2001;109:409–416.

Introduction
21
Miedema, H. M. E., and Borst, H. C. (2006). Rating environmental noise on the basis of noise maps.
Proceedings of Euronoise 2006, Tampere, Finland.
Miedema H.M.E. and Vos H. Associations between selfreported sleep disturbance and
environmental noise based on reanalyses of pooled data from 24 studies. Behav Sleep Med.
2007;5:1–20.
Mullington JM, Haack M, Toth M, Serrador JM and Meier-Ewert HK. Cardiovascular, inflammatory,
and metabolic consequences of sleep deprivation. Prog Cardiovasc Dis. 2009;51(4):294-302.
Öhrström E. Sleep disturbance, psycho-social and medical symptoms—A pilot survey among
persons exposed to high levels of road traffic noise. J Sound Vib. 1989;133:117–128.
Öhrström E. Sleep disturbances caused by road traffic noise—Studies in laboratory and field. Noise
Health. 2000;2:71–78.
Öhrström E, Hadzibajramociv E, Holmes M, and Svensson H. Effects of road traffic noise on sleep:
Studies on children and adults. J Environ Psychol. 2006a;26:116–126.
Öhrström, E., and Skanberg, A. Sleep disturbances from road traffic and ventilation noise—
Laboratory and field experiments. J Sound Vib. 2004;271:279–296.
Öhrström E., Skånberg A., Svensson H., Gidlöf Gunnarsson A. Effects of road traffic noise and the
benefit of access to quietness. J Sound Vib. 2006b;295:40–59.
Passchier-Vermeer, W., and Passchier, W. F. Noise exposure and public health. Environ Health
Perspect. 2000;108:123–131.
Passchier-Vermeer W, Vos H, Janssen SA and Miedema HME. Slaap en verkeersgeluid (Sleep and
traffic noise). 2007, TNO Report No. 2007-D-R0012/A, TNO, Delft, The Netherlands.
Schwartz S. McDowell Anderson W, Cole SR, Cornoni-Huntley J, Hays JC, Blazer D. Insomnia and
heart disease: a review of epidemiologic studies. J Psychosom Res. 1999;47(4):313–333.
Sørensen M, Hvidberg M, Andersen ZJ, Nordsborg RB, Lillelund KG et al. Road traffic noise and
stroke: a prospective cohort study. Eur Heart J. 2011;32(6);737–744.
Tetreault LF, Perron S, Smargiassi A. Cardiovascular health, traffic-related air pollution and noise:
are associations mutually confounded? A systematic review. Int J Public Health 2013;58:649–666.
Van Kempen E, Babisch W. The quantitative relationship between road traffic noise and
hypertension: a meta-analysis. J Hypertens. 2012;30:1075–1086.
Van Kempen EEMM and Houthuijs DJM. Omvang van de effecten op gezondheid en welbevinden in
de Nederlandse bevolking door geluid van weg- en railverkeer. RIVM rapport 630180001, 2008.

Chapter 1
22
Van Poll HFPM, Breugelmans ORP, Devilee JLA. Hinder, bezorgdheid en woontevredenheid in
Nederland: Inventarisatie Verstoringen 2008. RIVM Rapport nr. 630741001, 2011.
WG HSEA. Working Group Health and Socio-Economic Aspects. Working paper on the effectiveness
of noise measures. 2005. http://ec.europa.eu/environment/noise/pdf/13825_workingpaper.pdf
WHO. Night noise guidelines for Europe. World Health Organization Regional Office for Europe.
WHO, Copenhagen, Denmark, 2009.
WHO. World Health Organization Regional Office for Europe and JRC European Commission:
Burden of disease from environmental noise. Quantification of healthy life years lost in Europe.
WHO, Copenhagen, Denmark, 2011.
WHO. Health effects of black carbon. By: Janssen NAH, Gerlofs-Nijland ME, Lanki T, Salonen RO,
Cassee F, Hoek G, Fischer P, Brunekreef B, Krzyzanowski M. The WHO European Centre for
Environment and Health, Bonn, WHO Regional Office for Europe, 2012.

Chapter 2
Long term road traffic noise exposure is associated
with an increase in morning tiredness.
Yvonne de Kluizenaar
Sabine A. Janssen
Frank J. van Lenthe
Henk M.E. Miedema
Johan P. Mackenbach
Adapted from: J. Acoust. Soc. Am. 2009; 126(2): 627-633

Chapter 2
24
Abstract
This study investigates the association between night time road traffic noise exposure
(Lnight) and self-reported sleep problems. Logistic regression was performed in a large
population based cohort study (GLOBE), including over 18,000 subjects, to study the
association between exposure at the dwelling façade and sleep problems. Measures of
sleep problems were collected by questionnaire with two questions: “Do you in general
get up tired and not well rested in the morning?” and “Do you often use sleep
medication or tranquillizers”. After adjustment for potential confounders, a significant
association was found between noise exposure and the risk of getting up tired and not
rested in the morning. Although prevalence of medication use was higher at higher noise
levels compared to the reference category (Lnight < 35 dB), after adjustment for covariates
this association was not significant. Long-term road traffic noise exposure is associated
with increased risk of getting up tired and not rested in the morning in the general
population. This result extends the earlier established relationship between long term
noise exposure and self-reported sleep disturbance assessed with questions that
explicitly referred to noise and indicates that road traffic noise exposure during the night
may have day-after effects.

Long term road traffic noise exposure is associated with an increase in morning tiredness.
25
2.1 Introduction
Undisturbed sleep is important for human functioning. During sleep, people recover
mentally and physically from their activities, and process information they have acquired
during the day (Siegel, 2005; Marshall and Born, 2007; Drosopoulos et al., 2007).
Insufficient sleep is associated with feelings of sleepiness and fatigue during the daytime
(Scott et al., 2007; Elmenhorst et al., 2008), and with decreased cognitive performance
(Carter, 1996; Ouis, 1999; Raidy and Scharff, 2005, Murphy et al., 2006). Furthermore,
sleep deprivation has been associated with changes in physiological parameters, such as
metabolic and endocrine function (Spiegel et al., 1999), altered cardiac autonomic
nervous system activity (Holmes et al., 2002), and reduced acute immune system
responses during stress (Wright et al., 2007). One of the key features of subjective sleep
quality is morning tiredness (Harvey et al., 2008). Complaints of non-restorative sleep
(not feeling rested after sleep for at least three to four times a week) have been shown
to be correlated to daytime impairment such as irritability and mental fatigue (Ohayon,
2005).
Environmental noise may disturb recuperation by activating the organism during sleep.
Transportation is a prolific source of environmental noise during the night-time in urban
areas, and has been identified as a major cause of sleep disturbance (Berglund et al.,
1999; Muzet, 2007). Exposure to transportation noise has been shown to induce both
objectively measured and self-reported sleep disturbance (e.g. Pearsons et al., 1995;
Aasvang et al., 2008; Basner et al., 2006; Michaud et al., 2007; Miedema and Vos, 2007).
Considering the continuing growth of vehicular traffic and the large number of people
exposed, disturbance of sleep by road traffic noise has become an increasingly important
cause of concern.
Effects of night time road traffic noise exposure on aspects of sleep have been found in
both laboratory studies and in field studies with subjects exposed to habitual noise in
their home situation (Passchier-Vermeer and Passchier, 2000; Franssen and
Kwekkeboom, 2003; HCN, 2004). The observed effects include awakenings or sleep stage
changes (Carter, 1994), autonomic responses (Di Nisi et al., 1990; Hofman et al., 1995;
Griefahn, 2008; Graham et al., 2009), body movements (Horne et al., 1994; Passchier-
Vermeer et al., 2007), and self-reported noise-induced awakenings, difficulty falling
asleep, and reduced sleep quality (Öhrström, 2000; Öhrström et al., 2006a; Passchier-
Vermeer et al., 2007; Marks and Griefahn, 2007). While awakening reactions may be
subject to habituation (Thiessen and Lapointe, 1983; Öhrström, 2000), traffic noise has
been found to induce cardiac responses and motility in people who have lived in the
vicinity of a major road for years (Hofman et al., 1995; Passchier-Vermeer et al., 2007).
Furthermore, long-term effects of road traffic noise have been found on self-reported

Chapter 2
26
noise-related sleep disturbance and general sleep quality, as reported in questionnaires
(HCN, 2004; Bluhm et al., 2004), although few studies adjusted for potential confounders
(Franssen and Kwekkeboom, 2003). On the basis of the pooled original data sets from 24
community surveys, exposure-effect relationships have been presented for the
association between long-term night time transportation noise exposure and self-
reported noise-related sleep disturbance (Miedema and Vos, 2007). In addition, some
field studies have found next-day effects, such as tiredness in the morning and depressed
mood as indicated in sleep logs, as well as poorer performance on reaction time tasks
(Carter, 1996; Ouis, 1999; HCN, 2004).
Thus, there seems to be sufficient evidence that long-term traffic noise exposure is
associated with self-reported noise-related sleep disturbance. However, little is known
about the impact of long-term road traffic noise exposure on problems related to sleep
such as morning tiredness and medication use. Although several field studies have been
carried out (e.g. Öhrström, 1989; Öhrström and Skanberg, 2004; Passchier-Vermeer et
al., 2007), few epidemiological studies have assessed the relationship between long-term
exposure to residential road traffic noise and sleep problems in the general population
(e.g. Langdon and Buller, 1977; Kageyama et al., 1997; Bluhm et al., 2004). Furthermore,
in previous studies results may, to some extent, have been distorted by limitations in the
study sample (e.g. non-random selection or relatively small sample), exposure
assessment, or control for potential confounders. Moreover, in field studies and surveys
designed specifically to investigate the community effects of noise, participants were
usually aware of the noise focus of the study, and their response to questions concerning
aspects of sleep may have been biased by their attitude towards the local road traffic
exposure. The objective of the present study is to investigate the relationship between
night time road traffic noise exposure (Lnight) and self-reported sleep problems in a
population based cohort study. As far as the authors know, this study is the first to
investigate the relationship between night time road traffic noise exposure and morning
tiredness and sleep medication use in such a large population based sample. In this study
objective measures are used for noise exposure, and odds ratios (ORs) are studied with
adjustment for a broad spectrum of potential confounders. Furthermore, since the
population study and questionnaire were not directed towards studying the effect of
noise and noise exposure was determined independently, the subjects’ attitude towards
the local road traffic exposure is unlikely to have affected the results.

Long term road traffic noise exposure is associated with an increase in morning tiredness.
27
2.2 Methods
2.2.1 Study population
The GLOBE study is a prospective cohort study carried out in the Netherlands, with the
primary aim of explaining socio-economic inequalities in health. GLOBE is the Dutch
acronym for Health and Living Conditions of the Population of Eindhoven and
surroundings. Baseline data were collected in 1991. Details of the study protocol have
been described elsewhere (Mackenbach et al., 1994), and will only be briefly
summarised here.
In 1991, an a-select sample (stratified by age, degree of urbanization and socio-economic
position) of 27,070 non-institutionalized subjects (aged 15 to 74 years) was drawn from
18 municipal population registers in the south-eastern part of The Netherlands and was
asked to participate in the study. With a response rate of 70.1%, baseline information
was collected from 18,973 individuals using a postal questionnaire. The area of study
included the city of Eindhoven, which was the fifth largest city of The Netherlands in
1991.
2.2.2 Health outcome and covariates
The data collection comprised a broad range of potential confounders including
sociodemographic variables (age, gender, marital status, and education), lifestyle factors
(smoking, alcohol use, physical activity, Body Mass Index [BMI]), and living conditions
(employment status, financial problems). Data for measures of sleep problems were
available from the following questions in the questionnaire: “Do you in general get up
tired and not well rested in the morning?” and “Do you often use sleep medication or
tranquillizers?”. The response format is: “yes” or “no”.
2.2.3 Noise exposure
The road traffic noise exposure of the subjects was calculated at the most exposed
façade of the baseline home address with standard method SKM2 in accordance with
requirements of the EU Environmental Noise Directive (END). For the analyses, the
authors used the EU standard noise metric Lnight. Lnight (night level) is defined as the A-
weighted “average” sound level (International Standards Organization, 2002) over a year
during the period 23 – 7 h assessed at the façade of a dwelling with the highest overall
exposure (i.e., most exposed façade). SKM2 is the sophisticated version of the
Netherlands’ standard method for noise modelling and producing noise maps in

Chapter 2
28
compliance with the END (VROM, 2006a). SKM2 is implemented in Urbis (Borst and
Miedema, 2005) that was used here for the exposure calculations. Noise calculations are
carried out in two steps calculating first the emission and then the transmission. The
emission calculations take into account traffic characteristics, including traffic intensities,
traffic composition (percentages motorbikes, light duty, medium duty, and heavy duty
vehicles), speed, road height and road surface type. The transmission calculations take
into account the distance between source (road) and dwelling façade, air attenuation,
effects of (yearly) meteorological conditions, ground attenuation, object screening,
reflection of objects opposite the dwelling, and statistical diffraction for transmission.
Noise exposure is calculated at the height of the centre of the dwelling façade of the
exposed subject. Very low noise exposure levels (below 35 dB(A)) were recoded as 35
dB(A) since this can be considered to be a lower limit of the night time ambient noise in
most surroundings involved.
Input data for the noise emission calculations was a detailed digital map describing the
geographic location of roads and the traffic characteristics for each road segment
(including traffic intensities for each vehicle category, speed, and road surface type),
provided by the local authorities of Eindhoven for the current situation (2004). Although
traffic intensities may have increased, the road network is assumed to be rather stable,
with only small (if any) but equal changes in noise exposure across the population. Traffic
data were attached as attributes to the road segments for a dense network of roads,
including highways, arterial roads, main streets, and principal residential streets.
Basis for the noise transmission calculations was digital maps with precise information
on geographic location of buildings and ground characteristics (Topographic Service data
[TOP10]) provided by the Netherlands Ministry of Housing, Spatial Planning and the
Environment - Directoraat-Generaal Ruimte (VROM/DGR). Building height was derived
from the Actual Height Information Netherlands (AHN), a 5 x 5 m2 grid with height
information based on laser altimetry. The geographic location of noise screens with their
height was provided by the local authorities of Eindhoven. The geographical location of
dwellings within the building contours (Topographic Service data [TOP10]) was identified
with the use of address coordinates.
2.2.4 Statistical analysis
Logistic regression was performed to investigate the association between night time
residential road traffic noise exposure (Lnight) and self-reported sleep problems (getting
up tired and not well rested in the morning and the use of sleep- or tranquillizing

Long term road traffic noise exposure is associated with an increase in morning tiredness.
29
medication). Estimated ORs are presented as approximation of relative risks, together
with their corresponding 95% confidence intervals (CIs).
In the model, factors were included that were hypothesized a priori to potentially
confound the relationship between traffic exposure and sleep problems. These variables
are age, sex, BMI, physical activity, marital status, employment status, financial
problems, alcohol use, smoking, and self-reported level of education. A P value of at
most 0.05 was considered to be significant, a P value of 0.05–0.1 was considered an
indication of a relationship.
Age was entered as a continuous variable, while gender, BMI, physical activity, marital
status, employment status, financial problems, alcohol use, smoking, and education,
were entered as categorical variables. BMI (body weight divided by height squared) was
categorised into four groups (underweight [BMI <20], normal weight range [BMI 20–25],
overweight [BMI 25–30], obese [BMI >30]). Physical activity was available in four
categories (none, little, moderate, and much physical activity). Marital status was
categorised into four groups (married or living together, unmarried, divorced,
widow/widower). Employment status was categorised in three categories, including
“unemployed”. Three categories of financial problems were distinguished (no difficulty,
some difficulty, large difficulty). Alcohol use was categorised into three groups
(moderate, abstainer, and excessive). Data on smoking was available from the following
question in the questionnaire: “Do you smoke?” The response format is: “Yes”, “No, but I
have smoked in the past,” “No, I never smoked,” coded in three categories (current
smoker, former smoker, and never smoker). Highest attained level of education was
distinguished into four different categories (primary education, lower professional and
intermediate general education, intermediate professional and higher general education,
and higher professional education and university).
A sensitivity analysis was carried out to explore the effect of the inclusion of additional
variables. In this analysis, a measure of occurrence of major life events, number of
children living at home, and measures of cold or draught (answer categories: yes or no)
and dampness (answer categories: yes or no) inside the dwelling were taken into
account in the model in addition to age, sex, BMI, exercise, marital status, work
situation, financial difficulties, smoking, alcohol use, and education. For major life events,
a sum-score was used as the number of times respondents answered “yes” to one of
nine questions on occurrence of major life events experienced during the last 12 months.
These events included (1) moving house; (2) substantial decrease in financial situation;
(3) being the victim of serious crime (robbery, theft, physical abuse, or rape); (4)
becoming unemployed; (5) partner or other family member (member of household)
becoming unemployed; (6) serious disease of partner or family member (member of
Chapter 2
30
household) or parents (in law); (7) death of partner; (8) death of parent (in law), child,
brother of sister or close friend; (9) divorce.
Missings in potential confounding variables (the percentage of missings for all
confounding variables was below 5.6 %) were imputed, replacing the missing values with
the most common category. All analyses were performed with SPSS (version 11.0.1).
2.3 Results
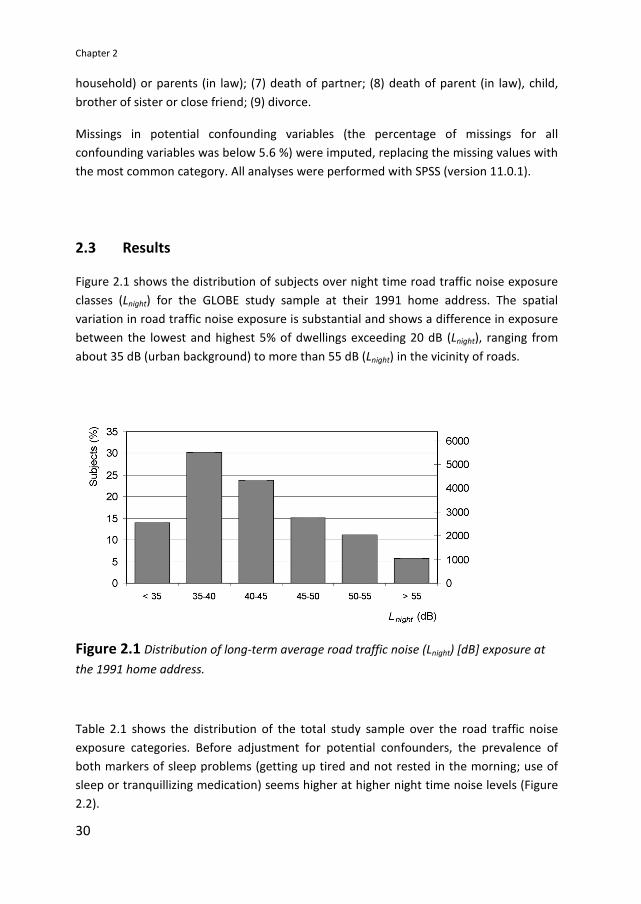
Figure 2.1 shows the distribution of subjects over night time road traffic noise exposure
classes (Lnight) for the GLOBE study sample at their 1991 home address. The spatial
variation in road traffic noise exposure is substantial and shows a difference in exposure
between the lowest and highest 5% of dwellings exceeding 20 dB (Lnight), ranging from
about 35 dB (urban background) to more than 55 dB (Lnight) in the vicinity of roads.
Figure 2.1 Distribution of long-term average road traffic noise (Lnight) [dB] exposure at
the 1991 home address.
Table 2.1 shows the distribution of the total study sample over the road traffic noise
exposure categories. Before adjustment for potential confounders, the prevalence of
both markers of sleep problems (getting up tired and not rested in the morning; use of
sleep or tranquillizing medication) seems higher at higher night time noise levels (Figure
2.2).

Long term road traffic noise exposure is associated with an increase in morning tiredness.
31
Table 2.1 Characteristics of the GLOBE cohort by road traffic noise (Lnight) [dB] exposure
category (unadjusted).
Lnight [dB] < 35 35−40 40−45 45−50 > 50
N 2547 5514 4325 2742 3085
Age (years) 45.7 46.8 47.9 48.3 49.0
Sex: Male (%) 49.6 48.3 48.3 47.6 48.3
BMI (QI > 30) (%) 5.3 6.3 6.4 6.2 5.8
Physical activity: much (%) 35.1 33.0 32.7 33.1 30.8
Marital (married/live together) (%) 74.2 74.6 75.4 72.8 67.8
Work situation: unemployed (%) 9.9 10.4 10.8 8.7 10.9
Financial: much difficulty (%) 4.7 4.7 4.3 3.6 3.6
Smoking (%) 35.8 37.2 35.7 35.0 36.9
Alcohol use: excessive (%) 8.8 8.0 7.8 7.8 9.0
Education low (%) 18.3 21.0 22.3 20.5 22.6
Not rested in the morning (%) 17.9 19.4 20.3 21.0 20.2
Sleep/tranquillizing medication (%) 5.4 6.6 6.9 7.1 7.3
Variables are described by means, and percentages in case of dichotomous variables.
Abbreviations are: BMI (Body Mass Index); and Lnight (road traffic noise - night level) (dB).
Figure 2.2 Prevalence of self-reported sleep problems in subjects of the GLOBE study
sample in relation to night time road traffic noise exposure at the home (Lnight) [dB]
unadjusted for confounders.

Chapter 2
32
Table 2.2 ORs for night time road traffic noise exposure (Lnight) (dB) , for markers of self-
reported sleep problems (tired and not rested in the morning, use of sleep or
tranquillizing medication) in the GLOBE study sample after adjustment for potential
confounders. ORs from logistic regression are shown, adjusted for age, sex, BMI,
exercise, marital status, work situation, financial difficulties, smoking, alcohol use,
education.
Group N OR
Lnight<35
OR
Lnight 35−40
OR
Lnight 40−45
OR
Lnight 45−50
OR
Lnight > 50
Tired, and not rested in
the morning
17,821 1.00 1.08
(0.95−1.22)
1.18
(1.03−1.34)*
1.26
(1.09−1.45)**
1.15
(1.00−1.33)*
Use of sleep- or
tranquillizing
medication
17,855
1.00
1.14
(0.92−1.41)
1.16
(0.93−1.44)
1.21
(0.96−1.54)
1.15
(0.92−1.45)
*Significant relationship (P < 0.05)
**bSignificant relationship (P < 0.01)
Figure 2.3 ORs for night time road traffic noise exposure for markers of self-reported
sleep problems (tired and not rested in the morning, use of sleep or tranquillizing
medication) in the GLOBE study sample after adjustment for confounders.
As shown in Table 2.2 and Figure 2.3, in the GLOBE study sample an association was
found between road traffic noise exposure (Lnight) and getting up tired and not rested in
the morning. Compared to the reference category (Lnight < 35 dB), the OR was higher in all
higher noise exposure categories. The ORs were found to increase with increasing noise
level, but showed a slight decrease in the highest exposure category. Overall, an OR of
1.08 was found (95% CI: 1.02–1.14) per 10 dB increase in Lnight. A sensitivity analysis was
carried out to explore the effect of the inclusion of additional variables. Additional

Long term road traffic noise exposure is associated with an increase in morning tiredness.
33
adjustment for major life events, and number of children living at home, and cold or
draught and dampness inside the dwelling did not substantially affect the association for
night time road traffic noise and getting up tired and not rested in the morning.
While the unadjusted results indicate there may be an association between road traffic
noise exposure and the use of sleep medication or tranquillizers, after adjustment for
potential confounders this relationship was not significant.
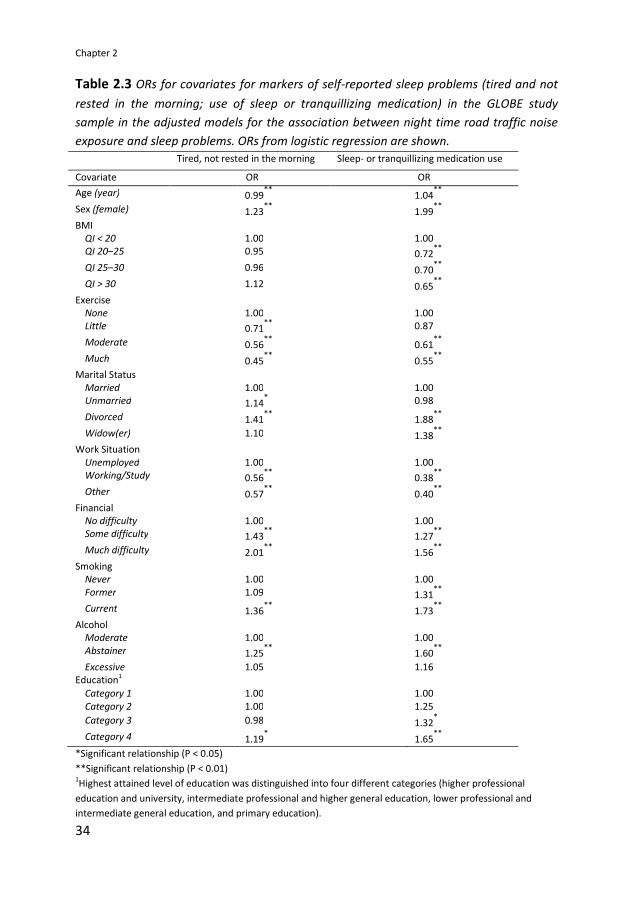
Table 2.3 shows the ORs for covariates, for markers of self-reported sleep problems
(tired and not rested in the morning, use of sleep or tranquillizing medication) in the
GLOBE study sample, in the adjusted models for the association between night time road
traffic noise exposure and sleep problems.
Chapter 2
34
Table 2.3 ORs for covariates for markers of self-reported sleep problems (tired and not
rested in the morning; use of sleep or tranquillizing medication) in the GLOBE study
sample in the adjusted models for the association between night time road traffic noise
exposure and sleep problems. ORs from logistic regression are shown.
Tired, not rested in the morning Sleep- or tranquillizing medication use
Covariate OR OR
Age (year) 0.99**
1.04**
Sex (female) 1.23**
1.99**
BMI QI < 20 1.00 1.00 QI 20–25 0.95 0.72
**
QI 25–30 0.96 0.70**
QI > 30 1.12 0.65**
Exercise None 1.00
1.00
Little 0.71**
0.87
Moderate 0.56**
0.61**
Much 0.45**
0.55**
Marital Status
Married 1.00 1.00 Unmarried 1.14
* 0.98
Divorced 1.41**
1.88**
Widow(er) 1.10 1.38**
Work Situation
Unemployed 1.00 1.00 Working/Study 0.56
** 0.38
**
Other 0.57**
0.40**
Financial No difficulty 1.00 1.00 Some difficulty 1.43
** 1.27
**
Much difficulty 2.01**
1.56**
Smoking Never 1.00 1.00
Former 1.09 1.31**
Current 1.36**
1.73**
Alcohol Moderate 1.00 1.00
Abstainer 1.25**
1.60**
Excessive 1.05 1.16 Education
1
Category 1 1.00 1.00
Category 2 1.00 1.25
Category 3 0.98 1.32*
Category 4 1.19*
1.65**
*Significant relationship (P < 0.05)
**Significant relationship (P < 0.01) 1Highest attained level of education was distinguished into four different categories (higher professional
education and university, intermediate professional and higher general education, lower professional and
intermediate general education, and primary education).

Long term road traffic noise exposure is associated with an increase in morning tiredness.
35
2.4 Discussion and conclusions
This study investigated the relationship between road traffic noise exposure during night
time and two indicators of sleep problems: getting up tired and not rested in the
morning, and the use of sleep or tranquillizing medication. After adjustment for potential
confounders, a significant association was found between road traffic noise exposure at
the home and the risk of getting up tired and not rested in the morning. Although the
prevalence of use of sleep or tranquillizing medication was higher at higher noise levels
compared to the reference category (Lnight <35 dB), after adjustment for potential
confounders this association was not significant. Thus, no evidence was found of an
effect of road traffic noise on sleep medication, although the findings do not contradict
the significant increase in prevalence with increasing aircraft noise exposure during the
late evening found by Franssen et al. (2004). The present finding on morning tiredness
adds to the evidence from community surveys and field studies that long-term traffic
noise is associated with self-reported sleep disturbance (Miedema and Vos, 2007) and
may adversely affect self-reported sleep quality (Franssen and Kwekkeboom, 2003).
Furthermore, the present results lend support to earlier indications from field studies
that traffic noise may have after-effects the following day (Carter, 1996; Ouis, 1999;
Öhrström, 1989; Öhrström and Skanberg, 2004). In addition, the results show that noise
exposure plays a role among all possible causes of sleep problems, a conclusion that
cannot be drawn on the basis of analyses with sleep disturbance questions explicitly
referring to noise, as in Miedema and Vos (2007). Night time road traffic volume has
previously been shown to be a risk factor for insomnia, and the prevalence of morning
tiredness was increased in the insomniacs as compared to the non-insomniacs
(Kageyama et al., 1997). The description of the different severity criteria of insomnia
(mild, moderate, and severe) includes “an almost nightly complaint of.... not feeling
rested after the habitual sleep episode” (The International Classification of Sleep
Disorders; ICSD). Since in our study night time road traffic noise exposure was found to
be associated with morning tiredness (getting up tired and not rested in the morning),
road traffic noise exposure may be hypothesized to induce or aggravate symptoms of
insomnia.
A slight decrease in relative risk estimate was found for the highest noise exposure
category. Similar to these findings, Öhrström et al. (2006a) found a decreasing effect of
Lnight on self-reported sleep quality in the highest noise category, which they attributed
to the increased tendency to sleep with closed windows. In a field study by Griefahn et
al. (2000), window closing behaviour was the primary variable associated with noise
levels outside. A survey by Öhrström et al. (2006b) showed that Lnight reduced both sleep
quality and sleeping with open window. Another factor that may explain this decrease in
effect is the self-selection of people less bothered by noise, particularly in areas with
very high exposures (noise sensitive subjects moving away from high exposure areas).
Chapter 2
36
Effects of high noise exposure may be partly masked by this selection mechanism. In
addition, better sound insulation of the dwellings of most exposed subjects, and choice
of bedroom location away from the source in reaction to exposure may affect relative
risk estimates, particularly in the highest noise exposure category. Unfortunately, no
data were available on noise sensitivity, dwelling insulation, choice of bedroom location,
or window opening behaviour to take these factors into account.
A limitation of the exposure assessment in this study is that road traffic noise data for
the current situation (2004) were used. Unfortunately, no historic data for 1991 were
available on traffic intensity and road characteristics such as road surface type and noise
screens. Although traffic intensities may have increased, the road network is assumed to
be rather stable, with only small (if any) changes in noise exposure across the population.
For example, a recent study showed that correlations between road traffic intensities for
a ten year period (1986-1996) in The Netherlands were high (>0.9) (Beelen et al., 2009).
If there is any effect of this limitation, it may be assumed that the actual association may
be slightly stronger than found.
No data were available on noise exposures inside the bedrooms of the respondents. Lnight
at the most exposed façade as metric characterises the exposure on one side of the
dwelling, while the subject may sleep on another side of the dwelling, which may be less
exposed. Having access to a quiet side of the dwelling has been found to reduce self-
reported sleep disturbance and tiredness (Bluhm et al., 2004; Öhrström et al., 2006b). In
addition to window opening behaviour of subjects, the difference between this outside
exposure level and the level inside the bedroom depends on the insulation of the façade.
However, the tendency of people to sleep with their windows open is expected to
reduce the variability in the outdoor – indoor difference.
Data for measures of sleep problems were available as dichotomous variables (response
format: “yes” or “no”). Refined measurement of the effects might have refined the
findings. If there would be an effect, it may be assumed the association found in this
study may be stronger still.
Strengths of the study include a number of aspects. First, the investigation was carried
out in a large random sample drawn from the general population. The large sample size
increases the power of the statistical analysis, while the population based design of the
study increases the possibility to extrapolate the results to the general population, as
compared to studies with smaller or non-random samples. In addition, the study was
carried out for a large region, including Eindhoven City, which was the fifth largest city of
The Netherlands at the start of the cohort study. As a result, there was a large variety in
road traffic noise exposure, which may be expected to be representative for urbanized
areas in general. The exposure was assessed with detailed noise models that take into

Long term road traffic noise exposure is associated with an increase in morning tiredness.
37
account the relevant small scale intra-urban spatial variation in the study area. This
approach reduces misclassification errors of noise exposure, which may occur in studies
where exposure is based on subjective information (e.g., questionnaire reporting on
traffic density or annoyance). Another strong point of this study was that it was not
directed to noise and its effects; thus no bias was introduced by subjects being triggered
to focus on road traffic noise exposure. Finally, we were able to minimise confounding by
adjusting for a large range of potential risk factors in the model, including age, sex, BMI,
exercise, marital status, work situation, financial difficulties, smoking, alcohol use, and
education. A sensitivity analysis was carried out to explore the effect of the inclusion of
additional variables. Additional adjustment for major life events, number of children
living at home, and cold or draught and dampness inside the dwelling did not
substantially affect the association between night time road traffic noise and morning
tiredness.
In conclusion, our results show that road traffic noise during the night is associated with
after-effects: an increased risk of subjects getting up tired and not rested in the morning.
These findings add to the evidence that residential road traffic noise exposure may cause
sleep disturbance and could be interpreted as a signal that noise-induced sleep
disturbance has significant implications for daily life in the general population.
Furthermore, noise exposure may induce or aggravate symptoms of insomnia. It
therefore appears to be important to increase awareness of transportation noise as a
factor affecting sleep. Reduction of these effects may require specialized advice, for
example, with respect to choice of bedroom location or measures of improving the
sound insulation of the bedroom.
References
Aasvang GM, Moun T, Engdahl B. Self-reported sleep disturbances due to railway noise:
Exposure-response relationships for nighttime equivalent and maximum noise levels. J
Acoust Soc Am. 2008;124(1):257–268.
Basner M, Samel A, Isermann U. Aircraft noise effects on sleep: Application of the results
of a large polysomnographic field study. J Acoust Soc Am. 2006;119(5): 2772–84.
Beelen R, Hoek G, Houthuijs D, Van den Brandt P, Goldbohm RA, Fischer P, Schouten LJ,
Armstrong B, Brunekreef B. The joint association of air pollution and noise from road
traffic with cardiovascular mortality in a cohort study. Occup Environ Med. 2009;66:243–
250.

Chapter 2
38
Berglund B, Lindvall T, Schwela DH. (1999). Guidelines for Community Noise. World
Health Organization: Protection of the Human Environment.
Bluhm G, Nordling E, Berglind N. Road traffic noise and annoyance — an increasing
environmental health problem. Noise Health 2004;6:43–49.
Borst HC, Miedema HME. Comparison of noise impact indicators, calculated on the basis
of noise maps of DENL. Acta Acustica 2005;91:378–385.
Carter NL, Hunyor SN, Crawford G, Kelly D, Smith AJ. Environmental noise and sleep — a
study of arousals, cardiac arrhythmia and urinary catecholamines. Sleep 1994;17:298–
307.
Carter NL. Transportation noise, sleep, and possible after-effects. Environ Int.
1996;22:105–116.
Di Nisi J, Muzet A, Ehrhart J, Libert JP. Comparison of cardiovascular responses to noise
during waking and sleeping in humans. Sleep 1990;13:108–120.
Drosopoulos S, Schulze C, Fischer S, Born J. Sleep's function in the spontaneous recovery
and consolidation of memories. J Exp Psychol Gen. 2007;136(2):169–83.
Elmenhorst EM, Elmenhorst D, Luks N, Maass H, Vejvoda M, Samel A. Partial sleep
deprivation: Impact on the architecture and quality of sleep. Sleep Med. 2008;9:840–
850.
Franssen EAM, Kwekkeboom JMI. Effecten van geluid door wegverkeer op de slaap. Een
systematische review van studies in de woonomgeving. (Effects of road traffic noise on
sleep. A systematic review of studies in de residential environment). Bilthoven: RIVM,
2003. Report 715120010/2003.
Franssen EAM, van Wiechen CMAG, Nagelkerke NJD, Lebret E. Aircraft noise around a
large international airport and its impact on general health and medication use. Occup
Environ Med. 2004;61:405–413.
Graham JMA, Janssen SA, Vos H, Miedema HME. Habitual traffic noise at home reduces
cardiac parasympathetic tone during sleep. Int J Psychophysiol. 2009;72(2):179-186.
Griefahn B, Schuemer-Kohrs A, Schuemer R, Moehler U, Mehnert P. Physiological,
subjective and behavioural responses during sleep to noise from rail and road traffic.
Noise Health. 2000;3:59–71.

Long term road traffic noise exposure is associated with an increase in morning tiredness.
39
Griefahn B, Bröde P, Marks A, Basner, M. Autonomic arousals related to traffic noise
during sleep. Sleep. 2008;31:569–577.
Harvey AG, Stinson K, Whitaker KL, Moskovitz D, Virk H. The subjective meaning of sleep
quality: a comparison of individuals with and without insomnia. Sleep. 2008;31:383–393.
HCN (Health Council of the Netherlands). (2004). The influence of night time noise on
sleep and health. Den Haag: Report 2004/14E.
Hofman WF, Kumar A, Tulen JHM. Cardiac reactivity to traffic noise during sleep in man. J
Sound Vib. 1995;179:577–589.
Holmes AL, Burgess HJ, Dawson D. Effects of sleep pressure on endogenous cardiac
autonomic activity and body temperature. J Appl Physiol. 2002;92:2578–2584.
Horne JA, Pankhurst FL, Reyner LA, Hume K, Diamond ID. A field study of sleep
disturbance: effects of aircraft noise and other factors on 5,742 nights of actimetrically
monitored sleep in a large subject sample. Sleep. 1994;17:146–159.
International Standards Organization. (2002). Acoustics—Description, measurement and
assessment of environmental noise: Part 2. Determination of environmental noise levels.
Rep. No. ISO/CD1996–2. Geneva, Switzerland.
Kageyama T, Kabuto M, Nitta H, Kurokawa Y, Taira K, Suzuki S, Takemoto T. A population
study on risk factors for insomnia among adult Japanese women: a possible effect of
road traffic volume. Sleep. 1997;20(11):963–971.
Langdon FJ, Buller IB. Road traffic noise and disturbance to sleep. J Sound Vib.
1977;50:13–28.
Mackenbach JP, Mheen H, Stronks K. A prospective cohort study investigating the
explanation of socioeconomic inequalities in health in The Netherlands. Soc Sci Med.
1994;38:299–308.
Marks A and Griefahn B. Associations between noise sensitivity and sleep, subjectively
evaluated sleep quality, annoyance, and performance after exposure to nocturnal traffic
noise. Noise Health. 2007;9:1–7.
Marshall L, Born J. The contribution of sleep to hippocampus-dependent memory
consolidation. Trends Cogn Sci. 2007;11(10):442–450.
Michaud DS, Fidell S, Pearsons K, Campbell KC, Keith SE. Review of field studies of aircraft
noise-induced sleep disturbance. J Acoust Soc Am. 2007;121(1):32–41.

Chapter 2
40
Miedema HME, Vos H. Associations between self-reported sleep disturbance and
environmental noise based on reanalyses of pooled data from 24 studies. Behav Sleep
Med. 2007;5(1):1–20.
Murphy TI, Richard M, Masaki H, Segalowitz SJ. The effect of sleepiness on performance
monitoring: I know what I am doing, but do I care? J Sleep Res. 2006;15: 15–21.
Muzet A. Environmental noise, sleep and health. Sleep Med Rev. 2007;11:135–142.
Öhrström E. Sleep disturbance, psycho-social and medical symptoms — a pilot survey
among persons exposed to high levels of road traffic noise. J Sound Vib. 1989;133:117–
128.
Öhrström E. Sleep disturbances caused by road traffic noise – studies in laboratory and
field. Noise Health. 2000;2(8):71–78.
Öhrström E, Skanberg A. Sleep disturbances from road traffic and ventilation noise—
laboratory and field experiments. J Sound Vib. 2004;271:279–296.
Öhrström E, Hadzibajramociv E, Holmes M, Svensson H.. Effects of road traffic noise on
sleep: studies on children and adults. J. Environ. Psych. 2006a;26:116–126.
Öhrström E, Skanberg A, Svensson H and Gidlöf-Gunnarsson A. Effects of road traffic
noise and the benefit of access to quietness. J Sound Vib. 2006b;295:40–59.
Ohayon MD. Prevalence and correlates of nonrestorative sleep complaints. Arch Intern
Med. 2005;165:35–41.
Ouis D. Exposure to nocturnal road traffic noise: Sleep disturbance and its after effects.
Noise Health. 1999;4:11–36.
Passchier-Vermeer W, Passchier WF. Noise exposure and public health. Environ Health
Perspect. 2000;108:123–131.
Passchier-Vermeer W, Vos H, Janssen SA, Miedema HME. (2007). Slaap en verkeersgeluid
(Sleep and traffic noise). Delft. TNO report 2007-D-R0012/A.
Pearsons KS, Barber DS, Tabachnick BG, Fidell S. Predicting noise-induced sleep
disturbance. J Acoust Soc Am. 1995;97:331–338.
Raidy DJ, Scharff LF. Effects of sleep deprivation on auditory and visual task. Percept Mot
Skills. 2005;101:451–467.

Long term road traffic noise exposure is associated with an increase in morning tiredness.
41
Scott LD, Hwang WT, Rogers AE, Nysse T, Dean GE, Dinges DF. The relationship between
nurse work schedules, sleep duration and drowsy driving. Sleep. 2007;30:1801–1807.
Siegel JM. Clues to the functions of mammalian sleep. Nature. 2005;437:1264–1271.
Spiegel K, Leproult R, Van Cauter E. Impact of sleep debt on metabolic and endocrine
function. Lancet. 1999;354:1435–1439.
Thiessen GJ, Lapointe AC. Effect of continuos traffic noise on percentage of deep sleep,
waking and sleep latency. J Acoust Soc Am. 1983;73(1):225–229.
VROM. (2006). Meet- en rekenvoorschrift geluidhinder 2006 (Prescribed measurement
and calculation methods for noise annoyance 2006). Staatscourant 21 december 2006a:
249, 84.
Wright CE, Erblicht J, Valdimarsdottir HB, Bovbjerg DH. Poor sleep the night before an
experimental stressor predicts reduced NK cell mobilization and slowed recovery in
healthy women. Brain Behav Immun. 2007;21:358–363.


Chapter 3
Hypertension and road traffic noise exposure
Yvonne de Kluizenaar
Ronald T. Gansevoort
Henk M.E. Miedema
Paul E. de Jong
Adapted from: J. Occup. Environ. Med. 2007; 49: 484-492*
*The text of this article has been updated with respect to current insights of the effects of combined exposure.

Chapter 3
44
Abstract
Objective: The purpose of this study was to assess the relationship between road traffic
noise exposure at home and the prevalence of hypertension.
Methods: We conducted cross-sectional analyses in a large random sample (N = 40,856)
of inhabitants of Groningen City, and in a subsample (the Prevention of Renal and
Vascular End-Stage Disease [PREVEND] study cohort; N = 8592).
Results: Before adjustment for confounders, road traffic noise exposure was associated
with self-reported use of antihypertensive medication in the city of Groningen sample
(odds ratio [OR] = 1.31 per 10 dB increase in Lden). Adjusted ORs were significant for the
subjects between 45 and 55 years old in the full model when adjusted for PM10 (OR =
1.19) and at higher exposure (Lden > 55 dB) only (OR= 1.21; with adjustment for PM10, OR
= 1.31). In the PREVEND cohort, the unadjusted odds ratio was 1.35 for hypertension
(systolic and diastolic blood pressure > 140 and > 90 mmHg, respectively, or use of
antihypertensive medication). Again, the adjusted odds ratio was significant for the
subjects between 45 and 55 years old (OR = 1.27; with adjustment for PM10, OR = 1.39).
Conclusions: Exposure to road traffic noise may be associated with hypertension in
subjects who are between 45 and 55 years old. Associations seemed to be stronger at
higher noise levels.

Hypertension and road traffic noise exposure
45
3.1 Introduction
There are indications that living near a major road can induce adverse health effects. It is
well-known that exposure to noise can cause noise annoyance and sleep disturbance.
For these effects, exposure-effect relationships have been presented (Miedema and
Oudshoorn, 2001; Pearsons et al., 1995). Over the last few decades, studies have been
conducted to determine if and how noise exposure may cause further adverse health
effects. Currently, there is increasing evidence that exposure to environmental noise can
induce stress-related health effects including hypertension and cardiovascular diseases
(Berglund et al., 2000; Gezondheidsraad; 2004; Babisch et al., 2000; Passchier-Vermeer
et al., 2000; Kempen et al., 2002; Babisch et al., 2001).
Early laboratory studies reviewed by Passchier-Vermeer (1993), have shown momentary
changes in the cardiovascular system induced by exposure to noise, including
vasoconstriction, electrocardiographic abnormalities and changes in heart rate.
Occupational noise studies provided evidence for an effect of noise exposure in the
working environment on hypertension (Passchier-Vermeer, 1993). Although these
findings indicate a link between noise exposure and cardiovascular effects, they give no
information as to what extent long-term noise exposure in the living environment may
affect cardiovascular health.
Few epidemiological studies have assessed the relationship between exposure to
transportation noise in the living environment and hypertension. Recent studies have
focussed on the effects of aircraft noise exposure and reported an association with
hypertension. In a meta-analysis, Van Kempen et al. (2002) concluded that there is a
significant association of aircraft noise exposure and hypertension, with an estimated
relative risk of 1.14 per 5 dB noise increase. However, from studies on the effects of
transportation noise on annoyance, it is known that people react to aircraft noise and
road traffic noise differently (Miedema et al., 2001). Therefore, it may be expected that
effects of exposure to road traffic noise are different. For road traffic noise, no
conclusion on how the exposure may affect hypertension can yet be drawn, and no
general exposure-response relationships have been derived (Kempen et al., 2002).
In previous studies on the effect of road traffic noise on hypertension, results may, to
some extent, have been distorted by limitations in the study sample (e.g., non-random
selection or relatively small sample), exposure assessment (e.g., subjectively defined
exposure), effect measure (e.g., subjectively defined hypertension), or control for
confounders. To our knowledge, one potentially important confounder that has not been
taken into account in road traffic noise effect studies is air pollution. Epidemiological
studies have been published that showed effects of road traffic-related air pollution on
cardiovascular endpoints (Pope et al., 2004; Hoek et al., 2002). Studies on the

Chapter 3
46
cardiovascular effects of air pollution have identified particulate matter (PM) as an
important pollutant in this respect. In addition to noise, road traffic is an important
source of air pollution. Therefore, in the study of the effects of road traffic noise on
hypertension, air pollution should be taken into account.
The objective of this study was to assess the relationship between road traffic noise
exposure at the home and hypertension. As far as we know, this study is the first to
investigate the relationship between road traffic noise exposure and hypertension in
such a large, population based sample (N = 40,856). We used objective measures for
noise exposure, and odds ratios are studied with adjustment for potential confounders,
taking air pollution into account in addition to common cardiovascular risk factors. In a
subsample, for which more detailed information on both the effect variables and
confounders was available, further analysis was carried out with objective measures for
hypertension and additional control for confounding. As noise annoyance meta-analysis
has revealed that the influence of noise is age dependent, with the strongest effects in
people around the age of 50 years compared with the effects in younger and older age
groups (Groothuis-Oudshoorn and Miedema, 2006), specific attention was paid to the
moderating role of age.
3.2 Material and Methods
3.2.1 Study population
We performed this study in the subjects who were participating in the Prevention of
Renal and Vascular ENd-Stage Disease (PREVEND) study. The PREVEND study was
designed to prospectively investigate the natural course of microalbuminuria and its
relation to renal and cardiovascular disease in a large cohort drawn from the general
population. Baseline data were collected in 1997 and 1998. Details of the study protocol
have been described elsewhere (Pinto-Sietsma et al., 2000), and will only be briefly
summarised here.
3.2.2 City of Groningen sample
All inhabitants of the city of Groningen (the Netherlands) between the age of 28 and 75
years, in total 85,421 subjects, were sent a one-page postal questionnaire on
demographics, use of medication, smoking behaviour, family history of cardiovascular
disease, and pregnancy. They also received a vial to collect an early morning urine
sample. Altogether, 40,856 people (47.8%) responded (referred to as the city of
Groningen sample). The subjects were defined as having hypertension when they

Hypertension and road traffic noise exposure
47
reported using medication for elevated blood pressure, and were classified as smokers if
they reported smoking or having smoked cigarettes during the previous 5 years. A family
history of cardiovascular disease was considered present if at least one first-degree
relative had documented angina pectoris, a myocardial infarction or a stroke before the
age of 65 years.
3.2.3 PREVEND cohort
Further analyses were carried out on a selection of subjects that visited the outpatient
clinic. This study cohort consists of all responding subjects with a morning urinary
albumin concentration of 10 mg/L or more, together with a randomly selected control
group of the total study population with morning urinary albumin excretion of <10 mg/L,
and who gave informed consent to participate in a long-term follow-up program.
Subjects with insulin-dependent diabetes and pregnant women were excluded.
Altogether 8592 subjects underwent a screening program of two visits in an outpatient
clinic. These visits included anthropometric measurements and fasting blood samples.
Both visits included blood pressure measurements with an automatic Dinamap device
(GE Medical Systems Information Technologies, Inc., Milwaukee, WI). Blood samples
were taken for various measurements, including fasting plasma levels of cholesterol. All
8592 subjects completed an extensive questionnaire on demographics; cardiovascular,
renal, and family medical history; use of antihypertensive medication; and smoking
status. Systolic and diastolic blood pressure measurements were calculated as the mean
of the last two of 10 successive measurements of the two visits. Hypertension was
defined as systolic blood pressure ≥ 140 mmHg, diastolic blood pressure of ≥ 90 mmHg,
or the use of antihypertensive medication based on pharmacy reports. Smoking was
defined as currently smoking or having stopped smoking less than 1 year ago. Education
was coded in two categories: university or higher professional education versus other. A
family history of cardiovascular heart disease (CHD) was considered present if at least
one parent had CHD before the age of 65. The PREVEND study was approved by the
Medical Ethics Committee and conducted in accordance with the guidelines of the
Declaration of Helsinki.
3.2.4 Environmental data
The road traffic noise exposure of the subjects was calculated at the most exposed
façade of the dwelling with standard method SKM2 (Standaard Karterings Methode 2 ) in
accordance with requirements of the European Environmental Noise Directive (END). For
the analyses, we used the EU standard noise metric Lden. Lden (day, evening, night level) is

Chapter 3
48
an “average” sound level for 24 hours in which sound levels during the evening and the
night are increased by 5 dB(A) and 10 dB(A), respectively. SKM2 is the sophisticated
version of the Netherlands’ standard method for noise modelling and producing noise
maps (VROM, 2004) in compliance with the END. SKM2 is implemented in Urbis (Borst
and Miedema, 2005) that was used here for the exposure calculations. Noise calculations
are carried out in two steps: calculating first the emission and then the transmission. The
emission calculations take into account traffic characteristics, including traffic intensities,
traffic composition (percentages of motorbikes, light-, medium-, and heavy-duty
vehicles), speed, type of road height and surface. The transmission calculations take into
account the distance between source (road) and dwelling façade, air attenuation, effects
of yearly meteorological conditions, ground attenuation, object screening, reflection of
objects opposite the dwelling, and statistical diffraction for transmission. Noise exposure
was calculated at the height of the centre of the dwelling façade of the exposed subject.
Very low levels of noise exposure (< 45 dB(A)) were recoded as 45 dB(A) since this was
considered to be a lower limit of the ambient noise in urban surrounding.
Input for the noise emission calculations were detailed digital maps describing traffic
characteristics for each road segment. The geographic location of roads in these maps
was extracted from the National Road Network (NWB; containing all streets, country
roads, and highways) obtained from the Netherlands Ministry of Housing, Spatial
Planning and the Environment / Directoraat-Generaal Ruimte (VROM/DGR). The traffic
flow data attached as attributes to the road segments were obtained from the local
authorities of Groningen for a dense network of roads, including highways, arterial
roads, main streets, and principal residential streets. The basis for the noise transmission
calculations was digital maps with precise information on the geographic situation of
buildings and ground characteristics (Topographic Service data [TOP10]; obtained from
VROM/DGR). Building height was derived from the Actual Height Information
Netherlands (AHN), a 5 x 5 m grid with height information based on laser altimetry. In
addition, a data set on the geographical location of noise screens with their height was
obtained from the local authorities. The geographic location of dwelling facades was
derived from the building façade dimensions, divided into dwellings on the basis of the
address coordinates available from the local authorities of Groningen.
In addition, we assessed exposure to air pollution to adjust for possible confounding. We
obtained PM10 concentrations using a combination of measurement data and modeling
techniques. Regional background concentrations based on measurement data were
used, supplemented with the calculated contribution of the local road traffic, to account
for the spatial variation within the city. Regional background concentrations were
available from the National Institute for Public Health and the Environment (RIVM),
which annually estimates the background concentrations based on measurement data of

Hypertension and road traffic noise exposure
49
the national air quality monitoring network (RIVM, 1993). Combining these monitoring
data and nation-wide air pollution modeling, each year they generate a national map (1
km x 1 km) of annual average concentrations for the most important components of air
pollution. Taking into account spatial gradients within the city, we obtained exposure
concentrations by summing the regional background concentration and the local traffic
contribution using the Netherlands’ standard Dutch models for local air pollution
calculations: the street model CAR II (e.g., Eerens et al., 1993; Boeft et al., 1996;
Teeuwisse, 2003) for the contribution of a street to locations in that street, and a
Gaussian (plume) dispersion model based on “Pluim” (the Netherlands’ national model
which is the default used to calculate annual average concentration contributions,
(Hanna et al., 1982) for all other contributions to a location from within the urban area.
PM10 emissions for the different vehicle categories (light-, medium-, and heavy duty
vehicles and busses), were calculated by multiplication of the amount of vehicles per
category by the speed-dependent national emission factor for that category, available
from the RIVM. The exposure to air pollution is described with the annual average
concentration, expressed in µg m-3
.
For the purpose of this study, additional data were collected on socio-economic status
(SES). Local indicators of poverty were available on a neighbourhood scale, from the
Central Bureau of Statistics (CBS) for 1997 (income distribution).
3.2.5 Statistical analysis
We performed logistic regression analysis to determine the association between
exposure to road traffic noise and hypertension. First, the association of noise with
hypertension was evaluated in the overall city of Groningen sample, in which the
presence of hypertension was defined by self-reported use of blood pressure-lowering
agents. Then, the association between noise and hypertension was further investigated
in the PREVEND cohort, for which more detailed data on both the effect variables and
confounders was available. Analysis was carried out with strictly objective measures of
hypertension: systolic blood pressure ≥ 140 mmHg diastolic blood pressure ≥ 90 mmHg,
or use of antihypertensive medication based on pharmacy reports.
Furthermore, additional adjustment for confounders was made. Various models were
fitted: first a model with noise exposure as the only predictor; second, a model
additionally adjusting for age and sex; third, a model additionally consisting of age, sex,
SES, family history of cardiovascular disease, smoking, and – for the PREVEND cohort –
body mass index (BMI), plasma cholesterol, and level of education. Finally a model was
used that, in addition, adjusted for air pollution. Missing values were excluded listwise.
Results are expressed as odds ratios (ORs) as an approximation of relative risk with the

Chapter 3
50
corresponding 95 % confidence intervals (CIs). A P value of at most 0.05 was considered
to be significant, and a P value between 0.05 and 0.1 was considered an indication of a
trend. Age, SES, BMI and cholesterol were entered as a continuous variable, whereas sex,
family history of smoking and education were entered as categorical variables. Subgroup
analyses were performed to investigate the moderating role of age, and to explore
differences between men and women, and possible differences at higher exposure of
noise. In addition, we investigated if there was a difference in effect between high and
low morning urinary albumin excretion, the inclusion criterion for the PREVEND cohort.
We performed analyses using the statistical software package SPSS version 12.01 (SPSS
Inc., Chicago, IL).
3.3 Results
Table 3.1a shows the characteristics of the city of Groningen sample and the PREVEND
cohort, respectively. The table shows that average noise levels (Lden in dB) are higher in
subjects with hypertension. Furthermore, people with hypertension more frequently
have a noise exposure (Lden) greater than 55 dB. They are generally older, seem to smoke
less frequently, are less likely to have university or higher professional education, and
live in an area with a neighbourhood SES below average.
Table 3.1b shows the population characteristics of the city of Groningen sample and the
PREVEND cohort, respectively, by exposure. The table shows that within subjects with
higher road traffic noise exposure, the prevalence of hypertension is higher.
Furthermore, the average age, BMI, and cholesterol level are higher, and subjects less
often have university or higher professional education, and subjects more often live in an
area with a neighbourhood SES below average.
At higher noise exposure, the strongest increase of prevalence of hypertension is found
in the 45 to 55 years-old age group; the oldest group showed a decrease. In the city of
Groningen sample, the prevalence antihypertensive medication changed from 1.9% to
2.2% (younger than 45 years), 8.8% to 9.8% (45 to 55 years), 19.9% to 20.4% (55 to 65
years), and 31.2% to 28.6% (older than 65 years). In the PREVEND cohort prevalence of
hypertension changed from 15.6% to 16.8% (younger than 45 years), 34.8% to 39.9% (45
to 55 years), 59.9% to 59.0% (55 to 65 years), and 77.2% to 77.0% (older than 65 years)
for Lden < 55 dB versus Lden > 55 dB.
Figure 3.1 shows the distribution of subjects over road traffic noise exposure classes and
pollution exposure classes (PM10; μg m-3
), for the city of Groningen sample and the
PREVEND cohort, respectively.

Hypertension and road traffic noise exposure
51
Table 3.1a Characteristics of the City of Groningen sample (n = 40,856) and the
PREVEND cohort (n = 8592) by hypertensionab
City of Groningen sample PREVEND cohort
No AHT AHT No HT HT
N 34,492 4357 4437 2827
Male (%) 45.9 41.6***
41.7
58.6***
Age (years) 48.0 (12.4) 61.1 (9.7)***
45.5 (11.1) 57.9 (11.4)***
Smoking (%) 43.5 29.0***
42.0
31.1***
SES > mean (%) 38.0 26.8***
41.3
31.9***
Fam. hist. CVD
(1st
degree relative) (%)
29.3 41.0***
28.9 37.8***
Lden mean (dB) 53.3 (6.9) 54.6 (7.0)***
52.8 (6.8) 54.3 (7.0)***
Lden ≥ 55 dB (%) 39.6 47.6***
36.8
46.2***
PM10 median (µg m-3
) 33.5
(32.8-37.5)
33.6
(32.9-37.6)***
33.4
(32.8-37.1)
33.6
(32.8-37.5)***
PM10 > 34 (%) 31.3 36.8***
29.0 35.2***
Self reported AHT (%) 0 100***
0.8
34.4***
Caucasian % NA NA 96.1
97.4**
BMI kg/m2 NA NA 25.2 (3.9) 28.0 (4.3)
***
Cholesterol mmol/L NA NA 5.5 (1.1) 6.0 (1.1)***
SBP mmHg NA NA 118.6 (11.1) 149.9 (18.8)***
DBP mmHg NA NA 70.1 (7.3) 81.9 (9.4)***
Education: university/higher
professional (%)
NA NA 45.9
26.5***
Pharmacy based AHT (%) NA NA 0 47.2***
* P<0.05 versus no (A)HT; ** P<0.01 versus no (A)HT; *** P<0.001 versus no (A)HT aVariables are described by means (SD), or median (range 5
th and 95
th percentiles) in case of skewed
distribution, and percentages in case of dichotomous variables. bGroups of cases are compared by chi-square (percentages) and Mann-Whithey statistics (means and
medians).
AHT= antihypertensive treatment; SES = social economic status; CVD = cardiovascular disease; Lden noise:day-
evening-night level; PM10 = particulate matter; BMI = body mass index; SBP = systolic blood pressure; DBP =
diastolic blood pressure; NA = not available; PREVEND = Prevention of Renal and Vascular End-Stage Disease
study.

Chapter 3
52
Table 3.1b Characteristics of the City of Groningen sample (n = 40,856) and the
PREVEND cohort (n = 8,592) by road traffic noise exposureab
City of Groningen sample PREVEND cohort Lden < 55 Lden > 55 Lden < 55 Lden > 55
N 23134 15715 4325 2939
Male (%) 46.1 44.7**
49.7 50.2
Age (years) 48.0 (12.2) 51.7 (13.4)***
47.7 51.6***
Smoking (%) 43.0 40.6***
38.2 36.9
SES > mean (%) 38.9 33.1***
40.4 33.7***
Fam. hist. CVD
(1st degree relative) (%)
30.3 30.9
31.5 32.4
PM10 median (µg m-3
) 33.3 (32.8-34.0) 34.6 (33.4-38.9)***
33.3 (32.8-34.0) 34.6 (33.4-38.9)***
PM10 > 34 (%) 4.0 73.0***
4.2 72.5***
Self reported AHT (%) 9.9 13.2***
10.0 13.6***
Caucasian % NA NA 96.3 97.0
BMI kg/m2 NA NA 26.0 (4.2) 26.3 (4.2)
***
Cholesterol mmol/L NA NA 5.6 (1.1) 5.7 (1.1)**
SBP mmHg NA NA 127.7 (19.6) 131.3 (21.2)***
DBP mmHg NA NA 73.7 (9.7) 74.6 (9.9)***
Education: university/higher
professional (%)
NA NA 43.3 37.4***
Pharmacy based AHT (%) NA NA 14.9 19.9***
Hypertension (%) 35.1 44.5***
* P<0.05 versus no (A)HT; ** P<0.01 versus no (A)HT; *** P<0.001 versus no (A)HT aVariables are described by means (SD), or median (range 5th and 95th percentiles) in case of skewed
distribution, and percentages in case of dichotomous variables. bGroups of cases are compared by χ
2 (percentages) and Mann-Whithey statistics (means and medians)
AHT= antihypertensive treatment; SES = social economic status; CVD = cardiovascular disease; Lden noise:day-
evening-night level; PM10 = particulate matter; BMI = body mass index; SBP = systolic blood pressure; DBP =
diastolic blood pressure; NA = not available; PREVEND = Prevention of Renal and Vascular End-Stage Disease
study.
Figure 3.1 Distribution of exposure of subjects at their home for the City of Groningen
sample (%) and the PREVEND cohort over road traffic noise classes (Lden) [dB] and over air
pollution classes (PM10; μg m-3
).

Hypertension and road traffic noise exposure
53
In Groningen the spatial variation in noise exposure is substantial, with a difference in
exposure between the lowest and highest 5% of dwellings in the city exceeding 20 dB(A)
for road traffic noise (Lden), ranging from about 45 dB (urban background) to more than
65 dB (Lden) in the vicinity of busy roads. The variation in annual average PM10
concentration is much smaller. The total concentration in Groningen, as in many cities, is
dominated by the contribution of sources outside the city (regional background) and is,
to a much smaller extent, affected by the local traffic contribution. Exposure ranged from
around 33 µg m-3
for the lowest 5%, to more than 37.5 µg m-3
for the highest 5%,
respectively. The correlation between road traffic noise and PM10 is r = 0.72.
In the city of Groningen sample, an association was found between exposure toroad
traffic noise (day-evening-night level; Lden) and hypertension (defined as self-reported
use of antihypertensive medication). A significant odds ratio was found of 1.31 (95% CI =
1.25-1.37) per 10 dB(A) increase in noise level. However, after adjustment for
confounders, the odds ratio became smaller and non-significant. Odds ratios and 95%
confidence intervals obtained by logistic regression are presented in Table 3.2, for four
different models. Odds ratios are shown for the sample as a whole and also for
subgroups within the sample. In the unadjusted model, significant associations were
found in most subgroups (OR = 1.10 to 1.40), but not for the age groups of subjects
younger than 45 and older than 65 years. After adjustment for age, sex, smoking, family
history of CVD, and SES, odds ratios were highest for the 45- to 55-years-old age group
with 1.08 (95% CI = 0.97–1.20) and the subgroup with “high” noise exposure (Lden ≥ 55)
with 1.21 (95% CI = 1.05-1.38). When additionally adjusting for air pollution, the effects
of road traffic noise did not wane, with odds ratios of 1.19 (95% CI = 1.02-1.40) and 1.31
(95% CI = 1.08-1.59) respectively. No differences were found between men and women.
Furthermore, no differences were found between the subgroups with high (UAC ≥ 10 mg
L-1
) and low (UAC < 10 mg L-1
) morning Urinary Albumin Excretion.

Chapter 3
54
Table 3.2 Odds ratios for a 10 dB increase of road traffic noise exposure (day-evening-
night level; Lden) for self reported use of medication for hypertension in pre-specified
subgroups of the City of Groningen sample. Odds ratios from logistic regression in each
subgroup are shown, for different models: (1) unadjusted; (2) adjusted for age and sex;
(3) adjusted for age, sex, smoking, family history CVD, SES; (4) and the same model
including adjustment for air pollution (PM10).
N OR
(unadjusted)
OR
(age,sex adjusted)
OR
(full model)
OR
(full model + PM10)
All 38849 1.31 (1.25-1.37)**
1.01 (0.96-1.06)
1.01 (0.96-1.06)
1.03 (0.96-1.11)
Sex
Male 17652 1.22 (1.14-1.31)**
0.99 (0.92-1.06)
0.99 (0.92-1.07)
1.03 (0.92-1.15)
Female 21197 1.38 (1.30-1.46)**
1.03 (0.97-1.10)
1.02 (0.95-1.09)
1.03 (0.94-1.13)
Age (year)
< 45 15562 0.96 (0.81-1.15)
1.00 (0.84-1.19)
1.00 (0.84-1.19)
1.12 (0.90-1.40)
45-55 9637
1.13 (1.02-1.26) **
1.10 (0.99-1.22)* 1.08 (0.97-1.20)
1.19 (1.02-1.40)
**
55-65 7089 1.10 (1.01-1.20) **
1.08 (0.99-1.18)*
1.07 (0.98-1.17)
1.02 (0.90-1.17)
> 65 6561 0.95 (0.88-1.03)
0.94 (0.87-1.01) 0.94 (0.87-1.01)*
0.93 (0.83-1.04)
Noise
(Lden,dBA)
< 55 23134 1.40 (1.23-1.61)**
1.02 (0.88-1.19)
1.06 (0.91-1.23)
1.09 (0.94-1.27)
≥ 55 15715 1.31 (1.16-1.48)**
1.21 (1.06-1.39)**
1.21 (1.05-1.38)**
1.31 (1.08-1.59)**
UAC (mg/L)
< 10 29363 1.36 (1.29-1.44)**
1.04 (0.99-1.11)
1.03 (0.97-1.09)
1.03 (0.95-1.12)
≥ 10 9485 1.19 (1.10-1.29)**
0.93 (0.85-1.02)
0.94 (0.86-1.04)
1.02 (0.89-1.17)
* Indication of a trend (p < 0.1)
** Significant relationship (p < 0.05)
When we studied these relationships in greater detail in the PREVEND cohort, using the
more detailed data on both effect parameters and confounders, we found similar results
for overall hypertension (systolic blood pressure ≥140 mmHg, diastolic blood pressure
≥90 mmHg or the use of antihypertensive medication based upon pharmacy reports).
Table 3.3 shows significant associations between road traffic noise exposure and
hypertension for the cohort as a whole, as well as in most subgroups (unadjusted odds
ratios ranging from 1.24 to 1.42). For the PREVEND cohort, the unadjusted odds ratio
was 1.35 (95% CI = 1.27-1.45) per 10 dB(A) increase in exposure to road traffic noise.
After adjustment for age, sex, BMI, smoking, cholesterol, family history of CVD,
education, and SES, associations were still significant in the 45 to 55year-old age group,
with an adjusted odds ratio of 1.27 (95% CI = 1.08 – 1.49). With additional adjustment for
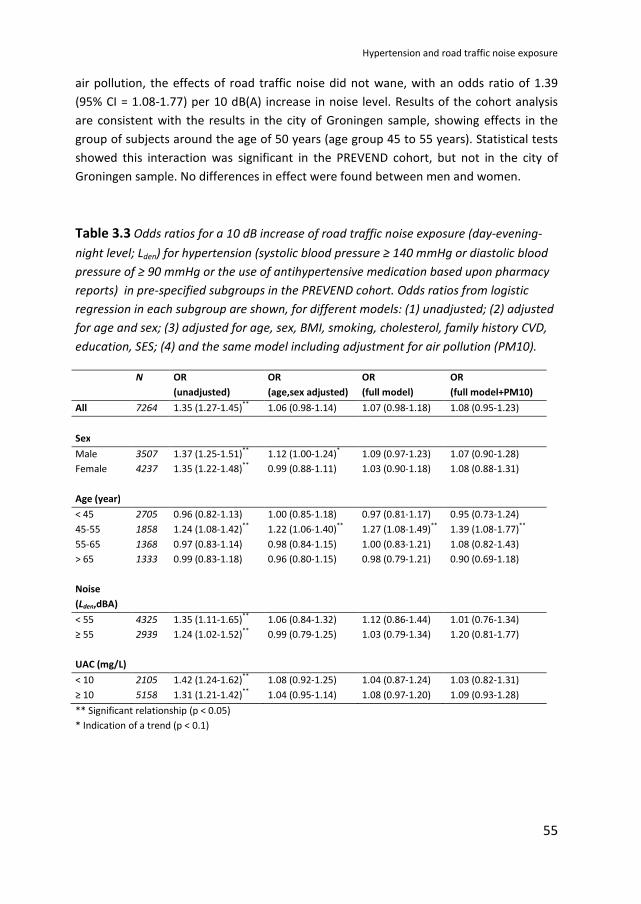
Hypertension and road traffic noise exposure
55
air pollution, the effects of road traffic noise did not wane, with an odds ratio of 1.39
(95% CI = 1.08-1.77) per 10 dB(A) increase in noise level. Results of the cohort analysis
are consistent with the results in the city of Groningen sample, showing effects in the
group of subjects around the age of 50 years (age group 45 to 55 years). Statistical tests
showed this interaction was significant in the PREVEND cohort, but not in the city of
Groningen sample. No differences in effect were found between men and women.
Table 3.3 Odds ratios for a 10 dB increase of road traffic noise exposure (day-evening-
night level; Lden) for hypertension (systolic blood pressure ≥ 140 mmHg or diastolic blood
pressure of ≥ 90 mmHg or the use of antihypertensive medication based upon pharmacy
reports) in pre-specified subgroups in the PREVEND cohort. Odds ratios from logistic
regression in each subgroup are shown, for different models: (1) unadjusted; (2) adjusted
for age and sex; (3) adjusted for age, sex, BMI, smoking, cholesterol, family history CVD,
education, SES; (4) and the same model including adjustment for air pollution (PM10).
N OR
(unadjusted)
OR
(age,sex adjusted)
OR
(full model)
OR
(full model+PM10)
All 7264 1.35 (1.27-1.45)**
1.06 (0.98-1.14)
1.07 (0.98-1.18)
1.08 (0.95-1.23)
Sex
Male 3507 1.37 (1.25-1.51)**
1.12 (1.00-1.24)* 1.09 (0.97-1.23)
1.07 (0.90-1.28)
Female 4237 1.35 (1.22-1.48)**
0.99 (0.88-1.11)
1.03 (0.90-1.18)
1.08 (0.88-1.31)
Age (year)
< 45 2705 0.96 (0.82-1.13)
1.00 (0.85-1.18)
0.97 (0.81-1.17)
0.95 (0.73-1.24)
45-55 1858 1.24 (1.08-1.42)**
1.22 (1.06-1.40)**
1.27 (1.08-1.49)**
1.39 (1.08-1.77)**
55-65 1368 0.97 (0.83-1.14)
0.98 (0.84-1.15)
1.00 (0.83-1.21)
1.08 (0.82-1.43)
> 65 1333 0.99 (0.83-1.18)
0.96 (0.80-1.15)
0.98 (0.79-1.21)
0.90 (0.69-1.18)
Noise
(Lden,dBA)
< 55 4325 1.35 (1.11-1.65)**
1.06 (0.84-1.32)
1.12 (0.86-1.44)
1.01 (0.76-1.34)
≥ 55 2939 1.24 (1.02-1.52)**
0.99 (0.79-1.25)
1.03 (0.79-1.34)
1.20 (0.81-1.77)
UAC (mg/L)
< 10 2105 1.42 (1.24-1.62)**
1.08 (0.92-1.25)
1.04 (0.87-1.24)
1.03 (0.82-1.31)
≥ 10 5158 1.31 (1.21-1.42)**
1.04 (0.95-1.14)
1.08 (0.97-1.20)
1.09 (0.93-1.28)
** Significant relationship (p < 0.05)
* Indication of a trend (p < 0.1)

Chapter 3
56
3.4 Discussion and Conclusions
Without adjustment for confounders, an association was found between exposure to
road traffic noise and hypertension. Unadjusted odds ratios ranged from 1.31 to 1.35 per
10 dB increase in noise level (Lden) in the total samples. However, after adjustment for
confounders, these odds ratios became smaller and not significant.
Investigation by analyses per subgroup of a possible moderating effect of age showed
strongest associations in the age group of subjects between 45 and 55 years old. After
adjustment for confounders, odds ratios were highest in this age group for self-reported
antihypertensive medication use in the city of Groningen sample. Further analysis in the
PREVEND cohort showed similar results. Significant associations for hypertension were
shown for the subjects who were between 45 and 55 years old. Thus, our results suggest
an interaction between exposure to noise and age, with effects occurring in middle-aged
adults (45 to 55 years). Statistical tests showed the interaction was significant in the
PREVEND cohort, but not in the city of Groningen sample.
Relative risk estimates for subjects younger than 45 years were not significant. This
might be explained by a lack of power, as a result of low prevalence of hypertension at a
younger age. Furthermore, some of the subjects in this age group might suffer from
secondary hypertension. At an older age, hypertension is relatively common. It is not
clear why the estimated relative risk is not significantly different in subjects older than 55
years, although the risk does seem to be elevated in the respondents between 45 and 55
years old. A possible explanation is that the influence of environmental exposure might
become relatively less dominant compared with that of other risk factors, by an overall
decrease in health status in the older population. Alternatively, it might be a true effect
that subjects who are between 45 and 55 years old might be more sensitive to exposure
to road traffic noise, compared with younger and older subjects. This would be
consistent with noise annoyance studies. A large meta analysis showed an inverted U-
shaped relationship of noise annoyance with age, with highest effects occurring around
the age of 50 years (Groothuis-Oudshoorn and Miedema, 2006).
We explored if noise effects were different at higher noise levels. After adjustment for
confounders, a stronger association was found for subjects exposed to higher noise
levels (Lden > 55 dB) in the city of Groningen sample. In analogy, further analysis in the
PREVEND cohort showed higher adjusted odds ratios when adjusted for PM10 at higher
noise levels for hypertension, although this did not reach significance. A stronger
reaction to higher noise exposure may be explained by a threshold for effects, or by a
non-linear exposure-effect relationship. However, in further analysis, this could not be
conclusively confirmed.

Hypertension and road traffic noise exposure
57
No differences in effect between men and women were found. Previous studies on road
traffic noise and hypertension reported higher prevalence of hypertension in men who
reported to live in a busier street (Herbold et al., 1989) and higher self reported use of
antihypertensive medication use in men who reported a higher annoyance score
(Belojevic and Saric-Tanaskovic, 2002). On the other hand, a large recent Swedish study
reported an association between noise and self reported hypertension for women, but
not for men (Björk et al, 2006). An older study reported no significant differences in
hypertension between noisy and quiet streets for housewives between 40 and 49 years
old (Knipschild et al., 1979); men were not included in the study. In these studies no
actual noise levels were available, and subjective measures of exposure were used. In
the Cearphilly and Speedwell studies, effects of road traffic noise on cardiovascular
health (ischemic heart disease) were examined in middle-aged men. These studies did
assess actual levels of noise exposure at the home, although they did not specifically
focus on the relationship of noise exposure to hypertension. They presented results for
blood pressure as a cardiovascular risk factor. Both positive and negative associations for
noise exposure and measured blood pressure were reported (Babisch et al., 1988;
Babisch, et al., 1993; Babisch et al., 1999). To our knowledge, the use of blood pressure-
lowering medication was not included in the analysis. Because a substantial percentage
of middle aged men uses anti-hypertensive medication, this may have influenced the
findings.
The present results show that the effects of road traffic noise on hypertension do not
wane when we adjust for air pollution; instead, they seem to become even more
pronounced. These outcomes strongly suggest that effects of noise on hypertension
cannot be explained by an association between noise and air pollution, and air pollution
being the true cause of effects.
Recently, a number of new studies have become available investigating the relationship
between road traffic noise and hypertension, taking into account air pollution (Foraster
et al., 2014; Babisch et al., 2014; Sørensen et al., 2011). In addition, a number of studies
have become available focusing on the association between traffic noise and blood
pressure, while taking air pollution into account (Liu et al., 2014; Bilenko et al., 2013;
Dratva et al., 2012). In a recent systematic review of studies into cardiovascular effects of
traffic related noise and air pollution, Tetreault et al. (2013) concluded that the available
studies suggest that confounding between noise and air pollution is limited, in line with
the results of this study. However, the number of studies that is currently available is still
limited, and there are large methodological differences between studies. Therefore, it
still seems too early for strong conclusions on potential confounding or interaction. More
studies are needed to assess the relative contribution of road traffic noise and air
pollution.

Chapter 3
58
The pathway for cardiovascular health effects of environmental noise exposure is
hypothesized to involve stress reactions related to noise exposure (Ising et al., 1999).
After disturbance of activities, communication or sleep, exposure to noise may directly
or indirectly lead to activation of the sympathetic system and the endocrine system
(hypothalamus-pituary-adrenal [HPA] axis), resulting in increased heart rate with
reduced variability and elevated levels of cortisol. This might, possibly in combination
with other factors, lead to increases in biological risk factors (e.g., increase in blood
lipids, blood pressure, blood glucose, and blood viscosity). Increases in biological risk
factors may induce manifest diseases (e.g., hypertension, arteriosclerosis, ischemic heart
disease) (Babisch et al., 2001; Babisch et al., 2003). Associations between long-term
exposure to environmental noise in the residential environment and cardiovascular
health have been found previously. Epidemiological studies indicate that environmental
noise exposure increases the risk for cardiovascular diseases in adults (Babisch et al.,
2000; Van Kempen et al., 2002; Babisch et al., 1999; Babisch et al., 2003; Babisch et al.,
2004; Babisch et al., 2005). Our results suggest that hypertension in middle-aged people
(45 to 55 years old) may mediate the influence of noise on cardiovascular disease.
When generalizing the relative risk estimates for the population in the city of Groningen
to other cities, some aspects need consideration. Results of this study have to be
confirmed in different populations. Potentially relevant differences with other cities may
include traffic composition, exposure, and population characteristics. Traffic composition
in Groningen may be fairly representative for that in an average sized city. Groningen
comprises a large variety in road types, including a number of highways, large arterial
roads, and a busy ring road. The population of Groningen is relatively homogenous.
There is little ethnic variety. More than 95% of the population is Caucasian.
There was a limited variation in exposure to air pollution (PM10) within the population of
Groningen. This may be why no significant contribution to the relative risk for
hypertension was found for exposure to air pollution. As far as there were variations in
exposure to air pollution, these were accounted for in our most extended models.
The location of busy roads may influence the social structure of the population, for
example, by attraction of people with a lower social economic status to noisy areas
through lower housing prices. To account for this, we adjusted for a neighborhood
indicator of poverty, and in the PREVEND cohort, we added education as an indicator of
SES and BMI as anindicator of lifestyle. After adjustment for age and sex, additionally
adjusting for other variables did not substantially change relative risk estimates.
The PREVEND cohort is a subsample of the initial random city of Groningen sample,
consisting of the subjects with a morning urinary albumin concentration greater than 10
mg L-1
, supplemented with a random subsample. It is unknown to what extent this

Hypertension and road traffic noise exposure
59
enrichment for albuminuria may have affected relative risk estimates. However, results
show no substantial differences in relative risk estimates between subjects with low and
subjects with elevated morning UAC.
To our knowledge, this is the first time that the effects of road traffic noise exposure in
the residential environment on hypertension are studied in such a large random sample.
Instead of using subjective measures, as in some previous studies (e.g., self-reported
annoyance or road type), we used objectively assessed levels of road traffic noise,
enabling us to quantitate relative risk estimates by increase in noise level. A unique
aspect of this study on the effects of exposure to road traffic noise was that, in addition
to common cardiovascular risk factors, exposure to air pollution was taken into account.
Thus, the investigation of an independent contribution of exposure to road traffic noise
to hypertension was made possible.
The PREVEND cohort provided an additional opportunity for further analysis. In this
subsample, more detailed information on both the effect variables and confounders was
available. For the subjects in this cohort, measurements of systolic and diastolic blood
pressure were available. In addition, pharmacy-based data on use of antihypertensive
medication were available. Combined, these data form a strictly objective measure of
overall hypertension. This measure may be most accurate in capturing all people with
hypertension (also those who do not know they have hypertension), because it includes
both people who are on hypertensives and those who are not.
Although the relative risks estimates for the age group between 45 and 55 years old may
be rather small, the public health impact may be substantial. Because hypertension is
common at this age, and a large percentage of the population is exposed to substantial
levels of road traffic noise, a relative risk of 1.2 to 1.4 may yield a substantial increase in
the prevalence of hypertension and possibly cardiovascular disease. This study shows
that it is plausible that, like aircraft noise (Rosenlund et al., 2001; Franssen et al., 2004),
road traffic noise may be associated with hypertension. In the general population,
compared with aircraft noise, a relatively high percentage of people are exposed to road
traffic noise. Therefore, the latter may even be more of a public health problem.

Chapter 3
60
References
Babisch W, Gallacher JE, Elwood PC, Ising H. Traffic noise and cardiovascular risk. The
Caerphilly study, first phase. Outdoor noise levels and risk factors. Arch Environ Health.
1988;43:407-414.
Babisch W, Ising H, Gallacher JE, Sharp DS, Baker IA. Traffic noise and cardiovascular risk:
the Speedwell study, first phase. Outdoor noise levels and risk factors. Arch Environ
Health. 1993;48:401-405.
Babisch W, Ising H, Gallacher JE, Sweetnam PM, Elwood PC. Traffic noise and
cardiovascular risk: the Caerphilly and Speedwell studies, third phase--10-year follow up.
Arch Environ Health. 1999;54:210-216.
Babisch W. Traffic Noise and Cardiovascular Disease: Epidemiological Review and
Synthesis. Noise Health. 2000; 2:9-32.
Babisch W, Fromme H, Beyer A, Ising H. Increased catecholamine levels in urine in
subjects exposed to road traffic noise. The role of stress hormones in noise research.
Environ Int. 2001;26:475-481.
Babisch W, Ising H, Gallacher JE. Health status as a potential effect modifier of the
relation between noise annoyance and incidence of ischaemic heart disease. Occup
Environ Med. 2003;60:739-745.
Babisch W. Health aspects of extra-aural noise research. Noise Health. 2004;6:69-81.
Babisch W, Beule B, Schust M, Kersten N, Ising H. Traffic noise and risk of myocardial
infarction. Epidemiology. 2005;16:33-40.
Babisch W, Wolf K, Petz M, Heinrich J, Cyrys J, Peters A. Associations between traffic
noise, particulate air pollution, hypertension, and isolated systolic hypertension in
adults: the KORA study. Environ Health Perspect. 2014;122(5):492-8.
Belojevic G, Saric-Tanaskovic M. Prevalence of Arterial Hypertension and Myocardial
Infarction in Relation to Subjective Ratings of Traffic Noise Exposure. Noise Health.
2002;4:33-37.

Hypertension and road traffic noise exposure
61
Berglund, B, Lindvall, T, Schwela, D, and Goh, KT. Guidelines for Community Noise.
Geneva: Word Health Organization; 2000.
Bilenko N, Rossem LV, Brunekreef B, Beelen R, Eeftens M, Hoek G, et al. Traffic-related
air pollution and noise and children's blood pressure: results from the PIAMA birth
cohort study. Eur J Prev Cardiol. 2013; DOI: 10.1177/2047487313505821.
Björk J, Ardö J, Stroh E, Lövkvist H, Östergen P, Albin M. Road traffic noise in southern
Sweden and its relation to annoyance, disturbance of daily activities and health. Scand J
Work Environ Health. 2006;32(5):392-401.
Boeft J. den, Eerens H.C., Tonkelaar W.A.M. den, and ZandVeld P.Y.J. CAR International:
A simple model to determine city street air quality. Sci Total Environ 1996: 190:321–326.
Borst, HC and Miedema HME. Comparison of noise impact indicators, calculated on the
basis of noise maps of DENL. Acta Acust. 2005;91, 378–385.
Dratva J, Phuleria HC, Foraster M, Gaspoz JM, Keidel D, Künzli N, Liu LJ, Pons M, Zemp E,
Gerbase MW, Schindler C. Transportation noise and blood pressure in a population-
based sample of adults. Environ Health Perspect. 2012; 120(1):50-5.
Eerens, HC, Sliggers, CJ, and Van den Hout, KD. The CAR model: The Dutch method to
determine city street air quality. Atm Environ. 1993; 27b[4]: 389-399.
Foraster M, Künzli N, Aguilera I, Rivera M, Agis D, Vila J, Bouso L, Deltell A, Marrugat J,
Ramos R, Sunyer J, Elosua R, Basagaña X. High blood pressure and long-term exposure to
indoor noise and air pollution from road traffic. Environ Health Perspect.
2014;122(11):1193-200.
Franssen EAM, van Wiechen CM, Nagelkerke NJ, Lebret E. Aircraft noise around a large
international airport and its impact on general health and medication use. Occup Environ
Med. 2004;61:405-413.
Gezondheidsraad. The influence of night-time noise on sleep and health. Den Haag:
Gezondheidsraad; 2004/14E, 1-196.
Groothuis-Oudshoorn, K. and Miedema, HME. Multilevel grouped regression for
analyzing self-reported health in relation to environmental factors: the model and its
application. Biometrical Journal. 2006; 48[1]: 67-82.

Chapter 3
62
Hanna S.R., Briggs G.A. and Hosker R.P. jr., Handbook on Athmospheric Diffusion, US
DOE, 1982.
Herbold M, Hense HW, Keil U. Effects of road traffic noise on prevalence of hypertension
in men: results of the Luebeck Blood Pressure Study. Soz Praventivmed. 1989;34:19-23.
Hoek G, Brunekreef B, Goldbohm S, Fischer P, van d. Association between mortality and
indicators of traffic-related air pollution in the Netherlands: a cohort study. Lancet.
2002;360:1203-1209.
Ising H, Babisch W, Günther T. Work noise as a risk factor in myocardial infarction. J Clin
Basic Cardiol. 1999;2:64-68.
Kempen EEEM, Kruize H, Boshuizen HC, Ameling CB, Staatsen BA, de Hollander AE. The
association between noise exposure and blood pressure and ischemic heart disease: a
meta-analysis. Environ Health Perspect. 2002;110:307-317.
Knipschild P, Salle H. Road traffic noise and cardiovascular disease. A population study in
The Netherlands. Int Arch Occup Environ Health. 1979;44:55-59.
Liu C, Fuertes E, Tiesler CM, Birk M, Babisch W, Bauer CP, Koletzko S, von Berg A,
Hoffmann B, Heinrich J; GINIplus and LISAplus Study Groups. The associations between
traffic-related air pollution and noise with blood pressure in children: results from the
GINIplus and LISAplus studies. Int J Hyg Environ Health. 2014;217(4-5):499-505.
Miedema HME, Oudshoorn CGM. Annoyance from transportation noise: relationships
with exposure metrics DNL and DENL and their confidence intervals. Environ Health
Perspect. 2001;109:409-416.
Passchier-Vermeer W, Passchier WF. Noise exposure and public health. Environ Health
Perspect. 2000;108:123-131.
Passchier-Vermeer, W. Noise and health: review. Den Haag: Gezondheidsraad; 1993:
Report nr A93/02E.
Pearsons KS, Barber DS, Tabachnick BG, Fidell S. Predicting noise-induced sleep
disturbance. J Acoust Soc Am. 1995;97:331-338.

Hypertension and road traffic noise exposure
63
Pinto-Sietsma SJ, Janssen WMT, Hillege HL et al. Urinary albumin excretion is associated
with renal functional abnormalities in a nondiabetic population. J Am Soc Nephrol.
2000;11:1882-1888.
Pope CA, Burnett RT, Thurston GD et al. Cardiovascular mortality and long-term exposure
to particulate air pollution: epidemiological evidence of general pathophysiological
pathways of disease. Circulation. 2004;109:71-77.
Rosenlund M, Berglind N, Pershagen G, Jarup L, Bluhm G. Increased prevalence of
hypertension in a population exposed to aircraft noise. Occup Environ Med.
2001;58:769-773.
Sørensen M, Hvidberg M, Hoffmann B, Andersen ZJ, Nordsborg RB, Lillelund KG,
Jakobsen J, Tjønneland A, Overvad K, Raaschou-Nielsen O. Exposure to road traffic and
railway noise and associations with blood pressure and self-reported hypertension: a
cohort study. Environ Health. 2011;10:92.
Teeuwisse SD. 2003. Handbook on the software package CAR II, versie 2.0, TNO. Report
R2003/118; 2003.
Tetreault LF, Perron S, Smargiassi A. Cardiovascular health, traffic-related air pollution
and noise: are associations mutually confounded? A systematic review. Int J Public
Health 2013; 58: 649–666

Chapter 4
Road traffic noise, air pollution components, and
cardiovascular events
Yvonne de Kluizenaar
Frank J. van Lenthe
Antoon J.H. Visschedijk
Peter Y.J. Zandveld
Henk M.E. Miedema
Johan P. Mackenbach
Adapted from Noise Health 2013; 15(67):388-397

Chapter 4
66
Abstract
Traffic noise and air pollution have been associated with cardiovascular health effects.
Until date, only a limited amount of prospective epidemiological studies is available on
long-term effects of road traffic noise and combustion related air pollution. This study
investigates the relationship between road traffic noise and air pollution and hospital
admissions for ischemic heart disease (IHD: International Classification of Diseases (ICD9)
410-414) or cerebrovascular disease (cerebrovascular event [CVE]: ICD9 430-438). We
linked baseline questionnaire data to 13 years of follow-up on hospital admissions and
road traffic noise and air pollution exposure, for a large random sample (N = 18,213) of
inhabitants of the Eindhoven region, The Netherlands. Subjects with cardiovascular
event during follow-up on average had higher road traffic noise day, evening, night level
(Lden) and air pollution exposure at the home. After adjustment for confounders (age,
sex, Body Mass Index [BMI], smoking, education, exercise, marital status, alcohol use,
work situation, and financial difficulties), increased exposure did not exert a significant
increased risk of hospital admission for IHD or cerebrovascular disease. Relative risks
(RRs) for a 5th
to 95th
percentile interval increase were 1.03 (0.88-1.20) for Lden; 1.04
(0.90-1.21) for particulate matter (PM10); 1.05 (0.91-1.20) for elemental carbon (EC);
and 1.12 (096-1.32) for nitrogen dioxide (NO2) in the full model. While the risk estimate
seemed highest for NO2 , for a 5th
to 95th
percentile interval increase, expressed as RRs
per 1 μg/m3 increases, hazard ratios seemed highest for EC (RR 1.04 [0.92-1.18]). In the
subgroup of study participants with a history of cardiovascular disease, RR estimates
seemed highest for noise exposure (1.19 [0.87-1.64] for Lden); in the subgroup of elderly
RR seemed highest for air pollution exposure (RR 1.24 [0.93-1.66] for NO2).

Road traffic noise, air pollution components, and cardiovascular events
67
4.1 Introduction
Road traffic is a major source of both environmental noise and air pollution exposure in
urban areas. Both road traffic noise and air pollution have been related to cardiovascular
health effects. (Babisch, 2008; Van Kempen and Babisch, 2012; Janssen et al., 2011;
Brook et al., 2010) The continuing urbanization, the large number of people exposed and
cardiovascular morbidity as a major cause of mortality in modern societies, create a need
for better insight in the long-term effects of road traffic on cardiovascular morbidity.
4.1.1 Noise exposure
Noise exposure can cause annoyance and sleep disturbance. (Miedema and Oudshoorn,
2001; Miedema and Vos, 2007) During the last decades, it has been studied if and how
noise exposure may cause further adverse health effects. The pathway from noise
exposure to cardiovascular health effects is hypothesized to involve stress reactions that
may cause adverse health effects in the long-term. Exposure to noise may - directly or
indirectly through disturbance of sleep, communication or activities - affect the
autonomic nervous system and the endocrine system, resulting in biological responses
such as changes in heart rate and levels of stress hormones. (e.g., Ising et al., 1999;
Babisch, 2002; WHO, 2011) This may, possibly in combination with other factors, lead to
increases in biological risk factors (e.g., blood lipids, blood pressure, blood glucose, blood
viscosity), which then may eventually result in manifest diseases such as arteriosclerosis
and ischemic heart disease (IHD) (Babisch, 2001; Babisch 2002). Currently, there is
increasing evidence that long-term exposure to environmental noise can induce stress
related health effects including cardiovascular diseases. (Babisch et al., 2005; Babisch,
2008; Barregard et al., 2009; Bluhm et al., 2007; Bodin et al., 2009; de Kluizenaar et al.,
2007; Floud et al., 2011; Huss et al., 2010; Gan et al., 2012; Van Kempen and Babisch,
2012; Sorensen et al., 2012b, WHO, 2011)
4.1.2 Air pollution
A large body of epidemiological studies shows associations between particulate matter
(PM10) and a wide range of adverse health effects, including cardiovascular health
effects. (Brook et al., 2010; Brook and Rajagopalan, 2010; WHO, 2012) Different
pathways to cardiovascular endpoints have been hypothesized for PM10, including (1)

Chapter 4
68
pulmonary oxidative stress and inflammatory responses that by "spill over" lead to
systemic oxidative stress and inflammatory responses, (2) perturbation of autonomic
nervous system balance, and (3) particles or particle constituents passing through the
lungs, thus entering the systemic circulation and provoking "direct" extra-pulmonary
effects (Brook et al., 2010). A majority of studies linking air pollution with cardiovascular
effects focus on PM10 air pollution. Epidemiological studies on the effects of long-term
exposure have shown associations with cardiovascular morbidity and mortality (e.g.,
Beelen et al., 2009; Chen et al., 2005; Hoffmann et al., 2007; Naess et al., 2007; Miller et
al., 2007; Puett et al., 2009).
Road traffic noise and air pollution share road traffic as a source; therefore, they are to
some extent related (e.g., Allen et al., 2009; Can et al., 2011; Davies et al, 2009). In
recent years, efforts have been made to study the association between cardiovascular
morbidity and road traffic noise and air pollution exposure in combination. Studies have
focused on various cardiovascular outcomes, including blood pressure, hypertension,
myocardial infarction, stroke, and cardiovascular mortality (Beelen et al., 2009; Belojevic
et al., 2008; de Kluizenaar et al., 2007; Dratva et al., 2012; Fuks et al., 2011; Gan et al.,
2012; Selander et al., 2009; Sorensen et al., 2011a, Sorensen et al., 2011b, Sorensen et
al., 2012a). Available studies carefully suggest independent effects of road traffic noise
and air pollution.
Until date, however, only a small number of prospective epidemiological studies is
available into effects of long-term exposure of road traffic noise and air pollution. With
regard to air pollution, particles originating from combustion sources (including traffic)
are of specific interest as it has been suggested that these particles are particularly
relevant for human health (Janssen et al., 2011; Peng et al., 2009; Ostro et al., 2007;
WHO, 2012). However, to date, only a limited number of epidemiological studies is
available that have studied the impact of long-term exposure to combustion related
particle fractions, of which elemental carbon (EC) is an indicator (Janssen et al., 2011).
Previous studies have shown that subjects with pre-existing disease and the elderly may
be susceptible groups for the effects of exposure (Brook et al., 2010; Chiusolo et al.,
2011). This study investigates the relationship between road traffic noise and air
pollution components, PM10, nitrogen dioxide (NO2), and EC and hospital based
incidence of IHD or cerebrovascular disease.

Road traffic noise, air pollution components, and cardiovascular events
69
4.2 Methods
4.2.1 Study population
The GLOBE study is a prospective cohort study carried out in the Netherlands, with a
primary aim of explaining socio-economic inequalities in health. GLOBE is the Dutch
acronym for Health and Living Conditions of the Population of Eindhoven and
surroundings. Baseline data were collected in 1991. Details of the study protocol have
been described elsewhere (Mackenbach, et al., 1994) and will only be briefly
summarized here.
In 1991, a sample (stratified by age, degree of urbanization, and socio-economic
position) of 27,070 non-institutionalized subjects (aged 15 - 74 years), was drawn from
18 municipal population registers in the south-eastern part of the Netherlands and asked
to participate in the study. With a response of 70.1 %, baseline information was collected
from 18,973 individuals using a postal questionnaire. The area of study included the city
of Eindhoven, which was the fifth largest city of The Netherlands in 1991.
4.2.2 Health outcome and covariates
The data collection comprised a broad range of potential confounders including socio-
demographic variables (age, gender, marital status, and education), life-style factors
(smoking, alcohol use, physical activity, and BMI) and living conditions (employment
status, and financial problems). A history of cardiovascular disease at baseline (1991) was
defined by a positive answer to one of the following questions in the questionnaire: "Did
you have a heart disease or infarction during the last 5 years?" and "Did you have a
cerebrovascular accident - or experience its consequences - during the last 5 years?"
Health outcome data were obtained from the national database on hospital admissions.
The study population was tracked annually through municipal population registers in and
outside the study area from the start of the study. These registers virtually completely
cover the population and are maintained continuously with respect to deaths and
changes of address. It allowed us to link our database to the National Medical Registry, a
national database on hospital admissions, available for the period from 1991 to 2003, to
obtain information on the incidence of hospital-based IHD (International Classification of
Diseases [ICD9] 410-414) and cerebrovascular disease (ICD9 430-438) in the study
population. In case of re-admission during follow-up, the first admissions were selected.

Chapter 4
70
The five hospitals in the area where the GLOBE participants lived at baseline gave their
permission to use their data from the national data set. Record linkage was carried out
on the key variables zip-code, gender, and date of birth. Approval for the record linkage
was received from the Medical Ethical Commission. Details on the record linkage
procedure have been described elsewhere (Van Lenthe et al., 2002).
Age was entered as a continuous variable while gender, BMI, smoking, education,
physical activity, marital status, alcohol use, employment status, and financial problems
were entered as categorical variables. BMI (body weight divided by height squared) was
categorized into four groups: (underweight [BMI < 20], normal weight range [BMI 20-25],
overweight [BMI 25-30], and obese [BMI > 30]). Smoking was coded in three categories
(current smoker, former smoker, and never smoker). The highest attained level of
education was distinguished into four different categories: (primary education; lower
professional and intermediate general education; intermediate professional and higher
general education; and higher professional education and university). Physical activity
was available in four categories: (none, little, moderate, and much physical activity).
Marital status was categorized into four groups: (married or living together, unmarried,
divorced, and widow/widower). Alcohol use was categorized into three groups:
(moderate, abstainer, and excessive). Employment status was categorized in three
categories, including unemployed, otherwise not gainfully employed nor studying (incl.
e.g., house wife/house man, pensioner, etc.), working (incl. studying, military service).
Three categories of financial problems were distinguished: (no difficulty, some difficulty,
and large difficulty). Missing values in potential confounding variables (the percentage of
missing values for all confounding variables was below 5.6 %) were imputed, replacing
the missing values with the most common category.
4.2.3 Environmental exposure
The road traffic noise exposure of the subjects was calculated at the most exposed
façade of the dwelling with the standard method SKM2 ("Standaard Karterings Methode
2") in accordance with requirements of the EU Environmental Noise Directive (END). For
the analyses, we used the EU standard noise metric day, evening, night level (Lden). Lden is
an "average" sound level over 24 h in which sound levels during the evening and the
night are increased by 5 dB(A) and 10 dB(A), respectively. SKM2 is the Netherlands'
standard method for noise modeling and producing noise maps in compliance with the
END (VROM, 2006a). SKM2 is implemented in Urbis (Borst and Miedema, 2005), that was

Road traffic noise, air pollution components, and cardiovascular events
71
used here for the exposure calculations. Noise calculations are carried out in two steps,
calculating first the emission and then the transmission. The emission calculations take
into account traffic characteristics, including traffic intensities, traffic composition,
speed, road height, and road surface type. The transmission calculations take into
account the distance between source (road) and dwelling façade, air attenuation, effects
of (yearly) meteorologic conditions, ground attenuation, object screening, reflection of
objects opposite the dwelling, and statistical diffraction for transmission. Noise exposure
is calculated at the height of the center of the dwelling façade of the exposed subject.
Very low noise exposure levels (Lden below 45 dB(A)) were recoded as 45 dB(A) since this
can be considered to be a lower limit of the ambient noise in urban surrounding.
Air pollution exposure was also assessed at the most exposed façade. The annual
average exposure concentration at a certain location is defined by the sum of the
regional and urban background concentration, supplemented with the calculated
contribution of the local road traffic, to account for the small scale spatial variation
within the city. Background concentrations are estimated annually by the National
Institute for Public Health and the Environment (Rijksinstituut voor Volksgezondheid en
Milieu, RIVM), based on measurement data of the Dutch National Air Quality Monitoring
Network. Combining these monitoring data with nationwide air pollution modeling, they
each year generate a national map (1 km Χ 1 km) of annual average concentrations for
the most important air pollution components, including PM10 and NO2 . The empirical
relationship proposed by Schaap and Denier van der Gon (2006) has shown that black
smoke (BS) may act as a suitable indicator of EC concentrations. Here, this relationship
was employed to derive background EC concentrations from the background BS
concentrations, measured by two regional monitoring stations within the study area (as
part of the National Air Quality Monitoring Network). The local traffic-related EC
emission contributions were estimated on the basis of the fuel-specific EC content of
exhaust PM10 emission (Schauer et al. 2006). These data were input for the calculation
of local EC concentrations, assuming an absence of other relevant local EC sources. An
inventory on the near-by industrial activities indicated that traffic is indeed the
dominating EC source in the Eindhoven region, although some minor contributions may
originate from e.g., wood combustion. The dispersion dynamics of EC are implicitly
assumed to be identical to PM10. PM10, NO2, and EC concentration gradients were
obtained using the Netherlands' standard models for local air pollution calculations: CAR
II for gradients in a street caused by the contribution of that street and "Pluim Snelweg"
for gradients caused by the contributions of highways (VROM, 2006b). Concentration

Chapter 4
72
levels were calculated for the year 2004, the end of follow-up, to represent the long-
term average spatial variation in air pollution concentrations.
Input data for emission calculations consisted of a detailed digital map describing the
geographic location of roads and the traffic characteristics for each road segment
(including traffic intensities for each vehicle category, speed, and road surface type),
provided by the local authorities of Eindhoven for the year 2004. Traffic data were
attached as attributes to the road segments for a dense network of roads, including
highways, arterial roads, main streets, and principal residential streets.
Input for the noise transmission calculations consisted of digital maps with precise
information on the geographic location of buildings and ground characteristics
(Topographic Service data [TOP 10]) provided by the Netherlands Ministry of Housing,
Spatial Planning and the Environment (Ministerie van Volkshuisvesting, Ruimtelijke
Ordening en Milieubeheer (VROM) / DGR). Building height was derived from the Actual
Height Information Netherlands (AHN), a 5 m Χ 5 m grid with height information based
on laser altimetry. The geographic location of noise screens with their height was
provided by the local authorities of Eindhoven. The geographical location of dwellings
within the building contours (Topographic Service data [TOP 10]) was identified with the
use of address coordinates.
In a recent study, the performance of a similar dispersion modeling approach for
calculation of air pollution concentrations in Rotterdam, The Netherlands was evaluated.
This study showed a good agreement between annual average NO2 concentrations,
estimated by dispersion modeling, and measured NO2 concentrations at eighteen sites in
the Rotterdam area (Pearson correlation coefficient ρ = 0.77) (Beelen et al., 2010).
4.2.4 Statistical analysis
Cox proportional hazard analysis was performed to investigate the association between
residential road traffic exposure (road traffic noise and air pollution) and hospital based
incidence of cardiovascular diseases (IHD: ICD9 410-414 or cerebrovascular disease: ICD9
430-438). Results are expressed as relative risks (RRs) with the corresponding 95 %
confidence intervals (CI) for the time to the first cardiovascular event. For participants
who were admitted to a hospital for IHD or cerebrovascular disease, who died, or moved
away from the 1991 baseline address, time in the study was calculated as the difference
between the start of study and date of the event. For those who had no event, time in

Road traffic noise, air pollution components, and cardiovascular events
73
the study was calculated as the difference between the start and end of follow-up.
Median follow-up time was 8.7 years.
We used different models: (1) unadjusted model; (2) model adjusted for age and sex; (3)
full model, where factors were included that were hypothesized a priori to potentially
confound the relationship between traffic exposures and cardiovascular disease,
including: age, sex, BMI, smoking, level of education (as a measure of social economic
position), physical activity, marital status, alcohol use, employment status, and financial
problems; and (4) models that, in addition, adjusted for road traffic noise respectively air
pollution. All analyzes were carried out for the full population and for three specific
subgroups of the population: (1) subjects without a history of cardiovascular disease, (2)
subjects with a history of cardiovascular disease, and (3) elderly subjects (age 65 years
and older). Analyses were performed with IBM SPSS Statistics version 20.
4.3 Results
Table 4.1 shows the characteristics of the study sample by the event of hospital
admission for (IHD: ICD9 410-414) or cerebrovascular disease (cerebrovascular event
[CVE]: ICD9 430-438) during follow-up. Table 4.1 shows that subjects who had an event
during follow-up on average have a higher age, more often are males, obese (BMI > 30),
smokers, and lower educated, less often exercise much, more often are married or living
together, more often are unemployed, and exposure to road traffic noise (Lden) and air
pollution (PM10 and EC) at home is higher. In addition, subjects in this group more often
reported a history of cardiovascular disease.
Tables 4.2a and b show the RRs for hospital admission for IHD or cerebrovascular disease
for road traffic noise exposure, for a 10 dB increase of Lden (Table 4.2a) and for a 5th
to
95th
percentile interval change (Table 4.2b). Results are presented for the full population
and for the three specific subgroups, for the four different models.
Tables 4.2a and b show that in the GLOBE study sample, in the unadjusted models, with
increasing road traffic noise level, a significantly elevated risk for the incidence of IHD or
cerebrovascular disease was found with RR 1.12 (95 % CI: 1.04-1.21) and RR 1.27 (95 %
CI: 1.09-1.47), for a 10 dB increase in Lden and a 5th
to 95th
percentile interval increase,
respectively). However, after adjustment for confounders in the full model, these
relationships were smaller and not significant with RR 1.01 (95 % CI: 0.94-1.09) and RR
1.03 (0.88-1.20), for a 10 dB increase in Lden and a 5th
to 95th
percentile interval increase,

Chapter 4
74
respectively). The RR seemed highest in the subgroup with a history of cardiovascular
disease, although not significant with RR 1.09 (95 % CI: 0.93-1.27) and RR 1.19 (95 % CI:
0.87-1.64) for a 10 dB increase in Lden and a 5th
to 95th
percentile interval increase,
respectively). However, CIs are overlapping. The association seemed not affected by
additional adjusting for PM10.
Table 4.1 Characteristics of the GLOBE cohort by event
Characteristics
Study population (N = 18,213)
No Event Event
N 16,666 1547
Age (years) 46.4 (15.9) 59.3 (9.1)***
Sex: Male (%) 47.0 63.9
***
BMI (QI > 30) (%) 5.8 8.9***
Smoking (%) 35.9 40.2**
Education low (%) 20.1 32.9***
Physical activity: much (%) 33.8 23.4***
Marital (married/live together) (%) 72.4 83.0***
Alcohol use: excessive (%) 8.2 8.4
Work situation: unemployed (%) 9.6 17.6***
Financial: much difficulty (%) 4.2 5.0
Lden mean (dB) 52.7 (6.7) 53.2 (6.6)***
PM10 mean long-term (µg m-3
) 27.79 (1.03) 27.81 (0.97)*
EC mean long-term (µg m-3
) 1.16 (0.40) 1.17 (0.38)*
NO2 mean long-term (µg m-3
) 32.10 (4.37) 32.22 (4.23)
No history of cardiovascular disease (%) (N=17,235)
96.2 77.8***
History of cardiovascular disease (%) (N = 978) 3.8 22.2***
Variables are described by means (standard deviation) and percentages. Groups of cases are compared by χ2
(percentages) and Mann–Whitney statistics (means and medians).
*P < 0.05, **P < 0.01, ***P < 0.001. Abbreviations are: BMI, Body Mass Index; Lden, road traffic noise day-evening-night level (dB); PM10, particulate matter; EC, elemental carbon; NO2, nitrogen dioxide; IHD, ischemic heart disease; CVE cerebrovascular event.

Road traffic noise, air pollution components, and cardiovascular events
75
Table 4.2a Hazard ratios for road traffic noise exposure (for a 10 dB increase of Lden) for
ischemic heart disease or cerebrovascular disease (hospital admission for ICD9 410–414
or 430–438) respectively, in pre-specified subgroups of the GLOBE study sample.
Groupa RR
unadjusted
RR
adjusted:
age, sex
RR
adjusted:
full model
RR
adjusted:
full model and PM10
GLOBE study sample 1.12 (1.04–1.21)**
1.02 (0.94–1.10) 1.01 (0.94–1.09)
1.00 (0.91–1.10)
No history of cardiovascular
disease
1.10 (1.01–1.19)*
1.00 (0.92-1.09) 0.99 (0.91–1.08) 0.99 (0.89–1.10)
History of cardiovascular disease 1.10 (0.95–1.28)
1.07 (0.92-1.25)
1.09 (0.93–1.27)
1.09 (0.90–1.32) Aged 65 and over 1.03 (0.91-1.17) 1.04 (0.91-1.17) 1.04 (0.92-1.18) 1.00 (0.85-1.18)
aRelative risks from Cox proportional hazard analysis are shown, for four different models: (1) unadjusted; (2)
adjusted for age and sex; (3) full model: adjusted for age, sex, Body Mass Index, smoking, education, exercise, marital status, alcohol use, work situation, financial difficulties; (4) full model with additional adjustment for air pollution (PM10).
┼ Indication of an association (P < 0.1); * significant relationship (P < 0.05); ** significant relationship (P < 0.01).
Table 4.2b Hazard ratios for road traffic noise exposure (for a 5th
to 95th
percentile
interval increase of Lden) for ischemic heart disease or cerebrovascular disease (hospital
admission for ICD9 410–414 or 430–438) respectively in pre-specified subgroups of the
GLOBE study sample.
aRelative risks from Cox proportional hazard analysis are shown, for four different models: (1) unadjusted; (2)
adjusted for age and sex; (3) full model: adjusted for age, sex, Body Mass Index, smoking, education, exercise, marital status, alcohol use, work situation, financial difficulties; (4) full model with additional adjustment for air
pollution (PM10).
┼ Indication of an association (P < 0.1); * significant relationship (P < 0.05); ** significant relationship (P < 0.01).
5th
to 95th
percentile interval: 20.6 dB.
Groupa RR
unadjusted
RR
adjusted:
age, sex
RR
adjusted:
full model
RR
adjusted:
full model and PM10
GLOBE study sample 1.27 (1.09–1.47)**
1.04 (0.89- 1.21) 1.03 (0.88-1.20) 1.00 (0.83-1.22)
No history of cardiovascular disease
1.21 (1.02-1.43)* 1.00 (0.84-1.19) 0.98 (0.82-1.17) 0.97 (0.78-1.21)
History of cardiovascular disease 1.22 (0.90-1.66) 1.15 (0.84-1.58) 1.19 (0.87-1.64) 1.20 (0.80-1.79)
Aged 65 and over 1.06 (0.82-1.38) 1.08 (0.83-1.39) 1.08 (0.83-1.41) 1.01 (0.72-1.42)

Chapter 4
76
Tables 4.3 to 4.5 show RRs for different components of air pollution: PM10, EC, and NO2
respectively. Tables 4.3a and 4.3b show a significant association between PM10
concentration and hospital admission of IHD or cerebrovascular disease with RR 1.06 (95
% CI: 1.01-1.11) and RR 1.20 (95 % CI: 1.04-1.38) for a 1 μg/m3 and a 5
th to 95
th percentile
interval increase respectively) before adjustment for potential confounders. After
adjustment for covariates in the full model, this association was not significant with RR
1.01 (95 % CI: 0.97-1.06) and RR 1.04 (95 % CI: 0.90-1.21) for a 1 μg/m3 and a 5
th to 95
th
percentile interval increase in PM10 respectively). The RR seemed highest, although not
significant, in the subgroup of elderly subjects with RR 1.04 (95 % CI: 0.96-1.13) and RR
1.13 (95 % CI: 0.87-1.46) for a 1 μg/m3 and a 5
th to 95
th percentile interval increase
respectively).
Table 4.3a Hazard ratios for particulate matter (PM10) exposure (for a 1 μg m-3
increase
in PM10) for ischemic heart disease or cerebrovascular disease (hospital admission for
ICD9 410–414 or 430–438) in pre-specified subgroups of the GLOBE study sample.
aRelative risks from Cox proportional hazard analysis are shown, for four different models: (1) unadjusted; (2)
adjusted for age and sex; (3) full model: adjusted for age, sex, Body Mass Index, smoking, education, exercise, marital status, alcohol use, work situation, financial difficulties; (4) full model with additional adjustment for
road traffic noise (Lden)
┼ Indication of an association (P < 0.1); * significant relationship (P < 0.05); ** significant relationship (P < 0.01).
In the subgroup with a history of cardiovascular disease, a RR was found of (RR 1.03 [95
% CI: 0.94-1.12]) and RR 1.09 (95 % CI: 0.83-1.43) for a 1 μg/m3 and a 5
th to 95
th
percentile interval increase in PM10 respectively). After additional adjustment for road
traffic noise, this changed to RR 1.00 (95 % CI: 0.89-1.12) and RR 0.99 (95 % CI: 0.70-1.41)
for a 1 μg/m3 and a 5
th to 95
th percentile interval increase in PM10 respectively).
Groupa RR
unadjusted
RR
adjusted:
age, sex
RR
Adjusted
full model
RR
adjusted:
full model and Lden
GLOBE study sample 1.06 (1.01–1.11)*
1.01(0.97-1.06) 1.01 (0.97–1.06)
1.01 (0.95–1.08)
No history of cardiovascular disease
1.05 (0.99–1.11)┼
1.00 (0.95-1.06) 1.00 (0.94-1.06) 1.00 (0.93-1.08)
History of cardiovascular disease 1.03 (0.95–1.11)
1.02 (0.94-1.11) 1.03 (0.94-1.12)
1.00 (0.89-1.12)
Aged 65 and over 1.02 (0.94-1.11) 1.03 (0.95-1.12) 1.04 (0.96-1.13) 1.04 (0.93-1.16)

Road traffic noise, air pollution components, and cardiovascular events
77
Table 4.3b Hazard ratios for particulate matter (PM10) exposure (for a 5th
to 95th
percentile interval increase of PM10) for ischemic heart disease or cerebrovascular
disease (hospital admission for ICD9 410–414 or 430–438) in pre-specified subgroups of
the GLOBE study sample.
aRelative risks from Cox proportional hazard analysis are shown, for four different models: (1) unadjusted; (2)
adjusted for age and sex; (3) full model: adjusted for age, sex, Body Mass Index, smoking, education, exercise,
marital status, alcohol use, work situation, financial difficulties; (4) full model with additional adjustment for road traffic noise (Lden)
┼ Indication of an association (P < 0.1); * significant relationship (P < 0.05); ** significant relationship (P < 0.01).
5th
to 95th
percentile interval of PM10: 3.1 µg/m3.
Table 4.4a Hazard ratios for elemental carbon (EC) exposure (for a 1 μg m-3
increase in
EC) for ischemic heart disease or cerebrovascular disease (hospital admission for ICD9
410–414 or 430–438) in pre-specified subgroups of the GLOBE study sample.
aRelative risks from Cox proportional hazard analysis are shown, for four different models: (1) unadjusted; (2)
adjusted for age and sex; (3) full model: adjusted for age, sex, Body Mass Index, smoking, education, exercise, marital status, alcohol use, work situation, financial difficulties; (4) full model with additional adjustment for road traffic noise (Lden)
┼ Indication of an association (P < 0.1); * significant relationship (P < 0.05); ** significant relationship (P < 0.01).
Groupa RR
unadjusted
RR
adjusted:
age, sex
RR
adjusted:
full model
RR
adjusted:
full model and Lden
GLOBE study sample 1.20 (1.04–1.38)*
1.04 (0.90-1.21) 1.04 (0.90–1.21)
1.04 (0.86–1.26) No history of cardiovascular disease
1.16 (0.98–1.37)┼
1.00 (0.84-1.20) 0.99 (0.83-1.19) 1.01 (0.81-1.26)
History of cardiovascular disease 1.09 (0.85–1.40)
1.06 (0.83-1.37) 1.09 (0.83-1.43)
0.99 (0.70-1.41) Aged 65 and over 1.08 (0.83–1.39) 1.10 (0.85-1.43) 1.13 (0.87-1.46) 1.12 (0.80-1.57)
Groupa RR
unadjusted
RR
adjusted:
age, sex
RR
adjusted:
full model
RR
adjusted:
full model and Lden
GLOBE study sample 1.16 (1.04-1.30)**
1.05 (0.93-1.18) 1.04 (0.92-1.18) 1.04 (0.89-1.22) No history of cardiovascular disease
1.13 (0.99-1.30)┼
1.02 (0.88-1.17) 1.00 (0.87-1.16) 1.02 (0.85-1.23)
History of cardiovascular disease 1.05 (0.86-1.28) 1.04 (0.85-1.26) 1.05 (0.85-1.30) 0.96 (0.72-1.28) Aged 65 and over 1.06 (0.86-1.31) 1.08 (0.88-1.33) 1.10 (0.89-1.35) 1.09 (0.82-1.44)

Chapter 4
78
Table 4.4b Hazard ratios for elemental carbon (EC) exposure (for a 5th
to 95th
percentile
interval increase of EC) for ischemic heart disease or cerebrovascular disease (hospital
admission for ICD9 410–414 or 430–438) in pre-specified subgroups of the GLOBE study
sample.
aRelative risks from Cox proportional hazard analysis are shown, for four different models: (1) unadjusted; (2)
adjusted for age and sex; (3) full model: adjusted for age, sex, Body Mass Index, smoking, education, exercise, marital status, alcohol use, work situation, financial difficulties; (4) full model with additional adjustment for
road traffic noise (Lden)
┼ Indication of an association (P < 0.1); * significant relationship (P < 0.05); ** significant relationship (P < 0.01).
5th
to 95th
percentile interval of EC: 1.13 µg/m-3
.
Tables 4.4a and b show associations found for EC. Comparison of Table 4.3a and Table
4.4a shows that RR estimates per μg/m3 increase seem higher for EC than for PM10 (RR
for EC per μg/m3 increase: 1.16 (95 % CI: 1.04-1.30) (unadjusted model), 1.04 (95 % CI:
0.92-1.18) (full model) and RR for PM10 per mg/m3 increase: 1.06 (95 % CI: 1.01-1.11)
(unadjusted model), 1.01 (95 % CI: 0.97-1.06) (full model). As shown in Table 4.3b and
Table 4.4b, associations found for a 5th
to 95th
percentile interval increase are
comparable in magnitude (RR for EC per 5th
to 95th
percentile increase: 1.18 (95 % CI:
1.04-1.35) (unadjusted model) and 1.05 (95 % CI: 0.91-1.20) (full model); RR for PM10:
1.20 (95 % CI: 1.04-1.38) (unadjusted model) and 1.04 (0.90-1.21) (full model).
Tables 4.5a and b show associations found for NO2. With increasing NO2 concentration,
in the unadjusted model, a significantly elevated risk for the incidence of IHD or
cerebrovascular disease was found with RR 1.02 (95 % CI: 1.01-1.03) and RR 1.29 (95 %
CI: 1.10-1.51) for a 1 μg/m3 and a 5
th to 95
th percentile interval increase respectively).
However, as for the other air pollution components, these associations were not
significant in the full model with RR 1.01 (95 % CI: 1.00-1.02) and 1.12 (0.96-1.32) for a 1
μg/m3 and a 5
th to 95
th percentile interval increase respectively). The RR seemed highest,
although not significant, in the subgroup of elderly subjects withRR 1.02 (95 % CI: 0.99-
1.04) and RR 1.24 (95 % CI: 0.93-1.66) for a 1 μg/m3 and a 5
th to 95
th percentile interval
increase respectively).
Groupa RR
unadjusted
RR
adjusted:
age, sex
RR
adjusted:
full model
RR
adjusted:
full model and Lden
GLOBE study sample 1.18 (1.04-1.35)
** 1.05 (0.92-1.21) 1.05 (0.91-1.20) 1.05 (0.88-1.25)
No history of cardiovascular disease
1.15 (0.98-1.34)┼
1.02 (0.87-1.20) 1.00 (0.85-1.18) 1.02 (0.83-1.26)
History of cardiovascular disease 1.05 (0.84-1.32) 1.04 (0.83-1.30) 1.05 (0.83-1.34) 0.95 (0.69-1.32)
Aged 65 and over 1.07 (0.84-1.35) 1.09 (0.86-1.38) 1.11 (0.88-1.41) 1.10 (0.80-1.50)

Road traffic noise, air pollution components, and cardiovascular events
79
Table 4.5a Hazard ratios for nitrogen dioxide (NO2) exposure (for a 1 μg m-3
increase in
NO2) for ischemic heart disease or cerebrovascular disease (hospital admission for ICD9
410–414 or 430–438) in pre-specified subgroups of the GLOBE study sample.
aRelative risks from Cox proportional hazard analysis are shown, for four different models: (1) unadjusted; (2)
adjusted for age and sex; (3) full model: adjusted for age, sex, Body Bass Index, smoking, education, exercise, marital status, alcohol use, work situation, financial difficulties; (4) full model with additional adjustment for
road traffic noise (Lden)
┼ Indication of an association (P < 0.1); * significant relationship (P < 0.05); ** significant relationship (P < 0.01).
Table 4.5b Hazard ratios for nitrogen dioxide (NO2) exposure (for a 5th
to 95th
percentile
interval increase of NO2) for ischemic heart disease or cerebrovascular disease (hospital
admission for ICD9 410–414 or 430–438) in pre-specified subgroups of the GLOBE study
sample.
aRelative risks from Cox proportional hazard analysis are shown, for four different models: (1) unadjusted; (2)
adjusted for age and sex; (3) full model: adjusted for age, sex, Body Mass Index, smoking, education, exercise,
marital status, alcohol use, work situation, financial difficulties; (4) full model with additional adjustment for road traffic noise (Lden)
┼ Indication of an association (P < 0.1); * significant relationship (P < 0.05); ** significant relationship (P < 0.01).
5th
to 95th
percentile interval: 14.1 µg m-3
.
Groupa RR
unadjusted
RR
adjusted:
age, sex
RR
adjusted:
full model
RR
adjusted:
full model and Lden
GLOBE study sample 1.02 (1.01-1.03)
** 1.01 (1.00-1.02) 1.01 (1.00-1.02) 1.01 (1.00-1.02)
No history of cardiovascular
disease
1.02 (1.00-1.03)*
1.01 (0.99-1.02) 1.01 (0.99-1.02) 1.01 (0.99-1.02)
History of cardiovascular disease 1.01 (0.99-1.04) 1.01 (0.99-1.03) 1.01 (0.99-1.03) 1.01 (0.98-1.03)
Aged 65 and over 1.01 (0.99-1.03) 1.01 (0.99-1.04) 1.02 (0.99-1.04) 1.02 (0.99-1.04)
Groupa RR
unadjusted
RR
adjusted:
age, sex
RR
adjusted:
full model
RR
adjusted:
full model and Lden
GLOBE study sample 1.29 (1.10-1.51)**
1.13 (0.96-1.33) 1.12 (0.96-1.32) 1.13 (0.95-1.34)
No history of cardiovascular disease
1.25 (1.05-1.50)*
1.10 (0.92-1.32) 1.09 (0.91-1.32) 1.12 (0.92-1.36)
History of cardiovascular disease 1.19 (0.85-1.66) 1.15 (0.83-1.61) 1.15 (0.82-1.62) 1.09 (0.75-1.56)
Aged 65 and over 1.16 (0.87-1.55) 1.22 (0.91-1.63) 1.24 (0.93-1.66) 1.24 (0.90-1.69)

Chapter 4
80
4.4 Discussion and Conclusions
In the present study, we only found significant associations between road traffic noise
(Lden), various components of air pollution (PM10, EC, and NO2) and hospital admission
for IHD or cerebrovascular disease in the unadjusted models. However, these
associations became substantially smaller and non-significant after adjustment for
confounders. While the risk estimates seemed highest for NO2 , when comparing risk
estimates for different exposures for a 5th
to 95th
interval increase, with a RR of 1.12
(0.96-1.32), expressed as RRs per μg/m3 increase, risk estimates seemed highest for EC
with an RR of 1.04 (0.92-1.18) in the full model.
For road traffic noise exposure, RRs seemed highest for the subgroup with a history of
cardiovascular disease. For air pollution, RRs seemed highest in the subgroup aged 65
and older. However, associations for subgroups of the study population were not
significant.
4.4.1 Noise exposure and cardiovascular disease
During the last decades studies have investigated the association between
transportation noise exposure and blood pressure changes and hypertension. In a recent
meta analysis, Van Kempen and Babisch (2012) report a small but significant association
between road traffic noise and hypertension (OR 1.034; 1.011-1.056) per 5 dB increase in
LAeq,16h, based on 24 studies carried out between 1970 and 2010. A limited number of
studies have investigated the relationship between IHD, cerebrovascular disease and
long-term exposure to transportation noise, with varying results. Early population
studies include the Caerphilly (Babisch et al., 1988) and Speedwell (Babisch et al., 1993)
studies. In the Caerphilly study, no association was found between road traffic noise and
the prevalence of IHD. However, associations were found between noise and a broad
range of potential risk factors for IHD. (Babisch et al., 1988) In pooled analyses of the
Caerphilly and Speedwell cohorts a marginal risk increase was suggested (RR 1.1 and 1.2
for IHD incidence and prevalence, respectively), for the highest noise category (Leq, 6-
22h = 66-70 dB(A)) versus the lowest noise category (Leq, 6-22h = 51-55 dB(A)). These
associations however, were not significant. (Babisch et al., 1993) Babisch et al, (2005)
reported an association between road traffic noise and the incidence of myocardial
infarction (adjusted OR 1.3 [0.88-1.8]), for men exposed to a road traffic noise level
exceeding 70 dB(A), compared to those exposed under 60 dB(A), in a case control study

Road traffic noise, air pollution components, and cardiovascular events
81
in Berlin. In a subsample of men who lived for at least 10 years at their present address,
the OR was higher (OR 1.8 [1.0-3.2]). In a review and meta-analysis Babisch (2008) found
no increase in risk below 60 dB(A) (Lday) while risk increase was found with increasing
noise levels above 60 dB(A). More recently, Selander et al, (2009) reported an
association between road traffic noise and myocardial infarction, with an adjusted odds
ratio for an exposure above 50 dB(A) of 1.12 (0.95-1.33) in the full population, and 1.38
(1.11-1.71) for a subsample excluding persons with hearing loss, or noise exposure from
other sources. Sørensen et al, (2012b) reported a significant association between road
traffic noise and incidence of myocardial infarction, with an incidence rate ratio (IRR) of
1.12 (1.02-1.22) per 10 dB (Lden) increase in exposure. Gan et al, (2012) reported
interquartile range increases of respectively community noise exposure associated with a
6 % (1-11 %) and black carbon with a 4 % (1-8 %) increase in coronary heart disease
(CHD) mortality. They conclude that their findings suggest an independent effect of
traffic related noise and air pollution on CHD mortality. Huss et al, (2010) reported an
adjusted RR of 1.3 (0.96-1.7) for mortality from myocardial infarction, for subjects
exposed to aircraft noise ≥60 dB(A) versus <45 dB(A) and 1.5 (1.0-2.2) in a subsample of
subjects who had lived at the same place for at least 15 years. However, they found no
association between aircraft noise and cerebrovascular disease mortality. Sørensen et al,
(2011b) reported an IRR of 1.14 (1.03-1.25) for stroke per 10 dB higher level of road
traffic noise (Lden), with stronger associations in the elderly (2011). Our study, with risk
estimates for a 5th
to 95th
percentile increase in road traffic noise (Lden) of 1.03 (0.88-
1.20) (full sample, full model) and 1.19 (0.87-1.64) for the subgroup with a history of
cardiovascular disease, falls within the range of reported risk estimates.
4.4.2 Air pollution and cardiovascular health
A number of epidemiological studies have studied the effects of long-term air pollution
exposure and cardiovascular morbidity and mortality. Studies have considered different
air pollution components and various endpoints. A limited number of studies have also
investigated effects of combustion related fractions (EC). In a recent review and meta
analyses, Janssen et al. (2011), report a pooled effect estimate of 1.06 (1.04-1.09) for EC
and 1.007 (1.004-1.009) for PM2.5 per 1 μg/m3 increase in concentration, for all-cause
mortality.
In the individual studies, generally increased risks were reported with increasing
concentration; however, like in this study CI often included 1. Only few studies into long-

Chapter 4
82
term effects on cardiovascular morbidity and mortality have been carried out in Europe.
In a large Dutch cohort study, Beelen et al, (2008) found RRs of 1.04 (0.95-1.13) for a 10
μg/m3 increase in BS cardiovascular mortality and similar results for PM2.5. In another
study, Beelen et al, (2009) found a RR of 1.39 (0.99-1.94) for cerebrovascular mortality
and 1.01 (0.83-1.22) for IHD mortality for a 10 μg/m3 increase in BS. They concluded that
results found in their study were not explained by traffic noise exposure. Our risk
estimates with an RR of 1.04 (0.92-1.18) for IHD or cerebrovascular disease for a 1 μg/m3
increase in EC concentration and 1.01 (0.97-1.06) for a 1 μg/m3 increase in PM10 (full
model) fall within the range of previous findings. Most studies on long term exposure to
PM10 and mortality were carried out in the US, often reporting somewhat stronger
associations (review by Brook et al., 2010). E.g., Laden et al, (2006) found an association
between PM2.5 exposure and cardiovascular mortality (RR 1.28 [1.13-1.44]) for a 10
μg/m3 increase in concentration.
In our study, although estimated risk estimates for a 1 μg/m3 increase seemed higher for
EC than for PM10 , risk estimates for a 5th
to 95th
percentile increase were similar. This is
in line with the results of the recent systematic review by Janssen et al (2011).
When comparing air pollution components for a 5th
to 95th
percentile interval change,
RRs seemed highest for NO2, with an RR of 1.12 (0.96-1.32) in the full model. NO2 is
commonly used as an indicator of combustion related air pollution. Although NO2 itself is
toxic, in toxicological studies, typically effects are only found at levels far exceeding
ambient levels (WHO, 2006). Therefore, at current ambient levels it is unclear if NO2
itself plays a major role, or if (more commonly assumed) NO2 is an indicator of other
toxic components in the air pollution mixture (WHO, 2006). In epidemiological studies,
associations between long term exposure to NO2 and adverse health outcomes have
been reported. (e.g., Rosenlund et al., 2008) Rosenlund et al, (2008) reported a RR for
incidence in coronary events per 10 μg/m3 increase in NO2 of 1.03 (1.00-1.07), with
stronger associations for fatal cases (1.07; 1.02-1.12). Hoek et al, (2002) reported a RR of
1.81 (0.98-3.34) for cardiopulmonary mortality for concentration changes from the 5th
to
the 95th
percentile (approximately 30 μg/m3) in a random sample of 5000 people from
the full cohort of the Netherlands Cohort study. In the full cohort, however, Beelen et al.,
(2008) reported a RR of 1.07 (0.94-1.21) for cardiovascular mortality for a 30 μg/m3
increase in NO2 concentration. The risk estimates found in this study fall within the range
of previously reported risk estimates.
Studies into short term effects have also reported independent associations between
NO2 and cardiovascular mortality that remained significant after adjustment for ambient

Road traffic noise, air pollution components, and cardiovascular events
83
particles or sulfur dioxide (Chen et al., 2012). Similarly, Chiusolo et al, (2011) found
statistically significant associations between short-term changes in NO2 and cardiac
mortality, independent of PM10 and O3 . They state that the role of NO2 as a surrogate of
unmeasured pollutants cannot be ruled out, and suggest that NO2 may act as a surrogate
of ultrafine PM.
4.4.3 Methodological considerations
A strength of our study is that exposure assessment incorporated both road traffic noise
and air pollution exposure. As these factors are both identified as possible pathogenic
traffic related stressors, it is valuable that in this study we were able to study the effects
of both exposures to road traffic noise and air pollution. In addition, we were able to pay
specific attention to the combustion related fraction of PM10. Until date, only a limited
amount of epidemiological studies have considered black carbon particles, such as EC
(reviewed by Janssen et al., 2011). Second, the prospective design of this large
population study provides a powerful basis for studying long-term effects as compared
with cross-sectional studies.
In this study, a large number of potential confounders were available. Nevertheless, the
possibility of residual confounding due to unavailable variables cannot be fully excluded.
Even after adjustment for confounders, there may still be some residual confounding
that may to some extent explain the associations found. However, we minimized any
potential residual confounding by being able to adjust for a large range of potential risk
factors in the model, including demographic, socio-economic, and life-style
characteristics. Information on the history of disease was available from a question in the
questionnaire, which referred to the previous 5 years. No information was available on
disease history further back in time.
As outdoor air pollution is a mixture of a large variety of components that are often
related as many of these components share the same sources (e.g., traffic), identification
of effects of single components remains complicated. The possibility that one
component acts as a surrogate for (a mixture of) other pollutants, cannot be ruled out.
While there was substantial spatial variation in road traffic noise (Lden) and NO2, the
spatial variation in PM10 and EC in terms of μg/m3 was relatively small. This may have
limited ability to detect associations between air pollution and cardiovascular events.
However, since the study area (the Eindhoven region) is quite a large urban area, the

Chapter 4
84
long-term spatial pattern in exposure may be assumed to be reasonably representative
for a within city contrast.
Exposure levels were estimated at the home address. Therefore, there may still be some
misclassification of air pollution exposure. No information was available on indoor or
occupational exposure or on commuting or on time-activity patterns of the respondents.
However, people tend to spend the largest percentage of their time at home.
The effects of high noise exposure may be partly masked by selection mechanisms (e.g.,
noise sensitive subjects moving away from high exposure areas), better sound insulation
measures to the home of most exposed dwellings, choice of bedroom location or
changed window opening behavior in reaction to exposure. Some previous studies have
shown stronger associations, when information on exposure modifying factors (e.g.,
bedroom position, window opening behavior, insulation) (e.g., Babisch et al., 1999;
Bluhm et al., 2007; Lercher et al., 2011), or effect modifying factors (e.g., hearing loss)
(Selander et al., 2009) could be taken into account. However, in this study no data were
available to take these factors into account.
Furthermore, there are indications that effects on cardiovascular morbidity mainly start
to occur at very high exposure levels (exceeding 60 dB). (Babisch, 2008) In an average
city, only a small percentage of the population is exposed to such high levels, which may
have limited the ability to detect associations for noise.
In summary, in this study no significant association between road traffic noise (Lden),
various components of air pollution (PM10, EC, and NO2) and hospital admission for IHD
or cerebrovascular disease was found after adjustment for confounders. When
comparing risk estimates for different exposures for a 5th
to 95th
interval increase, NO2
seemed to have the highest risk estimate for events while, when expressed per μg/m3
increase in concentration, risk estimates seemed highest for EC. For noise, risks
estimates seemed highest for the subgroup with a history of cardiovascular disease. For
air pollution, risks estimates seemed highest for the subgroup aged 65 and older.

Road traffic noise, air pollution components, and cardiovascular events
85
References
Allen RW, Davies H, Cohen MA, Mallach G, Kaufman JD, Adar SD. The spatial relationship between
traffic-generated air pollution and noise in 2 US cities. Environ Res. 2009;109:334-42.
Babisch W, Gallacher JE, Elwood PC, Ising H. Traffic noise and cardiovascular risk. The Caerphilly
study, first phase. Outdoor noise levels and risk factors. Arch Environ Health. 1988;43:407-14.
Babisch W, Ising H, Elwood PC, Sharp DS, Bainton D. Traffic noise and cardiovascular risk: The
Caerphilly and Speedwell studies, second phase. Risk estimation, prevalence, and incidence of
ischemic heart disease. Arch Environ Health. 1993;48:406-13.
Babisch W, Ising H, Gallacher JE, Sweetnam PM, Elwood PC. Traffic noise and cardiovascular risk:
The Caerphilly and Speedwell studies, third phase - 10-year follow up. Arch Environ Health.
1999;54:210-6.
Babisch W, Fromme H, Beyer A, Ising H. Increased catecholamine levels in urine in subjects
exposed to road traffic noise: The role of stress hormones in noise research. Environ Int.
2001;26:475-81.
Babisch W. The noise/stress concept, risk assessment and research needs. Noise Health. 2002;4:1-
11.
Babisch W, Beule B, Schust M, Kersten N, Ising H. Traffic noise and risk of myocardial infarction.
Epidemiology. 2005;16:33-40.
Babisch W. Road traffic noise and cardiovascular risk. Noise Health. 2008;10:27-33.
Barregard L, Bonde E, Ohrström E. Risk of hypertension from exposure to road traffic noise in a
population-based sample. Occup Environ Med. 2009;66:410-5.
Beelen R, Hoek G, van den Brandt PA, Goldbohm RA, Fischer P, Schouten LJ, et al. Long-term
effects of traffic-related air pollution on mortality in a Dutch cohort (NLCS-AIR study). Environ
Health Perspect. 2008;116:196-202.
Beelen R, Hoek G, Houthuijs D, van den Brandt PA, Goldbohm RA, Fischer P, et al. The joint
association of air pollution and noise from road traffic with cardiovascular mortality in a cohort
study. Occup Environ Med. 2009;66:243-50.
Beelen R, Voogt M, Duyzer J, Zandveld P, Hoek G. Comparison of the performances of land use
regression modelling and dispersion modelling in estimating small-scale variations in long-term air
pollution concentrations in a Dutch urban area. Atmos Environ. 2010;44:4614-21.
Belojeviæ GA, Jakovljeviæ BD, Stojanov VJ, Slepceviæ VZ, Paunoviæ KZ. Nighttime road-traffic
noise and arterial hypertension in an urban population. Hypertens Res. 2008;31:775-81.
Bluhm LG, Berglind N, Nordling E, Rosenlund M. Road traffic noise and hypertension. Occup
Environ Med. 2007;64:122-6.
Bodin T, Albin M, Ardö J, Stroh E, Ostergren PO, Björk J. Road traffic noise and hypertension:

Chapter 4
86
Results from a cross-sectional public health survey in southern Sweden. Environ Health. 2009;8:38.
Borst HC, Miedema HM. Comparison of noise impact indicators, calculated on the basis of noise
maps of DENL. Acta Acust. 2005;91:378-85.
Brook RD, Rajagopalan S. Particulate matter air pollution and atherosclerosis. Curr Atheroscler
Rep. 2010;12:291-300.
Brook RD, Rajagopalan S, Pope CA 3 rd
, Brook JR, Bhatnagar A, Diez-Roux AV, et al. Particulate
matter air pollution and cardiovascular disease: An update to the scientific statement from the
American Heart Association. Circulation. 2010;121:2331-78.
Can A, Rademaker M, Van Renterghem T, Mishra V, Van Poppel M, Touhafi A, et al. Correlation
analysis of noise and ultrafine particle counts in a street canyon. Sci Total Environ. 2011;409:564-
72.
Chen LH, Knutsen SF, Shavlik D, Beeson WL, Petersen F, Ghamsary M, et al. The association
between fatal coronary heart disease and ambient particulate air pollution: Are females at greater
risk? Environ Health Perspect. 2005;113:1723-9.
Chen R, Samoli E, Wong CM, Huang W, Wang Z, Chen B, et al. Associations between short-term
exposure to nitrogen dioxide and mortality in 17 Chinese cities: The China Air Pollution and Health
Effects Study (CAPES). Environ Int. 2012;45:32-8.
Chiusolo M, Cadum E, Stafoggia M, Galassi C, Berti G, Faustini A, et al. Short term effects of
nitrogen dioxide on mortality and susceptibility factors in ten Italian cities: The epiair study.
Environ Health Perspect. 2011;119:1233-8.
Davies HW, Vlaanderen JJ, Henderson SB, Brauer M. Correlation between co-exposures to noise
and air pollution from traffic sources. Occup Environ Med. 2009;66:347-50.
Dratva J, Phuleria HC, Foraster M, Gaspoz JM, Keidel D, Künzli N, et al. Transportation noise and
blood pressure in a population-based sample of adults. Environ Health Perspect 2012;120:50-5.
Floud S, Vigna-Taglianti F, Hansell A, Blangiardo M, Houthuijs D, Breugelmans O, et al. Medication
use in relation to noise from aircraft and road traffic in six European countries: Results of the
HYENA study. Occup Environ Med. 2011;68:518-24.
Fuks K, Moebus S, Hertel S, Viehmann A, Nonnemacher M, Dragano N, et al. Long-term urban
particulate air pollution, traffic noise, and arterial blood pressure. Environ Health Perspect.
2011;119:1706-11.
Gan WQ, Davies HW, Koehoorn M, Brauer M. Association of long-term exposure to community
noise and traffic-related air pollution with coronary heart disease mortality. Am J Epidemiol.
2012;175:898-906.
Hoek G, Brunekreef B, Goldbohm S, Fischer P, van den Brandt PA. Association between mortality
and indicators of traffic-related air pollution in the Netherlands: A cohort study. Lancet.
2002;360:1203-9.
Hoffmann B, Moebus S, Möhlenkamp S, Stang A, Lehmann N, Dragano N, et al. Residential

Road traffic noise, air pollution components, and cardiovascular events
87
exposure to traffic is associated with coronary atherosclerosis. Circulation. 2007;116:489-96.
Huss A, Spoerri A, Egger M, Röösli M, Swiss National Cohort Study Group. Aircraft noise, air
pollution, and mortality from myocardial infarction. Epidemiology. 2010;21:829-36.
Ising H, Babisch W, Günther T. Work noise as a risk factor in myocardial infarction. J Clin Basic
Cardiol. 1999;2:64-8.
Janssen NA, Hoek G, Simic-Lawson M, Fischer P, van Bree L, ten Brink H, et al. Black carbon as an
additional indicator of the adverse health effects of airborne particles compared with PM10 and
PM2.5. Environ Health Perspect. 2011;119:1691-9.
van Kempen E, Babisch W. The quantitative relationship between road traffic noise and
hypertension: A meta-analysis. J Hypertens. 2012;30:1075-86.
de Kluizenaar Y, Gansevoort RT, Miedema HM, de Jong PE. Hypertension and road traffic noise
exposure. J Occup Environ Med. 2007;49:484-92.
Laden F, Schwartz J, Speizer FE, Dockery DW. Reduction in fine particulate air pollution and
mortality: Extended follow-up of the Harvard six cities study. Am J Respir Crit Care Med.
2006;173:667-72.
Van Lenthe FJ, Gevers E, Joung IM, Bosma H, Mackenbach JP. Material and behavioral factors in
the explanation of educational differences in incidence of acute myocardial infarction: The globe
study. Ann Epidemiol. 2002;12:535-42.
Lercher P, Botteldooren D, Widmann U, Uhrner U, Kammeringer E. Cardiovascular effects of
environmental noise: Research in Austria. Noise Health. 2011;13:234-50.
Mackenbach JP, van de Mheen H, Stronks K. A prospective cohort study investigating the
explanation of socio-economic inequalities in health in The Netherlands. Soc Sci Med.
1994;38:299-308.
Miedema HM, Oudshoorn CG. Annoyance from transportation noise: Relationships with exposure
metrics DNL and DENL and their confidence intervals. Environ Health Perspect. 2001;109:409-16.
Miedema HM, Vos H. Associations between self-reported sleep disturbance and environmental
noise based on reanalyses of pooled data from 24 studies. Behav Sleep Med. 2007;5:1-20.
Miller KA, Siscovick DS, Sheppard L, Shepherd K, Sullivan JH, Anderson GL, et al. Long-term
exposure to air pollution and incidence of cardiovascular events in women. N Engl J Med.
2007;356:447-58.
Naess Ø, Nafstad P, Aamodt G, Claussen B, Rosland P. Relation between concentration of air
pollution and cause-specific mortality: Four-year exposures to nitrogen dioxide and particulate
matter pollutants in 470 neighborhoods in Oslo, Norway. Am J Epidemiol. 2007;165:435-43.
Ostro B, Feng WY, Broadwin R, Green S, Lipsett M. The effects of components of fine particulate air
pollution on mortality in California: Results from CALFINE. Environ Health Perspect. 2007;115:13-9.
Peng RD, Bell ML, Geyh AS, McDermott A, Zeger SL, Samet JM, et al. Emergency admissions for
cardiovascular and respiratory diseases and the chemical composition of fine particle air pollution.

Chapter 4
88
Environ Health Perspect. 2009;117:957-63.
Puett RC, Hart JE, Yanosky JD, Paciorek C, Schwartz J, Suh H, et al. Chronic fine and coarse
particulate exposure, mortality, and coronary heart disease in the Nurses' Health Study. Environ
Health Perspect. 2009;117:1697-701.
Rosenlund M, Picciotto S, Forastiere F, Stafoggia M, Perucci CA. Traffic-related air pollution in
relation to incidence and prognosis of coronary heart disease. Epidemiology. 2008;19:121-8.
Schaap M, Denier van der Gon HA. On the variability of black smoke and carbonaceous aerosols in
the Netherlands. Atmos Environ. 2006;41:5908-20.
Schauer JJ, Lough GC, Shafer MM, Christensen WF, Arndt MF, DeMinter JT, et al. Characterization
of metals emitted from motor vehicles. Res Rep Health Eff Inst. 2006;133: 1-76.
Selander J, Nilsson ME, Bluhm G, Rosenlund M, Lindqvist M, Nise G, et al. Long-term exposure to
road traffic noise and myocardial infarction. Epidemiology. 2009;20:272-9.
Sørensen M, Hvidberg M, Andersen ZJ, Nordsborg RB, Lillelund KG, Jakobsen J, et al. Road traffic
noise and stroke: A prospective cohort study. Eur Heart J. 2011;32:737-44.
Sørensen M, Hvidberg M, Hoffmann B, Andersen ZJ, Nordsborg RB, Lillelund KG, et al. Exposure to
road traffic and railway noise and associations with blood pressure and self-reported
hypertension: A cohort study. Environ Health. 2011;10:92.
Sørensen M, Andersen ZJ, Nordsborg RB, Jensen SS, Lillelund KG, Beelen R, et al. Road traffic noise
and incident myocardial infarction: A prospective cohort study. PLoS One. 2012;7:e39283.
Sørensen M, Hoffmann B, Hvidberg M, Ketzel M, Jensen SS, Andersen ZJ, et al. Long-term exposure
to traffic-related air pollution associated with blood pressure and self-reported hypertension in a
Danish cohort. Environ Health Perspect. 2012;120:418-24.
VROM. Meet-en rekenvoorschrift geluidhinder. (Prescribed measurement and calculation methods
for noise annoyance), Staatscourant 2006;249:84.
VROM. Meet-en rekenvoorschrift bevoegdheden luchtkwaliteit. Staatscourant 2006;215:20.
WHO. Air Quality Guidelines: Particulate Matter, Ozone, Nitrogen Dioxide and Sulphur Dioxide.
Global Update 2005. Copenhagen, Denmark: World Health Organization; 2006.
WHO. Burden of Disease from Environmental Noise. Quantification of Healthy Life Years Lost in
Europe. Copenhagen, Denmark: The WHO European Centre for Environment and Health, Bonn
Office, WHO Regional Office for Europe: World Health Organization; 2011.
WHO, Janssen NA, Gerlofs-Nijland ME, Lanki T, Salonen RO, Cassee F, et al. Health Effects of Black
Carbon. Bonn: WHO Regional Office for Europe, The WHO European Centre for Environment and
Health; 2012.

Chapter 5A
Urban road traffic noise and annoyance: the effect of
a quiet façade
Yvonne de Kluizenaar
Erik M. Salomons
Sabine A. Janssen
Frank J. van Lenthe
Henk Vos
Han Zhou
Henk M. E. Miedema
Johan P. Mackenbach
Adapted from J. Acoust. Soc. Am. 2011; 130 (4): 1936–1942

Chapter 5A
90
Abstract
Road traffic noise in urban areas is a major source of annoyance. A quiet façade has been
hypothesized to beneficially affect annoyance. However, only a limited number of
studies investigated this hypothesis, and further quantification is needed. This study
investigates the effect of a relatively quiet façade on the annoyance response. Logistic
regression was performed in a large population based study (GLOBE, N ~ 18,000), to
study the association between road traffic noise exposure at the most exposed dwelling
façade (Lden) and annoyance in: (1) the subgroup with a relatively quiet façade (large
difference in road traffic noise level between most and least exposed façade (Q > 10 dB);
(2) the subgroup without a relatively quiet façade (Q < 10 dB). Questionnaire data were
linked to individual exposure assessment based on detailed spatial data (GIS) and
standard modeling techniques. Annoyance was less likely (ORQ>10 < ORQ<10) in the
subgroup with relatively quiet façade compared to the subgroup without relatively quiet
façade. The difference in response between groups, seemed to increase with increasing
Q and Lden. Results indicate that residents may benefit from a quiet façade to the
dwelling.

Urban road traffic noise and annoyance: the effect of a quiet façade
91
5A.1 Introduction
This study investigates the effect of a quiet façade at the dwelling on the noise response
of inhabitants. Traffic noise in European cities is a major source of annoyance and sleep
disturbance, omnipresent, and hardly avoidable (e.g., de Kluizenaar et al., 2009;
Miedema and Oudshoorn, 2001; Miedema and Vos, 2007; Pearsons et al., 1995).
Exposure to high levels of road traffic noise may in the long term induce further adverse
health effects, including cardiovascular effects (e.g., Babisch et al., 2005; Babisch, 2008;
de Kluizenaar et al., 2007; Passchier-Vermeer and Passchier, 2000). Environmental noise
has been recognized as a serious health problem. In the Guidelines for Community Noise,
the World Health Organization (WHO) estimated about 40% of the population in the
European Union countries to be exposed to road traffic noise with a daytime equivalent
sound pressure level exceeding 55 dB (WHO, 1999). Considering the continuing growth
of road traffic and the large number of people exposed, the need for effective noise
reduction policy has become increasingly pronounced.
Invigorated by the accumulating amount of evidence of the potential harmful effects of
environmental noise, in the Sixth Environmental Action Programme (2002) the EU set
itself the objective of substantially reducing the number of people affected by noise
exposure. This has resulted in the Directive 2002/49/EC on the Assessment and
Management of Environmental Noise (END), which aims to define a common approach
within Europe to prevent or reduce the harmful effects of environmental noise. The
member states are required to make strategic noise maps, create or protect quiet zones,
and to develop action plans in cooperation with the local authorities. Developing
effective policy to protect citizens from the adverse effects of road traffic noise in urban
areas however, is challenging and often not straightforward. Although techniques have
been developed that have reduced noise emission for partial aspects, the vehicle fleet as
a whole has not become much quieter since the 1970s. Source related measures, such as
more stringent rules for road traffic vehicle emissions, remain therefore of utmost
importance, and form an important part of European policy. In addition, following the
END, local authorities have the responsibility to develop action plans to reduce
environmental noise exposure. However, existing local measures such as the application
of silent asphalt, the installation of noise screens, and regulation of the (local) traffic
flow, may not always result in the desired levels of reduction, may be costly, or may in
some cases not even be applicable. Consequently, for the local authorities, this
sometimes seems to leave little room for maneuver. A wider span of practically
applicable and effective alternatives would thus be desirable to complement the existing
policy ‘toolkit’. In urban areas, an optimized approach − utilizing all different available
policy options in combination − is required to create an acceptable noise environment.

Chapter 5A
92
This implies the need for quantification of the effectiveness of practical measures that
may be applied.
Annoyance is the most widely acknowledged effect of environmental noise exposure,
and is considered to be the most widespread. For annoyance of transportation noise,
exposure-effect relationships have been presented (Miedema and Oudshoorn, 2001). In
addition to the noise level at the most exposed façade of the dwelling, other aspects
have been hypothesized to affect the annoyance response at a certain exposure level,
including a quiet façade, living in the vicinity of quiet areas, and insulation (Miedema and
Borst, 2006; Miedema and Borst, 2007). However, to date only a limited amount of
research is available to quantify the impact of these aspects.
Creating quiet façades and quiet urban areas may reduce the harmful effects of noise by
offering an ‘escape’ from the noise to the inhabitants, for example by the option to
reside or sleep at a quiet side of the dwelling, or by the presence of a quiet garden (or
balcony) at the back side of the dwelling. Consequently, inhabitants of a dwelling with a
relatively quiet façade may be expected to be less annoyed (on average) as compared to
inhabitants with the same traffic noise exposure at the most exposed façade but without
a quiet façade. Previous studies have indicated a potential benificial effect of a quiet
façade (Öhrström et al., 2006; Gidlöf-Gunnarsson and Öhrström, 2007). However, to
date limited information is available, and studies on the basis of large datasets are now
needed to further investigate this association. As far as we know, this study is the first to
investigate the effect of a quiet façade on the relationship between road traffic noise
exposure and annoyance response in such a large, population based sample
(N ≈ 18,000). An additional advantage of this large representative random sample of
subjects from a larger urban area, is that different dwelling types within the housing
stock and different source orientations can be assumed to be represented accordingly.
We used objective measures for noise exposure, and odds ratios are studied with
adjustment for potential confounders.
5A.2 Methods
5A.2.1 Study population
The GLOBE study is a prospective cohort study carried out in The Netherlands, with a
primary aim of explaining socioeconomic inequalities in health. GLOBE is the Dutch
acronym for Health and Living Conditions of the Population of Eindhoven and
surroundings. Baseline data were collected in 1991. Details of the study protocol have

Urban road traffic noise and annoyance: the effect of a quiet façade
93
been described elsewhere (Mackenbach et al., 1994), and will only be briefly
summarised here.
In 1991, an a-select sample (stratified by age, degree of urbanization, and socioeconomic
position) of 27,070 non-institutionalized subjects (aged 15 to 74 years) was drawn from
18 municipal population registers in the south-eastern part of The Netherlands and
asked to participate in the study. With a response rate of 70.1%, baseline information
was collected in 1991 from 18,973 individuals using a postal questionnaire. The area of
study included the city of Eindhoven, which was the fifth largest city of The Netherlands
in 1991.
5A.2.2 Noise annoyance response and covariates
The data collection comprised a broad range of potential confounders including
sociodemographic variables (age, gender, marital status, and education), lifestyle factors
(smoking, alcohol use, physical activity, and BMI), and living conditions (employment
status, financial problems). Age was entered in the analyses as a continuous variable,
while gender, BMI, physical activity, marital status, employment status, financial
problems, alcohol use, and education, were entered as categorical variables. BMI was
categorised into four groups (underweight [BMI < 20], normal weight range [BMI 20–25],
overweight [BMI 25–30], obese [BMI >30]). Physical activity was available in four
categories (none, little, moderate, and much physical activity). Marital status was
categorised into four groups (married or living together, unmarried, divorced, and
widow/widower). Employment status was categorised in three categories, including
'unemployed'. Three categories of financial problems were distinguished (no difficulty,
some difficulty, and large difficulty). Alcohol use was categorised into three groups
(moderate, abstainer, and excessive). The highest attained level of education was
distinguished into four different categories (primary education, lower professional and
intermediate general education, intermediate professional and higher general education,
and higher professional education and university). Missings in potential confounding
variables (the percentage of missings for all confounding variables was below 5.6 %)
were imputed, replacing the missing values with the most common category. The
indicator for environmental noise annoyance, which is further referred to as the
annoyance response, was available from the following question in the questionnaire:
“This question concerns the dwelling and surrounding environment in which you live: In
the past year, were you often confronted with annoying levels of sound [in Dutch:
lawaai] from traffic, street noises, aircraft, businesses, etc. (Y/N)?” The response format
is: “Yes”, “No”.

Chapter 5A
94
5A.2.3 Noise exposure
The road traffic noise exposure of the subjects was calculated at the most- and the least
exposed façade of the home address with the Dutch standard method SRM2 in
accordance with requirements of the EU Environmental Noise Directive (END). Road
traffic noise may be assumed to be the dominant source in urban areas. For the analyses
we used the EU standard noise metric Lden. Lden (day-evening-night level) is defined as
the A-weighted ‘average’ sound level over 24 hours in which sound levels during the
evening and the night are increased by 5 dB and 10 dB respectively (International
Standards Organization, 2002) over a year. Noise levels were assessed at the façades of
a dwelling with the highest- and the lowest overall exposure respectively (i.e., most- and
least exposed façade). SRM2 is the Netherlands’ standard method for noise modelling, in
compliance with the END (VROM, 2006a). SRM2 is implemented in Urbis (Borst and
Miedema, 2005), that was used here for the exposure calculations. Noise calculations
were carried out in two steps calculating first the emission and then the transmission.
The emission calculations take into account traffic characteristics, including traffic
intensities, traffic composition (percentages light duty, medium duty, and heavy duty
vehicles), speed, road height, and road surface type. The transmission calculations take
into account the distance between source (road) and dwelling façade, air attenuation,
effects of (yearly) meteorological conditions, ground attenuation, object screening
(diffraction), and reflection of objects opposite the dwelling with one reflection per
sound path. Noise exposure was calculated at the height of the centre of the dwelling
façade of the exposed subject. For the most exposed façade, very low noise exposure
levels (below 45 dB) were recoded as 45 dB, as this can be considered to be a lower limit
of the ambient noise in urban areas. For the least exposed façade, levels below 40 dB
were recoded as 40 dB, as this can be considered a lower limit of the ambient noise level
at the quiet side in urban areas. Road traffic noise levels at both the most and the least
exposed façade could be calculated for most respondents (N = 17,650).
Input data for the noise emission calculations was a detailed digital map describing the
geographic location of roads and the traffic characteristics for each road segment
(including traffic intensities for each vehicle category, speed, and road surface type),
provided by the local authorities of Eindhoven for the current situation (2004). Traffic
data were attached as attributes to the road segments for a dense network of roads,
including highways, arterial roads, main streets, and principal residential streets.
Basis for the noise transmission calculations were digital maps with precise information
on geographic location of buildings and ground characteristics (Topographic Service data
[TOP10]) provided by the Netherlands Ministry of Housing, Spatial Planning and the
Environment (VROM/DGR). Building height was derived from the Actual Height

Urban road traffic noise and annoyance: the effect of a quiet façade
95
Information Netherlands (AHN), a 5 m x 5 m grid with height information based on laser
altimetry. The geographic location of noise screens with their height was provided by the
local authorities of Eindhoven. The geographical location of dwellings within the building
contours (Topographic Service data [TOP10]) was identified with the use of address
coordinates.
5A.2.4 Statistical analysis
Logistic regression was performed to investigate the association between day-evening-
night residential road traffic noise exposure (Lden) and the annoyance response. As a
measure of strength of the association, estimated odds ratios (OR) are presented, where
the odds ratio represents the ratio of the odds in favor of annoyance among the exposed
to the odds in favor of annoyance among the ‘unexposed’ (reference group: noise
exposure most exposed façade ≤45 dB). Odds ratios are presented together with their
corresponding 95% confidence intervals (CI).
For each dwelling the difference Q between the most- and least exposed dwelling façade
is calculated by
min,dendeni LLQ −=
with
Lden: level (Lden) at the most exposed façade,
Lden,min: level (Lden) at the least exposed façade.
The subjects are divided into subgroups depending on Lden and Q. We consider
overlapping intervals of Lden. For the level difference Q we consider two subgroups and
the full population:
Group 0: Full population (All);
Group 1: Q <10;
Group 2: Q >10.
Logistic regression was carried out for the full population (Group 0) as well as for the two
subgroups (Group 1 and Group 2). In the model, factors were included that could
potentially confound the relationship between traffic noise exposure and the annoyance
response. These variables are: age, sex, BMI, physical activity, marital status,
employment status, financial problems, alcohol use, and self-reported level of education.
A P value of at most 0.05 was considered to indicate significance of the association. All
analyses were performed with SPSS Inc. (PASW statistics version 18.0.0).

Chapter 5A
96
5A.3 Results
5A.3.1 Population Characteristics
Table 5A.1 shows the distribution of subjects of the GLOBE study sample over the road
traffic noise exposure categories (Lden), assessed at the most exposed façade of the
dwellings at the home address. There is a clear increase in annoyance response with
increasing noise exposure, with the subjects in the highest road traffic noise exposure
category most often reporting annoyance. The table further shows that the average age
is higher and subjects are on average less often married or living together at higher noise
levels than at lower noise levels.
5A.3.2 Noise exposure
Table 5A.1 shows that the variation in road traffic noise exposure in the study population
of the Eindhoven region is substantial. The difference in exposure between the lowest
exposed 5 % and the highest exposed 5% of dwellings exceeds 20 dB (Lden), ranging from
about 45 dB (urban background) to more than 65 dB (Lden), in the vicinity of roads.
Table 5A.1 Characteristics of the GLOBE cohort by road traffic noise (Lden) [dB] exposure
category at the most exposed façade (unadjusted).
Lden [dB] < 45 45−50 50−55 55−60 > 60
N 5077 4102 2820 2447 3204
Age (years) 46.8 47.0 47.8 48.4 49.2
Sex: Male (%) 48.9 49.1 46.6 49.2 48.0
BMI (QI > 25) (%) 35.6 37.2 37.9 38.3 38.2
Physical activity: much (%) 33.3 33.2 33.9 33.6 31.1
Marital (married/live together) (%) 76.0 75.7 74.9 73.1 68.0
Work situation: unemployed (%) 10.8 10.0 10.2 9.1 10.7
Financial: much difficulty (%) 4.7 4.6 3.9 3.4 3.8
Alcohol use: excessive (%) 8.4 8.3 7.3 7.7 8.6
Education low (%) 20.8 21.5 19.7 20.7 22.9
Annoying levels of sound (Y) (%) 7.9 9.3 12.7 17.3 31.5
Variables are described by means, and percentages in case of dichotomous variables.
Abbreviations are: BMI, Body Mass Index; Lden, road traffic noise level (dB).

Urban road traffic noise and annoyance: the effect of a quiet façade
97
Figure 5A.1 illustrates some typical geographical building orientations towards the roads,
resulting in varying differences between most and least exposed façade (Q). Dwellings
for which Q is smaller than 10, are marked with a black outline. As the figure shows,
these include dwellings exposed from more than one direction (e.g., near cross roads,
indicated with nr. 1 in the figure), and dwelling blocks oriented perpendicular to the road
(nr. 2). In contrast, dwelling blocks oriented parallel to the road source (nr. 3) or built in a
U-shaped formation (nr. 4) creating a noise-shielded side, are characterised by a higher
Q.
Figure 5.A.1 Illustration of some typical geographical orientations of blocks of dwelling
towards the roads.
Table 5A.2 shows the mean differences between most and least exposed façade (Q)
calculated for the different noise categories for: the full population (Group 0, All); the
subgroup without the advantage of a quiet side to the dwelling (Group 1; Q <10); the
subgroup with the advantage of a quiet side (Group 2; Q >10).
The mean level difference Qav for the total population was estimated by the following
calculation: Qav = Σi(Ni Qi,0)/ Σi (Ni) = 7.3 dB, with Ni from Table 5A.1. This value is rather
low as a result of the large percentage (about 50%) of the population in the lowest two
noise categories (including the reference group: Lden ≤ 45 dB). The estimated mean level
difference for the total population excluding the reference group equals 8.7 dB.
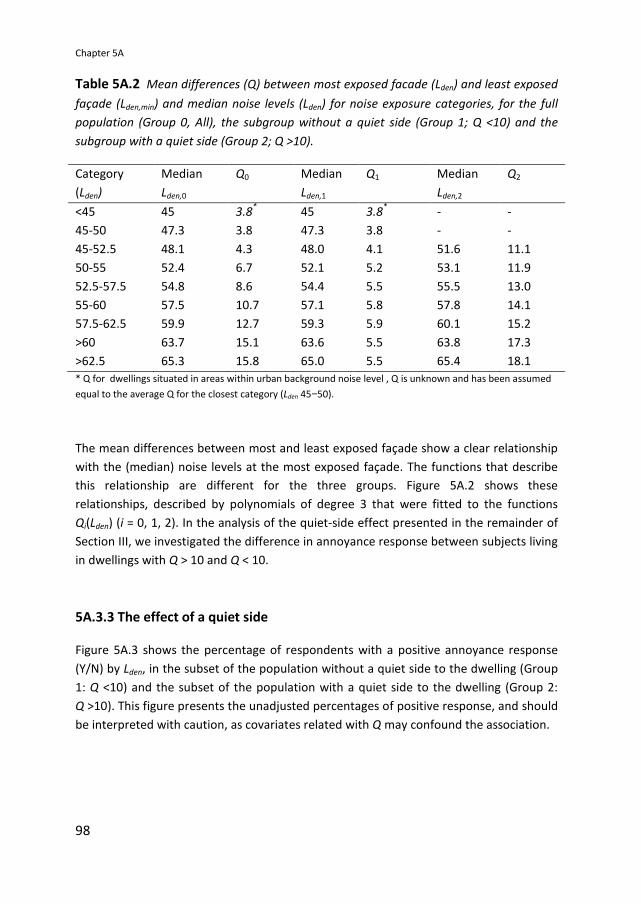
Chapter 5A
98
Table 5A.2 Mean differences (Q) between most exposed facade (Lden) and least exposed
façade (Lden,min) and median noise levels (Lden) for noise exposure categories, for the full
population (Group 0, All), the subgroup without a quiet side (Group 1; Q <10) and the
subgroup with a quiet side (Group 2; Q >10).
Category
(Lden)
Median
Lden,0
Q0 Median
Lden,1
Q1 Median
Lden,2
Q2
<45 45 3.8*
45 3.8*
- -
45-50 47.3 3.8 47.3 3.8 - -
45-52.5 48.1 4.3 48.0 4.1 51.6 11.1
50-55 52.4 6.7 52.1 5.2 53.1 11.9
52.5-57.5 54.8 8.6 54.4 5.5 55.5 13.0
55-60 57.5 10.7 57.1 5.8 57.8 14.1
57.5-62.5 59.9 12.7 59.3 5.9 60.1 15.2
>60 63.7 15.1 63.6 5.5 63.8 17.3
>62.5 65.3 15.8 65.0 5.5 65.4 18.1
* Q for dwellings situated in areas within urban background noise level , Q is unknown and has been assumed
equal to the average Q for the closest category (Lden 45−50).
The mean differences between most and least exposed façade show a clear relationship
with the (median) noise levels at the most exposed façade. The functions that describe
this relationship are different for the three groups. Figure 5A.2 shows these
relationships, described by polynomials of degree 3 that were fitted to the functions
Qi(Lden) (i = 0, 1, 2). In the analysis of the quiet-side effect presented in the remainder of
Section III, we investigated the difference in annoyance response between subjects living
in dwellings with Q > 10 and Q < 10.
5A.3.3 The effect of a quiet side
Figure 5A.3 shows the percentage of respondents with a positive annoyance response
(Y/N) by Lden, in the subset of the population without a quiet side to the dwelling (Group
1: Q <10) and the subset of the population with a quiet side to the dwelling (Group 2:
Q >10). This figure presents the unadjusted percentages of positive response, and should
be interpreted with caution, as covariates related with Q may confound the association.

Urban road traffic noise and annoyance: the effect of a quiet façade
99
Figure 5.A.2 Qi as a function of Lden (i=0, 1, 2), and 3rd
order polynomials.
Figure 5.A.3 Percentage of respondents with a positive annoyance response (Y/N) by
Lden, in the subset of the population without a quiet side to the dwelling (Group 1: Q <10)
and the subset of the population with a quiet side to the dwelling (Group 2: Q >10).

Chapter 5A
100
Table 5A.3 shows the odds ratios for the annoyance response in different noise
categories after adjustment for covariates for the 2 groups. First we calculated the odds
ratios for the following 5 dB noise categories: <45 (reference category), 45-50, 50-55,
55-60, > 60 dB. Second, we additionally calculated the odds ratios for the following noise
categories: <45 (reference category), 45-52.5, 52.5-57.5, 57.5-62.5, >62.5 dB. We
calculated the associations for the additional (overlapping) noise categories in order to
refine the estimated shape of the response function. The table shows that at a given
noise level at the most exposed façade, annoyance is more likely in the group without a
quiet façade (Group 1; Q <10) (higher odds ratios) than in the group with a quiet façade
(Group 2; Q >10).
Table 5A.3 Odds ratios for road traffic noise exposure (Lden) [dB], for the annoyance
response in the GLOBE study sample after adjustment for covariatesa)
for: The subset of
the population without a quiet side to the dwelling (Group 1; Q<10); the subset of the
population with a quiet side to the dwelling (Group 2; Q>10).
Category
(Lden)
Median
Lden,1
OR1 Median
Lden,2
OR2
<45 45 1.00 45 1.00
45-50 47.3 1.19 (1.03−1.39)* - -
45-52.5 48.0 1.26 (1.09−1.44)**
51.6 1.33 (0.84−2.10)
50-55 52.1 1.74 (1.47−2.05)**
53.1 1.63 (1.25−2.13)**
52.5-57.5 54.4 2.23 (1.87−2.66)**
55.4 2.05 (1.67−2.52)**
55-60 57.1 2.75 (2.27−3.34)**
57.8 2.38 (1.99−2.84)**
57.5-62.5 59.3 3.83 (3.09−4.74)**
60.1 2.96 (2.52−3.48)**
>60 63.6 6.93 (5.65−8.50)**
63.8 5.30 (4.63−6.07)**
>62.5 65.0 8.00 (6.30−10.16)**
65.4 6.54 (5.64−7.58)**
* Significant relationship (P < 0.05); ** Significant relationship (P < 0.01). a)
Odds ratios from logistic regression are shown, adjusted for age, sex, Body Mass Index, exercise, marital
status, work situation, financial difficulties, alcohol use, education.
The odds ratio for the two groups with and without a quiet side to the dwelling is
presented in Figure 5A.4. Odds ratios are plotted using the median for each noise
category. Odds ratios are lower in the group with a quiet façade.

Urban road traffic noise and annoyance: the effect of a quiet façade
101
Figure 5.A.4 Odds ratio as a function of road traffic noise exposure at the most
exposed facade (Lden) after adjustment for covariates for: the full population (Group 0;
All); the subset of the population without a quiet side to the dwelling (Group 1: Q <10);
the subset of the population with a quiet side to the dwelling (Group 2: Q >10).
To derive a quantitative estimate of the quiet-side effect, we took the following steps:
First we tested if the strength of the association (odds ratio) within a given noise
category was significantly dependent on quiet side (as defined by Q > 10 dB [Y/N]). This
was done by including the interaction between noise category and quiet side in the
model. This interaction term was significant at higher noise levels for two categories
(> 60 and 57.5 – 62.5 dB).
Second, to estimate the size of the potential beneficial effect, we assessed the difference
between the curves in noise level at which the two groups (1 and 2) showed equal
likelyhood of annoyance response (equal odds ratios). Thus, the potential benefit (in dB)
was assessed by deriving the difference in Lden along horizontal lines, i.e., at equal odds
ratio (equal annoyance response). Values of ∆L were determined as horizontal distances
between the response functions for groups 1 and 2 in Figure 5A.4, for two values of OR:
the OR values of the two noise categories where the quiet-side effect (difference in odds
ratios between groups 1 and 2) was found to be significant:

Chapter 5A
102
i) OR = 3.177, corresponding to Lden = 59.9 dB (median Lden,0 of interval 57.5-62.5 dB);
ii) OR = 5.584, corresponding to Lden = 63.7 dB (median Lden,0 of interval >60 dB).
Thus, the difference in quiet side effect between the two groups was estimated at
approximately 2.5 dB. For the category of respondents with a noise exposure >60 dB, the
average Q was 5.5 in group 1 (Q < 10), and 17.3 in group 2 (Q > 10). For the category of
respondents with a noise exposure between 57.5 and 62.5 dB, the average Q was 5.9 in
group 1 (Q <10), and 15.2 in group 2 (Q >10). Thus, the average difference in Q between
the two groups, for which the above effect (in dB) was estimated, was approximately 10
dB (5.5-5.9 to 15.2-17.3).
5A.4 Discussion and Conclusions
This study investigated the effect of a quiet façade at the dwelling on the noise response
of inhabitants. We tested the hypothesis that a relatively quiet side at the home may
affect the noise annoyance response. Annoyance was less likely (lower odds ratios) for
the subgroup with relatively quiet façade (Q >10 dB) as compared to the subgroup
without relatively quiet façade (Q <10 dB). Thus, a quiet façade was observed to affect
the annoyance response, in addition to the noise level at the most exposed façade,
suggesting that, as hypothesized, residents may benefit from a quiet façade. The
difference in response between groups, seemed to increase with increasing difference
(Q) between exposure at the most and least exposed façade and with increasing Lden at
the most exposed façade.
An effect of having a quiet side on self-reported annoyance has been reported previously
(Gidlöf-Gunnarsson and Öhrström, 2010; Gidlöf-Gunnarsson and Öhrström, 2007;
Öhrström et al., 2006). Öhrström et al. (2006) investigated whether having a quiet side of
one’s dwelling reduced noise annoyance in selected residential areas (four study sites,
similar in dwelling type: flat blocks). A quiet side (as defined by LAeq, 24h ≤ 45 dB) reduced
annoyance, corresponding to a reduction of sound level of approximately 5 dB at the
most exposed side. Gidlöf-Gunnarsson and Öhrström, (2007) added to this finding by
showing that in addition ‘better’ availability of nearby green areas may also reduce the
annoyance response, and Gidlöf-Gunnarsson and Öhrström (2010) showed that physical
environmental quality of the quiet side itself (degree of naturalness and utilization of the
courtyard) may also modify the annoyance response. Our study adds to previous findings
by showing a quiet side effect in a large random (population based) sample. Our results
indicate an effect of a relatively quiet side. In EU’s Environmental Noise Directive (END) a
definition in this line is used: “A quiet façade is defined as a façade where Lden 20 dB
lower than Lden at the most exposed façade (Q ≥ 20 dB).” In an average city however, only
a small percentage of dwellings may meet this criterion: for the city of Amsterdam and

Urban road traffic noise and annoyance: the effect of a quiet façade
103
the Eindhoven region, The Netherlands, an average Q of around 10 dB was calculated:
Salomons et al. (2009) calculated a Qav of 12.4 dB for Amsterdam, while for the
Eindhoven region the average Q was slightly lower than 10 dB.
We used a difference between most and least façade (Q), in line with the definition used
in the END, and taking into account the size of Qav estimated at around 10 dB for Dutch
urban situation, as an approximation of an urban average situation. In this way, we could
take into account that a benefit from a relatively quiet façade is expected. Also in high
exposure situations where the urban background level at the least exposed side may not
be reached.
Some limitations need to be acknowledged. First, the cohort study was originally not
designed as a noise annoyance study, and data on noise annoyance were available for
self-reported annoying levels of sound by environmental noise on a two point scale (Y/N)
only. Despite this, our analysis shows a clear quiet-side effect in the noise-annoyance
response. These findings now need to be confirmed and refined in other population
studies. It should be noted that this is an observational study, where a quiet side was
shown to be associated with the annoyance response. In theory, it cannot be ruled out
that another related factor was responsible for the observed effect. However, a causal
relationship may be assumed, given that the endpoint is specifically noise related, while
the quiet side influences the noise exposure. Furthermore, we tried to minimized this
chance by taking into account a wide range of potential confounders, including age, sex,
BMI, exercise, marital status, work situation, financial difficulties, alcohol use, and
education.
While road traffic noise may be assumed to be the dominant source in urban areas, the
possibility for inhabitants to ‘escape’ from the noise to a quiet side of the dwelling is
dependent also on the noise from sources other than road traffic at the back side of the
dwelling. However, in the analysis this may be compensated in part by the large
population sample (N ~ 18,000). Another possible limitation is that road traffic noise data
for the year 2004 were used for exposure assessment, because no historic data were
available on traffic intensity in 1991. However, although traffic intensities have increased
over the years, the road network is assumed to be rather stable, with only small (if any)
but comparable changes in noise exposure across the population. For example, a recent
study showed that road traffic intensities for a ten year difference in time (1986 and
1996) in The Netherlands were highly correlated (correlation coefficient 0.9) (Beelen et
al., 2009). Other important geographical aspects such as the orientation of dwellings and
the distance to the roads were likely to be stable as well.
Noise exposure in this study was calculated with the Netherlands’ standard calculation
method for road traffic noise modeling. This method is comparable to other European

Chapter 5A
104
engineering methods for road traffic noise mapping. These methods may be further
optimized for more accurate exposure assessment at the least exposed façade. Recently,
Salomons et al. (2009) proposed an engineering model which aims at refining
assessment of exposure at the quiet side. So far, however, this method has not (yet)
been broader adopted for noise mapping.
A strength of this study is that it was carried out in a large random sample drawn from
the general population, of a major urban region (the region of Eindhoven, which was the
fifth largest city of The Netherlands at the start of the cohort study). Thus, a
representative sample of buildings within the study area was obtained, together with the
existing variety in exposure conditions (façade levels and geographical orientations of
dwellings towards the surrounding roads). The large sample size increases the power of
the statistical analysis, while the population based design of the study increases the
possibility to extrapolate the results to the general population, as compared to studies
with smaller or non-random samples. The wide range of both exposure levels and
differences between most and least exposed façade (Q), together with the large sample
size, enabled us to investigate the quiet-side effect for different exposure conditions.
Still, when generalizing the effect estimates for the population in the region of
Eindhoven to other cities, some aspects need consideration. Results of this study have to
be confirmed in different populations. Potentially relevant differences with other cities
may include composition and lay-out of the building stock, traffic composition, exposure,
and population characteristics. Finally, we were able to minimize confounding by
adjusting for a large range of covariates in the model. To our knowledge, this effect has
not been studied (and quantified) in such a large random sample of the population
previously.
The present results suggest that the expected annoyance may be substantially reduced,
when in an early stage of the planning process the availability of a quiet side is
warranted. In cities with busy traffic, access of the inhabitants to quietness is important
to enhance restoration needed to recover from daily stress. This is of primary
importance within their direct living environment (the home). As exposure to road traffic
noise may adversely affect well-being and health in humans, it is important to investigate
practical approaches towards exposure and impact reduction. One such approach may
be to create quiet façades as noise refuges, either in new urban areas, or by modifying
existing urban areas, for example by choosing specific orientations of houses with
respect to roads, or by modifying traffic flows. While developing of action plans as part
of environmental noise policy, special urgency may be assigned to dwellings which not
only have high noise levels at the most exposed façade, but in addition also do not have
a quiet side. In the development of new urban areas and urban renewal initiatives,
measures geared towards creating new (or protecting existing) quiet facades may be

Urban road traffic noise and annoyance: the effect of a quiet façade
105
adopted in an early stage of the spatial planning process to protect and improve the
quality of the noise environment.
References
Babisch W, Beule B, Schust M, Kersten N, Ising H. Traffic noise and risk of myocardial
infarction. Epidemiology. 2005;16:33–40.
Babisch W. Road traffic noise and cardiovascular risk. Noise Health. 2008;10(38):27–33.
Borst HC, Miedema HME. Comparison of noise impact indicators, calculated on the basis
of noise maps of DENL. Acta Acust. 2005;91:378–385.
Gidlöf-Gunnarsson A, Öhrström E. Noise and well-being in urban residential
environments: The potential role of perceived availability to nearby green areas.
Landscape Urban Plan. 2007;83:115–126.
Gidlöf-Gunnarsson A, Öhrström E. Attractive “quiet” courtyards: a potential modifier of
urban residents responses tot road traffic noise? Int J Environ Res Public Health
2010;7:3359−3375.
Kluizenaar Y de, Janssen SA, Van Lenthe FJ, Miedema HME, Mackenbach JP. Long-term
road traffic noise exposure is associated with an increase in morning tiredness. J Acoust
Soc Am. 2009;126(2):626–633.
Kluizenaar, Y. de, Gansevoort RT, Miedema HME, Jong PE de. Hypertension and road
traffic noise exposure. J Occup Environ Med. 2007;49(5):484–492.
Mackenbach JP, Mheen H. van de, Stronks K. A prospective cohort study investigating
the explanation of socioeconomic inequalities in health in The Netherlands. Soc Sci Med.
1994;38:299–308.
Miedema HME, Oudshoorn CGM. (2001). Annoyance from transportation noise:
relationships with exposure metrics DNL and DENL and their confidence intervals.
Environ Health Perspect. 2001;109:409–416.
Miedema HME, Borst HC. Rating environmental noise on the basis of noise maps.
Proceedings of Euronoise 2006, Tampere, Finland.
Miedema HME, Borst HC. Rating environmental noise on the basis of noise maps within
the framework of the EU Environmental Noise Directive. Proceedings of Internoise 2007,
Istanbul, Turkey.

Chapter 5A
106
Miedema HME, Vos H. Associations between self-reported sleep disturbance and
environmental noise based on reanalyses of pooled data from 24 studies. Behav Sleep
Med. 2007;5(1):1–20.
Pearsons KS, Barber DS, Tabachnick BG, Fidell S. (1995). Predicting noise-induced sleep
disturbance. J Acoust Soc Am. 1995;97:331–338.
Öhrström E, Skanberg A, Svensson H, Gidlöf-Gunnarsson A. Effects of road traffic noise
and the benefit of access to quietness. J Sound Vib. 2006;295:40–59.
Passchier-Vermeer W, Passchier WF. Noise exposure and public health. Environ Health
Perspect. 2000;108,123–131.
Salomons EM, Polinder H, Lohman WJA, Zhou H, Borst HC, Miedema HME. Engineering
modeling of traffic noise in shielded areas in cities. J Acoust Soc. Am. 2009;126
2340-2349.
VROM. (2006). Meet- en rekenvoorschrift geluidhinder 2006 (Prescribed measurement
and calculation methods for noise annoyance 2006). Staatscourant 21 december 2006a:
249, 84.
WHO. Berglund, B., Lindvall, T., Schwela, D. (1999). Guidelines for Community Noise.
Geneva: Word Health Organization.

Chapter 5B
Road traffic noise and annoyance: a quantification of
the effect of quiet side exposure at dwellings
Yvonne de Kluizenaar
Sabine A. Janssen
Henk Vos
Erik M. Salomons
Han Zhou
Frits van den Berg
Adapted from Int. J. Environ. Res. Public Health 2013; 10: 2258-2270

Chapter 5B
108
Abstract
Previous studies indicate that residents may benefit from a “quiet side” in their
dwellings. The influence of the level of road traffic noise exposure at the least
exposed side on road traffic noise annoyance was studied in Amsterdam, The
Netherlands. Road traffic noise exposure was assessed at the most and least
exposed façade (Lden,most and Lden,least respectively) of dwellings for subjects in a
population based survey (N = 1,967). It was investigated if and to what extent
relative quietness at the least exposed façade affected the level of road traffic
noise annoyance by comparing two groups: (1) the subgroup with a relatively
quiet façade; (2) the subgroup without a relatively quiet façade (large versus small
difference in exposure between most and least exposed façade; DIF ≥ 10 dB and
DIF < 10 dB respectively). In addition, it was investigated if and to what extent
Lden,least affected the level of road traffic noise annoyance. Results indicate a
significantly lower road traffic noise annoyance score at a given Lden,most, in the
subgroup with DIF ≥ 10 dB versus DIF < 10 dB. Furthermore, results suggest an
effect of Lden,least independent of Lden,most. The estimated size of the effect
expressed in an equivalent change in Lden,most approximated 5 dB for both the
difference between the two subgroups (DIF ≥ 10 dB and DIF < 10 dB), and for a 10
dB change in Lden,least.

Road traffic noise and annoyance: a quantification of the effect of quiet side exposure at dwellings
109
5B.1 Introduction
Exposure to environmental noise has been associated with a broad range of health
effects. Of these effects, annoyance is the most widely recognized and is considered the
most prevalent. In a recent study, the WHO concluded that sleep disturbance and
annoyance form the main burden of disease from environmental noise in Europe (WHO,
2011). Road traffic is an important cause of noise annoyance in urban areas. For traffic
noise annoyance, exposure-response relationships have been established based on
pooled analyses of a large international database (Miedema and Oudshoorn, 2001). In an
EU position paper, these relationships have been recommended to be used for estimating
the expected prevalence of traffic noise annoyance (EC, 2002a). The expected prevalence of
annoyance is predicted from levels of exposure at the most exposed façade of dwellings.
However, locally the actual prevalence of noise annoyance may substantially differ from
predicted values (see e.g., Miedema et al., 1998). This difference may be explained by a
broad range of (area specific) characteristics of both the population and the physical
environment.
One of these characteristics is the exposure at the least exposed side of dwellings.
People living in dwellings with a (relatively) quiet least exposed side may be expected to
be better off than average. Similarly, inhabitants of dwellings with relatively high noise
exposure at multiple sides may be expected to be worse off than average. It has been
previously hypothesized that access to a quiet side may reduce the adverse effects of
noise by offering an “escape” from the noise to the inhabitants, e.g., by providing the
option to spend time or sleep at the quiet side of the dwelling (Miedema and Borst,
2006; Miedema and Borst, 2007).
Previous studies indeed indicate that having access to a (relatively) quiet side is
associated with a comparatively lower annoyance (Öhrström et al., 2006; de Kluizenaar
et al., 2011; Van Renterghem et al., 2012). Different approaches to investigate the
influence of exposure at the least exposed side have been followed. For example,
Öhrström et al. defined a quiet side as an exposure level at the least exposed façade
below 45 dB LAeq,24h, while other studies have looked at the influence of a relatively quiet
façade, expressed as an indicator for difference between the exposure at the most and

Chapter 5B
110
the least exposed side (Öhrström et al., 2006). To date, however, only a limited number
of studies is available. More studies are needed to further corroborate the hypothesized
effect, and to enable the comparison of results between studies in different populations.
Furthermore, there is a need for further quantification of the influence of exposure at
the least exposed side. In this study, the influence of the level of road traffic noise
exposure at the least exposed side on annoyance was studied in a population based
survey in Amsterdam, The Netherlands. Road traffic noise annoyance was available on an
11 point scale for a large urban population. The effect of exposure at the least exposed
side was investigated in two ways. First, it was investigated if and to what extent relative
quietness at the least exposed façade affected the road traffic noise annoyance level.
Second, it was investigated if and to what extent the road traffic noise level at the least
exposed side (Lden,least, continuous) affected the level of road traffic noise annoyance, in
addition to the level at the most exposed side (Lden,most,continuous).
5B.2 Methods
Road traffic noise exposure at both the most and the least exposed façade of dwellings
(Lden,most and Lden,least, respectively), was estimated by model calculations for all addresses
in the city of Amsterdam. Noise exposure was linked to questionnaire data on self-
reported traffic noise annoyance and potential confounding factors of subjects in a
population based survey. In this way a substantially sized sample with both noise
exposure and response data was obtained. This provided the opportunity to investigate
the hypothesized association between exposure at the least exposed side of the dwelling
on the annoyance response of the inhabitants.
5B.2.1 Study Population
Survey data were collected in 2008 by the Public Health Service (GGD) of the
Municipality of Amsterdam (Amsterdam Health Monitor 2008) (Dijkshoorn et al., 2009).
The following procedure was used: First, a random sample of 13,600 inhabitants of
Amsterdam was drawn from the municipal population register. From this initial sample,

Road traffic noise and annoyance: a quantification of the effect of quiet side exposure at dwellings
111
subjects who had moved out of the study area or had died were excluded. Secondly, the
sample was stratified by age and by district, to ensure comparable representation of all
age groups and all urban districts (city boroughs) of Amsterdam. Two different versions
of the questionnaire were developed: one version was dedicated to the 16 to 54 years
age group, and one version for the older age group (aged 55 years and older). The
annoyance question was available only in the questionnaire for the age group of 16 to 54
years olds. This sub sample consisted of 6,800 subjects, who were invited to participate.
Addresses were available only for respondents who had indicated that their data could
be used for further studies. The response rate was approximately 50%. Thus, road traffic
noise exposure at the dwelling façades could be estimated for 1,967 subjects.
Survey data were collected by a postal questionnaire or by an internet questionnaire, or
(if requested) with the aid of an interviewer. The main purpose of the survey was to
gauge the health status of the Amsterdam adult population, including demographic,
socioeconomic, psychosocial, and environmental determinants. The survey included
questions on self-reported noise annoyance from a number of sources (apart from road
traffic noise including e.g., noise from neighbors and humming noise [e.g., from fans]),
and a broad range of potential confounders including socio-demographic variables (e.g.,
age, gender, and education level). Data on education were available in four categories:
low (primary education), medium low (lower professional and intermediate general
education), medium high (intermediate professional and higher general education), and
high education (higher professional education and university).
Data on road traffic noise annoyance were available from the following questions in the
questionnaire: “Thinking of the last 12 months, when you are at home, which number on
a scale from 0 to 10 best represents to what extent you are being annoyed or disturbed
by noise from the following sources”, followed by: (a) traffic on roads with a maximum
speed limit greater than 50 km/h, and (b) traffic on roads with a maximum speed limit of
50 km/h. From these two road traffic noise annoyance questions, an annoyance scale
was constructed by taking for each respondent the maximum score of both items. It was
also possible to indicate that either type of traffic noise was not audible.

Chapter 5B
112
5B.2.2 Noise Exposure
Exposure to road traffic noise was determined by model calculations for all dwellings
(addresses in the population registry) in the city of Amsterdam. For each dwelling,
exposure levels were calculated at the most and least exposed façade (Lden,most and Lden,least,
respectively). Here, Lden is the day-evening-night level, which is a “weighted average” of the
levels Lday for the day period (7:00–19:00 h), Levening for the evening period (19:00–23:00
h), and Lnight for the night period (23:00–7:00 h), and includes “penalties” of 5 and 10 dB
for the evening and night periods, respectively. The model calculations were performed
with the Dutch standard calculation method for road traffic noise (SRM2) (VROM, 2006).
This method is a standard engineering method, which is also used for strategic noise
mapping in the framework of the Environmental Noise Directive 2002/49/EC (END) (EC,
2002b). Input for the model calculations includes: geometrical data of buildings and
noise barriers, geometrical data of roads (location and surface type of road segments),
traffic data for all road segments (vehicle intensities, traffic composition [incl. light
vehicles {passenger cars}, medium-heavy vehicles, and heavy vehicles], and driving
speed), and geometrical data for land surface types. The data were provided by the
municipality of Amsterdam, for the year 2011. Road traffic data were available for the
urban roads with substantial traffic intensities in Amsterdam (typically with a traffic
intensity above about 1,000 vehicles per 24 h). Noise levels were calculated depending
on the height of the dwelling.
For the most exposed façade, noise levels below 45 dB were recoded as 45 dB. The level
of 45 dB was assumed an approximate representation of ambient noise in urban areas.
This value has previously been used as a cut off value for the most exposed façade, e.g.,
in the development of the exposure response curves for annoyance (Miedema et al.,
2001; Miedema et al., 1998). For the least exposed façade, levels below 40 dB were
recoded as 40 dB, which was assumed an approximate representation of ambient noise at
the quiet side in urban areas.

Road traffic noise and annoyance: a quantification of the effect of quiet side exposure at dwellings
113
5B.2.3 Statistical Analyses
Linear regression analyses were performed to investigate the relationship between road
traffic noise exposure at the most exposed façade, and at the least exposed façade, and
the annoyance score (scale 0 to 10). Exposure at the least exposed façade was entered in
the model two ways: First, the effect of a relatively quiet façade was investigated
(difference between most and least exposed façade (DIF < 10 dB versus DIF ≥ 10 dB)).
Second, the influence of the road traffic noise level at the least exposed façade (Lden, least,
as a continuous variable) was investigated. Linear regression analyses were carried out
for 3 models: (1) unadjusted model; (2) adjusted model (adjustment for age, gender, and
education); (3) full model: as (2) with additional adjustment for annoyance from noise by
neighbors and humming sounds (e.g., fans), as these sources possibly disrupt quietness
at the least exposed façade. All analyses were carried out with the statistical software
package IBM SPSS statistics version 20.0.0.
5B.3 Results
5B.3.1 Characteristics of the Study Population
Table 5B.1 shows the characteristics of the Amsterdam study population. The average
age of the study population is approximately 36 years. Relatively more women than men
participated in the study, and the percentage of subjects with high education level is
comparatively high with slightly over 50%. The average reported road traffic noise
annoyance score (scale 0 to 10) in the Amsterdam study population is approximately 2.
The average annoyance from neighbor noise exceeds this average with a mean score of
approximately 3. Figure 5B.1 shows the mean road traffic noise annoyance score, for
categories of Lden,most with confidence intervals, for the Amsterdam study population.

Chapter 5B
114
Table 5B.1 Characteristics of the Amsterdam study population
Variable
Age (average, SD) 35.8 (10.4)
Men (%) 38.7
Women (%) 61.3
Education low (%) 6.9
Education medium low (%) 17.3
Education medium high (%) 25.2
Education high (%) 50.6
Annoyance road traffic noise scale 0 to 10 (average, SD) 2.2 (2.7)
Annoyance noise neighbors scale 0 to 10 (average, SD) 2.9 (2.9)
Annoyance noise humming sound (e.g., fans) scale 0 to 10 (average, SD) 1.3 (2.3)
Lden,most (average, SD) 52.3 (8.0)
Lden,least (average, SD) 41.7 (3.7)
Relatively quiet façade (DIF ≥ 10 dB; %) 40.5
Figure 5B.1 Mean road traffic noise annoyance score (scale 0 to 10), with 95%
confidence intervals for the Amsterdam study population

Road traffic noise and annoyance: a quantification of the effect of quiet side exposure at dwellings
115
5B.3.2 Relatively Quiet Façade and Annoyance
Figure 5B.2 presents the mean annoyance score for the subgroup with a relatively low
difference between most and least exposed façade (DIF < 10 dB) and the subgroup with a
relatively high difference between most and least exposed façade (DIF ≥ 10 dB), by most
exposed façade road traffic noise level (Lden,most). The figure suggests the mean
annoyance scores are lower for the subgroup with a relatively quiet façade, although not
consistently for all categories of Lden,most.
Figure 5B.2 Mean annoyance score (scale 0 to 10) in the Amsterdam study
population for two categories of difference between most and least exposed
façade (DIF < 10 dB versus DIF ≥ 10 dB), using 5 dB intervals of Lden,most.
Table 5B.2 provides an overview of the results from the linear regression analyses. In the
analyses, the annoyance score is predicted from the exposure at the most exposed
façade (Lden,most; dB; continuous) and the availability of relative quietness at the least

Chapter 5B
116
exposed façade (difference between Lden,most and Lden,least in two categories (DIF < 10 dB
versus DIF ≥ 10 dB)), with additional adjustment for covariates in the two extended
models. Table 5B.2 shows that there was a significant association between road traffic
noise annoyance and the availability of relative quietness at the least exposed façade,
with significantly lower annoyance in a situation with a relatively high difference as
compared to a relatively low difference in exposure at the most and least exposed
façade. The table shows that the parameter B estimates remain significant and similar in
magnitude between the three models, indicating that the effect did not diminish after
additional adjustment. Adjusted R Squared of Model 1, 2 and 3 are 0.055, 0.055 and
0.214 respectively. The adjusted R Squared of these same models, but without relative
quietness, are slightly lower, with 0.053, 0.053 and 0.212 respectively. The interaction
between Lden,most and relative quietness was tested. However, this was found to be not
significant (results not shown).
Table 5B.2 Parameter estimates for the contribution of Lden,most (dB, continuous)
and the difference between Lden,most and Lden,least (DIF ≥ 10 dB versus DIF < 10) in the
linear regression model for annoyance score.
BModel 1 (SE) BModel 2 (SE) BModel 3 (SE)
Lden,most 0.101 (0.013) ***
0.100 (0.013) *** 0.099 (0.012) ***
DIF ≥ 10 −0.463 (0.205) *
−0.448 (0.207) *
−0.481 (0.190) *
Model 1: Unadjusted model; Model 2: Adjusted for age, gender, education; Model 3: Full model:
Adjusted for age, gender, education, annoyance from neighbor noise and humming noise (e.g., fans).
Statistical significance is indicated as usual: * p < 0.05; **
p < 0.01; *** p < 0.001. The numbers B (SE)
are the unstandardized regression coefficients, with their standard error (in brackets).
In Figure 5B.3 regression lines are shown for the two subgroups of most and least
exposed façade exposure difference (DIF < 10 dB versus DIF ≥ 10 dB), for the full model.
Results are visualized for the assumption of equal gender distribution, average age, most
prevalent education level, and average annoyance score from neighbor noise and
humming noise (e.g., fans). The parameter B estimate for Lden,most determines the slope of

Road traffic noise and annoyance: a quantification of the effect of quiet side exposure at dwellings
117
the regression line, while the parameter B estimate for the difference determines the
additional change in annoyance score related to this difference. The horizontal shift in
the regression lines, which can be read from the figure by looking at equal annoyance
scores, provides an estimate of the difference in “effective noise level” (Lden,most’)
between these two groups. The figure shows that the horizontal shift in the regression
lines approximates 5 dB, Lden,most.
Figure 5B.3 Road traffic noise annoyance score predicted from Lden,most (dB,
continuous) and difference between Lden,most and Lden,least in two categories (DIF < 10
dB versus DIF ≥ 10 dB). Results from linear regression analyses.
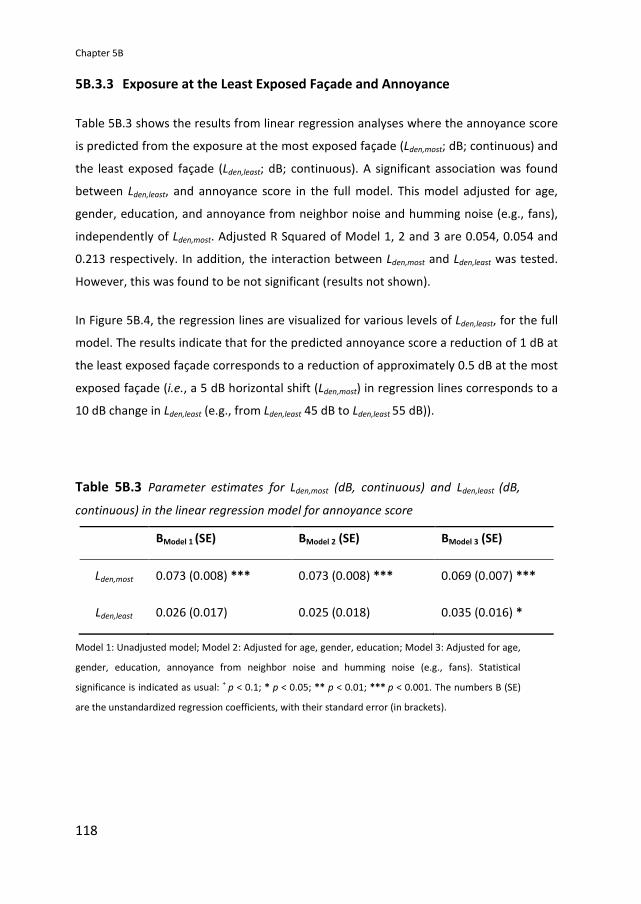
Chapter 5B
118
5B.3.3 Exposure at the Least Exposed Façade and Annoyance
Table 5B.3 shows the results from linear regression analyses where the annoyance score
is predicted from the exposure at the most exposed façade (Lden,most; dB; continuous) and
the least exposed façade (Lden,least; dB; continuous). A significant association was found
between Lden,least, and annoyance score in the full model. This model adjusted for age,
gender, education, and annoyance from neighbor noise and humming noise (e.g., fans),
independently of Lden,most. Adjusted R Squared of Model 1, 2 and 3 are 0.054, 0.054 and
0.213 respectively. In addition, the interaction between Lden,most and Lden,least was tested.
However, this was found to be not significant (results not shown).
In Figure 5B.4, the regression lines are visualized for various levels of Lden,least, for the full
model. The results indicate that for the predicted annoyance score a reduction of 1 dB at
the least exposed façade corresponds to a reduction of approximately 0.5 dB at the most
exposed façade (i.e., a 5 dB horizontal shift (Lden,most) in regression lines corresponds to a
10 dB change in Lden,least (e.g., from Lden,least 45 dB to Lden,least 55 dB)).
Table 5B.3 Parameter estimates for Lden,most (dB, continuous) and Lden,least (dB,
continuous) in the linear regression model for annoyance score
BModel 1 (SE) BModel 2 (SE) BModel 3 (SE)
Lden,most 0.073 (0.008) ***
0.073 (0.008) ***
0.069 (0.007) ***
Lden,least 0.026 (0.017)
0.025 (0.018) 0.035 (0.016) *
Model 1: Unadjusted model; Model 2: Adjusted for age, gender, education; Model 3: Adjusted for age,
gender, education, annoyance from neighbor noise and humming noise (e.g., fans). Statistical
significance is indicated as usual: +
p < 0.1; * p < 0.05; ** p < 0.01; *** p < 0.001. The numbers B (SE)
are the unstandardized regression coefficients, with their standard error (in brackets).

Road traffic noise and annoyance: a quantification of the effect of quiet side exposure at dwellings
119
Figure 5B.4 Road traffic noise annoyance score predicted from Lden,most (dB,
continuous) and Lden,least (dB, continuous). Results from linear regression analyses.
5B.4 Discussion and Conclusions
The results of this study indicate that there is an association between road traffic noise
annoyance and both the availability of relative quietness at the least exposed side of
dwelling, and the actual exposure level at the least exposed façade itself (Lden,least),
independent of Lden,most. The road traffic noise annoyance score (at a given exposure level
at the most exposed façade) was lower in the group with relative quietness at the least
exposed façade, expressed as a an exposure difference between most and least exposed
façade (DIF ≥ 10 dB). Similarly, results suggested lower annoyance with decreasing noise
level at the least exposed façade (Lden,least). An association between Lden,least and
annoyance, independent of Lden,most, indicates not only that lower exposures at the least
exposed façade may be better for the inhabitants, it also implies that higher exposures at
the least exposed façade may increase adverse effects. In addition, it should be noted
that even at low values of Lden,least, adverse effects are still to be expected when Lden,most is

Chapter 5B
120
high. Similarly, the results on relative quietness only indicate a difference in expected
road traffic noise annoyance score between the groups with a DIF < 10 dB compared to
DIF ≥ 10 dB. However, also at a DIF ≥ 10 dB, at high façade levels (e.g., Lden,most = 71 dB,
Lden,least = 60 dB), exposures are still undesirably high, and on the bases of existing
exposure response curves (see e.g. WHO, 2011), still adverse health effects are to be
expected (even though people might be (slightly) better off than in a situation with an
exposure of e.g., 71 dB on multiple sides). Nevertheless, these results provide further
support for the hypothesis that inhabitants exposed to road traffic noise may benefit
from a quiet side to the dwelling.
These results are in line with previous studies. Öhrström et al. previously investigated
the potential benefit of a quiet side to the dwelling amongst 956 individuals aged 18–75
years, within the Soundscape Support to Health research programme (Öhrström et al.,
2006). They studied the relationship between having access to a quiet side of the
dwelling (defined as a façade with an LAeq,24h ≤ 45 dB) and a number of adverse noise
effects, including annoyance. Results indicated that having access to a quiet side
corresponded to a decrease in disturbances by an average of 30–50%. This decrease was
estimated to correspond to a reduction in noise level at the most-exposed side of about
5 dB (LAeq,24h). Likewise, de Kluizenaar et al., (2011) studied the association between road
traffic noise and the environmental noise annoyance response within two groups: the
subgroup with a relatively quiet façade (difference in road traffic noise level between the
most and least exposed façade > 10 dB Lden), and the subgroup without a relatively quiet
façade (difference < 10 dB) (de Kluizenaar et al., 2011). Results suggested annoyance to
be less likely in the group with a relatively quiet façade. The recent study of Van
Renthergem and Botteldooren provides additional support for a beneficial effect of the
presence of a quiet façade at a dwelling (Van Renterghem et al., 2012). This study
showed that the absence of a quiet façade (expressed as a difference in road traffic noise
level between the most and least exposed façade < 10 dB) leads to a substantial increase of
self-reported noise annoyance.
Further and indirect evidence for the potential benefit of a quiet side came from studies
that investigated the difference in noise response between respondents having a
bedroom facing the traffic source, or facing the noise shielded side. In a study on road

Road traffic noise and annoyance: a quantification of the effect of quiet side exposure at dwellings
121
traffic noise annoyance and sleep disturbance in a stratified random sample of 1,000
respondents, Bluhm et al. (2004) reported a lower prevalence of both self-reported road
traffic noise annoyance and sleep disturbance for respondents with their bedroom facing
a “quiet side” (defined as: not facing the street). Amundsen et al. (2011) estimated the
benefit of having the bedroom facing the noise-shielded side of the dwelling on noise
annoyance to correspond to a 6 dB noise reduction. In other words, the difference in
annoyance between “having the bedroom on the least-exposed façade” versus “having
the bedroom on the most-exposed façade” was estimated to correspond to an exposure
difference of 6 dB in outdoor noise level (LAeq,24h) at the most exposed façade. In line with
these findings Gidlöf-Gunnarsson et al., based on field study data obtained for 1,695
respondents, reported a twice as high prevalence of general noise annoyance among
residents in dwellings with a balcony/patio oriented towards the railway, and about 1.5
times higher for residents with their bedroom facing the railway (Gidlöf-Gunnarsson et
al., 2012). Furthermore, Lercher et al. (2011) reported on the ALPNAP-study, where they
found a clear trend of reduced risk of hypertension for participants with their bedroom
facing a quiet yard. In addition, Selander et al. (2009) found that risk estimates for
myocardial infarction were particularly elevated for participants annoyed by noise mostly
in their bedroom. The above results indicate a possible mechanistic pathway through
disturbance of sleep, and/or the importance of exposure at the least exposed side
(assuming that on average, particularly at higher exposure levels, people tend to sleep at
the quiet side if they have the option).
In addition to access to a quiet side as such, the visual and functional quality of the quiet
side has been suggested to have an influence. In a previous study, Gidlöf-Gunnarsson
and Öhrström studied the influence of the physical environmental quality (degree of
naturalness and utilization) of “quiet” outdoor courtyards (defined as LAeq,24h ≤ 48 dB,
façade reflex included) in a sample of 385 residents (Gidlöf-Gunnarsson et al., 2010). They
found that access to a “high quality” quiet court yard was associated with less noise
annoyance among the residents. Furthermore, the results of an earlier study by the same
researchers have suggested that “better” availability to nearby green areas may
decrease the risk of annoyance (Gidlöf-Gunnarsson et al., 2007). Thus, all of the above
factors may affect the perceived quality of the least exposed side, and potentially may
(positively or negatively) affect its benefit. In the “Quiet Places Project” in Amsterdam,

Chapter 5B
122
Booij and van den Berg (2012) also reported the potential importance of the presence of
vegetation and other pleasant stimuli, in addition to relative quietness of a place, based on a
survey among 809 respondents.
Some limitations should be noted. Since this is an observational study with a cross
sectional design, the possibility that a related factor other than road traffic noise was in
fact responsible for the observed effect, in theory cannot be fully ruled out. However, as
the investigated effect is specifically road traffic noise related, and the least exposed side
exposure influences the overall road traffic noise exposure, a causal relationship is
plausible. Secondly, while road traffic noise may be assumed to be the dominant source
of environmental noise in urban areas, the possibility for inhabitants to “escape” from
the noise to a quiet side of the dwelling will also depend on the noise from other
sources, which may harm the relative quietness at the back side of a dwelling. Indeed,
previous research has shown that noise generated by installations (e.g., fans) at the quiet
side of dwellings can cause substantial annoyance and thereby “spoil” the quiet (Persson
Waye et al., 2003). Similarly, noise from neighbors may affect the “quietness” at the
least exposed side. In view of both issues raised above, we tried in this study to minimize
the risk of confounding by adjustment for a number of potential confounders, including
education (as an indicator of socio-economic status), age, and gender, as well as the
influence of noise from other sources: neighbors and installations (humming noise e.g.,
fans). However, it should be noted that other potentially important modifying factors,
about which unfortunately no information was available, may influence the effect of the
quiet side exposure, such as orientation of the bedroom towards the noise source, noise
sensitivity, and the visual quality and accessibility of the quiet side.
The study population consisted of a sample of the total Amsterdam city population. Still,
the possibility that the generalizability of results to the Amsterdam city population may
to some extent have been influenced by selective response cannot be ruled out.
Furthermore, it is not known to what extent the inhabitants of the city of Amsterdam
may be representative to the general population in The Netherlands or in Europe.
Therefore, it would be valuable to investigate the influence of noise exposure at the least
exposed side to confirm results in future studies, also in other cities.

Road traffic noise and annoyance: a quantification of the effect of quiet side exposure at dwellings
123
In this study, road traffic noise exposure was calculated with The Netherlands’ standard
calculation method for road traffic noise, SRM2, a method that is comparable to other
European engineering methods for road traffic noise modeling. These methods may be
further optimized for refined exposure assessment at the noise shielded side of buildings
(Salomons et al., 2009). So far however, no such method has (yet) been adopted for
noise mapping. Should this limitation have affected the effect estimate, it may be
assumed that the actual association is slightly stronger than found. However, this would
need to be confirmed in future studies. Furthermore, road traffic data was available for
the urban roads with substantial traffic intensities in Amsterdam (including roads
typically with a traffic intensity above about 1,000 vehicles per 24 h). In future studies
the exposure assessment may be further refined if traffic intensity data will become
available also for the smallest roads in the network. Currently, however, this is typically
not available at that level of detail. Nevertheless, our results show a clear association
between quiet side indicators and the noise annoyance. In this study both detailed
information on road traffic noise annoyance as well as objectively assessed road traffic
noise exposure levels were available for a large sample of residents (N = 1,967). Road
traffic noise annoyance was available on a scale from 0 to 10 (11 point scale), in line with
the international recommendation (Fields et al., 2001). The large sample size, together
with this detailed information for each resident, may be expected to have increased the
power of the analysis.
In large urban areas, access of residents to quietness is important to allow and support
restoration needed to recover from the impact of stress caused by daily activities. This is
likely to be of particular importance in the immediate living environment, the home. This
study provides further support for the hypothesized benefit of quietness at the least
exposed façade. Because of the adverse effects of noise exposure on health (WHO,
2011), it is important to avail of practical applicable measures to reduce the impact of
exposure for urban residents as much as possible. In urban planning processes, first of
all, this needs to be addressed by striving towards low exposure at dwellings in general,
starting with the most exposed façade, which still appears to have a higher impact on
annoyance. One approach to further improve the noise environment may be the
creation of quiet facades to offer an “escape” to the noise for the inhabitants. In existing

Chapter 5B
124
situations with high exposure levels, particular attention may need to be paid to
dwellings with high exposure at multiple sides.
References
Amundsen AH, Klaeboe R, Aasvang GM. The Norwegian façade insulation study: The
efficacy of façade insulation in reducing noise annoyance due to road traffic. J Acoust Soc
Am. 2011;129:1381–1389.
Bluhm G, Nordling E, Berglind N. Road traffic noise and annoyance—An increasing
environmental health problem. Noise Health. 2004;6:43–49.
Booi H, van den Berg F. Quiet areas and the need for quietness in Amsterdam. Int J
Environ Res Public Health. 2012;9:1030–1050.
Dijkshoorn H, Fakiri FE, Janssen A, Ujcic-Voortman J, Verhagen C. Opzet en Evaluatie
Dataverzameling Amsterdamse Gezondheidsmonitor 2008 (Design and Evaluation of
Datacollection Amsterdam Health Monitor 2008); GGD Amsterdam (Public Health service
Amsterdam): Amsterdam, The Netherlands, 2009.
European Commission. Position Paper on Dose Response Relationships between
Transportation Noise and Annoyance. EU’s Future Noise Policy, WG2-Dose/Effect; Office
of Official Publications of the European Communities: Luxembourg, Luxembourg, 2002a.
European Commission, DG Environment. Directive 2002/49/EC of the European
Parliament and of the Council. Brussels: EU/DG Environment, 2002b. Available online:
http://ec.europa.eu/environment/noise/ (accessed on 27 May 2013).
Fields JM, de Jong RG, Gjestland T, Flindell IH, Job RFS, Kurraf S, Lercher P, Vallet M, Yano
T, Guski R, Felscher Suhr U, Schumer R. Standarized general purpose noise reaction
questions for community noise surveys: Research and a recommendation. J Sound Vib.
2001;242:641–679.

Road traffic noise and annoyance: a quantification of the effect of quiet side exposure at dwellings
125
Gidlöf-Gunnarsson A, Ögren M, Jerson T, Öhrström E. Railway noise annoyance and the
importance of number of trains, ground vibration, and building situational factors. Noise
Health. 2012;14:190–201.
Gidlöf-Gunnarsson A, Öhrström E. Attractive “quiet” courtyards: A potential modifier of
urban residents responses tot road traffic noise? Int J Environ Res Public Health.
2010;7:3359–3375.
Gidlöf-Gunnarsson A, Öhrström E. Noise and well-being in urban residential
environments: The potential role of perceived availability to nearby green areas.
Landscape Urban Plan. 2007;83:115–126.
Kluizenaar Y de, Salomons E, Janssen SA, van Lenthe F, Vos H, Zhou H, Miedema H,
Mackenbach J. Urban road traffic noise and annoyance: The effect of a quiet façade. J
Acoust Soc Am. 2011;130:1936–1942.
Lercher P, Botteldooren D, Widmann U, Uhrner U, Kammeringer E. Cardiovascular effects
of environmental noise: Research in Austria. Noise Health. 2011;3:234–250.
Miedema HME, Oudshoorn CGM. Annoyance from transportation noise: Relationships
with exposure metrics DNL and DENL and their confidence intervals. Environ Health
Perspect. 2001;109:409–416.
Miedema HME, Borst HC. Rating Environmental Noise on the Basis of Noise Maps. In
Proceedings of Euronoise 2006, Tampere, Finland, 30 May–1 June 2006.
Miedema HME, Borst HC. Rating Environmental Noise on the Basis of Noise Maps within
the Framework of the EU Environmental Noise Directive. In Proceedings of Internoise
2007, Istanbul, Turkey, 28–31 August 2007.
Miedema HME, Vos H. Exposure-response relationships for transportation noise. J Acoust Soc
Am. 1998;104:3432–3445.
Öhrström E, Skånberg A, Svensson H, Gidlöf-Gunnarsson A. Effects of road traffic noise
and the benefit of access to quietness. J Sound Vib. 2006;295:40–59.

Chapter 5B
126
Persson Waye K, Bengtsson J, Agge A, Björkman M. A descriptive cross-sectional study of
annoyance from low frequency noise installations in an urban environment. Noise
Health. 2003;5:35–46.
Renterghem T van, Botteldooren D. Focused study on the quiet side effect in dwellings
highly exposed to road traffic noise. Int J Environ Res Public Health. 2012;9:4292–4310.
Selander J, Nilsson ME, Bluhm G, Rosenlund M, Lindqvist M, Nise G, Pershagen G. Long-
term exposure to road traffic noise and myocardial infarction. Epidemiology. 2009;20:272–
279.
Salomons EM, Polinder H, Lohman WJA, Zhou H, Borst HC, Miedema HME. Engineering
modeling of traffic noise in shielded areas in cities. J Acoust Soc Am. 2009;126:2340–
2349.
VROM: Meet-en rekenvoorschrift geluidhinder 2006 (Prescribed measurement and
calculation methods for noise annoyance 2006). Staatscourant 1942, 249, 84.
WHO. Burden of Disease from Environmental Noise—Quantification of Healthy Life Years
Lost in Europe; Fritschi, L., Brown, L., Kim, R., Schwela, D., Kephalopoulos, S., Eds.; WHO
Regional Office for Europe: Copenhagen, Denmark, 2011.

Chapter 6 General discussion


General discussion
129
6.1 Introduction
In recent years it has become more broadly recognized that exposure to road traffic
noise is an important and persistent environmental health problem, adversely affecting a
substantial part of the population in urbanized areas. The most prevalent effects of road
traffic noise, annoyance and sleep disturbance, not only in itself have a considerable
impact on general well-being, but may also in the long term lead to further adverse
health effects. Indeed, environmental noise exposure has been linked to long term
health effects in epidemiological studies, including cardiovascular disease (Babisch, 2008;
WHO, 2011; Basner et al., 2013).
Advances in Geographic Information Systems (GIS) techniques and exposure modelling,
together with the availability of data from large ongoing cohort studies, have provided
new opportunities for research into the effects of road traffic related exposure. In recent
years an increasing amount of epidemiological studies has become available, providing
further support for an association between long term traffic noise exposure and several
health endpoints, including cardiovascular morbidity (e.g., reviews by Babisch, 2008; Van
Kempen and Babisch, 2012; Babisch, 2014). The majority of studies into adverse effects
of traffic related exposures however, have focused on air pollution. The number of large
epidemiological studies into the long term effects of road traffic noise, is comparatively
limited. These studies are strongly needed, both to further explore the hypothesized
mechanism, and to allow the establishment and further refinement of exposure
response relationships for cardiovascular endpoints.
Results of previous studies into the long term effects of road traffic noise, in particular
the older studies, may to some extent have been distorted by limitations in study
population (e.g., small sample size, non-random selection of the sample), exposure
assessment (e.g., subjectively assessed exposure), effect measure (e.g., subjectively
assessed health status), or in adjustment for confounding. With respect to confounding,
combined exposure to road traffic noise and air pollution is one important issue that
needs further investigation, gaining increasing interest in recent years. However, the
number of studies taking into account both exposures, is still small (Review by Tetreault
et al., 2013).
Reducing the adverse effects of road traffic noise is challenging, since the spectrum of
measures suitable for local application in residential areas is modest. In addition to
exposure at the most exposed façade, exposure at the least exposed façade can affect
personal exposure, and thereby the health effects. Reducing exposure at the least

Chapter 6
130
exposed façade may be one useful way to reduce adverse effects of exposure. Insight
into the effect of noise exposure at the least exposed façade is needed, to be able to
evaluate effectiveness of measures geared towards reducing exposure at the least
exposed façade.
The studies described in this thesis were initiated to gain more knowledge about the long
term effects of road traffic noise. These studies complement existing knowledge by
adding a number of large epidemiological studies on the association between long term
road traffic noise exposure and adverse health effects, for a range of key health
endpoints within the causal pathway: sleep, hypertension and cardiovascular events.
Furthermore, a broad range of potential confounders was taken into account to adjust
for confounding, including air pollution, in the studies where cardiovascular endpoints
were studied. In addition, the effect of exposure at the least exposed façade of the
dwelling was investigated, contributing towards a more complete characterization of
personal exposure, and increasing insight in the importance of exposure at the least
exposed side.
In this chapter the main findings are summarized, and the interpretation of these
findings is discussed. Furthermore, methodological considerations are discussed and
recommendations are provided for future research.
6.2 Main findings
The results of the studies described in the preceding chapters strengthen and add to
previous insights in a number of ways as briefly discussed below, by Chapter.
6.2.1 Road traffic noise and sleep
In Chapter 2, the association was investigated between long-term road traffic noise
exposure at the home during the night, and two indicators of sleep problems: getting up
tired and not well rested in the morning (morning tiredness), and the use of sleep or
tranquilizing medication (medication use). Cross sectional analyses was performed in the
GLOBE study, a large population based cohort including over 18 000 respondents. Road
traffic noise exposure was significantly associated with morning tiredness. Even though
the prevalence of medication use was higher at higher noise levels, this association was
not significant after adjustment for potential confounders. The latter implies that, in this

General discussion
131
study, no evidence was found of an effect of road traffic noise on medication use. The
results of this study add to previous knowledge, by showing that long-term road traffic
noise exposure during night time is associated with self-reported morning tiredness, and
supports the hypothesis that night time road traffic noise exposure at home may,
through affecting sleep quality, have after-effects the following day. A strong feature of
this study is that morning tiredness and noise exposure were assessed independently,
and the sleep question did not refer to noise. Thus, the results indicate that road traffic
noise exposure plays a role amongst other possible causes of sleep problems, a
conclusion that cannot be drawn based on analyses of data from community surveys,
with questions explicitly focused on noise related sleep disturbance alone.
6.2.2 Road traffic noise and hypertension
In Chapter 3, the association between long-term exposure to road traffic noise and
prevalence of hypertension was investigated, taking air pollution into account. Cross
sectional analyses was conducted in a large random sample of more than 40 000
inhabitants of Groningen City in which data was available on self reported hypertension,
and in the PREVEND cohort of 8 592 subjects, for which more detailed information was
available, including blood pressure measurements.
While there was a significant association between exposure to road traffic noise and
hypertension in the unadjusted models, no significant association was found between
road traffic noise exposure and hypertension after adjustment for potential confounders.
Results indicate there may be a moderating effect of age, with strongest and significant
associations in the group of subjects aged between 45 and 55. Furthermore, associations
seemed to be stronger at higher noise levels. In the city of Groningen sample, in addition
to the middle-aged, a significant association was found for subjects exposed to higher
noise levels (Lden ≥ 55 dB). This study shows that it is plausible that road traffic noise is
associated with hypertension, particularly in the high exposure range. In addition, as
these associations did not disappear in the extended models with additional adjustment
for air pollution, the outcomes of this study suggest that the association between road
traffic noise exposure and hypertension cannot be explained by air pollution. To our
knowledge, this was the first study in which the effects of road traffic noise exposure on
the prevalence of hypertension were studied in such a large random population based
sample, with objective measures for road traffic noise exposure and — in the PREVEND
cohort — objectively assessed hypertension (blood pressure measurements).

Chapter 6
132
Furthermore, at the time of this study, to our knowledge, this was the first study into the
effects of road traffic noise exposure, taking potential confounding by air pollution into
account.
6.2.3 Road traffic noise, air pollution and cardiovascular events
In Chapter 4, the association between road traffic noise exposure and the incidence of
hospital admissions for ischemic heart disease events (IHD: ICD9 410–414) or
cerebrovascular disease events (CVE: ICD9 430–438) was investigated, taking air
pollution into account. Prospective analyses were performed within the large population
based GLOBE cohort.
Subjects with a cardiovascular event during follow up, on average, had higher road traffic
noise (Lden) and air pollution exposure at the home. However, after adjustment for
confounders (age, sex, Body Mass Index, smoking, education, exercise, marital status,
alcohol use, work situation, financial difficulties), no significantly increased risk of
cardiovascular events with increasing exposure levels was shown. It was further
investigated if subjects with a history of cardiovascular disease and the elderly may be
susceptible groups for road traffic noise or air pollution exposure. No conclusive
evidence was found for the hypothesis that these groups may be susceptible groups.
However, relative risk estimates for road traffic noise exposure seemed highest in the
subgroup with a history of cardiovascular disease, and relative risk estimates for air
pollution seemed highest in the subgroup of elderly. This study contributes towards
increasing insight in cardiovascular health effects of road traffic noise, taking air pollution
into account as a potential confounder. Furthermore, the prospective nature of this
study is a strong feature. In a prospective study subjects have not yet developed the
outcome of interest at the start of follow up. Large prospective studies is this research
area are still extremely rare.
6.2.4 A quiet façade: reducing the adverse effects of noise exposure?
In Chapter 5, the influence of road traffic noise exposure at the least exposed side on
noise annoyance was investigated in two large population studies. The first study
investigated the effect of a relatively quiet façade on the annoyance response in the
large population based GLOBE study in the Eindhoven region, the Netherlands. To
General discussion
133
further quantify the effects, and to confirm results in a different urban area, data
analyses were also performed in a population based survey in Amsterdam, the
Netherlands.
The first study revealed that annoyance was less likely in the subgroup with a relatively
quiet façade (difference between road traffic noise level at the most and at the least
exposed façade > 10 dB), as compared to the subgroup without a relatively quiet façade.
This study, to our knowledge, was the first study to investigate this effect in such a large
population based sample (N ~ 18 000). The results, because of the size and random
selection of the study sample, may be assumed representative for a larger urban area,
with its broad variety of building structure and of potential orientations of individual
buildings towards the noise source. However, while being an important step in
strengthening the evidence for the hypothesized beneficial effect of a ‘quiet side’, this
study allowed only a small step towards further quantification of effects, because of the
less specific and dichotomous nature of the noise annoyance question. In the second
study, road traffic noise annoyance was available on an 11 point scale. This allowed more
detailed analyses, including additional investigation of the effect of road traffic noise
level at the least exposed side (Lden,least). The estimated effect size expressed in change in
Lden,most approximated 5 dB, both for the difference between the two subgroups (DIF >=
10 dB and DIF <10 dB), and for a 10 dB change in Lden, least. While exposure at the most
exposed façade still appears to be the dominant predictor of road traffic noise
annoyance, results indicate that in addition, noise exposure at the least exposed side
independently influences this effect. These studies provide further support for the
hypothesized benefit of reducing exposure at the least exposed façade. Furthermore,
results contribute to the quantification of this effect.
6.3 Methodological considerations
This section discusses methodological limitations that have to be considered when
interpreting the results of observational studies in general, and hence, also the studies
described in this thesis. Strengths and limitations of the specific studies have been
described in detail previously in each of the dedicated chapters (Chapter 2 to Chapter 5),
and therefore will not extensively be repeated here.

Chapter 6
134
6.3.1 Study design
As noted in the introduction, investigating the relationships between road traffic noise
and health endpoints is challenging. Some of the main reasons are discussed here.
Challenges in studying effects of long term road traffic noise exposure
While there is a strong and direct relationship between road traffic noise exposure and
road traffic noise annoyance (or road traffic noise induced sleep disturbance), the
relationship between long term exposure and indirect health effects, such as after-
effects of disturbed sleep (in this thesis: e.g., morning tiredness), and clinical health
endpoints (in this thesis: e.g., hypertension or cardiovascular events) is typically weaker
and therefore more difficult to identify. Moreover, the risk attributable to noise
exposure is small as compared to the risk attributable to other, dominant risk factors.
Well known prominent risk factors for cardiovascular health effects for example, include
e.g., lifestyle related factors (such as physical activity, smoking and Body Mass Index), as
well as e.g., demographic factors (such as age). These risk factors usually play a much
stronger role than the exposure under study. This combination of a comparatively small
exposure attributable risk, together with the presence of dominant risk factors, typically
complicates isolating an effect of noise exposure. Therefore, a study design is needed
which allows identification of a contribution of environmental exposures to these health
effects amongst other risk factors. Such analyses first of all require a large study
population, preferably with a prospective design. A prospective study design allows
evaluation of the question of temporality: do participants with higher exposure at the
start of follow up have an increased risk for the development of the health outcome of
interest during the follow-up? The studies described in the previous chapters, were all
carried out in large population based studies, two of which were large prospective
cohort studies. The prospective nature of a cohort study allows studying the relationship
between an exposure and the development of an outcome. Strong features of the
studies described here include the large sample size, the population based design, and
the prospective nature of the cohort studies.
Secondly, accurate information is needed on the individual noise exposure, preferably
objectively assessed. Exposure to road traffic noise at the façade of the dwelling of each
respondent was objectively assessed by model calculation. This is an improvement as
compared to subjectively assessed indicators of exposure (e.g., by questions referring to
the intensity or type of nearby roads), as well as compared to exposure assessment with
lower spatial resolution (e.g., at street level, or coarse grid level).

General discussion
135
Third, adequate information is needed not only on the health endpoints of interest, but
also on the above mentioned other risk factors. Particularly, information is needed on
those risk factors that may be associated with the investigated exposure and thereby
confound the relationship that is being investigated. In the described studies, data was
collected not only on the health outcomes studied, but also on a broad range of
potential confounders. Hence, in the analysis we could adjust for these covariates. One
potential confounder many previous studies have not been able to adjust for, is air
pollution, which was taken into account in the studies into cardiovascular outcomes
described in this thesis.
Limitations and strengths of a population based design
A population based design can be less suitable to study rare health outcomes, since the
prevalence or incidence of an endpoint under study has to be sufficiently large to
provide sufficient power to allow investigation of relationships. Furthermore, in the
general population only a proportion of the residents have a high noise exposure level at
their home, while the risk for cardiovascular health effects is expected to increase mainly
at higher levels (although newer studies do not suggest a threshold for effects) (e.g.,
Babisch, 2008; Babisch, 2014). This may partly explain why, in the study investigating the
association between noise exposure and cardiovascular events, even though risk
estimates seemed elevated, these associations were not significant in the adjusted
models, while more clear indications were found of an association with hypertension and
sleep disturbance (morning tiredness), respectively. However, a very important strong
feature of the population based design of the studies described here, is a better
generalizability of findings, as further elaborated under 6.2.4.
Observational studies: Association or causality
While observational studies can identify statistical associations, conclusive evidence of
causality cannot be obtained. Observed relationships are not always necessarily causal.
Factors identified as being associated to the health effect under study, may be indicators
for (other) underlying causes. Even in studies with a prospective design, while results
may show that exposure preceded the disease, this does not necessarily prove that
exposure caused the disease. However, epidemiological studies are essential and
complement laboratory and field studies, as they allow investigation of associations
between hypothesized risk factors and long term health effects under ‘real life’
conditions in the general population, which clearly cannot easily be achieved in any other
way. In the epidemiological studies described here, data could be analyzed for large

Chapter 6
136
populations, with broad spectrum of available variables, both in terms of exposures, and
in health outcomes, and in potential confounding or modifying factors.
To aid further evaluation of the plausibility of causality, in 1965 Bradford Hill proposed a
list of 9 considerations, now commonly referred to as the “Bradford Hill criteria”. These
criteria included: 1) strength of the association; 2) consistency (is it more frequently
observed in different studies using different techniques, in different places,
circumstances and time); 3) specificity; 4) temporality; 5) biological gradient (or dose-
response curve); 6) plausibility (is there a plausible mechanism between cause and
effect), 7) coherence (cause and effect interpretation should not seriously conflict with
known facts); 8) experimental evidence (e.g., by investigating the effect of an
intervention), and 9) analogy (Bradford Hill, 1965). These criteria were not developed to
‘reject’ or ‘prove’ the causality of associations, however they can be helpful to evaluate
possible causality. These criteria are further discussed in relation to noise effects in
section 6.3 (Interpretation of the findings).
6.3.2 Bias
Bias may arise from systematic error in the assessment of a variable. Information bias
may get introduced for example with respect to the health outcome of interest. By
illustration, in studies specifically focused on the effects of noise, when participants may
be aware of the noise focus of the study, the answers concerning the effect studied (e.g.,
sleep disturbance) may be biased by the attitude of a respondent towards the noise
source. In the studies described here, exposure was retrospectively and objectively
assessed, and thus the answers to the questionnaires are not likely to be biased by such
influence.
Information bias may also occur when the exposure assessment is subject to error. For
road traffic noise and air pollution, systematic misclassification can be introduced for
example when low resolution spatial data is used (e.g., long term air pollution exposure
based on the neared monitoring station, or road traffic noise exposure derived from a
noise map with a large grid cell size). Typically there can be strong gradients near
sources, particularly in urban areas where noise transmission or air pollution dispersion
can be affected by characteristics of the built environment (e.g., screening by buildings
or noise screens etc.). In the studies described here, the risk of such misclassification was
minimized by objective assessment of exposure by modelling with high spatial
resolution: at the facade of the dwellings.

General discussion
137
Finally, it has to be noted that it cannot be excluded that exposure response functions
may be affected by self-selection of people, with people who are less bothered by noise
comparatively more frequently choosing to live (or stay) in noise exposed areas. In
addition, dwellings exposed to very high noise levels may more likely have undergone
acoustical insulation measures to reduce noise exposure inside the dwelling. In addition,
previous studies have indicated that the choice of the location of the bedroom away
from the noise source, may reduce the adverse effects of noise (e.g., Amudsen et al.,
2011; Babisch et al., 2012; Gidlof-Gunnarsson et al., 2012). It may be assumed that
particularly in high noise exposed areas, people are more likely to choose to sleep at the
noise shielded side of the dwelling, if they have this opportunity. Thus, effects of high
noise exposure may be partly masked by such selection mechanisms. If this would have
affected the results in any way, it may be assumed that the actual associations may be
stronger than the ones found.
6.3.3 Confounding
As previously noted, investigating the health effects of long term road traffic noise
exposure, requires identification of a potentially small attributable risk amongst other
dominant risk factors. This underlines the importance of adequate adjustment for
potential confounding. In epidemiological studies in general, one should always be aware
that the possibility of residual confounding due to unknown or unmeasured risk factors
cannot be fully ruled out. When studying the long term effects of traffic related
exposures, the possibility of confounding by spatial correlation between the traffic
related exposure of interest and various population characteristics needs specific
attention. Traffic exposures may spatially correlate with characteristics, which in turn
may be related to the health effect of interest. Exposure has for example previously been
found to be somewhat higher in certain age groups, and in low income areas, although
not consistently for all different exposures (e.g., Van den Hooven et al., 2012; Kruize et
al., 2007). Such correlations may differ between populations (in strength and direction),
depending on characteristics of the study area (e.g., size, country).
Previous studies may in some cases have been limited in the ability to adjust for these
factors. One prominent potential confounding factor, which has not been taken into
account in many previous studies, is air pollution. This may be considered as a
(potentially serious) limitation: Not only are long term exposure to road traffic noise and
air pollution known to be spatially related (e.g., Allen et al., 2009; Can et al., 2011;

Chapter 6
138
Foraster et al., 2011), but also there is evidence to support a causal relationship with
cardiovascular health effects for both exposures (e.g., Brook et al., 2010; Basner et al.,
2013). Only in recent years this has become a topic of growing attention. While over the
last few years, since the publication of the study on hypertension described in this thesis
(de Kluizenaar et al., 2007), a number of epidemiological studies have come available
into the effects of combined exposure, the number such studies is still limited (e.g.,
Beelen et al., 2009; Selander et al., 2009; Review by Tetreault et al., 2013).
In the studies described in this thesis, to minimize the risk of bias by confounding, in the
adjusted models a wide range of potential risk factors was taken into account, including
demographic, socio-economic and life-style characteristics. The studies on cardiovascular
effects additionally adjusted for air pollution in the extended models.
6.3.4. Generalizability
Generalizability is an issue of concern, not only in laboratory or field studies, but also in
epidemiological studies. It is always unclear to what extent results found in studies may
be generalized to other populations, other places and other conditions. Noise data
reported by the EU member states, presented by the European Environment Agency
(EEA) and the European Topic Centre on Spatial Information and Analysis (ETC SIA) for
example, indicate that the percentage of the population exposed to high road traffic
noise levels living in the large urban agglomerations in the Netherlands, is still (relatively)
modest, as compared to certain other European large urban agglomerations, including
e.g., Paris, Lyon, Barcelona, Prague, Bratislava, Budapest and Warschau
(http://noise.eionet.europa.eu/about.html). The lower percentage highly exposed, may
(in combination with the comparatively small effect of noise exposure between other
dominant risk factors) in part explain why some associations were not found significant
in the study described in Chapter 4. In general, replication of findings from
epidemiological is needed in other populations, cities and/or countries, and conditions.
Particularly in studies where the sample is drawn from a small area (e.g., a selection of
streets, or a single neighborhood), or from a particular subgroup in the population (e.g.,
university students), this may limit the ability to generalize findings to the general
population. Because the study populations of the studies described here, each consisted
of a population based sample of a larger urban area (a region or city: The Eindhoven
region, the city of Groningen and Amsterdam), these may be expected to better reflect
an ‘average’ urban population. Furthermore, the broader range of exposure levels

General discussion
139
typically observed within urban areas is covered this way. In addition, the different
dwelling types and dwelling orientations towards the road source commonly present in
an urban area is better represented. Thus, the population based design of the studies
described here contributes to better generalizability of findings.
6.4 Interpretation of the findings
6.4.1 Road traffic noise and sleep disturbance
In the recent international effort to estimate the burden of disease by environmental
noise exposure, the World Health Organization (WHO) estimated the annual amount of
healthy life years lost to exceed one million in Western Europe. The disturbance of sleep
was identified as the main contributing factor, followed by annoyance (WHO, 2011). For
these estimates the existing exposure response curves (Miedema and Vos, 2007;
Miedema and Oudshoorn, 2001) were applied. However, while the relationship between
night time transportation noise exposure and self-reported noise related sleep
disturbance is well established (Miedema and Vos, 2007), less is known on the after
effects of night time road traffic noise exposure in the general population.
Results of this thesis add to previous insights by showing a relationship between long
term exposure to road traffic noise at the home and morning tiredness (“in general
getting up tired and not well rested in the morning”), an ‘after-effect’ of disturbed sleep.
Tiredness in the morning is one of the commonly known consequences of reduced sleep
quality during the night (e.g., Porkka-Heiskanen et al., 2013). This association between
road traffic noise exposure and morning tiredness (as ‘after effect’ and as indicator of
reduced sleep quality) is an important finding in itself, because of its impact on general
well-being. Furthermore, it is an important finding because of its potential adverse
health effects in the long term. This will be further discussed in 6.3.2.
6.4.2 Road traffic noise and cardiovascular effects: sleep as a pathway
As discussed in the introduction of this thesis, several pathways have been proposed
through which exposure to environmental noise in the long term may lead to adverse
cardiovascular health effects, one of which is through the disturbance of sleep. It is
increasingly recognized that (chronic) sleep deficit may lead to severe adverse health

Chapter 6
140
effects (e.g., Leineweber et al., 2003; reviews by Cappucio et al., 2010a; Cappuccio et al.,
2011: Guo et al., 2013; Meng et al., 2013). The insight that inadequate sleep may cause
adverse health effects in the long term, is not new. Support for this hypothesis comes
from a large number of both experimental and epidemiological studies. Sleep deficit has
been linked with changes in a broad range of cardiovascular risk markers both in
experimental and epidemiological studies. Furthermore, epidemiological studies have
associated sleep loss to several adverse health outcomes, including hypertension and
cardiovascular disease. Current insights will be briefly discussed here.
Sleep and cardiovascular risk factors
An example of experimental studies showing a relationship between sleep restriction
and cardiovascular risk factors in healthy volunteers is the study by Spiegel et al. (1999).
They showed, in an experimental study in young men, an adverse effect of sleep
restriction on metabolic and endocrine function (glucose tolerance, thyrotropin
concentration, cortisol and sympathetic nervous system activity, respectively). In recent
years, a number of reviews have been published that focused on the adverse
physiological effects of reduced sleep (e.g., Faraut et al., 2012; Mullington et al., 2009;
Knudson et al., 2007; Meerlo et al., 2008, Porkka-Heiskanen et al., 2013; Van Cauter et
al., 2008). Based on a review of controlled sleep restriction laboratory studies, Faraut et
al. (2012) reported evidence for adverse effects on systemic immune and inflammatory
markers after sleep loss. Mullington et al. (2009), in a review of experimental studies in
healthy individuals, reported evidence for sleep loss induced alterations in established
cardiovascular risk factors, including changes in autonomic function, endocrine and
metabolic changes, blood pressure, inflammatory and coagulatory changes, in directions
recognized as increasing cardiovascular risk. Knutson et al. (2007) reported that available
laboratory and epidemiological studies provide support for adverse effects of sleep loss
on glucose metabolism and hormone levels (leptin and ghrelin) involved in appetite
regulation, as well as on energy expenditure. Based on a review of existing animal
studies into the effects of chronic sleep restriction, Meerlo et al. (2008) concluded that
results indicate that effects do not seem to be restricted to short-term effects alone.
There are indications that in the long term alterations in brain- and neuroendocrine
systems may occur, which may sensitize organisms to stress-related disorders, and
increase cardiovascular risk.

General discussion
141
Sleep and hypertension
Further support for the hypothesis that chronic sleep deficit may lead to adverse
cardiovascular health effects in the long term, comes from epidemiological studies.
Cappucio et al. (2007), for example, found that sleep deprivation was associated with a
higher risk of hypertension in women, both in cross-sectional as well as prospective
analyses of data of the Whitehall II Study, a cohort of British civil servants. In line with
this finding, Gottlieb et al. (2006) found that a ‘usual sleep duration’ shorter than the
median of 7 to 8 hours was associated with an increased prevalence of hypertension, in a
cross sectional analyses of data from the Sleep Heart Study. In recent years a number of
reviews have been published, that support an association between short sleep duration
and hypertension (e.g., Knutson, 2010; Calhoun and Harding, 2010; Guo et al., 2013;
Meng et al., 2013; Palagini et al., 2013). In a review of observational studies on the
relationship between sleep duration (or quality) and ‘cardiometabolic’ disease risk,
Knutson (2010) reported that short sleep duration (typically < 6 h per night) was
associated with prevalence of hypertension, and that these results are supported by
several (but not all) prospective epidemiological studies.
Counterintuitively, also an association with longer sleep duration has been reported
(e.g., Gottlieb et al., 2006; review by Knudson et al., 2010). This association however, has
been widely discussed and should be interpreted with caution. Several authors note that,
to date, no biological mechanism has been identified to explain this association
frequently found in observational studies (e.g., reviews by Knutson, 2010; Meng et al.,
2013; Guo et al., 2013), and that the possibility of causal bias cannot be excluded
(Gottlieb et al., 2006). Associations between sleeping longer and lifestyle factors
(including e.g., less physical activity, increased alcohol use), low socio economic status,
as well as depression have been reported (Gottlieb et al., 2006; reviews by Knutson,
2010; Meng et al., 2013). Furthermore, Knutson (2010) notes that there are indications
from studies in which objectively (wrist actigraphy) measured and self-reported sleep
duration were compared, that reporting bias may in part explain this association, with
‘long sleepers’ only spending more time in bed without actually physiologically sleeping
longer. The author speculates that this may be explained by underlying sleep disorder or
pathology. Indeed, more recent reviews and meta-analyses, evaluating epidemiological
studies into the relationship between sleep duration and hypertension incidence, report
a significant association between short sleep duration and hypertension incidence, but
less to no evidence for an association with long sleep duration from prospective studies
(e.g., Guo et al., 2013; Meng et al., 2013). Meng et al. (2013), in a review and meta-

Chapter 6
142
analysis restricted to prospective studies, even report a tendency towards decreased risk
of hypertension incidence with longer sleep duration (Meng et al., 2013).
Sleep and cardiovascular disease
Furthermore, an increasing amount of epidemiological studies support the existence of
an association between long term sleep deficit and cardiovascular disease, including
coronary heart disease and stroke (e.g., Leineweber et al., 2003; Chandola et al., 2010;
Kronholm et al., 2011; review by Cappucio et al., 2011) and all-cause mortality (review by
Cappucio et al., 2010b). For example Leineweber et al. (2003), found a significant
association between poor sleep and recurrent events of coronary heart disease in
prospective analysis of the Stockholm Female Coronary Risk Study. They reported a
similarly increased risk for ‘Not waking up well-rested’. Prospective analyses of data from
the Whitehall II cohort, showed an association between short sleep and coronary heart
disease. Interestingly, this association was most evident among participants who
reported some extent of sleep disturbance (Chandola et al., 2010).
The studies described above from the field of sleep research provide support for the
plausibility of disturbed sleep as one potential pathway linking night time noise exposure
to hypertension and cardiovascular disease.
6.4.3 Road traffic noise and hypertension
The association between road traffic noise and hypertension was investigated. Results
from analysis of data of the PREVEND cohort study presented in this thesis in Chapter 3,
indeed provide some support for the hypothesis of an association between long term
road traffic noise exposure at the home and hypertension. After adjustment for
confounders including air pollution, significant associations between road traffic noise
exposure at the home and hypertension were found in the middle-aged, and in the
higher exposure range.
In recent years, an increasing amount of studies have been performed that investigated
the association between environmental noise and hypertension, for different source
types, including road traffic noise (e.g., Bluhm et al., 2007, Barregard et al., 2009;
Belojevic et al., 2008; Bendokiene et al., 2012; Bodin et al., 2009; Chang et al., 2011a;
Jarup et al., 2008; Sørensen et al., 2011a) and aircraft noise exposure (e.g., Floud et al.,
2011 ; Greiser et al., 2007; Jarup et al., 2008). Furthermore, a number of recent studies
have focused on the association between occupational noise exposure and hypertension

General discussion
143
(Chang et al., 2011b; Chang et al., 2013; Hwang et al., 2012, Stokholm et al., 2013; Tomei
et al., 2013; Review by Tomei et al., 2010). In addition, recently one study investigated
the association between individual noise exposure (using personal noise dosimeters) and
hypertension (Weinmann et al., 2012).
The main results of the above mentioned studies focusing on road traffic noise, are
briefly summarized here. The majority of studies, suggested an association between road
traffic noise and hypertension, although not all (e.g., Sørensen et al, 2011a). Bluhm et al
(2007) found a significant association between road traffic noise and self-reported
physician diagnosed hypertension in a sample of 667 respondents of a postal
questionnaire. Barregard et al (2009) found a significant association between road traffic
noise and self-reported physician diagnosed hypertension in a sample of 1 953
respondents of a postal questionnaire. Belojevic et al (2008) reported a significant
association between road traffic noise and arterial hypertension in men, but not in
women, in a sample of 2 803 residents of Belgrade. Bendokiene et al (2012) reported an
association between road traffic noise exposure in a sample of 3 121 pregnant women,
which was significant only in the subgroup of women aged between 30 and 45, at higher
noise levels (> 61 dB). Bodin et al (2009), based on analyses of a sample of 24 238 adults
of a public health survey from Southern Sweden, reported an association which seemed
more pronounced at higher exposure categories as well as in the middle aged. Chang et
al (2011a) studied the association between road traffic noise exposure and prevalence of
hypertension in a sample of 820 respondents of a face to face survey in selected study
areas within the city of Taichung, Taiwan. They reported an association between noise
exposure and self-reported physician diagnosed hypertension. Road traffic noise levels in
this city by far exceeded levels typically found in European studies. Jarup et al (2008)
found an association between road traffic noise exposure during the day and risk of
hypertension, which was stronger in men. Furthermore, they reported an association
between night time aircraft noise and hypertension, based on blood pressure
measurements in a sample of 4 861 persons who had lived near one out of six major
European airports 5 year or longer. Sørensen et al (2011a) found an association between
systolic blood pressure and road traffic noise levels in men, but no association for
diastolic blood pressure nor for self-reported hypertension, based on analyses of a
sample of 44 083 participants in a population based cohort.
In 2012, a meta-analysis was performed, in which the results of 24 studies published
between 1970 and 2010 were included to derive a quantitative exposure-response
relationship. This effort revealed a small but significant odds ratio of 1.034 (95 % CI

Chapter 6
144
1.011‒1.056) for a 5 dB increase in road traffic noise level. From this analysis it was not
possible to draw conclusions on the existence of a threshold value for this relationship
(Van Kempen and Babisch, 2012).
In line with the findings for road traffic noise, several studies focusing on aircraft noise
have reported an association between exposure and hypertension, or use of anti-
hypertensive medication (e.g., Eriksson et al., 2007; Floud et al., 2011; Greiser et al.,
2007; Jarup et al., 2008; Rosenlund et al., 2001; Knipschild, 1977). Similarly, studies into
the effects of occupational noise exposure have reported significant associations with
hypertension (Hwang et al., 2012; Chang et al., 2013; Tomei et al., 2013; review by Tomei
et al., 2010), although not consistently (e.g., Stokholm et al., 2013). In 2002, Van Kempen
et al. performed a meta-analysis in which they already showed a significant association
of both aircraft noise and occupational noise exposure with hypertension, with relative
risks of 1.14 (95 % CI: 1.01‒1.29) and 1.26 (1.14‒1.39), respectively. In 2009, an updated
meta-analysis was published on the association between aircraft noise and hypertension.
While providing an estimate based on the meta-analysis, the authors note however, that
the resulting estimated exposure-response function should still be viewed as preliminary,
because of large methodological differences between studies and lack of continuous
noise data presented in available studies (Babisch and Van Kamp, 2009).
A totally different and rather uncommon approach in investigating noise effects, was
followed in the study by Weinmann et al (2012), who assessed individual noise exposure
(regardless of source) by personal dosimeters. They found an association between night
time noise and hypertension. For day time noise, they did not find an association,
however, perhaps not surprisingly: The authors note as a limitation of their approach,
that personal dosimeters also capture sounds produced by the participants themselves,
including for example their own speaking sound. This may have affected results
particular for the day time, when people are awake and active.
6.4.4 Road traffic noise and cardiovascular disease events
While significant associations were found between road traffic noise exposure and both
morning tiredness and hypertension, in our study, no conclusive evidence was found for
an association with ischemic heart disease (IHD) or cerebrovascular disease events.
However, in view of the increasing body of evidence from the international literature

General discussion
145
supporting an association between road traffic noise and cardiovascular disease, as
discussed in this section, it is likely that such effects exist.
In the eighties, nineties and beginning of this century a range of epidemiological studies
was published investigating the relationship between road traffic noise and ischemic
heart disease events, including myocardial infarction (Babisch et al., 1988; Babisch et al.,
1993; Babisch et al., 1994; Babisch et al., 1999; Babisch et al., 2003; Babisch et al., 2005).
Results from these studies provided some support for the hypothesis of an association
between road traffic noise exposure and IHD events, with significant odds ratios for
subgroups (Babisch et al., 2005), but results were inconsistent and evidence was still
limited. These early studies were included in a first meta-analysis and quantification of
an preliminary exposure-response function. This meta-analysis reported an increase in
risk with increasing noise levels above 60 dB(A) (Babisch, 2008). However, confidence
intervals were wide and it was noted that this should be considered a preliminary
exposure-effect estimate, which would need regular updating as results from new
studies would become available. In recent years, a number of epidemiological studies
have been performed investigating the relationship between environmental noise
exposure, adding to insights from earlier studies (e.g., Selander et al, 2009; Beelen et al.,
2009; Eriksson et al, 2012; Sørensen et al., 2012; Selander et al., 2013).
Selander et al (2009) investigated the association between road traffic noise and
myocardial infarction in a population based cohort with 3666 participants. They reported
a non-significant odds ratio of 1.12 (95 % CI: 0.95‒1.33) for road traffic noise level
exceeding 50 dBA. After exclusion of persons with hearing loss or exposure from other
noise sources, they found a significant odds ratio of 1.38 (95 % CI: 1.11‒1.71), after
adjustment for confounders including air pollution. Beelen et al (2009) studied the
association between air pollution, road traffic noise and cardiovascular mortality in the
large ongoing Netherlands Cohort Study on Diet and Cancer (N = 120 852). They reported
increased cardiovascular mortality in the highest noise category (> 65 dB(A)), with a
relative risk of 1.15 (95 % CI: 0.86‒1.53) for IHD and 1.99 (95 % CI: 1.05‒3.79) for heart
failure mortality respectively. After additional adjustment for both air pollution and
traffic intensity on the nearest road, risk estimates decreased. Eriksson et al (2012)
analyzed Swedish survey data (N=2498) and reported an association for railway noise
with self-reported doctor’s diagnosed cardiovascular disease, but not for road traffic
noise. Sørensen et al (2012) studied the association between road traffic noise and
myocardial infarction in a population based cohort (N = 57053) and reported a significant
association with an incidence rate ratio of 1.12 (95 % CI: 1.02‒1.22) per 10 dB increase in

Chapter 6
146
noise. Based on analysis of data from this same cohort study, a significant association
was reported for stroke incidence (Sørensen et al, 2011b). Selander et al (2013), in
analyses of data from a population based case-control study (N = 3050), found an
association between road traffic noise and myocardial infarction with an odds ratio of
1.23 (95 % CI: 1.01‒1.51). Furthermore, they added to previous findings by showing that
exposure to a combination of road traffic noise, occupational noise and job strain
increased the risk for myocardial infarction substantially, with an odds ratio of 2.27 (95 %
CI: 1.41‒3.64).
In 2014, a meta-analysis was performed on the association between road traffic noise
and coronary heart disease events. This meta-analysis provided an update of the earlier
preliminary quantification of the exposure-response function, with a significant pooled
estimate of the relative risk of 1.08 (95 %CI 1.04‒1.13) per 10 dB increase in road traffic
noise level (Babisch, 2014).
Further support for an association between noise exposure and cardiovascular morbidity
came from occupational noise studies (e.g., Davies et al., 2005), aircraft noise studies
(e.g., Huss et al., 2010), and a large study (N = 445 868) on total transportation noise
(road traffic, railway and aircraft) and coronary heart disease mortality (Gan et al.,
2012).
6.4.5 Cardiovascular effect of road traffic noise: Likelihood of causality
As noted in section 6.2, while observational studies can show associations, this does not
necessarily prove causality of the association. In general, it is therefore essential to
further evaluate this likelihood.
What complicates studying the long term health effects of environmental noise, is that
the added risk attributable to exposure is small as compared to other prominent risk
factors (including lifestyle related factors such as e.g., Body Mass Index, smoking,
physical inactivity). This brings us to the first point: ‘Strength’ of the association. Meta-
analyses show the effect is in the order of magnitude of percentages: For example, for
the relationship between road traffic noise and hypertension the meta-analyses by Van
Kempen and Babisch (2012) reports an estimated odds ratio of 1.034 (95 % CI 1.011‒
1.056) for a 5 dB(A) increase in road traffic noise level, while for the coronary heart
disease the meta-analysis by Babisch (2014) reports a significant pooled relative risk
estimate of 1.08 (95 % CI: 1.04‒1.13) per 10 dB(A) increase. Thus, the observed

General discussion
147
association is slight, but as Bradford Hill (1965) notes: ‘there are many occasions in
medicine when this is in truth so’. However, as the meta-analyses conclude, there is a
growing body of evidence to support that the relationship between road traffic noise and
both hypertension and coronary heart disease events is consistent (Van Kempen and
Babisch, 2012; Babisch, 2014). Thus, it may be concluded that there is an increasing
amount of support for the second characteristic of the list: ‘Consistency’. Third on the list
is ‘Specifity’. The likelihood of causality increases if associations are found for specific
exposures and specific outcomes, with no other likely explanations. This aspect is hard to
evaluate in the field of environmental exposures and cardiovascular effects.
Cardiovascular disease has a broad range of well-known other risk factors that may
contribute to its development. However, aircraft noise studies (e.g., Hansell et al., 2013;
Correira et al., 2013; Floud et al., 2013; reviews by Van Kempen et al., 2002; Babisch and
Van Kamp, 2009) and occupational noise studies (e.g., review by Tomei et al., 2010)
provide some support for this feature. A fourth aspect is ‘Temporality’: Does the
exposure precede the disease? Such insight may be obtained from prospective studies.
The number of large prospective studies in this field is still limited. However a number of
recent prospective studies have supported associations between transportation noise
exposure (aircraft and road traffic noise, respectively) and cardiovascular outcomes
including systolic blood pressure, hypertension, myocardial infarction and stroke
(Eriksson et al., 2007; Eriksson et al., 2010; Huss et al, 2010; Sørensen et al., 2011b,
Sørensen et al. 2012), between proximity to road traffic and myocardial infarction (Hart
et al., 2013), and between occupational noise exposure and hypertension (Chang et al.,
2013). However, results were not always consistent. For example, while prospective
studies by Eriksson et al. (2007) and Eriksson et al. (2010) reported a significant
association between aircraft noise and hypertension, a prospective study by Sørensen et
al. (2011a) could not confirm such association for road traffic noise. Huss et all (2010)
reported an association between aircraft noise and mortality from myocardial infarction
but not for other causes (including stroke), while the large prospective study by Sørensen
et al., 2011b reported a significant association between road traffic noise and stroke.
There is an increasing amount of evidence for the fifth feature in the list: ‘Biological
gradient’. A large amount of studies report a dose-response relationship between
transportation noise exposure (mainly aircraft noise and road traffic noise) and
cardiovascular endpoints (reviews by Van Kempen et al., 2002; Van Kempen and Babisch,
2012; Babisch and Van Kamp, 2009; Babisch, 2008; Babisch, 2014). The ‘Plausibility’ of
the relationship between noise exposure and cardiovascular effects is commonly
recognized. As described in the introduction of this thesis, there is a number of

Chapter 6
148
hypothesized pathways, through which exposure may in the long term lead to adverse
health effects. Proposed biological mechanisms involve stress responses, which induce
physiological effects, either directly or indirectly through the disturbance of activities,
communication or sleep (Babisch, 2002; Babisch, 2011). The seventh feature:
‘Coherence’, implies that the interpretation of data should not seriously conflict with the
commonly known facts of the health endpoint under study. Much is known about the
physiological reactions to psychological stress, including adverse cardiovascular effects in
the long term (e.g., reviews by Brotman et al., 2007; Cohen et al., 2007; Dimsdale, 2008).
“Experiment’: From a large amount of experimental laboratory studies and field studies,
there is support for the hypothesis of a causal relationship between noise exposure and
physiological effects, including changes in cardiovascular risk markers (reviews by e.g.,
Babisch, 2002; Babisch, 2003; WHO, 2009; WHO, 2011). One recent example, of an
experimental blinded field study is the study by Schmidt et al (2013). In this study, 75
health volunteers were exposed at home to different aircraft noise conditions. The study
showed that high noise exposure did not only cause a worse sleep quality, but was also
associated with noise induced endothelial dysfunction, increases in morning adrenaline,
and pulse transit time (reflecting arterial stiffness) (Schmidt et al., 2013). Intervention
studies are still rare. While a number of intervention studies have been performed
investigating the effect of changes in noise exposure on noise annoyance, sleep
disturbance and general well-being (e.g., Öhrström 2004; Amudsen et al., 2011; review
by Laszlo et al., 2012), a recent review by Laszlo et al (2012) could not identify any study
into the effects of changes in noise exposure focusing on physiological effects or
morbidity. The authors concluded that there is a strong need for intervention studies
investigating health endpoints. The last feature in the list of criteria discussed by
Bradford Hill (1965) is ‘Analogy’. As elaborated in this chapter, similar results have been
reported from epidemiological studies into the effects of road traffic noise, aircraft noise
and occupation noise. Furthermore, there is analogy with the literature on the
cardiovascular effects of stress.
6.4.6 Road traffic noise and air pollution
As discussed earlier, road traffic noise and prominent air pollution components,
including nitrogen oxides (NOx) and particulate matter, in part share a same source.
Consequently, these traffic related exposures show correlations, both spatially (e.g.,
Allen et al., 2009; Davies et al., 2009; Foraster et al., 2011), and in time (Can et al., 2011;
Ross et al., 2011). Cardiovascular health effects have been linked to both air pollution

General discussion
149
and noise, however, the amount of studies that take into account both traffic related
exposures is still limited. The topic has increasingly gained attention however, in recent
years. An increasing amount of studies is becoming available that take both exposures
into account (Beelen et al., 2009; Selander et al., 2009; Huss et al., 2010; Sørensen et al.,
2011; Fuks et al., 2011; Clark et al., 2012; Dratva et al., 2012; Gan et al., 2012; Sørensen
et al., 2012; Bilenko et al., 2013; Floud et al., 2013; Huang et al., 2013; Babisch et al.,
2014; Kalsch et al., 2014; Liu et al., 2014), including a first review (Tetreault et al., 2013).
More studies are needed to investigate the relative contribution of road traffic noise and
air pollution. Current insights do not yet allow conclusions on potential confounding or
interaction. There are large methodological differences between studies both in terms of
exposure indicators used, and in quality of exposure assessment. Results should be
interpreted with caution, particularly in studies where information on the secondary
exposure of interest (the ‘confounder’) is of low(er) quality (Foraster, 2013). However,
available studies suggest that confounding between transportation noise and air
pollution is limited (Tetreault et al., 2013). Although some studies suggest that there may
be some extent of confounding between road traffic noise and traffic related air
pollution (e.g., Floud et al., 2013; Babisch et al., 2014; Liu et al., 2014), the majority of
studies report that effects of road traffic noise exposure seemed independent of air
pollution (e.g., Selander et al., 2009; Huss et al., 2010; Sørensen et al., 2011; Dratva et
al., 2012; Gan et al., 2012; Sørensen et al., 2012; Kalsch et al., 2014). However, a recent
field study assessed personal exposure to both noise and air pollutants (including PM2.5,
black carbon (BC) and carbon monoxide (CO)) and heart rate variability (HRV) by
continuous monitoring in 40 healthy volunteers. They reported effects of both air
pollution and noise. Results suggested effect modification, with stronger effects of air
pollution at higher noise levels (Huang et al., 2013).
6.4.7 Exposure at the least exposed side of the dwelling
Results of the studies into the effect of road traffic noise exposure at the least exposed
side of the dwelling, as described in Chapter 5, suggest an independent effect of
exposure both at the most and at the least exposed side. This indicates the importance
of exposure at the noise shielded side of the dwellings for the perception of the noise
environment by the inhabitants. Exposure at the most exposed façade however, still
appeared to be the dominant predictor of road traffic noise annoyance.

Chapter 6
150
The ‘beneficial effect’ of having a side to the dwelling with low exposure, allowing
inhabitants to ‘escape’ from the noise, and to choose to reside or sleep at a more quiet
side, may depend on several aspects. First, the transmission of noise within the dwelling
and the usability of the side with lower exposure, may be expected to play a role. For
example, if an apartment or dwelling has no usable (or unoccupied) bedroom, obviously
for a resident there may no longer be the option to sleep at the lower exposed side.
Furthermore, in dwellings where the largest and most convenient bedrooms are situated
at the side facing the street, there may be other considerations which will make
inhabitants choose to sleep at the most exposed side, irrespective of the noise
environment. Results from previous studies provided support for the influence of
building situational factors on annoyance. Gidlöf-Gunnarsson et al. (2012), in a study into
the effects of railway noise, indicated that annoyance was approximately 1.5 to 2 times
higher among inhabitants with their bedroom window or balcony (or patio) facing the
railway. Second, the accessibility and quality of the outdoor space (e.g., balcony or
garden) may be of influence. A Swedish study showed that the physical environmental
quality of ‘quiet’ courtyards affected the perceived annoyance, with ‘high quality’
courtyards associated with lower noise annoyance (Gidlöf-Gunnarsson and Öhrström,
2010). Furthermore, previous studies have indicated that the perceived availability to
nearby green areas may affect noise annoyance, both in dwellings with and without a
‘quiet side’ (Gidlöf-Gunnarsson and Öhrström, 2007). Third, other sources of disturbance
may intervene with the presumed ‘quietness’, for example if a parking space is at the
least exposed side of dwellings, or stock supply activities for shops, restaurants, or café’s,
or other small medium enterprises (SMEs), installation noises from air conditioning or
ventilation systems. Behavior may modify exposure and effects (e.g., perceived
annoyance) in different ways: Previous studies have shown that people tend to more
often close their bedroom windows, when situated on a site exposed to high noise levels.
However, this was found to be conflicting with the residents’ preference (Van
Renthergem et al., 2012), which may be expected to be a source of annoyance.
6.5 Implications
With a growing body of evidence from experimental studies, and increasing support
from epidemiological studies, to date, it seems no longer the question if there is a
relationship between road traffic noise exposure and hypertension and several
cardiovascular disease outcomes. Rather, further refinement is needed on the exposure-
response relationships (refinement of estimates of magnitude(s) and shape).

General discussion
151
Furthermore, the relative contribution of both air pollution and noise, which may be
expected to differ between health outcomes, remains to be further clarified. There is
more insight needed in the potential modification of effects, by age, gender, and health
status, and work related factors such as job strain as well as occupational exposure.
Given the large number of residents involuntarily exposed, the trend of increasing
urbanization, and the adverse effects associated with road traffic noise exposure, noise is
expected to remain a persistent public health problem.
More attention is needed for noise abatement measures geared towards reducing
exposure and effects. The social costs of environmental noise exposure in urban areas in
the Netherlands have been estimated to be substantial (Jabben et al., 2007; Review by
Den Boer et al., 2008). Cost benefit analysis by RIVM reported that a range of (mainly
source oriented) measures can be highly cost effective. For road traffic, low emitting
tyres and low emitting road surface, were identified as most cost effective (Jabben et al.,
2007). Road traffic noise abatement measures are preferably source orientated.
International regulation setting emission limits for vehicular traffic (i.e. emissions from
tyre and engine) have the benefit of affecting exposure everywhere, in contrast to locally
applied measures, which, while remaining essential and valuable, can only improve a
noise environment within a restricted area. Furthermore, measures can be geared
towards reducing exposure and effects at the side of the receiver. Smart spatial planning,
as well as building design, can support the reduction of exposures as well as the
perception of the noise environment, and thereby reduce adverse effects. In addition to
the most exposed side of dwellings, exposure at the lower exposed side should be
considered. Optimizing the noise environment can aid the reduction of adverse effects of
noise. Practical application of these concepts however, should take account of factors
that may counteract the effect of a lower exposed side. The accessibility and usability of
the ‘quiet side’, as well as its quality, and perceived nearby green areas may modify
effects. Furthermore, it should be realized that for the perceived annoyance, exposure at
the most exposed façade is still the dominant predictor. For the protection of
inhabitants, a lower exposure at one side of the dwelling should not be used to allow
concessions with respect to exposure at the most exposed side.

Chapter 6
152
6.6 Future research directions
Numerous recommendations for future research can be given. A selection of prominent
ones is listed here.
Replication of results
To date, only a limited amount of large population studies into the after effects of noise
induced sleep disturbance are available. The association between road traffic noise and
morning tiredness needs to be confirmed in future studies, in different populations, and
in different cities or countries. Future studies may strengthen evidence and provide
further support for hypothesized causality, by a prospective design, as well as by studies
into the effects of changes in road traffic noise exposure.
Refinement of exposure response relationships
In recent years substantial progress has been made in the field of cardiovascular effects
of noise. Meta-analyses have been published, reporting significant associations between
road traffic noise and both hypertension (Van Kempen and Babisch, 2012), and coronary
heart disease (Babisch, 2014). However, the number of large population studies is still
limited. There is substantial heterogeneity between available studies in methodology.
Sources of heterogeneity include differences in age and gender of the population under
study, large differences in quality of exposure assessment, and in adjustment for
confounders. Large prospective studies are needed to further refine exposure response
relationships. Advances in the field of information technology may aid the improvement
of traffic data, particularly for the small to medium urban roads. This may aid further
refinement of exposure assessment both for road traffic noise and traffic related air
pollution, and thereby, when applied in epidemiological studies, aid refinement of
exposure-response relationships, as well as disentangling the relative contribution of
different exposures. In future studies, specific attention may be paid to taking into
account factors that may modify exposure or effects. One such factor includes the
orientation of the living room and bedroom towards the source, as results from previous
studies have indicated these may affect associations (e.g., Babisch et al., 2014b).
Furthermore, future studies which take into account effects of combined stressors, such
as the combination of high road traffic noise exposure at the home and job strain, since a
high level of job strain may increase the need for restoration when people return home
from a working day.

General discussion
153
Road traffic noise and air pollution
While currently an increasing amount of studies is coming available taking into account
both road traffic noise and air pollution, this amount is still limited. It has been
recognized that there is a need for studies, which take into account the ‘secondary
exposure’ with a similarly high quality of exposure assessment for both exposures
(Foraster, 2013). Studies with large differences in spatial resolution between air pollution
and noise exposures for example, may not provide a clear picture on the relative
contribution of exposures and thus may provide biased results. Future studies into short
term fluctuations in cardiovascular parameters (e.g., Huang et al., 2013) may provide
more insight in the influence of different exposures, while increasing understanding of
underlying mechanisms. It should be noted however, that the translation between short
term physiological changes and adverse health effects on the long term is difficult to
make.
Intervention studies
Intervention studies allow evaluation of the effect of prevention measures. An
intervention design, however, is typically not easily applicable to evaluate long term
exposure effects. Not only would the time needed for such evaluation be long, but also
in many cases the potential study population within a (local) intervention area will be
limited in size. Thus, a lack of power may further complicate studying long term
cardiovascular health effects in these type of studies. However, intervention studies can
be still be extremely valuable to evaluate effects of different abatement measures on
adverse effects that may emerge in the short term (e.g., annoyance, sleep disturbance,
(physiological) changes in cardiovascular risk factors etc.), while providing further
support for the hypothesis of causality. The amount of studies evaluating effects of
changes in environmental noise exposure is still limited, particularly for health endpoints.
More studies are needed that investigate the impact of noise reduction (or increase) on
health (Laszlo et al., 2012).
Effectivity of road traffic noise abatement measures
In addition to quantification of the effects of exposure at the least exposed side, further
quantification of the effect of dwelling insulation is needed. With the current trend in
improvement of the insulation of buildings, in the transition towards an energy neutral
built environment, energy related measures and acoustical insulation may go hand in
hand. However, it should be noted that insulation may not reduce effects such as
annoyance and sleep disturbance to the extent one might expect based on the potential

Chapter 6
154
to reduce indoor exposures. The quality of the noise environment outside the dwelling
(e.g., on the balcony or garden) will affect the perception. Furthermore, it is well known
that a substantial proportion of people prefer to sleep with windows opened.
Exposure response relationships for ‘new’ outcomes
In recent years, studies have become available that indicate an association between
noise exposure and a range of ‘new’ health outcomes, including e.g., stroke,
atherosclerosis, diabetes, and obesity (e.g., Sørensen et al., 2011b; Floud et al., 2013;
Kalsch et al., 2013; Sorensen et al., 2013; Eriksson et al., 2014). These new outcomes
deserve more attention. Findings need to be further confirmed in future studies.
6.7 Conclusion
The different studies presented in this thesis provide support for a relationship between
road traffic noise exposure and both reduced sleep quality (with morning tiredness as
indicator) and hypertension. No conclusive evidence was found for an effect of ischemic
heart disease or cerebrovascular disease events, but in view of the increasing body of
evidence from the international literature, it is likely that such effects exist. It was shown
that adverse effects may be reduced by reducing exposure not only at the most exposed
façade, but also at the least exposed façade. Therefore, exposure at the least exposed
façade seems important to consider, both in view of a more complete characterization of
personal exposure, as well as in view of spatial planning, design of dwelling lay-out
(architecture), and noise abatement measures.
Future studies are needed to further refine exposure-response relationships, to further
investigate the relative contribution of road traffic noise and air pollution to effects, their
potential interaction, and to further explore underlying mechanisms. It is increasingly
becoming recognized that environmental noise exposure, in addition to causing noise
annoyance and sleep disturbance, may lead to adverse health effects. Further
international, national and municipal efforts are needed to reduce the harmful effects of
road traffic noise exposure, where local measures can complement source oriented
measures enforced by (inter)national regulation.

General discussion
155
References
Allen RW, Davies H, Cohen MA, Mallach G, Kaufman JD, Adar SD, “The spatial relationship between
traffic-generated air pollution and noise in 2 US cities”, Environmental Research 2009; 109(3): 334–
342.
Amundsen AH, Klaeboe R, Aasvang GM. The Norwegian façade insulation study: the efficacy of
façade insulation in reducing noise annoyance due to road traffic. Journal of the Acoustical Society
of America 2011; 129: 1381–1389.
Babisch W, Gallacher JE, Ising H, Elwood PC. Traffic noise and cardiovascular risk. The Caerphilly
study, first phase. Outdoor noise levels and risk factors. Archives of Environmental Health 1988;
43(6): 407–414.
Babisch W, Ising H, Elwood PC, Sharp DS, Bainton D. Traffic noise and cardiovascular risk: the
Caerphilly and Speedwell studies, second phase. Risk estimation, prevalence, and incidence of
ischemic heart disease. Archives of Environmental Health 1993; 48(6): 406–413.
Babisch W, Ising H, Kruppa B, Wiens D. The incidence of myocardial infarction and its relation to
road traffic noise — The Berlin case-control studies. Environment International 1994; 20(4): 469–
474.
Babisch W, Ising H, Gallacher JEJ, Sweetnam PM, Elwood PC. Traffic noise and cardiovascular risk:
The Caerphilly and Speedwell studies, third phase-10 years follow-up. Archives of Environmental
Health 1999; 54(3): 210–216.
Babisch W. The noise/stress concept, risk assessment and research needs. Noise and Health 2002;
4(16): 1–11.
Babisch W, Ising H, Gallacher JE. Health status as a potential effect modifier of the relation
between noise annoyance and incidence of ischaemic heart disease. Occupational and
Environmental Medicine 2003; 60(10): 739–745.
Babisch W. Stress hormones in the research on cardiovascular effects of noise. Noise and Health
2003; 5(18): 1–11.
Babisch W, Beule B, Schust M, Kersten N, Ising H. Traffic noise and risk of myocardial infarction.
Epidemiology 2005; 16(1): 33–40.
Babisch W. Road traffic noise and cardiovascular risk. Noise and Health 2008; 10: 27–33.
Babisch W, van Kamp I. Exposure-response relationship of the association between aircraft noise
and the risk of hypertension. Noise and Health 2009;11:149-56.

Chapter 6
156
Babisch W. Cardiovascular effects of noise. Noise and Health 2011; 13: 52:201-204.
Babisch W, Swart W, Houthuijs D, Selander J, Bluhm G, Pershagen G, Dimakopoulou K, Haralabidis
AS, Katsouyanni K, Davou E, Sourtzi P, Cadum E, Vigna-Taglianti F, Floud S, Hansell A. Exposure
modifiers of the relationships of transportation noise with high blood pressure and noise
annoyance. Journal of the Acoustical Society of America 2012; 132 (6): 3788–3808.
Babisch W. Updated exposure-response relationship between road traffic noise and coronary heart
diseases: A meta-analysis. Noise and Health 2014; 16(68): 1–9.
Babisch W, Wolf K, Petz M, Heinrich J, Cyrys J, Peters A. Associations between traffic noise,
particulate air pollution, hypertension, and isolated systolic hypertension in adults: the KORA
study. Environmental Health Perspectives 2014a;122(5):492–498.
Babisch W, Wolke G, Heinrich J, Staff W. Road traffic noise and hypertension – Accounting for the
location of rooms. Environmental Research (in press).
http://dx.doi.org/10.1016/j.envres.2014.05.007.
Barregard L, Bonde E, Ohrström E. Risk of hypertension from exposure to road traffic noise in a
population-based sample. Occupational and Environmental Medicine 2009; 66(6): 410–415.
Basner M, Babisch W, Davis A, Brink M, Clark C, Janssen S, Stansfeld S. Auditory and non-auditory
effects of noise on health. Lancet 2013; 383(9925):1325–1322.
Beelen R, Hoek G, Houthuijs D, Van den Brandt PA, Goldbohm RA, Fischer P, Schouten LJ,
Armstrong B, Brunekreef B. The joint association of air pollution and noise from road traffic with
cardiovascular mortality in a cohort study. Occupational and Environmental Medicine 2009; 66(4):
243–250.
Belojević GA, Jakovljević BD, Stojanov VJ, Slepcević VZ, Paunović KZ. Nighttime road-traffic noise
and arterial hypertension in an urban population. Hypertension Research 2008; 31(4): 775–781.
Bendokiene I, Grazuleviciene R, Dedele A. Risk of hypertension related to road traffic noise among
reproductive-age women. Noise and Health 2011;13(55): 371–377.
Bilenko N, Rossem LV, Brunekreef B, Beelen R, Eeftens M, Hoek G, Houthuijs D, De Jongste JC, Van
Kempen E, Koppelman GH, Meliefste K, Oldenwening M, Smit HA, Wijga AH, Gehring U. Traffic-
related air pollution and noise and children's blood pressure: results from the PIAMA birth cohort
study. European Journal of Preventive Cardiology 2013. DOI: 10.1177/2047487313505821.
Bluhm GL, Berglind N, Nordling E, Rosenlund M. Road traffic noise and hypertension. Occupational
and Environmental Medicine 2007; 64(2): 122–126.

General discussion
157
Bodin T, Albin M, Ardö J, Stroh E, Ostergren PO, Björk J. Road traffic noise and hypertension:
results from a cross-sectional public health survey in southern Sweden. Environmental Health
2014; 3(1): 37.
Bradford Hill, A. The environment and disease, association or causation? Proceedings of the Royal
Society of Medicine 1965; 58: 295–300.
Brook RD, Rajagopalan S, Pope CA, Brook JR, Bhatnagar A, Diez-Roux AV, Holguin F, Hong Y,
Luepker RV, Mittleman MA, Peters A, Siscovick D, Smith SC, Whitsel L, Kaufman JD and on behalf of
the American Heart Association Council on Epidemiology and Prevention, Council on the Kidney in
Cardiovascular Disease, and Council on Nutrition, Physical Activity and Metabolism. Particulate
matter air pollution and cardiovascular disease: An update to the scientific statement from the
American Heart Association. Circulation 2010; 121: 2331–2378.
Brotman DJ, Golden SH, Wittstein IS. The cardiovascular toll of stress. The Lancet 2007; 370: 1089–
1100.
Can A, Rademaker M, Van Renterghem T, Mishra V, Van Poppel M, Touhafi A, Theunis J, De Baets
B, Botteldooren D. Correlation analysis of noise and ultrafine particle counts in a street canyon.
Science Total Environ 2011; 409; 564–572.
Cappuccio FP, Stranges S, Kandala NB, Miller MA, Taggart FM, Kumari M, Ferrie JE, Shipley MJ,
Brunner EJ, Marmot MG. Gender-specific associations of short sleep duration with prevalent and
incident hypertension: the Whitehall II Study. Hypertension 2007; 50(4): 693‒700.
Cappuccio FP, D'Elia L, Strazzullo P, Miller MA. Quantity and quality of sleep and incidence of type
2 diabetes: a systematic review and meta-analysis. Diabetes Care 2010a; 33(2): 414‒420.
Cappuccio FP, D’Elia L, Strazzullo P, Miller MA. Sleep duration and all-cause mortality: A systematic
review and meta-analysis of prospective studies. Sleep 2010b; 33(5): 585‒592.
Cappuccio FP, Cooper D, D'Elia L, Strazzullo P, Miller MA. Sleep duration predicts cardiovascular
outcomes: a systematic review and meta-analysis of prospective studies. European Heart Journal
2011; 32: 1484–1492.
Calhoun DA and Harding SM. Sleep and hypertension. Chest 2010; 138: 434‒443.
Chandola T, Ferrie JE, Perski A, Akbaraly T, Marmot MG. The effect of short sleep duration on
coronary heart disease risk is greatest among those with sleep disturbance: A prospective study
from the Whitehall II Cohort. Sleep 2010; 33(6): 739‒744.
Chang TY, Liu CS, Bao BY, Li SF, Chen TI, Lin YJ. Characterization of road traffic noise exposure and
prevalence of hypertension in central Taiwan. Science of the Total Environment 2011a; 409: 1053–
1057.

Chapter 6
158
Chang TY, Liu CS, Huang KH, Chen RY, Lai JS, Bao BY. High-frequency hearing loss, occupational
noise exposure and hypertension: a cross-sectional study in male workers. Environmental Health
2011b;10–35.
Chang TY, Hwang BF, Liu CS, Chen RY, Wang VS, Bao BY, Lai JS. Occupational noise exposure and
incident hypertension in men: a prospective cohort study. American Journal of Epidemiology
2013;177:818–825.
Clark C, Crombie R, Head J, Van Kamp I, Van Kempen E, Stansfeld SA. Does Traffic-related Air
Pollution Explain Associations of Aircraft and Road Traffic Noise Exposure on Children’s Health and
Cognition? A Secondary Analysis of the United Kingdom Sample From the RANCH Project.
American Journal of Epidemiology 2012; 176(4):327–337.
Cohen S, Janicki_Deverts D, Miller GE. Psychological stress and disease. JAMA 2007; 298(14): 1685‒
1687.
Correia AW, Peters JL, Levy JI, Melly S, Dominici F. Residential exposure to aircraft noise and
hospital admissions for cardiovascular diseases: multi-airport retrospective study. BMJ.
2013;347:f5561.
Davies HW, Teschke K, Kennedy SM, Hodgson MR, Hertzman C, Demers PA. Occupational exposure
to noise and mortality from acute myocardial infarction. Epidemiology 2005;16(1): 25‒32.
Davies HW, Vlaanderen JJ, Henderson SB, Brauer M. Correlation between co-exposures to noise
and air pollution from traffic sources. Occupational and Environmental Medicine 2009; 66:347–
350.
Den Boer LC, Van de Vreede GJ, De Jong F, De Bruyn SM. Beleving en MKBA in het geluidsbeleid —
Een verkenning naar beleving en kosten-batenanalyse bij de aanpak van geluidshinder. Delft, CE,
2008. Publicatienummer 08.7674.36.
Dimsdale JE. Psychological stress and cardiovascular disease. Journal of the American College of
Cardiology 2008; 51(13): 1237‒1246.
Dratva J, Phuleria HC, Foraster M, Gaspoz JM, Keidel D, Kunzli N, Liu LJS, Pons M, Zemp E, Gerbase
MW, Schindler C. Transportation noise and blood pressure in a population-based sample of adults.
Environmental Health Perspectives 2012;120:50‒55.
Eriksson C, Rosenlund M, Pershagen G, Hilding A, Ostenson CG, Bluhm G. Aircraft noise and
incidence of hypertension. Epidemiology 2007;18(6):716‒721.
Eriksson C, Nilsson ME, Willers SM, Gidhagen L, Bellander T, Pershagen G. Traffic noise and
cardiovascular health in Sweden: The roadside study. Noise and Health 2012;14 (59):140-147.

General discussion
159
Eriksson C, Hilding A, Pyko A, Bluhm G, Pershagen G, Ostenson CG. Long-Term Aircraft Noise
Exposure and Body Mass Index, Waist Circumference, and Type 2 Diabetes: A Prospective Study.
Environmental Health Perspectives 2014 (in press).
Faraut B, Boudjeltia KZ, Vanhamme L, Kerkhofs M. Immune, inflammatory and cardiovascular
consequences of sleep restriction and recovery. Sleep Medicine Reviews 2012; 16(2):137‒149.
Floud S, Vigna-Taglianti F, Hansell AL, Blangiardo M, Houthuijs D, Breugelmans O, Cadum E, Babisch
W, Selander J, Pershagen G, Antoniotti MC, Pisani S, Dimakopoulou K, Haralabidis AS, Velonakis M,
Jarup L, HYENA Study Team. Medication use in relation to noise from aircraft and road traffic in six
European countries: results of the HYENA study. Occupational and Environmental Medicine 2011;
68(7): 518‒524.
Floud S, Blangiardo M, Clark C, De Hoogh K, Babisch W, Houthuijs D, Swart W, Pershagen G,
Katsouyanni K, Velonakis M, Vigna-Taglianti F, Cadum E and Hansell AL. Exposure to aircraft and
road traffic noise and associations with heart disease and stroke in six European countries: a cross-
sectional study. Environmental Health 2013;12:89.
Foraster M, Deltell A, Basagana X, Medina-Ramon M, Aguilera I, Bouso L, Grau M, Phuleria HC,
Rivera M, Slama R, Sunyer J, Targa J, Künzli N. Local determinants of road traffic noise levels versus
determinants of air pollution levels in a Mediterranean city. Environmental Research 2011; 111,
177–183.
Foraster M. Is it traffic-related air pollution or road traffic noise, or both? Key questions not yet
settled! International Journal of Public Health 2013; 58:647-648.
Fuks K, Moebus S, Hertel S, Viehmann A, Nonnemacher M, Dragano N, Mohlenkamp S, Jakobs H,
Kessler C, Erbel R, Hoffmann B, on behalf of the Heinz Nixdorf Recall Study Investigative Group.
Long-term urban particulate air pollution, traffic noise, and arterial blood pressure. Environmental
Health Perspectives 2011;119:1706-1711.
Gan WQ, Davies HW, Koehoorn M, Brauer M. Association of long-term exposure to community
noise and traffic-related air pollution with coronary heart disease mortality. American Journal of
Epidemiology 2012; 175: 898-906.
Gidlöf-Gunnarsson A and Öhrström E. Noise and well-being in urban residential environments: The
potential role of perceived availability to nearby green areas. Landscape and Urban Planning 83
(2007) 115–126.
Gidlöf-Gunnarsson A, Ögren M, Jerson T, Öhrström E. Railway noise annoyance and the
importance of number of trains, ground vibration, and building situational factors. Noise and
Health 2012; 14 (59): 190–201.

Chapter 6
160
Gidlöf-Gunnarsson A and Öhrström E. Attractive “Quiet” Courtyards: A Potential Modifier of Urban
Residents’ Responses to Road Traffic Noise? International Journal of Environmental Research and
Public Health 2010; 7: 3359–3375.
Gottlieb DJ, Redline S, Nieto FJ, Baldwin CM, Newman AB, Resnick HE, Punjabi NM. Association of
usual sleep duration with hypertension: the Sleep Heart Health Study. Sleep 2006; 29(8):1009–
1014.
Greiser E, Greiser C, Janhsen K. Night-time aircraft noise increases prevalence of prescriptions of
antihypertensive and cardiovascular drugs irrespective of social class—the Cologne-Bonn Airport
study. Journal of Public Health 2007; 15(5): 327–337.
Guo X, Zheng L, Wang J, Zhang X, Zhang X, Li J, Sun Y. Epidemiological evidence for the link
between sleep duration and high blood pressure: a systematic review and meta-analysis. Sleep
Medicine 2013;14(4): 324–332.
Hänninen O and Knol A (editors). EBoDe working group. European perspectives on environmental
burden of disease: Estimates for nine stressors in six European countries. Finland: National
Institute for Health and Welfare; 2011.
Hansell AL, Blangiardo M, Fortunato L, Floud S, de Hoogh K, Fecht D, Fecht D, Ghosh RE, Laszlo HE,
Pearson C, Beale L, Beevers S, Gulliver J, Best N, Richardson S, Elliot P. Aircraft noise and
cardiovascular disease near Heathrow airport in London: small area study. BMJ 2013; 347: f5432.
Huss A, Spoerrt A, Egger M, Röösli M, for the Swiss National Cohort Study Group. Aircraft noise, air
pollution, and mortality from myocardial infarction. Epidemiology 2010; 21(6) 829–836.
Huang J, Deng F, Wu S, Lu H, Hao Y, Guo X. The impacts of short-term exposure to noise and traffic-
related air pollution on heart rate variability in young healthy adults. Journal of Exposure Science
and Environmental Epidemiology 2013; 23: 559–564.
Hwang BF, Chang TY, Cheng KY, Liu CS. Gene-environment interaction between angiotensinogen
and chronic exposure to occupational noise contribute to hypertension. Occupational and
Environmental Medicine 2012; 69: 236–242.
Jabben J, Potma, C, Lutter S. Baten van geluidmaatregelen. Een inventarisatie voor weg- en
railverkeer in Nederland. RIVM report 680300002. 2007.
Jarup L, Babisch W, Houthuijs D, Pershagen G, Katsouyanni K, Cadum E, Dudley ML, Savigny P,
Seiffert I, Swart W, Breugelmans O, Bluhm G, Selander J, Haralabidis A, Dimakopoulou K, Sourtzi P,
Velonakis M, Vigna-Taglianti F; the HYENA study team. Hypertension and exposure to noise near
airports: the HYENA Study. Environmental Health Perspectives 2008; 116(3): 329–333.

General discussion
161
Kalsch H, Hennig F, Moebus S, Mohlenkamp S, Dragano N, Jakobs H, Memmesheimer M, Erbel R,
Jockel KH, Hoffmann B, on behalf of the Heinz Nixdorf Recall Study Investigative Group. Are air
pollution and traffic noise independently associated with atherosclerosis: the Heinz Nixdorf Recall
Study. European Heart Journal 2014; 35: 853–860.
Knipschild P. V. Medical effects of aircraft noise: community cardiovascular survey. International
Archives of Occupational and Environmental Health 1977; 40(3):185–190.
Knutson KL, Spiegel K, Penev P, Van Cauter E. The metabolic consequences of sleep deprivation.
Sleep Medicine Reviews 2007;11(3):163–178.
Knutson KL. Sleep duration and cardiometabolic risk: a review of the epidemiologic evidence. Best
Practice and Research Clinical Endocrinology and Metabolism 2010; 24(5): 731–743.
Kronholm E, Laatikainen T, Peltonen M, Sippola R, Partonen T. Self-reported sleep duration, all-
cause mortality, cardiovascular mortality and morbidity in Finland. Sleep Medicine 2011; 12: 215–
221.
Kruize H, Driessen PPJ, Glasbergen P, Van Egmond KND. Environmental Equity and the Role of
Public Policy: Experiences in the Rijnmond Region. Environmental Management 2007; 40: 578–595.
Laszlo HE, McRobie ES, Stansfeld SA, Hansell AL. Annoyance and other reaction measures to
changes in noise exposure — A review. Science of the Total Environment 2012; 435–436; 551–562.
Leineweber C, Kecklund G, Janszky I, Akerstedt T, Orth-Gomér K. Poor sleep increases the
prospective risk for recurrent events in middle-aged women with coronary disease. The Stockholm
Female Coronary Risk Study. Journal of Psychosomatic Research 2003; 54: 121–127.
Liu C, Fuertes E, Tiesler CM, Birk M, Babisch W, Bauer CP, Koletzko S, Von Berg A, Hoffmann B,
Heinrich J, GINIplus and LISAplus Study Groups. The associations between traffic-related air
pollution and noise with blood pressure in children: Results from the GINIplus and LISAplus studies.
International Journal of Hygiene and Environmental Health 2014; 217: 499–505.
Meerlo P, Sgoifo A, Suchecki D. Restricted and disrupted sleep: Effects on autonomic function,
neuroendocrine stress systems and stress responsivity. Sleep Medicine Reviews 2008; 12: 197–
210.
Meng L, Zheng Y, Hui R. The relationship of sleep duration and insomnia to risk of hypertension
incidence: a meta-analysis of prospective cohort studies. Hypertension Research 2013; 36(11):
985–995.
Miedema HME and Vos H. Associations between self-reported sleep disturbance and
environmental noise based on reanalyses of pooled data from 24 studies. Behavioral sleep
medicine 2007; 5(1): 1–20.

Chapter 6
162
Mullington JM, Haack M, Toth M, Serrador JM, Meier-Ewert HK. Cardiovascular, inflammatory, and
metabolic consequences of sleep deprivation. Progress in Cardiovascular Disease 2009; 51(4): 294–
302.
Öhrström E. Longitudinal surveys on effects of changes in road traffic noise—annoyance, activity
disturbances, and psycho-social well-being. Journal of the Acoustical Society of America 2004; 115
(2): 719–729.
Palagini L, Bruno RM, Gemignani A, Baglioni C, Ghiadoni L, Riemann D. Sleep loss and hypertension:
a systematic review. Current Pharmaceutical Design 2013; 19(13): 2409–2419.
Porkka-Heiskanen T, Zitting KM, Wigren HK. Sleep, its regulation and possible mechanisms of sleep
disturbances. Acta Physiologica (Oxford, Emgland) 2013; 208(4): 311–328.
Rosenlund M, Berglind N, Pershagen G, Järup L, Bluhm G. Increased prevalence of hypertension in
a population exposed to aircraft noise. Occupational and Environmental Medicine 2001; 58: 769–
773.
Ross Z, Kheirbek I, Clougherty JE, Ito K, Matte T, Markowitz S, Eisl H. Noise, air pollutants and
traffic: Continuous measurement and correlation at a high-traffic location in New York City.
Environment Research 2011; 111(8): 1054–1063.
Schmidt FP, Basner M, Kröger G, Weck S, Schnorbus B, Muttray A, Sariyar M, Binder H, Gori T,
Warnholz A, Münzel T. Effect of nighttime aircraft noise exposure on endothelial function and
stress hormone release in healthy adults. European Heart Journal 2013; 34: 3508-3514.
Selander J, Nilsson M, Bluhm G, Rosenlund M, Lindqvist M, Nise G, Pershagen G. Long-term
exposure to road traffic noise and myocardial infarction. Epidemiology 2009; 20(2): 265–271.
Selander J, Bluhm G, Nilsson M, Hallqvist J, Theorell T, Willix P, Pershagen G. Joint effects of job
strain and road-traffic and occupational noise on myocardial infarction. Scandinavian Journal Work
Environment and Health 2013; 39(2): 195–203.
Sørensen M, Hvidberg M, Hoffmann B, Andersen ZJ, Nordsborg RB, Lillelund KG, Jakobsen J,
Tjønneland A, Overvad K, Raaschou-Nielsen O. Exposure to road traffic and railway noise and
associations with blood pressure and self-reported hypertension: a cohort study. Environmental
Health 2011a;10: 92.
Sørensen M, Hvidberg M, Andersen ZJ, Nordsborg RB, Lillelund KG, Jakobsen J, Tjønneland A,
Overvad K, Raaschou-Nielsen O. Road traffic noise and stroke: a prospective cohort study.
European Heart Journal 2011b; 32(6): 737–744.

General discussion
163
Sørensen M, Andersen ZJ, Nordsborg RB, Jensen SS, Lillelund KG, Beelen R, Schmidt EB, Tjønneland
A, Overvad K, Raaschou-Nielsen O. Road traffic noise and incident myocardial infarction: A
prospective cohort study. PLoS ONE 2012; 7(6): 1–7.
Sørensen M, Andersen ZJ, Nordsborg RB, Becker T, Tjønneland A, Overvad K, Raasschou Nielsen O.
Long-term exposure to road traffic noise and incident diabetes: a cohort study. Environmental
Health Perspectives 2013;121:217-22.
Spiegel K, Leproult R, Van Cauter E. Impact of sleep debt on metabolic and endocrine function.
Lancet 1999; 354(9188):1435–1439.
Stokholm ZA, Bonde JP, Christensen KL, Hansen AM, Kolstad HA. Occupational noise exposure and
the risk of hypertension. Epidemiology 2013; 24:135–142.
Tetreault LF, Perron S, Smargiassi A. Cardiovascular health, traffic-related air pollution and noise:
are associations mutually confounded? A systematic review. International Journal of Public Health
2013; 58: 649–666.
Tomei G, Fioravanti M, Cerratti D, Sancini A, Tomao E, Rosati MV, Vacca D, Palitti T, Di Famiani M,
Giubilati R, De Sio S, Tomei F. Occupational exposure to noise and the cardiovascular system: a
meta-analysis. Science of the Total Environment 2010; 408(4): 681–689.
Tomei G, Sancini A, Tomei F, Vitarelli A, Andreozzi G, Rinaldi G, Di Giorgio V, Samperi I, Fiaschetti
M, Tasciotti Z, Cetica C, Capozella A, Ciarocca, Caciari T. Prevalence of systemic arterial
hypertension, electrocardiogram abnormalities, and noise-induced hearing loss in agricultural
workers. Archives of Environmental and Occupational Health 2013; 68(4):196–203.
Van Cauter E1, Spiegel K, Tasali E, Leproult R. Metabolic consequences of sleep and sleep loss.
Sleep Medicine 2008; 9(S1):S23–28.
Van den Hooven EH, Pierik FH, Van Ratingen SW, Zandveld PYJ, Meijer EW, Hofman A, Miedema
HME, Jaddoe VWV and de Kluizenaar Y. Air pollution exposure estimation using dispersion
modelling and continuous monitoring data in a prospective birth cohort study in the Netherlands.
Environmental Health 2012; 11(9), 11pp.
Van Kempen EE, Kruize H, Boshuizen HC, Ameling CB, Staatsen BA, de Hollander AE. The
association between noise exposure and blood pressure and ischemic heart disease: a meta-
analysis. Environmental Health Perspectives 2002; 110(3): 307–317.
Van Kempen E and Babisch W. The quantitative relationship between road traffic noise and
hypertension: a meta-analysis. Journal of Hypertension 2012, 30:1075–1086.

Chapter 6
164
Van Rentherghem T and Botteldooren D. Focused Study on the Quiet Side Effect in Dwellings
Highly Exposed to Road Traffic Noise. International Journal of Environmental Research and Public
Health 2012; 9(12): 4292–4310.
Weinmann T, Ehrenstein V, Von Kries R, Nowak D, Radon K. Subjective and objective personal
noise exposure and hypertension: an epidemiologic approach. International Archives of
Occupational and Environmental Health 2012; 85: 363–371.
WHO. Night noise guidelines for Europe. World Health Organization Regional Office for Europe.
WHO, Copenhagen, Denmark, 2009.
WHO. World Health Organization Regional Office for Europe and JRC European Commission:
Burden of disease from environmental noise. Quantification of healthy life years lost in Europe.
WHO, Copenhagen, Denmark, 2011.

Chapter 7
Summary / Samenvatting


Summary
167
Summary
Exposure to road traffic noise is a widespread environmental health problem, adversely
affecting a large proportion of residents in our highly urbanized living environment. The
most prevalent effects of road traffic noise exposure include self-reported noise
annoyance and sleep disturbance. In a recent effort by WHO to quantify the
environmental noise related healthy life years lost in Europe, noise related sleep
disturbance was estimated to contribute most strongly to the total burden of disease. In
addition to annoyance and sleep disturbance, which in itself have a considerable impact
on well-being, there is a growing body of evidence supporting the hypothesis that long
term exposure to road traffic noise is associated with further health effects, including
hypertension and cardiovascular disease.
Invigorated by possibilities that have come available by advances in exposure modelling
and Geographical Information System (GIS) technology, over the last 10 years an
increasing amount of epidemiological studies studying the effects of environmental
exposures has appeared. A large proportion of these studies has focussed on effects of
air pollution. The number of large population studies studying long term effects of road
traffic noise is however still limited. A topic that has gained increasing interest in recent
years is combined exposure to road traffic noise and air pollution. These exposures are
to some extent related, both spatially and temporally, as they share the same source. As
both these exposures have been associated with adverse cardiovascular outcomes, these
may potentially act as confounders. To date, only few epidemiological studies into
effects of road traffic noise are available, that have taken air pollution into account.
Reducing road traffic noise exposure in urban areas, and thereby its adverse effects, is
challenging, often not straightforward and may require a smart combination of
measures. There are indications that having a lower exposed side to a dwelling may
reduce adverse effects of noise, by providing an ‘escape’ from the noise to the residents,
for example by providing the choice to sleep or reside at the quieter side of the dwelling.
Furthermore, taking into account exposure at the least exposed side may contribute to a
more complete characterization of individual exposure.
In this thesis the results of studies into the relationship between long term exposure to
road traffic noise in the living environment and adverse effects are described. The
following specific central research questions were formulated:
Chapter 7
168
1. What is the association between long term night time road traffic noise exposure
(Lnight) and self-reported sleep problems, including the after effect (medication use,
morning tiredness)?
2a. What is the association between road traffic noise and the prevalence of
hypertension, taking air pollution into account?
2b. What is the association between road traffic noise and the incidence of
cardiovascular events, taking air pollution into account?
3. Does a relatively quiet façade reduce adverse effects of exposure: How does
exposure at the least exposed side of dwellings affect annoyance?
The first part of the thesis is focused on the first research question, contributing to
further exploring the hypothesized mechanism for adverse effects of traffic noise. While
the relationship between road traffic noise exposure and self-reported noise induced
sleep disturbance is well established, less is known on the after effects of night time
noise exposure. Chapter 2 presents the results of a study in which the association
between long term night-time road traffic noise exposure at home and self-reported
indicators of sleep problems, including morning tiredness and the use of sleep or
tranquilizing medication, was investigated in a large population study in the Eindhoven
region (GLOBE). While the prevalence of medication use was higher in the higher
exposed, no conclusive evidence was found of an association between road traffic noise
and medication use. A significant association between long term night time road traffic
noise exposure and morning tiredness was observed. This finding adds to previous
knowledge and supports the hypothesis that night time noise exposure at the home may,
through adversely affecting sleep quality, have after effects the following day. Morning
tiredness and road traffic noise exposure were independently assessed. The question on
morning tiredness did not refer to noise. Thus, these results indicate that road traffic
noise plays a role amongst other factors causing sleep problems, a conclusion that
cannot be drawn based on studies into self-reported noise related sleep disturbance
alone.
The second part of this thesis focuses on the second research question. Two studies are
described in which the association between road traffic noise and cardiovascular health
effects are investigated, taking air pollution into account. In Chapter 3, the association
between long term exposure to road traffic noise and the prevalence of hypertension
was investigated in a large population study: a large random sample of more than 40000
inhabitants of Groningen City and the PREVEND cohort. Air pollution was taken into
account in the extended models. The results indicated a moderating effect of age, with

Summary
169
strongest and significant associations in the 45 to 55 year age group. Furthermore,
associations seemed stronger and significant at higher noise levels (Lden >= 55 dB). These
associations did not disappear after additional adjustment for air pollution. The results of
this study support that it is plausible that road traffic noise is associated with
hypertension, particularly in the higher exposure range. Furthermore, these results
indicate that the association between road traffic noise and hypertension cannot be
explained by air pollution.
In Chapter 4 the results of a study into the association between road traffic noise and
the incidence of hospital admissions for ischemic heart disease events (ICD9 410-414) or
cerebrovascular events (ICD9 430-438) are described. Again, air pollution was taken into
account in the extended models. While subjects with a cardiovascular event during
follow up on average had higher road traffic noise and air pollution at the home, no
significant associations were found in the adjusted models. Relative risk estimates for
road traffic noise exposure seemed highest in the subgroup with a history of
cardiovascular disease, while for air pollution they seemed highest in the elderly.
However, no conclusive evidence was found.
The third part of this thesis is focused on the third research question, and comprises a
description of the results of two large population studies. Chapter 5 first presents the
results of a large population study in the Eindhoven region (GLOBE), in which the
relationship between road traffic noise at the least exposed façade and noise annoyance
was investigated. In this first study the effect of a relatively quiet façade was
investigated. In the second study, a population study in Amsterdam, the effects of road
traffic noise exposure at the least exposed façade were further quantified. The results
provide support for the hypothesis of a potential benefit of having a relatively quiet
façade to the dwelling. These studies contribute to increasing insight into the potential
impact of reducing noise exposure at the least exposed façade as a measure to decrease
the adverse effects of noise, and contributes towards a more complete characterization
of personal exposure.
Finally, in Chapter 6, the general discussion, the results of the studies presented in this
thesis are discussed in a broader perspective of previous research and methodological
aspects related to this type of epidemiological studies are discussed. Furthermore,
recommendations for future research are provided.

Chapter 7

Samenvatting
171
Samenvatting
Blootstelling aan wegverkeersgeluid is een alomtegenwoordig milieugezondheids-
probleem. In onze hedendaagse, sterk verstedelijkte leefomgeving heeft een groot deel
van de bevolking te maken met substantiële blootstelling aan verkeersgeluid in de
woonomgeving en van de negatieve effecten daarvan. Onder de meest voorkomende
effecten van wegverkeergeluid vallen geluidshinder en slaapverstoring. In een recente
inspanning van de WHO om de ziektelast in Europa ten gevolge van omgevingsgeluid te
kwantificeren, kwam slaapverstoring naar voren als het effect met de grootste
gezondheidsimpact, uitgedrukt in verloren gezonde levensjaren. Naast geluidshinder en
slaapverstoring, effecten die op zichzelf al een aanzienlijke impact hebben op het
welbevinden, komt uit een toenemend aantal wetenschappelijke studies de aanwijzing
dat blootstelling aan geluid op de lange termijn mogelijk het risico op ernstige
aandoeningen vergroot, waaronder hart- en vaatziekten.
Mede door de nieuwe mogelijkheden die zijn ontstaan door recente ontwikkelingen in
blootstellingsmodellering en Geografische Informatie Systeem (GIS) technologie, is in het
afgelopen decennium een groeiend aantal epidemiologische studies beschikbaar
gekomen waarin de effecten van verschillende milieublootstellingen zijn onderzocht. Een
aanzienlijk aandeel hierin vormen studies die zich richten op de effecten van
luchtverontreiniging. Het aantal grote populatiestudies die de effecten van lange termijn
blootstelling aan wegverkeersgeluid bestuderen, is daarentegen beperkt. In het
bijzonder de zogenaamde prospectieve studies zijn nog zeldzaam. Een onderwerp dat de
afgelopen jaren steeds meer onder de aandacht is gekomen, is gecombineerde
blootstelling aan wegverkeersgeluid en luchtverontreiniging. Deze blootstellingen zijn in
zekere mate gerelateerd, zowel ruimtelijk als temporeel, doordat zij eenzelfde bron
delen. Tegelijkertijd zijn er aanwijzingen voor een oorzakelijk verband tussen hart- en
vaatziekten en deze beide blootstellingen. Hierdoor bestaat in studies waarin geen
rekening wordt gehouden met deze beide blootstellingen het risico van zogenaamde
‘confounding’. Tot op heden is slechts in een beperkt aantal epidemiologische studies
waarin de effecten van wegverkeersgeluid op hart en vaatziekten zijn onderzocht,
rekening gehouden met luchtverontreiniging (en vice versa).
Het reduceren van blootstelling aan wegverkeersgeluid in de stedelijke leefomgeving (en
daarmee de negatieve effecten ervan) vormt een grote uitdaging en is vaak niet
eenvoudig. Een slimme combinatie van maatregelen, zowel aan de bron als aan de kant
van de ontvangers, kan bijdragen aan het reduceren van blootstelling en daarmee van

Chapter 7
172
effecten als geluidhinder. Er zijn aanwijzingen dat een lagere blootstelling aan de
‘geluidluwe’ kant van de woning bijdraagt tot betere woonomstandigheden door
vermindering van effecten van geluid. Een laag (of lager) blootgestelde zijde aan een
woning, biedt de bewoners de mogelijkheid aan de continue aanwezigheid van
verkeersgeluid te ‘ontsnappen’, bijvoorbeeld door te kiezen om tijd door te brengen, of
te slapen aan de stillere kant. Het beschouwen van zowel blootstelling aan de meest
belaste zijde en minst belaste zijde van woningen draagt bij aan een completere
karakterisering van individuele blootstelling aan geluid.
Dit proefschrift richt zich op de langetermijneffecten van blootstelling aan
wegverkeersgeluid in de woonomgeving. Resultaten van een aantal grote
populatiestudies worden beschreven. De volgende specifieke centrale onderzoeks-
vragen werden geformuleerd:
1. Wat is het verband tussen lange termijn blootstelling aan wegverkeersgeluid
gedurende de nacht (Lnight) en zelf-gerapporteerde slaapproblemen, waaronder de
na-effecten: medicijngebruik en ochtendvermoeidheid?
2a. Wat is het verband tussen wegverkeersgeluid en het voorkomen van hoge
bloeddruk, rekening houdend met blootstelling aan luchtverontreiniging?
2b. Wat is het verband tussen wegverkeersgeluid en de incidentie van
cardiovasculaire events, rekening houdend met blootstelling aan
luchtverontreiniging?
3. Helpt een relatief stille zijde aan de woning de negatieve effecten van blootstelling
te verminderen: Hoe beïnvloedt blootstelling aan de minst belaste zijde van de
woning de ervaren geluidhinder?
Het eerste deel van dit proefschrift richt zich op de eerste onderzoeksvraag, en draagt
daarmee bij aan het verder verkennen van het veronderstelde mechanisme waarmee
geluidblootstelling op de lange termijn tot gezondheidseffecten leidt. Terwijl de relatie
tussen wegverkeersgeluid en zelf-gerapporteerde wegverkeer gerelateerde
slaapverstoring veelvuldig is beschreven en een kwantitatieve relatie is vastgelegd die
breed wordt toegepast om de verwachte slaapverstoring te voorspellen, is veel minder
bekend over de ‘na-effecten’ van blootstelling gedurende de nacht. In hoofdstuk 2
worden de resultaten gepresenteerd van een studie waarin het verband tussen
langetermijnblootstelling aan wegverkeersgeluid thuis gedurende de nacht en zelf-
gerapporteerde indicatoren van slaapproblemen, waaronder ochtendvermoeidheid en
gebruik van slaapmiddelen of rustgevende middelen, zijn onderzocht in een grote

Samenvatting
173
populatiestudie in de regio Eindhoven (GLOBE). Hoewel het medicijngebruik hoger was
bij hogere geluidblootstelling, kon het bestaan van een verband tussen
geluidblootstelling en medicijngebruik niet voldoende worden aangetoond. Er werd een
significant verband gevonden tussen langetermijnblootstelling aan wegverkeersgeluid
gedurende de nacht en ochtendvermoeidheid. Deze bevinding draagt bij aan de huidige
kennis en ondersteunt de hypothese dat nachtelijke blootstelling aan verkeerslawaai, via
een nadelige invloed op de kwaliteit van de slaap, leidt tot na-effecten de volgende dag.
In deze studie werden ochtendvermoeidheid en blootstelling aan wegverkeersgeluid
onafhankelijk van elkaar bepaald. In de vraag naar ochtendvermoeidheid werd niet
verwezen naar wegverkeersgeluid. Deze resultaten geven aanwijzingen dat
geluidblootstelling een rol speelt, naast andere al bekende risicofactoren voor
slaapproblemen. Een conclusie die niet getrokken kan worden op basis van studies naar
zelf-gerapporteerde slaapverstoring door verkeersgeluid alleen.
Het tweede deel van dit proefschrift richt zich op de tweede onderzoeksvraag. Er zijn
achtereenvolgens twee studies beschreven, waarin het verband tussen
langetermijnblootstelling aan wegverkeersgeluid en cardiovasculaire effecten wordt
onderzocht, rekening houdend met blootstelling aan luchtverontreiniging. In hoofdstuk
3, is in een grote populatiestudie het verband onderzocht tussen langdurige blootstelling
aan wegverkeersgeluid en de prevalentie van hypertensie. Analyses werden uitgevoerd
met data van een grote steekproef van meer dan 40.000 inwoners van de stad
Groningen en de PREVEND cohort. In deze analyses is rekening gehouden met
blootstelling aan luchtverontreiniging. Er werden aanwijzingen gevonden voor
leeftijdsafhankelijkheid van het effect, met de sterkste en significante in de groep van
45- tot 55-jarigen. Daarnaast werd een sterker en significant verband gevonden bij
hogere geluidsniveaus (Lden >= 55 dB). Dit verband verdween niet na aanvullende
correctie voor luchtverontreiniging. De resultaten van dit onderzoek ondersteunen de
aannemelijkheid van een verband tussen wegverkeersgeluid en hypertensie, vooral in
het hogere blootstellingsbereik. Daarnaast laten deze resultaten zien dat het verband
tussen wegverkeersgeluid en hypertensie niet kan worden verklaard door
luchtverontreiniging.
In hoofdstuk 4 worden de resultaten van een studie naar het verband tussen
blootstelling aan wegverkeersgeluid en de incidentie van ziekenhuisopnames voor
ischemische hartaandoeningen (ICD9 410-414) of cerebrovasculaire events (ICD9 430-
438) beschreven. Ook in deze studie werd rekening gehouden met blootstelling aan
luchtverontreiniging. Hoewel de blootstelling aan wegverkeersgeluid en

Chapter 7
174
luchtverontreiniging gemiddeld hoger was in de groep van respondenten met een
cardiovasculaire gebeurtenis tijdens de follow-up periode, werden geen significante
verbanden gevonden in de modellen na correctie voor potentiële ‘confounders’. Het
geschatte relatieve risico van blootstelling aan wegverkeersgeluid leek het hoogst in de
subgroep met een voorgeschiedenis van hart- en vaatziekten, terwijl voor luchtvervuiling
het geschatte relatieve risico het hoogst leek in de subgroep van ouderen. Echter, voor
geen van deze verbanden werd overtuigend bewijs gevonden.
Het derde deel van dit proefschrift richt zich op de derde en laatste onderzoeksvraag, en
bestaat uit een beschrijving van de resultaten van twee grote populatiestudies.
Hoofdstuk 5 presenteert eerst de resultaten van een groot bevolkingsonderzoek in de
regio Eindhoven (GLOBE), waarin de relatie tussen wegverkeersgeluid aan de minst
belaste gevel en geluidshinder werd onderzocht. In deze eerste studie werd het effect
van een relatief stille gevel onderzocht. In de tweede studie, een populatiestudie in
Amsterdam, werden de effecten van blootstelling aan wegverkeersgeluid aan de minst
belaste gevel nader gekwantificeerd. De resultaten ondersteunen de hypothese van een
gunstig effect van het hebben van een relatief stille gevel aan de woning. Deze studies
dragen bij aan het vergroten van inzicht in de verwachte effecten van het verlagen van
de blootstelling aan geluid aan de minst belaste zijde van de woning als maatregel om de
nadelige effecten van geluid te verminderen, en draagt bij aan een meer volledige
karakterisering van persoonlijke blootstelling.
In hoofdstuk 6, de algemene discussie, worden de resultaten van dit proefschrift in een
breder perspectief besproken, worden relevante methodologische aspecten, gerelateerd
aan dit type epidemiologisch onderzoek, bediscussieerd en worden aanbevelingen
gedaan voor verder onderzoek.

Chapter 8
About the author
List of Publications
PhD Portfolio
Dankwoord

Chapter 8

About the author
177
About the author
Yvonne de Kluizenaar was born on the 17th
of May 1974, in Eindhoven, The Netherlands.
She is the daughter of Erik and Hetty de Kluizenaar. In 1992, she graduated from
Gymnasium-β at the Eindhovens Protestants Lyceum, in Eindhoven. Subsequently, she
started her study in Environmental Science (in Dutch: Milieuhygiene) with specialization
in Air Quality at Wageningen University, Wageningen, the Netherlands. In 1997, she
graduated from university and started working as a researcher at University College
Dublin, Dublin, Ireland, in the field of air quality.
Since 2000, she is working as a research scientist at TNO in the field of environment and
health. Effects of combined exposures, including environmental noise and air pollution,
form a key research interest. At TNO, she has been involved in a broad range of national
and European research and advisory projects, both as a researcher and as project
manager. National projects were performed for the local and national government,
including the former Dutch Ministry of Housing, Spatial Planning and the Environment (in
Dutch: Ministerie van Volkshuisvesting, Ruimtelijke Ordening en Milieu; VROM) and the
Ministry of Health Welfare and Sport (in Dutch: Ministerie van Volksgezondheid, Welzijn
en Sport; VWS). Simultaneously with her full time position at TNO, she worked on her
PhD research in collaboration with University Medical Center Groningen (UMCG),
Groningen, the Netherlands and ErasmusMC, Rotterdam, the Netherlands. She
presented her research as invited speaker at large international conferences, and has
been involved in the organization of scientific research sessions at international
conferences, as session chair. She is currently chair of International Committee of
Biological Effects of Noise (ICBEN), Team 3: non auditory effects of noise.

Chapter 8
178
List of Publications
De Kluizenaar Y, Gansevoort RT, Miedema HME, De Jong PE. Hypertension and Road
Traffic Noise Exposure. Journal of Occupational and Environmental Medicine, 2007;
49(5): 484–492.
De Kluizenaar Y, Janssen SA, Van Lenthe FJ, Miedema HME and Mackenbach JP. Long-
term road traffic noise exposure is associated with an increase in morning tiredness.
Journal of the Acoustical Society of America, 2009; 126 (2): 626–633.
De Kluizenaar Y, Salomons EM, Janssen SA, Van Lenthe FJ, Vos H, Zhou H, Miedema HME
and Mackenbach JP. Urban road traffic noise and annoyance: The effect of a quiet
façade. Journal Acoustical Society America, 2011; 130 (4): 1936–1942.
De Kluizenaar Y, Van Lenthe FJ, Visschedijk AJH, Zandveld PYJ, Miedema HME,
Mackenbach JP. Road traffic noise, air pollution components and cardiovascular events.
Noise and Health 2013; 15(67): 388–397.
De Kluizenaar Y, Janssen SA, Vos H, Salomons EM, Zhou H, Van den Berg F. Road Traffic
Noise and Annoyance: A Quantification of the Effect of Quiet Side Exposure at Dwellings
Int. J. Environ. Res. Public Health 2013; 10(6): 2258–2270.
Van den Hooven EH, de Kluizenaar Y, Pierik FH, Hofman A, Van Ratingen SW, Zandveld
PYJ, Mackenbach JP, Steegers EAP, Miedema HME, Jaddoe VWV. Air Pollution, Blood
Pressure, and the Risk of Hypertensive Complications During Pregnancy The Generation
R Study. Hypertension 2011; 57: 406–412.
Van den Hooven EH, Pierik FH, de Kluizenaar Y, Willemsen SP, Hofman A, Van Ratingen
SW, Zandveld PYJ, Mackenbach JP, Steegers EAP, Miedema HME, Jaddoe VWV. Air
Pollution Exposure During Pregnancy, Ultrasound Measures of Fetal Growth, and
Adverse Birth Outcomes: A Prospective Cohort Study. Environmental Health Perspectives
2012; 120(1): 150–156.
Van den Hooven EH, de Kluizenaar Y, Pierik FH, Hofman A, Van Ratingen SW, Zandveld
PYJ, Lindemans J, Russcher H, Steegers EAP, Miedema HME, Jaddoe VWV. Chronic Air

List of publications
179
Pollution Exposure during Pregnancy and Maternal and Fetal C-Reactive Protein Levels:
The Generation R Study. Environmental Health Perspectives 2012; 120(5): 746–751.
Van den Hooven EH, Jaddoe VWV, de Kluizenaar Y, Hofman A, Mackenbach JP, Steegers
EAP, Miedema HME, Pierik FH. Residential traffic exposure and pregnancy-related
outcomes in mother and child: A prospective birth cohort study. Environmental Health
2009; 8(59).
Van den Hooven EH, Pierik FH, van Ratingen SW, Zandveld PYJ, Meijer EW, Hofman A,
Miedema HME, Jaddoe VWV, de Kluizenaar Y. Air pollution exposure estimation using
dispersion modelling and continuous monitoring data in the Generation R Study.
Environmental Health 2012; 11(9).
Van den Hooven EH, Pierik FH, de Kluizenaar Y, Hofman A, van Ratingen SW, Zandveld
PYJ, Russcher H, Lindemans J, Miedema HME, Steegers EAP, Jaddoe VWV. Air pollution
exposure and markers of placental growth and function. The Generation R Study.
Environmental Health Perspectives 2012;120(12):1753–1759.
Sonnenschein-van der Voort AM, de Kluizenaar Y, Jaddoe VWV, Gabriele C, Raat H, Moll
HA, Hofman A, Pierik FH, Miedema HME, De Jongste JC and Duijts L. Air pollution, fetal
and infant tobacco smoke exposure, and wheezing in preschool children: a population-
based prospective birth cohort. Environmental Health 2012; 11 (91).
Hohmann C, Grabenhenrich L, de Kluizenaar Y, Tischer C, Heinrich J, Chen CM, Thijs C,
Nieuwenhuijsen M, Keil T. Health effects of chronic noise exposure in pregnancy and
childhood: a systematic review initiated by ENRIECO. International Journal of Hygiene
and Environmental Health 2013; 216(3): 217–229.
Levie D, de Kluizenaar Y, Hoes-van Oeffelen ECM, Hofstetter H, Janssen SA, Spiekman
ME, Koene FGH. Determinants of ventilation behavior in naturally ventilated dwellings:
Identification and quantification of relationships. Building and Environment 82 (2014)
388–399.
Submitted
Basner M, Brink M, de Kluizenaar Y, Hong J, Janssen SA, Klaeboe R, Leroux T, Liebl A,
Matsui T, Sliwinska-Kowalska M, Sörqvist P. ICBEN Review of Research on the Biological
Effects of Noise 2011–2014.

Chapter 8
180
PhD Portfolio
Name PhD student: Yvonne de Kluizenaar
Erasmus MC Department: Public Health
Research School: Netherlands Institute of Health Sciences
1. PhD training
Year Workload
(Hours/ECTS)
General courses
Certified project management associate IPMA level D 2009 1.4
Communication skills. In Dutch: ‘Effectief beïnvloeden’ 2011 0.6
Specific courses
Cohort studies: Design, Analysis and Interpretation, 16 20
August, 2004, Rotterdam, The Netherlands. (Erasmus
Summer Programme)
2004
0.7
Attended seminars, symposia, meetings and workshops
(selection)
Research meetings at TNO 2000-now
PREVEND research meetings 2006-2007 0.1
CALM Conference, ‘Research and Strategies for Less Noise in
Europe’, 2 October 2007, Brussels, Belgium
2007
0.5
Workshop on Environment & Health: Air Quality Research
Needs and Opportunities in the EU 7th Framework
Programme, 15 16 January 2007, Brussels, Belgium
2007
0.6
Workshop meetings, ENNAH-European Research Network
on Noise and Health
2009-2011 2.0
Project meetings QSIDE - The positive effects of quiet
facades and quiet urban areas on traffic noise annoyance
and sleep disturbance
2010-2013 1.4
Project meetings OFFICAIR- On the reduction of health
effects from combined exposure to indoor air pollutants in
modern offices
OFFICAIR Workshop: On Indoor Air Quality in Modern Office
Buildings, 24 May 2013, Eötvös Loránd University, Budapest,
Hungary
OFFICAIR Final Workshop, 22 October, 2013, Brussels,
Belgium
2012-2014 4.0
Project meetings RetroKit - Toolboxes for systemic
retrofitting
2012-now 2.0

PHD portfolio
181
Presentations (selection)
Presentation at Generation R seminar: ‘Environment and
child health’, 19 April, 2012, Rotterdam, The Netherlands
2012 0.5
Presentations at several ENNAH workshop meetings 2009-2011
Presentation at “Workshop stille, geluidluwe gevels”, 15
May 2012, Den Haag, The Netherlands
2012 0.5
National and international conferences
Session organizing and/or chairing
Euro-Noise 2012, 9th European Conference on Noise
Control, 10 13 June 2012, Prague, Czech Republic. Session
chair
2012 1.0
Inter-Noise 2013 , the 42nd International Congress and
Exposition on Noise Control Engineering , 15 18 September
2013, Innsbruck, Austria. Session co-chair
2013 1.0
ICBEN 2014, the 11th International Congress on Noise as a
Public Health Problem, 1 5 June 2014, Nara, Japan. Session
organization
2014 0.5
Invited speaker
Inter-Noise 2007, the 36th International Congress and
Exhibition on Noise Control Engineering, 28 – 31 August
2007, Istanbul, Turkey. Oral presentation
2007 1.0
ICBEN 2008, the 9th Congress of the International
Commission on Biological Effects of Noise, Noise as a Public
Health Problem, 21 – 25 July, 2008, Mashantucket,
Connecticut, USA. Conference paper
2008 0.5
ISEE-ISEA Joint Annual Conference: Exposure and Health in a
Global Environment, 12 – 16 October, 2008, Pasadena, USA.
Oral presentation
2008 1.0
Euro-Noise 2009, the 8th European Conference on Noise
Control, 26 – 28 October, 2009, Edinburgh, Scotland.
Conference paper
2009 0.5
Inter-Noise 2009, the 38th International Congress and
Exposition on Noise Control Engineering, 23 – 26 August,
2009, Ottawa, Canada. Oral presentation
2009 1.0
Inter-Noise 2013, the 42nd International Congress and
Exposition on Noise Control Engineering, 15 18 September,
2013, Innsbruck, Austria. Oral presentation
2013 1.0

Chapter 8
182
Other
International Conference on Environmental Epidemiology &
Exposure, 2 6 September 2006, Paris, France. Poster
presentation
2006 1.0
Inter-Noise 2010, the 39th International Congress on Noise
Control Engineering, 13 – 16 June, 2010, Lisbon, Portugal.
Oral Presentation
2010 1.0
Euro-Noise 2012, the 9th European Conference on Noise
Control, 10 13 June 2012, Prague, Czech Republic. Oral
presentation.
2012 1.0
Other
Review article: ‘Health effects of chronic noise exposure in
pregnancy and childhood: a systematic review initiated by
ENRIECO’, International Journal of Hygiene and
Environmental Health, Co-author
2012 0.5
2. Teaching Year Workload
(Hours/EC
TS)
Lecturing
Guest lecture, Technische Universiteit Delft 2014 0.5
Supervising Master theses
Nienke Elske Dijkstra, MSc Health Sciences, Vrije Universiteit
Amsterdam
Project title: Office related determinants of dry eye
complaints: The OFFICAIR study
2013
2.0
Deborah Levie, MSc Health Sciences, Vrije Universiteit
Amsterdam
Project title: Determinants of ventilation behavior in
naturally ventilated dwellings; identification and
quantification of relationships
2014 2.0
Co-supervising PhD theses
Edith van den Hooven, Erasmus Universiteit Rotterdam
Project title: Air Pollution Exposure and Pregnancy
Complications The Generation R Study
2008-2012
6.0
Total 35.8

Dankwoord
183
Dankwoord
Promoveren is een leerproces, waarin je een nieuwe manier van kijken, denken en
creëren ontwikkelt. Ik ben dankbaar dat ik in de gelegenheid ben gesteld dit te doen
vanuit TNO, in samenwerking met vooraanstaande onderzoeksgroepen: de afdeling
Maatschappelijke Gezondheidszorg (Department of Public Health) van ErasmusMC, de
afdeling Nefrologie (Department of Internal Medicine - Nephrology) en PREVEND studie
van UMCG. Verbinden van kennis uit verschillende disciplines kan leiden tot waardevolle
nieuwe inzichten. Tijdens mijn promotie heb ik de kans gekregen om met experts uit
verschillende vakgebieden samen te werken en heb daarvan veel meer geleerd dan
hetgeen beschreven staat in dit proefschrift alleen.
Promoveren vraagt motivatie en discipline. Het is een traject van jaren waarin obstakels,
tegenslagen en gelukkig ook successen elkaar afwisselen. Ik ben dankbaar voor de steun
uit mijn omgeving, van familie, vrienden en collega’s, die mij heeft geholpen dit traject te
doorlopen. Mijn dank gaat uit naar velen die direct of indirect hebben bijgedragen aan
de totstandkoming van dit manuscript, waarvan ik hier graag een aantal mensen in het
bijzonder wil noemen.
Mijn dank gaat uit naar mijn copromotor en voormalig afdelingshoofd Henk Miedema.
Beste Henk, ik weet nog goed dat ik uit Ierland overkwam en bij jouw afdeling bij TNO
solliciteerde en we elkaar voor het eerst spraken. Je wist dat ik graag promotieonderzoek
wilde doen. Je hebt mij geholpen dit te mogelijk te maken. Bedankt dat je mij hiervoor
de ruimte hebt gegeven. Bedankt ook voor jouw begeleiding, je wijze woorden en de
inspirerende gesprekken over het vakgebied en daarbuiten. Het is al even geleden dat dit
onderzoek onder jouw hoede is opgestart. Ik ben blij dat ik het met jou als copromotor
nu ook mag afronden.
Prof.dr. J.P. Mackenbach, mijn eerste promotor, beste Johan, bedankt voor de
mogelijkheden die je mij hebt gegeven en jouw begeleiding. Ik heb bewondering voor je
wetenschappelijk inzicht en de manier waarop je altijd precies de juiste vragen wist te
stellen. Hoe druk je het ook had, jouw reactie en input kreeg ik vaak dezelfde dag nog.
De vriendelijke rust, aandacht en zorgvuldigheid waarmee je de dingen weet te doen,
met een bijzonder grote efficiëntie, zijn voor mij een voorbeeld.
Prof.dr. P.E. de Jong, mijn tweede promotor. Beste Paul, bedankt dat je mij de
mogelijkheid hebt gegeven en hebt gegund te werken binnen de bijzondere PREVEND
studie. Bedankt voor je begeleiding en je kritische en relevante vragen die me hebben

Chapter 8
184
geholpen het werk te verbeteren. Bedankt ook voor het warme welkom dat ik bij jullie in
Groningen altijd heb mogen ervaren. Ik kijk met goede herinneringen terug op de tijd die
ik in Groningen heb mogen doorbrengen.
Ron Gansevoort, en Frank van Lenthe, mijn ‘dagelijks’ begeleiders in Groningen en
Rotterdam. Beste Ron, bedankt voor jouw begeleiding, de fijne samenwerking en de
altijd hartelijke ontvangst in Groningen. Beste Frank, bedankt voor jouw begeleiding en
waardevolle input. Ik kijk met positieve herinnering terug op de tijd dat ik bij jullie op de
afdeling zat en wij een tijd een werkkamer deelden.
Paul, Ron, medepromovendi Nienke, Auke en Jacolien, PREVEND polimedewerkers en
Winie, jullie maakten dat ik mij thuis voelde in Groningen. Ondanks de afstand en
omstandigheden waardoor ik minder tijd in Groningen heb kunnen doorbrengen dan
vooraf gehoopt, hebben jullie mij altijd het prettige gevoel gegeven deel uit te maken
van het PREVEND onderzoeksteam. Bedankt voor de fijne tijd, het is dankzij jullie dat de
uitdrukking “Er gaat niets boven Groningen” voor mij diepere betekenis heeft gekregen.
Leden van de leescommissie, Prof.dr. H Tiemeier, Prof.dr. H. Boersma en Prof.dr. S.
Stansfeld, wil ik hartelijk bedanken voor de bereidheid mijn proefschrift te lezen en te
beoordelen. Dear Prof.dr. Stansfeld, thank you very much for your kind willingness to be
part of the evaluation committee and to assess my PhD dissertation.
De studies beschreven in dit proefschrift waren niet mogelijk geweest zonder de
deelname van de vele duizenden deelnemers van de PREVEND cohort, de GLOBE cohort
en de Amsterdam Health Monitor. Mijn dank gaat ook uit naar de gemeenten Groningen
en Eindhoven en GGD Amsterdam voor het beschikbaar stellen van benodigde gegevens.
Hierbij wil ik ook mijn coauteurs bedanken voor de prettige samenwerking en jullie
waardevolle bijdrage: Peter en Antoon (luchtkwaliteit), Erik en Han (akoestiek en GIS),
Sabine, Frits (psychologie, effecten van geluid), en onze collega Henk Vos die door ons
wordt gemist.
Mijn TNO collega’s wil ik bedanken voor hun betrokkenheid en interesse, voor de fijne
werksfeer, gezellige lunchpauzes en humor. Corrie, je stond altijd voor klaar om me
dingen uit handen te nemen als het druk was, bedankt daarvoor. Jeroen, eerst collega,
nu afdelingshoofd, wil ik bedanken voor de ruimte die me is gegund. Toen ik net bij TNO
begon heb jij me met veel geduld ‘ingewerkt’ in de ruimtelijke modellering van
milieublootstellingen. Je stond altijd klaar om me te helpen als dat nodig was. Jouw
betrokkenheid als collega, nu ook als leidinggevende, waardeer ik heel erg.

Dankwoord
185
Mijn vrienden wil ik bedanken voor al die gezellige momenten die voor de broodnodige
ontspanning en afwisseling zorgen, maar verder weinig met dit proefschrift te maken
hebben.
Sabine en Petra, bedankt dat jullie mijn paranimfen wilden zijn. Sabine, mijn collega bij
TNO, we deelden de afgelopen jaren onze werkkamer, lief en leed en onze passie voor
het geluid-gezondheidsonderzoek. Je bent een geweldige collega. Je staat altijd klaar om
je collega’s te helpen wanneer dat nodig is. Bedankt voor de leerzame gesprekken, je
waardevolle adviezen en voor je vriendschap.
Petra we kennen elkaar al van kleins af aan en hebben elkaar zien opgroeien. Wat
hebben we sinds het moment dat we elkaar voor het eerst zagen veel meegemaakt
samen. Wat promoveren betreft ben jij mij lang geleden in Maastricht al voorgegaan,
een hoogtepunt. De afgelopen jaren op moeilijke momenten werd eens te meer duidelijk
hoe bijzonder en waardevol onze vriendschap is. Ik ben heel blij dat jij tijdens de
verdediging aan mijn zijde wil staan.
Henk en Noor, mijn lieve schoonouders, de afgelopen jaren stonden jullie altijd klaar om
ons te helpen. Regelmatig pasten jullie op de jongens, zodat ik kon werken aan de
afronding van het proefschrift. Er zijn momenten geweest dat ik niet durfde geloven dat
het ooit af zou komen. Dan kwamen jullie met de jongens op Skype en riepen met de
kinderen in koor ‘goed studeren hoor!’. Bedankt voor jullie steun. Nu is het er dan toch!
Remco, mijn lieve broer, fijn dat jij er bent. Ik bof met zo’n broer.
Mijn lieve ouders, nu ik zelf moeder ben realiseer ik me wat jullie voor ons hebben
gedaan. Jullie opvoeding, toewijding, liefde en steun hebben me gemaakt tot wie ik nu
ben en hebben mogelijk gemaakt te bereiken wat ik bereikt heb. Papa, bedankt voor je
hulp bij de lay-out van dit boek, de afgelopen weken soms tot in de nachtelijke uurtjes.
Het is mooi geworden! Ik koester de gedachte dat het daarmee (een klein beetje) ‘van
ons samen’ is.
Niels en Rinze, lieve jongens, ik ben zo blij met jullie! Het leven met jullie is een feest.
Jullie hebben me leren zien wat echt belangrijk is.
Lieve Mark, in de hoogtepunten en dieptepunten van de afgelopen jaren heb jij aan mijn
zijde gestaan. Als een rots in de branding en met veel geduld, stond jij altijd klaar om mij
te steunen, ook op de moeilijkste momenten. Ik ben blij dat ik nu deze mijlpaal met je
mag delen en kijk uit naar de toekomst!