Advances in Geostationary-Derived Longwave Fluxes for the ...
19
Advances in Geostationary-Derived Longwave Fluxes for the CERES Synoptic (SYN1deg) Product DAVID R. DOELLING NASA Langley Research Center, Hampton, Virginia MOGUO SUN,LE TRANG NGUYEN,MICHELE L. NORDEEN,CONOR O. HANEY,DENNIS F. KEYES, AND PAMELA E. MLYNCZAK Science Systems and Applications, Inc., Hampton, Virginia (Manuscript received 9 July 2015, in final form 20 November 2015) ABSTRACT The Clouds and the Earth’s Radiant Energy System (CERES) project has provided the climate community 15 years of globally observed top-of-the-atmosphere fluxes critical for climate and cloud feedback studies. To accurately monitor the earth’s radiation budget, the CERES instrument footprint fluxes must be spatially and temporally averaged properly. The CERES synoptic 18 (SYN1deg) product incorporates derived fluxes from the geostationary satellites (GEOs) to account for the regional diurnal flux variations in between Terra and Aqua CERES measurements. The Edition 4 CERES reprocessing effort has provided the opportunity to reevaluate the derivation of longwave (LW) fluxes from GEO narrowband radiances by examining the im- provements from incorporating 1-hourly versus 3-hourly GEO data, additional GEO infrared (IR) channels, and multichannel GEO cloud properties. The resultant GEO LW fluxes need to be consistent across the 16- satellite climate data record. To that end, the addition of the water vapor channel, available on all GEOs, was more effective than using a reanalysis dataset’s column-weighted relative humidity combined with the win- dow channel radiance. The benefit of the CERES LW angular directional model to derive fluxes was limited by the inconsistency of the GEO cloud retrievals. Greater success was found in the direct conversion of window and water vapor channel radiances into fluxes. Incorporating 1-hourly GEO fluxes had the greatest impact on improving the accuracy of high-temporal-resolution fluxes, and normalizing the GEO LW fluxes with CERES greatly reduced the monthly regional LW flux bias. 1. Introduction The National Aeronautics and Space Administration’s (NASA) Clouds and the Earth’s Radiant Energy System (CERES) mission has currently provided the climate community a 15-yr record of observed top-of-the-atmosphere (TOA) fluxes (Wielicki et al. 1996). Accurate knowledge of the earth radiation budget is critical for cloud and cli- mate feedback studies (Wielicki et al. 2013). The CERES- observed footprint fluxes must be spatially and temporally averaged to monitor the earth’s global energy balance. CERES instruments flown on board the Terra, Aqua, and Suomi–National Polar-Orbiting Partnership satellites have been operational since February 2000, June 2002, and January 2012, respectively. These satellites were launched in sun-synchronous orbits with local equator crossing times (LECT) of 1030, 1330, and 1330 LT, re- spectively. All CERES Edition-3 instrument TOA ra- diances were radiometrically scaled to the Terra flight model (FM) 1 instrument (Loeb et al. 2012) to avoid temporal discontinuities in the flux record with the in- troduction of new CERES instruments. The CERES footprint radiances are converted into fluxes using scene-dependent angular directional models (ADMs) (Loeb et al. 2003, 2005) based on the CERES project’s Moderate Resolution Imaging Spectroradiometer (MODIS) imager cloud retrievals (Minnis et al. 2011). To estimate the daily mean flux, CERES uses two different approaches to account for the diurnal fluctua- tions of longwave (LW) regional fluxes in between the CERES measurements. The constant meteorology Corresponding author address: David Doelling, NASA Langley Research Center, 21 Langley Blvd., MS 420, Hampton, VA 23681- 2199. E-mail: [email protected] MARCH 2016 DOELLING ET AL. 503 DOI: 10.1175/JTECH-D-15-0147.1 Unauthenticated | Downloaded 11/09/21 02:43 PM UTC
Transcript of Advances in Geostationary-Derived Longwave Fluxes for the ...
Advances in Geostationary-Derived Longwave Fluxes for the CERES Synoptic(SYN1deg) Product
DAVID R. DOELLING
NASA Langley Research Center, Hampton, Virginia
MOGUO SUN, LE TRANG NGUYEN, MICHELE L. NORDEEN, CONOR O. HANEY, DENNIS F. KEYES,AND PAMELA E. MLYNCZAK
Science Systems and Applications, Inc., Hampton, Virginia
(Manuscript received 9 July 2015, in final form 20 November 2015)
ABSTRACT
The Clouds and the Earth’s Radiant Energy System (CERES) project has provided the climate community
15 years of globally observed top-of-the-atmosphere fluxes critical for climate and cloud feedback studies. To
accurately monitor the earth’s radiation budget, the CERES instrument footprint fluxes must be spatially and
temporally averaged properly. The CERES synoptic 18 (SYN1deg) product incorporates derived fluxes from
the geostationary satellites (GEOs) to account for the regional diurnal flux variations in between Terra and
Aqua CERES measurements. The Edition 4 CERES reprocessing effort has provided the opportunity to
reevaluate the derivation of longwave (LW) fluxes from GEO narrowband radiances by examining the im-
provements from incorporating 1-hourly versus 3-hourly GEO data, additional GEO infrared (IR) channels,
and multichannel GEO cloud properties. The resultant GEO LW fluxes need to be consistent across the 16-
satellite climate data record. To that end, the addition of the water vapor channel, available on all GEOs, was
more effective than using a reanalysis dataset’s column-weighted relative humidity combined with the win-
dow channel radiance. The benefit of the CERES LW angular directional model to derive fluxes was limited
by the inconsistency of the GEO cloud retrievals. Greater success was found in the direct conversion of
window and water vapor channel radiances into fluxes. Incorporating 1-hourly GEO fluxes had the greatest
impact on improving the accuracy of high-temporal-resolution fluxes, and normalizing the GEO LW fluxes
with CERES greatly reduced the monthly regional LW flux bias.
1. Introduction
The National Aeronautics and Space Administration’s
(NASA)Clouds and the Earth’s Radiant Energy System
(CERES) mission has currently provided the climate
community a15-yr recordofobserved top-of-the-atmosphere
(TOA) fluxes (Wielicki et al. 1996). Accurate knowledge
of the earth radiation budget is critical for cloud and cli-
mate feedback studies (Wielicki et al. 2013). The CERES-
observed footprint fluxesmust be spatially and temporally
averaged to monitor the earth’s global energy balance.
CERES instruments flown on board the Terra, Aqua,
and Suomi–National Polar-Orbiting Partnership satellites
have been operational since February 2000, June 2002,
and January 2012, respectively. These satellites were
launched in sun-synchronous orbits with local equator
crossing times (LECT) of 1030, 1330, and 1330 LT, re-
spectively. All CERES Edition-3 instrument TOA ra-
diances were radiometrically scaled to the Terra flight
model (FM) 1 instrument (Loeb et al. 2012) to avoid
temporal discontinuities in the flux record with the in-
troduction of new CERES instruments. The CERES
footprint radiances are converted into fluxes using
scene-dependent angular directional models (ADMs)
(Loeb et al. 2003, 2005) based on the CERES project’s
Moderate Resolution Imaging Spectroradiometer
(MODIS) imager cloud retrievals (Minnis et al. 2011).
To estimate the daily mean flux, CERES uses two
different approaches to account for the diurnal fluctua-
tions of longwave (LW) regional fluxes in between the
CERES measurements. The constant meteorology
Corresponding author address: David Doelling, NASA Langley
Research Center, 21 Langley Blvd., MS 420, Hampton, VA 23681-
2199.
E-mail: [email protected]
MARCH 2016 DOELL ING ET AL . 503
DOI: 10.1175/JTECH-D-15-0147.1
Unauthenticated | Downloaded 11/09/21 02:43 PM UTC
approach, used in the CERES single-scanner footprint
18 (SSF1deg) product, assumes that the cloud conditions
at the time of measurement represent the conditions
throughout the day. Over ocean, the daily LW flux is
then based on linear interpolation between the daytime
and nighttime CERESmeasurements. Over land, a half-
sine shape centered at noon with a constant nighttime
flux describes the hourly LW flux to account for the
daytime solar heating (Doelling et al. 2013). These al-
gorithms are similar to those employed by the Earth
Radiation Budget Experiment (ERBE) (Young et al.
1998). The second approach incorporates broadband
fluxes derived from contiguous geostationary satellite
(GEO) imager radiances between 608N and 608S. Thediurnally complete synoptic 18 (SYN1deg) product uses
this approach, combining Terra, Aqua, and GEO ob-
servations. This product also contains the computed in-
atmosphere and surface fluxes based on both the
MODIS and GEO imager-derived CERES cloud re-
trievals (Rutan et al. 2015). The CERES product pro-
cessing flowchart can be foundat online (at http://ceres.larc.
nasa.gov/science_information.php?page5system-flow),
and the CERES GEO temporal interpolation flowchart
is available in Doelling et al. (2013, their Fig. 2).
The monthly regional shortwave (SW) and LW flux
differences between the two approaches can be as great
as 25 and 8Wm22, respectively, over maritime stratus
and afternoon land convective regions. However, the
global mean flux differences are within ;1Wm22 for
both SW and LW (Doelling et al. 2013). The GEO
fluxes are used to account for regional diurnal cycles.
However, because of the varying quality of the GEO
fluxes and clouds from 16 satellites since 2000, GEO
artifacts may introduce spurious long-term regional
trends in the SYN1deg TOAflux record. Therefore, the
SYN1deg product is not suited to determine regional
long-term trends, unlike the SSF1deg product, which
relies only on the CERES instrument calibration for
stability. Taylor and Loeb (2013) reported that diurnal-
cycle fluctuations are small contributors to the long-
term regional trends.
To prepare for the CERES Edition 4 products, the
CERES instrument calibration, MODIS-derived cloud
retrievals, ADMs, andGEOclouds and fluxes have been
reevaluated in order to improve the accuracy of the
observed TOA and computed surface fluxes. The Edi-
tion 4 effort also presented the opportunity to improve
the GEO-derived LW broadband fluxes over those used
in Edition 3 by utilizing multiple infrared (IR) GEO
channels, multichannel GEO imager-based cloud
properties, and hourly GEO images. There are four
overall components to derive theGEOLWfluxes: 1) the
GEOIRchannel calibration, 2) theGEOLWnarrowband
(NB) to broadband (BB) algorithm, 3) the LW flux
temporal interpolation, and 4) the normalization of
the GEO-derived LW fluxes to the CERES-observed
fluxes to remove any residual GEO-derived LW flux
biases.
Three GEO NB-to-BB algorithms are considered:
1) the column-weighted relative humidity approach
(colRH), which utilizes the GEO window channel ra-
diance and the RH from an assimilated model to esti-
mate the LW flux; 2) the radiance-based algorithm
(RBA), which directly converts the GEO window and
water vapor channel radiances to LW flux, binned
according to radiance and other observed conditions;
and 3) the scene-based algorithm (SBA), which converts
the GEO window and water vapor channel radiances to
LW radiance, binned according to the CERES ADM
scene type, and then uses the CERES ADM to convert
the radiance to LW flux. This algorithm also takes ad-
vantage of the multichannel GEO imager cloud
properties.
Two LW temporal interpolation approaches are
evaluated: 1) the 3-h GEO approach that utilizes 3-
hourly GEO-derived LW fluxes and temporally in-
terpolates the fluxes throughout the day to compute the
daily mean LW flux; and 2) the 1-h GEO approach,
which simply averages the hourlyGEO-derived fluxes to
compute the daily mean LW flux.
Two GEO-derived LW normalization routines are
analyzed: 1) instantaneous normalization, which up-
dates the regional scaling factors whenever the GEO
and CERES LW fluxes can be matched within one hour;
and 2) regional normalization, which applies monthly
regional scaling factors based on the linear regression of
GEO and CERES LW matched flux pairs within a
moving 58 latitude by 58 longitude domain.
The current CERES Edition 3 processing uses
the colRH algorithm, 3-h GEO sampling, and in-
stantaneous normalization. The new approaches are
expected to improve upon the current Edition 3 ap-
proach, but they need to be evaluated against it. The
relative contribution of each component also needs to
be assessed.
This study is organized by first describing the GEO IR
radiances and their calibration withMODIS in section 2.
Section 3 outlines the GEO LWNB radiance to BB flux
approaches. Section 4 describes the LW temporal in-
terpolation and normalization with CERES fluxes.
Section 5 validates the GEO LW flux approaches with
CERES-observed fluxes. The diurnal fluxes from the
various GEO LW flux approaches are compared against
hourly Geostationary Earth Radiation Budget
(GERB)-observed LW fluxes in section 6. The conclu-
sions are found in section 7.
504 JOURNAL OF ATMOSPHER IC AND OCEAN IC TECHNOLOGY VOLUME 33
Unauthenticated | Downloaded 11/09/21 02:43 PM UTC
2. GEO data and calibration
a. GEO imager radiance and clouds
One-hourly GEO images are obtained from Man
Computer Interactive Data Access System (McIDAS)
(Lazzara et al. 1999), which provides a consistent data
format across GEO platforms. The GEO nominal 1-km
visible and 4-km IR pixel resolution images are sub-
sampled into 8-km pixel resolution images. At any given
time during the CERES record, five GEO satellites
provide contiguous coverage between 608N and 608S.Sixteen satellites from the Geostationary Operational
Environmental Satellite (GOES), Geostationary Mete-
orological Satellite (GMS), Meteorological Satellite
[Meteosat (Met)], and Multifunctional Transport Sat-
ellite (MTSAT) series comprise the CERES GEO re-
cord and are listed in Table 1 along with the times they
begin and end their hourly scans. All GEOs during the
CERES record scan at least hourly; however, the GEOs
do not scan at the same time within the hour. Also, the
Met satellites scan from the south to north, whereas all
other satellites scan in the opposite direction.
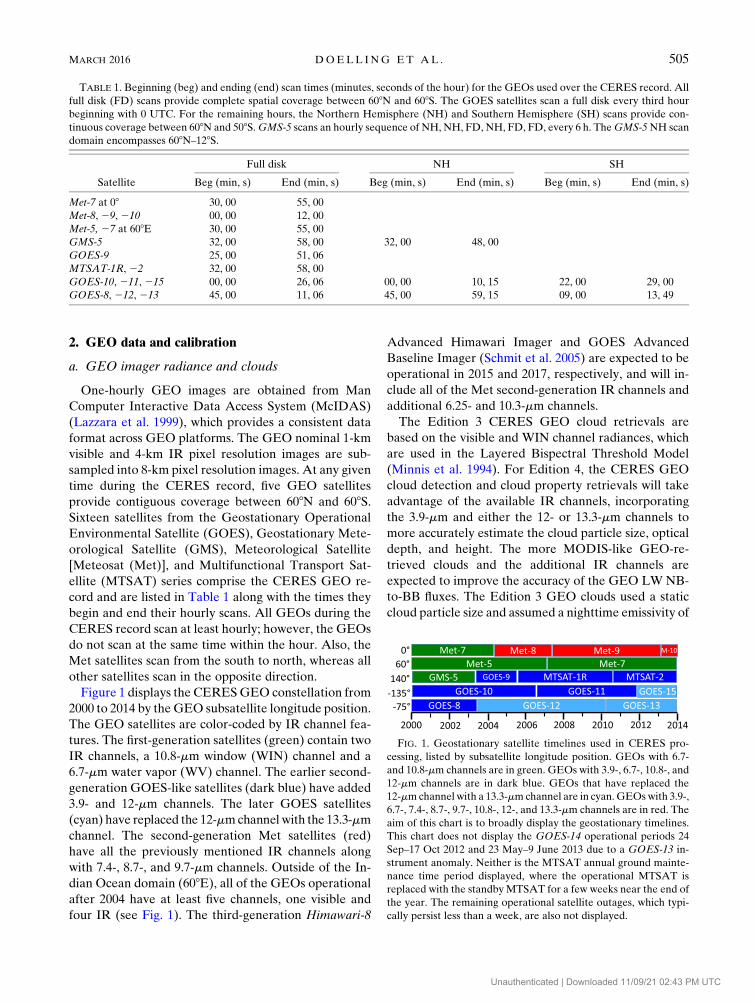
Figure 1 displays the CERESGEO constellation from
2000 to 2014 by theGEO subsatellite longitude position.
The GEO satellites are color-coded by IR channel fea-
tures. The first-generation satellites (green) contain two
IR channels, a 10.8-mm window (WIN) channel and a
6.7-mm water vapor (WV) channel. The earlier second-
generation GOES-like satellites (dark blue) have added
3.9- and 12-mm channels. The later GOES satellites
(cyan) have replaced the 12-mmchannel with the 13.3-mm
channel. The second-generation Met satellites (red)
have all the previously mentioned IR channels along
with 7.4-, 8.7-, and 9.7-mm channels. Outside of the In-
dian Ocean domain (608E), all of the GEOs operational
after 2004 have at least five channels, one visible and
four IR (see Fig. 1). The third-generation Himawari-8
Advanced Himawari Imager and GOES Advanced
Baseline Imager (Schmit et al. 2005) are expected to be
operational in 2015 and 2017, respectively, and will in-
clude all of the Met second-generation IR channels and
additional 6.25- and 10.3-mm channels.
The Edition 3 CERES GEO cloud retrievals are
based on the visible and WIN channel radiances, which
are used in the Layered Bispectral Threshold Model
(Minnis et al. 1994). For Edition 4, the CERES GEO
cloud detection and cloud property retrievals will take
advantage of the available IR channels, incorporating
the 3.9-mm and either the 12- or 13.3-mm channels to
more accurately estimate the cloud particle size, optical
depth, and height. The more MODIS-like GEO-re-
trieved clouds and the additional IR channels are
expected to improve the accuracy of the GEO LW NB-
to-BB fluxes. The Edition 3 GEO clouds used a static
cloud particle size and assumed a nighttime emissivity of
TABLE 1. Beginning (beg) and ending (end) scan times (minutes, seconds of the hour) for the GEOs used over the CERES record. All
full disk (FD) scans provide complete spatial coverage between 608N and 608S. The GOES satellites scan a full disk every third hour
beginning with 0 UTC. For the remaining hours, the Northern Hemisphere (NH) and Southern Hemisphere (SH) scans provide con-
tinuous coverage between 608N and 508S.GMS-5 scans an hourly sequence of NH, NH, FD, NH, FD, FD, every 6 h. TheGMS-5NH scan
domain encompasses 608N–128S.
Satellite
Full disk NH SH
Beg (min, s) End (min, s) Beg (min, s) End (min, s) Beg (min, s) End (min, s)
Met-7 at 08 30, 00 55, 00
Met-8, 29, 210 00, 00 12, 00
Met-5, 27 at 608E 30, 00 55, 00
GMS-5 32, 00 58, 00 32, 00 48, 00
GOES-9 25, 00 51, 06
MTSAT-1R, 22 32, 00 58, 00
GOES-10, 211, 215 00, 00 26, 06 00, 00 10, 15 22, 00 29, 00
GOES-8, 212, 213 45, 00 11, 06 45, 00 59, 15 09, 00 13, 49
FIG. 1. Geostationary satellite timelines used in CERES pro-
cessing, listed by subsatellite longitude position. GEOs with 6.7-
and 10.8-mm channels are in green. GEOs with 3.9-, 6.7-, 10.8-, and
12-mm channels are in dark blue. GEOs that have replaced the
12-mmchannel with a 13.3-mmchannel are in cyan. GEOswith 3.9-,
6.7-, 7.4-, 8.7-, 9.7-, 10.8-, 12-, and 13.3-mm channels are in red. The
aim of this chart is to broadly display the geostationary timelines.
This chart does not display the GOES-14 operational periods 24
Sep–17 Oct 2012 and 23 May–9 June 2013 due to a GOES-13 in-
strument anomaly. Neither is the MTSAT annual ground mainte-
nance time period displayed, where the operational MTSAT is
replaced with the standbyMTSAT for a few weeks near the end of
the year. The remaining operational satellite outages, which typi-
cally persist less than a week, are also not displayed.
MARCH 2016 DOELL ING ET AL . 505
Unauthenticated | Downloaded 11/09/21 02:43 PM UTC
unity, which had the effect of placing semitransparent
clouds too low in the atmosphere (Minnis et al. 1994).
b. GEO imager radiance calibration with AquaMODIS
The Edition 3 GEO IR channel brightness temper-
atures (BTs) were referenced to the Terra MODIS
calibration to ensure consistency across GEO plat-
forms. All of the GEO channel BTs were adjusted to
the corresponding MODIS-equivalent IR tempera-
tures, without accounting for spectral band response
differences, to facilitate the GEO cloud retrieval al-
gorithm. Since the Terra and Aqua MODIS spectral
response functions are nearly identical, any IR radi-
ance difference between Terra and Aqua is due to the
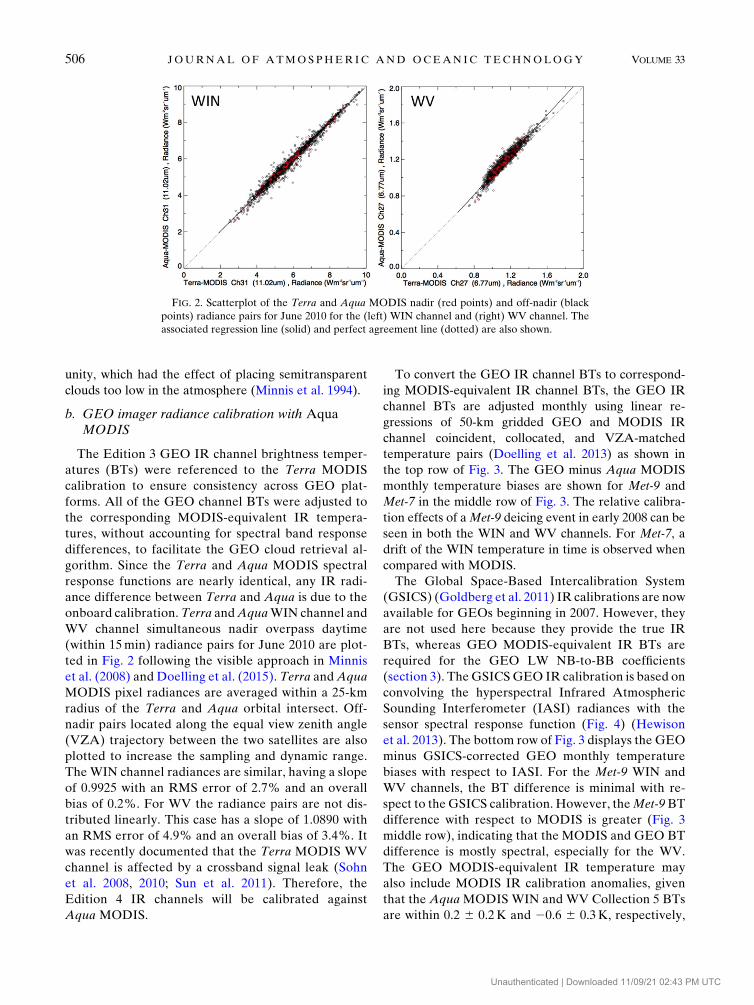
onboard calibration.Terra andAquaWIN channel and
WV channel simultaneous nadir overpass daytime
(within 15min) radiance pairs for June 2010 are plot-
ted in Fig. 2 following the visible approach in Minnis
et al. (2008) and Doelling et al. (2015). Terra andAqua
MODIS pixel radiances are averaged within a 25-km
radius of the Terra and Aqua orbital intersect. Off-
nadir pairs located along the equal view zenith angle
(VZA) trajectory between the two satellites are also
plotted to increase the sampling and dynamic range.
The WIN channel radiances are similar, having a slope
of 0.9925 with an RMS error of 2.7% and an overall
bias of 0.2%. For WV the radiance pairs are not dis-
tributed linearly. This case has a slope of 1.0890 with
an RMS error of 4.9% and an overall bias of 3.4%. It
was recently documented that the Terra MODIS WV
channel is affected by a crossband signal leak (Sohn
et al. 2008, 2010; Sun et al. 2011). Therefore, the
Edition 4 IR channels will be calibrated against
Aqua MODIS.
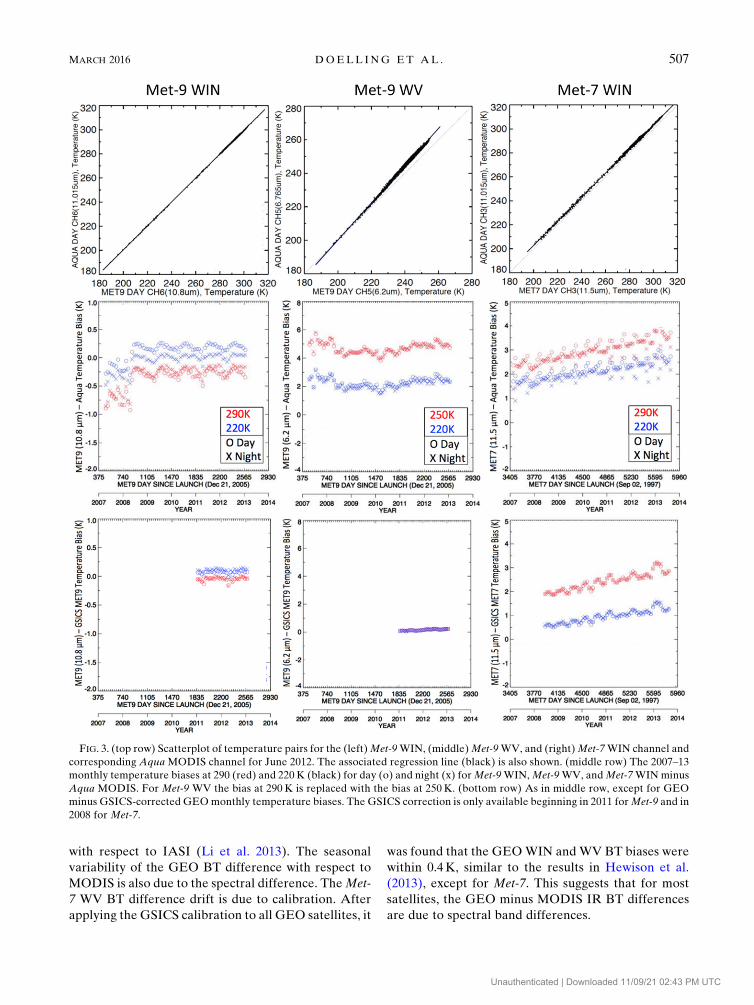
To convert the GEO IR channel BTs to correspond-
ing MODIS-equivalent IR channel BTs, the GEO IR
channel BTs are adjusted monthly using linear re-
gressions of 50-km gridded GEO and MODIS IR
channel coincident, collocated, and VZA-matched
temperature pairs (Doelling et al. 2013) as shown in
the top row of Fig. 3. The GEO minus Aqua MODIS
monthly temperature biases are shown for Met-9 and
Met-7 in the middle row of Fig. 3. The relative calibra-
tion effects of aMet-9 deicing event in early 2008 can be
seen in both the WIN and WV channels. For Met-7, a
drift of the WIN temperature in time is observed when
compared with MODIS.
The Global Space-Based Intercalibration System
(GSICS) (Goldberg et al. 2011) IR calibrations are now
available for GEOs beginning in 2007. However, they
are not used here because they provide the true IR
BTs, whereas GEO MODIS-equivalent IR BTs are
required for the GEO LW NB-to-BB coefficients
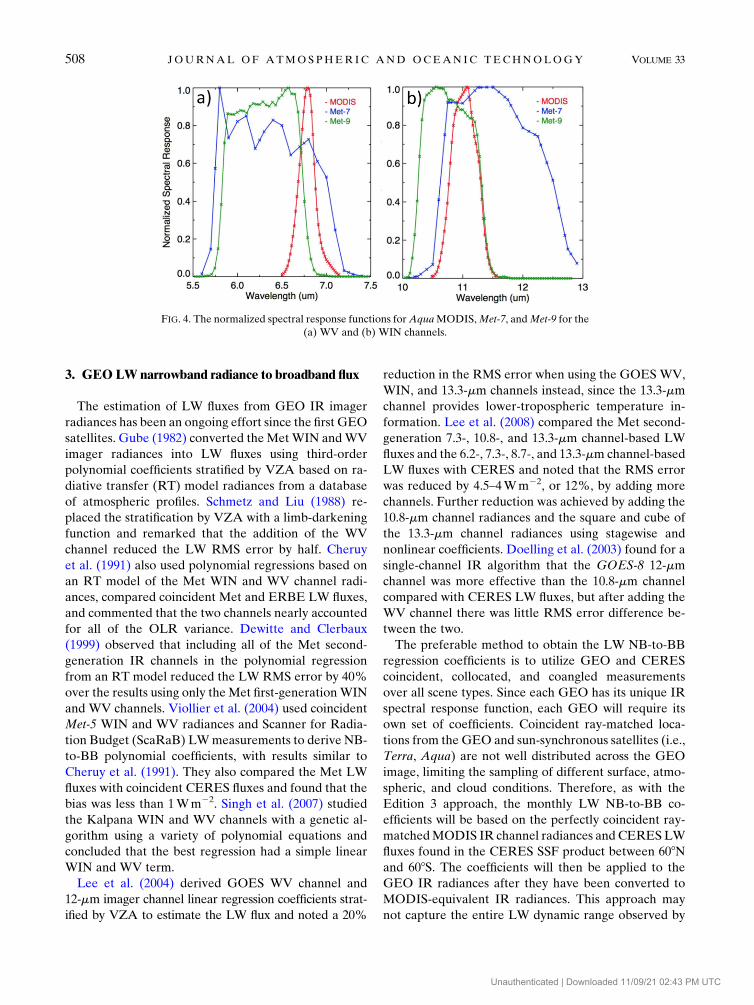
(section 3). TheGSICSGEO IR calibration is based on
convolving the hyperspectral Infrared Atmospheric
Sounding Interferometer (IASI) radiances with the
sensor spectral response function (Fig. 4) (Hewison
et al. 2013). The bottom row of Fig. 3 displays the GEO
minus GSICS-corrected GEO monthly temperature
biases with respect to IASI. For the Met-9 WIN and
WV channels, the BT difference is minimal with re-
spect to the GSICS calibration. However, theMet-9BT
difference with respect to MODIS is greater (Fig. 3
middle row), indicating that the MODIS and GEO BT
difference is mostly spectral, especially for the WV.
The GEO MODIS-equivalent IR temperature may
also include MODIS IR calibration anomalies, given
that the Aqua MODIS WIN and WV Collection 5 BTs
are within 0.2 6 0.2K and 20.6 6 0.3K, respectively,
FIG. 2. Scatterplot of the Terra and Aqua MODIS nadir (red points) and off-nadir (black
points) radiance pairs for June 2010 for the (left) WIN channel and (right) WV channel. The
associated regression line (solid) and perfect agreement line (dotted) are also shown.
506 JOURNAL OF ATMOSPHER IC AND OCEAN IC TECHNOLOGY VOLUME 33
Unauthenticated | Downloaded 11/09/21 02:43 PM UTC
with respect to IASI (Li et al. 2013). The seasonal
variability of the GEO BT difference with respect to
MODIS is also due to the spectral difference. TheMet-
7 WV BT difference drift is due to calibration. After
applying the GSICS calibration to all GEO satellites, it
was found that the GEOWIN and WV BT biases were
within 0.4K, similar to the results in Hewison et al.
(2013), except for Met-7. This suggests that for most
satellites, the GEO minus MODIS IR BT differences
are due to spectral band differences.
FIG. 3. (top row) Scatterplot of temperature pairs for the (left)Met-9WIN, (middle)Met-9WV, and (right)Met-7WIN channel and
corresponding Aqua MODIS channel for June 2012. The associated regression line (black) is also shown. (middle row) The 2007–13
monthly temperature biases at 290 (red) and 220 K (black) for day (o) and night (x) forMet-9WIN,Met-9WV, andMet-7WINminus
Aqua MODIS. For Met-9 WV the bias at 290 K is replaced with the bias at 250 K. (bottom row) As in middle row, except for GEO
minus GSICS-corrected GEOmonthly temperature biases. The GSICS correction is only available beginning in 2011 forMet-9 and in
2008 for Met-7.
MARCH 2016 DOELL ING ET AL . 507
Unauthenticated | Downloaded 11/09/21 02:43 PM UTC
3. GEOLWnarrowband radiance to broadband flux
The estimation of LW fluxes from GEO IR imager
radiances has been an ongoing effort since the first GEO
satellites. Gube (1982) converted theMetWIN andWV
imager radiances into LW fluxes using third-order
polynomial coefficients stratified by VZA based on ra-
diative transfer (RT) model radiances from a database
of atmospheric profiles. Schmetz and Liu (1988) re-
placed the stratification by VZA with a limb-darkening
function and remarked that the addition of the WV
channel reduced the LW RMS error by half. Cheruy
et al. (1991) also used polynomial regressions based on
an RT model of the Met WIN and WV channel radi-
ances, compared coincident Met and ERBE LW fluxes,
and commented that the two channels nearly accounted
for all of the OLR variance. Dewitte and Clerbaux
(1999) observed that including all of the Met second-
generation IR channels in the polynomial regression
from an RT model reduced the LW RMS error by 40%
over the results using only theMet first-generationWIN
and WV channels. Viollier et al. (2004) used coincident
Met-5 WIN and WV radiances and Scanner for Radia-
tion Budget (ScaRaB) LWmeasurements to derive NB-
to-BB polynomial coefficients, with results similar to
Cheruy et al. (1991). They also compared the Met LW
fluxes with coincident CERES fluxes and found that the
bias was less than 1Wm22. Singh et al. (2007) studied
the Kalpana WIN and WV channels with a genetic al-
gorithm using a variety of polynomial equations and
concluded that the best regression had a simple linear
WIN and WV term.
Lee et al. (2004) derived GOES WV channel and
12-mm imager channel linear regression coefficients strat-
ified by VZA to estimate the LW flux and noted a 20%
reduction in the RMS error when using the GOESWV,
WIN, and 13.3-mm channels instead, since the 13.3-mm
channel provides lower-tropospheric temperature in-
formation. Lee et al. (2008) compared the Met second-
generation 7.3-, 10.8-, and 13.3-mm channel-based LW
fluxes and the 6.2-, 7.3-, 8.7-, and 13.3-mm channel-based
LW fluxes with CERES and noted that the RMS error
was reduced by 4.5–4Wm22, or 12%, by adding more
channels. Further reduction was achieved by adding the
10.8-mm channel radiances and the square and cube of
the 13.3-mm channel radiances using stagewise and
nonlinear coefficients. Doelling et al. (2003) found for a
single-channel IR algorithm that the GOES-8 12-mm
channel was more effective than the 10.8-mm channel
compared with CERES LW fluxes, but after adding the
WV channel there was little RMS error difference be-
tween the two.
The preferable method to obtain the LW NB-to-BB
regression coefficients is to utilize GEO and CERES
coincident, collocated, and coangled measurements
over all scene types. Since each GEO has its unique IR
spectral response function, each GEO will require its
own set of coefficients. Coincident ray-matched loca-
tions from the GEO and sun-synchronous satellites (i.e.,
Terra, Aqua) are not well distributed across the GEO
image, limiting the sampling of different surface, atmo-
spheric, and cloud conditions. Therefore, as with the
Edition 3 approach, the monthly LW NB-to-BB co-
efficients will be based on the perfectly coincident ray-
matchedMODIS IR channel radiances and CERESLW
fluxes found in the CERES SSF product between 608Nand 608S. The coefficients will then be applied to the
GEO IR radiances after they have been converted to
MODIS-equivalent IR radiances. This approach may
not capture the entire LW dynamic range observed by
FIG. 4. The normalized spectral response functions forAquaMODIS,Met-7, andMet-9 for the
(a) WV and (b) WIN channels.
508 JOURNAL OF ATMOSPHER IC AND OCEAN IC TECHNOLOGY VOLUME 33
Unauthenticated | Downloaded 11/09/21 02:43 PM UTC
the GEO measurements, such as noontime desert and
late afternoon land convective conditions that are not
observed by either Terra orAqua. The fluxes from these
extreme conditions can be validated geographically
against hourly GERB fluxes (see section 6).
Historical studies indicate that most of the LW in-
formation is contained in theWIN andWVchannels, with
diminishing returns from additional IR channels. The
WIN andWV channels are found on all GEOs during the
CERES record, thereby providing the most consistent
LW fluxes across all GEOs. Varying the number of GEO
IR channels utilized may cause LW flux discontinuities
across satellite boundaries. Although it is possible to
compute coefficients using all availableGEO IR channels
associated with a similar MODIS channel, it presents an
operational challenge. Because of the inferior quality of
GEO images, which may contain spurious pixel-level ra-
diances, the addition of more IR channels increases the
risk of erroneous LW fluxes resulting from the spurious
radiances. The CERES Edition 3 product GEO data has
not been quality controlled, and corrupted scan lines are
embedded in the imagery. Since 2011, the GEO visible
and WIN imagery are visually inspected, and corrupted
scan lines are removed. CERES Edition 4 GEO data will
be quality controlled with a combination of automated
and human visualization efforts, since the volume of data
will be much greater.
a. colRH approach
The CERES Edition 3 uses a column-weighted rela-
tive humidity (colRH) approach that is described in
detail in Doelling et al. (2013) and summarized here.
TheGEOWIN flux is computed from theWIN radiance
using a limb-darkening factor (g) based on VZA fol-
lowing Eq. (1). The WIN flux is then converted to LW
flux using a quadratic function with a column-weighted
relative humidity term to estimate the water vapor ab-
sorption contribution using Eq. (2) (Minnis et al. 1991;
Young et al. 1998):
WINflux
5 6:18g(VZA)WINrad
(1)
LWflux
5 a01 a
1WIN
flux1 a
2WIN2
flux
1 a3WIN
fluxln(colRH). (2)
CERES uses atmospheric profiles from the Global
Modeling and Assimilation Office (GMAO) Goddard
Earth Observing System GEOS-5.4.1 assimilation data-
set (Rienecker et al. 2011) to obtain column-weighted
relative humidity. The monthly coefficients are derived
empirically from the perfectly matched MODIS WIN
channel radiances and CERES LWfluxes on the CERES
SSF product. Global ocean and land coefficients are
derived separately. The coefficients are found not to
vary in time. Only a single set of monthly coefficients is
used for the entire record.
b. Radiance-based approach
The radiance-based algorithm (RBA) converts the
WIN and WV radiances to LW fluxes by binning
according to WIN radiance, VZA, day/night, pre-
cipitable water (PW) from the GEOS 5.4.1 dataset,
clear/cloudy conditions from the CERES GEO four-
channel cloud retrievals, and surface type to remove the
nonlinear spectral, limb-darkening, and regional de-
pendencies of theGEOLWflux. There are 35 VZAbins
of 28 from 08 to 708, six WIN radiance bins of
2Wm22 sr21mm21 each, and four PW bins. There are
six surface types grouped by International Geosphere–
Biosphere Programme (IGBP) type that correspond to
the surface albedo brightness and are identified as
ocean, dark and bright land, dark and bright desert, and
snow; all are static except for snow (Loeb et al. 2005).
For each bin the LW NB-to-BB flux multilinear re-
gression coefficients are computed using Eq. (3):
LWflux
5 a01 a
1WIN
rad1 a
2WV
rad. (3)
The coefficients are computed monthly from the
matched MODIS WIN channel radiances and CERES
SSF LW fluxes.
c. Scene-based approach
The SBA increases the number of scene conditions by
taking advantage of the improved four-channel GEO
cloud properties and utilizing the CERES LW ADM to
convert radiances into fluxes. This algorithm uses the
same scene binning as the CERES LWADM to convert
the GEO IR radiances into BB radiances. It incorporates
six surface types, seven VZA, three PW, and day/night
bins, as well as five cloud amount, five cloud emissivity,
and six lapse rate bins based on the GEOS 5.4.1 dataset
and CERES GEO four-channel cloud retrievals. The
lapse rate is defined as the surface minus cloud-top tem-
perature difference, or in the case of clear sky, the surface
minus 300-hPa temperature. For each bin the LWNB-to-
BB coefficients are computed using Eq. (4):
LWrad
5 b01 b
1WIN
rad1 b
2WV
rad(4)
The coefficients are computed monthly from the
matched MODIS WIN channel radiances and CERES
SSF LW radiances. The CERES LWADM is then used
to convert the LW radiance to a flux.
Essentially, the RBA assumes that the spectral de-
pendency is radiance based and that various cloud
conditions with the same WIN and WV radiances will
MARCH 2016 DOELL ING ET AL . 509
Unauthenticated | Downloaded 11/09/21 02:43 PM UTC
have similar coefficients, whereas the SBA allows cloud
conditions with the same radiances to have unique
coefficients.
4. LW temporal interpolation and normalization
a. LW temporal interpolation
The CERES or GEO LWmeasurements are assigned
into 24 hourly increments, or hourboxes, per day. The
hourbox range is between UTC whole hours, that is, 0–
1UTC, 1–2UTC, etc. This is a departure from theERBE
temporal averaging where the hourboxes were defined
in local time. When both a CERES measurement and a
GEO LW measurement are within the same hourbox,
the CERES observation takes precedence. Then, the
linear interpolation between observed hourboxes fills
the remaining unsampled hourboxes. The SYN1deg
Edition 3 product incorporates 3-hourly GEO data.
Typically within 458N–458S, there are two Aqua
CERES, two Terra CERES, and eight 3-hourly GEO
daily measurements; the remaining 12h are composed
of interpolated LW fluxes. For the SYN1deg Edition 4
product, 1-hourly GEO imagery will be utilized. This
will eliminate the need for temporal interpolation unless
there is a data gap. Therefore, the addition of hourly
GEO fluxes and clouds is expected to increase the ac-
curacy of the TOA LW flux, as well as the associated
computed surface and in-atmosphere LW fluxes.
b. Instantaneous normalization
For the SYN1deg Edition 3 product, the residual
GEO OLR biases are removed by instantaneously
scaling the GEO-derived LW flux to the observed
CERES OLR. This is performed whenever a CERES
and GEO measurement are contained within the same
hourbox. The scaling factor is interpolated between
CERES measurement hourboxes and applied to all
GEO and interpolated LW hourbox fluxes. This en-
sures that the monthly regional GEO-derived LW
fluxes are on the same radiometric scale as the CERES
fluxes. The drawback of instantaneous normalization is
that the normalization factor not only contains the LW
NB-to-BB flux bias but also the GEO and CERES time
difference matching error, which can be as large as
59min. This may result in unrealistic normalized LW
fluxes, especially when warm clear-sky and cold high
thick cloud conditions are observed in the same
hourbox.
c. Regional normalization
GEO LW to CERES flux normalization in Edition 4
will incorporate the regional normalization algorithm
utilized for Edition 3 SWfluxes. This technique has been
effective in removing residual biases, which are man-
ifested regionally (Doelling et al. 2013). Regional GEO
and CERES LW flux pairs coincident within 30min
from a moving 58 latitude by 58 longitude domain are
regressed monthly to compute a monthly slope and
offset for each region. Only regions with the same sur-
face type within the same GEO domain are used to
derive the normalization coefficients. Any LW flux dif-
ference within the hourbox due to changing meteoro-
logical conditions will be considered as noise along the
linear regression line, as opposed to the instantaneous
normalization, which would give an unrealistic normal-
ization factor in this case.
5. Validation with CERES fluxes
The objective of this section is to validate the SBA,
which takes advantage of the MODIS-like four-channel
GEO cloud properties, the RBA, which strives for
consistency between GEO WIN and WV channels, and
the Edition 3 colRH baseline LWflux approaches.Terra
CERESLWobserved fluxes are used as truth to validate
the GEO-derived LW fluxes, where the LW NB-to-BB
coefficients are computed from the Aqua SSF product’s
MODIS and CERES measurements and where the
GEO fluxes are regionally normalized to the Aqua
CERES fluxes. No Terra measurements are used to
derive the GEO fluxes; they are used only to validate.
For CERES Edition 3, the Terra instrument calibration
was radiometrically scaled to the Aqua instrument cal-
ibration, implying that any Terra CERES and GEO LW
flux difference is due to the GEO LW flux algorithm.
The Terra (1030 LECT) and Aqua (1330 LECT) local
crossing time difference is symmetric about both local
noon and midnight. The time difference between the
two satellites’ orbits varies by 2h at 608N, 3h at the
equator, and 4h at 608S. Using a 30-min window to
match the GEO and Terra CERES measurements en-
sures that all regions in the GEO domain have two
measurements a day for validation.
a. LW approaches without normalization
Figure 5 displays theGEOdatasetminusTerraCERES
coincident (within 30min) LWmean regional flux biases
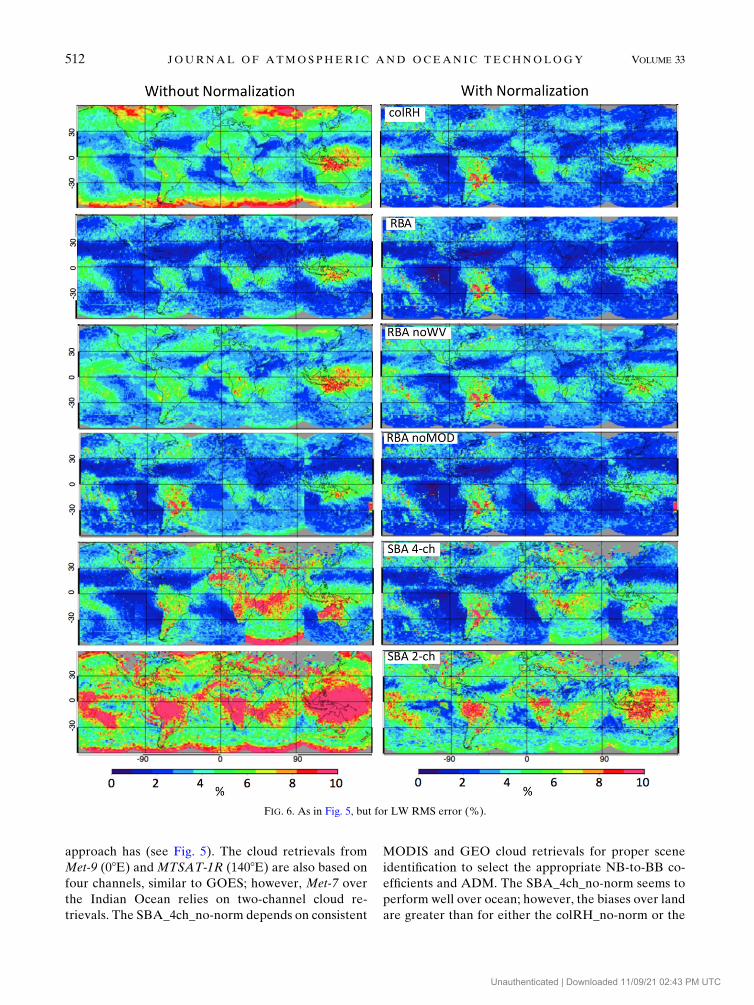
for January 2010. Figure 6 displays the corresponding
regional RMS errors. The colRH_no-norm (without
normalization) approach has large regional biases over
maritime stratus, Northern Hemisphere snow, the
tropical western Pacific, and the South Pacific conver-
gence zone. The large colRH_no-norm regional biases
and RMS errors near the poles suggest that the limb-
darkening factor [see Eq. (1)] is inadequate for large
510 JOURNAL OF ATMOSPHER IC AND OCEAN IC TECHNOLOGY VOLUME 33
Unauthenticated | Downloaded 11/09/21 02:43 PM UTC
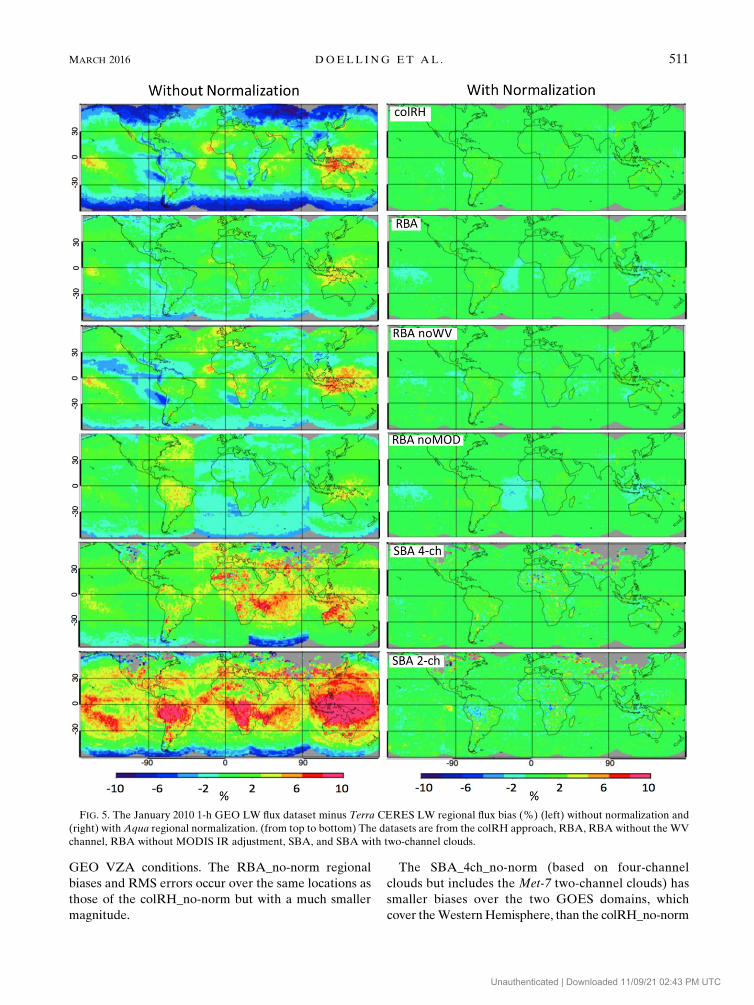
GEO VZA conditions. The RBA_no-norm regional
biases and RMS errors occur over the same locations as
those of the colRH_no-norm but with a much smaller
magnitude.
The SBA_4ch_no-norm (based on four-channel
clouds but includes the Met-7 two-channel clouds) has
smaller biases over the two GOES domains, which
cover theWesternHemisphere, than the colRH_no-norm
FIG. 5. The January 2010 1-h GEO LW flux dataset minus Terra CERES LW regional flux bias (%) (left) without normalization and
(right) with Aqua regional normalization. (from top to bottom) The datasets are from the colRH approach, RBA, RBA without the WV
channel, RBA without MODIS IR adjustment, SBA, and SBA with two-channel clouds.
MARCH 2016 DOELL ING ET AL . 511
Unauthenticated | Downloaded 11/09/21 02:43 PM UTC
approach has (see Fig. 5). The cloud retrievals from
Met-9 (08E) and MTSAT-1R (1408E) are also based on
four channels, similar to GOES; however, Met-7 over
the Indian Ocean relies on two-channel cloud re-
trievals. The SBA_4ch_no-norm depends on consistent
MODIS and GEO cloud retrievals for proper scene
identification to select the appropriate NB-to-BB co-
efficients and ADM. The SBA_4ch_no-norm seems to
perform well over ocean; however, the biases over land
are greater than for either the colRH_no-norm or the
FIG. 6. As in Fig. 5, but for LW RMS error (%).
512 JOURNAL OF ATMOSPHER IC AND OCEAN IC TECHNOLOGY VOLUME 33
Unauthenticated | Downloaded 11/09/21 02:43 PM UTC
RBA_no_norm. For the SBA_2ch_no-norm (based on
two-channel clouds), large regional biases and RMS
errors seem to manifest themselves in circular VZA
patterns, centered on the individual GEO domains.
The SBA_4ch_no-norm and the SBA_2ch_no-norm
gray regions over Northern Hemisphere land are cov-
ered by snow, where the GEO cloud retrievals are
considered unreliable. The snow-covered regions rely
on temporally interpolated MODIS cloud properties
because no systematic diurnal variations in cloud con-
ditions are expected over snow.
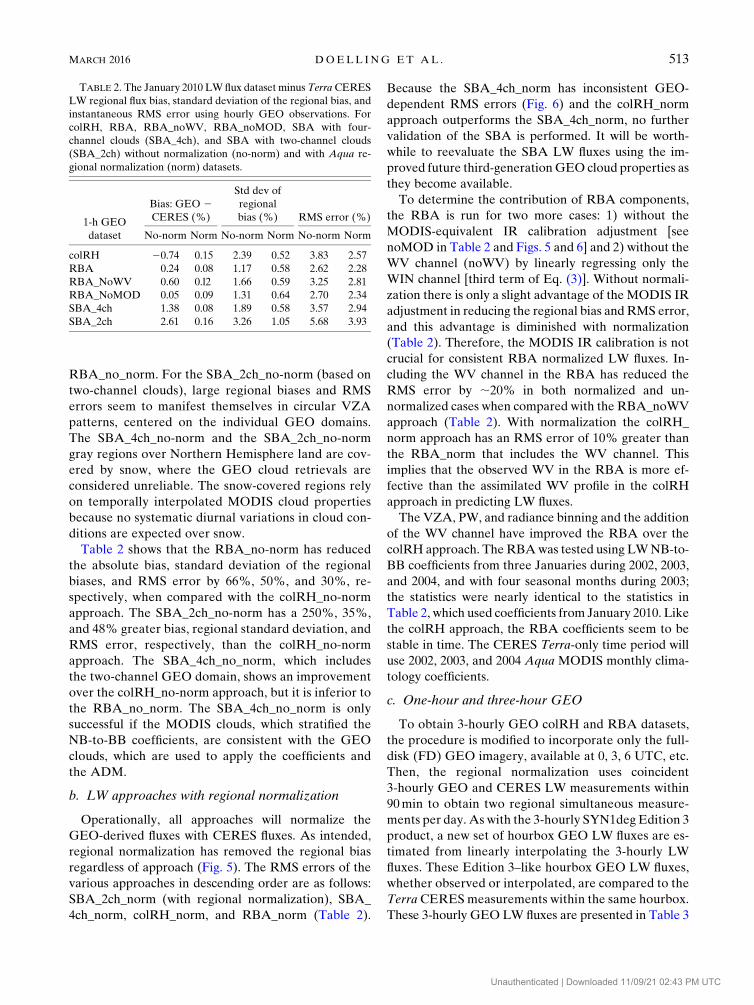
Table 2 shows that the RBA_no-norm has reduced
the absolute bias, standard deviation of the regional
biases, and RMS error by 66%, 50%, and 30%, re-
spectively, when compared with the colRH_no-norm
approach. The SBA_2ch_no-norm has a 250%, 35%,
and 48% greater bias, regional standard deviation, and
RMS error, respectively, than the colRH_no-norm
approach. The SBA_4ch_no_norm, which includes
the two-channel GEO domain, shows an improvement
over the colRH_no-norm approach, but it is inferior to
the RBA_no_norm. The SBA_4ch_no_norm is only
successful if the MODIS clouds, which stratified the
NB-to-BB coefficients, are consistent with the GEO
clouds, which are used to apply the coefficients and
the ADM.
b. LW approaches with regional normalization
Operationally, all approaches will normalize the
GEO-derived fluxes with CERES fluxes. As intended,
regional normalization has removed the regional bias
regardless of approach (Fig. 5). The RMS errors of the
various approaches in descending order are as follows:
SBA_2ch_norm (with regional normalization), SBA_
4ch_norm, colRH_norm, and RBA_norm (Table 2).
Because the SBA_4ch_norm has inconsistent GEO-
dependent RMS errors (Fig. 6) and the colRH_norm
approach outperforms the SBA_4ch_norm, no further
validation of the SBA is performed. It will be worth-
while to reevaluate the SBA LW fluxes using the im-
proved future third-generationGEO cloud properties as
they become available.
To determine the contribution of RBA components,
the RBA is run for two more cases: 1) without the
MODIS-equivalent IR calibration adjustment [see
noMOD in Table 2 and Figs. 5 and 6] and 2) without the
WV channel (noWV) by linearly regressing only the
WIN channel [third term of Eq. (3)]. Without normali-
zation there is only a slight advantage of the MODIS IR
adjustment in reducing the regional bias and RMS error,
and this advantage is diminished with normalization
(Table 2). Therefore, the MODIS IR calibration is not
crucial for consistent RBA normalized LW fluxes. In-
cluding the WV channel in the RBA has reduced the
RMS error by ;20% in both normalized and un-
normalized cases when compared with the RBA_noWV
approach (Table 2). With normalization the colRH_
norm approach has an RMS error of 10% greater than
the RBA_norm that includes the WV channel. This
implies that the observed WV in the RBA is more ef-
fective than the assimilated WV profile in the colRH
approach in predicting LW fluxes.
The VZA, PW, and radiance binning and the addition
of the WV channel have improved the RBA over the
colRH approach. The RBAwas tested using LWNB-to-
BB coefficients from three Januaries during 2002, 2003,
and 2004, and with four seasonal months during 2003;
the statistics were nearly identical to the statistics in
Table 2, which used coefficients from January 2010. Like
the colRH approach, the RBA coefficients seem to be
stable in time. The CERES Terra-only time period will
use 2002, 2003, and 2004 Aqua MODIS monthly clima-
tology coefficients.
c. One-hour and three-hour GEO
To obtain 3-hourly GEO colRH and RBA datasets,
the procedure is modified to incorporate only the full-
disk (FD) GEO imagery, available at 0, 3, 6 UTC, etc.
Then, the regional normalization uses coincident
3-hourly GEO and CERES LW measurements within
90min to obtain two regional simultaneous measure-
ments per day. As with the 3-hourly SYN1deg Edition 3
product, a new set of hourbox GEO LW fluxes are es-
timated from linearly interpolating the 3-hourly LW
fluxes. These Edition 3–like hourbox GEO LW fluxes,
whether observed or interpolated, are compared to the
TerraCERESmeasurements within the same hourbox.
These 3-hourly GEO LW fluxes are presented in Table 3
TABLE 2. The January 2010 LWflux dataset minus TerraCERES
LW regional flux bias, standard deviation of the regional bias, and
instantaneous RMS error using hourly GEO observations. For
colRH, RBA, RBA_noWV, RBA_noMOD, SBA with four-
channel clouds (SBA_4ch), and SBA with two-channel clouds
(SBA_2ch) without normalization (no-norm) and with Aqua re-
gional normalization (norm) datasets.
1-h GEO
dataset
Bias: GEO 2CERES (%)
Std dev of
regional
bias (%) RMS error (%)
No-norm Norm No-norm Norm No-norm Norm
colRH 20.74 0.15 2.39 0.52 3.83 2.57
RBA 0.24 0.08 1.17 0.58 2.62 2.28
RBA_NoWV 0.60 0.l2 1.66 0.59 3.25 2.81
RBA_NoMOD 0.05 0.09 1.31 0.64 2.70 2.34
SBA_4ch 1.38 0.08 1.89 0.58 3.57 2.94
SBA_2ch 2.61 0.16 3.26 1.05 5.68 3.93
MARCH 2016 DOELL ING ET AL . 513
Unauthenticated | Downloaded 11/09/21 02:43 PM UTC
and can be compared with the 1-hourly GEO LW fluxes
in Table 2. Regional normalization removes the
3-hourly GEO LW bias as effectively as the 1-hourly
GEOLWbias for both colRH andRBA. Normalization
reduces both the 3-hourly or 1-hourly RBA RMS error
by ;10%, whereas at least a 20% reduction for both
3-hourly and 1-hourly error is realized for the colRH
approach. However, introducing 1-hourly GEO reduces
the normalized regional RMS error by 30% and 40%
over 3-hourly GEO for the RBA_norm and colRH_
norm approaches, respectively. Without normalization
the regional RMS error is reduced by 25% and 30% for
the RBA_no-norm and colRH_no-norm approaches,
respectively, using 1-hourly GEO instead of 3-hourly
GEO. Although the 1-hourly data do not change the
monthly mean regional bias, they greatly reduce the
instantaneous flux bias with either method and with or
without normalization.
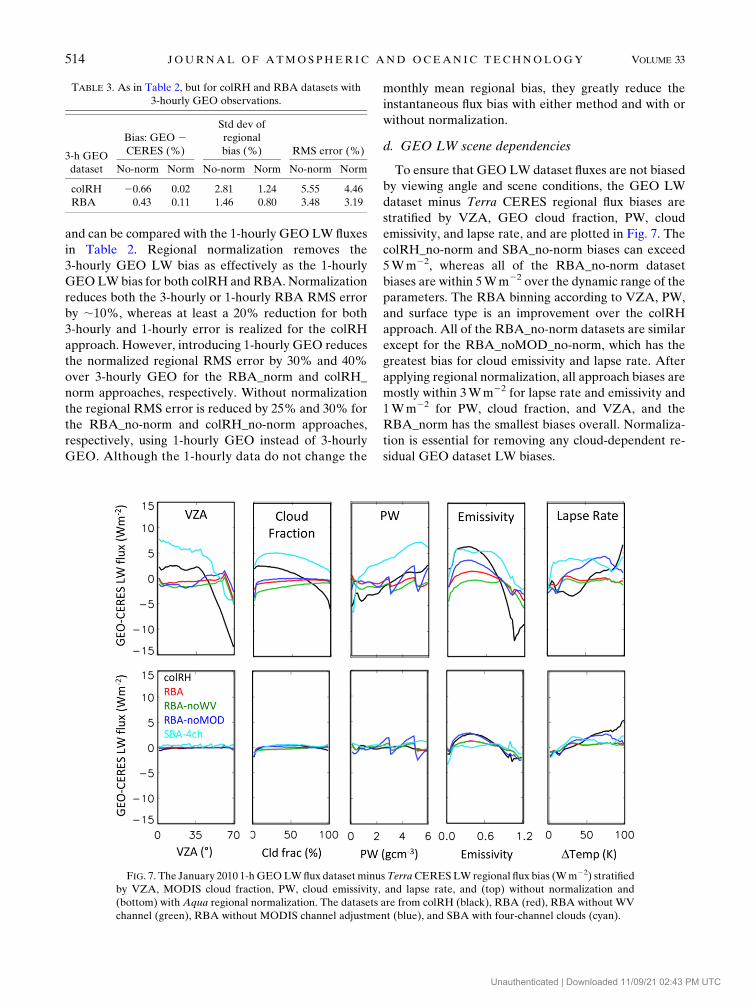
d. GEO LW scene dependencies
To ensure that GEO LW dataset fluxes are not biased
by viewing angle and scene conditions, the GEO LW
dataset minus Terra CERES regional flux biases are
stratified by VZA, GEO cloud fraction, PW, cloud
emissivity, and lapse rate, and are plotted in Fig. 7. The
colRH_no-norm and SBA_no-norm biases can exceed
5Wm22, whereas all of the RBA_no-norm dataset
biases are within 5Wm22 over the dynamic range of the
parameters. The RBA binning according to VZA, PW,
and surface type is an improvement over the colRH
approach. All of the RBA_no-norm datasets are similar
except for the RBA_noMOD_no-norm, which has the
greatest bias for cloud emissivity and lapse rate. After
applying regional normalization, all approach biases are
mostly within 3Wm22 for lapse rate and emissivity and
1Wm22 for PW, cloud fraction, and VZA, and the
RBA_norm has the smallest biases overall. Normaliza-
tion is essential for removing any cloud-dependent re-
sidual GEO dataset LW biases.
FIG. 7. The January 2010 1-hGEOLWflux dataset minusTerraCERESLW regional flux bias (Wm22) stratified
by VZA, MODIS cloud fraction, PW, cloud emissivity, and lapse rate, and (top) without normalization and
(bottom) with Aqua regional normalization. The datasets are from colRH (black), RBA (red), RBA without WV
channel (green), RBA without MODIS channel adjustment (blue), and SBA with four-channel clouds (cyan).
TABLE 3. As in Table 2, but for colRH and RBA datasets with
3-hourly GEO observations.
3-h GEO
dataset
Bias: GEO 2CERES (%)
Std dev of
regional
bias (%) RMS error (%)
No-norm Norm No-norm Norm No-norm Norm
colRH 20.66 0.02 2.81 1.24 5.55 4.46
RBA 0.43 0.11 1.46 0.80 3.48 3.19
514 JOURNAL OF ATMOSPHER IC AND OCEAN IC TECHNOLOGY VOLUME 33
Unauthenticated | Downloaded 11/09/21 02:43 PM UTC
6. Validation with GERB fluxes
The previous section validated the GEO-derived LW
fluxes at the Terra local time only. To validate the ap-
proaches over the entire diurnal cycle, the GERB LW
fluxes from January 2010 are used as truth (Harries et al.
2005). The GERB fluxes have temporal and nominal
spatial resolutions of 15min and 50 km, respectively, and
cover 608W–608E. The GERB Edition 1 LW fluxes are
1.3% darker than CERES, but they are within the
combined stated instrument calibration uncertainties.
GERB may also have residual LW biases over cloudy
conditions and as a function of view angle due to in-
adequate ADMs (Clerbaux et al. 2009). For this study,
the GERB fluxes are scaled to the CERES LW fluxes to
ensure the GERB and CERES flux differences do not
impact the validation. For this scaling, the GERB-1
Edition 1 averaged rectified geolocated (ARG) product
footprint fluxes (Dewitte et al. 2008) are averaged into
the CERES equal-area grid. The coincident (within
15min) GERB and Terra and Aqua CERES LW fluxes
are then linearly regressed. The regression coefficients
are shown in Eq. (5):
LWCERES
5 1:0163LWGERB
2 0:24. (5)
The slope is very close to the 1.3% reported by Clerbaux
et al. (2009), and the scatter about the regression was
3.75%. Some of this scatter can be attributed to the
GERB residual ADM LW bias, which should not
impact the overall GERB domain comparison. To
compare specific scene conditions, a more robust
GERB to CERES LW flux scaling would need to be
performed.
The GERB field of view is divided into three GEO
domains using the longitudes located at 37.58W and
288E. To minimize the time between GEO and GERB
measurements, the GERB 15-min image that is closest
to theGEO scan time (Table 4) is selected, ensuring that
most matches occur within 15min.
a. With and without regional normalization
The LW fluxes from the RBA and colRH approaches
are compared with the GERB LW fluxes and are shown
in Fig. 8 and summarized in Tables 5 and 6. Without
normalization the RBA_no-norm shows improvement
over the colRH_no-norm for the entire GERB domain,
especially in reducing all temporal-resolution RMS er-
rors by more than 40%, except for the 1- and 3-h RMS
errors, which were reduced by ;30% (Table 5). With
regional normalization, the colRH_norm, when com-
pared with RBA_norm, has a 10% lower monthly RMS
error, similar monthly hourly RMS errors, and more
than 20% greater daily, 3-, and 1-hourly RMS errors
(Table 6). Regional normalization reduced the monthly
and monthly 1-h RBA (colRH) RMS errors by 40%
(75%) and 20% (50%), respectively, and for daily and
hourly time scales by 10% (35%) and 5% (13%), re-
spectively. Normalization is critical for both approaches
but particularly for the colRH approach.
b. Regional and instantaneous normalization
To determine the effects of the normalizationmethod,
both regional and instantaneous normalizations are
applied to the RBA. Instantaneous normalization as-
sumes that the CERES and GEO LW fluxes are asso-
ciated with the same scene conditions within an
hourbox.Where there is little hourly LWflux variability,
the instantaneous normalization is better suited than the
regional normalization, such as over the ocean off the
west coast of Namibia (cf. 1-hourly flux in Fig. 8).
However, over land convective regions over Brazil and
Africa, regional normalization performs better. In-
stantaneous normalization reduces the RBA monthly
RMS error by ;20% over regional normalization
(Table 5). For the monthly 3-hourly and 1-hourly error,
the RBA RMS errors are similar, regardless of the
normalization method. However, regional normaliza-
tion reduces the RBAdaily, 3-, and 1-hourly RMS errors
by 12%, 20%, and 17%, respectively, from the RBA
with instantaneous normalization. In general, in-
stantaneous normalization is better suited for removing
monthly regional biases, whereas regional normaliza-
tion increases the accuracy of higher temporal-
resolution LW fluxes.
If the monthly RMS error were the only criteria for
choosing the GEO LW approach, then the colRH ap-
proach with instantaneous normalization is ideal. Based
on RMS errors for all other temporal resolutions, the
RBAwith regional normalization is preferred. Edition 4
will use the regional normalization technique since in-
stantaneous normalization may introduce unrealistic
1-hourly GEO LW fluxes if the scene conditions within
the hourbox are inconsistent. For Edition 3, Doelling et al.
(2013, their Table 4, CG results) report a 0.53% monthly
RMS error over the GERB domain during January 2005
using instantaneous normalization with 3-hourly GEO
TABLE 4. Beginning scan times for the GEOs used over the
GERB domain and associated GERB scan times (min after the
hour). The GOES-12 NH scan covers 608N–208S and the SH scan
covers 208–508S.
Satellite Position GEO time GERB time
GOES-12 NH 608–37.58W 45 45
GOES-12 SH 608–37.58W 9 0
Met-9 37.58W–288E 0 0
Met-7 288–608E 30 30
MARCH 2016 DOELL ING ET AL . 515
Unauthenticated | Downloaded 11/09/21 02:43 PM UTC
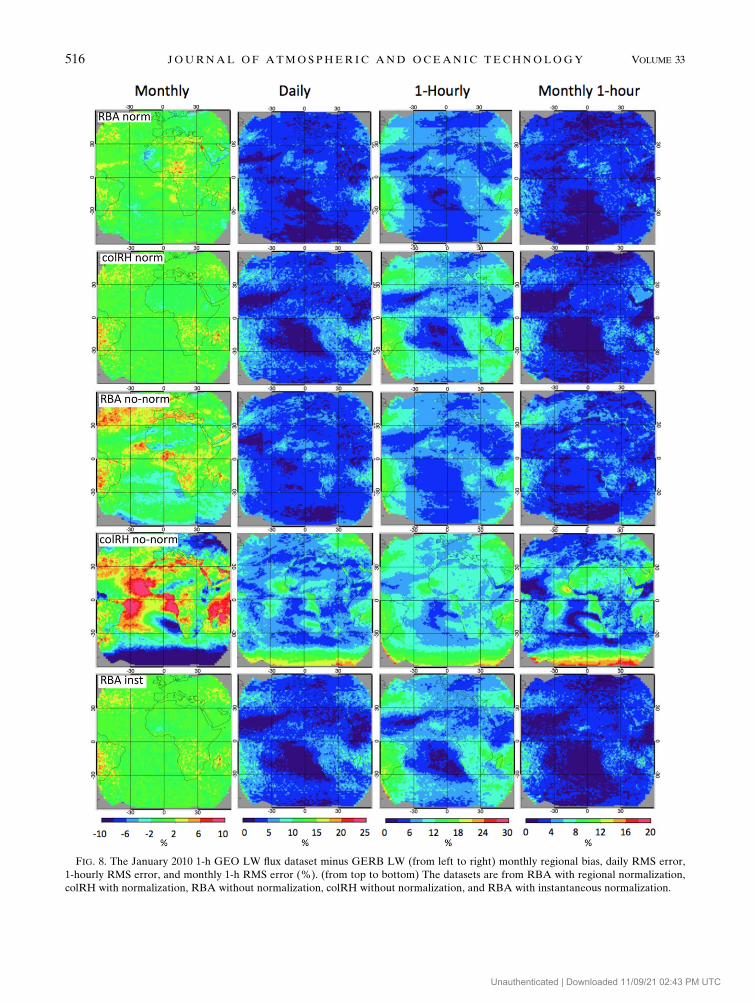
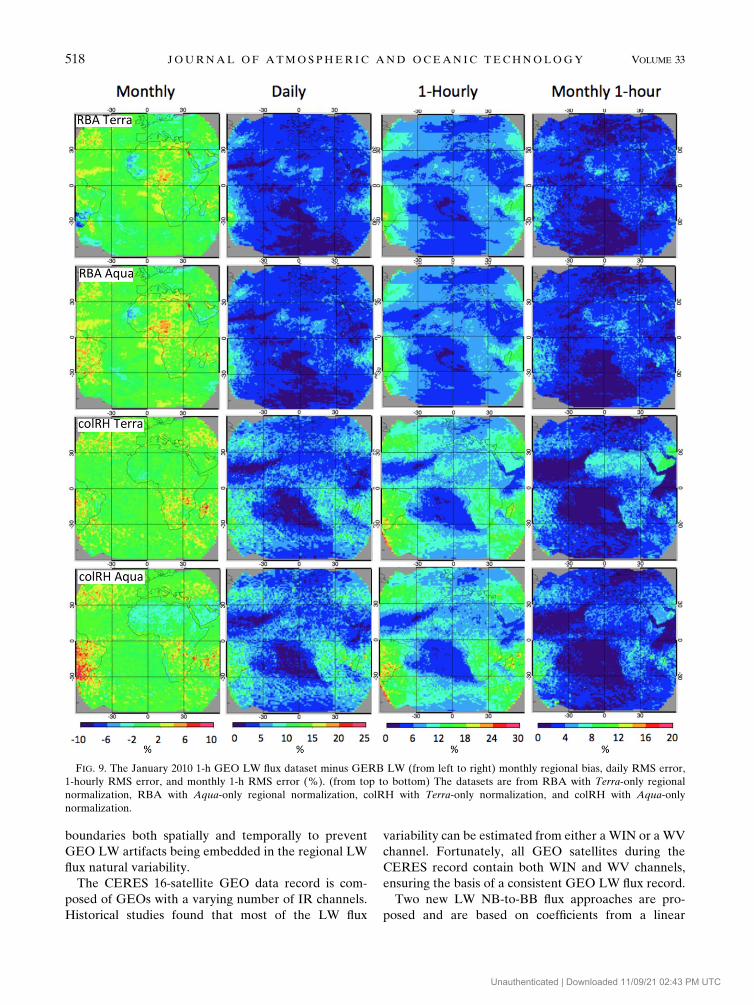
FIG. 8. The January 2010 1-h GEO LW flux dataset minus GERB LW (from left to right) monthly regional bias, daily RMS error,
1-hourly RMS error, and monthly 1-h RMS error (%). (from top to bottom) The datasets are from RBA with regional normalization,
colRH with normalization, RBA without normalization, colRH without normalization, and RBA with instantaneous normalization.
516 JOURNAL OF ATMOSPHER IC AND OCEAN IC TECHNOLOGY VOLUME 33
Unauthenticated | Downloaded 11/09/21 02:43 PM UTC
LW fluxes. The Edition 4 monthly RMS error is ex-
pected to be 0.59% (Table 5), which is slightly greater
than Edition 3; however, the higher temporal-resolution
RMS errors will be significantly reduced.
c. Terra-only and Aqua-only normalization
Future CERES data products may have to rely on
observations exclusively from CERES instruments on
0130 LT sun-synchronous orbits if the Terra instruments
fail. If the GEO-derived LW fluxes were perfect, then
the GEO LW fluxes normalized with Terra only, Aqua
only, or Terra 1 Aqua should be identical. Doelling
et al. (2013, their Table 4, CG results) found that in-
stantaneous normalization with Terra 1 Aqua reduced
the monthly and daily RMS errors by ;20% from nor-
malization with one satellite only. Also, the Terra-only
and Aqua-only GERB domain statistics were similar to
each other. However, Doelling et al. (2013, their Fig. 8,
CG results) showed very different monthly hourly LW
fluxes depending on the satellite used for normalization.
These results indicate that a discontinuity in the GEO-
derived LW fluxes may be encountered when migrating
to a single CERES satellite.
Both the RBA and colRH approach datasets were
regionally normalized with Aqua-only, Terra-only, and
Terra 1 Aqua CERES LW fluxes. The single CERES
satellite results are shown in Fig. 9 and can be compared
with the Terra1Aqua results in Fig. 8. The RBA shows
more consistency among the three satellite-dependent
normalizations. The monthly 1-h RMS errors of the
colRH approach are clearly greater over the Sahara
Desert and the Arabian Peninsula for Terra-only nor-
malization than for Aqua-only normalization (Fig. 9).
The diurnal (monthly 1- and 3-hourly) consistency of the
three satellite-dependent normalization approaches was
much greater for the RBA than for the colRH approach
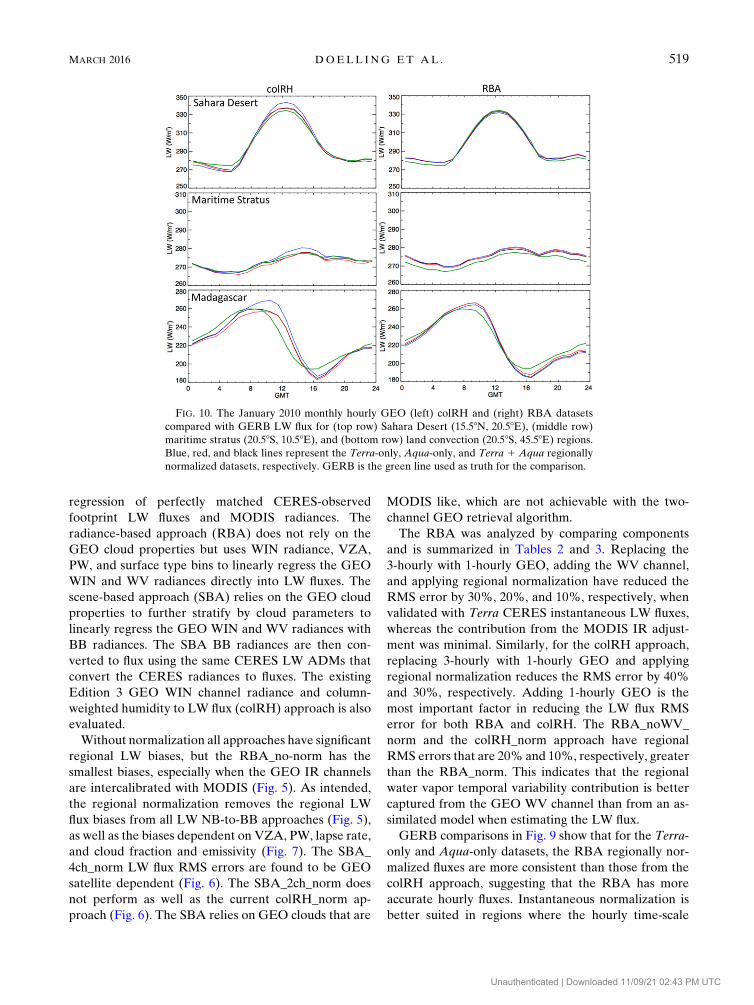
(Tables 5 and 6). Comparisons of the satellite-
dependent regional normalization of the colRH and
RBA are shown in Fig. 10 for desert, maritime stratus,
and convective regions, clearly illustrating the consis-
tency of the RBA satellite-dependent normalizations.
The RBA dual-satellite regional normalization mainly
reduces the monthly RMS error over single-satellite
normalization, whereas for the colRH approach, all
temporal-resolution RMS errors were reduced. The
consistency of the RBA satellite-dependent normaliza-
tion implies the RBA provides more accurate LW fluxes
than the colRH approach.
7. Conclusions
The CERES Edition 4 product reprocessing has pro-
vided the opportunity to validate the current and new
GEO-derived LW flux algorithms. The Edition 4 has
allowed the use of 1-hourly GEO data, improved four-
channel GEO cloud retrievals, and multiple GEO IR
channels to derive the LW flux. Edition 3 was based on
3-hourly GEO data and two-channel GEO cloud re-
trievals, and the LW flux was derived from the WIN
channel and column-weighted relative humidity from an
assimilated dataset. For CERES, the GEO-derived LW
flux algorithm is based on the GEO IR calibration, the
LW NB-to-BB algorithm, the LW flux temporal in-
terpolation, and the normalization of the GEO-derived
LW fluxes with CERES-observed fluxes. The resultant
GEO LW fluxes need to be consistent across satellite
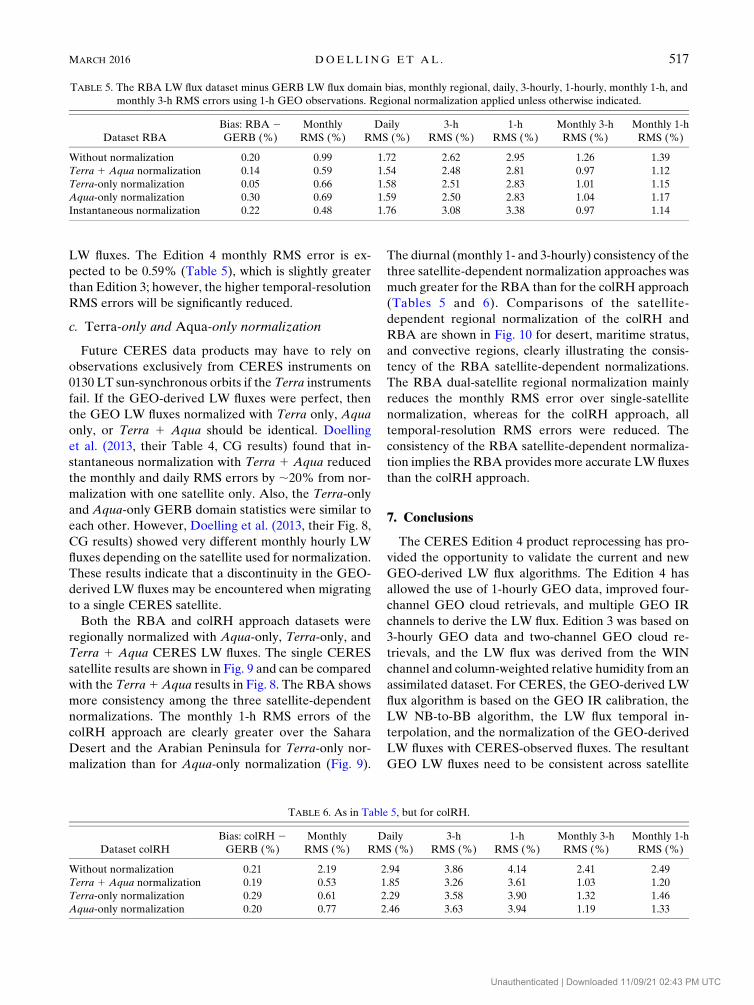
TABLE 6. As in Table 5, but for colRH.
Dataset colRH
Bias: colRH 2GERB (%)
Monthly
RMS (%)
Daily
RMS (%)
3-h
RMS (%)
1-h
RMS (%)
Monthly 3-h
RMS (%)
Monthly 1-h
RMS (%)
Without normalization 0.21 2.19 2.94 3.86 4.14 2.41 2.49
Terra 1 Aqua normalization 0.19 0.53 1.85 3.26 3.61 1.03 1.20
Terra-only normalization 0.29 0.61 2.29 3.58 3.90 1.32 1.46
Aqua-only normalization 0.20 0.77 2.46 3.63 3.94 1.19 1.33
TABLE 5. The RBA LW flux dataset minus GERB LW flux domain bias, monthly regional, daily, 3-hourly, 1-hourly, monthly 1-h, and
monthly 3-h RMS errors using 1-h GEO observations. Regional normalization applied unless otherwise indicated.
Dataset RBA
Bias: RBA 2GERB (%)
Monthly
RMS (%)
Daily
RMS (%)
3-h
RMS (%)
1-h
RMS (%)
Monthly 3-h
RMS (%)
Monthly 1-h
RMS (%)
Without normalization 0.20 0.99 1.72 2.62 2.95 1.26 1.39
Terra 1 Aqua normalization 0.14 0.59 1.54 2.48 2.81 0.97 1.12
Terra-only normalization 0.05 0.66 1.58 2.51 2.83 1.01 1.15
Aqua-only normalization 0.30 0.69 1.59 2.50 2.83 1.04 1.17
Instantaneous normalization 0.22 0.48 1.76 3.08 3.38 0.97 1.14
MARCH 2016 DOELL ING ET AL . 517
Unauthenticated | Downloaded 11/09/21 02:43 PM UTC
boundaries both spatially and temporally to prevent
GEO LW artifacts being embedded in the regional LW
flux natural variability.
The CERES 16-satellite GEO data record is com-
posed of GEOs with a varying number of IR channels.
Historical studies found that most of the LW flux
variability can be estimated from either a WIN or a WV
channel. Fortunately, all GEO satellites during the
CERES record contain both WIN and WV channels,
ensuring the basis of a consistent GEO LW flux record.
Two new LW NB-to-BB flux approaches are pro-
posed and are based on coefficients from a linear
FIG. 9. The January 2010 1-h GEO LW flux dataset minus GERB LW (from left to right) monthly regional bias, daily RMS error,
1-hourly RMS error, and monthly 1-h RMS error (%). (from top to bottom) The datasets are from RBA with Terra-only regional
normalization, RBA with Aqua-only regional normalization, colRH with Terra-only normalization, and colRH with Aqua-only
normalization.
518 JOURNAL OF ATMOSPHER IC AND OCEAN IC TECHNOLOGY VOLUME 33
Unauthenticated | Downloaded 11/09/21 02:43 PM UTC
regression of perfectly matched CERES-observed
footprint LW fluxes and MODIS radiances. The
radiance-based approach (RBA) does not rely on the
GEO cloud properties but uses WIN radiance, VZA,
PW, and surface type bins to linearly regress the GEO
WIN and WV radiances directly into LW fluxes. The
scene-based approach (SBA) relies on the GEO cloud
properties to further stratify by cloud parameters to
linearly regress the GEO WIN and WV radiances with
BB radiances. The SBA BB radiances are then con-
verted to flux using the same CERES LW ADMs that
convert the CERES radiances to fluxes. The existing
Edition 3 GEO WIN channel radiance and column-
weighted humidity to LW flux (colRH) approach is also
evaluated.
Without normalization all approaches have significant
regional LW biases, but the RBA_no-norm has the
smallest biases, especially when the GEO IR channels
are intercalibrated with MODIS (Fig. 5). As intended,
the regional normalization removes the regional LW
flux biases from all LW NB-to-BB approaches (Fig. 5),
as well as the biases dependent on VZA, PW, lapse rate,
and cloud fraction and emissivity (Fig. 7). The SBA_
4ch_norm LW flux RMS errors are found to be GEO
satellite dependent (Fig. 6). The SBA_2ch_norm does
not perform as well as the current colRH_norm ap-
proach (Fig. 6). The SBA relies on GEO clouds that are
MODIS like, which are not achievable with the two-
channel GEO retrieval algorithm.
The RBA was analyzed by comparing components
and is summarized in Tables 2 and 3. Replacing the
3-hourly with 1-hourly GEO, adding the WV channel,
and applying regional normalization have reduced the
RMS error by 30%, 20%, and 10%, respectively, when
validated with Terra CERES instantaneous LW fluxes,
whereas the contribution from the MODIS IR adjust-
ment was minimal. Similarly, for the colRH approach,
replacing 3-hourly with 1-hourly GEO and applying
regional normalization reduces the RMS error by 40%
and 30%, respectively. Adding 1-hourly GEO is the
most important factor in reducing the LW flux RMS
error for both RBA and colRH. The RBA_noWV_
norm and the colRH_norm approach have regional
RMS errors that are 20% and 10%, respectively, greater
than the RBA_norm. This indicates that the regional
water vapor temporal variability contribution is better
captured from the GEO WV channel than from an as-
similated model when estimating the LW flux.
GERB comparisons in Fig. 9 show that for the Terra-
only and Aqua-only datasets, the RBA regionally nor-
malized fluxes are more consistent than those from the
colRH approach, suggesting that the RBA has more
accurate hourly fluxes. Instantaneous normalization is
better suited in regions where the hourly time-scale
FIG. 10. The January 2010 monthly hourly GEO (left) colRH and (right) RBA datasets
compared with GERB LW flux for (top row) Sahara Desert (15.58N, 20.58E), (middle row)
maritime stratus (20.58S, 10.58E), and (bottom row) land convection (20.58S, 45.58E) regions.Blue, red, and black lines represent the Terra-only, Aqua-only, and Terra 1 Aqua regionally
normalized datasets, respectively. GERB is the green line used as truth for the comparison.
MARCH 2016 DOELL ING ET AL . 519
Unauthenticated | Downloaded 11/09/21 02:43 PM UTC
variations in LW fluxes are small, whereas regional
normalization is more applicable to convective regions
where the short-termLWflux variations can be dramatic
(Fig. 8). To take advantage of both normalization
techniques, a hybrid normalization approach may be
applied for Edition 5.
The CERES Edition 4 GEO products will in-
corporate the 1-hourly GEO WIN and WV channel
radiances adjusted to the MODIS calibration using the
RBA with regional normalization to derive the GEO
LW fluxes. The Edition 4 GEO LW fluxes (see Fig. 8
RBA_norm and Table 5 Terra 1 Aqua normalization)
are anticipated to have regional monthly LW RMS er-
rors that are slightly greater than Edition 3 (see Fig. 8
colRH_norm and Table 6 Terra 1 Aqua normaliza-
tion), but with significantly reduced LW RMS errors at
higher temporal resolutions. Further validation of the
GEO LW fluxes is anticipated in 2016, when the entire
CERES record is reprocessed as Edition 4. The new
third-generation GEO satellites will offer an opportu-
nity to reevaluate the LW approaches, by employing
more IR channels to estimate the LW flux and by using
improved GEO cloud retrievals that should be near
MODIS like. The new GEO satellites will also offer
10-min full-disk imagery. The GEO-derived LW fluxes
from using subhourly GEO sampling, which would
capture more of the diurnal cycle and reduce the
matching times when normalizing with CERES fluxes,
should be more accurate, but they will come at a con-
siderable data processing cost.
Acknowledgments. This work was funded by the
NASA CERES project. The validation effort could not
have been accomplished without the help of the CERES
TISA team. CERES SYN1deg Edition 3 data were ob-
tained from the NASA Langley Research Center
EOSDIS Distributed Active Archive Center. GERB
Edition 1 Level 2 ARG data were obtained from the
GERB Ground Segment Processing System at Ruth-
erford Appleton Laboratory. The GEOS-5 data used in
this study/project were provided by the Global Model-
ing and Assimilation Office (GMAO) at NASA God-
dard Space Flight Center.
REFERENCES
Cheruy, F., R. S. Kandel, and J. P. Duvel, 1991: Outgoing longwave
radiation and its diurnal variation from combined ERBE and
MET observations: 1. Estimating OLR from Meteosat data.
J. Geophys. Res., 96, 22 611–22 622, doi:10.1029/91JD02153.
Clerbaux, N., and Coauthors, 2009: Comparison of GERB in-
stantaneous radiance and flux products withCERESEdition-2
data. Remote Sens. Environ., 113, 102–114, doi:10.1016/
j.rse.2008.08.016.
Dewitte, S., and N. Clerbaux, 1999: First experience with GERB
ground segment processing software: Validation with CERES
PFM data. Adv. Space Res., 24, 925–929, doi:10.1016/
S0273-1177(99)00357-9.
——, L. Gonzalez, N. Clerbaux, A. Ipe, C. Bertrand, and B. De
Paepe, 2008: The Geostationary Earth Radiation Budget
edition 1 data processing algorithms. Adv. Space Res., 41,
190621913, doi:10.1016/j.asr.2007.07.042.
Doelling, D. R., M. M. Khaiyer, and P. Minnis, 2003: Improved
ARM-SGPTOAOLRfluxes fromGOES-8 IR radiances based
on CERES data. Proc. 13th Atmospheric Radiation Measure-
ment (ARM) Science Team Meeting, Broomfield, CO, U.S.
Dept. of Energy. [Available online at http://www.arm.gov/
publications/proceedings/conf13/extended_abs/doelling-dr.pdf.]
——, and Coauthors, 2013: Geostationary enhanced temporal in-
terpolation for CERES flux products. J. Atmos. Oceanic
Technol., 30, 1072–1090, doi:10.1175/JTECH-D-12-00136.1.
——, A. Wu, X. Xiong, B. R. Scarino, R. Bhatt, C. O. Haney,
D. Morstad, and A. Gopalan, 2015: The radiometric stability
and scaling of collection 6Terra- andAqua-MODISVIS,NIR,
and SWIR spectral bands. IEEE Trans. Geosci. Remote Sens.,
53, 4520–4535, doi:10.1109/TGRS.2015.2400928.
Goldberg, M., and Coauthors, 2011: The Global Space–Based
Inter-Calibration System. Bull. Amer. Meteor. Soc., 92, 467–
475, doi:10.1175/2010BAMS2967.1.
Gube, M., 1982: Radiation budget parameters at the top of the
earth’s atmosphere derived from METEOSAT data. J. Appl.
Meteor., 21, 1907–1921, doi:10.1175/1520-0450(1982)021,1907:
RBPATT.2.0.CO;2.
Harries, J. E., and Coauthors, 2005: The Geostationary Earth
Radiation Budget project. Bull. Amer. Meteor. Soc., 86, 945–
960, doi:10.1175/BAMS-86-7-945.
Hewison, T. J., X. Wu, F. Yu, Y. Tahara, X. Hu, D. Kim,
and M. Koenig, 2013: GSICS inter-calibration of infrared
channels of geostationary imagers using Metop/IASA. IEEE
Trans. Geosci. Remote Sens., 51, 1160–1170, doi:10.1109/
TGRS.2013.2238544.
Lazzara, M. A., and Coauthors, 1999: The Man computer In-
teractive Data Access System: 25 years of interactive pro-
cessing. Bull. Amer. Meteor. Soc., 80, 271–284, doi:10.1175/
1520-0477(1999)080,0271:TMCIDA.2.0.CO;2.
Lee, H.-T., A. Heidinger, A. Gruber, and R. G. Ellingson, 2004:
The HIRS outgoing longwave radiation product from hybrid
polar and geosynchronous satellite observations. Adv. Space
Res., 33, 1120–1124, doi:10.1016/S0273-1177(03)00750-6.
——, I. Laszlo, andA. Gruber, 2008: Development of theGOES-R
ABI outgoing longwave radiation product. Fifth GOESUsers’
Conf., NewOrleans, LA,Amer.Meteor. Soc., P1.8. [Available
online at https://ams.confex.com/ams/88Annual/webprogram/
Paper135756.html.]
Li, Y., A. Wu, and X. Xiong, 2013: Evaluating calibration of
MODIS thermal emissive bands using infrared atmospheric
sounding interferometer measurements. Ocean Sensing and
Monitoring V, W. W. Hou and R. A. Arnone, Eds., In-
ternational Society for Optical Engineering (SPIE Pro-
ceedings, Vol. 8724), 87240X, doi:10.1117/12.2016621.
Loeb, N. G., N. Manalo-Smith, S. Kato, W. F. Miller, S. K. Gupta,
P. Minnis, and B. A. Wielicki, 2003: Angular distribution
models for top-of-atmosphere radiative flux estimation from
the Clouds and the Earth’s Radiant Energy System instrument
on the Tropical Rainfall Measuring Mission satellite. Part I:
Methodology. J. Appl. Meteor., 42, 240–265, doi:10.1175/
1520-0450(2003)042,0240:ADMFTO.2.0.CO;2.
520 JOURNAL OF ATMOSPHER IC AND OCEAN IC TECHNOLOGY VOLUME 33
Unauthenticated | Downloaded 11/09/21 02:43 PM UTC
——, S. Kato, K. Loukachine, andN.Manalo-Smith, 2005: Angular
distribution models for top-of-atmosphere radiative flux esti-
mation from the Clouds and the Earth’s Radiant Energy
System instrument on the Terra satellite. Part I: Methodology.
J. Atmos. Oceanic Technol., 22, 338–351, doi:10.1175/
JTECH1712.1.
——,——,W. Su, T.Wong, F.G. Rose, D. R.Doelling, J. R. Norris,
and X. Huang, 2012: Advances in understanding top-of-
atmosphere radiation variability from satellite observations.
Surv. Geophys., 33, 359–385, doi:10.1007/s10712-012-9175-1.
Minnis, P., D. F. Young, andE. F.Harrison, 1991: Examination of a
relationship between outgoing infrared window and total
longwave fluxes using satellite data. J. Climate, 4, 1114–1133,
doi:10.1175/1520-0442(1991)004,1114:EOTRBO.2.0.CO;2.
——,W. L. Smith Jr., D. P.Garber, J. K.Ayers, andD.R.Doelling,
1994: Cloud properties derived from GOES-7 for spring 1994
ARM intensive observing period using version 1.0.0 of ARM
Satellite Data Analysis Program. NASA Reference Publ.
NASA RP-1366, 59 pp.
——, D. R. Doelling, L. Nguyen, W. F. Miller, and V. Chakrapani,
2008: Assessment of the visible channel calibrations of VIRS
on TRMMandMODIS onAqua andTerra. J. Atmos. Oceanic
Technol., 25, 385–400, doi:10.1175/2007JTECHA1021.1.
——, and Coauthors, 2011: CERES Edition-2 cloud property re-
trievals using TRMM VIRS and Terra and Aqua MODIS
data—Part I: Algorithms. IEEE Trans. Geosci. Remote Sens.,
49, 4374–4400, doi:10.1109/TGRS.2011.2144601.
Rienecker, M. M., and Coauthors, 2011: MERRA: NASA’s
Modern-Era Retrospective Analysis for Research and Applica-
tions. J. Climate, 24, 3624–3648, doi:10.1175/JCLI-D-11-00015.1.
Rutan, D. A., S. Kato, D. R. Doelling, F. G. Rose, L. T. Nguyen,
T. E. Caldwell, and N. G. Loeb, 2015: CERES synoptic
product: Methodology and validation of surface radiant flux.
J. Atmos. Oceanic Technol., 32, 1121–1143, doi:10.1175/
JTECH-D-14-00165.1.
Schmetz, J., and Q. Liu, 1988: Outgoing longwave radiation and
its diurnal variation at regional scales derived from
Meteosat. J. Geophys. Res., 93, 11 192–11 204, doi:10.1029/
JD093iD09p11192.
Schmit, T. J., M. M. Gunshor, W. P. Menzel, J. J. Gurka, J. Li,
and A. S. Bachmeier, 2005: Introducing the next-generation
Advanced Baseline Imager onGOES-R.Bull. Amer. Meteor.
Soc., 86, 1079–1096, doi:10.1175/BAMS-86-8-1079.
Singh, R., P. K. Thapliyal, C. M. Kishtawal, P. K. Pal, and P. C.
Joshi, 2007: A new technique for estimating outgoing long-
wave radiation using infrared window and water vapor radi-
ances from Kalpana very high resolution radiometer.
Geophys. Res. Lett., 34, L23815, doi:10.1029/2007GL031715.
Sohn, B. J., H.-S. Park, H.-J. Han, andM.-H.Ahn, 2008: Evaluating
the calibration of MTSAT-1R infrared channels using collo-
cated Terra MODIS measurements. Int. J. Remote Sens., 29,
3033–3042, doi:10.1080/01431160701408394.
——, B.-R. Kim, and S.-S. Lee, 2010: Possible shift of spectral re-
sponse function of the MODIS 6.8mm water vapor channel
causing a cold bias of 2–3K.Atmos.Meas. Tech., 3, 1667–1672,
doi:10.5194/amt-3-1667-2010.
Sun, J., S. Madhavan, B. N. Wenny, and X. Xiong, 2011: Terra
MODIS band 27 electronic crosstalk: Cause, impact and mit-
igation. Sensors, Systems, and Next-Generation Satellites XV,
R. Meynart, S. P. Neeck, and H. Shimoda, Eds., International
Society for Optical Engineering (SPIE Proceeings, Vol. 8176),
81760Z, doi:10.1117/12.897754.
Taylor, P. C., andN.G. Loeb, 2013: Impact of sun-synchronous diurnal
sampling on tropical TOA flux interannual variability and trends.
J. Climate, 26, 2184–2191, doi:10.1175/JCLI-D-12-00416.1.
Viollier, M., R. Kandel, and P. Raberanto, 2004: Combination of
ScaRaB-2 and CERES withMeteosat-5 to remove time sampling
bias and improve radiation budget estimations in the INDOEX
region. J. Geophys. Res., 109, D05105, doi:10.1029/2003JD003947.
Wielicki, B. A., B. R. Barkstrom, E. F. Harrison, R. B. Lee III,
G. L. Smith, and J. E. Cooper, 1996: Clouds and the Earth’s
Radiant Energy System (CERES): An Earth Observing Sys-
tem experiment. Bull. Amer. Meteor. Soc., 77, 853–868,
doi:10.1175/1520-0477(1996)077,0853:CATERE.2.0.CO;2.
——, and Coauthors, 2013: Achieving climate change absolute
accuracy in orbit. Bull. Amer. Meteor. Soc., 94, 1519–1539,
doi:10.1175/BAMS-D-12-00149.1.
Young, D. F., P. Minnis, D. R. Doelling, G. G. Gibson, and
T. Wong, 1998: Temporal interpolation methods for the
Clouds and the Earth’s Radiant Energy System (CERES)
experiment. J. Appl. Meteor., 37, 572–590, doi:10.1175/
1520-0450(1998)037,0572:TIMFTC.2.0.CO;2.
MARCH 2016 DOELL ING ET AL . 521
Unauthenticated | Downloaded 11/09/21 02:43 PM UTC