pH Alkalinity Hardness pH Alkalinity Hardness Effective Disinfection ...
Upload
sabrie-solomanCategory
view
58download
2
Ivy Lee
@IvyLeeSensorX
Marketing Director
@AmericanSensorX August, 2016
One of Advanced Sensor Tech : SpectRx™ FFT-NIR
Lightning Speed & Hardness Test Game Changer
1

2 2 2 2 2 2
Advanced Sensor Tech Partnering In Fashion SensorX
• Water Food Health Climate Safety Modernization Cloud
• Quality Life System Industry & Stock IoT • Smart Dust, NASA Style City IoT
• Quantum Color/ Hardness/ Chem/ Bio
• Positioning & ID Chip (Standard
• Pose, V2V,
• Industry Robot)
•
• SiteSocial
M2C (Operator Open Platform)
C2M M&A
Corp Rating Stock IoT
Me-Too
Nano Sensor
Natural Infrastructure Longevity System OS
Nano-MEMS
MEMS Sensor Neural Network
Robot
3D Printer
FFT
2
SensorX

3 3 InspectRx® : um Particle SpectRx™: Chemical Composition, 0.01% Concentration, 1 PPM Weight, 0.1% Sensitivity Nano Positioning & ID-Chip Sensor: Deploy Micro Dot to Secure Asset, Life, Serve Business
SensorX
Advanced Nano Sensor Program in High Dynamic Device IoT @SensorXClimate, Your 12.5 Milliseconds AQI
Wearable InspectRx® -SpectRx™-Nano Positioning & ID Chip Sensor--Environment

4 4
Human Blood Composition and Gene Changed by Air/ Water/ Goods with Toxic Chemical/ Heavy Mental ( You Don’t Know, Haven’t Adopted Our Right Tech Machine & Device to Find Everywhere Yet )
SensorX
Chemicals in Plastic Home Products Linked to Health Issues JULY 9, 2015, 8:13 AM http://www.cbsnews.com/videos/chemicals-in-plastic-home-products-linked-to-health-issues/

5 5 5 5 5
Fat Thickness ≤ 150mm or Requested
Structured Diffused Light Energy (SpectRx™ Emission Spectroscopy Fluoresce)
InspectRx® Upper Camera
Lower Camera
SensorX
Inspect-Analyze Animal Parasite, Infected Cysts, Metallic Foreign Objects & Drug Residue
Advanced Nano Sensor Program in Health IoT SpectRx™ Fluoresce Direct & Indirect Sensing Molecular ( Virus, Tumor, Fluid, Odor, PH) - InspectRx® Remote Sensing (Skin Color Number) - MedBed - 3D PrinterX Precision Medicine. Track Life Intervention, Quantify Quality Yield, Analyze & Evaluate Diagnostic System, Communicate Data, Positively Impact on Human MTBF>150 Years

6 6
SpectRx™ FFT-NIR + InspectRx® Special Light Analyze • Fat/Protein/Moisture Contents • Infected Cysts, Parasites & Drug Residue
InspectRx® • UX Phys: Color Number • UX Bio: Bacteria, Virus • 3D Size Calculate • Area • Thickness • Volume • Fat/ Protein Percentage • Weight • Accumulation • Price Per Weight
SensorX
Inspect-Analyze Animal Skin/ Protein Color, Fat/ Protein Percentage, Fat/ Protein/ Moisture Contents
Advanced Nano Sensor Program in Health IoT SpectRx™ Fluoresce Direct & Indirect Sensing Molecular (Virus, Tumor, Fluid, Odor, PH) - InspectRx® Remote Sensing (Skin Color Number) - MedBed - 3D PrinterX Precision Medicine. Track Life Intervention, Quantify Quality Yield, Analyze & Evaluate Diagnostic System, Communicate Data, Positively Impact on Human MTBF>150 Years

7
SpectRx™ FFT-NIR Tech
Frost & Sullivan Spectroscopy Inspection Tech Excellence
2006-

8
World Fastest Speed:
Type1: 180 Analyses/Second/Probe
Type2: 80 Analyses/Second/Probe
Precision(Concentration): 0.01%
Precision(Weight):
Type1: 25 PPM
Type2: 1 PPM
Sensitivity: 0.1%
Penetrate 5mm Depth
Spectra: Millions
Wave Length: 830-2500nm
Real Time Production
Close-Loop System
Total Integration with Production Machine
Incoming Inspection and Verifications
In-process Inspection
Maintains Consistent Quality
8
IR-Based Vision System
8 Solid – Powder – Liquids – Semi-Solid – Gas
SensorX

9
Probe
Object
Fiber Optic Cables Detector
Spectrometer
Multi-online Process Apps—Pharma, Food, Polymer
Product Streams under 2, 80 Probes
9
80 SpectRx™ Probes
SensorX

10
Redesigned for JNJ Stent
10 Analysis of Stents of Same Polymers with Different Active Concentrations
Stents of Different Polymers with Same Constant of Active Layer
Each Stent Includes Micro-composition of Drug Contents Deposited between Polymer Layers SpectRx ™-Stent Online Process
SensorX

11 11
Redesigned for FilleRx® Inspection & Packaging System -- NIR Light Source ( Compact Probe )
SensorX
Type1 Speed
5 Milliseconds/ Analyse/ Probe
Light Source Intensity Stronger beam divided by 10 mm Prism
Cover glass in sensor (detect UV
radiation) is made of UV permeable quartz glass
Competitive: NIR Light Source Signal Transmission Reflected Signal Detection Data Analysis Process

12 12 12 12
Lab App - Pharm, Food, Agri, Oil & Gas, Chemical
Samples on Turntable
Three Plug and Play Modules 1. Near Infrared Fiber Optic, Probe
2. InSb Detector • Analogue-to-digital Converter • Electromagnetic Interferometer
(100 + times data) • Digital Signal Processor 3. An Automated Indexer A PLC Sensors
Competitive: NIR Light Source Signal Transmission Reflected Signal Detection Data Analysis Process
SensorX

13 13
Quantum Hardness UX: electronegativity & hardness predict chemical behavior (ionization energy, electrophilic & toxicity), correlate with visible-UV spectra.
Hardness: governed dissolution from tablet to smallest particles after broken by ―disintegration‖ (energy) over all stages (time)
Sabrie Index (FDA Approved) Widely used among scientists &
physicists.
Non-destructive identification hardness & disintegration by the InspectRx® & SpectRx™ correlation with the energy absorbed or reflected
InspectRx® vision inspects in physical
properties.(U.S. Patent 5,679,954)
SpectRx™ FFT-NIR analyzes organic
and inorganic in compound
properties.(U.S. Patent 5,900,634)
13 • The only automated system can detect hardness & disintegration without destroying • Achieved by applying neural network analysis using Sabrie’s Index.
Tech Advantage 1. IR-Based Vision System Analyze Compound Property – Hardness by Sabrie Index (Sabrie Soloman Law of Solid Dosage Disintegration & Light Absorbed Energy)
SensorX

14 14
Solid - Tablets-Capsules-Polymer
Diffused Reflectance
Tablet Hardness & Friability
Tablet Disintegration
Chemical Composition
Active Ingredients
Impurities
Moisture Content
Homogeneity
Tablet Cracks
Capsule Deterioration
14
Tech Advantage 1. IR-Based Vision System Analyze Physical & Chemical Properties by Solid/ Liquid/ Gas Probe
Liquid - Gels – Ointments - Gas
• Transmission
• Chemical Composition
Active Ingredients
Impurities
Concentration
Homogeneity
• Air-Bubbles
• Oxygen
• Acidity
SensorX

15 15
Tech Advantage 2. Speed Time Dispersion and Time / Spatial Separation beyond Classical FFT(Fast Fourier Transform) Spectrometer
Classical advantages of FFT spectrometry over dispersive spectrometry:
• Multiplexing all wavelengths fall on the detector at all times
• Throughput the aperture vs resolution limitation is reduced
• Wavelength accuracy the internal laser ensures stability in ppm levels
SpectRx™ further superior:
It relies on time not spatial dispersion of the spectral information. This limits the number of moving components and provides a more reliable observation geometry. In practice, it is
• Higher spectral resolution.
• Larger bandwidth, more spectral channels
• Flexibility: because of the complete separation of spectral information (performed in the time domain) and spatial information (performed in the spatial domain),The spectral resolution can be instantly changed by computer. The field of view configuration can be changed in the field, simply by changing telescope modules.
15
SensorX
Competitive: NIR Light Source Signal Transmission Reflected Signal Detection Data Analysis Process

16 16
Tech Advantage 3. Radiometric Accuracy Influenced by
1. Calibration Source Errors
Relative radiometric errors at 5000 cm-1, 2860 cm-1, and 2000 cm-1 (2 m, 3.5 m, and 5 m) due to the uncertainty of the calibration source temperature, assuming a blackbody relative temperature accuracy of 0.2% and an absolute accuracy of 1°. The maximum error is 5% for the coldest source (TS=373K) at the highest frequency(=2860cm-1). This is a very pessimistic value.
.
2. Calibration Drift
InSb detectors exhibit much less variation of responsively with respect to temperature.
We typically use 2% as the relative radiometric accuracy due to drift, and assume that the corresponding time interval between characterisation and scene measurement is long enough to allow measurement.
SensorX

17 17
3.Spectrometer Intrinsic linearity
Detector Non-Linearity Error The saturation level is never reached because the feedback resistors used are high enough so that preamplifier saturation occurs before there is detector saturation. We therefore do not anticipate detector non-linearity problems in InSb detectors.
Channel Spectrum Error
A certain degree of wedging a parallel-face protective window would further reduce the channel spectrum but at the cost of introducing the phenomenon of ghost images. Spectral Aliasing Error
An optical filter provides both a sharp cut-off and very high attenuation outside the spectral range of interest. This method also reduces photon noise.
Tech Advantage 3. Radiometric Accuracy Influenced by
SensorX

18 18 18
Tech Advantage 4. Sensitivity: 0.1% Signal / Peak Noise Amplitude = 3 (SNR 300%, as Signal Quality 25-30% is Usable in Practice)
18
Really Simple Syndication
Scene Radiation
Detector Irradiance
Detector Current
Photon Noise Johnson Noise
Jitter Noise
ADC Noise
Dark Noise
Noise Equivalent Spectral Radiance
Signal to Noise Ratio
SensorX

19 19 19
Input – Use Spectra as Input Layer - Data
Output
Input
Hidden Layers
Input Layers
Output Layers
Output – Such As Active Ingredients by Weight
Tech Advantage 5. SensorX Sophisticated Neural Network Analysis
SensorX
20
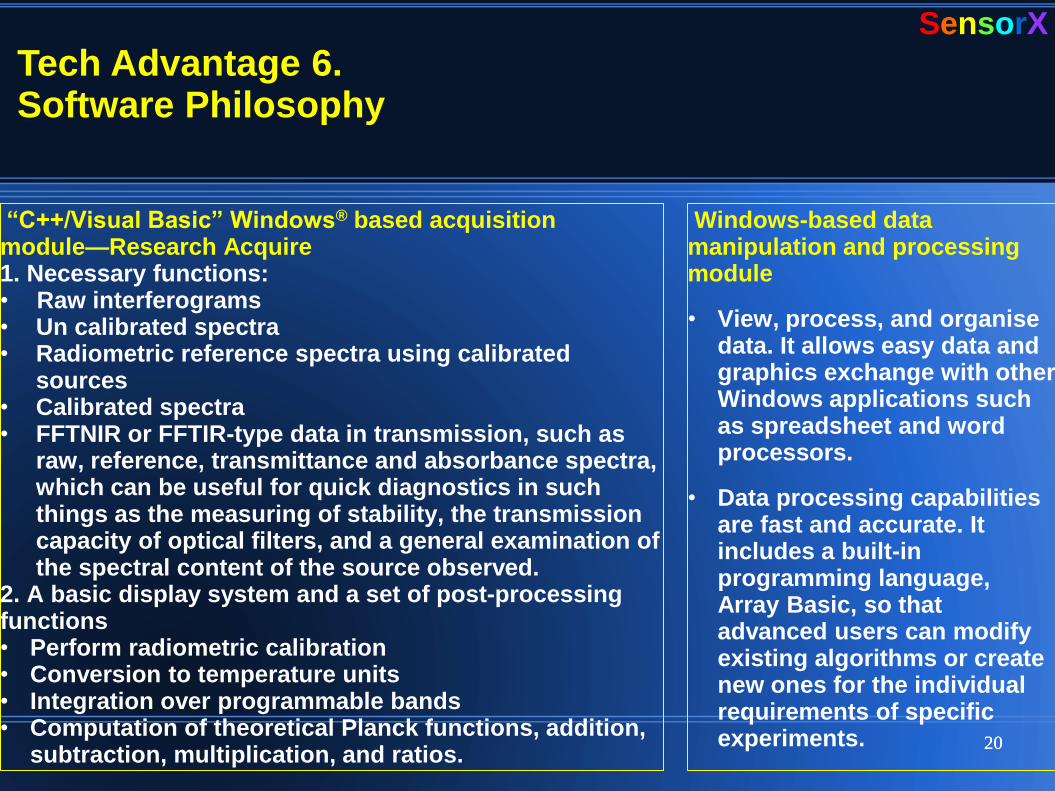
Windows-based data manipulation and processing module
• View, process, and organise data. It allows easy data and graphics exchange with other Windows applications such as spreadsheet and word processors.
• Data processing capabilities are fast and accurate. It includes a built-in programming language, Array Basic, so that advanced users can modify existing algorithms or create new ones for the individual requirements of specific experiments.
―C++/Visual Basic‖ Windows® based acquisition module—Research Acquire 1. Necessary functions: • Raw interferograms • Un calibrated spectra • Radiometric reference spectra using calibrated
sources • Calibrated spectra • FFTNIR or FFTIR-type data in transmission, such as
raw, reference, transmittance and absorbance spectra, which can be useful for quick diagnostics in such things as the measuring of stability, the transmission capacity of optical filters, and a general examination of the spectral content of the source observed.
2. A basic display system and a set of post-processing functions • Perform radiometric calibration • Conversion to temperature units • Integration over programmable bands • Computation of theoretical Planck functions, addition,
subtraction, multiplication, and ratios.
20
Tech Advantage 6. Software Philosophy
SensorX

21
Tech Advantage 7. Data Flow Outlines Data: Notions of Size, Type, Transfer Rate
SpectRx™ Functions: Scan Speed, Spectral Resolution, Spectral Range
Temporal & Spectral Data Types: 1. Involved in FT Spectroradiometer ; 2. Are Linked by Fourier Transform
• The scan length is a function of resolution.
• All wavelengths are acquired simultaneously whatever the scan length is.
• SpectRx™ systems acquire double-sided interferograms.
• The sampling rate is a function of the scanning speed and of the number of samples per fringe or oversampling factor.
• The maximum observable spectral range is determined by the oversampling factor. In the SpectRx™ the oversampling factor can be 1 (no oversampling) or 2, this provides for spectral ranges of 0 to 7899 cm-1 and 15798cm-1 respectively.
• Each data point is stored as a 16-bit number. Coherent addition or signal averaging is done with 32 bit numbers.
• The maximum number of interferograms, which can be recorded in kinetic mode, depends on the size of the DRAM buffer. This is 4 MB (expandable to 64 MB) in the case of the SpectRx™ 100, and 64 MB in the SpectRx™ 200.
• The required scanning speed is dictated by how fast an event is to be resolved; it is limited by the ADC speed, the detector response time, and the throughput of the electronics, including the communication links. It is 1 cm/s in the SpectRx™ 100 and 25 cm/s in the SpectRx™ 200.
21
SensorX

22 22
Tech Advantage 8. One of World Largest Spectral Database (Millions)
Comparing to stored ―gold standard sample‖ It can enter the verification and validation to maintain quality and consistency.
In case of unknown composition
A 95% chance of unknown composition can be found through millions of spectral diagram ( local database), unless the composition of signal to noise ratio is too small.
SensorX

Tech Advantage 9. SpectRx ™ FFT – NIR Spectroscopic Methods
23
Emission Spectroscopy Fluorescence
Light Source Measurement
Reflection Absorbancy
Infrared Spectroscopy
UV spectroscopy
Laser Spectroscopy
Transmission
Every sample has its own specific spectral ―fingerprint.‖ Unlike other analytical procedures, the samples do not need time-consuming preparation.
SensorX

Emission Spectroscopy Fluorescence In Biology, Materials, Production Oversight (Refer to Biosensor Dev.)
Measure an excitation spectrum,
• The fluorescent sample is illuminated with different wavelengths one after another.
• The intensity of the fluorescent radiation is measured at a fixed wavelength.
• The intensity measured at this wavelength is applied at the excitation wavelength.
Measure an emission spectrum,
• with a fixed wavelength.
• The sample emits fluorescent radiation over a wide range of wavelengths.
• The intensity emitted is applied at
the particular emission wavelength.
24 Light source measurement is commonly used in emission spectroscopy area.
UV Spectroscopy is primarily executed as absorption and fluorescence spectroscopy.
SensorX

Light Source Measurement In Physiological Criteria Evaluation
Calibration source errors, the first type of three errors influence radiometric accuracy(P8), are deviations in the production of a perfect calibration source. These errors include the accuracy of blackbody temperature and the accuracy of its emissivity over the operational spectral range.
25 Light source measurement is commonly used in emission spectroscopy area.
SensorX

26
Laser Spectroscopy As Light Source
The laser is used
• A light source for excitation
• Illuminating the sample for absorption measurement.
• If the sample is excited by the laser, the sample itself begins to emit radiation. The spectrometer records the radiation at a right angle to the direction of the radiation excitations.
• If the sample absorbs the laser beam, the sample is placed between the laser and the spectrometer.
26 Light source measurement is commonly used in emission spectroscopy area.
SensorX

Absorbance For Materials In Water and Gas
Measure monochromatic radiation For materials in water solution or gas, optical density is directly proportional to the concentration of the material.
Measure cloudy samples
• A sensible choice of reference measurements must be made.
• Both absorption and reflection measurement values change as a result of the dispersion of the radiation. In order to get real spectra, the reference measurements in the observed wavelength range must be transparent but display a comparable dispersion.
27 UV Spectroscopy is primarily executed as absorption and fluorescence spectroscopy.
SensorX

Reflection
The sample reflects the radiation diffusely; the directly reflected radiation is coupled out through the gloss trap. Only the diffuse reflection is coupled into the optical fiber.
The reference measurement is measured against a comparable strongly diffuse reflecting white reference standard (Spectralon).
The spectrometer is reset to reflection measurement. The reflectance from the wavelength can be read off on the spectrometer
28
SensorX

Transmission
1.The spectrometer is set to absorption. • First, the radiation intensity and
special diffusion of the light source are measured. This reading is the reference measurement.
• The sample is then fixed into the holder.
2.Set to transmission • A spectrum is then taken.
• • Depending on the setting, the
transmission can be displayed as a percentage or transmittance from the wavelength.
29
SensorX

Infrared Spectroscopy in Organic Materials UV Spectroscopy in Drinking Water, Chlorophyll & Photosynthesis
They are separate fields, places special demands on the spectrometer.
IR spectroscopy has become extremely important because the molecular vibrations have an effect on the spectrum in infrared. Nearly all organic materials exhibit specific absorptions in the near infrared.
30 UV Spectroscopy is primarily executed as absorption and fluorescence spectroscopy.
SensorX

31
SpectRx™ Software Programming Guide
Run Manual Mode 1. Set sample standard
• In case of known conditions as P12-
P13, for instance, ① Hardness, disintegration, sabrie index ② Weight : chemical compositions, active
ingredients ③ Content : air humidity, sample moisture
• In case of unknown composition, 95%
can be found in local database. 2. Set upper & lower control limits on production screen 3.Set spectroscopic methods.
Run Auto Mode
1. Accept – Reject - Quarantined An acceptable product must fall between upper & lower control limits
2. Data Storage, implementation, validation
Training and Development
31
SensorX

32 32 32 32 32 Auto Mode / Manual Mode Chemical Composition Spectrum Deviation
Set as (Golden) Standard
SensorX

33 33 33 Active Ingredients Weight & Spectrum Deviation Air Humidity, Product Moisture Content
Set as (Golden) Standard
SensorX

34 Sabrie Index, Hardness, Disintegration & Spectrum Deviation
34
Set as (Golden) Standard
SensorX

35 35 35 Production Screen Describing UCL & LCL
An Acceptable Product Must Fall Between Upper & Lower Control Limits
SensorX
36 36
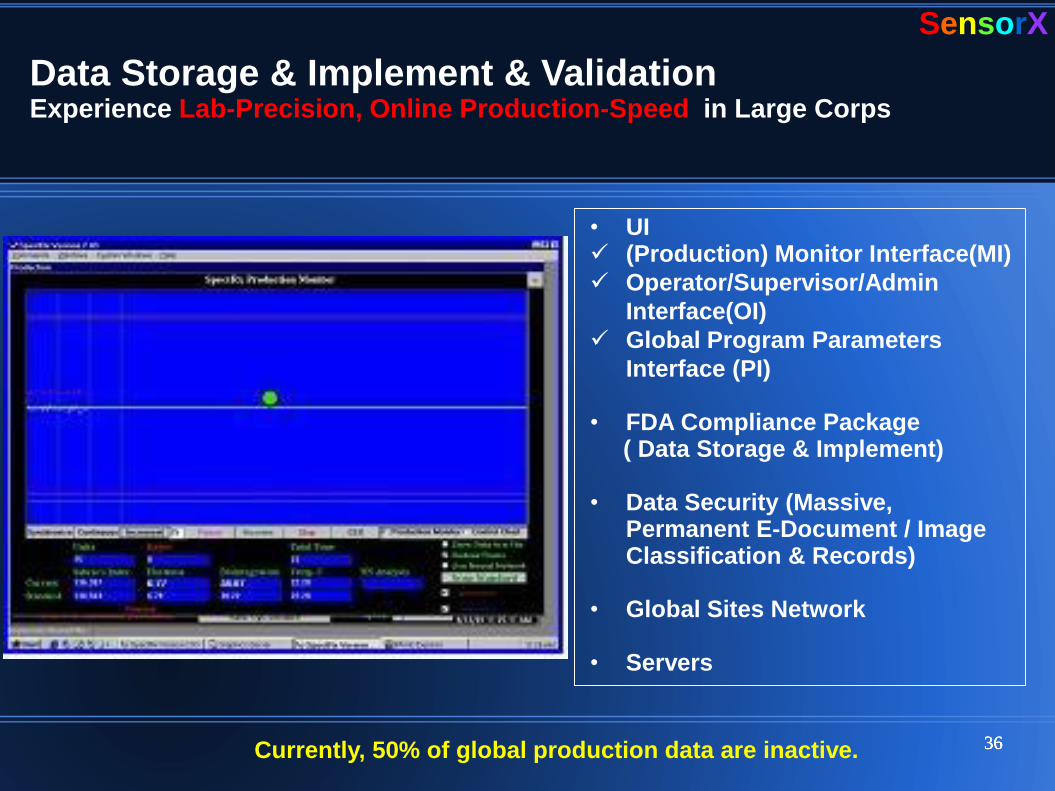
Data Storage & Implement & Validation Experience Lab-Precision, Online Production-Speed in Large Corps
• UI (Production) Monitor Interface(MI)
Operator/Supervisor/Admin
Interface(OI)
Global Program Parameters
Interface (PI)
• FDA Compliance Package ( Data Storage & Implement) • Data Security (Massive,
Permanent E-Document / Image Classification & Records)
• Global Sites Network
• Servers
36 Currently, 50% of global production data are inactive.
SensorX

37 37
American SensoRx, Inc. USA The SpectRx™ FFT-NIR Technology
Advanced Sensor Technology
Ms. Ivy Lee
Online Marketing & Finance Director
31 North Monroe Street
Ridgewood, New Jersey, 07450 USA in: [email protected] WeChat / t: @IvyLeeSensorX Tel: 001 201 447 8999 Fax: 001 201 447 8998 Linkedln Company Page https://plus.google.com/+IvyLee/about ( Links- Contributor to ) www.facebook.com/SmartSensorX http://www.slideshare.net ( Search “SensorX” , 2 pages ) www.AmericanSensorX.com