Adrian Stone IEW 20 th June 2012. Research Question Commissioned by IRENA “Assess the energy...
28
Profiling the Vehicle Parc in a Complex Region where Data is Sparse – The Case of Nigeria Adrian Stone IEW 20 th June 2012
-
Upload
melvin-brumby -
Category
Documents
-
view
213 -
download
0
Transcript of Adrian Stone IEW 20 th June 2012. Research Question Commissioned by IRENA “Assess the energy...
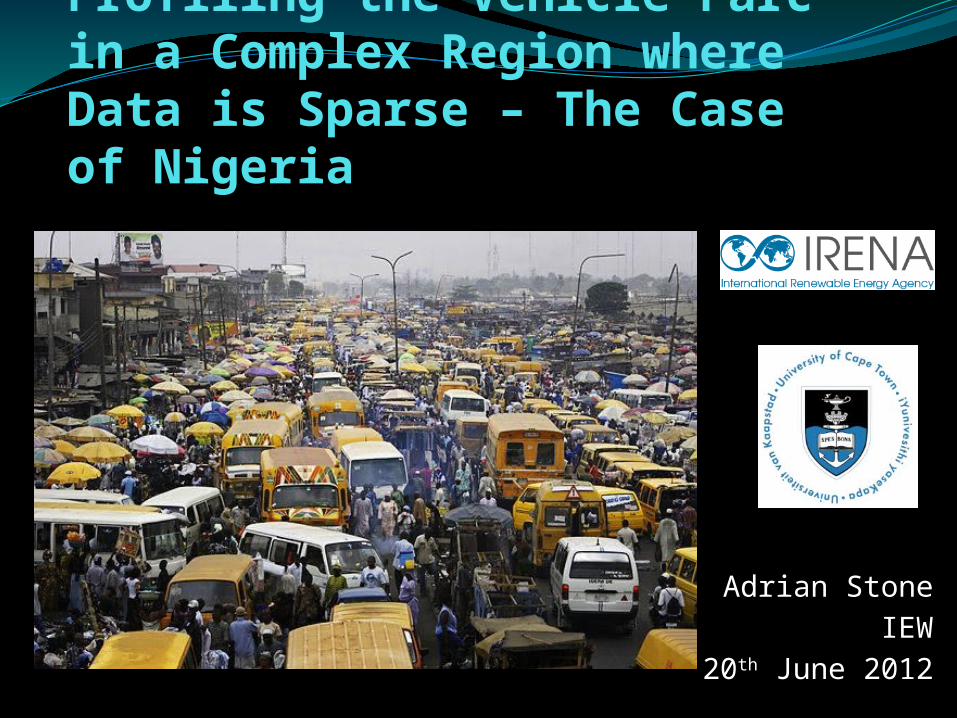
Profiling the Vehicle Parc in a Complex Region where Data is Sparse – The Case of Nigeria
Adrian StoneIEW
20th June 2012
Nigerian Vehicle Parc 2
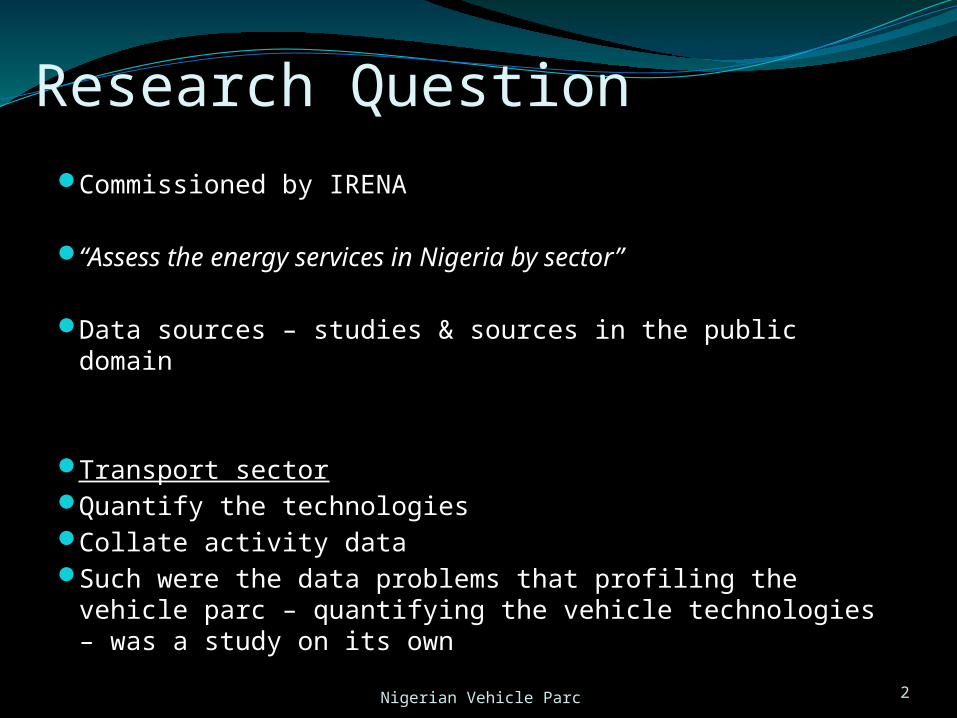
Research QuestionCommissioned by IRENA
“Assess the energy services in Nigeria by sector”
Data sources – studies & sources in the public domain
Transport sectorQuantify the technologiesCollate activity dataSuch were the data problems that profiling the vehicle parc –
quantifying the vehicle technologies – was a study on its own
Nigerian Vehicle Parc 3
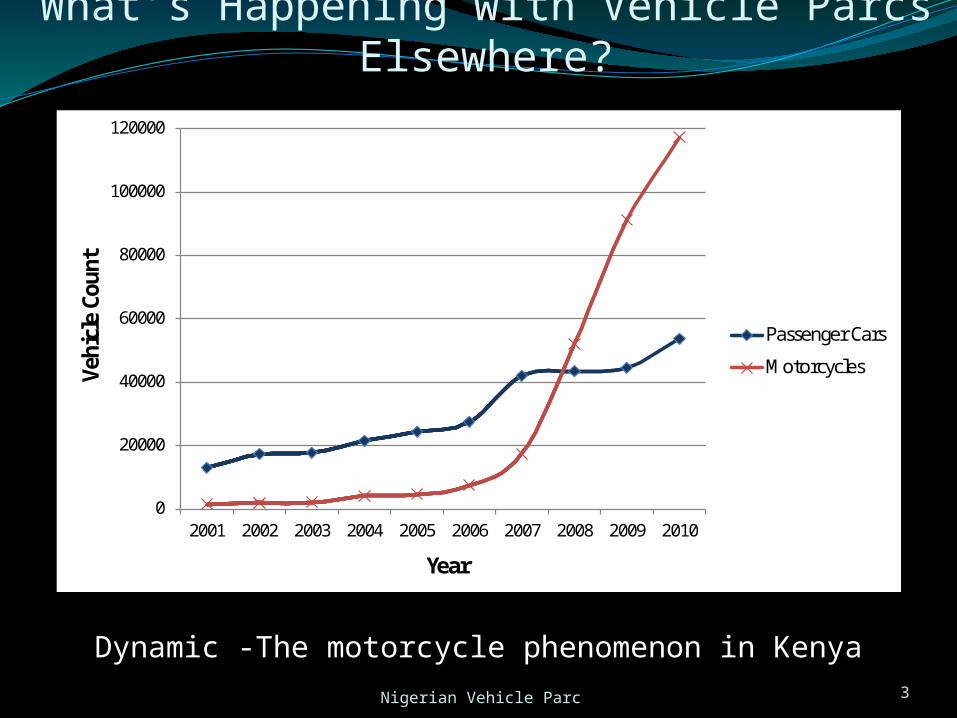
What’s Happening with Vehicle Parcs Elsewhere?
Dynamic -The motorcycle phenomenon in Kenya
0
20000
40000
60000
80000
100000
120000
2001 2002 2003 2004 2005 2006 2007 2008 2009 2010
Vehi
cle
Coun
t
Year
Passenger Cars
Motorcycles
Nigerian Vehicle Parc 4
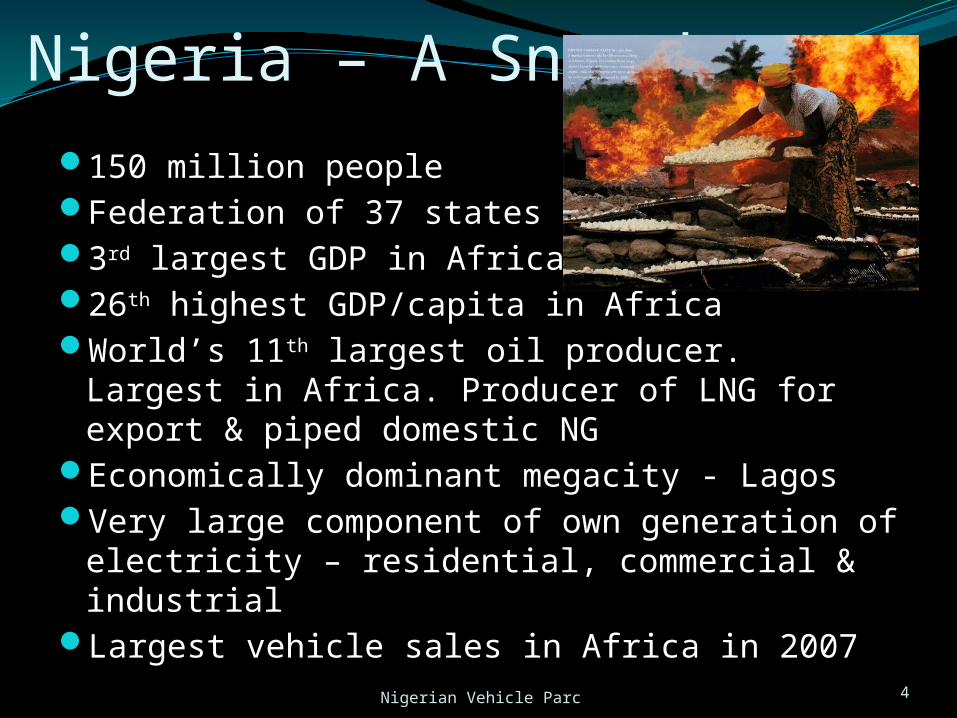
Nigeria – A Snapshot150 million peopleFederation of 37 states3rd largest GDP in Africa26th highest GDP/capita in AfricaWorld’s 11th largest oil producer. Largest in Africa.
Producer of LNG for export & piped domestic NG Economically dominant megacity - LagosVery large component of own generation of electricity –
residential, commercial & industrialLargest vehicle sales in Africa in 2007
Nigerian Vehicle Parc 5
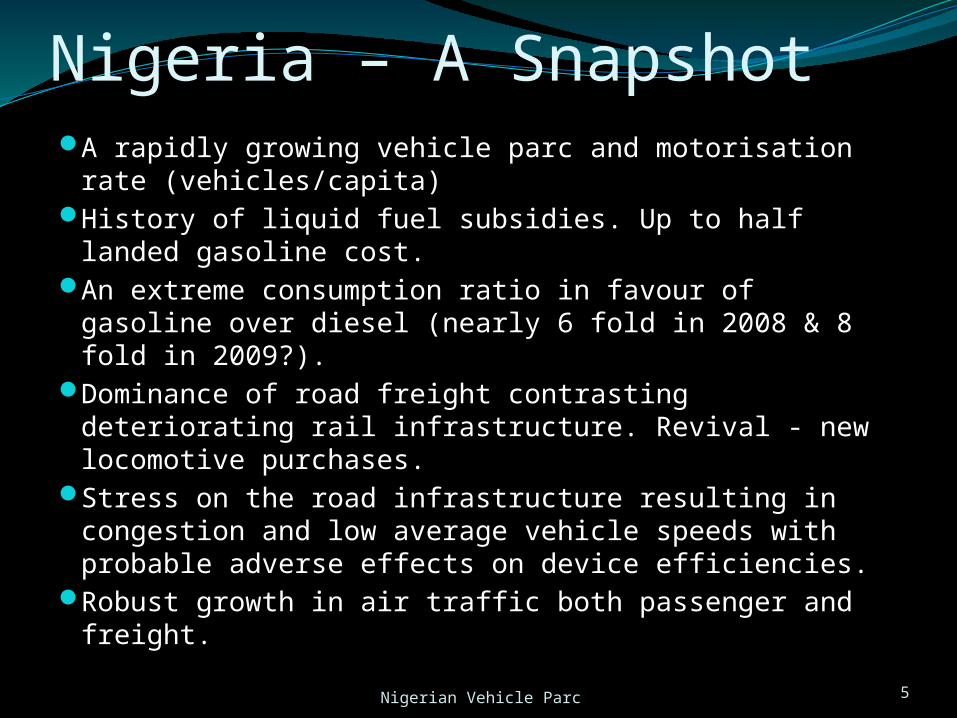
Nigeria – A SnapshotA rapidly growing vehicle parc and motorisation rate
(vehicles/capita)History of liquid fuel subsidies. Up to half landed gasoline
cost.An extreme consumption ratio in favour of gasoline over
diesel (nearly 6 fold in 2008 & 8 fold in 2009?).Dominance of road freight contrasting deteriorating rail
infrastructure. Revival - new locomotive purchases. Stress on the road infrastructure resulting in congestion
and low average vehicle speeds with probable adverse effects on device efficiencies.
Robust growth in air traffic both passenger and freight.
Nigerian Vehicle Parc 6
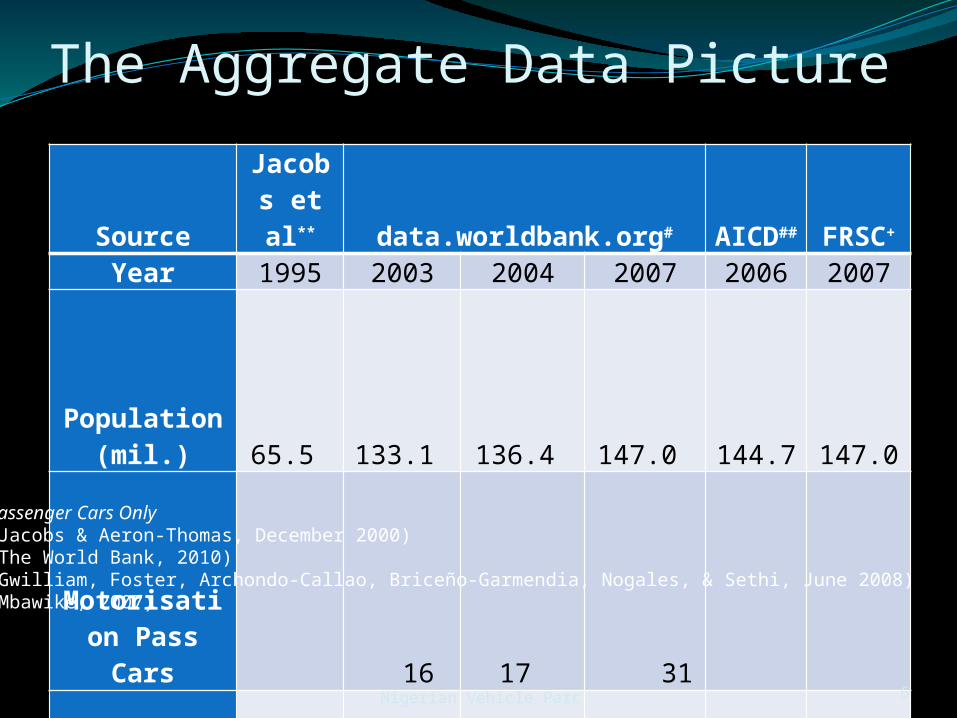
The Aggregate Data Picture
Source
Jacobs et al** data.worldbank.org#
AICD##
FRSC+
Year 1995 2003 2004 2007 2006 2007
Population (mil.)
65.5
133.1
136.4
147.0
144.7
147.0
Motorisation Pass
Cars
16
17
31
Motorisation All
Vehicles
21
31
24 >48
Vehicle Parc Count
(mil.)
1.4
2.1*
2.3*
4.6
3.5
>7.0
* Passenger Cars Only** (Jacobs & Aeron-Thomas, December 2000)# (The World Bank, 2010)## (Gwilliam, Foster, Archondo-Callao, Briceño-Garmendia, Nogales, & Sethi, June 2008)+ (Mbawike, 2007)
Nigerian Vehicle Parc 7
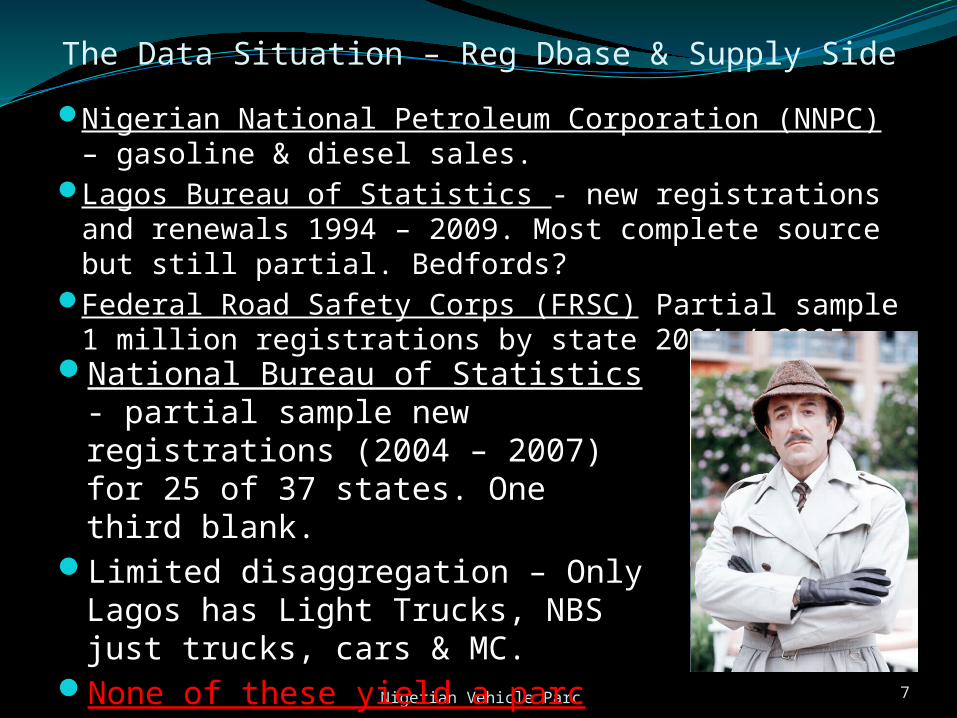
The Data Situation – Reg Dbase & Supply Side
Nigerian National Petroleum Corporation (NNPC) – gasoline & diesel sales.
Lagos Bureau of Statistics - new registrations and renewals 1994 – 2009. Most complete source but still partial. Bedfords?
Federal Road Safety Corps (FRSC) Partial sample 1 million registrations by state 2004 / 2005.
National Bureau of Statistics - partial sample new registrations (2004 – 2007) for 25 of 37 states. One third blank.
Limited disaggregation – Only Lagos has Light Trucks, NBS just trucks, cars & MC.
None of these yield a parc size
Nigerian Vehicle Parc 8
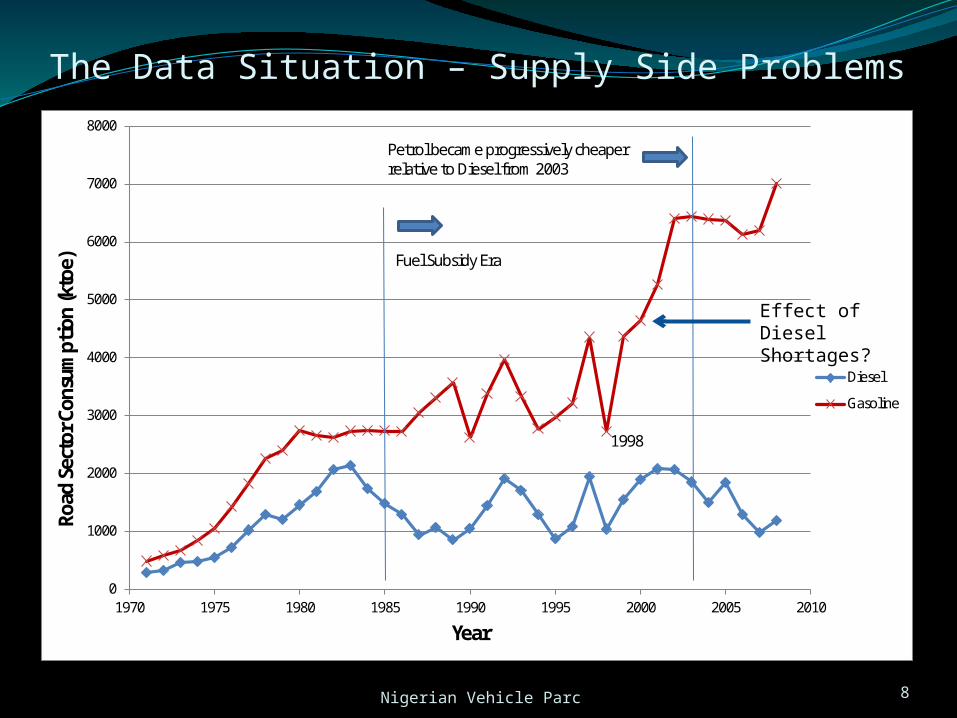
The Data Situation – Supply Side Problems
0
1000
2000
3000
4000
5000
6000
7000
8000
1970 1975 1980 1985 1990 1995 2000 2005 2010
Road
Sec
tor C
onsu
mpti
on (k
toe)
Year
Diesel
Gasoline
1998
Petrol became progressively cheaper relative to Diesel from 2003
Fuel Subsidy Era
Effect of Diesel Shortages?
9
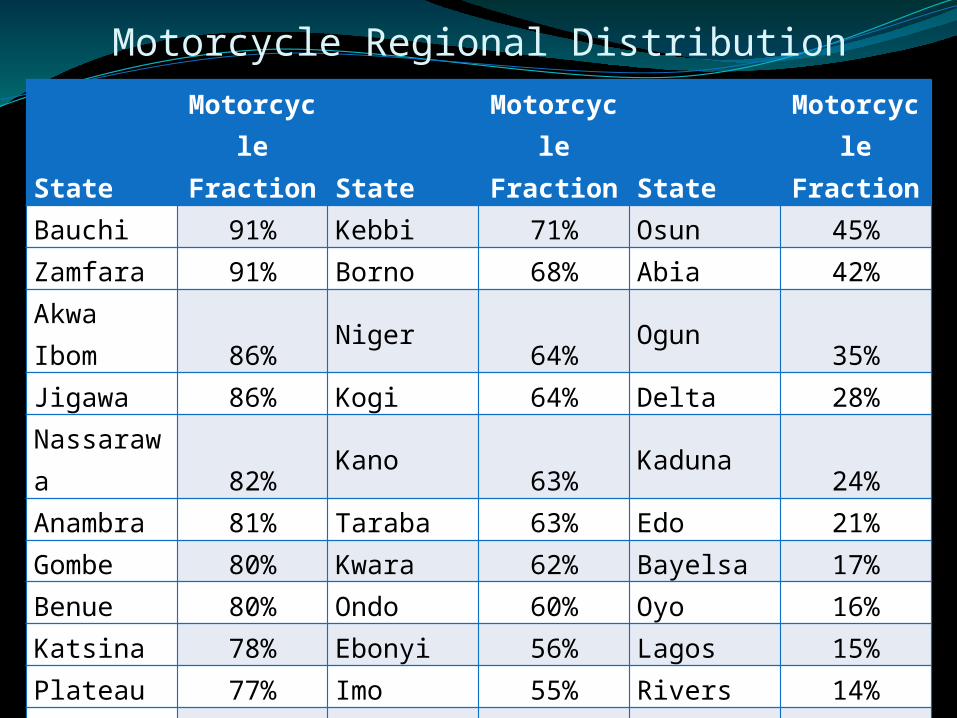
Motorcycle Regional Distribution
FRSC data shows motorcycle fraction of the parc to be highly skewed by state
Nigerian Vehicle Parc
StateMotorcycle
Fraction StateMotorcycle
Fraction StateMotorcycle
FractionBauchi 91% Kebbi 71% Osun 45%Zamfara 91% Borno 68% Abia 42%Akwa Ibom 86% Niger 64% Ogun 35%Jigawa 86% Kogi 64% Delta 28%Nassarawa 82% Kano 63% Kaduna 24%Anambra 81% Taraba 63% Edo 21%Gombe 80% Kwara 62% Bayelsa 17%Benue 80% Ondo 60% Oyo 16%Katsina 78% Ebonyi 56% Lagos 15%Plateau 77% Imo 55% Rivers 14%Cross River 76% Ekiti 53% FCT, Abuja 14%Yobe 74% Enugu 53% Sokoto 74% Adamawa 52%
10
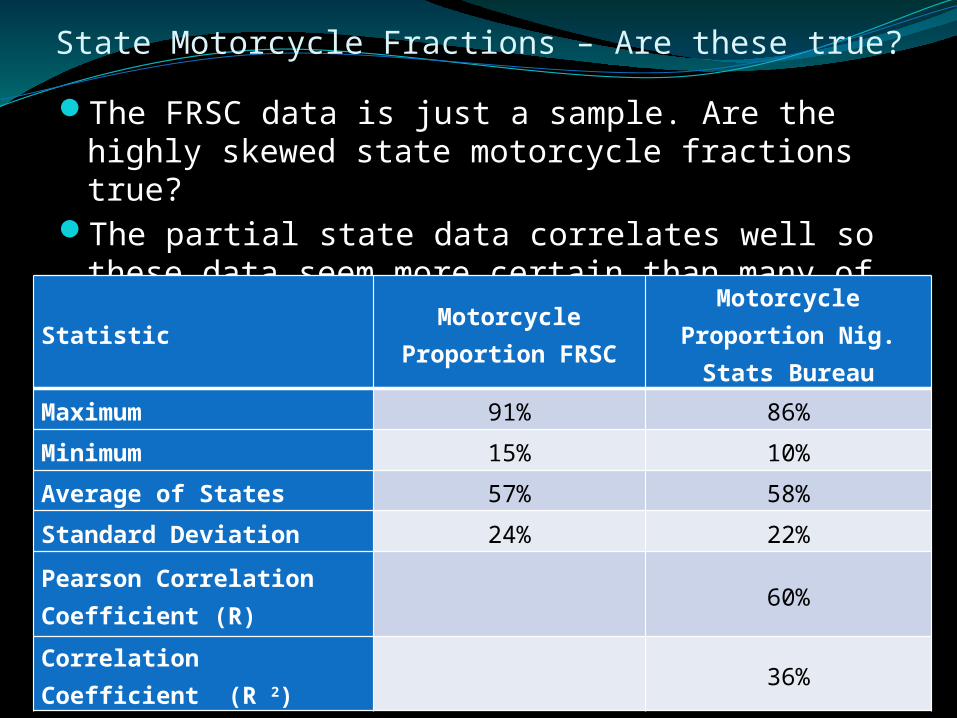
State Motorcycle Fractions – Are these true?
The FRSC data is just a sample. Are the highly skewed state motorcycle fractions true?
The partial state data correlates well so these data seem more certain than many of our other clues
Nigerian Vehicle Parc
StatisticMotorcycle
Proportion FRSC
Motorcycle Proportion Nig.
Stats Bureau
Maximum 91% 86%
Minimum 15% 10%
Average of States 57% 58%
Standard Deviation 24% 22%
Pearson Correlation Coefficient (R)
60%
Correlation Coefficient (R 2)
36%

11
Data – Vehicle Category Breakdown
Nigerian Vehicle Parc
Lagos Nigeria Other Countries
Vehicle Type
LBS (1994
- 2009)*
FRSC (2004
/ 2005)
**
NBS (2004 - 2007)#
FRSC (1996)
+
FRSC (2004/ 2005)*
*
South Africa
(2008)#
#
EU (2008)+
+
Dehli, India
(2007)π
Pass. Car 70.82%
42.5% 63.25% 71% 31.1%
LCV/Other
2.12% 22.74% 11.6% 2.9%
All Trucks
3.45% 2.4% 4.10% 3.81% 10.8%
Rigid Trucks
3.19%
3.70%
9.8%
Tanker 0.02%
2.2%
Tractor 0.03%
0.41%
1.0%
Tipper 0.20%
All Buses 8.55% 8.6% 3.87% 0.40% 0.9%Minibus
8.28% 3.36%
Large Bus
0.27%
0.51% 0.40%
Motorcycle
14.98%
17% 44.4% 53% 3.89% 6% 65.1%
12
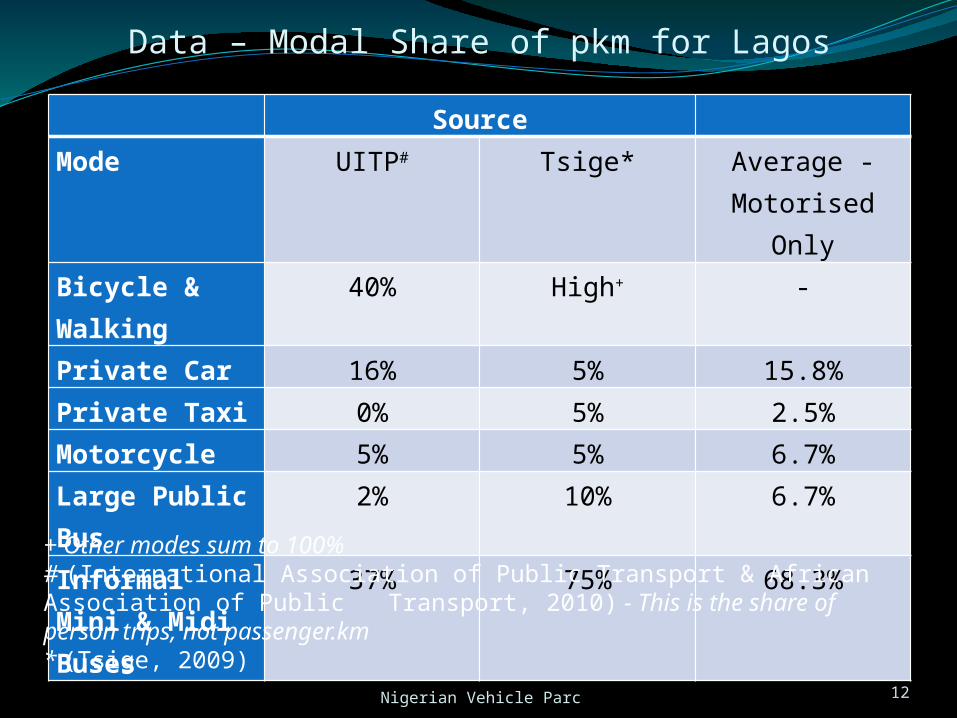
Data – Modal Share of pkm for Lagos
Nigerian Vehicle Parc
SourceMode UITP# Tsige* Average -
Motorised Only
Bicycle & Walking
40% High+ -
Private Car 16% 5% 15.8%Private Taxi 0% 5% 2.5%Motorcycle 5% 5% 6.7%Large Public Bus
2% 10% 6.7%
Informal Mini & Midi Buses
37% 75% 68.3%+ Other modes sum to 100%# (International Association of Public Transport & African Association of Public Transport, 2010) - This is the share of person trips, not passenger.km* (Tsige, 2009)
13
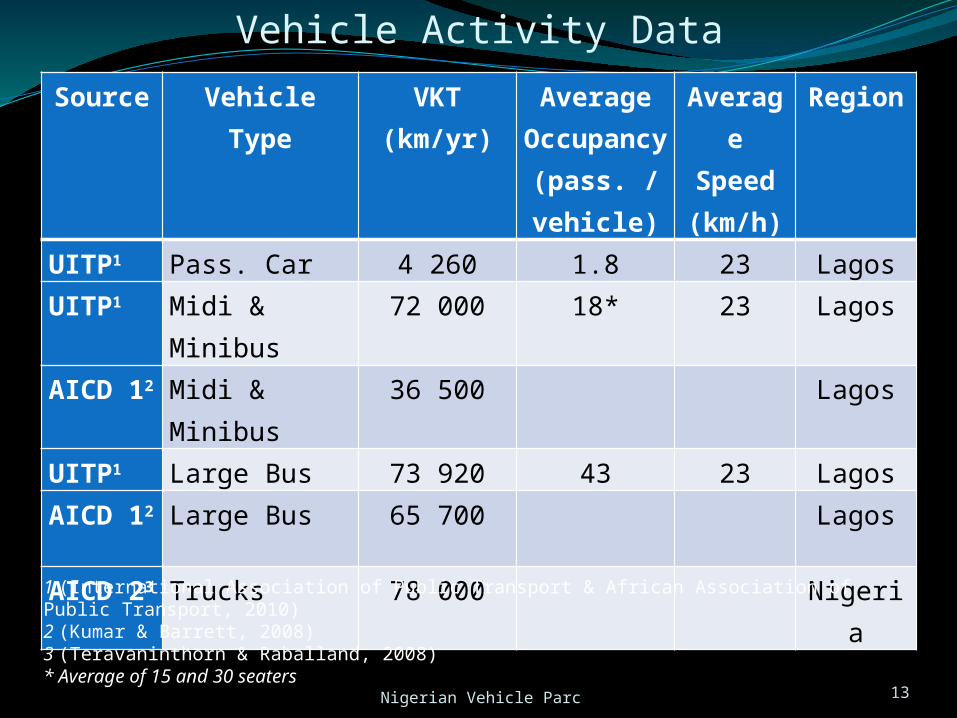
Vehicle Activity Data
Nigerian Vehicle Parc
Source Vehicle Type
VKT (km/yr)
Average Occupan
cy (pass. / vehicle)
Average
Speed (km/h)
Region
UITP1 Pass. Car 4 260 1.8 23 LagosUITP1 Midi &
Minibus72 000 18* 23 Lagos
AICD 12
Midi & Minibus
36 500 Lagos
UITP1 Large Bus 73 920 43 23 LagosAICD 12
Large Bus 65 700 Lagos
AICD 23
Trucks 78 000 Nigeria1 (International Association of Public Transport & African Association of Public Transport, 2010)2 (Kumar & Barrett, 2008)3 (Teravaninthorn & Raballand, 2008)* Average of 15 and 30 seaters
Nigerian Vehicle Parc 14
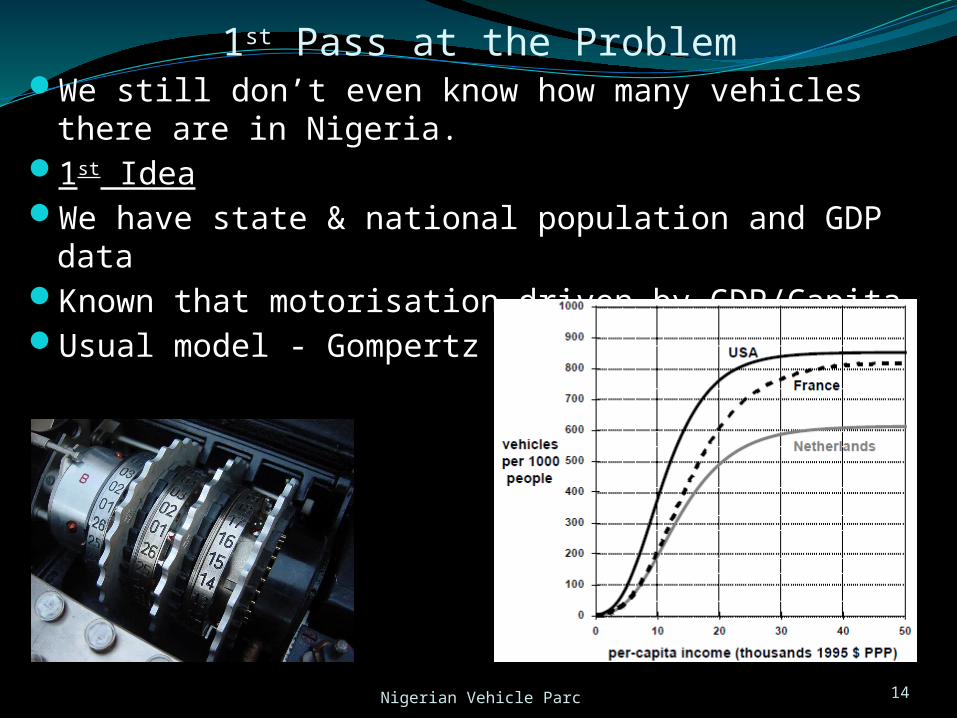
1st Pass at the ProblemWe still don’t even know how many vehicles there are in Nigeria.1st IdeaWe have state & national population and GDP dataKnown that motorisation driven by GDP/CapitaUsual model - Gompertz Curve
Nigerian Vehicle Parc 15
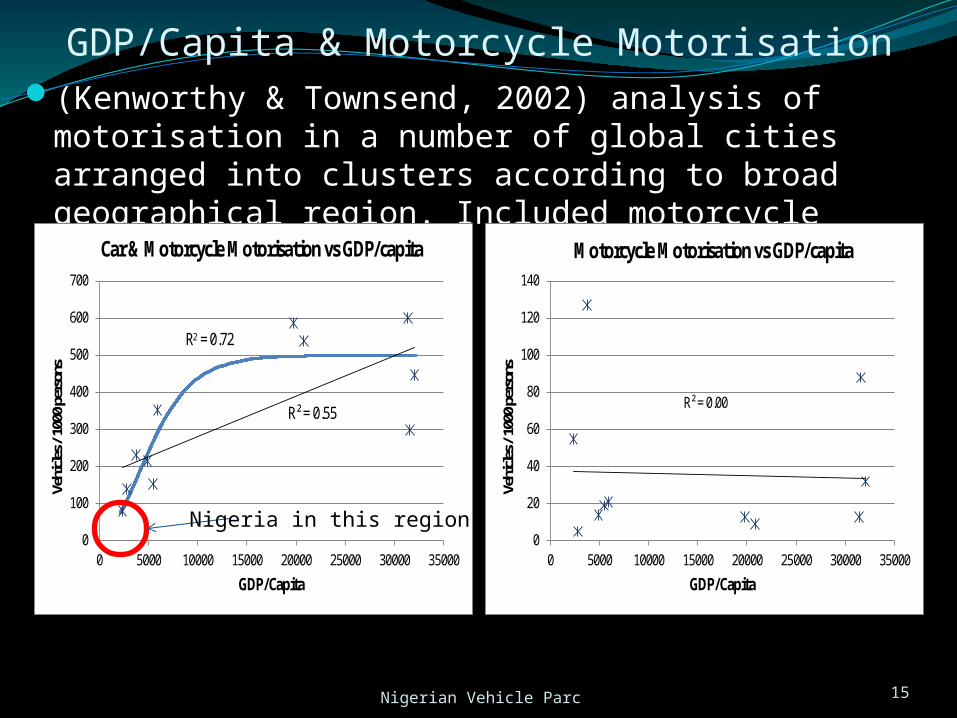
GDP/Capita & Motorcycle Motorisation(Kenworthy & Townsend, 2002) analysis of motorisation in a
number of global cities arranged into clusters according to broad geographical region. Included motorcycle fraction
R² = 0.55
0
100
200
300
400
500
600
700
0 5000 10000 15000 20000 25000 30000 35000
Vehi
cles /
1000
perso
ns
GDP/Capita
Car & Motorcycle Motorisation vs GDP/capita
R2 = 0.72
R² = 0.00
0
20
40
60
80
100
120
140
0 5000 10000 15000 20000 25000 30000 35000
Vehi
cles /
1000
perso
ns
GDP/Capita
Motorcycle Motorisation vs GDP/capita
Nigeria in this region
Nigerian Vehicle Parc 16
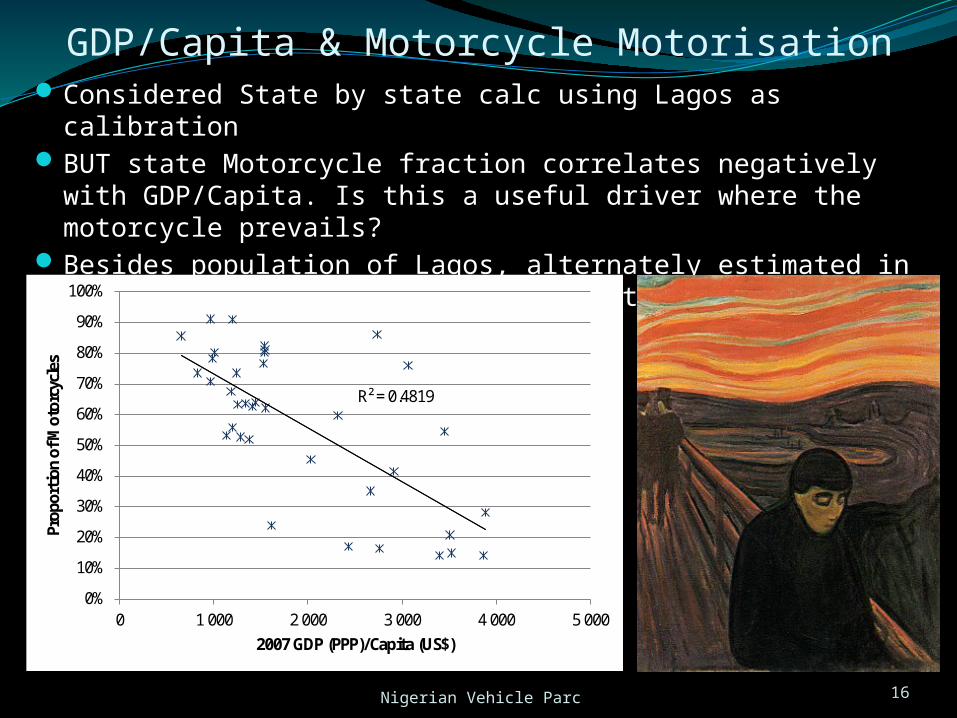
GDP/Capita & Motorcycle MotorisationConsidered State by state calc using Lagos as calibrationBUT state Motorcycle fraction correlates negatively with GDP/Capita. Is this a
useful driver where the motorcycle prevails?Besides population of Lagos, alternately estimated in 2006 as 17 552 942 by the
Lagos State Government and as 9 113 605 by the National Census
R² = 0.4819
0%
10%
20%
30%
40%
50%
60%
70%
80%
90%
100%
0 1 000 2 000 3 000 4 000 5 000
Prop
ortio
n of
Mot
orcy
cles
2007 GDP (PPP)/Capita (US$)
Nigerian Vehicle Parc 17
Option 2 - Simple Linear Fuel Balancing Model
Lagos used as a calibration state. (The population count still needed to be inferred from the data & literature however).
State gasoline and diesel sales used to estimate the size of the parcs in the other states on a proportional basis.
Linear model used to take account of the large fluctuations in motorcycle fraction in each state. The size of a state vehicle parc was therefore dependent on an assumption of the ratio of motorcycle fuel consumption to that of other gasoline fuelled vehicles.
The diesel vehicle fraction in a state was scaled from an assumed 5% of the parc in Lagos based on the diesel consumption of that state relative to that of Lagos State.
Nigerian Vehicle Parc 18
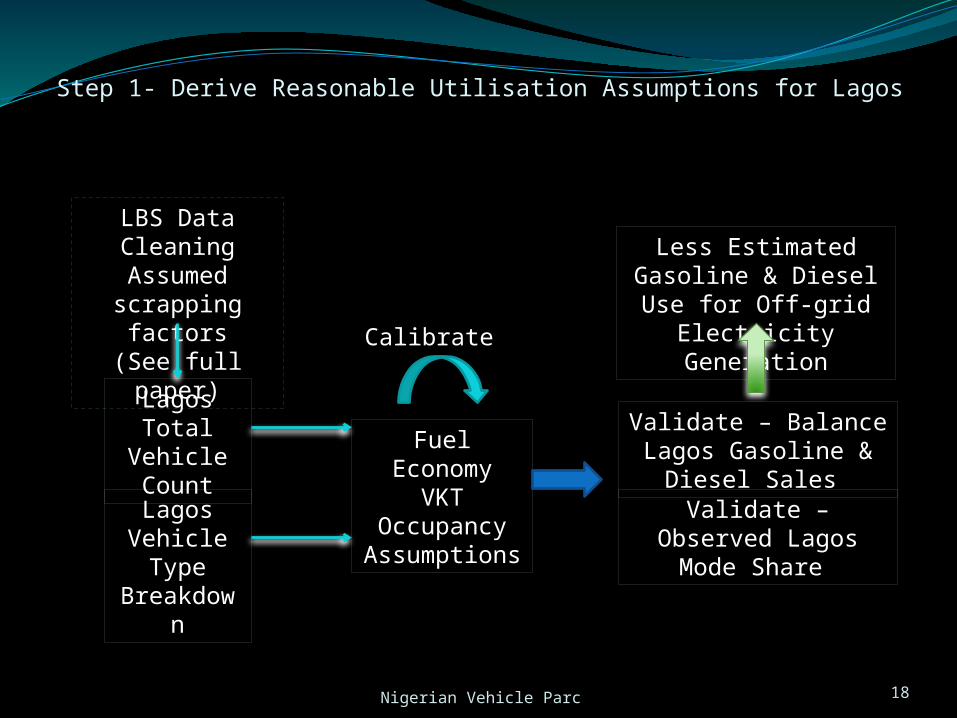
Step 1- Derive Reasonable Utilisation Assumptions for Lagos
Fuel EconomyVKT
OccupancyAssumptions
Lagos Total Vehicle Count
Lagos Vehicle Type Breakdown
Validate – Balance Lagos Gasoline & Diesel Sales
Validate – Observed Lagos Mode Share
Calibrate
Less Estimated Gasoline & Diesel Use for Off-grid Electricity Generation
LBS Data CleaningAssumed scrapping
factors(See full paper)
Nigerian Vehicle Parc 19
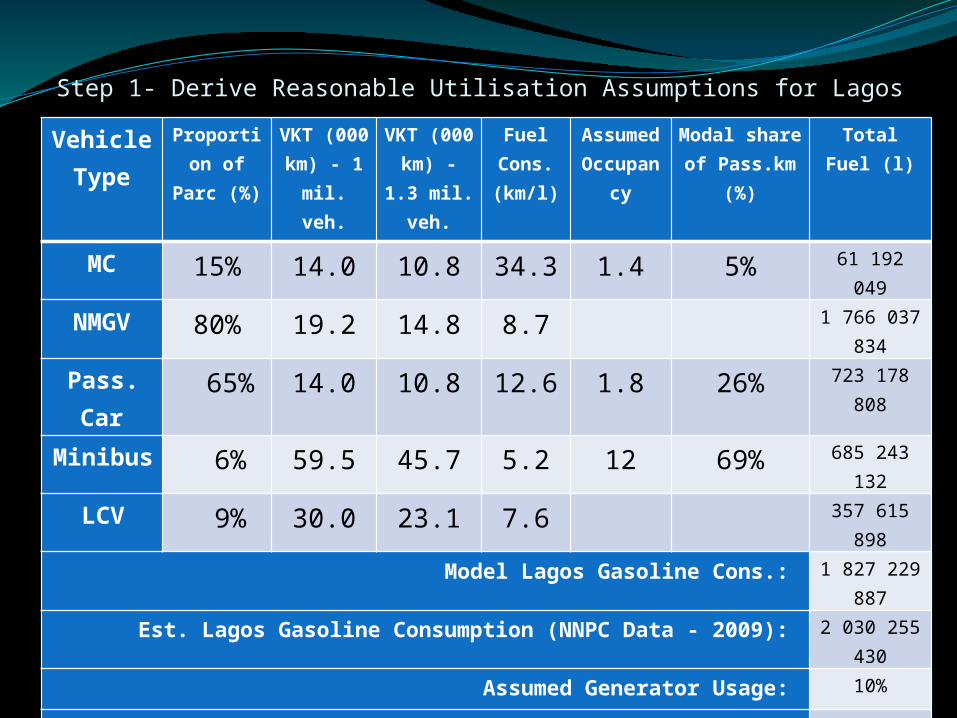
Step 1- Derive Reasonable Utilisation Assumptions for LagosVehicle
TypeProportion of Parc (%)
VKT (000 km) - 1 mil.
veh.
VKT (000 km) - 1.3 mil. veh.
Fuel Cons. (km/l)
Assumed Occupancy
Modal share of Pass.km (%)
Total Fuel (l)
MC 15% 14.0 10.8 34.3 1.4 5% 61 192 049
NMGV 80% 19.2 14.8 8.7 1 766 037 834
Pass. Car 65% 14.0 10.8 12.6 1.8 26% 723 178 808
Minibus 6% 59.5 45.7 5.2 12 69% 685 243 132
LCV 9% 30.0 23.1 7.6 357 615 898
Model Lagos Gasoline Cons.: 1 827 229 887
Est. Lagos Gasoline Consumption (NNPC Data - 2009): 2 030 255 430
Assumed Generator Usage: 10%
Est. Lagos Road Sector Gasoline Usage (NNPC Data - 2009): 1 827 229 887
Nigerian Vehicle Parc 20
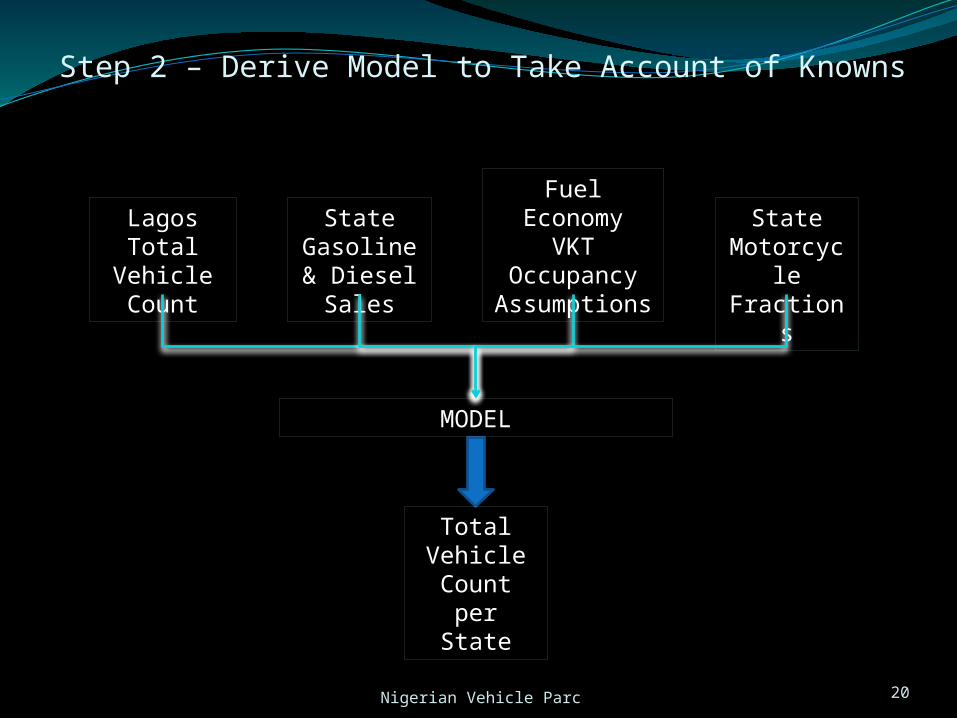
Step 2 – Derive Model to Take Account of Knowns
State Gasoline & Diesel Sales
State Motorcycle Fractions
Fuel EconomyVKT
OccupancyAssumptions
Lagos Total Vehicle Count
MODEL
Total Vehicle Count per
State
Nigerian Vehicle Parc 21
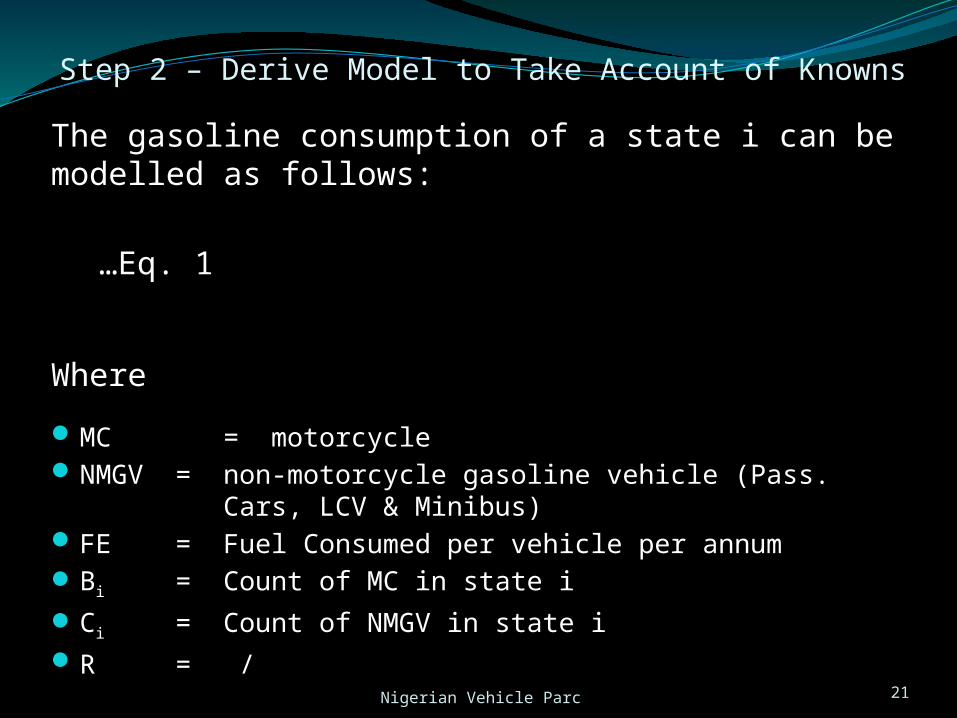
Step 2 – Derive Model to Take Account of Knowns
The gasoline consumption of a state i can be modelled as follows:
…Eq. 1
Where
MC = motorcycleNMGV = non-motorcycle gasoline vehicle (Pass.
Cars, LCV & Minibus)FE = Fuel Consumed per vehicle per annumBi = Count of MC in state iCi = Count of NMGV in state iR = /
Nigerian Vehicle Parc 22
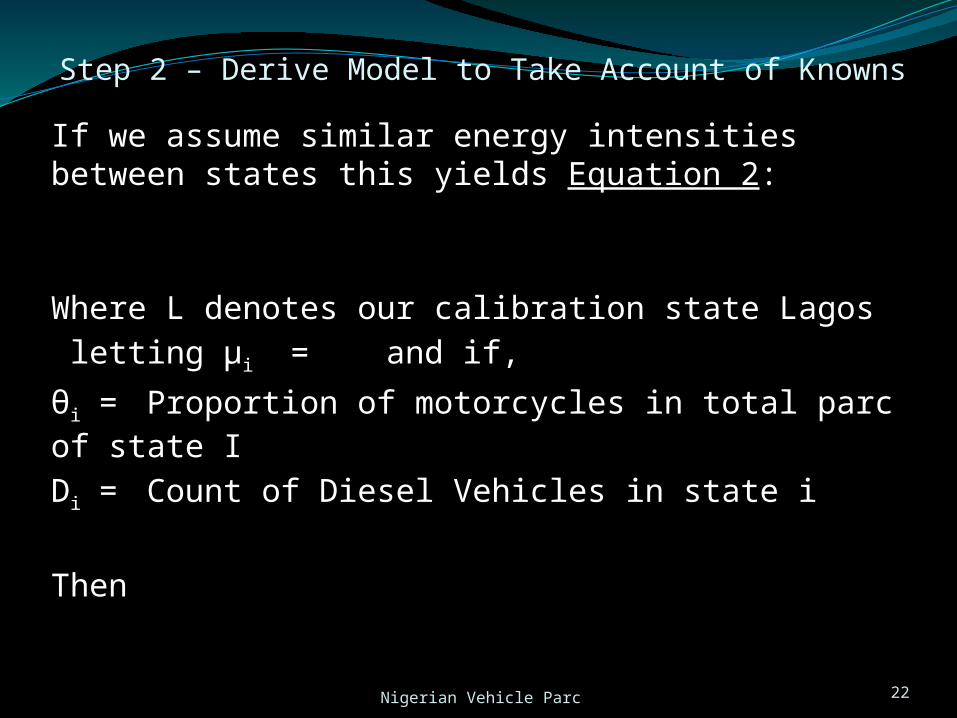
Step 2 – Derive Model to Take Account of Knowns
If we assume similar energy intensities between states this yields Equation 2:
Where L denotes our calibration state Lagos letting µi = and if,
θi = Proportion of motorcycles in total parc of state I
Di = Count of Diesel Vehicles in state i
Then

Nigerian Vehicle Parc 23
Step 2 – Derive Model to Take Account of Knowns
Letting, A =
And substituting in Eq. 2 yields Equation 3:
The count of gasoline vehicles that are not motorcycles as a function of our most certain (approximately known) variables and the count of diesel vehicles in the state.
Nigerian Vehicle Parc 24
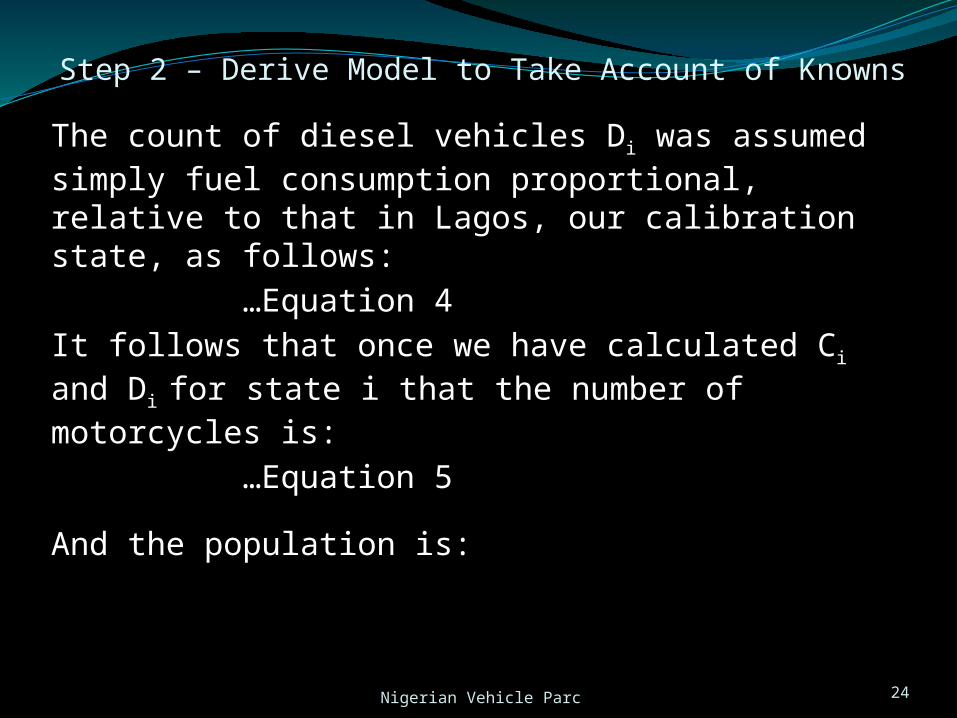
Step 2 – Derive Model to Take Account of Knowns
The count of diesel vehicles Di was assumed simply fuel consumption proportional, relative to that in Lagos, our calibration state, as follows:
…Equation 4It follows that once we have calculated Ci and Di for state i that the number of motorcycles is:
…Equation 5
And the population is:
Nigerian Vehicle Parc 25
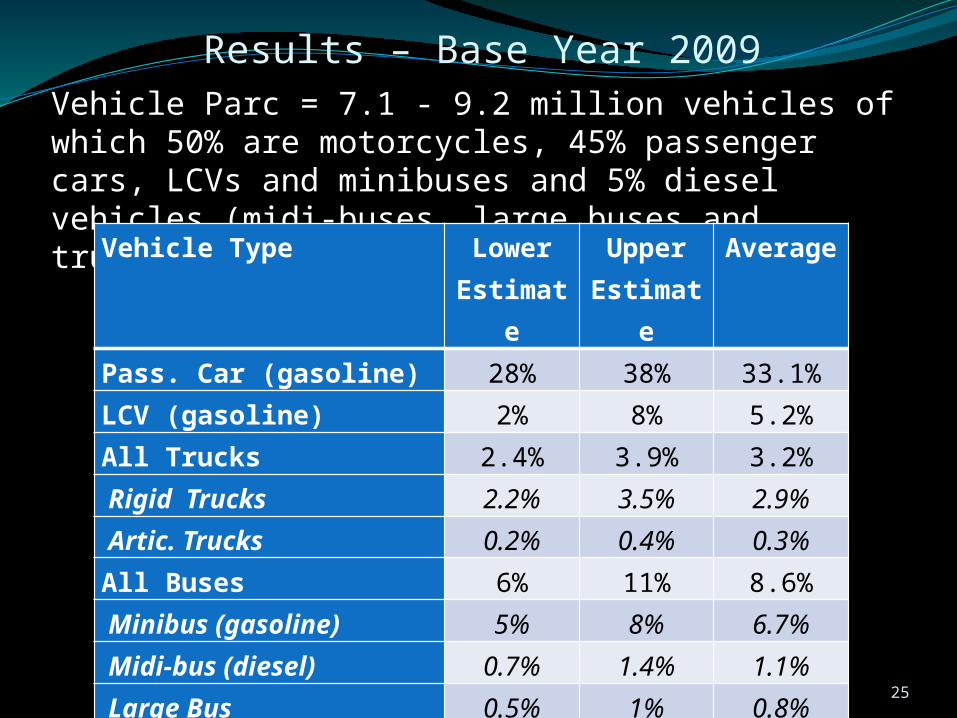
Results – Base Year 2009Vehicle Parc = 7.1 - 9.2 million vehicles of which 50% are motorcycles, 45% passenger cars, LCVs and minibuses and 5% diesel vehicles (midi-buses, large buses and trucks).
Vehicle Type Lower Estimate
Upper Estimate
Average
Pass. Car (gasoline) 28% 38% 33.1%LCV (gasoline) 2% 8% 5.2%All Trucks 2.4% 3.9% 3.2% Rigid Trucks 2.2% 3.5% 2.9% Artic. Trucks 0.2% 0.4% 0.3%All Buses 6% 11% 8.6% Minibus (gasoline) 5% 8% 6.7% Midi-bus (diesel) 0.7% 1.4% 1.1% Large Bus 0.5% 1% 0.8%Motorcycle 40% 60% 50.0%
Nigerian Vehicle Parc 26
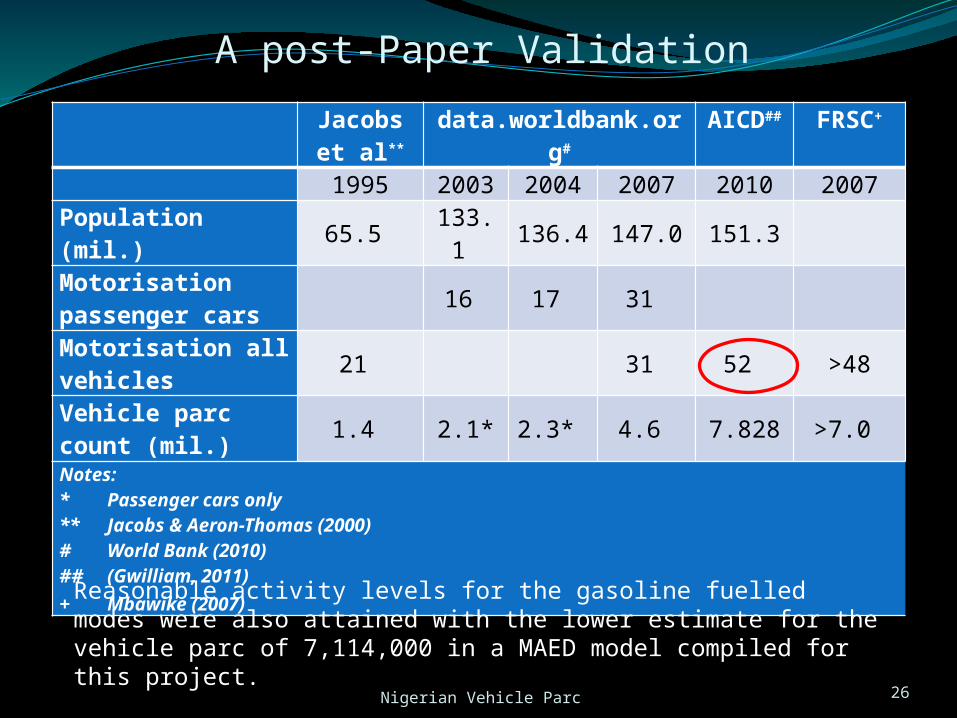
A post-Paper Validation
Jacobs et al**
data.worldbank.org#
AICD#
#
FRSC+
1995 2003 2004 2007 2010 2007Population (mil.) 65.5 133.1 136.4 147.0 151.3 Motorisation passenger cars
16 17 31
Motorisation all vehicles
21 31 52 >48
Vehicle parc count (mil.)
1.4 2.1* 2.3* 4.6 7.828 >7.0
Notes:* Passenger cars only** Jacobs & Aeron-Thomas (2000)# World Bank (2010)## (Gwilliam, 2011)+ Mbawike (2007)
Reasonable activity levels for the gasoline fuelled modes were also attained with the lower estimate for the vehicle parc of 7,114,000 in a MAED model compiled for this project.
Nigerian Vehicle Parc 27
Caveats
Gasoline supply side figures are likely to be over-estimated in Nigeria because of the temptation to declare false imports posed by the long-standing subsidy.
The government is trying to unwind the subsidy and this error will only become evident then.
The diesel under-reporting appears much more severe. The error to the number of vehicles is small in % terms but these heavy vehicles are large consumers.
Combining a MAED type model for transport and a suppressed electricity demand model indicated that actual diesel supplied could be 190 – 280% higher than that reported in official statistics.
Lagos may be very different to rest of country in terms of VKT and FE.
Nigerian Vehicle Parc 28
Conclusions
Profiling the Base Year energy services for complex economies with sparse data requires the modeller to mediate the supply side data and whatever utilisation data exists for the services.
This requires validation of both data sets and comparison with similar markets.
Piecing together clues can improve best guesses but the process is very inefficient
Getting quality data into the public domain remains a challenge for Africa