ADR and Daksh’s 2018 Karnataka Survey Report - (Dec … India. Foreword Karnataka ... Civil...
33
ADR and Daksh’s 2018 Karnataka Survey Report - (Dec ’17 – Feb ’18) Brief Analysis of Voters’ Priorities in Karnataka: Importance of Issues and Performance of the Government Association for Democratic Reforms T-95, C.L. House, 2nd Floor, Gulmohar Commercial Complex Gautam Nagar, New Delhi-110 049 Phone : +91-011-4165-4200 Fax : +91-11-46094248
Transcript of ADR and Daksh’s 2018 Karnataka Survey Report - (Dec … India. Foreword Karnataka ... Civil...
ADR and Daksh’s 2018 Karnataka Survey Report - (Dec ’17 – Feb ’18)
Brief Analysis of Voters’ Priorities in Karnataka: Importance of Issues and
Performance of the Government
Association for Democratic Reforms T-95, C.L. House, 2nd Floor,
Gulmohar Commercial Complex Gautam Nagar, New Delhi-110 049
Phone : +91-011-4165-4200 Fax : +91-11-46094248

ABOUT ADR
The Association for Democratic Reforms (ADR) was established in 1999 by a group of
professors from the Indian Institute of Management (IIM) Ahmedabad. In 1999, Public
Interest Litigation (PIL) was filed by them with Delhi High Court asking for [or
requesting] the disclosure of the criminal, financial and educational background of the
candidates contesting elections. Based on this, the Supreme Court in 2002, and
subsequently in 2003, made it mandatory for all candidates contesting elections to
disclose criminal, financial and educational background prior to the polls by filing an
affidavit with the Election Commission.
ADR’s goal is to improve governance and strengthen democracy by continuous work in
the area of Electoral and Political Reforms. The ambit and scope of work in this field is
enormous, Hence, ADR has chosen to concentrate its efforts in the following areas
pertaining to the political system of the country:
Corruption and criminalization in the political process.
Empowerment of the electorate through greater dissemination of information relating to the candidates and the parties, for a better and informed choice.
Need for greater accountability of Political Parties.
Need for inner-party democracy and transparency in party functioning.

ABOUT DAKSH
DAKSH is a civil society organization that undertakes research and activities to promote
accountability and better governance in India. It was founded in 2008 by people from
diverse backgrounds, including academicians, entrepreneurs, lawyers, teachers, social
and political activists, and ordinary citizens. Over the last seven years, DAKSH has been
working to create inclusive, transparent, self-correcting mechanisms that encourage accountability in all branches of the government.
Our two main activities are measuring political and judicial performance. We have
designed, developed, and deployed a variety of measures to assess and analyze
performance in the political space, such as conducting physical surveys to gather data on
people’s perceptions of their elected representatives. The most significant one was a
national, physical survey of over 2,65,000 people in 2014, assessing their perceptions of
their Members of Parliament (MPs).
We embarked on the Rule of Law Project in 2014 in order to evaluate judicial performance
and in particular, to study the problem of pendency of cases in the Indian legal system.
This project is based on quantitative research that will map the administration of justice
in India.

Foreword Karnataka Survey 2018
Professor Trilochan Sastry, IIM Bangalore and
Founder-Chairman Association for Democratic Reforms (ADR)
ADR has periodically done such surveys for various State Assembly and Lok Sabha elections in
partnership with various organizations. This survey, done in collaboration with Daksh has been
completed in time for the coming Assembly elections in Karnataka. The purpose is to find out
what voters want from the Government.
There are two aspects to the work on electoral and political reforms done by civil society. One is
to help clean the system for which ADR and its partners have worked hard for more than 15 years.
The other equally important aspect is to help and assist in good governance. After the heat and
dust of an election settles down, we recall the real purpose of elections: to bring in a Government
that governs well. However, who defines what this good governance is? In the spirit of democracy,
this survey and all previous surveys ask the voters and the people themselves what they expect of
the Government. As the results of such surveys gain traction with the media, political parties and
Governments we expect that priorities will shift towards what the people want rather than the
often populist election campaigns that we see of late. To give just one instance, survey after survey
(we have done more than half a dozen of them) shows one thing: people want jobs, employment
and livelihoods. It is difficult to establish cause and effect, but today we sometimes see
Governments trying to create jobs.
As mentioned in earlier survey reports, there is a philosophical basis for this. After all, the money
spent by the Government for delivering good governance belongs to the voters. So the voice of the
people must be reflected in the priorities, programs and policies made by elected Governments.
A related purpose of these surveys is to see that elections are fought on voter issues. As of now,
employment is not a major election issue because political parties using big money and the media
frame the campaigns. However, political parties would do much better if they promised and
delivered on people’s priorities.
Why do we need periodic surveys? A survey done in the aftermath of drought may show water as
a top priority and another after a good monsoon may show harvest prices as a priority. However,
in nearly all surveys, employment came out as one of the top priorities. We would get a better
understanding of short term and long term priorities at local, regional and national levels by
periodic surveys.
When the voter understands that the Government’s money is her money, then the foundation for
democracy would perhaps become a bit stronger. When the voter understands his/her, own power
– not only to change Governments, but also to influence governance, then democracy would have
moved another step forward. This understanding will not come through the election campaigns
of political parties. Civil society, the media and perhaps the Election Commission need to play a
bigger role. ADR expects that this is a long term effort and such surveys will play a part. We hope
the next elected Government in Karnataka will heed the voice of the people – not merely in terms
of who wins, but also in day to day governance.

Harish Narasappa Lawyer and Co-Founder, DAKSH
For a democracy to be meaningful, a regular discourse between the people and their elected representatives is a necessity. Unfortunately, this feature is missing in our country. Dialogue between the citizens and their representatives takes place primarily during elections. Moreover, elections do not always focus on issues that are relevant to the citizens. To bridge this gap between the citizens and their representatives and to ensure that citizens' concerns occupy the prime place in the functioning of elected bodies, voter surveys are important. The Karnataka Voter Survey carried out by ADR and DAKSH is an attempt to understand, and bring to the forefront, the perceptions of voters regarding issues of importance in their constituency. The survey was conducted ahead of the Karnataka assembly elections with the hope that the political parties, candidates and citizens can reflect on the issues that are important in their constituency. If citizens' issues dominate the discourse during elections, plans to tackle such issues will also develop. Voter perception surveys have been periodically carried out by ADR and DAKSH prior to assembly and parliamentary elections in the past, and have been well received by the citizens, elected representatives and political parties. While it may take time for electoral discourse to focus purely on issues related to governance, we hope that such surveys continue to create a dialogue for further discussion. Over the years, we have come to note that there has been a change in the needs of people, and the results of this survey show a demand for better schools. We hope that the results of this survey nudge us one-step further on the road to a meaningful democracy.

ACKNOWLEDGEMENTS
The Association for Democratic Reforms (ADR) and DAKSH would like to thank the
people and organizations who contributed to the conduct of this pan-Karnataka survey of
governance issues. This survey would not have been a success without the cooperation of
the following-
1. Interviewees: 13244 interviewees across 225 assembly constituencies gave their
time to participate in the survey. We express our deep gratitude to each one of the
interviewees.
2. Interviewers and supervisors: Vijayamma B.N. for the field survey and
training the field force particularly in issues related to governance and voters’
behaviour.
3. Mentor: Professor Trilochan Sastry who conceptualised the need for this survey,
supervised the administration of the survey and mentored the research group.
4. Research Group: Nilesh Ekka and Anirudh Dutta Gupta who developed an
analytical framework to accomplish the research and analysis for evaluating the
findings of the survey.
Major General Anil Verma (Retd.) Head, ADR

Table of Contents
ABOUT ADR............................................................................................................................................. 2
ABOUT DAKSH ...................................................................................................................................... 3
Foreword Karnataka Survey 2018 ................................................................................................. 4
ACKNOWLEDGEMENTS .................................................................................................................... 6
REPORT ABSTRACT ............................................................................................................................ 8
INTRODUCTION.................................................................................................................................... 9
METHODOLOGY ................................................................................................................................. 11
SUMMARY OF KEY FINDINGS ..................................................................................................... 13
Karnataka Rural Significant Issues: ....................................................................................... 16
Rural Performance Rating of the Government ................................................................... 17
Karnataka Urban Significant Issues ....................................................................................... 18
Urban Performance Rating of the Government ................................................................. 19
VOTING BEHAVIOUR ....................................................................................................................... 20
CONCLUSION ....................................................................................................................................... 22

REPORT ABSTRACT
Purpose: The Association for Democratic Reforms (ADR) and DAKSH commissioned a
survey of members of the eligible electorate in Karnataka—citizens over the age of 18—
during December 2017 to February 2018 in order to identify the level of citizen awareness
of the electoral process. Moreover, to ascertain voter perception on specific governance
issues and the rated performance of our elected representatives on those issues. The
primary purpose of the survey was to assess eligible voters’ access to information about
the political process, exposure to inducements for vote, awareness of candidates with
criminal cases in elections, general attitudes about electoral process in democracy and expectations from the government.
Research Design: A cross-sectional, representative sample of the population over
eighteen was selected using a partially purposive sample selection procedure, which
produced a sample of 13,244 respondents.
Survey: The responses of the Respondent Voters were obtained with the help of the
Questionnaire designed by DAKSH for this survey. Android based mobile smart phones
were used for conducting the survey. The surveyors directly recorded the data on these
smart phones with the help of android based software. Direct Interviews were carried out
between December 2017 and February 2018. Locally trained men and women conducted
all the in-person interviews. After pilot-testing, master trainers and enumerator teams
received survey-specific training in different districts of the state. The surveyors were
thereafter, overseen and controlled through the trained and experienced supervisors.
Respondents: Of the 13,244 respondents selected for the sample, 67 percent were men
and 33 percent were women and 74 percent of respondents were between 18 and 45 years
of age. 53 percent respondents were from rural locations and 47 percent from urban.

INTRODUCTION
This report presents the key findings of the 2018 Survey on the Expectations of the Voter
from Karnataka and their perception on the Performance of the Government conducted
by the Association for Democratic Reforms (ADR) and DAKSH.
The main objective of this survey was to find out voter perception on specific governance
issues and the rated performance of our government on those issues. ADR believes that
one of the means to establish accountability in politics is to evaluate the effectiveness of
legislators by measuring the public’s perception of the legislator’s performance in addressing issues that the people consider important.
The 2018 Karnataka Survey was administered exclusively with the help of android based
hand-held devices against the more traditional methods of paper-based surveys. The
survey sought to identify the issues considered most important by the voters and obtained
their opinion on the performance of the government in relation to such issues. This survey
was conducted during December 2017 to February 2018 across 225 assembly
constituencies and the total sample size was 13,244.
This report outlines the findings of a survey of voters’ expectations, perceptions and their
evaluation of the 25 most important issues for the voters in their particular region in
terms of their capacity, governance and specific roles in improving the living conditions
of the voters. These aspects are analyzed in relation to the performance of the government
on those issues as perceived by the respondents.
To identify what are voter priorities in terms of governance issues like water, electricity,
roads, food, education and health, a list of 25 items was given to voters and they were
asked to rate the issues as low, medium, high and not applicable for them. This list was
comprehensive as less than 5% said that the given issues were “not applicable” to them.
The results of the Perception Assessment shows the striking difference between the
priorities of the voters and the performance on those issues and highlights the overall
weak efforts of all institutions in fulfilling their role in providing what the voters really
need.
ADR believes that the assessment report can be an important tool in engendering
improvements within all institutions in refining their own institutional practices or
developing better oversight of other bodies. We hope the report will be instrumental in
starting a coordinated effort to work together to ensure the most efficient use of resources
to serve the nation as a whole.

The key objectives of this perception assessment are to generate:
a) An improved understanding of the important needs of the voters.
b) Momentum among key stake holders for addressing priority areas.
The primary aim of the assessment is therefore to evaluate the effectiveness of the
government, government institutions, mechanisms etc. in terms of planning and
providing for the needs of the country and fostering transparency and integrity. In
addition, it seeks to promote the assessment process as a springboard for action among
the government and Civil Society Organizations (CSOs) in terms of policy reforms,
evidence based advocacy, or further in-depth evaluations of specific governance issues.
This assessment should serve as a basis for key stakeholders to advocate for sustainable
and effective reforms.
We hope that this report will bring out the gap between expectations from the voters and the disappointments from the government and that this gap can be minimized.

METHODOLOGY
At the outset it is important to note that the survey is entirely about voter
perceptions. Whether the voter’s perception is right or wrong is immaterial for our
purposes. For instance in urban areas, some group may perceive garbage clearance was
very important while another may not think so. ‘Scientifically’ one may say that garbage
causes health hazards, but we present the data as voters tell it, and not based on what
‘ought’ to be done. The reason is that a voter votes based on his/her own perception, and
not on what may be ‘scientifically’ known to be true or false. There was no attempt to
prompt or influence responses during the survey. At the same time, there are socially
accepted ‘preferred’ answers. For instance asking “will you vote for someone with a
serious criminal record?” is of no use. The questionnaire was suitably designed to take
care of these issues.
The survey was done in the months of December ‘17 and February ‘18. While a
professional agency was hired to do it, DAKSH designed the questionnaire, and also made
random checks to ensure that the survey was proceeding smoothly. Given the size of the
survey, the time and budget limitations, we wanted to keep the questionnaire short and simple. It collected the following information:
Demographic data. Name, gender, caste/religion, age, educational qualification, Occupation, Annual Family Income.
What are the important factors for voting: Candidate, Political Party, Candidate caste/religion, Party’s CM Candidate.
The 25 Issues on Governance and rating of the government on each issue.
These included agriculture, electricity for agriculture and domestic use, higher price
realization for farm products, irrigation, subsidy for seed and fertilizers, Accessibility and
Trustworthiness of MLA, terrorism, employment, health care, Law and Order, public
transport, roads, education, drinking water, empowerment and security of Women,
eradication of Corruption, reservation for jobs and education, subsidized food
distribution (PDS), training for jobs, garbage clearance, encroachment of public land /
lakes, Traffic management, environment protection etc.
The respondents were randomly selected to represent various segments of the population
like rural-urban, gender, caste, religion, and income classes. Every care was taken to make
the samples fully representative of the population. The accuracy of the survey is 95%, i.e.,
the true values are within 5% of the survey predictions.
The assessment does not seek to offer in-depth evaluation of specific governance issues.
Rather, it seeks breadth, aiming to examine all relevant pillars across a wide number of
indicators in order to gain a view of the overall system. Understanding the interactions between various inter-related institutions helps to prioritize areas for reform.

Along with the importance of these 25 issues, voters were also asked to rate the
performance of their government on these particular issues and whether the performance was GOOD, AVERAGE or BAD.
For calculating the performance score, separate weightages were given to GOOD,
AVERAGE and BAD where, GOOD was given weightage equal to 3, Average was weighted
2 and BAD was weighted as 1. The weighted average was taken and the scores were between 1 to 3, where 1 was the lowest and 3 was the highest.

SUMMARY OF KEY FINDINGS
The data suggest that, as of February 2018, the majority of the eligible electorate
intended to vote. 95 percent of the respondents said that they voted in the last
elections.
In addition, the survey measured voters’ experience with electoral process and
asked them the reasons for which they vote for a candidate in elections. 86 percent
respondents said that the candidate was the most important reason for them to
vote in an election.
Although 67 percent respondents considered the candidate’s party to be a voting
factor, 42 percent said they would vote based on the CM candidate.
Candidate’s religion and caste were important for 37 percent and 36 percent voters
respectively.
31 percent respondents said that they were happy with the Indira Canteen Scheme,
whereas 36 percent were not happy with the scheme. 33 percent of the respondents
said they do not avail this scheme.
A vast majority of respondents, 79 percent, said that they were happy with the
Anna Bhagya Scheme. 6 percent respondents said that they do not use the scheme
and 14 percent respondents were not happy with the scheme.
63 percent respondents who used the Cycle Bhagya Scheme said that they were
happy with the scheme. While 25 percent responded in the negative, 13 percent
respondents did not use the scheme.
58 percent respondents were happy with the Krishi Bhagya scheme, whereas 25
percent were not. 17 percent respondents said that they do not use the scheme.
Anila/Gas Bhagya Scheme had 64 respondents who said that they were happy with
the scheme. 23 percent said no and 14 percent said that they do not use the scheme.
Shaadi Bhagya Scheme had 45 percent respondents who were not happy with it.
Only 16 percent respondents were happy with it and 40 percent said they do not
use the scheme.
Improving water supply and quality in Karnataka is by far the most important issue
on Democratic voters' minds, according to the survey conducted. It had a

significant score of 8.06 out of a scale of 10 in rural areas and 8.02 out of 10 in
urban areas.
Next most important issues in urban areas were Better Electricity Supply and
Better Schools with 7.97 and 7.94 out of 10.
They were followed by Better Roads and Environment protection with 7.81 and
7.80 out of 10.
In rural areas, the next most important issues were Better Schools and Better
Roads with significance scores of 8.03 and 7.99 out of 10.
Better Electricity Supply and More Hospitals and Public Health Centres followed
them with a score of 7.96 and 7.92 out of 10.
Anti-Terrorism in urban areas had the least significance with a score of 7.20.
In rural areas, Job Trainings with a score of 7.51 out of 10 had the least significance
according to the survey respondents.
The respondents also rated the government for their performance on the issues
which they considered very important. The top most issue, Better Water Supply
and Quality scored 7.48 out of 10 in urban and 7.33 in rural areas.
The respondents ranked Better Schools, the highest among the 25 top issues in
urban areas with a score of 7.85 out of 10.
The worst performances were on the issues of Public Facilities (6.79), Corruption
Eradication (6.77) and Job Trainings (6.40) in urban areas.
In rural areas, the highest performance score was given to Better Schools with 7.58
out of 10.
The worst performance score was given to Better Employment Opportunities
(6.70), Corruption Eradication (6.67) and Job Trainings (6.60) in rural areas.
This measure of voters’ perceptions highlight the need for awareness on the criminal,
financial and other background of the candidates as well the transparency and
accountability of the political parties. Only then can a voter make an informed choice and
contribute to electoral reform efforts.

The overall average importance of issues was rated as 7.72 on a scale of 10 and the overall
average rating for Karnataka as perceived by the survey respondents was 7.09 on a scale of 10
Karnataka Importance of Issues
Score (out of 10) Performance of Government
Score (out of 10) Urban 7.61 7.13 Rural 7.82 7.05
Overall 7.72 7.09
6.6
6.8
7
7.2
7.4
7.6
7.8
I M P O R T A N C E O F I S S U E S
P E R F O R M A N C E S C O R E
7.72
7.09
KARNATAKA AVG. IMPORTANCE AND PERFORMANCE RATINGS (OUT OF 10)
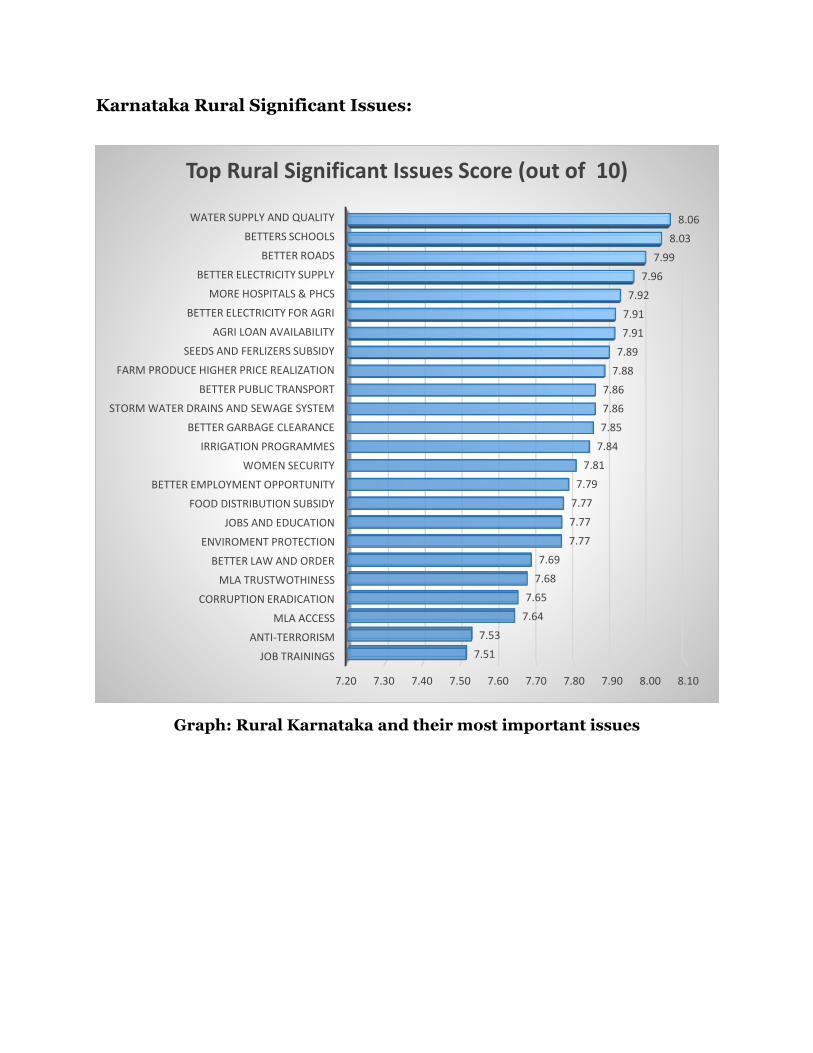
Karnataka Rural Significant Issues:
Graph: Rural Karnataka and their most important issues
7.20 7.30 7.40 7.50 7.60 7.70 7.80 7.90 8.00 8.10
JOB TRAININGS
ANTI-TERRORISM
MLA ACCESS
CORRUPTION ERADICATION
MLA TRUSTWOTHINESS
BETTER LAW AND ORDER
ENVIROMENT PROTECTION
JOBS AND EDUCATION
FOOD DISTRIBUTION SUBSIDY
BETTER EMPLOYMENT OPPORTUNITY
WOMEN SECURITY
IRRIGATION PROGRAMMES
BETTER GARBAGE CLEARANCE
STORM WATER DRAINS AND SEWAGE SYSTEM
BETTER PUBLIC TRANSPORT
FARM PRODUCE HIGHER PRICE REALIZATION
SEEDS AND FERLIZERS SUBSIDY
AGRI LOAN AVAILABILITY
BETTER ELECTRICITY FOR AGRI
MORE HOSPITALS & PHCS
BETTER ELECTRICITY SUPPLY
BETTER ROADS
BETTERS SCHOOLS
WATER SUPPLY AND QUALITY
7.51
7.53
7.64
7.65
7.68
7.69
7.77
7.77
7.77
7.79
7.81
7.84
7.85
7.86
7.86
7.88
7.89
7.91
7.91
7.92
7.96
7.99
8.03
8.06
Top Rural Significant Issues Score (out of 10)

Rural Performance Rating of the Government
Graph: Rural Karnataka Performance Score
6.00 6.20 6.40 6.60 6.80 7.00 7.20 7.40 7.60
JOB TRAININGS
CORRUPTION ERADICATION
BETTER EMPLOYMENT OPPORTUNITY
BETTER GARBAGE CLEARANCE
JOBS AND EDUCATION
STORM WATER DRAINS AND SEWAGE SYSTEM
IRRIGATION PROGRAMMES
FARM PRODUCE HIGHER PRICE REALIZATION
ENVIROMENT PROTECTION
MORE HOSPITALS & PHCS
BETTER LAW AND ORDER
MLA TRUSTWOTHINESS
ANTI-TERRORISM
BETTER ELECTRICITY FOR AGRI
MLA ACCESS
SEEDS AND FERLIZERS SUBSIDY
BETTER PUBLIC TRANSPORT
BETTER ROADS
WOMEN SECURITY
AGRI LOAN AVAILABILITY
WATER SUPPLY AND QUALITY
FOOD DISTRIBUTION SUBSIDY
BETTER ELECTRICITY SUPPLY
BETTERS SCHOOLS
6.60
6.67
6.70
6.73
6.77
6.79
6.88
6.88
6.90
7.01
7.02
7.03
7.05
7.12
7.12
7.14
7.19
7.23
7.27
7.28
7.33
7.35
7.56
7.58
Rural Performance Score (out of 10)

Karnataka Urban Significant Issues
Graph: Urban Karnataka and their most important issues
6.60 6.80 7.00 7.20 7.40 7.60 7.80 8.00 8.20
ANTI-TERRORISM
ZONE REGULATIONS
JOB TRAININGS
LAKE RESTORATION
MLA ACCESS
PARKING FACILITIES
JOBS AND EDUCATION RESERVATION
TRAFFIC MANGEMENT
PUBLIC LAND/LAKE/ROADS ENCHROACHMENT
CORRUPTION ERADICATION
WOMEN SECURITY
BETTER LAW AND ORDER
BETTER PUBLIC TRANSPORT
MLA TRUSTWOTHINESS
BETTER GARBAGE CLEARANCE
BETTER EMPLOYMENT OPPORTUNITY
PUBLIC FACILITIES PARKS/PUBLIC TOILETS/FOOTPATH …
FOOD DISTRIBUTION SUBSIDY
STORM WATER DRAINS AND SEWAGE SYSTEM
MORE HOSPITALS & PHCS
ENVIROMENT PROTECTION
BETTER ROADS
BETTERS SCHOOLS
BETTER ELECTRICITY SUPPLY
WATER SUPPLY AND QUALITY
7.20
7.28
7.28
7.42
7.42
7.46
7.47
7.51
7.51
7.56
7.57
7.58
7.60
7.61
7.62
7.64
7.64
7.70
7.78
7.78
7.80
7.81
7.94
7.97
8.02
Top Urban Significant Issues Score (out of 10)

Urban Performance Rating of the Government
Graph: Urban Karnataka Performance Score
6.40
6.77
6.79
6.82
6.83
6.86
6.87
6.87
6.92
7.00
7.05
7.06
7.08
7.08
7.14
7.26
7.32
7.33
7.34
7.38
7.39
7.48
7.61
7.83
7.85
0.00 1.00 2.00 3.00 4.00 5.00 6.00 7.00 8.00 9.00
JOB TRAININGS
CORRUPTION ERADICATION
PUBLIC FACILITIES PARKS/PUBLIC TOILETS/FOOTPATH …
ANTI-TERRORISM
JOBS AND EDUCATION RESERVATION
BETTER GARBAGE CLEARANCE
BETTER EMPLOYMENT OPPORTUNITY
LAKE RESTORATION
ZONE REGULATIONS
STORM WATER DRAINS AND SEWAGE SYSTEM
PARKING FACILITIES
PUBLIC LAND/LAKE/ROADS ENCHROACHMENT
ENVIROMENT PROTECTION
MLA ACCESS
TRAFFIC MANGEMENT
BETTER LAW AND ORDER
BETTER ROADS
WOMEN SECURITY
MLA TRUSTWOTHINESS
MORE HOSPITALS & PHCS
FOOD DISTRIBUTION SUBSIDY
WATER SUPPLY AND QUALITY
BETTER PUBLIC TRANSPORT
BETTER ELECTRICITY SUPPLY
BETTERS SCHOOLS
Urban Performance Score (out of 10)

VOTING BEHAVIOUR
The survey tried to identify the important factors that people take into account before
voting for a particular Candidate. Issue like whether the Candidate matters the most or
his Political Party or other issues like caste/religion of the Candidate and CM Candidate of the party
Voting Behaviour Karnataka
Why people vote:
Party 67%
Candidate 86%
CM Candidate 42%
Religion 37%
Caste 36%
The survey asked respondents about the reason they vote for a particular candidate.
They were given five choices—candidate, party, party’s chief ministerial candidate,
religion and caste. Respondents had to rank each of these as either very important,
important or not important. Taking the weighted average across respondents for each of
these factors, we can gauge the aggregate importance of each of the five factors across all
voters.

It is interesting that, according to the survey, the most important factor for voters is the
candidate, followed by the party and CM candidate.
86%
67%
37% 36%42%
0%
10%
20%
30%
40%
50%
60%
70%
80%
90%
100%
The Candidate The Candidate's Party Candidate's Religion Candidate's Caste CM Candidate
WHY PEOPLE VOTE?

CONCLUSION
The survey assessed the voter characteristics and the voter perception towards issues of importance to them and how they think the Government has performed on those issues. Thus, the analysis brings out mainly two important questions to the forefront. What important factors may drive divergence? What can be done to improve congruence? Through the analysis, we can see that men and women whether in rural or urban areas, are equally interested in politics and have actively participated in bringing forth their concerns. The decisions of the policy makers are likely to differ from the preferences of the constituents; however, this survey provides an opportunity to the policy makers to evaluate the issues that the respondents have raised and work towards minimizing the gap between voters and Government. The voters have to make a choice from among those candidates that are available. It is assumed that the voters vote for candidates that have similar opinions, based on the promises made during election campaigns and in their election manifesto. However, besides the lack of information with the constituents, the candidate's own preferences are not transparent, they advertise what seems to be good for election or re-election, and they avoid talking or declaring anything that could be unpopular. The relative importance of these promises shift with proximity to the elections. The fact that the electorate has no role once the politician is elected and the suspended animation of electorate is brought back to life only when next elections are due allows the priority of the candidates elected to be determined by the political parties. It is then hoped that the electorate takes care to elect a better politician to represent them. Political representation is about championing constituents’ preferences. In the larger and complete report, we also provide constituency wise information. However, the top two issues of employment and better health services remain relevant across the country. We hope this report will help people’s representatives to do their work more effectively. The gap between people’s expectations and its fulfilment needs to be addressed.

Political Survey: KarnatakaDemographic Profile
Page 23

Age and Income
Page 24
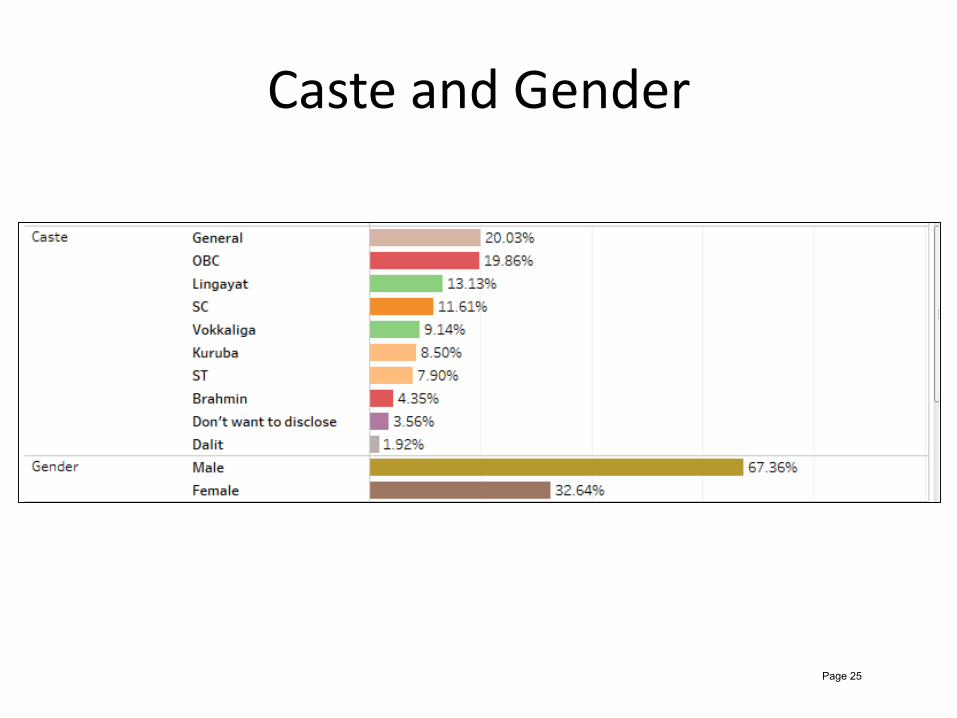
Caste and Gender
Page 25

Occupation, Qualification and Religion
Page 26

12/19/2017 Karnataka Voter Survey 2017 | Enterprise Survey Software
https://www.questionpro.com/a/loadResponse.do?editMode=true&print=true 1/7
Questions marked with a * are required
* District, Taluk, Assembly Constituency, and Location
-- Select --
Rural
Urban
Male
Female
18 - 30 years
31 - 45 years
46 - 60 years
61 - 70 years
71 - 80 years
81 - 85 years
Above 85 years
Hindu
Muslim
Christian
Other
* Name of surveyor
* Name of survey respondent
Phone number of survey respondent
* Voter location
* Gender
* Age
* Religion
Page 27

12/19/2017 Karnataka Voter Survey 2017 | Enterprise Survey Software
https://www.questionpro.com/a/loadResponse.do?editMode=true&print=true 2/7
Brahmin
Dalit
Kuruba
Lingayat
Vokkaliga
General
SC
ST
OBC
Don't want to disclose
No education
Primary
High school
PUC
Degree
Above degree
Agriculture
Business
Defence
Engineering
Government
Law
Medical
Private
Others
* Caste
* Qualification
* Occupation
Page 28

12/19/2017 Karnataka Voter Survey 2017 | Enterprise Survey Software
https://www.questionpro.com/a/loadResponse.do?editMode=true&print=true 3/7
Under Rs. 10,000
Rs. 10,001 to Rs. 25,000
Rs. 25,001 to Rs. 50,000
Rs. 50,001 to Rs. 1,00,000
Rs. 1,00,001 to Rs. 2,50,000
Rs. 2,50,001 to Rs. 5,00,000
Rs. 5,00,001 to Rs. 10,00,000
Above Rs. 10,00,000
Yes
No
Missing name
Not registered
Not interested
Yes
No
What are the reasons you vote for a candidate? Rate the factors in the table by order of importance.
Not important Important Very important* The candidate
* The candidate's party
* Candidate's religion
* Candidate's caste
* Chief ministerial candidate
Are you happy with the following schemes?
Yes No I do not use this scheme* Indira Canteen
* Anna Bhagya
* Cycle Bhagya
* Krishi Bhagya
* Anila/Gas Bhagya
* Shaadi Bhagya
* Annual family income
* Did you vote in the last elections?
* If no, why?
* If yes, did the candidate you voted for in the last election win?
Page 29

12/19/2017 Karnataka Voter Survey 2017 | Enterprise Survey Software
https://www.questionpro.com/a/loadResponse.do?editMode=true&print=true 4/7
What are the issues that are important to you in an election? (Urban)
Low Medium High Not Applicable* Accessibility of MLA
* Better law and order / policing
* Better public transport
* Better roads
* Eradication of corruption
* More hospitals / primary health care centers
* Trustworthiness of MLA
* Security of women
* Better electricity supply
* Better employment opportunities
Low Medium High Not Applicable* Better garbage clearance
* Reservation for jobs and education
* Subsidized food distribution
* Water supply and quality
* Restoration of lakes
* Functioning of storm water drains andsewerage system
* Traffic management
* Encroachment of public land, lakes androads
* Parking facilities
* Public facilities / basic amenities - parks,public toilets, quality footpaths, etc
* Zoning regulations
* Anti-terrorism
* Better schools
* Environmental protection
* Training for jobs
Page 30

12/19/2017 Karnataka Voter Survey 2017 | Enterprise Survey Software
https://www.questionpro.com/a/loadResponse.do?editMode=true&print=true 5/7
What are the issues that are important to you in an election? (Rural)
Low Medium High Not Applicable* Accessibility of MLA
* Better law and order / policing
* Better public transport
* Better roads
* Eradication of corruption
* More hospitals / primary health care centers
* Trustworthiness of MLA
* Security of women
* Better electricity supply
* Better employment opportunities
Low Medium High Not Applicable* Better garbage clearance
* Reservation for jobs and education
* Subsidized food distribution
* Water supply and quality
* Functioning of storm water drains andsewerage system
* Agricultural loan availability
* Electricity for agriculture
* Higher price-realization for farm products
* Irrigation programmes
* Subsidy for seeds and fertilizers
* Anti-terrorism
* Better schools
* Environmental protection
* Training for jobs
How has your MLA performed on various issues? (Urban)
Page 31

12/19/2017 Karnataka Voter Survey 2017 | Enterprise Survey Software
https://www.questionpro.com/a/loadResponse.do?editMode=true&print=true 6/7
Bad Average Good Not Applicable* Accessibility of MLA
* Better law and order / policing
* Better public transport
* Better roads
* Eradication of corruption
* More hospitals / primary health care centers
* Trustworthiness of MLA
* Security of women
* Better electricity supply
* Better employment opportunities
Bad Average Good Not Applicable* Better garbage clearance
* Reservation for jobs and education
* Subsidized food distribution
* Water supply and quality
* Restoration of lakes
* Functioning of storm water drains andsewerage system
* Traffic management
* Encroachment of public land, lakes androads
* Parking facilities
* Public facilities / basic amenities - parks,public toilets, quality footpaths, etc
* Zoning regulations
* Anti-terrorism
* Better schools
* Environmental protection
* Training for jobs
Page 32

12/19/2017 Karnataka Voter Survey 2017 | Enterprise Survey Software
https://www.questionpro.com/a/loadResponse.do?editMode=true&print=true 7/7
How has your MLA performed on various issues? (Rural)
Bad Average Good Not Applicable* Accessibility of MLA
* Better law and order / policing
* Better public transport
* Better roads
* Eradication of corruption
* More hospitals / primary health care centers
* Trustworthiness of MLA
* Security of women
* Better electricity supply
* Better employment opportunities
Bad Average Good Not Applicable* Better garbage clearance
* Reservation for jobs and education
* Subsidized food distribution
* Water supply and quality
* Functioning of storm water drains andsewerage system
* Agricultural loan availability
* Electricity for agriculture
* Higher price-realization for farm products
* Irrigation programmes
* Subsidy for seeds and fertilizers
* Anti-terrorism
* Better schools
* Environmental protection
* Training for jobs
Survey Software Powered by
Page 33