Adoptive Expectations: Rising Sons in Japanese … · Adoptive Expectations: Rising Sons in...
37
First draft: June 30 th 2007 his draft: September 28 th 2009 reliminary: Comments Welcome T P Adoptive Expectations: Rising Sons in Japanese Family Firms Vikas Mehrotra, a Randall Morck, b Jungwook Shim, c & Yupana Wiwattanakantang d Abstract A unique Japanese practice of adopting adults, even if one has biological children, makes Japanese family firms unusually economically competitive. Using a large panel that very nearly comprises the population of postwar listed nonfinancial firms; we find inherited family firms more important in postwar Japan than generally realized, and also performing well – an unusual finding for a developed economy. Adopted heirs’ firms outperform blood heirs’ firms, and match or nearly match founderrun listed firms. Both adopted and blood heirs’ firms outperform nonfamily firms (excluding founders’ firms). With blood heir gender and educational records as instruments, we find family succession events “causing” elevated performance. These findings are consistent with adult adoptees displacing blood heirs in the left tail of the talent distribution, with the “adopted son” job motivating star managers, and l, mitigating the s with the threat of displacement inducing blood heirs to invest in human capita ocalled “Carnegie conjecture” that inherited wealth deadens talent. KEYWORDS: PORATE GOVERNANCE, FAMILY BUSINESS, INHERITED ABILITY, SION. ADOPTION, COR JAPAN, SUCCES L CODES: G32, G34, M13 JE a. A. F. (Chip) Collins Chair in Finance, University of Alberta School of Business, Edmonton CANADA T6G2R6. E‐mail: [email protected] Phonr: +1 (780) 492‐2976 b. Distinguished University Professor and Stephen A. Jarislowsky Distinguished Chair in Finance, University of Alberta mail: School of Business, Edmonton CANADA T6G2R6; Research Associate, National Bureau of Economic Research. E‐ [email protected] . Phone: +1 (780) 492‐5683. c. Institute for Economic Research, Hitotsubashi University, Naka 2‐1, Kunitachi, Tokyo, JAPAN 186‐8603. E‐mail: [email protected] . Institute for Economic Research, Hitotsubashi University, Naka 2‐1 Kunitachi, Tokyo, JAPAN 186‐8603. E‐mail: d. [email protected]‐u.ac.jp . We are grateful for helpful comments from Joseph Fan, Masaharu Hanasaki, Katsuyuki Kubo, Seki Obata, Juro Teranishi sensei, Hugh Pattrick and from seminar and conference participants at the University of Alberta, the University of Calgary, the Chinese University of Hong Kong, Columbia University, Hitotsubashi University, IIM‐Bangalore, the Indian School of Business, Kobe University, Kyoto University, London School of Economics, London Business School, the University of Lugano, and Osaka University. We acknowledge financial support from the Grant‐in‐Aid for Scientific Research (kakenhi) provided by the Japanese [Ministry of Education, Culture, Sports, Science and Technology (MEXT) and the Murata Foundation. All remaining errors are the authors’ responsibility.
Transcript of Adoptive Expectations: Rising Sons in Japanese … · Adoptive Expectations: Rising Sons in...
First draft: June 30th 2007 his draft: September 28th 2009 reliminary: Comments Welcome TP
Adoptive Expectations: Rising Sons in Japanese Family Firms Vikas Mehrotra,a Randall Morck,b Jungwook Shim,c & Y
upana Wiwattanakantangd
Abstract
A unique Japanese practice of adopting adults, even if one has biological children, makes Japanese family firms unusually economically competitive. Using a large panel that very nearly comprises the population of postwar listed nonfinancial firms; we find inherited family firms more important in postwar Japan than generally realized, and also performing well – an unusual finding for a developed economy. Adopted heirs’ firms outperform blood heirs’ firms, and match or nearly match founderrun listed firms. Both adopted and blood heirs’ firms outperform nonfamily firms (excluding founders’ firms). With blood heir gender and educational records as instruments, we find family succession events “causing” elevated performance. These findings are consistent with adult adoptees displacing blood heirs in the left tail of the talent distribution, with the “adopted son” job motivating star managers, and l, mitigating the s
with the threat of displacement inducing blood heirs to invest in human capitaocalled “Carnegie conjecture” that inherited wealth deadens talent.
KEYWORDS: PORATE GOVERNANCE, FAMILY BUSINESS, INHERITED ABILITY, SION.
ADOPTION, CORJAPAN, SUCCES
L CODES: G32, G34, M13 JE a. A. F. (Chip) Collins Chair in Finance, University of Alberta School of Business, Edmonton CANADA T6G2R6. E‐mail:
[email protected] Phonr: +1 (780) 492‐2976 b. Distinguished University Professor and Stephen A. Jarislowsky Distinguished Chair in Finance, University of Alberta
mail: School of Business, Edmonton CANADA T6G2R6; Research Associate, National Bureau of Economic Research. E‐[email protected]. Phone: +1 (780) 492‐5683.
c. Institute for Economic Research, Hitotsubashi University, Naka 2‐1, Kunitachi, Tokyo, JAPAN 186‐8603. E‐mail: [email protected]. Institute for Economic Research, Hitotsubashi University, Naka 2‐1 Kunitachi, Tokyo, JAPAN 186‐8603. E‐mail: d. [email protected]‐u.ac.jp.
We are grateful for helpful comments from Joseph Fan, Masaharu Hanasaki, Katsuyuki Kubo, Seki Obata, Juro Teranishi sensei, Hugh Pattrick and from seminar and conference participants at the University of Alberta, the University of Calgary, the Chinese University of Hong Kong, Columbia University, Hitotsubashi University, IIM‐Bangalore, the Indian School of Business, Kobe University, Kyoto University, London School of Economics, London Business School, the University of Lugano, and Osaka University. We acknowledge financial support from the Grant‐in‐Aid for Scientific Research (kakenhi) provided by the Japanese [Ministry of Education, Culture, Sports, Science and Technology (MEXT) and the Murata Foundation. All remaining errors are the authors’ responsibility.
1
“Better to have daughters than sons, for then I can choose my sons.” Mitsui patriarch.
1 Introduction If talent and intelligence were reliably inherited, biologically or environmentally, family firms should dominate economic activity. However, such traits are, at most, unreliably genetically inherited (Herrnstein and Murray 1994; Heckman1995). Moreover, restricting the top job to family truncates non‐family executives’ career options, inducing an adverse selection problem in the hiring and retention of outsiders (Aronoff and Ward, 2000) and limiting the efficacy of CEO tournaments in eliciting lower‐level executives’ effort (Lazear and Rosen, 1981; Demsetz, 1996; Frank and Cook, 1996). Perhaps most damning, the US robber baron Andrew Carnegie (1899) famously conjectures that enormous inherited wealth “generally deadens the talents and energies” – a premise supported in US tax data (Holtz‐Eakin et al. 1993). Given this threefold competitive disadvantage, the wisdom of the Chinese proverb “wealth shall not pass to a third generation”
.
follows.
The benefits of entrusting corporate governance to business families are less definitive. Theses that family firms have a competitive advantage in longer term thinking or lessen agency conflicts lack empirical support (Bertrand and Schoar, 2006). Empirically support instead suggests family control is a feasible second best solution around dysfunctional institutions, such as weak shareholder rights (La Porta et al. 1999; Burkart, Panunzi and Shleifer 2003) or widespread corruption (Khanna and Palepu 2000; Khanna and Rivkin 2001), which correlate strongly with families dominating big business (La Porta et al. 1999; Fogel, 2007). Family firms also perform better in less developed economies (Khanna and Yafeh, 2007) and worse in more developed conome ies (Bennedsen et al. 2007; Morck, Wolfenzon, and Yeung, 2006).
Japan is a highly developed economy with solid institutions, and its big businesses are generally thought professionally managed (Porter, 1990). However, using a panel of nearly all nonfinancial firms listed from 1949 (when stock markets reopened) through 1970, and followed until 2000, we find inherited family control commonplace in large Japanese businesses. Moreover, we show firms controlled by heirs to outperform like professionally managed firms. These results are highly robust and an analysis of succession events suggests family control “causes” good performance, rather than the converse.
To explain this seeming paradox, we highlight two unique facts about Japanese family businesses. First, business families in Japan continue to practice a form of arranged marriage called omiai, literally meaning “arranged seeing”, where the girl meets an approved groom, selected by the family business patriarch for business acumen. Second, Japanese families commonly adopt an adult son if nature provides either none or inadequate natural ones. Business families often select such adopted sons from the ranks of their most promising top managers. The firm, the “new” son usually takes the family name in a legal adoption process, swears allegiance to his new ancestors, and in most instances also marries a daughter of the current patriarch – hence the Mitsui patriarch’s quip above. Adult adoptions are commonplace in Japan, but rare elsewhere in Asia and the West. This Japanese propensity to adopt highly successful adults, rather than needy children, evokes stiff rebuke from foreign child advocates and researchers alike.1
We postulate that adult adoption invigorates family firms in two ways, thus explaining the above paradox. First, adult adoptions mitigate the suboptimal succession problem in Burkart et al. (2003): having drawn blood heirs from the far left tail of the talent bell curve, a business family can recover by adopting a top manager as a more able son. This presumably attenuates the lower talent
1 See e.g., Hayes and Habu (2006), who the effect of adoptions on child welfare as “questionable” in Japan.

tail of observed heirs and broadens the upper tail. Second, unlike their peers in foreign family firms, Japanese professional executives can aim for the top job of “heir” a prize not normally considered in discussions of Western family firms. Finally, blood sons, knowing adopted adult sons can displace them, dare not let their talents and energies be deadened. As the threat of a hostile takeover, rather than its actual occurrence, spurs professional managers to efficiency; the threat of displacement by a “better” son may well mitigate the Carnegie conjecture.
We posit that these effects explain the incidence and prosperity of large old‐money family firms in postwar Japan. Elsewhere (Mehrotra et al. 2009), these considerations lead us to speculate that selecting sons‐in‐law for business acumen might reproduce some of the positive effects of adopting talented outsiders into a business family, and that arranged marriages might thus be an important institution behind the prevalence of family firms in many more conservative societies .
The remainder of the paper is organized as follows. In section 2 describes Japanese adoption practices and highlights their stark distinctions from those of other countries – Western and Asian. Section 3 describes our data and variables; and section 4 contains our empirical test results. Section 5 concludes.
2. Family Firms and Trad tion Differences between Japan and other countries are easily exaggerated. However, Japan unquestionably has a very unique concept of adoption, and this provides a unique set of institutional constraints around family firms.
Japanese i s
2.1 Pitfalls of Dynastic Corporate Governance, and a Japanese Solution Dynastic corporate governance is subject to two fundamental problems: heirs who do not inherit business acumen and heirs whose upbringing renders them unqualified.
Leading a great business requires intelligence; though of a form clearly different from the general intelligence measured by IQ tests. Business acumen probably depends on social or emotional intelligence (Thorndike, 1920; Payne, 1983), and perhaps other traits (Gardner, 2007), complementing general intelligence (Cote and Miners, 2006). Business acumen, like other human characteristics, is likely subject to “regression to the mean”. That is, outliers with extreme traits arise occasionally, but each successive generation of the family’s progeny average ever closer to the global population mean (Galton, 1886). General intelligence is, at most, only partially inherited (Herrnstein and Murray, 1994; Heckman, 1995; Devlin et al. 1997), so it seems implausible that
un in
2
business intelligence would reliably r families.
Another reason for positing a competitive disadvantage to hereditary corporate control arises from recent work showing that the CEO labor market is efficient in offering high compensation premiums for slight edges in talent because this induces tournament competition for the top job (Lazear and Rosen, 1981; Demsetz, 1996). This is important for two reasons. First, a small edge in CEO talent applied over the assets of a large firm is plausibly an economically significant competitive advantage for the firm (Frank and Cook, 1996). But more importantly, a tournament to become CEO elicits effort from middle and lower‐level executives who aspire to the top job. Restricting the pool of CEO candidates to family members should be costly on both counts: First, the most talented potential CEO in the family is unlikely to be better than the most talented potential CEO in the population. But more important, professional executives working for the family firm are not eligible for the tournament and their effort is correspondingly lessened, or less aligned with the firm’s prosperity if the ambitious executive must contemplate switching employers to have a shot at the top job.

3
A third reason for doubting the efficacy of dynastic corporate governance is the so‐called “Carnegie conjecture.” Arguing that the wealthy should bequeath their fortunes to schools, libraries, parks, music halls, and the like, the US steel tycoon Andrew Carnegie (1891) writes: “the parent who leaves his son enormous wealth generally deadens the talents and energies of the son, and tempts him to lead a less worthy and less useful life than he otherwise would.” Concluding that inherited wealth is destructive to both the heir and society, Carnegie argues that those who accumulate great fortunes have a duty to redistribute their wealth during their lifetimes to leave a egacy ol f elevated social welfare.
Empirical studies in developed economies generally find heir‐controlled firms to underperform significantly (Morck et al. 1988, 2000; Bertrand and Schoar, 2006; Bennedsen et al. 2007; Villalonga and Amit, 2007; Miller et al. 2007; and others). Studies to the contrary generally use extremely broad definitions of “family firms” (Bertrand and Schoar, 2006) – for example, Anderson and Reeb (2003) number founder‐controlled firms such as Berkshire Hathaway and Microsoft among ”family firms”. Inherited corporate control clearly “causes” depressed performance because firms’ share prices drop immediately upon the news of the CEO job passing to an heir (Smith and Amoako‐Adu, 2005; Perez‐Gonzalez, 2006; and others). Holtz‐Eakin et al. (1993) find evidence supporting the “Carnegie conjecture” by inferring “deadening” from heirs’ US tax returns before and after receiving legacies. Business historians Landes (1949) and Chandler (1977) some countries’ superior economic performance to their professionalized big business sectors outpacing economies still relying on family firms. Family firms in developing economies, in contrast, are often found to exhibit superior performance (Khanna and Palepu, 2000; Khanna and Rivkin, 2001); perhaps reflecting a dearth of trained professional managers, family connections substituting for dysfunctional markets, or the value of business families’ political connections (Morck et al. 2005). Despite a preponderance of theory and evidence panning dynastic corporate governance, the persistent dominance of very large family firms in most economies remains a puzzle (La Porta et al. 1999; Landes, 2006). This stylized fact suggests the existence of solutions to the pitfalls of dynastic corporate governance.
The great Tokugawa era merchant families ‐ the Mitsui and Sumitomo especially ‐ found workable solutions to these problems in adoptions, arranged marriages, or both. For example, the Sumitomo mixed adoptions with arranged marriages. Thus, Masatomo Sumitomo (1585‐1652) arranged his daughter’s marriage to his nephew, Tomomochi Soga, who replicated foreign copper smelting techniques. Using Sumitomo money, and taking the Sumitomo name, he founded a copper refinery that bankrolled the family for centuries.
Other business families also used arranged marriages and adoptions of sons‐in‐law to bring talented men into the family – and some reputedly valued marriageable daughters more highly than sons (Morikawa, 1992, p.53). Many daughters, after all, let the patriarch select top businessmen as sons‐in‐law, and then make the best among these his son.2 Arranged marriages feature in family businesses elsewhere (James, 2006; Landes, 2006), but adoption as a form of executive compensation is (as far as we know) a uniquely Japanese invention.3
2.2 Japanese Adoption Practices With this distinctly mercantile ethos well‐preserved, adoption remains common in modern Japan. Paulson (1983) reports that 30% of her survey respondents respond affirmatively that “an adoptee
2 en For example, the Suzuki family has adopted sons-in-law in the past and promoted them to top management ev
when own blood sons were available for the position. 3 Chen (2004) suggests that the uniquely Japanese custom of using adoptions as a successor strategy can explain differences between Japanese and other Asian business groups.
4
was among their relatives”. Comparative statistics are difficult because many countries keep adoptions confidential, but Yamahata (1977) estimates adoption far more popular in modern Japan han in et any other country, with the possible exception of th United States.
However, most U.S. adoptees are children, while Japanese adoptees are overwhelmingly adults. Moriguchi (2007) reports that 2.5% of U.S. children are adopted, the highest rate per capita in the world: 31.4 per 1000 births, or 127,000 adoptions (Child Welfare Information Gateway, 2004)4 in 2000. This compares with only 1.6 child adoptions per 1000 births in Japan that year. Of the 80,790 adoptions reported in Japan in 2000, only 1,718 were of children; and all but 362 of these were by grandparents or step‐parents. The other 79,072 adoptions, 97.9% of the total, were f adulto s by adults.
Since 1988, the law permits two forms of adoption (yôshi).5 One form, special adoption (tokubetsu yôshi), resembles Western practices, and permanently transfers a child younger than six (eight in certain foster care cases) to adoptive parents. A special adoption severs all legal links between the child and its biological parents, and is designed to advance the welfare of a needy child (Hayes and Habu, 2006). This is a new, imported, and rarely used procedure. The courts approve
d 350 in 1995, 20 0, and 2002, ectively.6only a few hundred each year in Japan – 521, 362, an 0 resp
The traditional form of adoption, now called ordinary adoption (yôshi engumi or fûtsu yôshi), remains far more common. The adoptee is usually an adult male who, in return for an inheritance, agrees to carry forward the adopting family’s name. Both parties to the adoption transaction must be above the age of consent (over 15) or court approval is required – except for adoptions of one’s grandchildren or step‐children (Civil Code §798). The adopted heir must also be at least a day younger than the adoptive parent. Adoptees’ average age at adoption is over twenty, and the vast majority of adoptions registered in Japan each year between consenting adults (Bryant, 1990, p. 300). Elsewhere, adult adoption is vanishingly rare (Kitsuse, 1964).7 O'Halloran (2009) notes that Japan’s “…continuing tradition of providing for the adoption of adults, is without any comparable recedent among developed nations.” p
[Table 1 a out here] b
Table 1 summarizes these patterns in adoptions through the postwar period. More recent statistics show much higher rates of adult adoption than earlier in the postwar period, averaging 97 to 98% from 1985 on. Thus, of the 83,505 adoptions registered by Koseki offices in 2004, only ,330 (21 %) were of children. The higher rates of child adoption in the years immediately following the war are perhaps due war orphans. Ordinary adoption sanctifies the voluntary severing of most, but not all, ties to one’s birth parents and their replacement with fealty to one’s new parents. The adoptee may often remain in
4 See www.childwelfare.gov/adoption. 5 This discussion follows Hayes and Habu (2006, ch. 1). 6 Hayes and Habu (2006, Table 2, p 137) and Ninomiya (2006, p. 192). 7 The Common Law, from which most English speaking countries derive their legal systems, initially did not sanction adoption. Although the practice occurred informally, adoptees could not inherit unless named as heirs in a legal will. Legislation permitting legal adoptions passed in the mid‐19th century in the United States, and in 1926 in the United Kingdom (Bryant, 1990, n. 6) Adult adoption, though legal in 47 U.S. states and the District of Columbia, remains rare and controversial for allowing the circumvention of gay marriage restrictions (Paveno, 1987). Thus Wadlington (1966, p. 409) thunders that "our present system adoption is designed to create through artificial means something resembling as closely as possible a normal parent‐child relationship and not a freak or totally new form of relation."

contact with his birth parents, and may even inherit from them. If the adoptive relationship is disrupt urn to his bed, the adopted child may ret iological parents.
Calling ordinary adoption a transaction is appropriate, for Hayes and Habu (2006, pp. 2‐3) explain that “in Japanese society there continues to be a vein of unsentimental pragmatism towards adoption arrangements. There is a fairly widespread view that it is ethically acceptable for parents to become adopters for worldly objectives, even if they do not intend from the outset, to love the child as their own.” Lebra (1989, p. 203) clarifies that “nurturance and intimacy were secondary or irrelevant to the mandate of professional succession, and often were completely absent from the adoptive relationship – even where the adoptee was destined to become the new head of the household.”8
Most ordinary adoptees are of adult sons (Paulson, 1984, p.165, 289) because the practice is designed to rescue biologically ill‐fated families, not to provide for a needy child.9 Hayes and Habu (2006, p. 1) elaborate: “Adoptions can be used to reconstruct patriarchal families. Families with superfluous sons would pair them off in a combined marriage and adoption to families with daughters.” Since the incest law only proscribes sex between biological siblings, a daughter and adopted son may marry. That a term, muko yôshi, exists to describe a husband‐who‐is‐also‐an‐adopted‐brother indicates this to be an accepted and relatively commonplace form of adoption; and Paulson (1983) reports 55% of adoptions in 1981 to be of sons‐in‐law. Of course, if a desirable potential son is already married, an adult married couple can also be adopted in a single transaction.
Parents who adopt adult sons either lack biological sons or desire better quality sons than nature provided. Although Nakane (1967) argues that families seldom disinherit biological son in favor of an adopted son, subsequent ethnographic work convincingly refutes this. Beardsley et al. (1959) report at least one instance of adopted sons superseding biological sons in the histories of 25% to 33% of rural families; Pelzel (1970) estimates its frequency at 25%, and Bachnik (1983) puts its incidence at 34%. Pre‐modern records indicate even higher frequencies (Bachnik, 1983, p. 163).
The patriarch of a family business can thus adopt a new son, say a star manager, should his biological sons prove uninterested or incapable of honoring the family name. This occurs with some regularity (Paulson, 1984, 165‐75; Kurosu, 1998; Hayes and Habu, 2006, p. 2). In this context, translating yôshi as adoption might be confusing. Terms like protégé or successor seem at least as appropriate as adopted son – the standard translation. Similar relationships, between family business patriarchs and favored junior associates who become “like sons”, may well occur less visibly in Western countries.
This echoes a linguistic ambiguity as to what constitutes a family versus a firm. A Japanese family business is referred to as a house (ie or 家), as in the House of Mitsui; but ie can also mean family or household.10 This conflation also occurs in West, as with the House of Windsor and J.P. Morgan’s 19th century investment bank, the House of Morgan (Goodman, 2000, p. 20). Repackaging a business as a family is readily dismissible as “an ideological obfuscation created by those at the top of the economic hierarchy.”11 But something more is clearly going on where a top manager subsequently becomes the head of an adopting family as well as that family’s businesses.
8 Quoted in Hayes and Habu ( 2006, p. 11) 9
5
The remainder include minors as well as adults of both genders, but the vast majority are presumably males. A stigma attaches to adopting females because of past abuses.
10 World War II (Oppler, 1976, pp. 116‐120); but Bachnik (1983) outlines its the difficulties this causes translators.
The ie lost its legal status aftercontinued informal usage and
11 Hayes and Habu (2006, p. 12)
It is tempting to see adoption as a liberal adaptation allowing “competent individuals to surmount rigid social barriers” in Japan’s hierarchical society (Burke, 1962, p. 108‐9). Haynes and Habu (2006, p. 12) more warily suggest that “the overlap between family and business concerns, potentially at least, forms an integrated social ethos in which the aspirations of a powerless child can find a place.” Although, they caution against pressing this too far, noting that many ordinary adoptions are within extended families, Macfarlane (2002) notes that “those who were adopted were not necessarily or even primarily blood relatives” and cites several studies that support the view that “adoption became a mechanism for social mobility” in pre‐modern Japan.
The Japanese government restricts adult adoption for fiscal reasons. The 1988 revision to the tax law prevents testators evading inheritance taxes via multiple adoptions. Thenceforth an adopter with one or more biological children may bequeath to one adoptee only, and an adopter lacking any biological children may bequeath to two adoptees (Nakagawa, 1991, 89). A parent might still adopt many sons in order to have a broader choice of successors, but since only one may inherit, l ethe supply of eager second, third, and forth adoptees is ikely to b meager.
Foreigners periodically sought to change Japanese adoption practices, which seemed immoral to Chinese and Western sensibilities alike. Chinese legal imports, beginning with the Taiho Code of 702 A.D., sought to impose Confucian morals restricting adoptions to blood relatives (Mass, 1989, 9‐11, 25, 72). In seeming deference to European sensibilities, Japan’s imported Civil Code (§792‐3) mandates that the adopted child be at least a day younger than the adopting parent (Takenoshita, 1997, p. 9).12 Both sought to fit Japanese pegs into foreign holes. The Taiho Code was soon “improved”, and modern registries sometimes let a younger parent adopt an older child by mis“ take” (Nishioka, 1991, pp. 232‐4).
Foreign criticisms of Japanese adult adoption practices are not entirely groundless. Before the Great War, families adopted children as de facto slaves, sold by their biological parents; and brothel owners adopted their prostitutes.13 Draft dodgers became “only sons” of childless families, and thus escaped conscription (Paulson, 1984, 278‐9). Adult adoptions are also used to hide affaires o o or t circumvent m ney lending laws (Bryant, 1990).
But Japan’s adult adoptions doubtless primarily evoke condemnation because they challenge the conventions of other cultures. Elsewhere in East Asia, adoptions are a duty of blood relatives, but “the more rigid forms of Confucianism have not constrained non‐relative adoption in Japan to nearly the same degree as elsewhere” (Kaji, 1999; see also Bryant, 1990, n. 32).14 This shocked and appalled Confucian traditionalists, like Dazai Shundai (1680‐1747), who deplores Japan's “lawlessness”, and singles out its “barbarous” and “promiscuous” adoptions as “a major example of chaos” (Lebra, 1989, p. 185; quoting Kirby, 1908). In the same vein, the 19th century historian Shigeno Aneki (1887) compares the “evils” of adoption to those of imperial abdication (Lebra, 1989, p. 186).
The above is a vast oversimplification, but conveys the gist of adoption practices as they affect Japanese family businesses. We distill two key economic implications.
First, Japanese family businesses confronted with an heir who is incapable or ill‐disposed to take over the family business can readily adopt a more able son. Adoption lets family firms expand
12 Japan’s adopted Civil Code is frequently described as imposing primogeniture and other Western concepts of inheritance, and Western advisors apparently also believed this (see e.g. Morris, 1894). However, Bachnik (1983, esp. pp. 168‐9) explains at length how the Japanese wording of the Meiji Civil Code clearly
tices. See Wadlington (1966) on the importance of age
6
permits the continuation of traditional adoption prac
71 & 275) differences in U.S. adoption law.
13 Oppler (1976, 113 n 3; Paulson (1983, p. 214 Quoted in Hayes and Habu (2006, p. 11).

7
ewspapers (Nihon Keizai Shimbun, the Nikkei Business Daily, the Nikkei Financial Daily and th
their successor searches beyond biological sons, and even beyond blood kin and in‐laws, to include virtually the same applicant pool a widely held professionally managed firm might tap. In theory at least, Japanese family firms ought to be able to meld such benefits as family ownership confers with the free‐ranging competition among potential successors that helps put the most able managers in charge of professionally‐run firms.
Second, the threat of adoption may induce a greater work ethic in biological children, for “the eldest son too was sometimes forced out into the world, if a more competent younger or adopted son was appointed to succeed to the family property or rights” (Burke, 1962, p. 109). Adult adoptions may thus help counter the famous Carnegie Conjecture that inherited fortunes so deaden initiative and distort perspective as to virtually guarantee failure in running a great business.
3. Data Description We begin with 1,433 non‐financial firms that listed in all Japanese stock exchanges (the Tokyo, Nagoya, Fukuoka and Osaka stock exchanges) from 1949 (when markets reopened after the war to new listings, as well as previously listed prewar firms) through 1970. We follow these firms from 1962, when standardized financial disclosure begins, until 2000 or a delisting, whichever comes first.15 Our need for complete data on each firm’s ownership structure, board, and financial variables during that period cuts the sample to 1,367 firms. Our sample includes 95% of all listed firms during this window.
3.1 Data sources Our ownership data are from the Development Bank of Japan database for 1981 through 2000, as are our accounting data from 1962 through 2000. The Toyo Keizai database provides information on boards from 1989 through 2000. For prior years and years with missing data, we hand‐collect ownership, board, and financial data from hardcopy annual reports available at the Institute of Innovation Research of Hitotsubashi University.
Ownership data disclosed in annual reports include: (1) the stake of each of the top ten shareholders, (2) the combined stake of all banks, and (3) the combined stake of all other corporations. Board data include detailed information on board members’ education (alma mater, major, and graduation year), birth date, year initially hired, year appointed to the board, year made CEO (shacho) and Chairman (kaicho), and prior work experience.
We identify each firm’s founder by consulting the following sources: (1) company archives (shashi) commemorating firms’ anniversaries); (2) Toyokeizai Shimposha (1995), (3) Nihon Keizai Shimbun (2004), and (4) company websites. To identify the family relationship among the founding family members, we use various books published in Japanese: (1) Tokiwa shoin (1977) provides family trees of 1002 business leaders, (2) a series of books published by Zaikai Kenkyusho (1979, 1981, 1982, 1983, 1985) provides the names of family members of the board of listed firms, and (3) the thirty‐eight book volumes published by Nihon Keizai Shimbun (2004) provide biography of 243 top business leaders during postwar Japan. Additional information on family relationships is obtained from the following sources: a number of volumes of equivalent to “Who is Who” published by Jinjikoshinjo, the Nikkei Telecom 21 database of corporate news from 1975 on in the Nikkei n e
15 Between 1970 and 1990, only 31 firms in our sample delist. A further 95 delist from 1991 through 2000. The remarkable longevity of Japanese firms prior to the 1990s corroborates Fogel et al. (2008).
Nikkei Marketing Journal), and website searches. We combine all this information to construct family trees naming all the members of each firm’s founding family, and their relationships to each other. This information lets us identify each firm’s founder(s), ultimate owners, and if each CEO/Chairman is related to the founding family by blood, marriage or adoption.
3.2 Defining and classifying family firms Previous family firm studies have been criticized for overly broad definitions of family firms (Bertrand and Schoar, 2006) that also include firms run by their founders. We therefore use an alternative term, the Japanese word don (ドン, lit. boss) and designate firms run by their founder or their progeny as don firms.16 By “run” we mean that the founder or founding family retains either a significant equity stake or a significant role in management. We consider the individual who establishes a business as its founder. For example, a business established in the Edo period, restructured into a partnership during the early Meiji era, incorporated in the early 20th century, taken public in the 1920s, and relisted in 1949, is founded by the person who first established it in the Edo period. We thus define a don firm as one with a member of its founding family listed among its top ten shareholders or serving in a leadership position: either as CEO (shacho) or Chairman (daihyo torishimariyaku kaicho).17 If only one founding family member fulfills these requirements, we call that person the firm’s don. If more than one founding family member appears in these roles, we define don as the one serving as CEO or Chairman. If both positions are occupied by members of the founding family, we define don as the older. Thus, if a founder is a top ten shareholder, but does not serve as CEO or Chairman, and an heir serves in a leadership position, the heir is classified as on. But if one is CEO and the other is Chairman, we take the older as the don. This is clearly a udgme , in these firmdj nt call, but we presume that s, the heir is the actual decision‐maker.
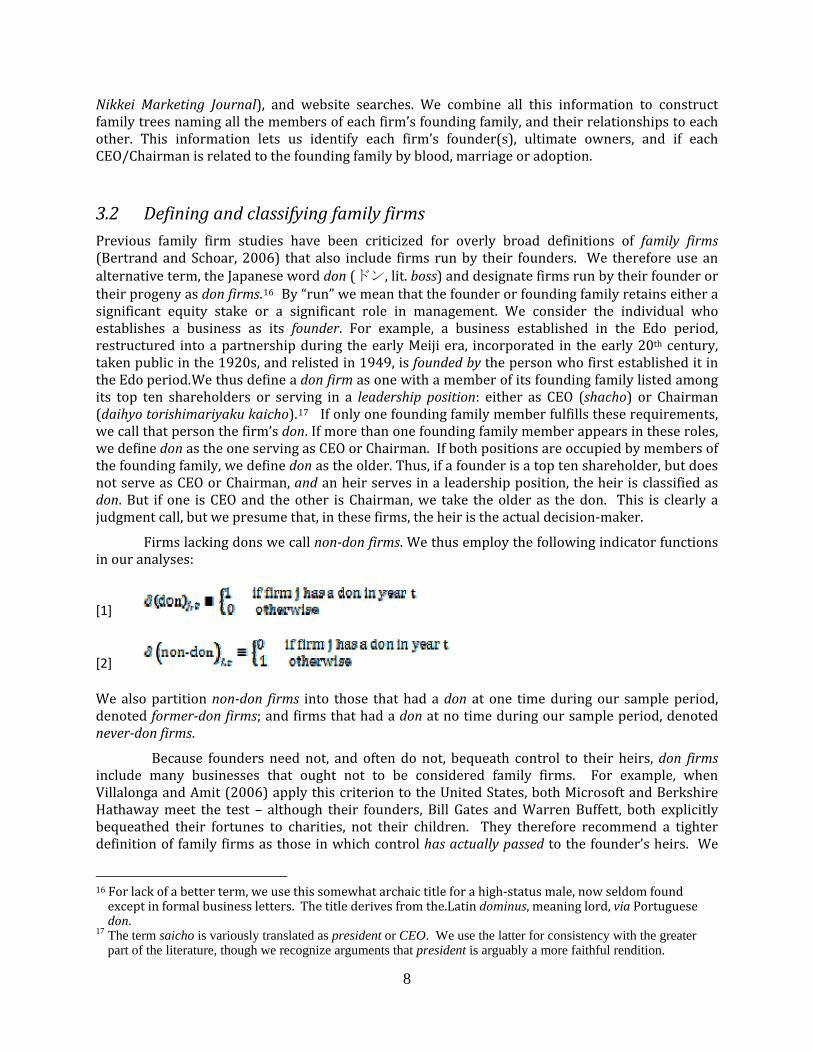
Firms lacking dons we call nondon firms. We thus employ the following indicator functions in our analyses:
[1]
[2] We also partition nondon firms into those that had a don at one time during our sample period, denoted formerdon firms; and firms that had a don at no time during our sample period, denoted neverdon firms.
Because founders need not, and often do not, bequeath control to their heirs, don firms include many businesses that ought not to be considered family firms. For example, when Villalonga and Amit (2006) apply this criterion to the United States, both Microsoft and Berkshire Hathaway meet the test – although their founders, Bill Gates and Warren Buffett, both explicitly bequeathed their fortunes to charities, not their children. They therefore recommend a tighter definition of family firms as those in which control has actually passed to the founder’s heirs. We
16 For lack of a better term, we use this somewhat archaic title for a high‐status male, now seldom found except in formal business letters. The title derives from the.Latin dominus, meaning lord, via Portuguese don.
17 The term saicho is variously translated as president or CEO. We use the latter for consistency with the greater part of the literature, though we recognize arguments that president is arguably a more faithful rendition.
8

therefore denote true family firms as those whose current don is the previous don’s heir. This narrower definition understates the incidence of family firms, for it excludes firms run by founders who do not plan to pass control to their heirs. However, it has the virtue of including only firms unambiguously identifiable as family firms. Other don firms – those still run by their founders – we call founderrun firms. We formalize this with the indicator variables
[3]
[4]
Finally, we partition true family firms into subcategories according to the position of the current don and his relationship to the previous one. A firm whose current don serves as CEO or chairman and is the previous don’s biological son we call a blood heir firm. A firm whose current don serves as CEO or chairman and is the previous don’s adopted son or son‐in‐law we call a nonblood heir firm. Our data include no instances of daughters taking over. A third category of true family firm arises where a biological heir ranks among the top ten shareholders, but delegates both he CEOt and Chairman positions to professional managers. These we denote sarariman firms.18
Our data contain no non‐blood heirs adopted as children, consistent with the rarity of this practice. Almost all of the legally adopted heirs in our sample also marry a daughter of the founding family. We have two instances of control passing to an ordinary adoptee who is not also a son‐in‐aw. l
We therefore designate firms whose current dons are their previous dons’ sons‐in‐law as a second category of nonblood heir firms. This is justifiable if the dons impose arranged marriages on their daughters, but may be problematic if daughters chose their own mates. The former assumption is reasonable because arranged marriages (omiai), in which dons select husbands for their daughters on the basis of business advantage, remains commonplace in Japanese business amilies (Hamabata (1991) and Kerbo and McKinstry, 1995). f
[5]
[6]
[7]
We do, however, have 20 cases in which founders are succeeded by temporary sarariman CEOs, who are subsequently succeeded by a blood or non‐blood heir. Inspection of news reports describing these cases make the temporary status of these transition CEOs clear: they are minding the firm while grooming the designated heir, or while the designated heir concludes other businesses or commitments before taking charge of the family firm. Examples are Toyota Motors
9
18 The Japanese term for a professional manager is sarariman, from the English “salary man”. The term connotes an executive who works long hours, but does not control his destiny.

and Canon. These interim CEOs are not considered heirs, nor are they on par with sarariman CEOs in a chain of sarariman CEOs, providing professional management over the long term. Therefore we dropped these cases from our sample.
The partition of family firms in [5], [6], and [7] raises the issue of whether non‐blood heirs – adopted sons or sons‐in‐law – should be identified as an alternative to heirs or an alternative to sarariman CEOs. We explore this by comparing the tenures of the three categories of successor. Founders unsurprisingly remain at the helm longest: serving for a mean tenure of 30.23 years and a median tenure of 30 years. Sarariman CEOs in family firms have the shortest tenures: averaging only 6.31 years with half gone after 5 years. However, blood and non‐blood heirs’ tenures are essentially identical: blood heirs average 18.74 years and non‐blood heirs average 18.4 years; half of blood heirs are gone after 16 years and half of non‐blood heirs are gone after 17 years. We conclude that non‐blood heirs’ control positions are as secure as those of blood heirs, and that both are far more secure than the positions of sarariman CEOs.19
The number of don firms varies by year. For example, the initial 1962 cross‐section of our panel contains a total of 1,060 firms. Of these, 37% are don firms, and the remaining are non‐don firms. Of the don firms, we classify 17% as founder‐run and the remainder (20%) as true family firms. Of the true family firms, 41 are run by non‐blood heirs – comprising almost a fifth of family firms and 4% of the full sample. Of the non‐blood heirs, 22 are adopted sons, all of whom also marry the previous don’s daughter, and the remaining 19 are sons‐in‐law who are not formally adopted.
By the end of our analysis period, in 2000, don firms represent 31% of the total sample, down from 37% in 1962. Founder‐run firms decline to less than 1% by 2000 (as founders retire or pass away). True family firms represent about 30% of the sample in 2000 (about the same level from 1980 onwards). Non‐don firms represent almost 70% of all firms in 2000.
The total fraction of don firms in Japan resembles the fraction of “family” firms reported among U.S. Fortune 500 reported by Anderson and Reeb (2003), whose definition of family firm resembles ours for don firms. Thus, while neither America nor Japan is usually considered an economy of family firms; dons, and perhaps their heirs too, may be more important than generally accredited in both countries.
When family firms are defined as those controlled by second or later generation heirs, only 7% of the Fortune 500 firms in Villalonga and Amit (2006) qualify. This is substantially less than our 30% figure for inherited family control in all listed Japanese firms; however, our sample includes all listed firms. Family control in postwar Japan is clearly economically significant – a fact generally not acknowledged in discussions of Japanese corporate governance.
3.3 Variables We measure several dimensions of firm performance. A multidimensional approach is needed because Japanese law does not mandate that firms be run to maximize shareholder value, and because banks and employees interests are often posited to trump those of shareholders (Porter et al., 2000). We describe each variable in turn. Summary statistics are displayed in Table 2. Robustness checks using alternative definitions of the variable are deferred to section 4.4.
19Studying S&P 500 firms from 1992 through 2004, Coates and Kraakman (2007) report the mean tenure of hired
CEOs to be 5.5 years and that of equity control blockholder CEOs to be 13.4 years.
10
11
[Table 2 about here]
Firm valuations We gauge shareholder valuation by a firm’s Tobin’s average Q ratio (Q) ‐ its market value to investors divided by its replacement cost. This is essentially the firm’s value to shareholders divided by the value of its measurable physical assets. A higher Q means the firm’s value is augmented by greater net intangible assets – presumed, partly at least, to reflect superior past management and superior expected future management. Average Q ratios, relative to industry benchmarks to exclude factors beyond managers’ control, are therefore sensible measures of the uality o t n o 8 r nq of c rpora e gover ance (M rck et al. 19 8; Gompe s et al. 2003; Bebchuk a d Cohen, 2005) when stock markets are passably efficient, and perhaps even during bubbles. We define market value as the price of the firm’s stock times the number of shares utstan book value of io ding plus the ts total liabilities. This values control blocks at public share prices. We estimate replacement cost as the book value of total assets plus adjustments for equity holdings and real estate. Almost ten percent of the assets of the typical firm in our sample are shares in other firms, and these are carried at historical cost. We therefore multiply the book value of a given firm’s equity holdings in a given year by the cumulative return of the Nikkei Index from when the equity was acquired to the present. To estimate the age of equity holdings, we look at all past acquisitions and disposals of equity, and assume that the most recently acquired shares are the first to be disposed of. Nominal sales are used throughout because inflation remained very low throughout the postwar period. Real estate holdings, also carried at book, are adjusted analogously using the Japanese Real Estate Index.
Current profitability
Our second performance measure is each firm’s return on assets (ROA), defined as operating income divided by replacement cost, as estimated above. Operating income is earnings before interest costs, tax, and depreciation and amortization. This figure captures a firm’s current profitability, a easure of short‐term financial performance. m
Sales growth
Many scholars argue that Japanese firms, at least for a large part of the postwar period, competed to gain market share, rather than augment profits or shareholder value.20 Regardless of the social welfare implications of such alternative objective functions, the degree to which different categories of our firms deviate from value maximization is of interest. We therefore examine sales growth rates as an alternative performance measure. We define sales growth as the logarithm of the firm’s current year sales less the logarithm of its sales one year earlier.
Employment growth
Another common argument is that Japanese firms’ objective is employment, rather than shareholder value (e.g. Geringer et al. 1999). Again, knowing the extent to which different categories of our firms deviated from value maximization is of interest. We therefore examine labor force growth rates as another alternative performance measure. We define employment
20 See, among others, Abegglen and Stalk (1985), Johnston (1995), and Tsuru (1996).

growth as the logarithm of the firm’s current year number of employees less the logarithm of the umber of its employees one years prior. n
Control variables
The statistical tests in the next section require various controls. Industry indicator variables are defined using the 2‐digit industry classification code in the Development Bank of Japan data. Leverage is long‐term debt scaled by estimated replacement cost. Capital expenditure for year t is defined as the change in fixed assets from year t1 to year t, plus depreciation in year t. It is scaled y total
b sales in year t.
Firm age is measured from the year of incorporation of the firm. Firm size is defined as the logarithm of replacement cost. Risk is measured as the standard deviation of monthly stock returns sing the lagging three years of stock prices. This variable is used in certain robustness checks. u
4. Findings 4.1 Subsample comparisons Our first sets of statistical tests, shown in Table 3, contrast dimensions of firm performance across differently controlled firms. Across the board, founder‐run firms are the best performers, followed by non‐blood heir‐run firms. Though non‐don firms are the largest of all, non‐blood heir‐run firms are substantially larger than all other don firms. However, they are not greatly different in terms of leverage. Unsurprisingly founder‐run firms are younger than all other categories, and also less widely held, though non‐blood heir‐run firms are the second least widely held category. Our sample s very nearly equal to the full population of listed Japanese firms, so the numbers in Table 3 are ssentially population means, and thus m rmal statistical tests. ie eaningful without fo
b
[Ta le 3 about here] To compare performance across these categories formally, we perform t‐tests across ategories, controlling for year and industry fixed effects, clustering residuals by firm to compensate or longitudinal persistence. To do this we run regressions of the form cf
8] [ tjiiss
K
tikitj etjihtdkba ,
2638
)),(()()( +⋅+⋅+⋅+= ∑∑∑ δδδπisk 111
,,===
where tj ,π is firm j’s performance in year t (in terms of one of ROA, Q, sales growth or labor force growth); the tik ,)(δ are a proper subset of indicator variables [1] through [7], with k one of founder, blood heir, non‐blood heir, or non‐don. The δs are year fixed effects; the δi are industry fixed effects; and the e are residuals, clustered by firm. The t‐tests are to reject the null hypothesis that a coefficient , and
j,t
bk is zero are displayed in Table 4.
In terms of profitability and shareholder valuation, founder firms statistically significantly outperform every other category of firm except non‐blood heirs, whose firms perform statistically indistinguishably from founder firms. Founder firms significantly outperform non‐blood heir firms only in sales and labor force growth rates. This is unsurprising, since Table 2 shows non‐blood heir firms to be substantially larger (¥164B versus ¥58.2B) and older (43 versus 29 years since founded), and are thus plausibly less prone to very rapid growth.
12

The panel using nondon firms as the benchmark shows family firms (don firms excluding founder firm) outperforming non‐don firms across the board. Notably, this performance premium rests primarily upon blood heir‐run firms and non‐blood heir run firms, not on family firms run by professional sarariman CEOs. The second panel, using firms run by their founders’ blood descendents as the benchmark, confirms that founders outperform founders’ progeny across the board; but that blood heirs outperform all categories of firms save those run by non‐blood heirs. Non‐blood heirs outperform or tie all categories save founders, and sarariman firms outperform no other category at all, and lag all other classes of don firms. Sarariman‐run family firms’ performance is statis y indistinguishable from that of non‐don firms. ticall
[Table 4 about here]
4.2 Regressions controlling for firm characteristics able 5 expands upon the results in Table 4 by controlling for firm characteristics: size, leverage, apital spending, and age in regressions of the form Tc
[9] tjiis
ssn
tink
tiki ,11
,1
,===
where tj ,
i
NK
tj etjihtdxckba26
1
38
, )),(()()( +⋅+⋅+⋅+⋅+= ∑∑∑∑=
δδδπ
π is one of our firm performance measures, the )(kδ are some proper subset of the firm‐
control indicator variables [1] through [7], the xj,t are control variable, the δt are year fixed effects, the δ ari e industry fixed effects, and the ej,t are residuals, again clustered by firm.
As in Tables 3 and 4, founder‐run firms and family firms both significantly outperform non‐don firms in all dimensions. Larger firms and firms with more aggressive capital budgeting generally utperform, while more leveraged firms and older firms generally underperform. o
[Tables 5 and 6 about here]
After controlling for these firm‐level characteristics, in addition to industry and year fixed effects, and again clustering residuals by firm, Table 5 reconfirms the superior performance of founder and family firms across all dimensions of firm performance.
Table 6 replicates the regressions in Table 5, but using different firm categories as the benchmark for statistical comparison. The pattern of signs and significance levels in Table 6 is little different from that in Table 4.
In terms of profitability and shareholder valuation, founder firms statistically significantly outperform every other category of firm except non‐blood heirs, whose firms perform statistically indistinguishably from founder firms in terms of accounting profits and shareholder valuations. As in Table 4, founder firms significantly outperform non‐blood heir firms in sales and labor force growth rates. Since firm size and age ae among the control variables in Tables 5 and 6, neither of these factors can explain the high growth rates of founder firms. This suggests that the founders of firms that list during their founders lifetimes are an unusual class of people, perhaps possessing a
13
scarce entrepreneurial talent (Knight, 1921; Hayek, 1945; Schumpeter, 1950).
The panel using non‐don firms as the benchmark again shows non‐founder family firms outperform non‐don firms across the board, save that non‐blood heir firms no longer outgrow non‐

don firms. The margin by which non‐blood heir firms outperform non‐don firms in terms of accounting profits and shareholder valuations now exceeds that for blood heir firms; and this difference is highly significant for accounting profits – though not for valuations. After controlling for size, age, leverage, and capital spending, non‐blood heirs match or surpass blood heirs. Sarariman‐run family firms’ performance again lags that of the other two types of family firm, with erformance statistically indistinguishable from that of non‐don firms. p
4.3 Causality The t‐test and regression results above demonstrate a set of positive correlations between firm performance and family control. However, causation could run either way. Non‐blood heirs might replace biological sons in the negative tail of the talent bell curve; and the threat of being replaced by a non‐blood son might blunt the deadening of talent Carnegie (1899) postulates afflicting heirs o greatt fortunes.
But converse causality is also possible. A current don might be more prone to pass control to a beloved son if the firm is running more smoothly; and the son might covet control of a better performing family firm more earnestly (Bennedsen et al. 2007). Smith and Amoako‐Adu (2005) and Perez‐Gonzalez (2006) overcome this endogeneity problem with event studies that show stock price declines upon the announcement that control is to pass to a son, rather than a professional manager, in Canadian and US family firms, respectively. Bennedsen et al. (2007) overcome the problem by noting that family succession is more likely, independently of firm performance, if the old don’s firstborn child is a son, rather than a daughter. This lets them infer that inherited
lcorporate control causes poor performance in Danish fami y firms.
We lack the precise succession announcement dates used by Smith and Amoako‐Adu (2005) and Perez‐Gonzalez (2006), so we cannot perform precise abnormal stock return event studies; and we lack information on the gender of dons’ firstborn children, so the technique of Bennedsen et al. (2007) is also unavailable to us. We therefore develop a set of endogeneity tests that utilize information we do possess about controlling families and employ an event study methodology.
We define the succession event as one where control is transferred from a don firm to a successor who may be either part of the family (via blood line or via adotion), a sarariman, or an outsider in cases where the founder or his heirs decide to exit the business. We identify 918 such succession events with incumbent founder or family control. We drop 18 cases where control shifts from a founder to a co‐founder, 130 cases where succession involves either an incoming or outgoing temporary sarariman, and 117 cases where the succession event was within 7 years of a previous succession event. This leaves us with 653 succession events where control is transferred to either a founder or family nominee or to an outsider via a sell‐off. We lose another 228 firms for lack of family structure data, leaving us with a usable sample of 425 succession events. These are listed in the first two columns of Table 7.
The most common succession events – 57% of the total – are to blood heirs, reinforcing the importance of traditional family firms in Japan. However, almost one in ten family firms opts for non‐blood heirs; and almost one in five turns management over to a sarariman and becomes a seemingly passive investor. In over 85% of successions, the family thus remains – either in charge r as a blockholder. The family cashes out in less than 15% of successions. o
14
[Table 7 about here]
Our strategy is to look at performance increases around succession events, and regress these cross‐sectionally on indicator variables for the different types of succession shown in Table 7.
un regressions of the form
j
'
That is, we r
[10] ji
iis
ssn
jnk
jkk ejihtdxckba +⋅+⋅+⋅+⋅+=Δ ∑∑∑∑==== 1111
))(()()( δδδπ
where the xj are control variable, the δ(t) are succession year fixed effects, set to one if succession j occurs in year t and to zero otherwise; the δ(i) are industry fixed effects; and the ej are residuals. We ow thi j cces c
el o
ISNK
n nk of the as indexing su sions rather than firms. In fa t, some firms have more than one succession event in our long pan f data. We return to this issue in the robustness section below.
The dependent variable, jπΔ , is the change in one of firm j’s performance measures. That is, Δπj can be any one of ΔROAj, ΔQj, Δsalesgrowthj, or Δlaborgrowthj. Differences are the average over the two years following the succession event year minus the average over the two years prior to the succession event. Performance during the succession event year is excluded because we cannot date the successions precisely. The two‐year window corresponds to the standard interval between newa i theirs bo d. re ls of Japanese CEO s’ posit ons by ar
The control variables, xj, include firm size, firm age, leverage, and capital expenditure. We include these because larger, older, less leveraged firms plausibly have more stable performance over time, and because firms with larger capital budgets allow greater scope for unqualified CEOs to cause damage. Succession year fixed effects should remove macroeconomic factors, and industry fixed
lateeffects should remove industry related performance trends, also plausibly unre d to the effects of succession.
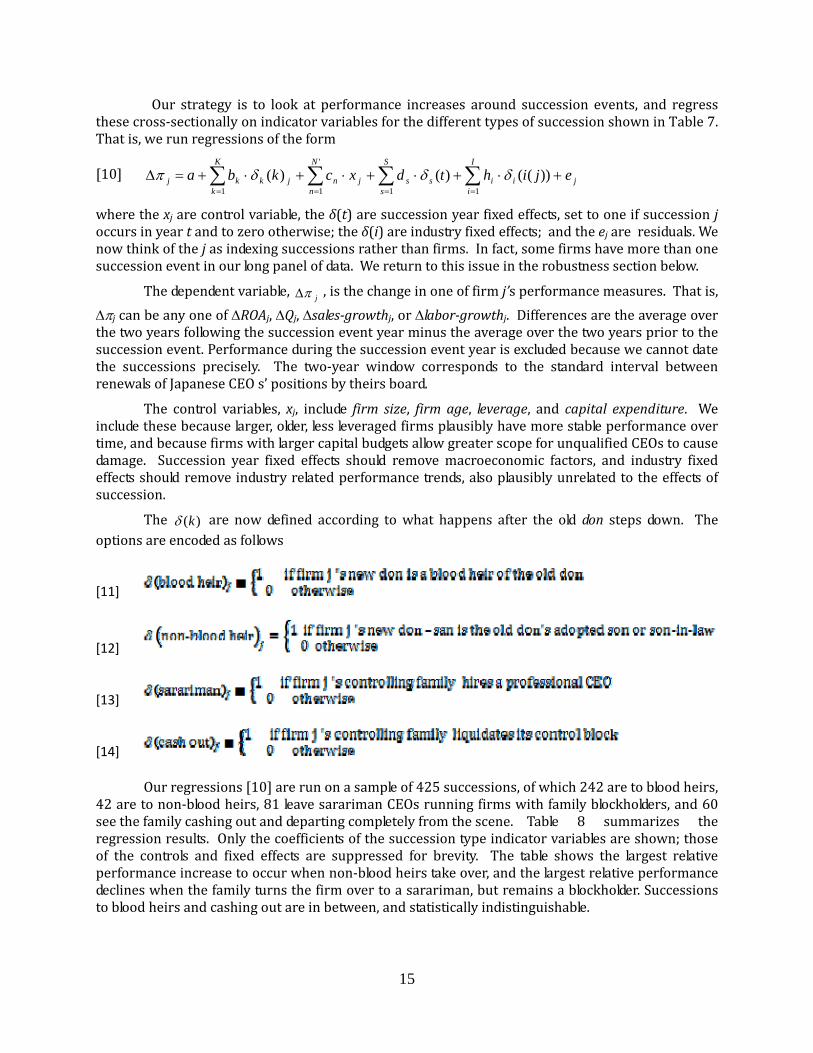
The )(kδ are now defined according to what happens after the old don steps down. The options are encoded as follows
[11]
[12]
[13]
[14] Our regressions [10] are run on a sample of 425 successions, of which 242 are to blood heirs, 42 are to non‐blood heirs, 81 leave sarariman CEOs running firms with family blockholders, and 60 see the family cashing out and departing completely from the scene. Table 8 summarizes the regression results. Only the coefficients of the succession type indicator variables are shown; those of the controls and fixed effects are suppressed for brevity. The table shows the largest relative performance increase to occur when non‐blood heirs take over, and the largest relative performance eclines ad when the family turns the firm over to a sar riman, but remains a blockholder. Successions to blood heirs and cashing out are in between, and statistically indistinguishable.
15

However, the pattern is strongest in current ROA, the most short‐term of our performance measures, and weakest in Q, the most forward looking. This raises endogeneity concerns: perhaps non‐blood heirs are chosen more often good times; perhaps sarariman CEOs are hired by family firms when bad time mily member dares step in.
by firms anticipatings are ahea and no fad
[Table 8 about here]
To explore these issues, we estimate two‐stage least squares (2SLS) analogs to the regressions in table 8. Our first‐stage multinomial probit regressions use exogenous instrumental ariable jk , ; and the second tage re ator variables, the v s to estimate the probabilities of different sorts of successions, denoted δ̂
gressions substitute these probabilities for the actual succession indicsjk )(δ in [10], in specifications otherwise identical to those used in Table 8. Our 2SLSprocedure thus uses multinomial probit regressions of the form
[15] ji
is
s
N
njn
M
mjmmj ujihjtdxczgk +⋅+⋅+⋅+⋅= ∑∑∑∑
====
26
1
38
1
"
11, ))(())(()( δδδ
o estimate probabilities for different types of succession and cross sectional OLS to estimate the nous effects of hese succession types on firm performance, viz.
texoge t
[16] j
I
iii
S
sss
N
njn
K
kjkkj ejihtdxcba +⋅+⋅+⋅+⋅+=Δ ∑∑∑∑
==== 11
'
11, ))(()(ˆ δδδπ
To operationalize the strategy in [15] and [16], we require variables that are plausibly exogenous for economic reasons, correlated strongly with the actual succession choices, and uncorrelated with the true residuals in [6]. We consider the following as potential instruments: Obviously, if the departing don lacks male issue, the firm is less likely to pass to a blood heir. Although women in Japan are making major strides towards career equality in other spheres, female CEOs remain rare. There are only four female dons in our sample from 1962‐2000. Our first instrument is therefore an indicator variable set to one if we are able to document the existence of a male blood heir to the current don, and to zero otherwise. We construct this variable by scanning through our director database for sons of dons, consulting firm and family histories, and checking the Japanese equivalent of Who’s Who, and other sources as described in section 3.1.
A second factor in the don’s decision to bequeath control to a blood heir is the ability of that heir. A more demonstrably able biological son is presumably a stronger succession candidate, all else equal. We are able to gauge biological sons’ general intelligence using their university degrees earned. This is because Japan has two clearly differentiated types of universities: imperial universit
16
ies, to which admission is based solely on merit via entrance examination scores; and other universities, admission to some of which is possible by dint of special quotas for graduates of expensive preparatory schools affiliated with these universities.
The imperial universities – Tokyo University, Kyoto University, Tohoku University, Osaka University, Kyushu University, Hokkaido University, and Nagoya University– along with Hitotsubashi University, each conduct their own rigorous entrance examinations, and their students are widely acknowledged to be selected solely on merit. Consequently, a degree from an

17
ely different from younger, less leveraged, or smaller ones, so we include logarithms of firm age and size, and book leverage, defined as in [10], in the second stage regression. We also include capital expenditure to control for the effect of investment on performance changes.
imperial university reliably implies that a biological son has a high level of intelligence, and this presumably correlates with ability. Other universities, such as the highly regarded private Keio and Waseda universities also boast very highly qualified academic faculty. However, alternate admissions paths – in particular, via university‐run prep‐school channels – make their degrees less
a ttended reliable certifications than those gr nted by the imperial universities. Biological sons who aImperial universities are almost surely quite intelligent; those who attended other universities might or might not be.
Our second instrument is therefore an indicator variable set to one if we are able to odocument the existence f a male blood heir to the current don who graduated from an imperial
university, and to zero otherwise. We construct this variable by scanning through our director database for sons of dons, consulting firm and family histories, and checking the Japanese equivalent of Who’s Who, and other data sources described in section 3.1. The distribution of imperial university graduates across blood and non‐blood heirs is shown in the rightmost two columns of Table 7. Of the 242 biological sons who take over the firms covered, only 51, or 21%, attended an imperial university; while 17, or 41% of the 42 non‐blood heirs did so. Non‐blood heirs are thus far more likely to be imperial university graduates than blood heirs (t‐test p = 0.0204, however their talent is obviously not exogenous since they are selected for adoption based upon talent (Kerbo and McKinstry, 1995) . Our instrument is therefore set to one only for blood heirs who graduate from an imperial university.
Even if the current don has a biological son, and even if that son is highly intelligent, the son may not be interested in the family business. Moreover, even if the don has an intelligent son, he may not wish to found a business dynasty, and may keep relations away from his firm.
bOur third instrument is therefore a measure of the strength of the ties of the don’s family
to his firm. We gauge this with an indicator variable set to one if the don has any lood relations on the board at the time of the firm’s IPO, and zero otherwise.
As the old don ages, his abilities are likely to wane and pressure to step aside grows stronger itua, all else equal. Seppuku (r l suicide to remove disgrace) aside, the don cannot readily alter his biological aging process. Our fourth instrument is therefore the old don’s age measured at the succession year.
A highly talented outgoing don may value talent in a successor more highly. We therefore gauge the departing don’s talent with a fifth instrumental variable: the educational attainment of the old don, set to 1 if he attended an Imperial university, and to zero otherwise.
Finally, a previous non‐blood heir sets a precedent, and may increase the odds of another. Our final instrumental variable is therefore a measure the departing don’s cultural amenability to adult ado
eption. This is an indicator variable set to one if either the incumbent don is himself an
adopt d son or the controlling family, at some time in the past, including years prior to the IPO, adopted an adult son; and to zero otherwise.
Latent variables are always a concern in econometric frameworks of this sort, and are dealt with by including appropriate control variables. Obviously, macroeconomic effects can influence successions and change firm performance. We therefore include succession year fixed effects in both stages of our estimation. Many latent factors plausibly affect particular industries, so we include industry fixed effects in both stages. Older, highly leveraged, or larger firms may be qualitativ

Our fist stage estimation shows the instrumental variables to be highly jointly correlated with the actual succession outcomes. A Hausman test (Nakamura and Nakamura, 1981) comparing e liketh lihood ratios of running the 1st stage multinomial probit with the instruments versus
without them – that is, with only the controls and fixed effects – rejects joint insignificance ( 26χ =
22.5, p < 0.0000), a level well below the threshold normally required to pass weak instruments tests (Stock et al. 2002).
Our second stage results, shown in Table 9, again show that non‐blood heir successions nduce
18
m es t‐ratios in our causality study, and some differences that are insi ant Table 8 and Table 9 attain statistical significance. In particular, sarariman successions induce lower performance in terms of accounting profit than blood heirs. In fact, sarariman successions are associated with the lowest performance among the four types of successors.
We pool sons‐in‐law and adopted sons, who are also sons‐in‐law, together and call these non‐blood heirs. However, the two subgroups might have different performance effects. We therefore rerun all our regressions treating these as separate classes of family firms. We find formally adopted sons‐in‐law to outperform blood heirs in terms of accounting profit rates by 0.58% ‐ a magnitude greater than that by which all non‐blood heir firms outperform blood heir firms; but the p‐level (p = 0.15) now falls below standard thresholds of statistical significance. Formally adopted sons’ firms outperform other sons’‐in‐laws’ firms across the board – by 0.131%
es should discount likely uccession events, and this tells against Table 9.
i the greatest performance gains. Cashing out induces a greater ROA increase than does either hiring a sarariman CEO while retaining an equity block in the firm, or passing control to a blood heir. The latter is marginally superior to a sarariman (p‐value=009) in ROA, though statistically indistinguishable in other dimensions.
Q ratios show no significant differences across succession types. This may reflect the more forward‐looking nature of shareholder valuation based performance estimates. Once succession is ocked in as far as the controlling family is concerned by the values of the various instrumental ariables we employ, shareholders mig coming – and perhaps more than two ears before the actual succession. In t, share pric
lvys
ht be able to see thisan efficient marke
the power of Q ratios in
[Table 9 about here]
. 4 4 Robustness checks
The results in the tables above survive a large battery of robustness checks. In describing these, we say the robustness check generates qualitatively similar results if the pattern of signs, significance levels, and rough coefficient magnitudes is identical to that shown in the corresponding tables.
We check for outlier influence using Cook’s D statistics, and find all of our results to be unaffected by extreme observations. We have replicated both the panel results as well as the event tudy rs esults both by including and excluding outliers, and find qualitatively similar results. In particular, we find that founders and non‐blood heirs continue to out‐perform blood heirs, sarariman, and non‐don firms, and that transitions to non‐blood heirs are followed by superior performance improvements vis‐à‐vis other successor groups.
Our standard errors adjust for heteroskedasticity and are clustered by firm to account for the persistence of firms’ data within our panel, and for more than one succession event per firm in our causality analysis. Using simple pooled OLS standard errors greatly magnifies our t‐ratios, and renders virtually all coefficients in all the tables statistically significant. Not clustering by firm also agnifi gnific in

19
erages after and before, significant levels weaken somewhat, bu
in ROA, 0.0106 in Qs, 0.015% in sales growth, and 0.28% in labor force growth; but none of these coefficients is statistically significant. Formally adopted sons‐in‐law and other sons‐in‐law have otherwise similar tenure as CEO in their firms – the former serve for a median length of 19 years, s. 17 yv ears for the latter. Overall, the data suggest that formally adopted sons‐in‐law and other sons‐in‐law are qualitatively similar in comparison to other groups (such as blood heirs, sarariman, and non‐don firms), and that their mutual differences are statistically insignificant. We therefore continue to treat them as one group.
We define ROA as operating income divided by replacement cost, taken as the denominator in our Tobin’s average Q measure. If we instead define ROA as operating income over the book value of assets, qualitatively similar results ensue throughout.
We define sales growth as the logarithm of the firm’s current year nominal sales less the logarithm of its sales one year earlier. Inflation was very low throughout our sample, but we netheless no repeat our tests using inflation real sales, and find qualitatively similar results. We also
repeat all our tests with 3‐ and 5‐year sales growth numbers, and find qualitatively similar results again. Using the logarithm of current employees less the logarithm of employees three and five years earlier to measure labor force growth likewise yields qualitatively similar results.
In the tables, leverage is long‐term debt scaled by estimated replacement cost. As robustness checks, we redefine leverage with total debt, rather than long term debt, in the numerator; with unadjusted book value of assets in the denominator; and with both changed. Qualitatively similar results ensue in all three cases.
We also repeat our tests using alternative definitions of family control. 21 For example, we define family firms as those where the founding family owns the largest share of equity. When we do this, we find that the rank order of performance presented earlier is preserved. That is, founders nd nona ‐blood heirs continue to outperform non‐don firms in ROA and valuations. For sales growth and employee growth, only founder and blood‐heir firms outdo the non‐don firms. When we define family firms as those where the founding family owns at least 10% of the equity, we get qualitatively similar results.
Another possibility is that founders may be disinclined to pass on the reins to family firms. We call these firms Bill Gates type firms. We do not find a statistically significant difference between Bill Gates type founders and other founders. However, blood‐heirs, and non‐don firms, continue to lag in performance compared to either founder type, while non‐blood heirs don’t, as per results presented in earlier sections. Thus founders appear to display superior performance regardless of their succession preferences.
We also perform a battery of robustness checks specifically on our causality analysis. First, Tables 8 and 9 use the old don’s attendance at an Imperial University as a proxy for his inate intelligence. University educations were less accessible to low‐income families in earlier decades, so this may miss highly intelligent founders from poor families. We therefore re‐do our 1st stage IV regressions using a different proxy for the outgoing don’s intelligence – the average annual ROA of the firm a under the don’s watch excluding the 5 years immedi tely prior to the succession event. The second stage coefficients are qualitatively similar to those in the tables and, in many cases, their significance levels are much better. However, past performance is less clearly exogenous than university education, so we use the latter in our primary results.
Second, Tables 8 and 9 measure performance gains by average performance in the 2 years after the succession less average performance in the 2 years before the succession. If we use 3 years av t the patterns of coefficient
21 These results are not tabulated, but available from the authors upon request.

20
n rly more often than in the United States or United Kingdom. Moreover, professional networking is intense in Japan (Gerlach, 1997), so family ties should be correspondingly devalued.
magnitudes and signs remain unchanged. Still significant are the ROA differences between blood heirs and non‐blood heirs, and between non‐blood heirs and sarariman. When we use 3‐year averages, the employee growth difference between blood heirs and non‐blood heirs increases to 0.08, but is insignificant at conventional levels. Overall, the 3‐year averages for pre and post succession events are materially similar to those that we report in the tables here using two year pre and post averages.
5. Conclusions heriteIn d family firms are a more important part of the postwar Japanese economy than is generally
realized. In 2000, roughly a third of listed Japanese firms were run by their founders’ heirs or had his heirs as major equity blockholders. We also find that family firms tend to stay in the family – over 85% of intergenerational transitions preserve family control.
This is puzzling, for Burkart et al. (2003) model inherited family control prevailing where private benefits of control exceed the benefits of diversification. Even if the families’ private benefits controf ol are primarily non‐pecuniary (Demsetz and Lehn, 1985), block and voting premiums
should reveal the value families implicitly ascribe to these benefits. Yet international comparisons using block and voting premiums to infer the sum of pecuniary and nonpecuniary private benefits of control show these to be meager in Japan (Dyck and Zingales, 2004; Nenova, 2003).
Without private benefits of some sort, family control should be unsustainable in a competitive economy for three fundamental reasons. First, intelligence is at most only partially and undependably inherited (Herrnstein and Murray, 1994; Heckman, 1995; Devlin et al. 1997), and business talent is plausibly a dimension of intelligence (Thorndike, 1920; Payne, 1983, Gardner, 2007), perhaps complementing general intelligence (Cote and Miners, 2006). Second, the Carnegie 1899) e l lt( conjecture that immense inherited wealth deadens talent finds mpirica support (Ho z‐Eakin et al. 1993). Third, reserving the top job for family precludes open CEO tournaments, which Lazear and Rosen (1981), Demsetz (1996), Frank and Cook (1996), and others show highly effective at wringing effort from executives throughout the firm.
This threefold competitive disadvantage readily explains the subpar performance of nherite ni d family firms observed in the U.S. (Morck et al. 1988; Perez‐Go zalez, 2006; Villalong and Amit, 2007; Miller et al. 2007), Canada (Morck et al. 2000), Denmark (Bennedsen et al. 2007), and other countries (Bertrand and Schoar, 2006); and the rapid diminution of family equity blocks observed in the United Kingdom (Franks et al. 2004).
s e Yet we find Japanese family firm puzzlingly competitiv . They outperform professionally managed firms in both profitability and in market valuation (as measured by Tobin’s Q). They also display higher growth in sales and employees. These results persist when we remove first generation founders from the comparison.
Japan thus appears to resemble developing economies, where Khanna and Rivkin (2001) report old‐moneyed family firms to be top performers. They link this to the importance of business families’ reputations and political or economic connections in countries where corruption is prevalent and formal institutions are weak (Faccio, 2006; Morck and Yeung, 2003; Fogel, 2007), arguing that family control confers genuine economic benefits in these environments. Yet Japan scores very low on international surveys about corruption and its institutions are strong (La Porta et al. 1997, 1999). Corruption scandals and institutional flaws appear from time to time in Japan, but ot clea

Thus, although we cannot categorically rule out “connections” as underlying Japanese family firms’ admirable performance, we conclude that this is implausible.
We trace the relative success of family firms in Japan to a unique custom of incorporating fresh blood into the family via adult adoptions (mostly through in‐marrying the founder’s daughters), a practice that to the best of our knowledge, remains particular to Japan. Adopting highly qualified adults to head family businesses has the triple effect of replacing untalented blood heirs, eliciting effort from professional managers who might be “promoted” to adopted son, and eliciting effort from blood heirs who live under an ever present threat of being replaced by a “better” adopted son. Consistent with this logic, we find a broad body of evidence consistent with family firms run by adopted heirs outperforming family firms run by blood heirs, and with that both outperforming family firms run by professional sarariman CEOs and non‐family firms.
As in other corporate governance settings, such as hostile takeovers, the threat matters more an th lth e caning. During the height of the US hostile takeover wave in the 1980s, on y one in ten
takeovers was manifestly hostile, with the target board advising shareholders not to tender (Morck, Shleifer and Vishny, 1988a). Yet the threat of a hostile takeover was thought to elicit economically significant greater effort from CEOs across the board (Shleifer and Vishny, 1997). Only one in ten successions in our sample are to non‐blood heirs. Perhaps, as in Voltaire's (1759) Candide, "'In this country, it is good, from time to time, to kill an admiral, to encourage the others”.22
Our findings suggest that the unexpectedly high incidence and prosperity of old‐moneyed family firms in Japan need not disturb the generality of a key premise of the business history literature: that professionalization raises firm efficiency (Landes, 1949; Chandler, 1977). While Japan is much less unique than often portrayed (Beason and Patterson, 2006), the practice of adult adoptions into business families appears to be genuinely exceptional. This practice, and the incentives it creates for both professional managers and potential heirs, plausibly renders Japanese amily firms more professionally managed than their peers elsewhere. However, even in the
e of adult adoptions, carefully selected sons‐in‐law mighfabsenc t have similar effects. This suggests
might better prosper where arranged marriages are more socially acceptable,
that family firms consistent with evidence presented by Mehrotra et al. (2009).
References
eAbegglen, J.C., Stalk, G., Jr., 1985. Kaisha: the Japan se corporation. Basic Books, New York.
Anderson, Ronald and David Reeb, 2003. Founding family ownership and firm performance: evidence from the S&P 500. Journal of Finance 58, 1301–1329.
Aronoff, Craig and John L. Ward. 2000. More than family: non‐family executives in the family business. Business Owner Resources .
: Rethinking Japanese Bachnik, Jane M. 1983. Recruitment Strategies for Household SuccessionHousehold Organisation. Man, New Series 18(1) 160‐182.
Beardsley, Richard K., John W. Hall and Robert E. Ward 1959. Village Japan. Chicago: Univ. Press.
Beason, Dick and Dennis Patrick Patterson. 2006. The Japan That Never Was: Explaining the Rise and Decline of a Misunderstood Country. State University of New York Press.
21
22 “Dans ce paysci, il est bon de tuer de temps en temps un amiral pour encourager les autres”, Voltaire (1759, p. X)

Bebchuk, Lucian and Alma Cohen, 2005. The Costs of Entrenched Boards. The Journal ofEconomics, v. 78, 409‐433.
Financial
Bennedsen, Morten, Kasper Meisner Nielsen, Francisco Pérez‐González and Daniel Wolfenzon. 2007. Inside the Family Firm: The Role of Families in Succession Decisions and
Performance. Quarterly Journal of Economics 122(2) 647‐691.
Bertrand, Marianne and Antoinette Schoar, 2006. The Role of Family in Family Firms, Journal of
Jo
Economic Perspectives, 20.
Bryant, Taimie. 1990. Sons and Lovers: Adoption in Japan. American urnal of Comparative Law
al of Finance, 58, 2167‐
38(2) 299‐336.
rnBurkart, Mike, Fausto Panunzi and Andrei Shleifer, 2003. Family firms, Jou2202.
Burke, William. 1962. Creative Response and Adaptive Response in Japanese Society. American Journal of Economics and Sociology 21(1) 103‐12.
Carnegie, Andrew. 1899. Wealth. North American Review 148(391) 653‐65.
Chandler, Alfred D., Jr. 1977. The Visible Hand. Harvard University Press.
n
Chen, Min. 2004. Asian Management Systems. 2nd Edition, Thomson Learning.
Coates, John C., and Reinier Kraakman, 2007. CEO Tenure, Performance a d Turnover in S&P 500 Companies, ECGI‐Finance Working Paper No. 191/2007.
Cote, S. and Miners, C.T.H. 2006. Emotional intelligence, cognitive intelligence and job performance. Administrative Science Quarterly 51(1) 1‐28.
Demsetz, Harold, and Kenneth Lehn. 1985. The structure of corporate ownership: Causes and consequences. Journal of Political Economy 93 1155‐77.
e Business Firm: Seven mentaries Demsetz, Harold. 1996. The Economics of th Critical ComCambridge University press.
Devlin B, Daniels M, Roeder K. 1997. The heritability of IQ. Nature 388(6641) 417‐8.
Dyck, Alexander & Luigi Zingales. 2004. Private Benefits of Control: An International Comparison. Journal of Finance 59(2)537‐600.
96, 369‐386. Faccio, Mara, 2006. Politically connected firms. American Economic Review,
Faccio, Mara and Larry Lang, 2002. The ultimate ownership of western European corporations, Journal of Financial Economics, 65, 365‐395.
Fogel, Kathy. 2007. Oligarchic Family Control, Social Economic Outcomes, and the. Quality of Government. Journal of International Business Studies 37(5) 603‐22.
Frank, Robert and Philip Cook. 1996. The Winner‐Take‐All Society. Penguin.
Franks, Julian, Colin Mayer and Stefano Rossi, 2004. Spending Less Time with the Family: The Decline of Family Ownership in the UK. NBER program on the History of Corporate
22
Ownership: The Rise and Fall of Great Business Families.
Galton, Francis. 1886. Regression towards mediocrity in hereditary stature. Nature 15 246–263.
Gardner, Howard. 2007. Five Minds for the Future ‐ Harvard Business School Press.
Gerlach, Michael. 1997. Alliance capitalism: the social organization of Japanese business. University of California Press.

23
Kurosu, S. 1998. Long way to headship, short way to retirement: adopted sons in a northeastern village in pre‐industrial Japan. History of the Family 3 393‐410.
s.
Geringer, J. Michael, Colette A. Frayne and David Olsen, 1999. Rewarding growth or profit? Top Japanese MNEs. Journal of management team compensation and governance in
International Management, 4‐ 289–309.
Gompers, Paul A., Joy L. Ishii and Andrew Metrick, 2003. Corporate Governance and Equity Price5. Quarterly Journal of Economics, 118, 107‐15
Hayes, Peter and Toshie Habu. 2006. Adoption in Japan. Routledge.
Hamabata, Matthews Masayuki. 1991. Crested Kimono: Power and Love in the Japanese Business Family. Cornell University Press, Ithaca, NY.
Hayek, F., 1945. The Use of Knowledge in Society. American Economic Review. pp519‐30.
en in need. Abingdon: Hayes, P, and Habu, T., 2006. Adoption in Japan: Comparing policies for childrRoutledge.
Heckman, James. 1995. Lessons from the Bell Curve", Journal of Political Economy 103(5) 1091‐1120.
Herrnstein, Richard J. and Charles Murray. 1994. The Bell Curve. Free Press.
Holtz‐Eakin, Douglas, David Joulfaian and Harvey Rosen, 1993. The Carnegie Conjecture: Some Empirical Evidence. The Quarterly Journal of Economics, v. 108, p. 413‐35.
James, Harold. 2006. Family Capitalism: Wendels, Haniels, Falcks, and the Continental European Model. Harvard University Press.
Johnston, S., 1995. Managerial dominance of Japan’s major corporations. Journal of Management, 21 (2), 191–210.
tKaji, N. 1999. Presentation in the minu es of the 8th specialist committee on medical technology to assist reproduction. Organized by Children and Families bureau, Ministry of Health and
seishokuhojyWelfare. (Dai 8 kai o iryogiyutu nikansuru senmoniinkai gijiroku; Koseisho Jidokateikyuko Boshihokenka)
ups in Khanna, Tarun and Jan Rivkin, 2001. Estimating the performance effects of business groemerging markets. Strategic Management Journal.
Khanna, Tarun and Krishna Palepu, 2000. Is Group Membership Profitable in Emerging Markets?An Analysis of Diversified Indian Business Groups. Journal of Finance, Vol 55.
Khanna, Tarun, and Yishay Yafeh. 2007. Business Groups in Emerging Markets: Paragons or Parasites? Journal of Economic Literature 45, 331‐372.
Kerbo, Harold R. and John A. McKinstry, 1995. Who rules Japan?: the inner circles of economic and political power. Greenwood/Praeger, Santa Barbara.
n Essay by Dasai Jun. (Tra Asiatic Kirby, R. J. 1908. A nslated by R. J. Kirby) Transactions of the) 96‐135. Society of Japan 36(1
Kitsuse, John, 1964. Untitled Review of Japanese Culture: Its Development and Characteristics. American Sociological Review, Vol. 29, No. 2 (Apr., 1964), pp. 309‐310
Knight, F.H., 1921. Risk, Uncertainty, and Profit. Boston, Massachussetts: Houghton Mifflin.
Koshin Data, various issues, Shinji kôshin roku (Who is who), Koshin Data, Tokyo.

Kurosu, Satomi and Emiko Ochiai, 1995. Adoption as an Heirship Strategy under Demographic Constraints: a Case from Nineteenth‐Century Japan. Journal of Family History.
La Porta, Rafael, et al, 1997. Trust in Large Organizations. American Economic Review 87(2) 333‐38
dFinan
La Porta, Rafael, Florencio Lopez e Silanes, and Andrei Shleifer, 1999, Corporate ownership around the world, Journal of ce 54, 471‐517.
Landes, David S. 1949. French Entrepreneurship and Industrial Growth in the Nineteenth Century," Journal of Economic History 9 45‐61.
Landes, David S. 2006. Dynasties: Fortunes and Misfortunes of the World’s Greatest Business Families. New York: Viking.
Lazear, Edward and Rosen, Sherwin. 1981. Rank and Order Tournament: An Optimal Labor Contract. Journal of. Political Economy (89) 841‐864
Lebra, Takie Sugiyama. 1989. Adoption among the Hereditary Elite of Japan: Status Preservation through Mobility. Ethnology 28(3) 185‐218.
Macfarlane, Alan, 2002. The Savage Wars of Peace: England, Japan and the Malthusian Trap. Paperback edition by Palgrave, London, 2002.
Mass, J. P., 1989. Lordship and inheritance in early medieval Japan: A study of the Kamakura sˆoryˆo system. Stanford, CA: Stanford University Press.
Mehrotra, Vikas, Randall Morck, JungWook Shim, and Yupana Wiwattanakantang, 2009. Must Love Kill the Family Firm? Working paper, University of Alberta School of Business.
Miller, Danny, Isabelle Le Breton‐Miller, Richard Lester, and Albert Cannella Jr., 2007. Are Family Firms Really Superior Performers? Journal of Corporate Finance 13, 829858.
Randall, A Morck, ndrei Shleifer and Robert Vishny, 1988. Management ownership and market valuation: an empirical analysis. Journal of Financial Economics 20, 293–315.
dee
Morck, Randall, Andrei Shleifer an Robert Vishny, 1988a. The Differences Between Hostile & Friendly Takeovers. In Corporat Takeovers: Causes & Consequences, Allan Auerbach (ed.) National Bureau of Economic Res arch Conference Volume, University of Chicago Press.
Morck, Randall and Bernard Yeung. 2003. Family Firms and the Rent Seeking Society. Entrepreneurship, Theory and Practice 28(4) 391‐409.
e, Economic Morck, Randall, Daniel Wolfenzon and Bernard Yeung, 2005. Corporate GovernancEntrenchment and Growth, Journal of Economics Literature.
eM
Morck, Randall, David Stangeland and Bernard Yeung, 2000. Inherit d wealth, corporate control, and economic growth, in Concentrated Corporate Ownership, Randall, orck (ed.), The University of Chicago Press.
Moriguchi, 2007. Child Adoption in the United States and Japan. NBER working paper.
EMorikawa, Hidemas, 1992. Zaibatsu: The Rise and Fall of Family nterprise Groups in Japan. University of Tokyo Press.
Morris, Robert, 1894. Adoption in Japan. Yale Law Journal 4(4) 143‐49.
24
Nakagawa, T. 1991. The rights of adopted children (Yôshi no sozokuken) Hanrei Taimuzu 688 27.
Nakamura, Alice and Nakamura, Masao. 1981. On the relationship among several specification error tests presented by Durbin, Wu, and hausman. Econometrica 49 1583‐8.

Nakane, Chie 1967. Kinship and economic organization in rural Japan. London: Athlone Press.
Nenova, Tatiana. 2003. The value of corporate voting rights and control: A cross‐country analysis. Journal of Financial Economics 68(3)325‐351
Nihon Keizai Shimbun, 2004, Watashino rirekisho—keizaijin zen 38 kan (My Life‐‐Businessmen, 38 volumes), (Nihon Keizai Shimbun, Tokyo).
the child is older than the parent (Yôshiga Nishioka, Y. 1991. The legality of adoptions whereyô’oya yori nenchoto naru yôshi engumino kouyoku) Hanrei Taimuzu 747 232‐4.
O’Halloran, Kerry, 2009. The Politics of Adoption – International Perspectives on Law, Policy & Practice. Published by Springer Netherlands, p 403‐432.
Oppler, Alfred. 1976. Legal Reform in Occupied Japan
Paulson, Joy Larsen. 1983. Family Law Reform in Postwar Japan: Succession and Adoption. Ph.D. dissertation, Department of History, University of Colorado).
Payne, W.L. 1983. A study of emotion. Doctoral thesis (University microfilms No. AAC 8605928)
Pelzel, John C. 1970. Japanese kinship: a comparison. In Maurice Freedman, ed. Family and kinship in Chinese society. Stanford: Univ. Press
Perez‐Gonzalez, Francisco, 2006. Inherited Control and Firm Performance, American Economic ‐1588. Review. Vol. 96, 1559
Porter, Michael. 1990. The Competitive Advantage of Nations. Free Press, New York.
Porter, Michael, Hirotaka Takeuchi, and Mariko Sakakibara, 2000. Can Japan Compete? Basic Books and Perseus Publishing.
arper and Row, NewSchumpeter, Joseph, 1950. Capitalism, Socialism, and Democracy, 3rd ed., H York.
Shigeno, Aneki. 1887. The Evils of Abdication, Heirship, and Adoption. Transactions of the Asiatic Society of Japan 15 72‐82.
Shleifer, Andrei and Robert Vishny, 1997. A Survey of Corporate Governance. Journal of Finance, 52.
Smith, Brian F. and Ben Amoako‐Adu. 2005. Management Succession and Financial Performance of Family Controlled Firms. In Robert Watson, ed. Governance and Ownership, Elgar: Cheltenham, UK, 314‐341.
ts and Weak d Economic
Stock, James, Jonathan Wright, Motohiro Yogo. 2002. A Survey of Weak InstrumenIdentification in Generalized Method of Moments. Journal of Business an
4): 518‐529. Statistics 20(
hiro, 1997. Yōshi tokTakenoshita. Yoshi ubetsu yōshi kokusai yōshi (Adoptions, Special Adoptionsand International Adoptions). Published by Chuo Keizaisha, Tokyo.
and i
,
0. IntelligenceThorndike, Edward L. 192 ts use. Harper's magazine 140 227–235.
Tokiwa Shoin, 1977, Zaikai kakeifu daikan (Family Trees of Big Business), Tokiwa Shoin, Tokyo.
eiz iToyô K ai, 1995, Nihon kaishashi sôran (The Company History n Japan), Toyô Keizai Shimpôsha, Tokyo.
Toyô Keizai. 1981–1988, Kigyô keiretsu sôran (Survey of Corporate Groups), Toyô Keiza Shimpôsha, Tokyo.
25

Tsuru, K., 1996. The Japanese market economy system: its strengths and weaknesses. LTCB International Library Foundation, Tokyo.
ownership, management and control 385–41
Villalonga, Belen and Raphael Amit, 2006. How do familynomics 80,
rence as a
affect firm value? Journal of Financial Eco 7.
Voltaire, François Marie Arouet. 1759. Candide, or optimism: A philosophical tale.
Wadlington, Walter. 1966. Minimum Age Diffe uisite for Adoption. Duke Law Journal.392 409.
ta Masao, 1977. Y
Req
Yamaha ôshi. Juristo Sogotokushu 6 259.
Zaikai Kenkyûjo. 1979, 1981, 1982, 1983, 1985. Kaisha yakuin roku (The Board of Directors), Zaikai Kenkyûjo, Tokyo.
26

Table 1: Adoption Statistics. Special adoptions, explicitly modelled on the foreign practice of finding homes for orphans and mistreated or unwanted children, are a recent innovation. Ordinary adoptions, in contrast, are a deeply rooted Japanese tradition, in which parents needing an heir adopt a child or adult.
All Adoptions Special adoptions Ordinary adoptions
of minors Total adoptions of
minors Total adoptions of
adults
yôshi engumi tokubetsu yôshi miseinen yôshi
1955 101,963 0 26983 26,983 74,980
1965 82,176 0 15,018 15,018 67,158
1975 86,844 0 6,771 6,771 80,073
1985 91,186 0 2,804 2,804 88,382
1990 82,007 738 1,502 2,240 79,767
1995 79,381 521 1,111 1,632 77,749
2000 80,790 362 994 1,356 79,434
2002 85,674 350 960 1,310 84,364
2004 83,505 332 998 1,330 82,175 Sources: Tokubetsu yôshi and Child Adoptions Approved by the Court: Supreme Court of Japan. shihôtôkeinenpô Kajihen are from issues of the Annual Report of Judicial Statistics (Table 3 of Volume 3, Family Cases). Adoptions registered by Koseki offices are from issues of the Ministry of Justice Annual report (Hômu nenkan).
27

Table 2: Summary Statistics for Main Variables ROA is the ratio of operating income to adjusted total assets. Q‐ratios is market value over replacement cost, with market value defined as replacement cost less book value of equity plus market value of equity; and replacement cost defined as assets adjusted by marking real estate and equity cross holdings to market. Sales and employee growth statistics are based on year to year percentage growth. Leverage is defined as long‐term debt scaled by total assets. Industry‐adjustment is based on subtracting the median value for the matching two‐digit Japanese exchange industry code firms, excluding the sample firm. Total assets are in billions of yen; leverage is long‐term debt over replacement cost; capital expenditure is year‐on‐year change in fixed assets plus depreciation over lagged sales. Firm age is years since founding..
Mean Median Maximum Minimum Standard deviation
Performance Dimensions ROA 4.60% 3.92% 30.4% ‐19.0% 4.50%
Industry adj ROA ‐0.650% ‐0.940% 26.0% ‐22.8% 3.89% Q 1.40 1.28 5.79 0.29 0.416
Industry adj Q ‐0.061 ‐0.103 3.81 ‐1.98 0.368 Sales growth 8.02% 6.15% 115% ‐70.3% 16.0%
Industry adj sales growth ‐0.727% ‐1.26% 117% ‐87.6% 13.1% Employee growth ) ‐0.336% ‐0.480% 59.0% ‐65.4% 8.12%
Industry adj employee growth ‐0.611% ‐0.489% 111% ‐90.2% 9.03% Main Control Variables
Total assets (billion Yen) 189 32.4 16,100 0.17 667 Leverage 0.119 0.095 0.670 0.000 0.106 Firm age 44.9 44.0 110 4.00 18.3
28
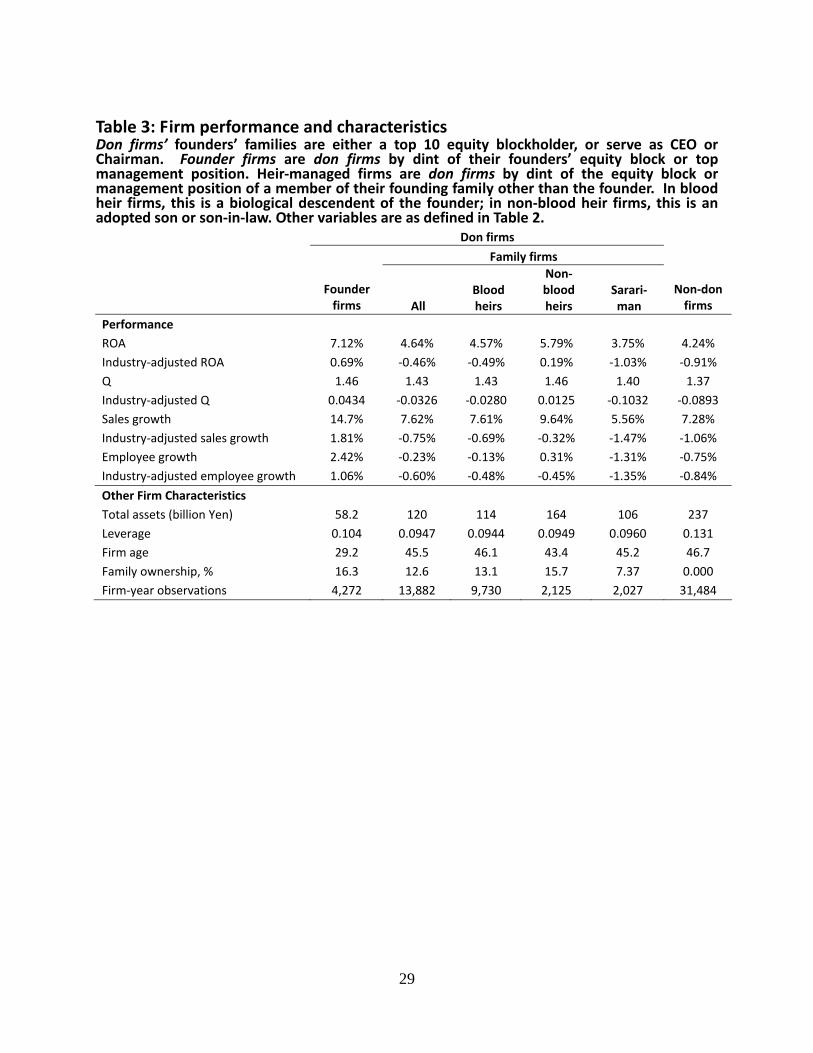
Table 3: Firm performance and characteristics Don firms’ founders’ families are either a top 10 equity blockholder, or serve as CEO or Chairman. Founder firms are don firms by dint of their founders’ equity block or top management position. Heir‐managed firms are don firms by dint of the equity block or management position of a member of their founding family other than the founder. In blood heir firms, this is a biological descendent of the founder; in non‐blood heir firms, this is an adopted son or son‐in‐law. Other variables are as defined in Table 2. Don firms
Family firms
Founder firms All
Blood heirs
Non‐blood heirs
Sarari‐man
Non‐don firms
Performance ROA 7.12% 4.64% 4.57% 5.79% 3.75% 4.24% Industry‐adjusted ROA 0.69% ‐0.46% ‐0.49% 0.19% ‐1.03% ‐0.91% Q 1.46 1.43 1.43 1.46 1.40 1.37 Industry‐adjusted Q 0.0434 ‐0.0326 ‐0.0280 0.0125 ‐0.1032 ‐0.0893 Sales growth 14.7% 7.62% 7.61% 9.64% 5.56% 7.28% Industry‐adjusted sales growth 1.81% ‐0.75% ‐0.69% ‐0.32% ‐1.47% ‐1.06% Employee growth 2.42% ‐0.23% ‐0.13% 0.31% ‐1.31% ‐0.75% Industry‐adjusted employee growth 1.06% ‐0.60% ‐0.48% ‐0.45% ‐1.35% ‐0.84%
Other Firm Characteristics Total assets (billion Yen) 58.2 120 114 164 106 237 Leverage 0.104 0.0947 0.0944 0.0949 0.0960 0.131 Firm age 29.2 45.5 46.1 43.4 45.2 46.7 Family ownership, % 16.3 12.6 13.1 15.7 7.37 0.000 Firm‐year observations 4,272 13,882 9,730 2,125 2,027 31,484
29

Table 4. Relative performance by control classification, ANOVA results Variables are as defined in Tables 2 and 3. T‐tests adjust for industry and year fixed effects, and for firm‐level clustering of residuals. Numbers in parentheses are p‐levels for rejecting the null hypothesis of identical means. Boldface denotes significance at 5% or better.
Benchmark Premium for ROA, % Q Sales growth,% Labour growth, % Non‐don firms Don firms 0.483 0.062 0.373 0.292
(0.00) (0.00) (0.02) (0.03) Founders 1.46 0.127 2.78 1.64 (0.00) (0.00) (0.00) (0.00) Blood heirs 0.445 0.067 0.443 0.420 (0.00) (0.00) (0.02) (0.01) Non‐blood heirs 0.975 0.093 0.454 0.233 (0.00) (0.00) (0.18) (0.38) Sarariman 0.138 0.004 ‐0.064 ‐0.283 (0.55) (0.87) (0.85) (0.25)
Blood heirs Founders 1.01 0.061 2.34 1.22 (0.00) (0.00) (0.00) (0.00) Non‐blood heirs 0.530 0.026 0.011 ‐0.187 (0.05) (0.41) (0.98) (0.51) Sarariman ‐0.308 ‐0.063 ‐0.507 ‐0.703 (0.21) (0.02) (0.17) (0.01) Non‐don ‐0.445 ‐0.067 ‐0.443 ‐0.420 (0.00) (0.00) (0.02) (0.01)
Non‐blood heirs Founders 0.481 0.035 2.33 1.41 (0.14) (0.29) (0.00) (0.00) Blood heirs ‐0.530 ‐0.026 ‐0.011 0.187 (0.05) (0.41) (0.98) (0.51) Sarariman ‐0.837 ‐0.089 ‐0.518 ‐0.516 (0.01) (0.02) (0.27) (0.14) Non‐don ‐0.975 ‐0.093 ‐0.454 ‐0.233 (0.00) (0.00) (0.18) (0.38)
Sarariman Founders 1.32 0.123 2.85 1.93 (0.00) (0.00) (0.00) (0.00) Blood heirs 0.308 0.063 0.507 0.703 (0.21) (0.02) (0.17) (0.01) Non‐blood heirs 0.837 0.089 0.518 0.516 (0.01) (0.02) (0.27) (0.14) Non‐don ‐0.138 ‐0.004 0.064 0.283 (0.55) (0.87) (0.85) (0.25)
30

Table 5. Performance regressions, founder, family, and other firms Variables are defined in Tables 2 and 3. Regressions are on firm‐level panel data from 1962 hrough 2000. Total observations equal 47,102 for Q‐regressions and 49,638 firm‐years for all thers.
to
ROA, % Q Sales growth, % Labour growth, %
1.14 0.109 2.42 1.44(0.00) (0.00) (0.00) (0.00)
0.371 0.049 0.360 0.304(0.00) (0.00) (0.02) (0.01)
0.120 0.005 0.325 0.258(0.00) (0.24) (0.00) (0.00)
‐0.0951 ‐0.0085 ‐0.072 ‐0.0678(0.00) (0.00) (0.00) (0.00)
0.0324 0.0046 0.168 0.155(0.00) (0.00) (0.00) (0.00)
‐0.0159 ‐0.0001 ‐0.0361 ‐0.0250(0.00) (0.88) (0.00) (0.00)
7.36 1.88 5.09 1.77(0.00) (0.00) (0.00) (0.01)
Adj. R2 0.33 0.35 0.31 0.17
Number of firm clusters 1,367 1,289 1,367 1,367
Year fixed effects Yes Yes Yes Yes
Industry fixed effects Yes Yes Yes Yes
Capital expenditure
Firm age
Constant
Founder firms
Firm size
Leverage
Family firms
31

Table 6. Performance and family control, regressions summary Variables are defined in Tables 2 and 3. Regressions are on firm‐level panel data from 1962 through 2000, and include the control variables listed in Table 5. Total observations equal 47,102 for Q‐regressions and 49,638 firm‐years for all others.
Benchmark Premium for ROA, % Q Sales growth, % Labour growth, %
Don firms 0.539 0.0622 0.809 0.553 Non‐don firms
(0.00) (0.00) (0.00) (0.00)
Founders 1.14 0.11 2.41 1.44
(0.00) (0.00) (0.00) (0.00)
Blood heirs 0.332 0.053 0.449 0.446
(0.02) (0.00) (0.01) (0.00)
Non‐blood heirs 0.850 0.076 0.385 0.147
(0.00) (0.01) (0.22) (0.54)
Sarariman 0.0471 ‐0.0007 ‐0.111 ‐0.230
(0.84) (0.98) (0.74) (0.33)
Blood heirs Founders 0.811 0.056 1.965 0.996
(0.00) (0.00) (0.00) (0.00)
Non‐blood heirs 0.519 0.023 ‐0.064 ‐0.299
(0.04) (0.45) (0.85) (0.25)
Sarariman ‐0.285 ‐0.054 ‐0.560 ‐0.675
(0.24) (0.03) (0.11) (0.01)
Non‐don ‐0.332 ‐0.053 ‐0.449 ‐0.446
(0.02) (0.00) (0.01) (0.00)
Non‐blood heirs Founders 0.293 0.0330 2.03 1.29
(0.34) (0.30) (0.000 (0.00)
Blood heirs ‐0.519 ‐0.0229 0.0636 0.299
(0.04) (0.45) (0.85) (0.25)
Sarariman ‐0.804 ‐0.0769 ‐0.496 ‐0.377
(0.01) (0.03) (0.26) (0.25)
Non‐don ‐0.850 ‐0.076 ‐0.385 ‐0.147
(0.00) (0.01) (0.22) (0.54)
Sarariman Founders 1.10 0.11 2.52 1.67
(0.00) (0.00) (0.00) (0.00)
Blood heirs 0.285 0.0540 0.560 0.675 (0.24) (0.03) (0.11) (0.01)
Non‐blood heirs 0.803 0.077 0.496 0.377 (0.01) (0.03) ‐(0.26) (0.25)
Non‐don ‐0.0471 0.0007 0.111 0.230
(0.84) (0.98) (0.74) (0.33)
32

Table 7. Succession Events Sample is all changes in control from 1962 to 2000 in all Japanese firms initially listed between 1949 and 1970. This includes prewar firms that relisted when stock markets reopened in 1949. The imperial universities – Tokyo University, Kyoto University, and several others – and Hitotsubashi University admit solely on academic merit. Entrance to other universities is possible by attending expensive affiliated preparatory schools. Successor type Events Successor sub‐type Events
242 blood heir is a merit university graduate 51 Blood heir blood heir is not a merit university graduate 191
42 non‐blood heir is legally adopted son and son‐in‐law 20 Non‐blood heir non‐blood heir is son‐in‐law, but not legally adopted son 22
Sarariman 81 family retains top ten equity stake (sarariman‐run family firm) 81 Subtotal of family firm successions
365
Cash out 60 family not listed among top ten shareholders (non‐don firm) Grand total 425 425
33

Table 8: Performance changes around succession events Variables are defined in Tables 2 and 3. Cross‐section regressions are on event‐level data. Events are all 425 old don departures from 1962 through 2000 for which control variables data are complete, and are subdivided according to whether the successor is the old don’s blood heir, non‐blood heir, a professional manager (sarariman) running a firm in which the old don’s family remains a top ten blockholder, or a professional manager running a firm in which the family is no longer a top ten blockholder (cash out). Regressions control for firm age, firm size, leverage, capital spending, and succession year and industry fixed effects. Some firms have more than one succession event, so standard errors are clustered by firm.
Benchmark Premium for ΔROA ΔQ ΔSales growth ΔLabor growth Blood heir ‐0.0235 0.0333 ‐0.0784 ‐0.0228
Non‐blood heir (0.00) (0.47) (0.00) (0.10)
Sarariman ‐0.0340 ‐0.0333 ‐0.0623 ‐0.0110
(0.00) (0.52) (0.02) (0.55)
Cash out ‐0.0182 0.0624 ‐0.0568 ‐0.0174
(0.02) (0.41) (0.04) (0.30)
Blood heir Non‐blood heir 0.0235 ‐0.0333 0.0784 0.0228
(0.00) (0.47) (0.00) (0.10)
Sarariman ‐0.0105 ‐0.0666 0.0162 0.0118
(0.03) (0.10) (0.41) (0.39)
Cash out 0.0053 0.0291 0.0217 0.0054
(0.33) (0.65) (0.25) (0.64)
Sarariman Blood heir 0.0105 0.0666 ‐0.0162 ‐0.0118
(0.03) (0.10) (0.41) (0.39)
Non‐blood heir 0.0340 0.0333 0.0623 0.0110
(0.00) (0.52) (0.02) (0.55)
Cash out 0.0158 0.0957 0.0055 ‐0.0064
(0.01) (0.15) (0.82) (0.68)
Cash out Blood heir ‐0.0053 ‐0.0291 ‐0.0217 ‐0.0054
(0.33) (0.66) (0.25) (0.64)
Non‐blood heir 0.0182 ‐0.0624 0.0568 0.0174
(0.02) (0.41) (0.04) (0.30)
Sarariman ‐0.0158 ‐0.0957 ‐0.0055 0.0064
(0.01) (0.15) (0.82) (0.68)
34

Table 9: Exogenous performance changes around succession events Variables are defined in Tables 2 and 3. First stage regressions are multinomial probits of succession choices on instruments and control, and are described in [15]. Second stage cross‐section regressions are on event‐level data and are described in [16]. Events are all 425 old don departures from 1962 through 2000 for which control variables data are complete, and are subdivided according to whether the successor is the old don’s blood heir, non‐blood heir, a professional manager (sarariman) running a firm in which the old don’s family remains a top ten blockholder, or a professional manager running a firm in which the family is no longer a top ten blockholder (cash out). Second stage regressions control for firm age, firm size, leverage, capital spending, and succession year and industry fixed effects. Some firms have more than one succession event, so standard errors are clustered by firm.
Benchmark Premium for ΔROA ΔQ ΔSales growth ΔLabor growth Blood heir ‐0.0261 ‐0.0725 ‐0.1253 ‐0.0525
Non‐blood heir (0.0034) (0.3230) (0.0029) (0.0331)
Sarariman ‐0.0412 ‐0.1125 ‐0.1450 ‐0.0826
(0.0009) (0.3075) (0.0054) (0.0212)
Cash out ‐0.0182 0.0291 ‐0.0006 ‐0.0273
(0.2249) (0.8349) (0.9917) (0.4117)
Blood heir Non‐blood heir 0.0261 0.0725 0.1253 0.0525
(0.0034) (0.3230) (0.0029) (0.0331)
Sarariman ‐0.0152 ‐0.0399 ‐0.0197 ‐0.0301
(0.0940) (0.6167) (0.5485) (0.1488)
Cash out 0.0078 0.1016 0.1247 0.0252
(0.4962) (0.3758) (0.0012) (0.2505)
Sarariman Blood heir 0.0152 0.0399 0.0197 0.0301
(0.0940) (0.6167) (0.5485) (0.1488)
Non‐blood heir 0.0412 0.1125 0.1450 0.0826
(0.0009) (0.3075) (0.0054) (0.0212)
Cash out 0.0230 0.1416 0.1445 0.0553
(0.1335) (0.3519) (0.0094) (0.0852)
Cash out Blood heir ‐0.0078 ‐0.1016 ‐0.1247 ‐0.0252
(0.4962) (0.3758) (0.0012) (0.2505)
Non‐blood heir 0.0182 ‐0.0291 0.0006 0.0273
(0.2249) (0.8349) (0.9917) (0.4117)
Sarariman ‐0.0230 ‐0.1416 ‐0.1445 ‐0.0553
(0.1335) (0.3519) (0.0094) (0.0852)
35

Figure 1. Prevalence of Founder and Family Controlled Firms: 1962 to 2000 The graph includes all firms trading on Japanese stock exchanges between 1949 and 1970, for which accounting and governance data are available from 1962 through 2000 (or delisting). Family firms count a founding family member among their top 10 shareholders, directors empowered to sign for the firm, or as CEO. All other firms are non‐don firms. Founder‐run firms are family firms whose founder fills one or more of these criteria. All other family firms are heir‐run. Among these, blood heir firms have a biological descendent of the founder and non‐blood heir firms an adopted son or son‐in‐law filling one of these roles. A sarariman firm’s founding families remains a top 10 shareholder, but provides neither a CEO nor a signing director, instead entrusting these positions to professional managers. Former family irms are one‐time family firms that became professionally‐run firms. The maximum and inimum cross‐sections are 1,319 and 1,107 firms, respectively.
fm
0
200
400
600
800
1000
1200
1400
1962
1964
1966
1968
1970
1972
1974
1976
1978
1980
1982
1984
1986
1988
1990
1992
1994
1996
1998
2000
Founder Blood heir Non-blood heir Sarariman Former-Don Firm Non-don Firm
36