Addressing Deficiencies HCM Bike Level of Service …docs.trb.org/prp/14-3227.pdf · ·...
28
Petritsch, et al 1 Addressing Deficiencies HCM Bike Level of Service Model for Arterial Roadways 1 2 3 Submitted July 31, 2013 4 Word Count: 2,690 plus 11 tables and 7 figures at 250 words each = 7,190 words 5 6 By 7 Theodore A. Petritsch – Corresponding author 8 Bruce W. Landis 9 Sprinkle Consulting, Inc. 10 18115 U.S. Highway 41 North, Suite 600 11 Lutz, FL 33549 12 Phone: (813) 949-7449 13 Fax: (813) 948-1712 14 E-mails: [email protected] 15 [email protected] 16 17 Tyrone Scorsone 18 Cambridge Systematics, Inc. 19 1566 Village Square Blvd, Suite 2 20 Tallahassee, FL 32309 21 Phone: (850) 219-6388 22 Fax: (850) 219-6389 23 E-mail: [email protected] 24 25 26 27 28 TRB 2014 Annual Meeting Original paper submittal - not revised by author
Transcript of Addressing Deficiencies HCM Bike Level of Service …docs.trb.org/prp/14-3227.pdf · ·...

Petritsch, et al 1
E:\8308-13 2012 HCM Bike LOS for Arterial Roadways\Addressing Deficiencies in the HCM Bike Level of Service 04.docx
Addressing Deficiencies HCM Bike Level of Service Model for Arterial Roadways 1
2 3 Submitted July 31, 2013 4 Word Count: 2,690 plus 11 tables and 7 figures at 250 words each = 7,190 words 5 6 By 7 Theodore A. Petritsch – Corresponding author 8 Bruce W. Landis 9 Sprinkle Consulting, Inc. 10 18115 U.S. Highway 41 North, Suite 600 11 Lutz, FL 33549 12 Phone: (813) 949-7449 13 Fax: (813) 948-1712 14 E-mails: [email protected] 15 [email protected] 16 17 Tyrone Scorsone 18 Cambridge Systematics, Inc. 19 1566 Village Square Blvd, Suite 2 20 Tallahassee, FL 32309 21 Phone: (850) 219-6388 22 Fax: (850) 219-6389 23 E-mail: [email protected] 24 25 26 27
28
TRB 2014 Annual Meeting Original paper submittal - not revised by author

Petritsch, et al 2
E:\8308-13 2012 HCM Bike LOS for Arterial Roadways\Addressing Deficiencies in the HCM Bike Level of Service 04.docx
ABSTRACT 29 The 2010 Highway Capacity Manual (HCM) includes methodologies for calculating 30 Bicycle Level of Service (BLOS) as part of “Multimodal LOS” analysis. The 31 methodology provides a model for calculating a pseudo-academic letter grade scaled 32 from “A” to “F” that represents bicyclists’ perceptions of safety and comfort. It is the 33 standard for transportation engineering analysis in numerous locations throughout the 34 United States. It combines the link bicycle LOS model with a bicycle intersection model, 35 both developed by the Florida Department of Transportation (FDOT). Practitioners have 36 found the HCM methodology does not provide intuitive results. 37 38 The HCM methodology provides scores which represent a roadway as worse than it 39 actually is, does not provide enough sensitivity to bike improvements, and does not 40 provide an adequate range of responses. It is difficult to achieve an “A” of “B” LOS 41 score using the HCM methodology. Adding bike lanes does not have a significant impact 42 on the LOS. It is also very difficult to achieve an LOS of worse than “E” regardless of 43 how bad a roadway is. 44 45 This paper describes an effort by FDOT to create an alternative model that better 46 represents how well roadways meet the needs of bicyclists. It is based upon the time 47 exposed and relative LOS value for each individual LOS component (intersection/link). It 48 was developed with the input of a panel of practitioners from around the country. The 49 resulting model represents an LOS methodology that provides more intuitive values (than 50 the HCM methodology) for those evaluating their roadway networks. 51
52
TRB 2014 Annual Meeting Original paper submittal - not revised by author
Petritsch, et al 3
E:\8308-13 2012 HCM Bike LOS for Arterial Roadways\Addressing Deficiencies in the HCM Bike Level of Service 04.docx
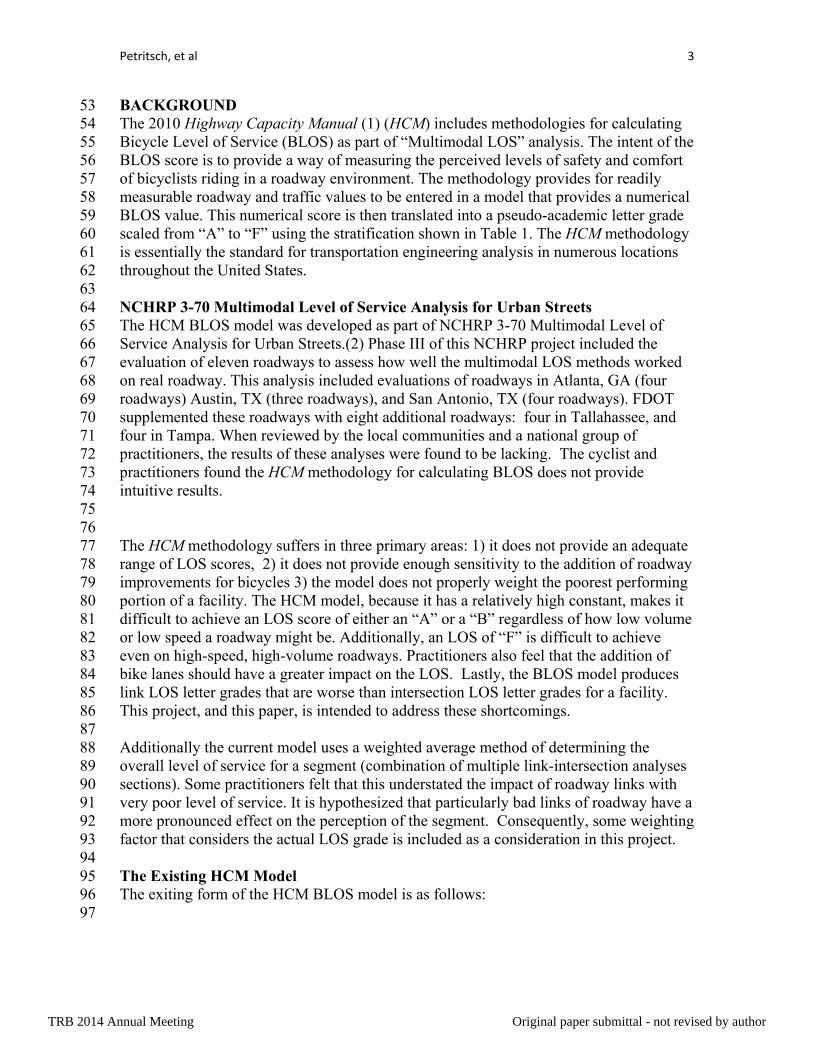
BACKGROUND 53 The 2010 Highway Capacity Manual (1) (HCM) includes methodologies for calculating 54 Bicycle Level of Service (BLOS) as part of “Multimodal LOS” analysis. The intent of the 55 BLOS score is to provide a way of measuring the perceived levels of safety and comfort 56 of bicyclists riding in a roadway environment. The methodology provides for readily 57 measurable roadway and traffic values to be entered in a model that provides a numerical 58 BLOS value. This numerical score is then translated into a pseudo-academic letter grade 59 scaled from “A” to “F” using the stratification shown in Table 1. The HCM methodology 60 is essentially the standard for transportation engineering analysis in numerous locations 61 throughout the United States. 62 63 NCHRP 3-70 Multimodal Level of Service Analysis for Urban Streets 64 The HCM BLOS model was developed as part of NCHRP 3-70 Multimodal Level of 65 Service Analysis for Urban Streets.(2) Phase III of this NCHRP project included the 66 evaluation of eleven roadways to assess how well the multimodal LOS methods worked 67 on real roadway. This analysis included evaluations of roadways in Atlanta, GA (four 68 roadways) Austin, TX (three roadways), and San Antonio, TX (four roadways). FDOT 69 supplemented these roadways with eight additional roadways: four in Tallahassee, and 70 four in Tampa. When reviewed by the local communities and a national group of 71 practitioners, the results of these analyses were found to be lacking. The cyclist and 72 practitioners found the HCM methodology for calculating BLOS does not provide 73 intuitive results. 74 75 76 The HCM methodology suffers in three primary areas: 1) it does not provide an adequate 77 range of LOS scores, 2) it does not provide enough sensitivity to the addition of roadway 78 improvements for bicycles 3) the model does not properly weight the poorest performing 79 portion of a facility. The HCM model, because it has a relatively high constant, makes it 80 difficult to achieve an LOS score of either an “A” or a “B” regardless of how low volume 81 or low speed a roadway might be. Additionally, an LOS of “F” is difficult to achieve 82 even on high-speed, high-volume roadways. Practitioners also feel that the addition of 83 bike lanes should have a greater impact on the LOS. Lastly, the BLOS model produces 84 link LOS letter grades that are worse than intersection LOS letter grades for a facility. 85 This project, and this paper, is intended to address these shortcomings. 86 87 Additionally the current model uses a weighted average method of determining the 88 overall level of service for a segment (combination of multiple link-intersection analyses 89 sections). Some practitioners felt that this understated the impact of roadway links with 90 very poor level of service. It is hypothesized that particularly bad links of roadway have a 91 more pronounced effect on the perception of the segment. Consequently, some weighting 92 factor that considers the actual LOS grade is included as a consideration in this project. 93 94 The Existing HCM Model 95 The exiting form of the HCM BLOS model is as follows: 96 97
TRB 2014 Annual Meeting Original paper submittal - not revised by author
Petritsch, et al 4
E:\8308-13 2012 HCM Bike LOS for Arterial Roadways\Addressing Deficiencies in the HCM Bike Level of Service 04.docx
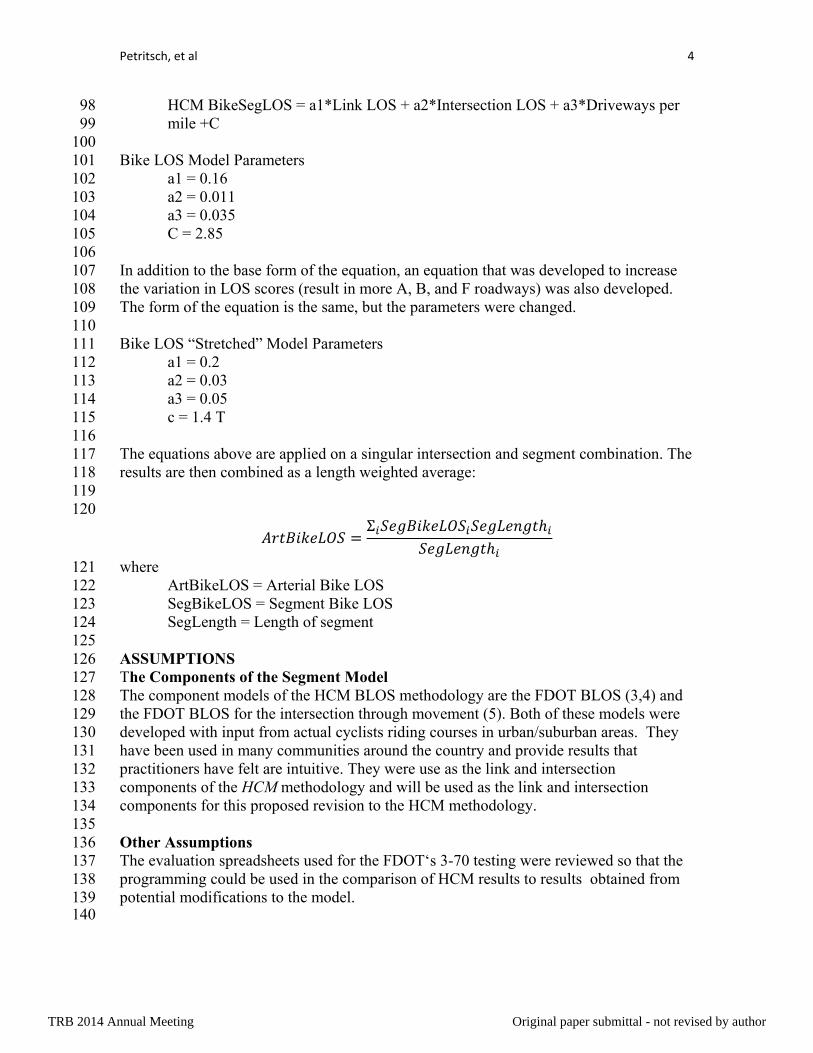
HCM BikeSegLOS = a1*Link LOS + a2*Intersection LOS + a3*Driveways per 98 mile +C 99
100 Bike LOS Model Parameters 101
a1 = 0.16 102 a2 = 0.011 103 a3 = 0.035 104 C = 2.85 105 106
In addition to the base form of the equation, an equation that was developed to increase 107 the variation in LOS scores (result in more A, B, and F roadways) was also developed. 108 The form of the equation is the same, but the parameters were changed. 109 110 Bike LOS “Stretched” Model Parameters 111
a1 = 0.2 112 a2 = 0.03 113 a3 = 0.05 114 c = 1.4 T 115 116
The equations above are applied on a singular intersection and segment combination. The 117 results are then combined as a length weighted average: 118 119 120
Σ
where 121 ArtBikeLOS = Arterial Bike LOS 122 SegBikeLOS = Segment Bike LOS 123 SegLength = Length of segment 124
125 ASSUMPTIONS 126 The Components of the Segment Model 127 The component models of the HCM BLOS methodology are the FDOT BLOS (3,4) and 128 the FDOT BLOS for the intersection through movement (5). Both of these models were 129 developed with input from actual cyclists riding courses in urban/suburban areas. They 130 have been used in many communities around the country and provide results that 131 practitioners have felt are intuitive. They were use as the link and intersection 132 components of the HCM methodology and will be used as the link and intersection 133 components for this proposed revision to the HCM methodology. 134 135 Other Assumptions 136 The evaluation spreadsheets used for the FDOT‘s 3-70 testing were reviewed so that the 137 programming could be used in the comparison of HCM results to results obtained from 138 potential modifications to the model. 139 140
TRB 2014 Annual Meeting Original paper submittal - not revised by author

Petritsch, et al 5
E:\8308-13 2012 HCM Bike LOS for Arterial Roadways\Addressing Deficiencies in the HCM Bike Level of Service 04.docx
When beginning this project, a sample roadway was evaluated using the HCM 141 methodology. Using a sample of five segments, with various inputs the results shown in 142 Table 2 were reported by the FDOT 3-70 testing spreadsheet. Each line represents one 143 link and a single downstream signal. 144 145 146 Please note the following: 147
Line 1 has a truck percentage of 25% and poor pavement. This explains the 17.6 148 value for the segment LOS score. It does not seem reasonable that a good 149 intersection would improve bicyclists overall perception of the roadway as much 150 as this suggests. While still an LOS of F, it is a much better F as a result of the 151 intersection. 152
Lines 2 and 3 suggest a second issue. The overall levels of service are three and 153 two letter grades worse than either of the component scores. Segment 2 has link 154 and intersection LOSs of A; Segment 2 a link LOS grade of B and an intersection 155 LOS of A. Both have a composite score of LOS D for the overall section. While 156 a numerous driveways could conceivably account for this shift, the constant of 157 2.85 is the primary cause of this shift. 158
Lines 4 and 5 suggest that encountering a good intersection improves the overall 159 perception of the roadway segment. 160 161
After discussion with the review panel, the researchers made the following 162 recommendations for base assumptions of the level of service: 163
1. The link BLOS should control the BLOS on the segment. That is, the BLOS for 164 the segment should never be better than the BLOS for the link. One possible 165 exception might be in the absence of driveways (seen point 3 below). 166
2. Except as modified by driveways per mile the Segment BLOS should not be 167 worse that the worse of either the link or intersection BLOS. 168
3. Some base driveways per mile should be assumed. Zero driveways per mile is not 169 a typical base condition for an arterial roadway. We recommend looking at the 170 original Ride for Science data and determining a assumed base number of 171 driveways and applying the driveway factor coefficient to the actual number of 172 driveways minus the assumed number. The result could be a slightly improved 173 BLOS, however given the coefficient and the likely assumed value, the 174 improvement would not be that great. 175 176
The review panel agreed with these base assumptions. 177 178 DEVELOPMENT OF THE REVISED METHODOLOGY 179 During discussions of the Transportation Research Board Highway Capacity and Quality 180 of Service Committee Pedestrians and Bicycles Subcommittee, a recommendation was 181 made to consider time-based exposure weighted coefficients for the ArtBikeLOS model. 182 Because intersections do not represent a length along a facility, it was suggested that time 183 would be a better weighting factor. 184 185
TRB 2014 Annual Meeting Original paper submittal - not revised by author
Petritsch, et al 6
E:\8308-13 2012 HCM Bike LOS for Arterial Roadways\Addressing Deficiencies in the HCM Bike Level of Service 04.docx
The additional consideration was the impact of links with varying “badness” on the 186 perception of the overall arterial segment. It is hypothesized that particularly bad links of 187 roadway have a more pronounced effect on the perception of the segment. An 188 exponential weighted average was considered to compensate for this hypothesized 189 phenomenon. However, applying an exponent to the BLOS would be problematic as it 190 can have a negative value. Applying an exponent of less than one to the exposure was 191 recommended as an alternative by a panel member and this is the approach taken 192 forward. 193 194 Thus, the revised model form would be as follows: 195 196
ΣΣ
197 where 198
CompBLOS = either link or intersection bicycle BLOS (the driveway factor 199 would become a term in the link BLOS model) 200 CompTime = time exposed to link or intersection bicycle LOS 201 n = exponent modifier for weighted average 202
203 CompTime for links was calculated using the segment length and an assumed bicyclist’s 204 speed of 12 mph. for intersections was calculated using the simple delay equation 205
2
where 206 C = cycle length 207 g = green time 208
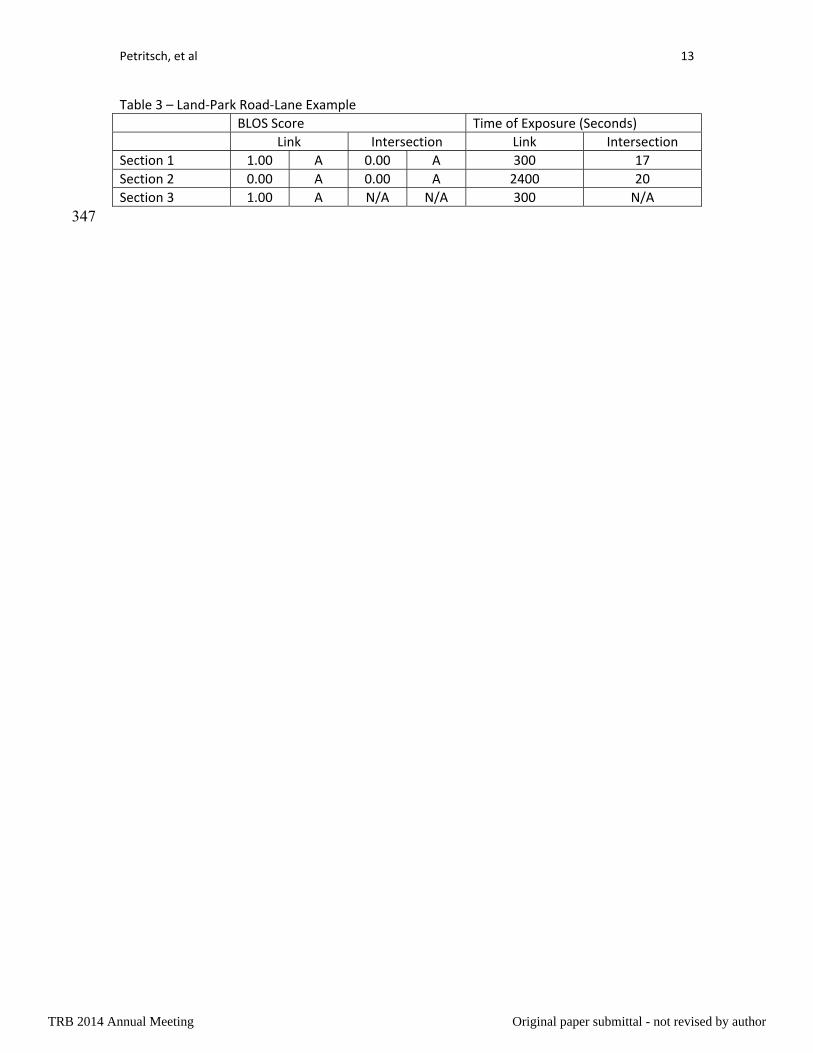
209 This proposed time-based exposure model also allows sensitivity to the speed of 210 bicyclists. This would allow the user to select an appropriate bicyclist cohort and thus 211 better represent the relative times spent riding on links or delayed at intersections. 212 Additionally, the speeds could be adjusted based upon the grade of the roadway. 213 214 Discussion of the Exponents 215 For this discussion we ask the reader participate in a thought experiment. Consider an 216 eight-mile bike ride on a very pleasant facility, perhaps an extremely low speed, 217 extremely low volume roadway or a park access used only by one or two service vehicles 218 a day road (shared use path like in all respects except that it was built as an access road 219 for service vehicles). Such a roadway could score a negative link level of service value, 220 but for the purposes of this thought experiment, assume a value of zero, a very good “A.” 221 To get to this eight mile bike ride one needs only to ride on a quiet lane, BLOS numerical 222 score of 1, an “A.” Likewise the intersections linking the path to the roadway are 223 excellent, assume BLOS value 0.00. Ignoring the conflicts per mile term of the Bike 224 Segment LOS equations for now, and assuming an average bicycle speed of 12 mph, in 225 tabular format the trip would be represented in Table 3: 226 227
TRB 2014 Annual Meeting Original paper submittal - not revised by author

Petritsch, et al 7
E:\8308-13 2012 HCM Bike LOS for Arterial Roadways\Addressing Deficiencies in the HCM Bike Level of Service 04.docx
Consider the Figure 1. 228 The solid LOS line indicates the link or intersection LOS experienced at any 229
given point during the trip (trip time has been converted to % of trip time so all 230 charts in this paper will have a similar horizontal scale). 231
The HCM (dotted) line represents the ArtBikeLOS as calculated using the base 232 HCM method. 233
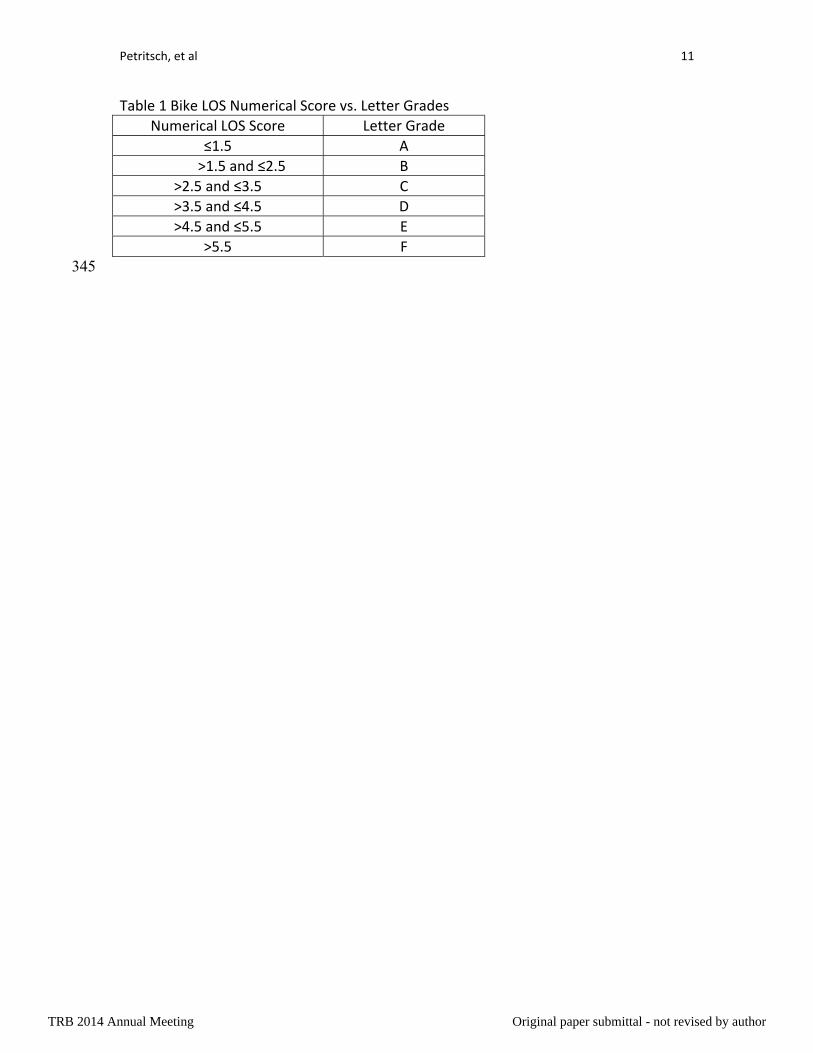
The HCM Stretched (dashed) line represents the ArtBikeLOS as calculated using 234 the base HCM method adjusted to expand the range of scores. 235
The LinExposure (long dash-dot) line represents the time weighted average LOS 236 with no exponent applied (linear). 237
The Exp 0.5 (short dash-dot) line represents the time weighted average LOS with 238 an exponent of 0.5 applied. 239
The Exp 0.25 (long dash-dot-dot) line represents the time weighted average LOS 240 with an exponent of 3 applied (cubed). 241 242
The values associated with each of the calculated segment BLOS methods are shown in 243 Table 4. 244 245 From this example it is clear that the HCM method calculates BLOS that is much worse 246 that could reasonably be expected. While the Stretched HCM method results in a BLOS 247 of “A”, the numerical score still exceeds any of the individual component parts; again, 248 this is does not appear reasonable. The LinExposure, Exp 0.5, and Exp 0.25 BLOS 249 methods all yield considerably reasonable results. This example provides little support for 250 using any method more complicated than a linear time-weighted average of the individual 251 component BLOS scores. 252 253 As another thought experiment, consider that to get to this eight-mile path-like roadway 254 bike ride, one must ride on 1 mile of unpleasant very congested, higher speed facilities 255 without bike lanes or paved shoulders. Assume an LOS value of 6.00 for this roadway. 256 Further assume the intersections have a BLOS value of 3.00. Ignoring the conflicts per 257 mile term of the ArtBikeLOS equations for now, in tabular format the trip would be 258 represented in Table 5. 259 260 The values associated with each of the calculated segment BLOS methods are shown in 261 Table 6. 262 263 In this second example, the linear time-weighted average does not seem to adequately 264 represent the impact of the degradation of having to spend nearly 20% of the trip time on 265 a very bad roadway. Either the 0.5 exponent time-weighted method or 0.25 exponent 266 time-weighted method might be considered to reasonably represent the over BLOS for 267 the ride. Members of the bike and pedestrian subcommittee were of the opinion that the 268 0.5 exponent function more accurately represented conditions along the facility. Figure 2 269 below provides a graphic example of how the methodologies compared. 270 271 Chart similar to those shown above for the two-thought experiments were developed for 272 all 19 of the roadways evaluated during the NCHRP 3-70 Phase III effort. Space 273
TRB 2014 Annual Meeting Original paper submittal - not revised by author
Petritsch, et al 8
E:\8308-13 2012 HCM Bike LOS for Arterial Roadways\Addressing Deficiencies in the HCM Bike Level of Service 04.docx
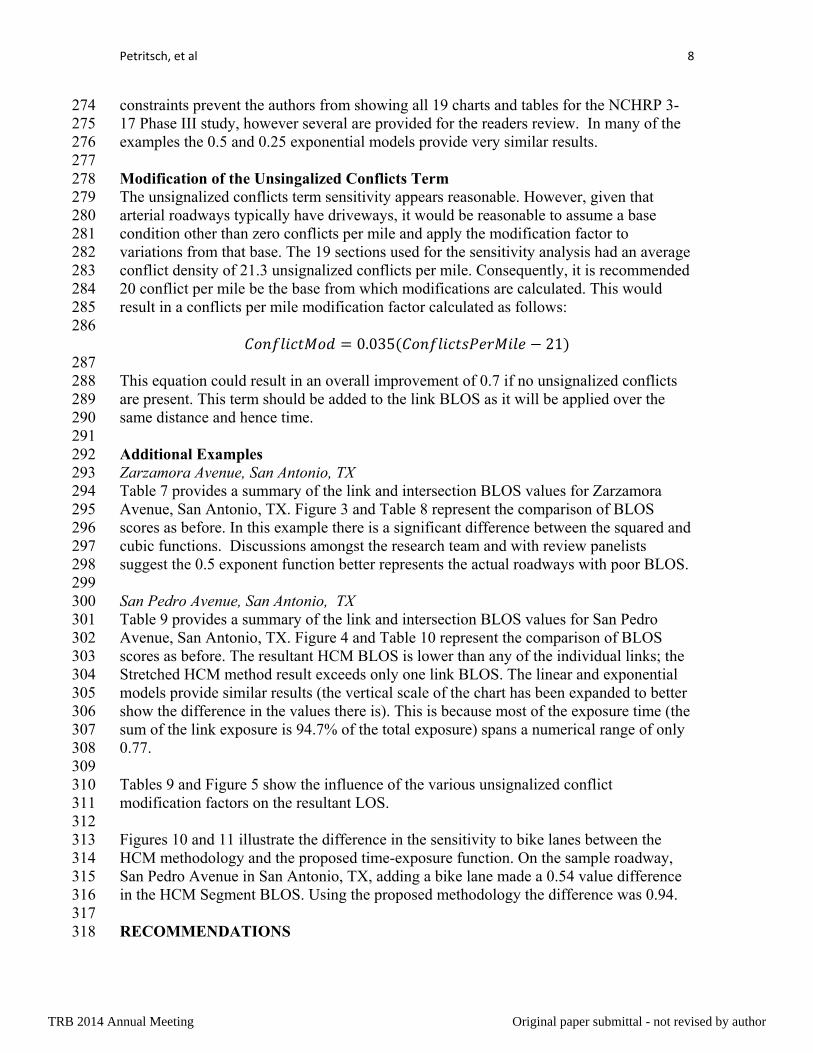
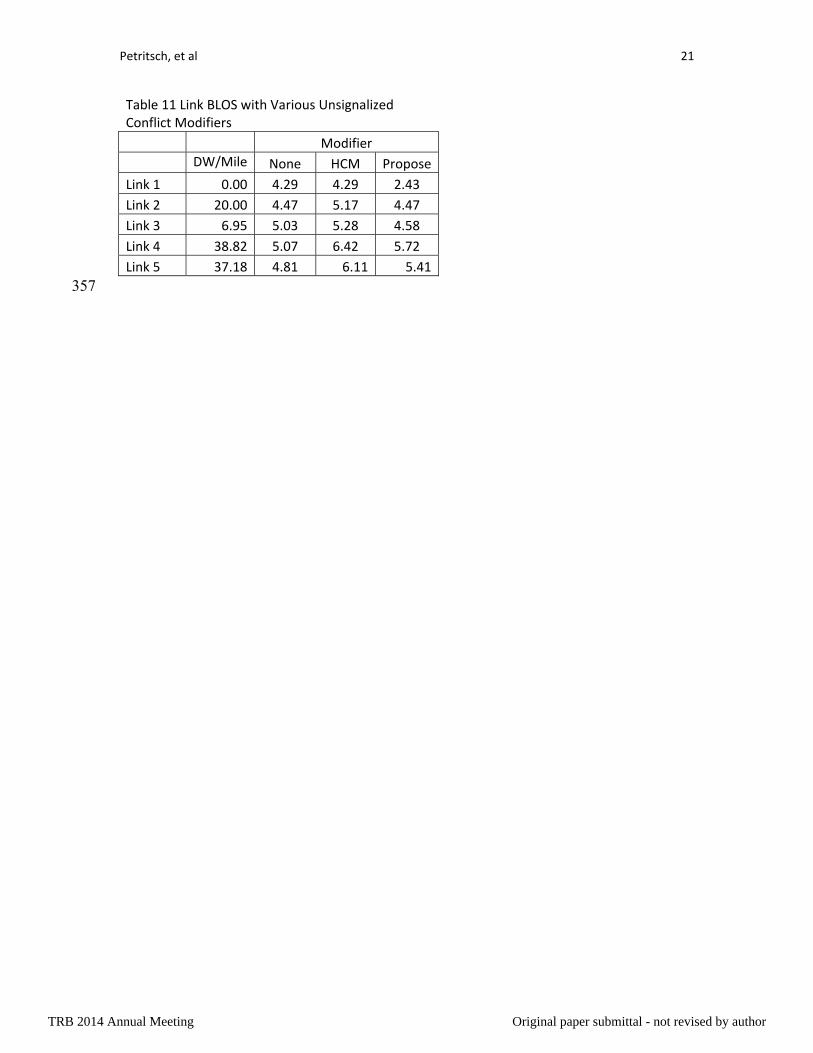
constraints prevent the authors from showing all 19 charts and tables for the NCHRP 3-274 17 Phase III study, however several are provided for the readers review. In many of the 275 examples the 0.5 and 0.25 exponential models provide very similar results. 276 277 Modification of the Unsingalized Conflicts Term 278 The unsignalized conflicts term sensitivity appears reasonable. However, given that 279 arterial roadways typically have driveways, it would be reasonable to assume a base 280 condition other than zero conflicts per mile and apply the modification factor to 281 variations from that base. The 19 sections used for the sensitivity analysis had an average 282 conflict density of 21.3 unsignalized conflicts per mile. Consequently, it is recommended 283 20 conflict per mile be the base from which modifications are calculated. This would 284 result in a conflicts per mile modification factor calculated as follows: 285 286
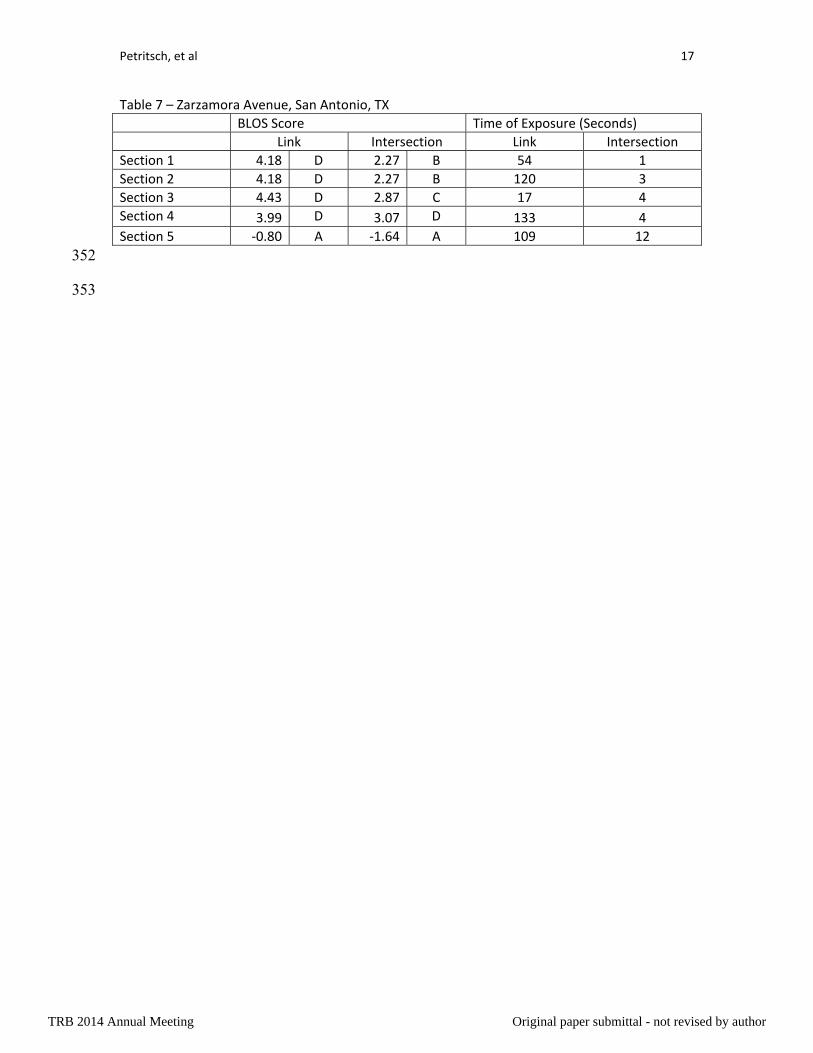
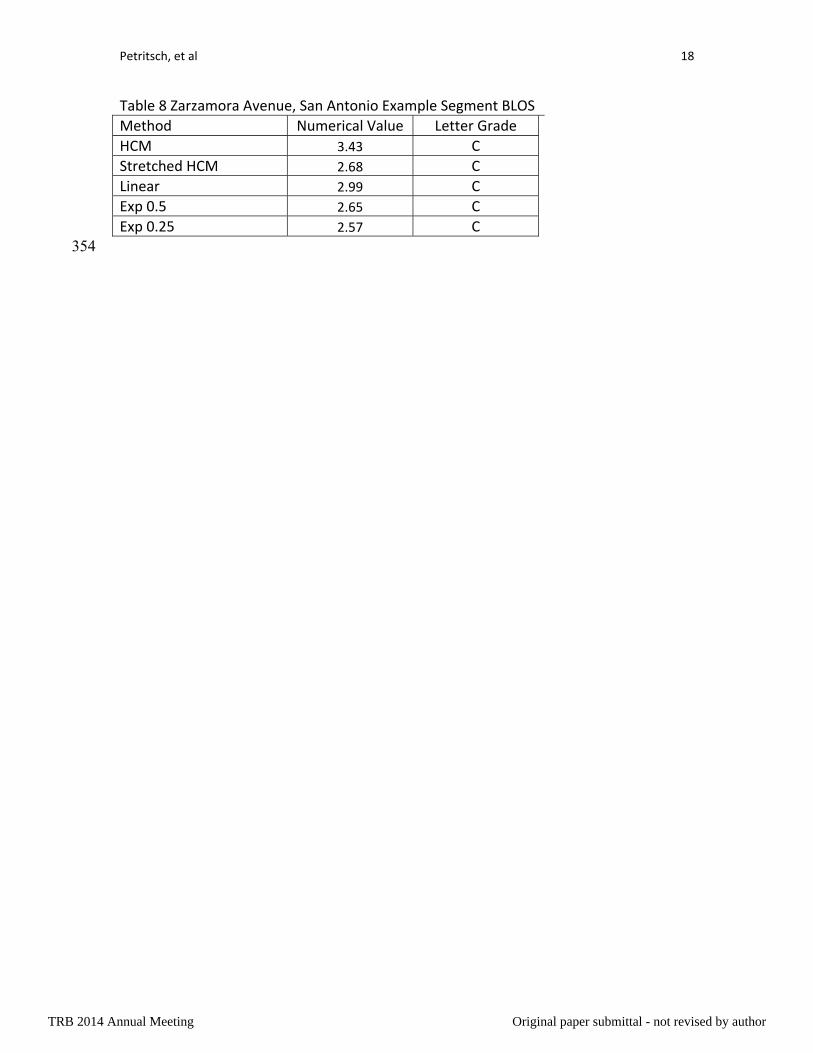
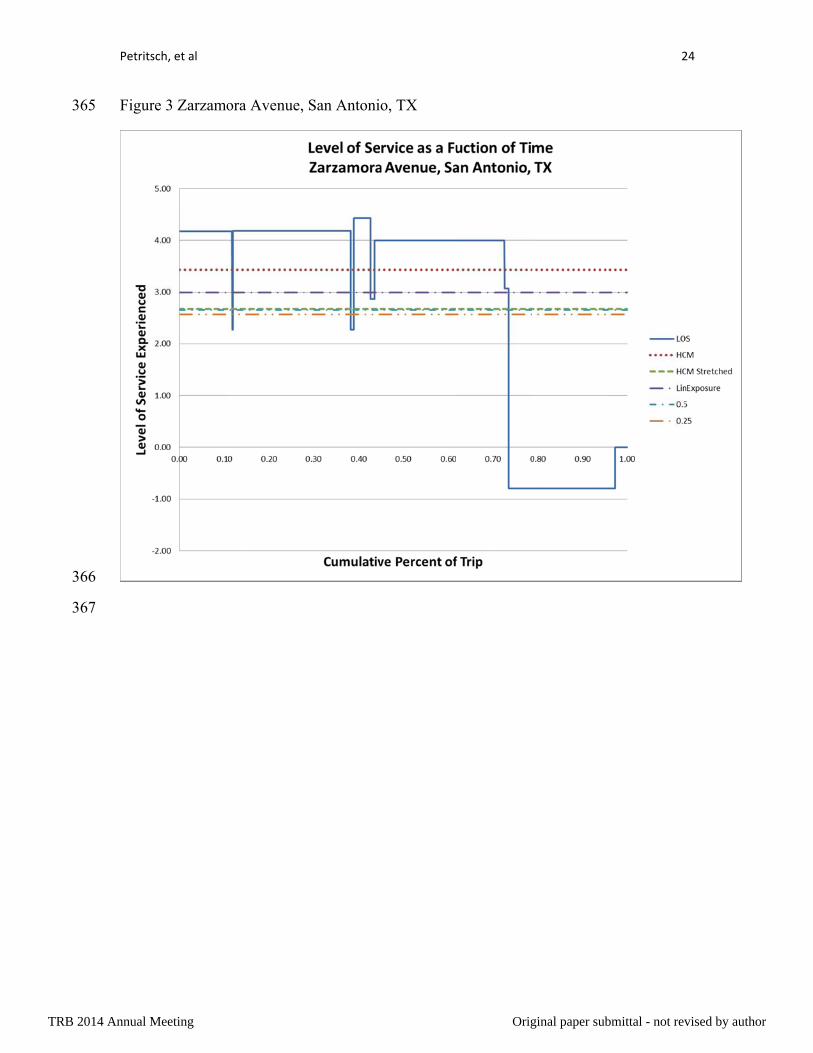
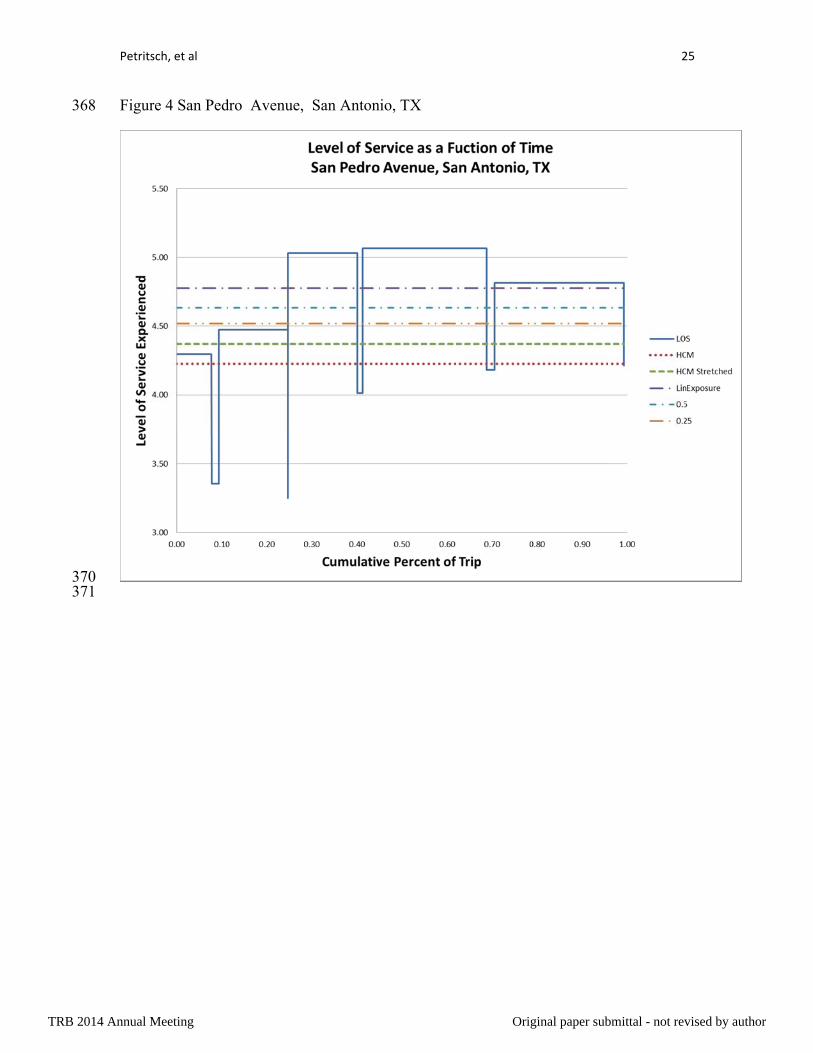
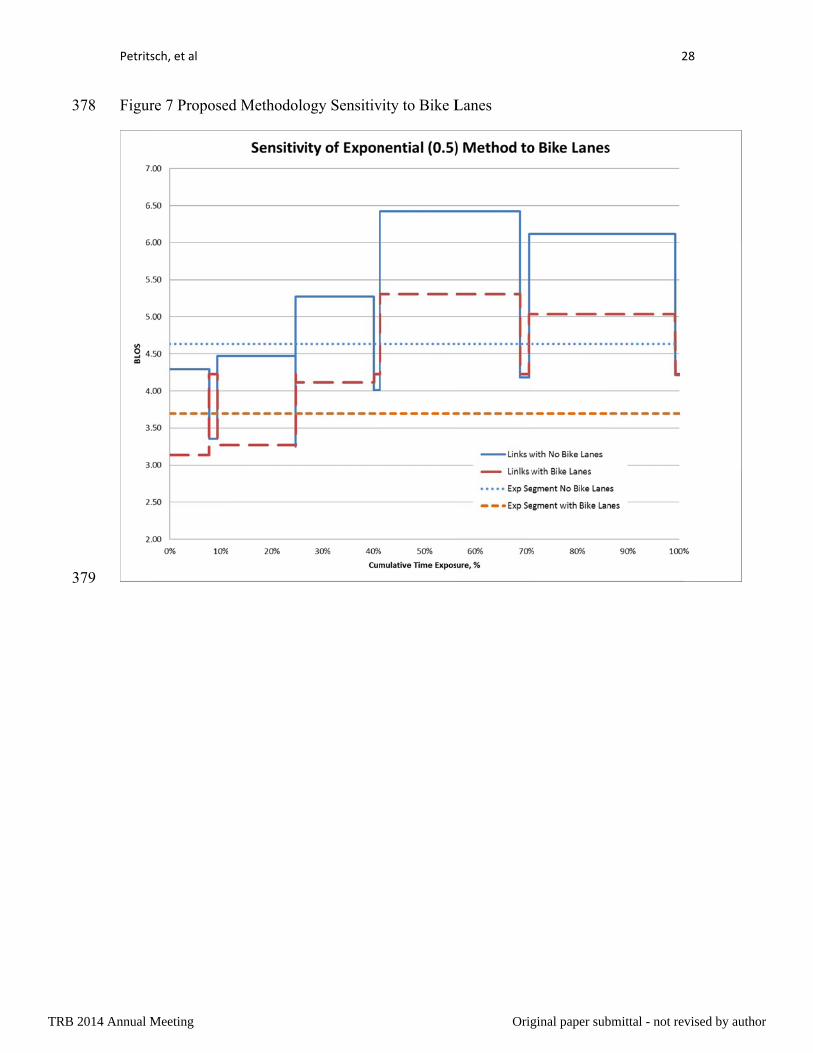
0.035 21 287 This equation could result in an overall improvement of 0.7 if no unsignalized conflicts 288 are present. This term should be added to the link BLOS as it will be applied over the 289 same distance and hence time. 290 291 Additional Examples 292 Zarzamora Avenue, San Antonio, TX 293 Table 7 provides a summary of the link and intersection BLOS values for Zarzamora 294 Avenue, San Antonio, TX. Figure 3 and Table 8 represent the comparison of BLOS 295 scores as before. In this example there is a significant difference between the squared and 296 cubic functions. Discussions amongst the research team and with review panelists 297 suggest the 0.5 exponent function better represents the actual roadways with poor BLOS. 298 299 San Pedro Avenue, San Antonio, TX 300 Table 9 provides a summary of the link and intersection BLOS values for San Pedro 301 Avenue, San Antonio, TX. Figure 4 and Table 10 represent the comparison of BLOS 302 scores as before. The resultant HCM BLOS is lower than any of the individual links; the 303 Stretched HCM method result exceeds only one link BLOS. The linear and exponential 304 models provide similar results (the vertical scale of the chart has been expanded to better 305 show the difference in the values there is). This is because most of the exposure time (the 306 sum of the link exposure is 94.7% of the total exposure) spans a numerical range of only 307 0.77. 308 309 Tables 9 and Figure 5 show the influence of the various unsignalized conflict 310 modification factors on the resultant LOS. 311 312 Figures 10 and 11 illustrate the difference in the sensitivity to bike lanes between the 313 HCM methodology and the proposed time-exposure function. On the sample roadway, 314 San Pedro Avenue in San Antonio, TX, adding a bike lane made a 0.54 value difference 315 in the HCM Segment BLOS. Using the proposed methodology the difference was 0.94. 316 317 RECOMMENDATIONS 318
TRB 2014 Annual Meeting Original paper submittal - not revised by author

Petritsch, et al 9
E:\8308-13 2012 HCM Bike LOS for Arterial Roadways\Addressing Deficiencies in the HCM Bike Level of Service 04.docx
The HCM Segment bike LOS methodology should be replaced with a methodology that 319 is more sensitive to the roadway conditions and better represents the conditions of the 320 roadway. Based upon the consensus of a practitioners, a 0.5 exponent based time-321 exposure function should be considered as an alternative to the HCM method. 322 Additionally, the driveway modification factor should be modified to reflect a base 323 number of driveways and be applied directly to the link BLOS. 324
ACKNOWLEDGMENTS 325
The authors wish to thank the members of the TRB Highway Capacity and Quality of 326 Service Committee Pedestrians and Bicycles Subcommittee who donated their valuable 327 time to provide feedback on this project. In particular we would like to thank Robert 328 Bryson, Janice Daniels, Martin Guttenplan, Peyton McLeod, and a special thank you to 329 Jamie Parks for his help with the eliminating the exponent of a negative problem. 330 331 REFERENCES 332 (1) Transportation Research Board, Highway Capacity Manual 2010, Transportation 333 Research Board of the National Academy of the Sciences (TRB), Washington, D.C., 334 2010. 335 (2) Dowling, R., et al, NCHRP Report 616 Multimodal Level of Service Analysis for 336 Urban Streets, TRB, Washington, D.C., 2008. 337 (3) FDOT, Quality/Level of Service Handbook, FDOT, Tallahassee, FL, 2009. 338 (4) Landis, B., V. Vattikuti, and M. Brannick. “Real-Time Human Perceptions: Toward a 339 Bicycle Level of Service,” Transportation Research Record 1578, Transportation 340 Research Board, National Research Council, Washington, DC, 1997. 341 (5)Landis, B., et al. “Bicycle Level of Service for Arterials.” Presented at the 342 Transportation Research Board Annual Meeting, Washington, DC, 2007. 343
TRB 2014 Annual Meeting Original paper submittal - not revised by author

Petritsch, et al 10
E:\8308-13 2012 HCM Bike LOS for Arterial Roadways\Addressing Deficiencies in the HCM Bike Level of Service 04.docx
Tables and Figures 344
TRB 2014 Annual Meeting Original paper submittal - not revised by author
Petritsch, et al 11
E:\8308-13 2012 HCM Bike LOS for Arterial Roadways\Addressing Deficiencies in the HCM Bike Level of Service 04.docx
Table 1 Bike LOS Numerical Score vs. Letter Grades
Numerical LOS Score Letter Grade
≤1.5 A
>1.5 and ≤2.5 B
>2.5 and ≤3.5 C
>3.5 and ≤4.5 D
>4.5 and ≤5.5 E
>5.5 F 345
TRB 2014 Annual Meeting Original paper submittal - not revised by author

Petritsch, et al 12
E:\8308-13 2012 HCM Bike LOS for Arterial Roadways\Addressing Deficiencies in the HCM Bike Level of Service 04.docx
Table 2 ‐ Computed Bicycle LOS
Segment & Link Intersect Bicycle BicycleDownstream LOS LOS Score LOS Signal (#) (#) (#)
1 17.56 1.40 6.37 F 2 ‐0.03 0.27 3.56 D 3 2.28 0.13 3.65 D 4 3.53 ‐0.16 3.42 C 5 3.71 1.11 3.48 C
Average 4.98 E 346
TRB 2014 Annual Meeting Original paper submittal - not revised by author
Petritsch, et al 13
E:\8308-13 2012 HCM Bike LOS for Arterial Roadways\Addressing Deficiencies in the HCM Bike Level of Service 04.docx
Table 3 – Land‐Park Road‐Lane Example
BLOS Score Time of Exposure (Seconds)
Link Intersection Link Intersection
Section 1 1.00 A 0.00 A 300 17
Section 2 0.00 A 0.00 A 2400 20
Section 3 1.00 A N/A N/A 300 N/A
347
TRB 2014 Annual Meeting Original paper submittal - not revised by author

Petritsch, et al 14
E:\8308-13 2012 HCM Bike LOS for Arterial Roadways\Addressing Deficiencies in the HCM Bike Level of Service 04.docx
Table 4 Lane‐Path‐Lane Example Segment BLOS
Method Numerical Value Letter Grade
HCM 2.91 C
Stretched HCM 1.49 A
Linear 0.20 A
Exp 0.5 0.43 A
Exp 0.25 0.38 A 348
TRB 2014 Annual Meeting Original paper submittal - not revised by author

Petritsch, et al 15
E:\8308-13 2012 HCM Bike LOS for Arterial Roadways\Addressing Deficiencies in the HCM Bike Level of Service 04.docx
Table 5 – Road‐Path‐Road Example
BLOS Score Time of Exposure (Seconds)
Link Intersection Link Intersection
Section 1 6.00 F 3.00 C 300 17
Section 2 0.00 A 3.00 C 2400 20
Section 3 6.00 F N/A N/A 300 N/A
349
TRB 2014 Annual Meeting Original paper submittal - not revised by author

Petritsch, et al 16
E:\8308-13 2012 HCM Bike LOS for Arterial Roadways\Addressing Deficiencies in the HCM Bike Level of Service 04.docx
350
Table 6 Road‐Path‐Road Example Segment BLOS
Method Numerical Value Letter Grade
HCM 3.38 C
Stretched HCM 2.40 B
Linear 1.24 A
Exp 0.5 2.53 C
Exp 0.25 3.20 C 351
TRB 2014 Annual Meeting Original paper submittal - not revised by author
Petritsch, et al 17
E:\8308-13 2012 HCM Bike LOS for Arterial Roadways\Addressing Deficiencies in the HCM Bike Level of Service 04.docx
Table 7 – Zarzamora Avenue, San Antonio, TX
BLOS Score Time of Exposure (Seconds)
Link Intersection Link Intersection
Section 1 4.18 D 2.27 B 54 1
Section 2 4.18 D 2.27 B 120 3
Section 3 4.43 D 2.87 C 17 4
Section 4 3.99 D 3.07 D 133 4
Section 5 ‐0.80 A ‐1.64 A 109 12
352
353
TRB 2014 Annual Meeting Original paper submittal - not revised by author
Petritsch, et al 18
E:\8308-13 2012 HCM Bike LOS for Arterial Roadways\Addressing Deficiencies in the HCM Bike Level of Service 04.docx
Table 8 Zarzamora Avenue, San Antonio Example Segment BLOS
Method Numerical Value Letter Grade
HCM 3.43 C
Stretched HCM 2.68 C
Linear 2.99 C
Exp 0.5 2.65 C
Exp 0.25 2.57 C 354
TRB 2014 Annual Meeting Original paper submittal - not revised by author

Petritsch, et al 19
E:\8308-13 2012 HCM Bike LOS for Arterial Roadways\Addressing Deficiencies in the HCM Bike Level of Service 04.docx
Table 9 – San Pedro Avenue, San Antonio, TX
BLOS Score Time of Exposure (Seconds)
Link Intersection Link Intersection
Section 1 4.29 D 3.36 C 22 4
Section 2 4.47 D 3.25 C 43 0
Section 3 5.03 E 4.01 D 43 3
Section 4 5.07 E 4.18 D 77 5
Section 5 4.81 E 4.21 D 81 2
355
TRB 2014 Annual Meeting Original paper submittal - not revised by author

Petritsch, et al 20
E:\8308-13 2012 HCM Bike LOS for Arterial Roadways\Addressing Deficiencies in the HCM Bike Level of Service 04.docx
Table 10 San Pedro Avenue, San Antonio, TX Example Segment BLOS
Method Numerical Value Letter Grade
HCM 4.23 D
Stretched HCM 4.37 D
Linear 4.78 E
Exp 0.5 4.63 E
Exp 0.25 4.52 E 356
TRB 2014 Annual Meeting Original paper submittal - not revised by author
Petritsch, et al 21
E:\8308-13 2012 HCM Bike LOS for Arterial Roadways\Addressing Deficiencies in the HCM Bike Level of Service 04.docx
Table 11 Link BLOS with Various Unsignalized Conflict Modifiers
Modifier
DW/Mile None HCM Propose
Link 1 0.00 4.29 4.29 2.43
Link 2 20.00 4.47 5.17 4.47
Link 3 6.95 5.03 5.28 4.58
Link 4 38.82 5.07 6.42 5.72
Link 5 37.18 4.81 6.11 5.41
357
TRB 2014 Annual Meeting Original paper submittal - not revised by author

3
3
3
Petrits
E:\83004.doc
Figur359
360
361
sch, et al
8-13 2012 HCMx
re 1 Lane-Pa
M Bike LOS for A
ark Road-La
Arterial Roadwa
ane Example
ays\Addressing D
e
Deficiencies in thhe HCM Bike L
2
Level of Service
22
TRB 2014 Annual Meeting Original paper submittal - not revised by author

3
3
3
Petrits
E:\83004.doc
Figur362
363
364
sch, et al
8-13 2012 HCMx
re 2 Road-P
M Bike LOS for A
Park Road-Ro
Arterial Roadwa
oad Exampl
ays\Addressing D
e
Deficiencies in thhe HCM Bike L
2
Level of Service
23
TRB 2014 Annual Meeting Original paper submittal - not revised by author
3
3
3
Petrits
E:\83004.doc
Figur365
366
367
sch, et al
8-13 2012 HCMx
re 3 Zarzamo
M Bike LOS for A
ora Avenue,
Arterial Roadwa
San Antoni
ays\Addressing D
o, TX
Deficiencies in thhe HCM Bike L
2
Level of Service
24
TRB 2014 Annual Meeting Original paper submittal - not revised by author
3
33
Petrits
E:\83004.doc
Figur368
370 371
sch, et al
8-13 2012 HCMx
re 4 San Ped
M Bike LOS for A
dro Avenue,
Arterial Roadwa
San Antoni
ays\Addressing D
io, TX
Deficiencies in thhe HCM Bike L
2
Level of Service
25
TRB 2014 Annual Meeting Original paper submittal - not revised by author

33
3
3
Petrits
E:\83004.doc
Figur371 San P373
374
374
sch, et al
8-13 2012 HCMx
re 5 IllustratPedro Avenu
M Bike LOS for A
tion of Potenue, San Anto
Arterial Roadwa
ntial Unsignaonio, TX
ays\Addressing D
alized Confl
Deficiencies in th
lict Modifier
he HCM Bike L
r Options
2
Level of Service
26
TRB 2014 Annual Meeting Original paper submittal - not revised by author

3
3
3
Petrits
E:\83004.doc
Figur375
376
377
sch, et al
8-13 2012 HCMx
re 6 HCM M
M Bike LOS for A
Method Sens
Arterial Roadwa
sitivity to Bik
ays\Addressing D
ke Lanes
Deficiencies in thhe HCM Bike L
2
Level of Service
27
TRB 2014 Annual Meeting Original paper submittal - not revised by author
3
3
Petrits
E:\83004.doc
Figur378
379
sch, et al
8-13 2012 HCMx
re 7 Propose
M Bike LOS for A
d Methodolo
Arterial Roadwa
ogy Sensitiv
ays\Addressing D
vity to Bike L
Deficiencies in th
Lanes
he HCM Bike L
2
Level of Service
28
TRB 2014 Annual Meeting Original paper submittal - not revised by author