Adding Tables to Slides 5 - landofhoz.comlandofhoz.com/For Students/MS IT Academy/PowerPoint...
31
KEY TERMS • cells • embedded • linked • table • worksheet Adding Tables to Slides 5 159 LESSON SKILL MATRIX Skill Exam Objective Objective Number Creating Tables Draw a table. 4.1.1 Inserting a Microsoft Excel Spreadsheet Insert a Microsoft Excel spreadsheet. 4.1.2 Modifying Table Layout Adjust columns and rows. 4.1.7 Formatting Tables Set table style options. 4.1.3 Add shading. 4.1.4 Add borders. 4.1.5 Add effects. 4.1.6 Adjust columns and rows. 4.1.7
Transcript of Adding Tables to Slides 5 - landofhoz.comlandofhoz.com/For Students/MS IT Academy/PowerPoint...

KEY TERMS• cells
• embedded
• linked
• table
• worksheet
Adding Tables to Slides 5
159
LESSON SKILL MATRIX
Skill Exam Objective Objective Number
Creating Tables Draw a table. 4.1.1
Inserting a Microsoft Excel Spreadsheet Insert a Microsoft Excel spreadsheet. 4.1.2
Modifying Table Layout Adjust columns and rows. 4.1.7
Formatting Tables Set table style options. 4.1.3 Add shading. 4.1.4 Add borders. 4.1.5 Add effects. 4.1.6 Adjust columns and rows. 4.1.7
c05AddingTablestoSlides.indd Page 159 8/26/11 10:58 AM user f-404 F-402

160 Lesson 5
You are an assistant director of ATM operations at Woodgrove Bank. Your job is to
help oversee the placement and use of ATMs in your bank’s branches and other loca-
tions. You often deliver presentations to bank offi cers to keep them up to date on ATM
activities. The best way to organize information that has several related com-
ponents is to use a table. Distributing information in rows and columns makes
the data easy to read and understand. Use the table features of Microsoft Offi ce
PowerPoint 2010 to modify the structure and appearance of a table to improve
readability and visual interest.
Figure 5-1
A PowerPoint table and the table tools on the Ribbon
Table Tools tabs
Row
Column
SOFTWARE ORIENTATION
A PowerPoint Table
Tables are designed to organize data in columns and rows, as shown in Figure 5-1.
The Table Tools Design tab, shown above, and the Table Tools Layout tab provide tools for modifying and formatting a table. These tabs become active only when a table is selected.
CREATING TABLESWhen you want to organize complex data on a slide, use a table. A table is a grid into which you can type text in the individual cells at the intersection of each column and row. A table’s column and row structure makes data easy to understand. If you need to organize numerical data that may be used in calculations, you can insert an Excel worksheet right on a slide and use Excel’s tools to work with the data.
The Bottom Line
c05AddingTablestoSlides.indd Page 160 8/26/11 11:59 AM user f-404 F-402
Adding Tables to Slides 161
Inserting a TablePowerPoint has automated the process of creating a table so that you can simply specify the number of columns and rows and then type data to achieve a professionally formatted result. PowerPoint offers several ways to insert a table. The simplest is to click the Insert Table icon in any content placeholder. You can also insert a table with the Insert Table dialog box. In this exercise, you create tables using both methods.
STEP BY STEP Insert a Table
GET READY. Before you begin these steps, make sure that your computer is on. Log on, if necessary.
1. START PowerPoint, if the program is not already running.
2. Locate and open the ATMs presentation and save it as ATMs Final.
3. Click below slide 4 in the Slides/Outline pane and press Enter to Insert a new slide with the Title and Content layout after slide 4.
4. On the new slide, click in the title placeholder and type the slide title Proposed ATM Locations.
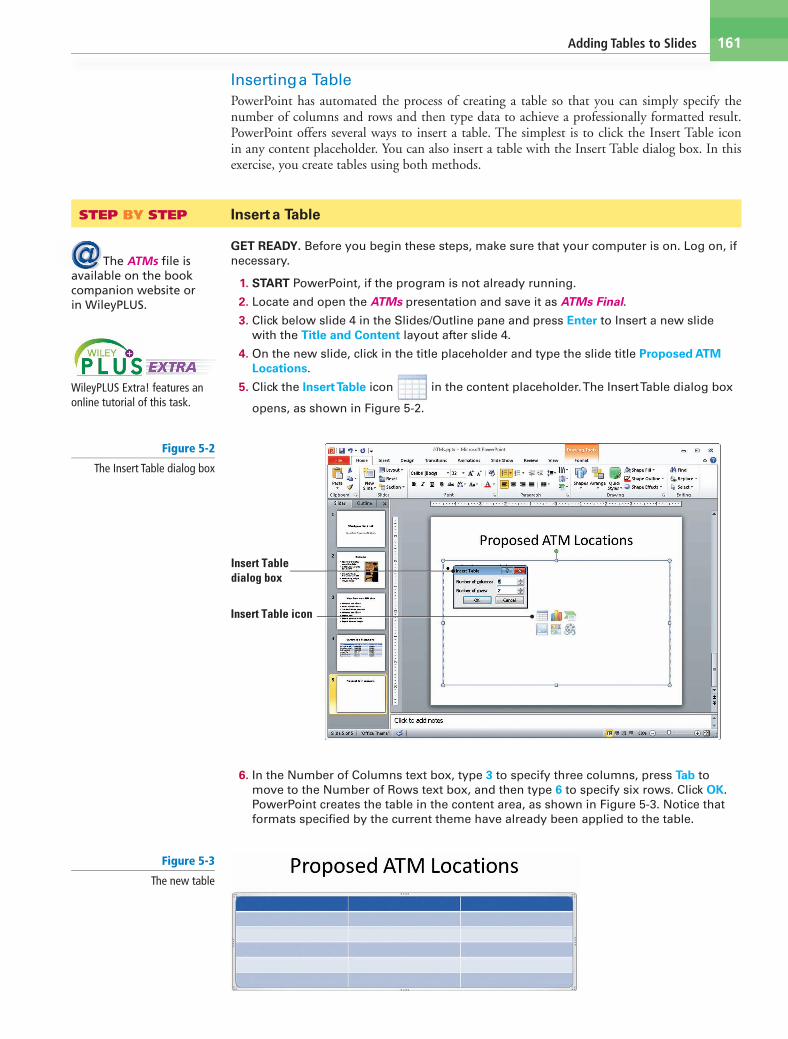
5. Click the Insert Table icon in the content placeholder. The Insert Table dialog box
opens, as shown in Figure 5-2.
Figure 5-2
The Insert Table dialog box
Insert Table icon
Insert Table dialog box
Figure 5-3
The new table
6. In the Number of Columns text box, type 3 to specify three columns, press Tab to move to the Number of Rows text box, and then type 6 to specify six rows. Click OK. PowerPoint creates the table in the content area, as shown in Figure 5-3. Notice that formats specifi ed by the current theme have already been applied to the table.
WileyPLUS Extra! features an online tutorial of this task.
The ATMs fi le is available on the book companion website or in WileyPLUS.
c05AddingTablestoSlides.indd Page 161 21/11/12 8:31 AM user-F408 /Users/user-F408/Desktop
162 Lesson 5
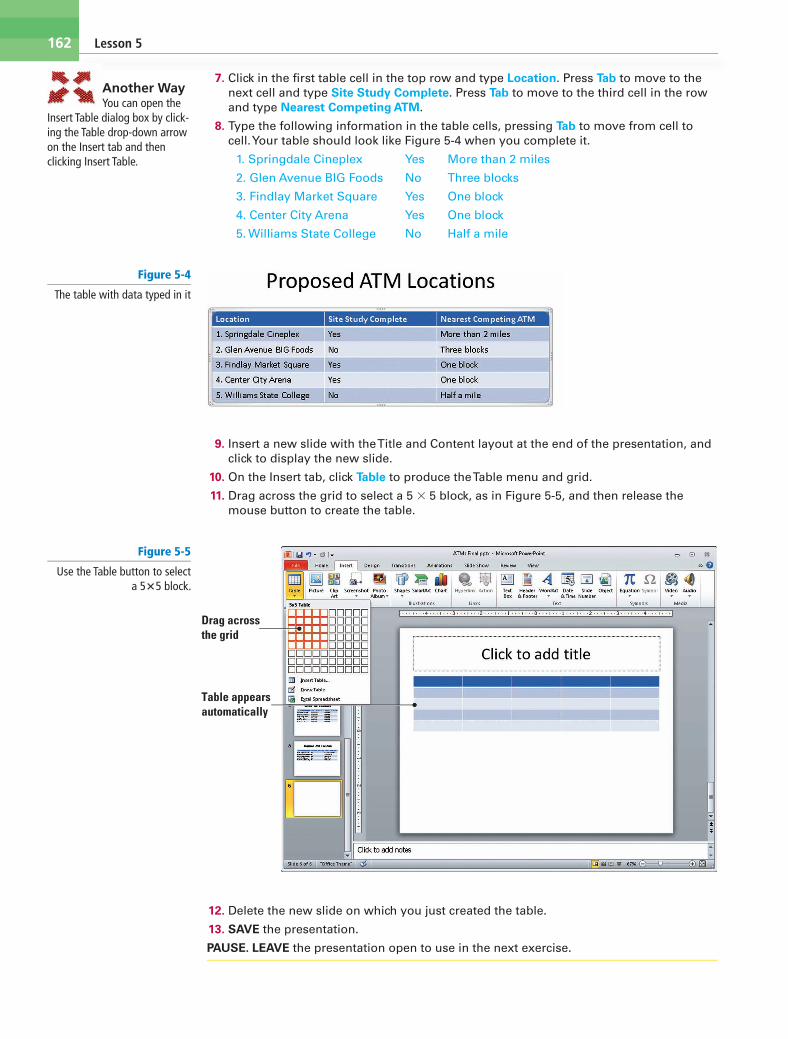
7. Click in the fi rst table cell in the top row and type Location. Press Tab to move to the next cell and type Site Study Complete. Press Tab to move to the third cell in the row and type Nearest Competing ATM.
8. Type the following information in the table cells, pressing Tab to move from cell to cell. Your table should look like Figure 5-4 when you complete it.
1. Springdale Cineplex Yes More than 2 miles
2. Glen Avenue BIG Foods No Three blocks
3. Findlay Market Square Yes One block
4. Center City Arena Yes One block
5. Williams State College No Half a mile
Another WayYou can open the
Insert Table dialog box by click-ing the Table drop-down arrow on the Insert tab and then clicking Insert Table.
Figure 5-4
The table with data typed in it
9. Insert a new slide with the Title and Content layout at the end of the presentation, and click to display the new slide.
10. On the Insert tab, click Table to produce the Table menu and grid.
11. Drag across the grid to select a 5 3 5 block, as in Figure 5-5, and then release the mouse button to create the table.
Figure 5-5
Use the Table button to select a 535 block.
Drag acrossthe grid
Table appears automatically
12. Delete the new slide on which you just created the table.
13. SAVE the presentation.
PAUSE. LEAVE the presentation open to use in the next exercise.
c05AddingTablestoSlides.indd Page 162 8/26/11 10:58 AM user f-404 F-402

Adding Tables to Slides 163
By default, PowerPoint sizes a new table to fi ll the width of the content placeholder. If you have only a few columns, you may fi nd the table a little too spacious. You will learn later in this lesson how to adjust column widths and row heights to more closely fi t the data you have entered.
If you need to reposition a table on a slide, you can do so by simply dragging its outer frame, as with any other object on a slide. You can resize a table overall by positioning the mouse pointer over one of the corners of its frame, so the mouse pointer becomes a double-headed arrow, and then dragging in or out; this changes the sizes of all rows and columns proportionally.
Drawing a TableDrawing a table enables you to create a table with different row and column sizes, and with different numbers of rows per column (or columns per row). In this exercise, you will draw a table.
STEP BY STEP Draw a Table
USE the ATMs Final presentation that is still open from the previous exercise.
1. Insert a new slide at the end of the presentation with the Title Only layout.
2. On the Insert tab, click Table to open the Table menu, and click Draw Table. The mouse pointer changes to a pencil.
3. Click and drag the mouse pointer to draw a frame approximately 3” high and the same width as the slide’s title placeholder box.
When you release the mouse button, the new table appears (which has only one big cell), and the Table Tools Design tab is displayed. See Figure 5-6.
Figure 5-6
Draw the outer frame for a new table
c05AddingTablestoSlides.indd Page 163 24/09/12 4:54 PM user-F408 /Users/user-F408/Desktop

164 Lesson 5
4. On the Table Tools Design tab, click Draw Table in the Draw Borders command group. The mouse pointer becomes a pencil again.
5. Click and drag to draw a horizontal line that divides the table in half horizontally. A dotted horizontal line appears. Release the mouse button to accept it.
Drag to draw the lines starting slightly inside the border, rather than on the border’s edge. If you start dragging too close to the border, PowerPoint creates a new table frame rather than adding to the existing table.
The drawing pencil mouse pointer should stay on; if it turns itself off, click the Draw Table button again to re-enable it.
6. Drag a vertical line through the middle of the table to divide it in half vertically.
7. Drag another vertical line that divides only the lower-right cell of the table vertically.
8. Drag another horizontal line that divides only the lower-right cells of the table horizontally. Figure 5-7 shows the completed table.
Take Note
Figure 5-7
A drawn table
9. Press Esc to turn off the pencil cursor on the mouse pointer.
10. Type the text shown in Figure 5-8 into the slide’s title placeholder and into the table. You will format this table later in the lesson.
Figure 5-8
The table with text added
11. SAVE the presentation.
PAUSE. LEAVE the presentation open to use in the next exercise.
c05AddingTablestoSlides.indd Page 164 8/26/11 10:58 AM user f-404 F-402

Adding Tables to Slides 165
Drawing a table is useful when you need a table that has different numbers of rows or columns in different spots, as you saw in the preceding exercise. You can also draw a table to create rows and columns of different heights and widths. Later in this lesson you will learn how to resize, merge, and split table rows and columns to create the same kinds of effects after the initial table creation.
INSERTING AN EXCEL WORKSHEETMicrosoft Offi ce 2010 allows a great deal of integration among its programs. If you need to show numerical data on a slide, for example, you can insert an Excel worksheet directly on the slide and use it to manipulate data just as you would in Excel.
Using an Excel Worksheet in PowerPointIf you need to show numerical data on a PowerPoint slide, you can insert an Excel worksheet directly on the slide and use it to manipulate data just as you would in Excel. Inserting an Excel worksheet (a spreadsheet from an Excel workbook) gives you access to all of Excel’s data manipulation and formatting tools. If you want to show Excel data on a slide and have not yet created the worksheet, it makes sense to create the worksheet directly on the PowerPoint slide. A worksheet you insert in this way is embedded on the slide—it is stored within the PowerPoint presentation but can be edited using the tools of its source application, Excel.
When you insert a worksheet using the Excel Spreadsheet command, the worksheet consists of only four visible cells. Drag the bottom or side sizing handle (or the lower-right corner handle) to reveal more cells. When you have fi nished inserting data, use these handles to adjust the border to hide empty cells that would otherwise show on the PowerPoint slide.
You can also resize a worksheet object by clicking it once to display the heavy, light-blue con-tainer border, then dragging a bottom, side, or corner of the container. This action enlarges or reduces the object itself; it does not change font size of the embedded data even though the text may look larger. You can edit an embedded worksheet at any time by double-clicking the worksheet object to open it in Excel. You can remove the object by clicking it once to display the heavy, light-blue container border and then pressing Delete.
In this exercise, you insert an Excel worksheet in a PowerPoint presentation. In some ways the worksheet is like a table; in other ways it differs. You’ll see the differences as you work through the exercise.
STEP BY STEP Insert an Excel Worksheet
USE the ATMs Final presentation that is still open from the previous exercise.
1. Insert a new slide at the end of the presentation with the Title Only layout.
2. Type the slide title ATM Cost Analysis.
3. Click the Insert tab, click the Table drop-down arrow, and then click Excel Spreadsheet. PowerPoint creates a small Excel worksheet on the slide, as shown in Figure 5-9. Note that the PowerPoint Ribbon has been replaced by the Excel Ribbon.
4.1.1
How do you draw a table on a slide?
The Bottom Line
c05AddingTablestoSlides.indd Page 165 8/26/11 10:58 AM user f-404 F-402
166 Lesson 5
When an Excel worksheet is open on the slide, you are actually working in Excel. To return to PowerPoint, click outside the worksheet.
4. Resize the worksheet object by dragging the lower-right corner handle diagonally to the right to display columns A through F and rows 1 through 10.
5. Click the Select All area in the upper-left corner of the worksheet object, where the column headers and row headers intersect. The entire worksheet object is selected.
6. Click the Font Size drop-down arrow on the Home tab and click 18.
7. Type data in the worksheet cells as shown in Figure 5-10. To move between cells, use the arrow keys on the keyboard. To adjust column widths, position the pointer on the border between column headings and drag to the right until all data appears.
Figure 5-9
A new Excel worksheet on a slide
Excel worksheet
Excel Ribbon
Select All area
Take Note
Figure 5-10
Type the data as shown
8. Click cell F5 and type the following formula: =E5–(B5+C5+D5). This formula sums the values in B5, C5, and D5, and then subtracts that total from the value in E5.
9. Press Enter to complete the formula.
c05AddingTablestoSlides.indd Page 166 8/26/11 10:58 AM user f-404 F-402

Adding Tables to Slides 167
10. Click cell F5, click the Copy button on the Home tab. Then click and drag over cells F6 through F9 to select them and click the Paste button to paste the formula in each of the selected cells.
Don’t worry that the font and color of the text are different from the rest of the worksheet at this point.
11. Click then drag over the numbers in columns B through F to select them. Then click the Accounting Number Format button in the Number group on the Home tab to apply a currency format to the selected cells.
12. Click cell B5, and click the Format Painter button on the Home tab. Then click and drag over cell F5 through F9 to paint that formatting onto those cells. (Don’t worry if some of the cells fi ll up with # signs.)
13. Drag over the range B5 to F9 to select it, and then click the Decrease Decimal button in the Number group twice to remove the decimal points and trailing zeros for the numbers.
14. Scroll to the right so that the divider between columns F and G is visible, and double-click the divider between the column letters to auto-resize column F to fi t its contents.
15. Click cell A1 and change the font size to 24.
16. Click outside the worksheet object, and then click again to close the worksheet container. Your slide should look similar to Figure 5-11.
Figure 5-11
The completed Excel worksheet embedded in a slide
24-point
Accounting formatwith no decimal places
Values in this columnwere calculated by functions.
17. SAVE the presentation.
PAUSE. LEAVE PowerPoint open to use in the next exercise.
You know a worksheet is open and ready to edit in Excel when it displays the heavy hatched border.
If you have already created an Excel worksheet and want to use the data on a slide, you have several additional options for getting it from Excel to PowerPoint:
• Select the data in Excel, copy it to the Clipboard, and paste it on a PowerPoint slide. This action pastes the Excel data as a PowerPoint table that cannot be edited in Excel but can be modifi ed like any other PowerPoint table.
• Select the data in Excel, copy it to the Clipboard, click the Paste button drop-down arrow in PowerPoint, and select Paste Special. In the Paste Special dialog box, choose to paste the data as an Excel worksheet object. The data is then embedded on the slide just as when you used the Excel Spreadsheet command.
Take Note
4.1.2
How do you insert an Excel spreadsheet in a slide?
c05AddingTablestoSlides.indd Page 167 8/26/11 10:58 AM user f-404 F-402
168 Lesson 5
• Select the data in Excel, copy it to the Clipboard, and open the Paste Special dialog box in PowerPoint. Choose to paste link the data as an Excel worksheet object. The data is then linked to the Excel worksheet, so that if you make a change to the worksheet in Excel, the data on the slide will show that same change.
• Click the Object button on the Insert tab to open the Insert Object dialog box. Here you can choose to create a new worksheet fi le or navigate to an existing fi le and paste or paste link it on the slide.
The Insert Object dialog box allows you to create a number of objects other than worksheets. You can create formulas, Word documents in various versions, and even sound fi les.
You can use the same procedures to copy Excel charts to slides. When simply pasted on a slide, an Excel chart can be formatted using the same tools you use to work with a PowerPoint chart.
You will work with PowerPoint charts in Lesson 6.
MODIFYING TABLE LAYOUTIt is often necessary to modify layout as you work with a table. For example, you may need to add or delete rows or columns, move data in the table, adjust column widths, or merge or split table cells.
Adding Rows and ColumnsOne of the most common reasons to change a table’s structure is to add data to or remove data from the table. You learn in this exercise that you can easily insert rows and columns in Power-Point tables to keep data accurate and up to date. In the following exercise, you will add a row and a column to a table.
STEP BY STEP Add a Row and a Column
USE the ATMs Final presentation that is still open from the previous exercise.
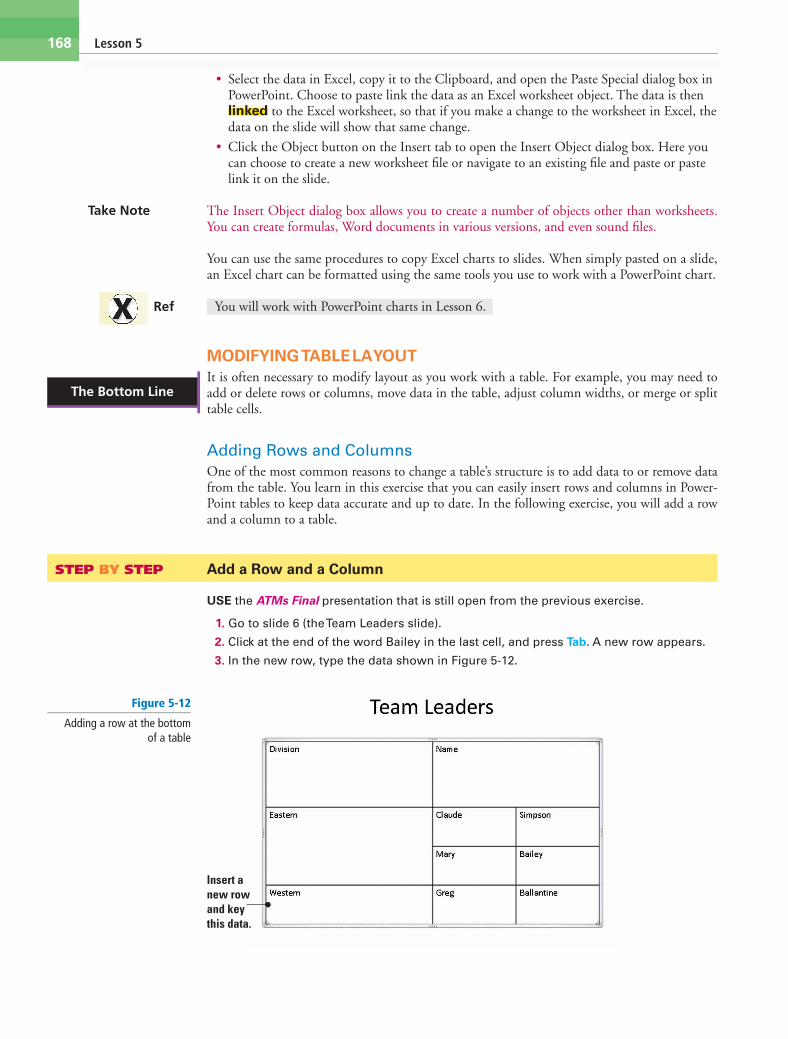
1. Go to slide 6 (the Team Leaders slide).
2. Click at the end of the word Bailey in the last cell, and press Tab. A new row appears.
3. In the new row, type the data shown in Figure 5-12.
Take Note
Ref
Figure 5-12
Adding a row at the bottom of a table
Insert a new row and key this data.
The Bottom Line
c05AddingTablestoSlides.indd Page 168 8/26/11 10:58 AM user f-404 F-402

Adding Tables to Slides 169
4. Click in the cell containing Eastern and on the Table Tools Layout tab, click Insert Above in the Rows and Columns command group. A new blank row appears above that cell’s row.
5. Drag the lower border of the fi rst row upward, decreasing that row’s height so the table does not overfl ow the slide.
6. In the new row, type the data shown in Figure 5-13.
Another WayYou can also right-
click in a cell, point to Insert on the shortcut menu, and click an option for inserting cells above, below, left, or right.
Figure 5-13
Adding a row between two existing rows
This border was dragged upward to decrease height of first row.
Insert Above button
New row inserted
7. Click and drag across all the cells in the Division column to select that column.
8. On the Table Tools Layout tab, click Insert Right. A new blank column appears.
9. In the new column, type the data shown in Figure 5-14.
Figure 5-14
Adding a new column
New column added
10. SAVE the presentation.
PAUSE. LEAVE the presentation open to use in the next exercise.
c05AddingTablestoSlides.indd Page 169 8/26/11 10:59 AM user f-404 F-402

170 Lesson 5
To add a new row at the bottom of a table, simply move into the last cell of the table (bottom right) and press Tab. Alternatively, the Tools in the Rows & Columns group on the Table Tools Layout tab make it easy to insert new rows and columns exactly where you want them in the table. Click in a cell near where you want to add the row or column and then click the appropriate button on the tab.
Deleting Rows or ColumnsWhen you delete rows and columns, the table automatically resizes to account for the removal of the data. Note, however, that columns do not automatically resize to fi ll the area previously occupied by a column. After removing columns, you may need to resize the remaining columns in the table to adjust space. You learn about resizing later in this lesson. In this exercise, you delete a column and a row.
STEP BY STEP Delete Rows or Columns
USE the ATMs Final presentation that is still open from the previous exercise.
1. On slide 6, click in the upper left cell (Divisions).
2. On the Table Tools Layout tab, click the Delete button, and on the menu that appears, click Delete Columns (see Figure 5-15). The fi rst column is deleted.
Figure 5-15
Deleting a column
3. Click the Undo button on the Quick Access toolbar to undo the delete operation.
4. Click in the lower-left cell (Western).
5. On the Table Tools Layout tab, click the Delete button, and on the menu that appears, click Delete Rows. The bottom row is deleted.
6. Click the Undo button on the Quick Access toolbar to undo the delete operation.
7. SAVE the presentation.
PAUSE. LEAVE the presentation open to use in the next exercise.
Moving Rows and ColumnsMove rows and columns when you need to reorder data. You can use drag and drop or the Cut and Paste commands to move row or column data into a new, blank row or column. In this exercise, you will insert a new column and then move content into it.
STEP BY STEP Move a Column
USE the ATMs Final presentation that is still open from the previous exercise.
1. Go to slide 4, click in the second column, and on the Table Tools Layout tab, click Insert Left. A new column is inserted between the fi rst and second columns.
2. Drag across all the cells in the rightmost column to select them.
Another WayYou can also press
Ctrl+Z to undo.
c05AddingTablestoSlides.indd Page 170 8/26/11 10:59 AM user f-404 F-402

Adding Tables to Slides 171
3. Drag the selected column and drop it on top of the fi rst cell in the blank column you inserted in step 1. The data from the selected column is moved to the new column, and a blank column remains in the data’s previous location, as shown in Figure 5-16.
Figure 5-16
Moving a column …to here.Data was dragged from here…
4. With the second column still selected, press Ctrl+X to cut the column’s data to the clipboard. The column disappears entirely. When you use the Ctrl+X command to cut all data from a column, a blank column is not left behind, as with drag and drop.
5. Click in the fi rst row of the empty column on the right side of the table and press Ctrl+V to paste the data into that column. The data is placed in the empty column, and the table returns to having only three columns.
6. Drag the table’s frame to re-center it on the slide if needed. (It may be slightly skewed to the left.)
7. SAVE the presentation.
PAUSE. LEAVE the presentation open to use in the next exercise.
Moving rows and columns in PowerPoint 2010 is similar to moving rows and columns in a worksheet program such as Excel: you must make sure you have a blank row or column in which to insert the new data. If you simply drag a row or column to a new location, you will overwrite the existing data at that location.
There is one important difference between PowerPoint tables and Excel spreadsheets when moving data. When you move data around in a PowerPoint table, the area to which you paste or drag the content must be empty. Otherwise, the incoming content will overwrite what is already there. Unlike in Excel, the existing content does not move over to accommodate the new content.
Resizing and Distributing Rows and ColumnsRow heights and column widths can be easily resized by dragging or double-clicking cell borders.
Adjust column widths or row heights to eliminate unused space or add space to make table text more readable. Dragging allows you to “eyeball” column widths or row heights so that they look attractive on the slide. Double-clicking allows you to immediately set column width to the width of its widest line. Double-clicking does not adjust row height, however. To resize a row that has been enlarged, drag its bottom border. To make all the rows or columns the same width, you can use the Distribute Rows or Distribute Columns buttons.
In this exercise, you will resize rows and columns in two different ways and distribute the column widths evenly.
Another WayYou can also click in
the rightmost column and then on the Table Tools Layout tab, click Select and click Column.
Another WayYou can use the
Cut and Paste commands on the Home tab to cut and paste if you prefer, or right-click and choose the Cut or Paste commands.
c05AddingTablestoSlides.indd Page 171 8/26/11 10:59 AM user f-404 F-402
172 Lesson 5
STEP BY STEP Resize and Distribute Rows and Columns
USE the ATMs Final presentation that is still open from the previous exercise.
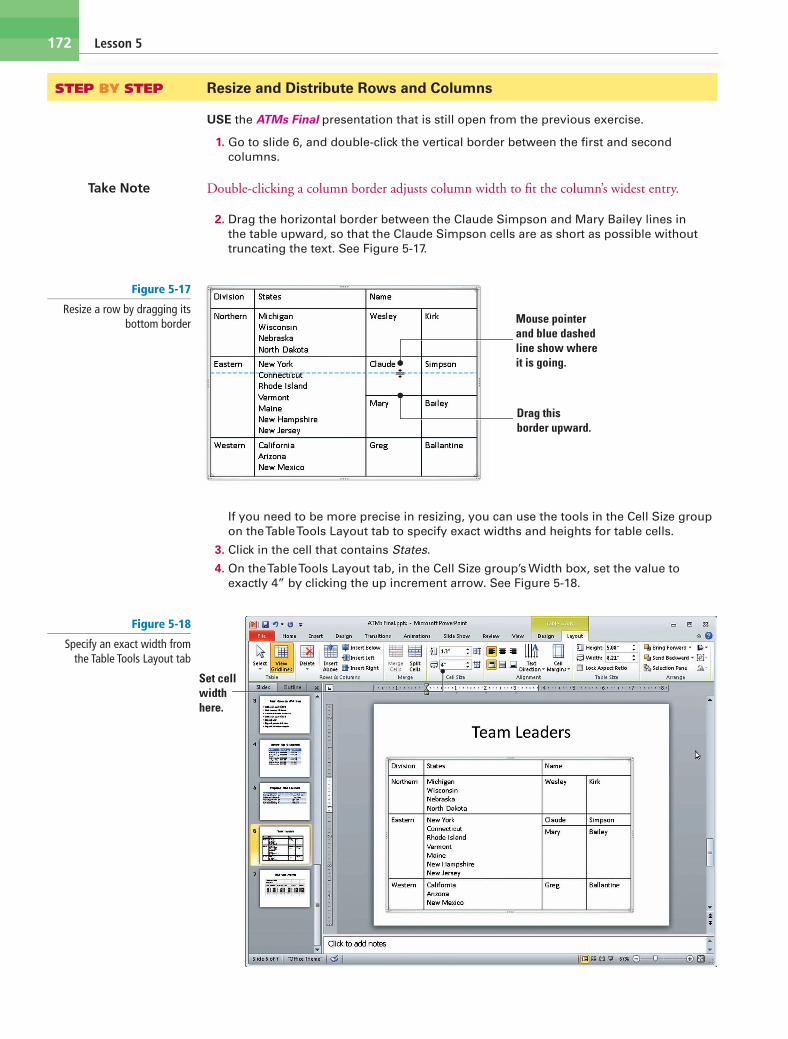
1. Go to slide 6, and double-click the vertical border between the fi rst and second columns.
Double-clicking a column border adjusts column width to fi t the column’s widest entry.
2. Drag the horizontal border between the Claude Simpson and Mary Bailey lines in the table upward, so that the Claude Simpson cells are as short as possible without truncating the text. See Figure 5-17.
Take Note
If you need to be more precise in resizing, you can use the tools in the Cell Size group on the Table Tools Layout tab to specify exact widths and heights for table cells.
3. Click in the cell that contains States.
4. On the Table Tools Layout tab, in the Cell Size group’s Width box, set the value to exactly 4” by clicking the up increment arrow. See Figure 5-18.
Figure 5-17
Resize a row by dragging its bottom border
Drag this border upward.
Mouse pointer and blue dashed line show where it is going.
Figure 5-18
Specify an exact width from the Table Tools Layout tab
Set cellwidth here.
c05AddingTablestoSlides.indd Page 172 8/26/11 10:59 AM user f-404 F-402
Adding Tables to Slides 173
The Width setting in the Table Size group controls the width of the entire table.
5. Select the entire table by dragging across it.
6. On the Table Tools Layout tab, click the Distribute Columns button . Each column becomes the same width.
7. SAVE the presentation.
PAUSE. LEAVE the presentation open to use in the next exercise.
You do not have to select an entire column or row to resize all cells in that column. When you click in any cell and resize a row or column, all cells in that row or column are adjusted at the same time.
If space in a table is extremely tight, you may be able to fi t more text in columns and rows by adjusting cell margins. The Cell Margins button in the Alignment group on the Table Tools Layout tab allows you to select from four different cell margin options ranging from None to Wide, or create custom margins.
Merging and Splitting Table CellsThe merge and split features allow you to adjust how content fi ts in table cells and to modify the internal structure of a table without increasing or reducing its overall width. By merging cells, you can position content so it spans more than one column or row. When two cells merge, all the content is retained; a paragraph break is inserted between their content. Use the split feature when you want to divide a single row or column to accommodate additional entries without modifying the remainder of the table. When you split a cell that contains content, the content goes with the leftmost or upper cell; you may choose to move some or all of the content into the new blank cell(s) after the split. Merging and splitting can modify the internal structure of a table without increasing or reducing its overall width. In this exercise, you practice merging and splitting table cells.
STEP BY STEP Merge and Split Table Cells
USE the ATMs Final presentation that is still open from the previous exercise.
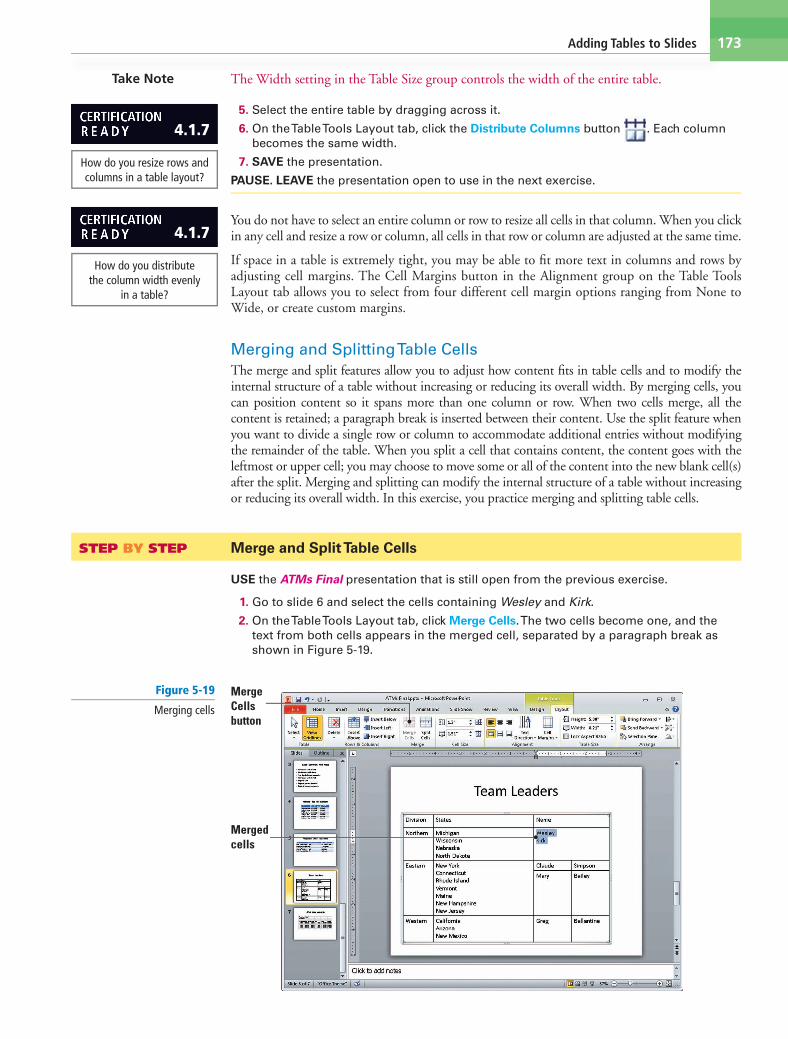
1. Go to slide 6 and select the cells containing Wesley and Kirk.
2. On the Table Tools Layout tab, click Merge Cells. The two cells become one, and the text from both cells appears in the merged cell, separated by a paragraph break as shown in Figure 5-19.
Take Note
4.1.7
How do you resize rows and columns in a table layout?
4.1.7
How do you distribute the column width evenly
in a table?
Figure 5-19
Merging cells
Merge Cells button
Merged cells
c05AddingTablestoSlides.indd Page 173 8/26/11 10:59 AM user f-404 F-402

174 Lesson 5
3. Click at the beginning of the second name and press Backspace to delete the paragraph break between the two names, so they appear on the same line.
4. Use the procedures in steps 1-3 to merge each of the other three names (Claude Simpson, Mary Bailey, Greg Ballantine) in the table in the same way.
5. Use the procedures in steps 1-3 to merge the cells containing the names of the representatives for the Eastern region, and leave each name on a separate line as in Figure 5-20.
Figure 5-20
The table after all fi rst and last names have been merged
6. Select all three cells that contain state names, and on the Table Tools Layout tab, click Split Cells in the Merge command group. The Split Cells dialog box opens (see Figure 5-21).
Figure 5-21
Splitting a cell into multiple cells
7. In the Number of Columns text box, type 2 to set the number of columns to 2. In the Number of Rows box, type 1 to set the number of rows to 1. Then click OK.
8. For each division, move approximately half of the names from the existing cell to the empty cell to its right as shown in Figure 5-22. You can move the text either with drag and drop or cut and paste.
Figure 5-22
Move some of the state names into the new cells
Move some of the state names intothe new column.
9. SAVE the presentation fi le and CLOSE it.
PAUSE. LEAVE PowerPoint open to use in the next exercise.
Another WayTo quickly merge
or split, right-click in a cell or selected cells and click Merge or Split on the shortcut menu.
4.1.7
How do you merge table cells?
4.1.7
How do you split table cells?
c05AddingTablestoSlides.indd Page 174 8/26/11 10:59 AM user f-404 F-402

Adding Tables to Slides 175
You can also split columns or rows by drawing additional lines with the Draw Table feature, as you did earlier in the lesson. You can use the Eraser tool on the Table Tools Design tab to merge cells by erasing the divider between them.
FORMATTING TABLESPowerPoint provides default formats to all new tables so that they have an appealing aesthetic. You may want to modify formatting, however, because you do not like the default colors or you want a different look. Use the tools on the Table Tools Design and Table Tools Layout tabs to apply new formatting options.
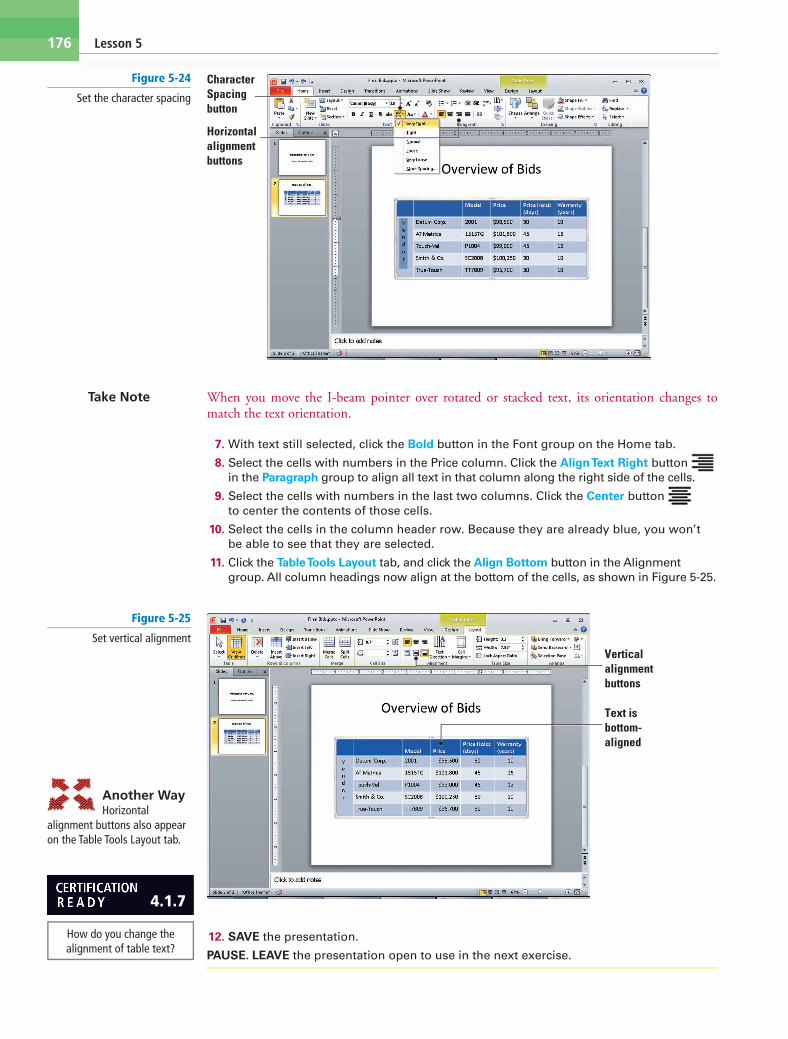
Changing Table Text Alignment and Or ientationText can be aligned both vertically and horizontally within a cell. You can also change the text’s orientation (rotation) to create visual interest. Use the same tools to align content horizontally in a table cell that you use to align text in a text placeholder. Changing alignment in table cells can improve readability as well as make a table more attractive.
Vertical alignment options control how content appears from top to bottom of a cell. The default option is top alignment, but column heads often look better centered vertically in table cells. When column headings have differing numbers of lines, standard procedure is to align all headings at the bottom.
Use options on the Text Direction menu to change the orientation of text for a special effect. Vertical text or text that reads from bottom to top makes a unique row header, for example. In this exercise, you will change the text direction and alignment in table cells.
STEP BY STEP Align and Orient Text in a Table
GET READY. To align and orient text in a table, do the following:
1. OPEN the Bids presentation and save it as Final Bids.
2. Go to slide 2, and click in the merged cell at the far left of the table.
3. Click the Table Tools Layout tab, and then click the Text Direction button to display a menu of orientation options.
4. Click Stacked. This option will stack text with each letter below the previous one.
5. Type Vendor in the merged cell. The text stacks in the merged cell as shown in Figure 5-23.
The Bottom Line
Figure 5-23
Stacked text orientation
The Bids fi le is available on the book companion website or in WileyPLUS.
6. Select the text you just typed. Click the Home tab, and then click the Character Spacing button. Click Very Tight (see Figure 5-24).
c05AddingTablestoSlides.indd Page 175 8/26/11 10:59 AM user f-404 F-402
176 Lesson 5
12. SAVE the presentation.
PAUSE. LEAVE the presentation open to use in the next exercise.
When you move the I-beam pointer over rotated or stacked text, its orientation changes to match the text orientation.
7. With text still selected, click the Bold button in the Font group on the Home tab.
8. Select the cells with numbers in the Price column. Click the Align Text Right button in the Paragraph group to align all text in that column along the right side of the cells.
9. Select the cells with numbers in the last two columns. Click the Center button to center the contents of those cells.
10. Select the cells in the column header row. Because they are already blue, you won’t be able to see that they are selected.
11. Click the Table Tools Layout tab, and click the Align Bottom button in the Alignment group. All column headings now align at the bottom of the cells, as shown in Figure 5-25.
Figure 5-24
Set the character spacing
Horizontal alignment buttons
Character Spacing button
Take Note
Figure 5-25
Set vertical alignment
Text is bottom-aligned
Vertical alignment buttons
Another WayHorizontal
alignment buttons also appear on the Table Tools Layout tab.
4.1.7
How do you change the alignment of table text?
c05AddingTablestoSlides.indd Page 176 8/26/11 10:59 AM user f-404 F-402
Adding Tables to Slides 177
Figure 5-26
Table Quick Styles gallery
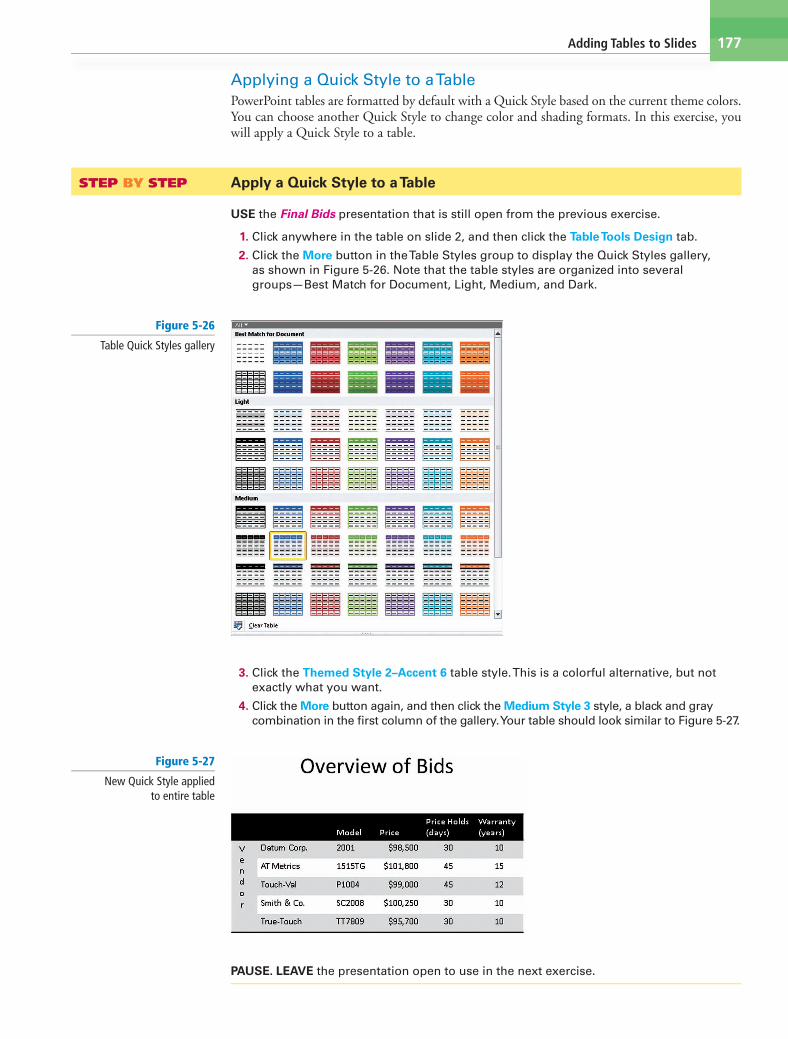
3. Click the Themed Style 2–Accent 6 table style. This is a colorful alternative, but not exactly what you want.
4. Click the More button again, and then click the Medium Style 3 style, a black and gray combination in the fi rst column of the gallery. Your table should look similar to Figure 5-27.
Applying a Quick Style to a TablePowerPoint tables are formatted by default with a Quick Style based on the current theme colors. You can choose another Quick Style to change color and shading formats. In this exercise, you will apply a Quick Style to a table.
STEP BY STEP Apply a Quick Style to a Table
USE the Final Bids presentation that is still open from the previous exercise.
1. Click anywhere in the table on slide 2, and then click the Table Tools Design tab.
2. Click the More button in the Table Styles group to display the Quick Styles gallery, as shown in Figure 5-26. Note that the table styles are organized into several groups—Best Match for Document, Light, Medium, and Dark.
Figure 5-27
New Quick Style applied to entire table
PAUSE. LEAVE the presentation open to use in the next exercise.
c05AddingTablestoSlides.indd Page 177 8/26/11 10:59 AM user f-404 F-402
178 Lesson 5
Colors available for Quick Style formats are controlled by theme. If you apply a Quick Style and then change the theme, the Quick Style colors will adjust to those of the new theme.
You may on occasion want to remove all table formatting to present data in a simple grid without shading or border colors. You can remove formatting by clicking Clear Table at the bottom of the Quick Styles gallery. Once you have cleared formats, you can reapply them by selecting any table style.
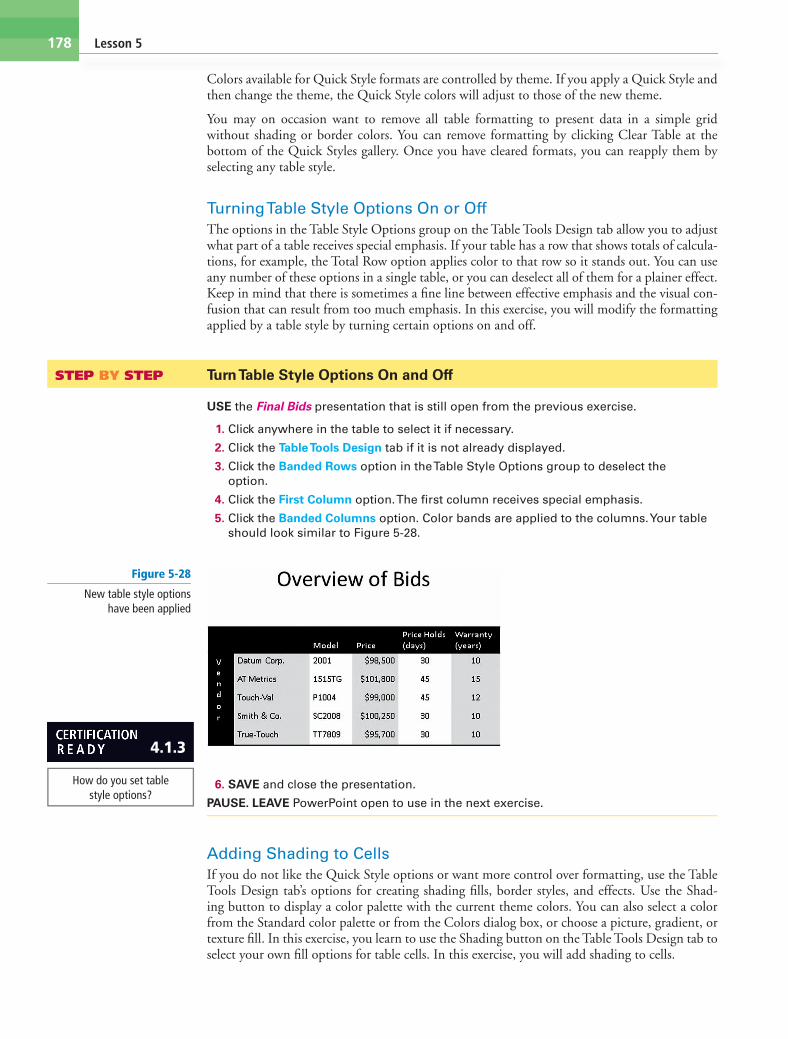
Turning Table Style Options On or OffThe options in the Table Style Options group on the Table Tools Design tab allow you to adjust what part of a table receives special emphasis. If your table has a row that shows totals of calcula-tions, for example, the Total Row option applies color to that row so it stands out. You can use any number of these options in a single table, or you can deselect all of them for a plainer effect. Keep in mind that there is sometimes a fi ne line between effective emphasis and the visual con-fusion that can result from too much emphasis. In this exercise, you will modify the formatting applied by a table style by turning certain options on and off.
STEP BY STEP Turn Table Style Options On and Off
USE the Final Bids presentation that is still open from the previous exercise.
1. Click anywhere in the table to select it if necessary.
2. Click the Table Tools Design tab if it is not already displayed.
3. Click the Banded Rows option in the Table Style Options group to deselect the option.
4. Click the First Column option. The fi rst column receives special emphasis.
5. Click the Banded Columns option. Color bands are applied to the columns. Your table should look similar to Figure 5-28.
Figure 5-28
New table style options have been applied
4.1.3
How do you set table style options?
6. SAVE and close the presentation.
PAUSE. LEAVE PowerPoint open to use in the next exercise.
Adding Shading to CellsIf you do not like the Quick Style options or want more control over formatting, use the Table Tools Design tab’s options for creating shading fi lls, border styles, and effects. Use the Shad-ing button to display a color palette with the current theme colors. You can also select a color from the Standard color palette or from the Colors dialog box, or choose a picture, gradient, or texture fi ll. In this exercise, you learn to use the Shading button on the Table Tools Design tab to select your own fi ll options for table cells. In this exercise, you will add shading to cells.
c05AddingTablestoSlides.indd Page 178 8/26/11 10:59 AM user f-404 F-402

Adding Tables to Slides 179
STEP BY STEP Add Shading to Cells
GET READY. To add shading to cells, perform the following steps:
1. OPEN the Warranties presentation and save it as Warranties Final.
2. Go to slide 2, and select the cells in the column header row.
3. Click the Table Tools Design tab, and then click the Shading button drop-down arrow in the Table Styles group. The Shading color palette displays.
4. Click the Gold, Accent 1 color to fi ll the column header cells with gold.
5. With the column header cells still selected, click the Shading drop-down arrow again, point to Gradient, and select the From Top Right Corner gradient style in the Dark Variations section of the gallery (see Figure 5-29).
Figure 5-29
Select a gradient fi ll
Select thisgradient.
Shadingbutton
The Warranties fi le is available on the book companion website or in WileyPLUS.
6. SAVE the presentation.
PAUSE. LEAVE the presentation open to use in the next exercise.
The Shading menu also offers the Table Background option. You can use this command to insert a color or a picture to fi ll all cells of a table. You will learn more about inserting pictures as background later in this lesson.
Be careful when applying picture or texture fi lls to an entire table. Your text must remain readable, so choose a light background, adjust transparency if necessary, or be prepared to boldface text.
Adding Borders to Table CellsThe Border menu allows you to quickly apply borders to all sides of selected cells or to any specifi c side of a cell, giving you considerable fl exibility in formatting table cells. You can also remove all borders from a cell or selected cells by selecting No Border. After you have selected a border option, it displays on the button. You can easily reapply that border option by simply clicking the button. In this exercise, you will add borders to table cells.
4.1.4
How do you set table cell shading?
c05AddingTablestoSlides.indd Page 179 8/26/11 10:59 AM user f-404 F-402
180 Lesson 5
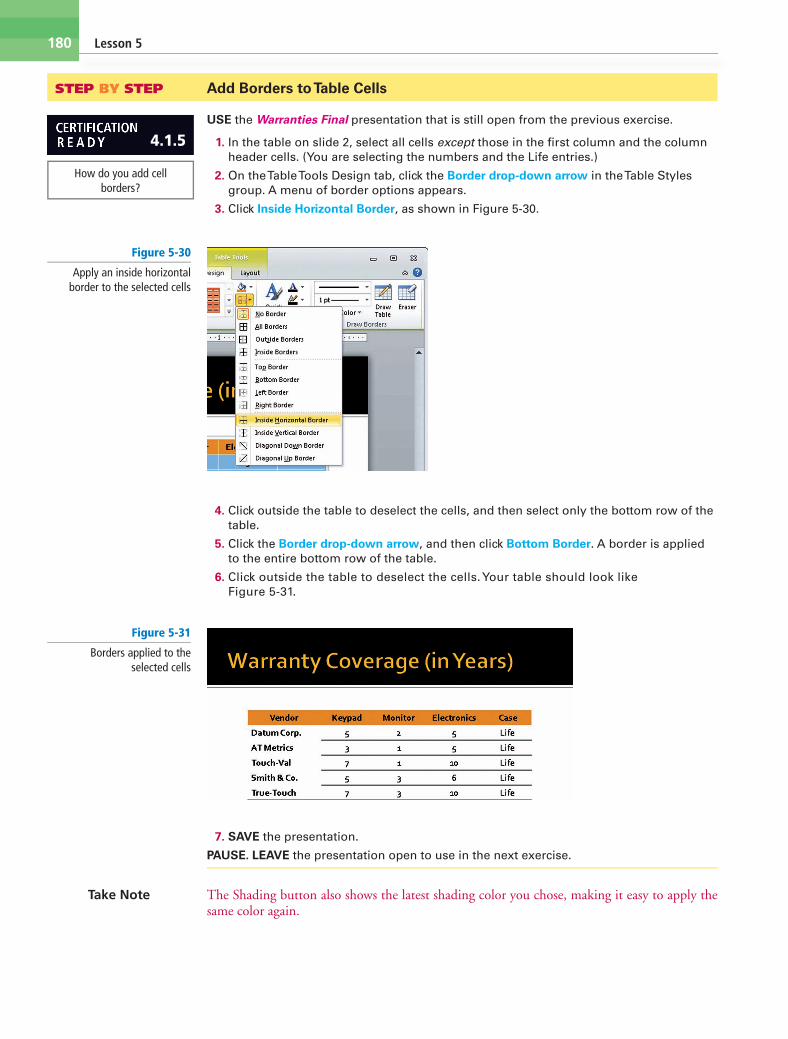
STEP BY STEP Add Borders to Table Cells
USE the Warranties Final presentation that is still open from the previous exercise.
1. In the table on slide 2, select all cells except those in the fi rst column and the column header cells. (You are selecting the numbers and the Life entries.)
2. On the Table Tools Design tab, click the Border drop-down arrow in the Table Styles group. A menu of border options appears.
3. Click Inside Horizontal Border, as shown in Figure 5-30.
Figure 5-30
Apply an inside horizontal border to the selected cells
4. Click outside the table to deselect the cells, and then select only the bottom row of the table.
5. Click the Border drop-down arrow, and then click Bottom Border. A border is applied to the entire bottom row of the table.
6. Click outside the table to deselect the cells. Your table should look like Figure 5-31.
Figure 5-31
Borders applied to the selected cells
4.1.5
How do you add cell borders?
Take Note
7. SAVE the presentation.
PAUSE. LEAVE the presentation open to use in the next exercise.
The Shading button also shows the latest shading color you chose, making it easy to apply the same color again.
c05AddingTablestoSlides.indd Page 180 8/26/11 10:59 AM user f-404 F-402

Adding Tables to Slides 181
Note that you can also choose diagonal borders from the Border menu. Use a diagonal border to split a cell so you can insert two values in it, one to the left side of the cell and the other to the right on the other side of the diagonal border.
To insert two values in a cell, set left alignment and type the fi rst value, then press Ctrl+Tab or use the spacebar to move to the other half of the cell to type the second value.
Adding Special Effects to a TableThe Table Styles group offers an Effects button to let you apply selected special effects. Using the Effects menu, you can apply bevel, shadow, and refl ection effects to a table. Bevels can apply to individual cells or selections of cells, but shadows and refl ections are applied to the entire table.
STEP BY STEP Add Special Effects to a Table
USE the Warranties Final presentation that is still open from the previous exercise.
1. Click anywhere in the table on slide 2.
2. Click the Effects button in the Table Styles group, point to Shadow, and click Offset Diagonal Bottom Right (see Figure 5-32).
Take Note
Figure 5-32
Apply a shadow effect to the table Effects
button
Select this shadow
3. Click outside the table to see the effect.
4. SAVE the presentation.
PAUSE. LEAVE the presentation open to use in the next exercise.
4.1.6
How do you add effects to a table?
c05AddingTablestoSlides.indd Page 181 8/26/11 10:59 AM user f-404 F-402

182 Lesson 5
Adding an Image to a TableAn image can serve as the background in one or more table cells. The image is not the cell content, but rather a background fi ll, just as a color fi ll would be. The text in the cell appears on top of it. In this exercise, you will learn how to add an image behind the text in some cells in a table.
STEP BY STEP Add an Image to a Table
USE the Warranties Final presentation that is still open from the previous exercise.
1. In the table on slide 2, select the vendor names in the fi rst column of the table. (Do not select the Vendor column heading.)
2. Right-click in one of the selected cells, then click Format Shape on the menu that appears. The Format Shape dialog box opens.
3. In the dialog box, click Picture or texture fi ll.
4. In the Insert From area of the dialog box, click the File button and in the Insert Picture dialog box that appears, navigate to the location of your data fi les. Select ATM.jpg and click Insert.
5. In the Format Shape dialog box, click to place a checkmark in the Tile picture as texture check box.
6. Drag the dialog box’s Transparency slider until the box to the right of the slider reads 80%. See Figure 5-33.
7. Click Close to apply your changes and close the dialog box. Click outside the table. The selected cells have a semi-transparent fi ll using the selected graphic.
8. SAVE the presentation.
PAUSE. LEAVE the presentation open to use in the next exercise.
You learned earlier that you can specify a picture as a background using the Table Background command on the Shading menu. Use this option if the picture you want to use is already formatted in such a way that it will not overwhelm the text in the table.
The ATM.jpg fi le is available on the book companion website or in WileyPLUS.
Figure 5-33
Apply a picture fi ll
Tile the picture as a texture.
Make the picture 80% transparent.
c05AddingTablestoSlides.indd Page 182 8/26/11 10:59 AM user f-404 F-402

Adding Tables to Slides 183
For the most control over an image to be used as a table background, insert it using the Format Shape dialog box, as you did in this exercise. You can insert a picture in a single cell or selected cells by right-clicking a selected cell and choosing Format Shape. Or you can insert the picture in all cells by right-clicking the table’s light-blue container frame and then choosing Format Shape. Tiling options in this dialog box allow you to adjust how the tiles display over the table. If you choose not to tile, a separate copy of the picture will appear in every cell of the table. The Transparency slider lets you wash out the picture to make it appropriate for a background.
Images can be used for more than background effects in tables. You can also insert an image as table content. To do so, click in a cell and use the Picture command on the Shading menu. The picture you select is automatically resized to fi t into the selected table cell.
Arranging a Table with Other ObjectsPowerPoint enables you to stack one object on top of another, and then arrange them to control which one is at the top of the stack. Any transparent areas on the object on top show the underlying object behind them. In this exercise, you arrange a shape with a table so that the shape serves as a decorative frame.
STEP BY STEP Arrange a Shape and a Table
USE the Warranties Final presentation that is still open from the previous exercise.
1. Display slide 2 and on the Insert tab, click the Shape button to produce the Shape gallery. Then click the rounded rectangle in the fi rst row of shapes.
2. Drag to draw a rounded rectangle that completely covers the table, as in Figure 5-34.
Figure 5-34
Cover the table with a rounded rectangle
Click the Shapes button.
Select the rounded rectangle.
Draw a rectangle that covers the table.
3. On the Drawing Tools Format tab, click Send Backward in the Arrange command group. The shape is sent behind the table.
4. With the shape still selected, click the Shape Fill button and click More Fill Colors from the menu that appears. The Colors dialog box opens.
c05AddingTablestoSlides.indd Page 183 8/26/11 10:59 AM user f-404 F-402

184 Lesson 5
Figure 5-35
The table and the shape stacked together, arranged so
that the table is in front
6. SAVE and CLOSE the presentation.
EXIT PowerPoint.
4.1.7
How do you arrange a table with other content?
SKILL SUMMARY
In This Lesson ObjectiveYou Learned How To: Exam Objective Number
Create tables. Draw a table. 4.1.1
Insert a Microsoft Excel Insert a Microsoft Excel spreadsheet. 4.1.2 spreadsheet.
Modify table layout. Adjust columns and rows. 4.1.7
Format Tables. Set table style options. 4.1.3 Add shading. 4.1.4 Add borders. 4.1.5 Add effects. 4.1.6 Adjust columns and rows. 4.1.7
Knowledge Assessment
Matching
Match the term in Column 1 to its description in Column 2.
Column 1 Column 2
1. Table source a. Insert data so that it maintains a connection to a document
2. Draw Table b. A document used to manipulate numerical data
3. Table Tools Design c. A background color for table cells
4. Merge d. Insert data so that it can be edited using its original application
5. Quick Style e. Tab that allows you to insert a new table row
6. Link f. An arrangement of columns and rows used to organize data
7. Shading g. Tab that allows you to apply a Quick Style to a table
8. Embed h. Option you can use to create a table frame and insert columns and rows where you want them
9. Table Tools Layout i. To combine two or more cells to create a larger cell
10. Worksheet j. A set of preset formatting that can be applied to a table.
5. Drag the Transparency slider to 85%, and then click OK. The rectangle appears as a lightly shaded background behind the table, as shown in Figure 5-35.
c05AddingTablestoSlides.indd Page 184 8/26/11 12:00 PM user f-404 F-402

Adding Tables to Slides 185
True/False
Circle T if the statement is true or F if the statement is false.
T F 1. To create a new table, click the Insert Object button and then select the type of table to create.
T F 2. By default, a new table is sized to fi t the content placeholder in which it wascreated.
T F 3. To edit a worksheet object, double-click the object to display Excel’s tools.
T F 4. You can copy and paste data from Excel to a PowerPoint slide using the Clipboard.
T F 5. You must select an entire row before you can insert a new row above or below it.
T F 6. When moving a column, you do not have to create an empty column fi rst for the moved data to be placed in; the existing content will move over to accommodate it.
T F 7. Use Distribute Columns to quickly resize all columns to the same width.
T F 8. Use the Blank Table option to quickly remove all formatting from a table.
T F 9. Bevel effects automatically apply to an entire table.
T F 10. If you do not specify that a picture should be tiled over selected cells, it will display in each table cell.
Competency Assessment
Project 5-1: Job FairYou work for Lucerne Executive Recruiters, a company that specializes in fi nding employees for a variety of clients. You are planning to give a brief presentation at a local job fair and need to prepare a slide that lists some currently available jobs for which you are recruiting candidates. You can use a table to display this information.
GET READY. LAUNCH PowerPoint if it is not already running.
1. OPEN the Jobs presentation and save it as Jobs Final.
2. Go to slide 2, and click the Insert Table icon in the content placeholder.
3. Create a table with three columns and seven rows.
4. Type the following information in the table:
Title Company Salary Range*
Senior Editor Litware, Inc. $30K-$42K
Sales Associate Contoso Pharmaceuticals $55K-$70K
District Manager Tailspin Toys $65K-$80K
Accountant Fourth Coffee $53K-$60K
Production Assistant Fabrikam, Inc. $38K-$45K *Starting salary based on experience
5. Click in the Salary Range column, and then click the Insert Right button on the Table Tools Layout tab to insert a new column.
6. Type the following information in the new column:
Posted
5/01
5/10
4/30
4/27
5/07
The Jobs fi le is available on the book companion website or in WileyPLUS.
c05AddingTablestoSlides.indd Page 185 8/26/11 10:59 AM user f-404 F-402
186 Lesson 5
7. Click the Production Assistant cell, then click the Insert Below button on the Table Tools Layout tab to insert a new row.
8. Type the following information in the new row:
Loan Offi cer Woodgrove Bank $42-$54K 5/12
9. Select all the cells in the last row of the table, and then click the Merge Cells button on the Table Tools Layout tab.
10. Adjust column widths by dragging or double-clicking cell borders so that all table entries in a given row are on a single line.
11. Format the table as follows:
a. Select the Salary Range and Posted columns, and then click the Center button on the Home tab.
b. Click in the last row of the table, and then click the Align Text Right button.
c. With the insertion point still in the last row, click the Shading button on the Table Tools Design tab, and then click No Fill.
d. Click the Border button, and then click No Border.
e. Click the First Column table style option to apply emphasis to the fi rst column of the table. Adjust column widths again if necessary to avoid runover lines.
f. Select all cells in the Loan Offi cer row of the table, click the Border button, and then click Bottom Border.
g. Apply a bevel effect to the column header cells and the fi rst column cells.
12. SAVE the presentation and then CLOSE the fi le.
LEAVE PowerPoint open for use in the next project.
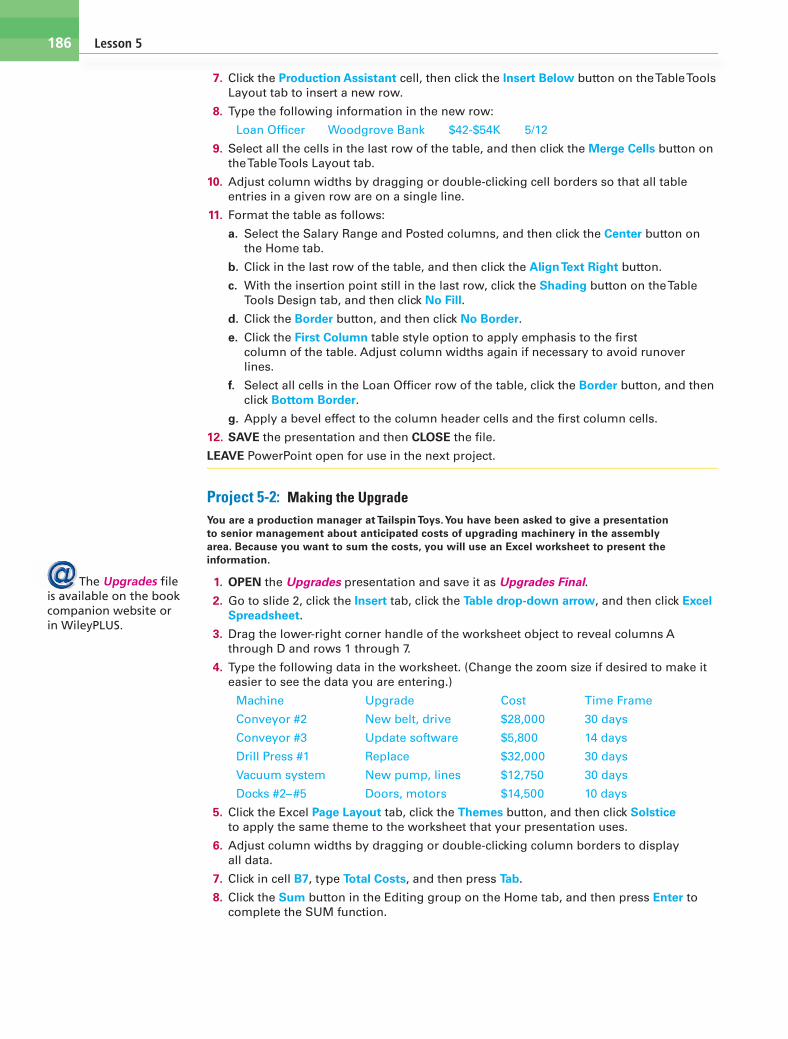
Project 5-2: Making the UpgradeYou are a production manager at Tailspin Toys. You have been asked to give a presentation to senior management about anticipated costs of upgrading machinery in the assembly area. Because you want to sum the costs, you will use an Excel worksheet to present the information.
1. OPEN the Upgrades presentation and save it as Upgrades Final.
2. Go to slide 2, click the Insert tab, click the Table drop-down arrow, and then click Excel Spreadsheet.
3. Drag the lower-right corner handle of the worksheet object to reveal columns A through D and rows 1 through 7.
4. Type the following data in the worksheet. (Change the zoom size if desired to make it easier to see the data you are entering.)
Machine Upgrade Cost Time Frame
Conveyor #2 New belt, drive $28,000 30 days
Conveyor #3 Update software $5,800 14 days
Drill Press #1 Replace $32,000 30 days
Vacuum system New pump, lines $12,750 30 days
Docks #2–#5 Doors, motors $14,500 10 days
5. Click the Excel Page Layout tab, click the Themes button, and then click Solstice to apply the same theme to the worksheet that your presentation uses.
6. Adjust column widths by dragging or double-clicking column borders to display all data.
7. Click in cell B7, type Total Costs, and then press Tab.
8. Click the Sum button in the Editing group on the Home tab, and then press Enter to complete the SUM function.
The Upgrades fi le is available on the book companion website or in WileyPLUS.
c05AddingTablestoSlides.indd Page 186 8/26/11 10:59 AM user f-404 F-402

Adding Tables to Slides 187
9. Apply Quick Styles to the worksheet as follows:
a. Select the column headings, and then click the Cell Styles button in the Styles group on the Home tab.
b. Click the Accent5 style.
c. Click the Total Costs cell, click the Cell Styles button, and click the Accent1 style.
d. Click the cell that contains the sum of costs, click the Cell Styles button, and click the Total style.
e. Apply bold formatting to the column heads and the Total Costs cell.
10. Click the Select All area at the top left corner of the worksheet, then click the Font Size drop-down arrow and click 18. Adjust column width again if necessary to display all data.
11. Select the entries in the Time Frame column, and click the Center button.
12. Click outside the worksheet twice to review your changes.
13. SAVE the presentation and CLOSE the fi le.
LEAVE PowerPoint open for use in the next project.
Profi ciency Assessment
Project 5-3: Power UpYou are an operations manager for City Power & Light. You have been asked to give a presentation to department heads about scheduled maintenance of power substations around the city. Use a table to present the maintenance schedule.
1. OPEN the Power presentation and save it as Power Final.
2. Go to slide 3. On the Insert tab, click Table and drag over the grid to create a table with two columns and seven rows.
3. Type the following information in the table:
Substation Week of
Eastland July 13
Morehead October 1
Huntington June 6
Parkland May 21
Midtown July 28
Elmwood December 11
4. Apply a Quick Style of your choice to the table.
5. Turn on the First Column table style, and change any other table style option that improves the look of the table. For example, you might change the font color.
6. Delete the last row of the table.
7. Rearrange the rows so that the dates in the second column are in chronological order.
Tip: Create a new blank row, and use it as a temporary holding area when moving rows.
8. Click the outside border of the table, hold down the mouse button, and drag straight down to move the table down about half an inch.
9. SAVE the presentation and CLOSE the fi le.
LEAVE PowerPoint open for use in the next project.
The Power fi le is available on the book companion website or in WileyPLUS.
c05AddingTablestoSlides.indd Page 187 8/26/11 10:59 AM user f-404 F-402

188 Lesson 5
Project 5-4: Is It on the Agenda?You are an assistant director of fi nance at Humongous Insurance Company. You have been tasked with establishing the agenda for a management meeting. You have created the agenda as a table on a slide, which will appear onscreen throughout the day. You think the table could use some additional formatting to make it easier to read and understand.
1. OPEN the Agenda presentation and save it as Agenda Final.
2. Center all entries in the second column, and then center the column head only for the third column.
3. Clear all formatting from the table using the Clear Table option on the Table Styles gallery.
4. Remove all borders using the No Border option on the Border menu.
5. Format the table’s header row as follows:
a. Increase the height of the column header row to 0.6”, and then center the column header text vertically in the row.
b. Apply bold, 20-point formatting to the column header text.
c. Select the header row cells and use the Format Shape dialog box to apply the Granite texture. Change the transparency of the texture to 65%.
d. Apply the Circle cell bevel effect to the header row cells.
6. Select the fi rst Break row and apply a shading of Aqua, Accent 3, Lighter 40%. Apply the same shading color to the second Break row.
7. Select the Lunch row and apply a shading of Lavender, Accent 5, Lighter 40%.
8. Apply the Inside Diagonal Bottom Right shadow effect to the entire table.
9. Add a border around the outside of the table and along the bottom of the header row.
10. SAVE the presentation as Agenda Final and CLOSE the fi le.
LEAVE PowerPoint open for use in the next project.
The Agenda fi le is available on the book companion website or in WileyPLUS.
Mastery Assessment
Project 5-5: Scaling the SummitYou are a district manager for Adventure Works, a travel agency specializing in adventurous destinations. You are preparing a presentation that contains a list of mountain climbing excursions you can use at a travel fair and need to format the table that contains the excursion information.
1. OPEN the Adventures presentation.
2. Go to slide 3 and select all the cells in the table.
3. Use the Mountain.jpg picture fi le as a background fi ll for the selected cells. Tile the picture, and adjust transparency so that the text can be clearly read against the background.
4. Apply shading formatting of your choice to the column heads, and adjust font color and style as desired to improve appearance.
5. Apply formatting to the header row that makes it stand out from the other text.
6. Apply borders of your choice to the table.
7. Apply an effect of your choice to the table.
8. SAVE the presentation as Adventures Final and CLOSE the fi le.
LEAVE PowerPoint open for use in the next project.
The Adventures fi le is available on the book companion website or in WileyPLUS.
The Mountain.jpg fi le is available on the book companion website or in WileyPLUS.
c05AddingTablestoSlides.indd Page 188 21/11/12 8:30 AM user-F408 /Users/user-F408/Desktop

Adding Tables to Slides 189
Project 5-6: Complaint ProcessYour employer, Trey Research, has been asked by Center City Hospital to help the hospital conduct an extensive study on patient complaints. You have been asked to tally complaints for the past year and categorize them. You have begun the process of creating a presentation to detail your fi ndings. Your fi rst step is a summary table that lays out the major categories of complaints.
1. OPEN the Complaints presentation.
2. Go to slide 2 and adjust column widths so that all the summary items are on one line.
3. Reorder the rows so that the categories are in alphabetical order.
4. Set the height of each of the rows (except the header row) to exactly 0.4”.
5. Split the Complaints column (except the column header cell) into two columns, and move all information from the original Complaints column, including the column header, into the right-hand split.
6. Merge the table cells in the left-hand split. (Do not merge the column header row, only the banded cells.)
7. In the merged cell, rotate the text direction 270 degrees and type Over 375 complaints received from patients in past 12 months.
8. Apply different shading colors to each category of complaint, with a border at the bottom of each category section.
9. Adjust column widths again if necessary and adjust alignment as necessary to improve table appearance.
10. SAVE the presentation as Complaints Final and CLOSE the fi le.
EXIT PowerPoint.
The Complaints fi le is available on the book companion website or in WileyPLUS.
Determine the local price for all these excursions. Create a PowerPoint presentation with a table that lists your possible destinations and dates of travel. Add a new slide and insert a worksheet. Enter the destinations and their costs and the conversion rate to convert local costs to dollars. Create for-mulas to convert costs so you can compare all package costs in U.S. dollars.
INTERNET READYYou want to take a vacation over the winter
holidays next year, but you have not yet decided whether to go skiing, enjoy the sun on a Caribbean island, or venture down under to Australia. Using Internet search tools, fi nd several interesting ski packages in Canada and Europe, resort packages in the Caribbean, and lodgings in Sydney, Australia.
c05AddingTablestoSlides.indd Page 189 8/26/11 10:59 AM user f-404 F-402