Adaptive Multi Sensor Based Nonlinear Identification of ... · Adaptive Multi Sensor Based...
13
Adaptive Multi Sensor Based Nonlinear Identification of Skeletal Muscle Force PARMOD KUMAR, CHANDRASEKHAR POTLURI, ANISH SEBASTIAN, STEVE CHIU, ALEX URFER, D. SUBBARAM NAIDU, and MARCO P. SCHOEN Measurement and Control Engineering Research Center, College of Engineering Idaho State University 921 South 8 th Avenue, Stop 8060, Pocatello, Idaho USA {kumaparm, potlchan, sebaanis, chiustev, urfealex, naiduds, schomarc}@isu.edu http://www.isu.edu/~schomarc Abstract: - Skeletal muscle force and surface electromyographic (sEMG) signals are closely related. Hence, the later can be used for the force estimation. Usually, the location for the sEMG sensors is near the respective muscle motor unit points. EMG signals generated by skeletal muscles are temporal and spatially distributed which results in cross talk that is recorded by different sEMG sensors. This research focuses on modeling muscle dynamics in terms of sEMG signals and the generated muscle force. Here, an array of three sEMG sensors is used to capture the information of the muscle dynamics in terms of sEMG signals and generated muscle force. Optimized nonlinear Half-Gaussian Bayesian filters and a Chebyshev type-II filter are used for the filtration of the sEMG signals and the muscle force signal, respectively. A Genetic Algorithm is used for the optimization of the filter parameters. sEMG and skeletal muscle force is modeled using multi nonlinear Auto Regressive eXogenous (ARX) and Wiener-Hammerstein models with different nonlinearity estimators/classes using System Identification (SI) for three sets of sensor data. An adaptive probabilistic Kullback Information Criterion (KIC) for model selection is applied to obtain the fusion based skeletal muscle force for each sensor first and then for the final outputs from each sensor. The approach yields good skeletal muscle force estimates. Key-Words: - sEMG, ARX, Weiner-Hammerstein, Prosthetic hand, KIC, System Identification, 1 Introduction Aftereffects of the loss of upper limbs are a reduction of functionality and psychological disturbance for the person. According to [1] there are 1.7 million peoples with amputation in the United States and this number is on rise after the Afghanistan and Iraq war in 2003 [2]. Conversely, a prosthetic limb can considerably increase the functionality of an amputee and benefit the person in everyday life. In the past, there have been various research works towards prosthetic hand design, having similar functionality and appearance as human hand [3-4]. Most of these research works are based on electromyography (EMG). The EMG signal is activated and controlled by the central nervous system, which depends on the flow of specific ions such as sodium ( ା ), potassium ( ܭା ) and calcium (ܥ ାା ). An EMG signal recorded on the surface of the limb is expressed as an electric voltage ranging between -5 and +5 mV. This method is known as surface electromyography (sEMG). sEMG is utilized as an input to the controller to realize the movements of the prosthesis and force control [5-6]. Past research results show that EMG signal amplitude generally increases with skeletal muscle force. However, this relationship is not always rigid; various factors affect this relationship. EMG signals are a result of the varying motor unit recruitments, crosstalk, and biochemical interaction within the muscular fibres. This makes EMG signals random, complex and dynamic in nature and the control of the prosthesis difficult. Moreover, it changes continuously due to the onset and progression of muscle fatigue which results because of continuous high frequency stimulation or because of titanic stimulation [7]. Synchronization of active motor units along the muscle fibres, and a decrease in conduction velocity are reflected in the EMG signal as an increase of amplitude in time domain and a decrease of medium frequency in frequency domain [7]. All these factors make the relationship between EMG and force nonlinear. Correct interpretation of EMG signal is vital to achieve precise motion and force control of prosthesis. WSEAS TRANSACTIONS on SYSTEMS Parmod Kumar, Chandrasekhar Potluri, Anish Sebastian, Steve Chiu, Alex Urfer, D. Subbaram Naidu, Marco P. Schoen ISSN: 1109-2777 1050 Issue 10, Volume 9, October 2010
Transcript of Adaptive Multi Sensor Based Nonlinear Identification of ... · Adaptive Multi Sensor Based...

Adaptive Multi Sensor Based Nonlinear Identification of Skeletal Muscle Force
PARMOD KUMAR, CHANDRASEKHAR POTLURI, ANISH SEBASTIAN, STEVE CHIU, ALEX
URFER, D. SUBBARAM NAIDU, and MARCO P. SCHOEN Measurement and Control Engineering Research Center, College of Engineering
Idaho State University 921 South 8th Avenue, Stop 8060, Pocatello, Idaho
USA {kumaparm, potlchan, sebaanis, chiustev, urfealex, naiduds, schomarc}@isu.edu
http://www.isu.edu/~schomarc Abstract: - Skeletal muscle force and surface electromyographic (sEMG) signals are closely related. Hence, the later can be used for the force estimation. Usually, the location for the sEMG sensors is near the respective muscle motor unit points. EMG signals generated by skeletal muscles are temporal and spatially distributed which results in cross talk that is recorded by different sEMG sensors. This research focuses on modeling muscle dynamics in terms of sEMG signals and the generated muscle force. Here, an array of three sEMG sensors is used to capture the information of the muscle dynamics in terms of sEMG signals and generated muscle force. Optimized nonlinear Half-Gaussian Bayesian filters and a Chebyshev type-II filter are used for the filtration of the sEMG signals and the muscle force signal, respectively. A Genetic Algorithm is used for the optimization of the filter parameters. sEMG and skeletal muscle force is modeled using multi nonlinear Auto Regressive eXogenous (ARX) and Wiener-Hammerstein models with different nonlinearity estimators/classes using System Identification (SI) for three sets of sensor data. An adaptive probabilistic Kullback Information Criterion (KIC) for model selection is applied to obtain the fusion based skeletal muscle force for each sensor first and then for the final outputs from each sensor. The approach yields good skeletal muscle force estimates. Key-Words: - sEMG, ARX, Weiner-Hammerstein, Prosthetic hand, KIC, System Identification,
1 Introduction Aftereffects of the loss of upper limbs are a reduction of functionality and psychological disturbance for the person. According to [1] there are 1.7 million peoples with amputation in the United States and this number is on rise after the Afghanistan and Iraq war in 2003 [2]. Conversely, a prosthetic limb can considerably increase the functionality of an amputee and benefit the person in everyday life.
In the past, there have been various research works towards prosthetic hand design, having similar functionality and appearance as human hand [3-4]. Most of these research works are based on electromyography (EMG). The EMG signal is activated and controlled by the central nervous system, which depends on the flow of specific ions such as sodium ( ), potassium ( ) and calcium ( ).
An EMG signal recorded on the surface of the limb is expressed as an electric voltage ranging between -5 and +5 mV. This method is known as surface electromyography (sEMG). sEMG is
utilized as an input to the controller to realize the movements of the prosthesis and force control [5-6]. Past research results show that EMG signal amplitude generally increases with skeletal muscle force. However, this relationship is not always rigid; various factors affect this relationship. EMG signals are a result of the varying motor unit recruitments, crosstalk, and biochemical interaction within the muscular fibres. This makes EMG signals random, complex and dynamic in nature and the control of the prosthesis difficult. Moreover, it changes continuously due to the onset and progression of muscle fatigue which results because of continuous high frequency stimulation or because of titanic stimulation [7]. Synchronization of active motor units along the muscle fibres, and a decrease in conduction velocity are reflected in the EMG signal as an increase of amplitude in time domain and a decrease of medium frequency in frequency domain [7]. All these factors make the relationship between EMG and force nonlinear. Correct interpretation of EMG signal is vital to achieve precise motion and force control of prosthesis.
WSEAS TRANSACTIONS on SYSTEMSParmod Kumar, Chandrasekhar Potluri, Anish Sebastian, Steve Chiu, Alex Urfer, D. Subbaram Naidu, Marco P. Schoen
ISSN: 1109-2777 1050 Issue 10, Volume 9, October 2010
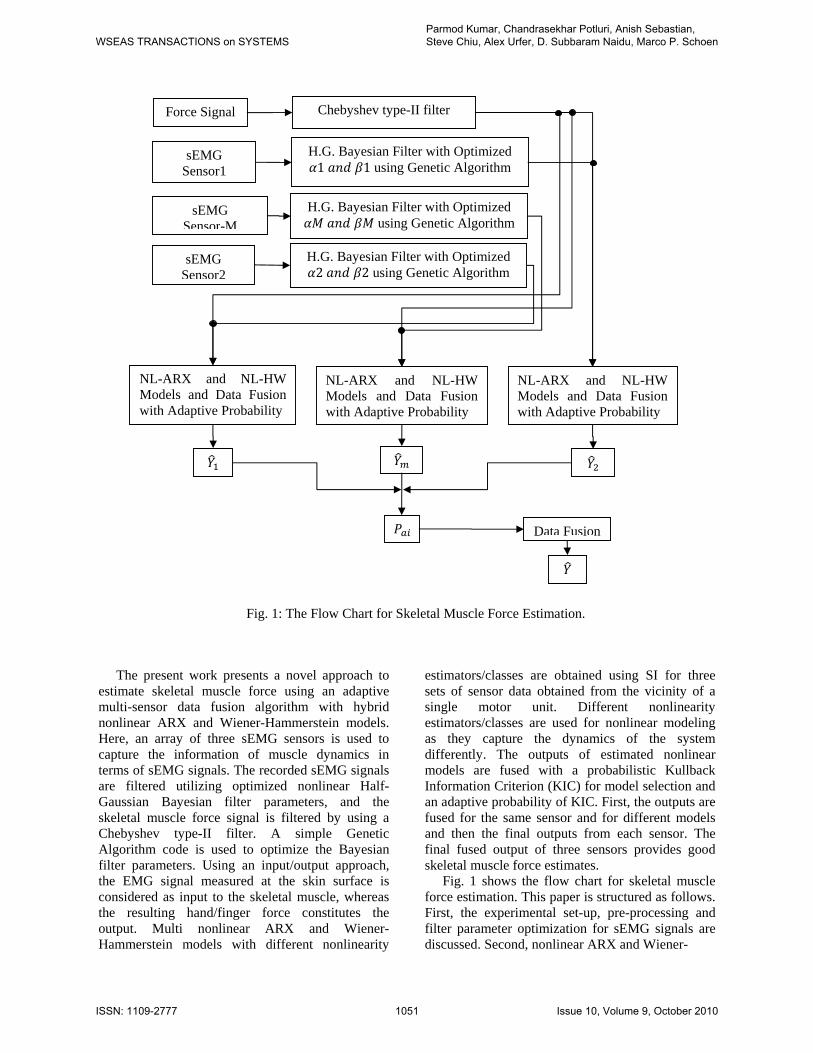
Fig. 1: The Flow Chart for Skeletal Muscle Force Estimation.
The present work presents a novel approach to estimate skeletal muscle force using an adaptive multi-sensor data fusion algorithm with hybrid nonlinear ARX and Wiener-Hammerstein models. Here, an array of three sEMG sensors is used to capture the information of muscle dynamics in terms of sEMG signals. The recorded sEMG signals are filtered utilizing optimized nonlinear Half-Gaussian Bayesian filter parameters, and the skeletal muscle force signal is filtered by using a Chebyshev type-II filter. A simple Genetic Algorithm code is used to optimize the Bayesian filter parameters. Using an input/output approach, the EMG signal measured at the skin surface is considered as input to the skeletal muscle, whereas the resulting hand/finger force constitutes the output. Multi nonlinear ARX and Wiener-Hammerstein models with different nonlinearity
estimators/classes are obtained using SI for three sets of sensor data obtained from the vicinity of a single motor unit. Different nonlinearity estimators/classes are used for nonlinear modeling as they capture the dynamics of the system differently. The outputs of estimated nonlinear models are fused with a probabilistic Kullback Information Criterion (KIC) for model selection and an adaptive probability of KIC. First, the outputs are fused for the same sensor and for different models and then the final outputs from each sensor. The final fused output of three sensors provides good skeletal muscle force estimates.
Fig. 1 shows the flow chart for skeletal muscle force estimation. This paper is structured as follows. First, the experimental set-up, pre-processing and filter parameter optimization for sEMG signals are discussed. Second, nonlinear ARX and Wiener-
Force Signal Chebyshev type-II filter
Data Fusion
sEMG Sensor1
sEMG Sensor-M
sEMG Sensor2
H.G. Bayesian Filter with Optimized 1 1 using Genetic Algorithm
H.G. Bayesian Filter with Optimized using Genetic Algorithm
H.G. Bayesian Filter with Optimized 2 2 using Genetic Algorithm
NL-ARX and NL-HW Models and Data Fusion with Adaptive Probability
NL-ARX and NL-HW Models and Data Fusion with Adaptive Probability
NL-ARX and NL-HW Models and Data Fusion with Adaptive Probability
WSEAS TRANSACTIONS on SYSTEMSParmod Kumar, Chandrasekhar Potluri, Anish Sebastian, Steve Chiu, Alex Urfer, D. Subbaram Naidu, Marco P. Schoen
ISSN: 1109-2777 1051 Issue 10, Volume 9, October 2010

Fig. 2: Experimental Set-Up.
Fig. 3: (a) Raw and (b) Chebyshev Type-II Filtered Skeletal Muscle Force Signals.
Hammerstein modeling is covered. Third, the fusion of various nonlinear model outputs using KIC and adaptive probability of KIC is covered. Finally, the results, discussion and future work are provided followed by a conclusion to summarize the importance of this work.
2 Experimental Set-Up and Pre-Processing The experimental set-up is shown in Fig. 2. Both sEMG and muscle force signals were acquired simultaneously using LabVIEW™ at a sampling rate of 2000 Hz. The sEMG data capturing was aided by a DELSYS® Bagnoli-16 EMG system with DE-2.1 differential EMG sensors. The
2 4 6 8 10 12
x 104
0.2
0.4
0.6
0.8
1
Time (60.35 secs)
Am
plitu
de
(a) Raw Skeletal Muscle Force Signal
2 4 6 8 10 12
x 104
0.2
0.4
0.6
0.8
1
Time (60.35 secs)
Am
plitu
de
(b) Chebyshev Type - II Filtered Force Signal
WSEAS TRANSACTIONS on SYSTEMSParmod Kumar, Chandrasekhar Potluri, Anish Sebastian, Steve Chiu, Alex Urfer, D. Subbaram Naidu, Marco P. Schoen
ISSN: 1109-2777 1052 Issue 10, Volume 9, October 2010

Fig. 4(a): Rectified EMG and Half-Gaussian Filtered EMG Signal for Motor Point Sensor.
Fig. 4(b): Rectified EMG and Half-Gaussian Filtered EMG Signal for Ring 1 Sensor.
2 4 6 8 10 12
x 104
0
0.2
0.4
0.6
0.8
Am
plitu
de
Rectified EMG for Motor Point Sensor
2 4 6 8 10 12
x 104
0
0.2
0.4
0.6
Time (60.35 Seconds)
Am
plitu
de
Half Gaussian Filtered EMG for Motor Point Sensor
2 4 6 8 10 12
x 104
0
0.2
0.4
0.6
0.8
Am
plitu
de
Rectified EMG for Ring 1 Sensor
2 4 6 8 10 12
x 104
0
0.2
0.4
0.6
0.8
Time (60.35 Seconds)
Am
plitu
de
Half Gaussian Filtered EMG for Ring 1 Sensor
WSEAS TRANSACTIONS on SYSTEMSParmod Kumar, Chandrasekhar Potluri, Anish Sebastian, Steve Chiu, Alex Urfer, D. Subbaram Naidu, Marco P. Schoen
ISSN: 1109-2777 1053 Issue 10, Volume 9, October 2010

Fig. 4(c): Rectified EMG and Half-Gaussian Filtered EMG Signal for Ring 2 Sensor.
corresponding force data was captured using Interlink Electronics FSR 0.5” circular force sensor. One sEMG sensor was placed on the motor point of the ring finger and two adjacent to the motor point of a healthy subject. Prior to placing the sEMG sensors, the skin surface of the subject was prepared according to International Society of Electrophysiology and Kinesiology (ISEK) protocols. According to previous research, the Bayesian based filtering method yields the most suitable sEMG signals [8]. The nonlinear filter significantly reduces noise and extracts a signal that best describes EMG signals and may permit effective use in prosthetic control. An instantaneous conditional probability density | provides the resulting EMG for the latent driving signal [8]. The model for the conditional probability of the rectified EMG signal | | is used in this current estimation algorithm. EMG signals are usually described as amplitude-modulated zero mean Gaussian noise sequence [9]. For the rectified EMG signal, the “Half-Gaussian measurement model” in [8] is given by Equation (1).
|∗
√. (1)
The EMG signal is modeled for the conditional probability of the rectified EMG signal as a filtered random process with random rate. The likelihood function for the rate evolves in time according to a Fokker–Planck partial differential equation [8]. The discrete time Fokker–Planck Equation is given by equation (2). , ∗ , 1 1 2 ∗ ∗
, 1 ∗ , 1 1 ∗ , 1 . 2 Here, and are two free parameters, is the expected rate of gradual drift in the signal, and is the expected rate of sudden shifts in the signal. The unknown driving signal is discretized into bins of width . These two free parameters of the non-linear Half-Gaussian filter model are optimized for the acquired EMG data using elitism based GA. GA belongs to a class of optimization algorithms that are based on observing nature and its corresponding processes to imitate solving complex problems, most often optimization or estimation problems, see [10-12]. A Chebyshev type II low pass filter with a 550 Hz pass frequency is used to filter the force signal. Fig. 3 depicts the raw and Chebyshev type-II low pass filtered force signals. Fig. 4(a), (b) and (c)
2 4 6 8 10 12
x 104
0
0.2
0.4
0.6
0.8
Am
plitu
de
Rectified EMG for Ring 2 Sensor
2 4 6 8 10 12
x 104
0
0.2
0.4
0.6
0.8
Time (60.35 Seconds)
Am
plitu
de
Half Gaussian Filtered EMG for Ring 2 Sensor
WSEAS TRANSACTIONS on SYSTEMSParmod Kumar, Chandrasekhar Potluri, Anish Sebastian, Steve Chiu, Alex Urfer, D. Subbaram Naidu, Marco P. Schoen
ISSN: 1109-2777 1054 Issue 10, Volume 9, October 2010

show the rectified EMG and Half-Gaussian Filtered EMG signal for three sensors.
3 Nonlinear ARX and Wiener-Hammerstein Modeling
In this paper, we are using nonlinear ARX and Wiener-Hammerstein models with different nonlinearity estimators/classes to model three sEMG sensors data as input and skeletal muscle force data as output. The nonlinear ARX model uses a parallel combination of nonlinear and linear blocks [13].
Fig. 5 shows the nonlinear ARX model structure. The nonlinear ARX model uses regressors as variables for nonlinear and linear functions. Regressors are functions of measured input-output data [13]. The predicted output of a nonlinear model at time is given by the general Equation (3): (3) where represents the regressors, is a nonlinear regressor command, which is estimated by nonlinearity estimators/classes [13]. As shown in Fig. 5, the command can include both linear and nonlinear functions of . Equation (4) gives the description of . ∑ (4) where is the unit nonlinear command, is the number of nonlinearity units, and , and are the parameters of the nonlinearity estimators/classes [13].
The Wiener-Hammerstein model uses one or two static nonlinear blocks in series with a linear block. Structural representation of a nonlinear Wiener-Hammerstein is shown in Fig. 6 [13].
The general Equations (5), (6), and (7) can describe the Wiener-Hammerstein structure [13]. (5)
,
, (6)
. (7) where and are input and output of the system, respectively, and are nonlinear functions, which corresponds to input and output nonlinearity, respectively, and are internal variables, where has the same dimensions as and has the same dimensions as , and and corresponds to the linear dynamic block, these are polynomials in the backward shift operator.
The nonlinearity classes used in this work are Wavenet, Treepartition, Sigmoidnet, Pwlinear, Saturation, and Deadzone. For motor point and ring1 sensors, three nonlinear ARX and four
nonlinear Wiener-Hammerstein models with different nonlinearity estimators/classes are obtained. For ring2 sensor, three nonlinear ARX and five nonlinear Wiener-Hammerstein models with different nonlinearity estimators/classes are obtained. Tables 1, 2 and 3 gives the nonlinearity estimators/classes for different sensors and their corresponding model fit values.
Fig. 5: Nonlinear ARX Model Structure.
Fig. 6: Nonlinear Wiener-Hammerstein Model
Structure.
4 Data Fusion and Adaptive KIC Probability
Data fusion of multiple outputs of nonlinear ARX and Wiener-Hammerstein models is done by assigning a particular probability to each individual model [14]. First, the fusion algorithm is applied to the outputs of different nonlinear ARX and Wiener-Hammerstein models for each sensor obtained using different nonlinearity estimators. Second, the fusion algorithm is again applied to the final fusion based
Input Input Nonlinearity
Linear Block
Output Nonlinearity
Output
Input Output
1 1 , 2 3 , 1 1 Regressors
Nonlinear Function
Linear Function
Predicted Output
WSEAS TRANSACTIONS on SYSTEMSParmod Kumar, Chandrasekhar Potluri, Anish Sebastian, Steve Chiu, Alex Urfer, D. Subbaram Naidu, Marco P. Schoen
ISSN: 1109-2777 1055 Issue 10, Volume 9, October 2010
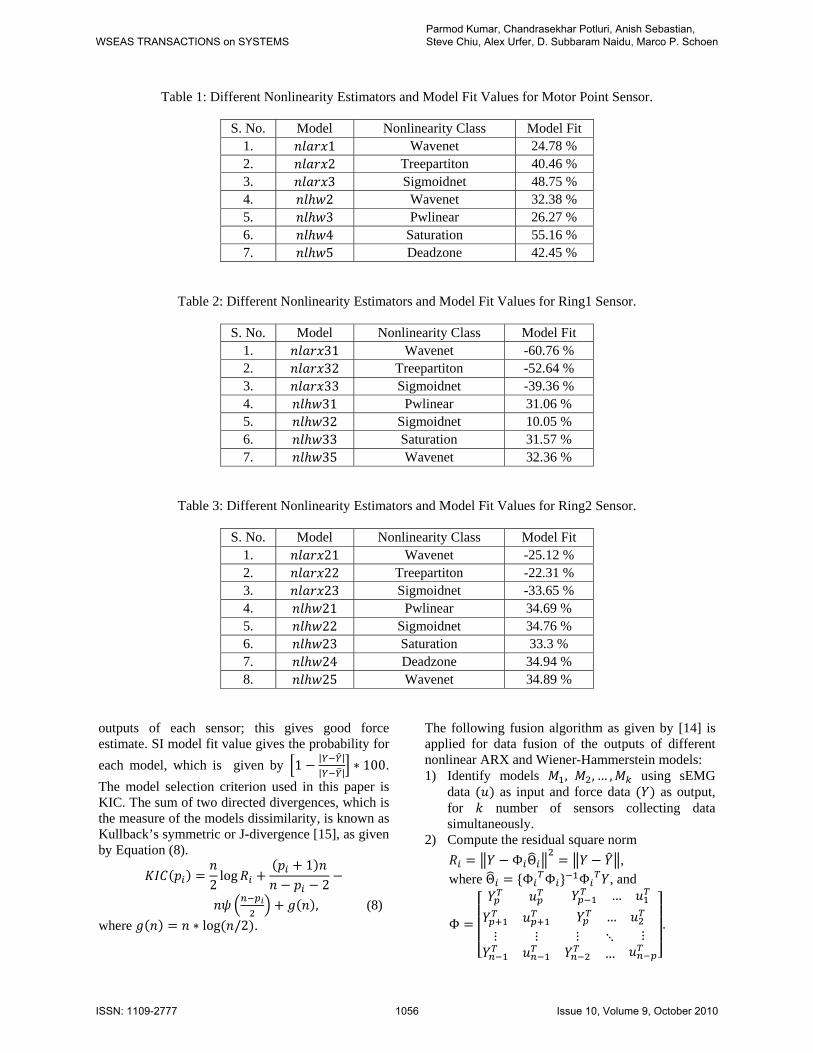
Table 1: Different Nonlinearity Estimators and Model Fit Values for Motor Point Sensor.
S. No. Model Nonlinearity Class Model Fit 1. 1 Wavenet 24.78 % 2. 2 Treepartiton 40.46 % 3. 3 Sigmoidnet 48.75 % 4. 2 Wavenet 32.38 % 5. 3 Pwlinear 26.27 % 6. 4 Saturation 55.16 % 7. 5 Deadzone 42.45 %
Table 2: Different Nonlinearity Estimators and Model Fit Values for Ring1 Sensor.
S. No. Model Nonlinearity Class Model Fit 1. 31 Wavenet -60.76 % 2. 32 Treepartiton -52.64 % 3. 33 Sigmoidnet -39.36 % 4. 31 Pwlinear 31.06 % 5. 32 Sigmoidnet 10.05 % 6. 33 Saturation 31.57 % 7. 35 Wavenet 32.36 %
Table 3: Different Nonlinearity Estimators and Model Fit Values for Ring2 Sensor.
S. No. Model Nonlinearity Class Model Fit 1. 21 Wavenet -25.12 % 2. 22 Treepartiton -22.31 % 3. 23 Sigmoidnet -33.65 % 4. 21 Pwlinear 34.69 % 5. 22 Sigmoidnet 34.76 % 6. 23 Saturation 33.3 % 7. 24 Deadzone 34.94 % 8. 25 Wavenet 34.89 %
outputs of each sensor; this gives good force estimate. SI model fit value gives the probability for
each model, which is given by 1| |
| |∗ 100.
The model selection criterion used in this paper is KIC. The sum of two directed divergences, which is the measure of the models dissimilarity, is known as Kullback’s symmetric or J-divergence [15], as given by Equation (8).
2log
1
2
, (8)
where ∗ log /2 .
The following fusion algorithm as given by [14] is applied for data fusion of the outputs of different nonlinear ARX and Wiener-Hammerstein models: 1) Identify models , , … , using sEMG
data as input and force data as output, for number of sensors collecting data simultaneously.
2) Compute the residual square norm
Φ Θ , where Θ Φ Φ Φ , and
Φ
…
…
⋮ ⋮ ⋮ ⋱…
⋮.
WSEAS TRANSACTIONS on SYSTEMSParmod Kumar, Chandrasekhar Potluri, Anish Sebastian, Steve Chiu, Alex Urfer, D. Subbaram Naidu, Marco P. Schoen
ISSN: 1109-2777 1056 Issue 10, Volume 9, October 2010

Fig. 7: Data Fusion and Adaptive KIC Probability.
3) Calculate the model criteria coefficient using Equation (8).
4) Compute the model probability |
∑, where is model selection criterion,
i.e. . 5) Compute the fused model output
∑ | . 6) Compute the overall model from and force
data. Here all the computation from step 2) to 6) is adaptive i.e. the residual square norm, , model probability | , and fused model output
are being updated with time or for each data point. Fig. 7 shows the flow chart for fusion of outputs and adaptive probability of KIC.
5 Results, Discussion and Future Work
This section deals with the results, discussion and future work. The following plots show the nonlinear
(ARX and Wiener-Hammerstein) model and adaptive fusion algorithm based estimated force output for each sensor first and then finally combined adaptive fusion based output for all three sensors. Fig. 8 shows the overlapping plot of the original and adaptive fusion based force output for the motor point sensor. The output is the result of the adaptive fusion algorithm on three nonlinear ARX and four nonlinear Wiener-Hammerstein models for the motor point sensor signal. Fig. 9 shows the overlapping plot of the original and adaptive fusion based force output for ring1 sensor. This output is the result of adaptive fusion algorithm of three nonlinear ARX and four nonlinear Wiener-Hammerstein models for ring1 sensor signal. Fig. 10 shows the overlapping plot of the original and adaptive fusion based force output for ring2 sensor. This output is the result of adaptive fusion algorithm on three nonlinear ARX and five nonlinear Wiener-Hammerstein models for ring2 sensor signal. Fig. 11 shows the overlapping plot of the original and final combined adaptive fusion based force output for motor point, ring1 and ring2 sensors. The output is the result of adaptive fusion algorithm on the final
Y
R1
R2
Rn
M1
M2
Mn
Error
⋮
WSEAS TRANSACTIONS on SYSTEMSParmod Kumar, Chandrasekhar Potluri, Anish Sebastian, Steve Chiu, Alex Urfer, D. Subbaram Naidu, Marco P. Schoen
ISSN: 1109-2777 1057 Issue 10, Volume 9, October 2010
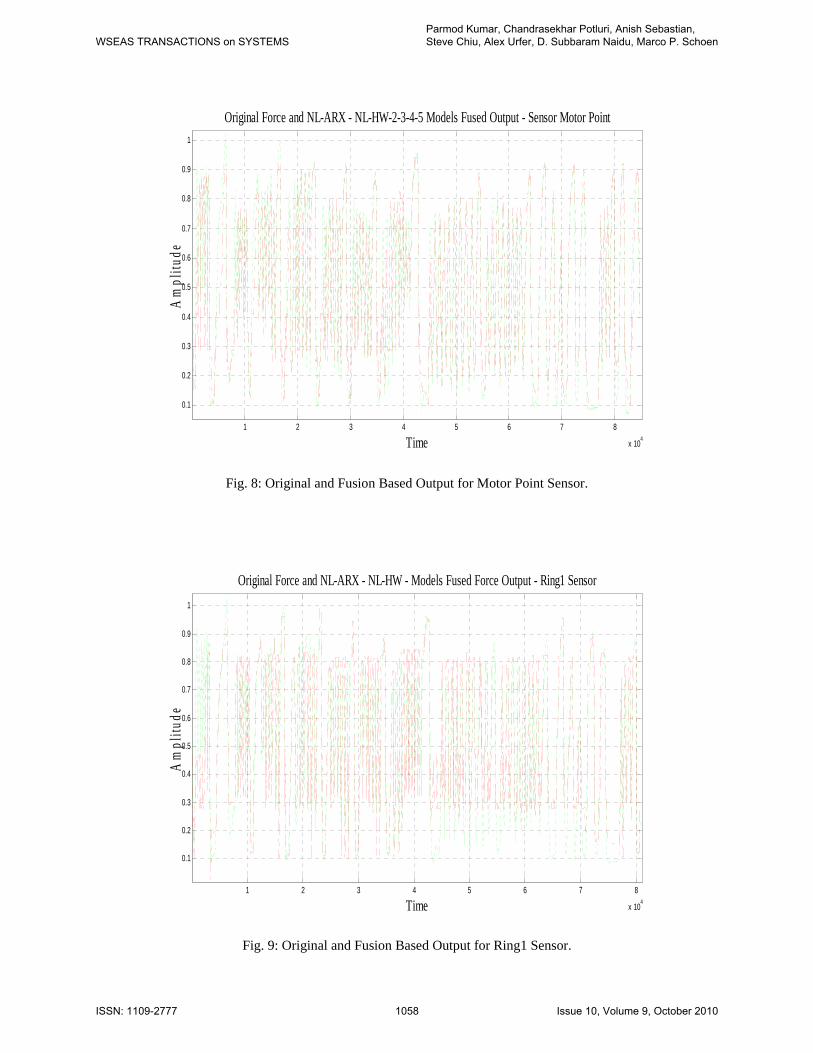
Fig. 8: Original and Fusion Based Output for Motor Point Sensor.
Fig. 9: Original and Fusion Based Output for Ring1 Sensor.
1 2 3 4 5 6 7 8
x 104
0.1
0.2
0.3
0.4
0.5
0.6
0.7
0.8
0.9
1
Time
Am
plitu
de
Original Force and NL-ARX - NL-HW-2-3-4-5 Models Fused Output - Sensor Motor Point
1 2 3 4 5 6 7 8
x 104
0.1
0.2
0.3
0.4
0.5
0.6
0.7
0.8
0.9
1
Time
Am
plitu
de
Original Force and NL-ARX - NL-HW - Models Fused Force Output - Ring1 Sensor
WSEAS TRANSACTIONS on SYSTEMSParmod Kumar, Chandrasekhar Potluri, Anish Sebastian, Steve Chiu, Alex Urfer, D. Subbaram Naidu, Marco P. Schoen
ISSN: 1109-2777 1058 Issue 10, Volume 9, October 2010

Fig. 10: Original and Fusion Based Output for Ring2 Sensor.
Fig. 11: Final Plot - Original and Fusion Based Output for All Three Sensors.
1 2 3 4 5 6 7
x 104
0.1
0.2
0.3
0.4
0.5
0.6
0.7
0.8
0.9
1
Time
Am
plitu
de
Original Force and NL-ARX - NL-HW Models Fused Output - Ring2 Sensor
1 2 3 4 5 6 7
x 104
0.1
0.2
0.3
0.4
0.5
0.6
0.7
0.8
0.9
1
Time
Am
plitu
de
Original Force and NL-ARX - NL-HW Models Output - MotorPoint - Ring1 - Ring2 Sensors
WSEAS TRANSACTIONS on SYSTEMSParmod Kumar, Chandrasekhar Potluri, Anish Sebastian, Steve Chiu, Alex Urfer, D. Subbaram Naidu, Marco P. Schoen
ISSN: 1109-2777 1059 Issue 10, Volume 9, October 2010

Fig. 12: Error Plot – Original and Best-Estimated Model Output for Motor Point Sensor.
Fig. 13: Final Error Plot – Original and Fusion Based Output for Motor Point, Ring1 and Ring2 Sensors.
WSEAS TRANSACTIONS on SYSTEMSParmod Kumar, Chandrasekhar Potluri, Anish Sebastian, Steve Chiu, Alex Urfer, D. Subbaram Naidu, Marco P. Schoen
ISSN: 1109-2777 1060 Issue 10, Volume 9, October 2010

outputs of three sensors i.e. motor point, ring1 and ring2 as shown in Fig. 8 to 10. Fig. 11 shows the best skeletal muscle force estimate, which is the result of the multi nonlinear ARX and Wiener-Hammerstein models and an adaptive hybrid data fusion on these nonlinear models. Fig. 12 shows the error plot of the original and best-estimated model output for the motor point sensor.
Fig. 13 shows the error plot of original and final multi nonlinear modeled and adaptive hybrid data fusion based force estimate (results from three sensors, nonlinear modeling and adaptive data fusion algorithm). If we compare Fig. 12 and 13, it is very clear and conspicuous that the error has decreased remarkably and is very close to zero.
Future work will focus on the improvement of the data collection techniques and experimental set-up. By using the combination of linear and nonlinear modeling, and adaptive hybrid data fusion, the skeletal muscle force estimate can be improved further. Furthermore, the authors believe that by using different model selection criteria such as Akaike Information Criterion (AIC), Kullback Information Criterion (KIC) and the Bayesian Information Criterion (BIC) together to obtain final skeletal muscle force estimate will give improved results.
6 Conclusions sEMG and force data acquired using three EMG and one common FSR force sensor is modeled using nonlinear SI. Using different nonlinearity estimators/classes, multi nonlinear ARX and Wiener-Hammerstein models are obtained for each sensor. First, the outputs of different models for each sensor are fused with a data fusion algorithm and an adaptive KIC probability. Finally, the fused outputs from each sensor are again fused with same algorithm and adaptive KIC probability. The final estimated force using this technique gives the best estimate. The presented approach can be utilized for controlling prosthetic hands [16].
Acknowledgement The research was sponsored by the US Department of the Army, under the award number W81XWH-10-1-0128 awarded and administered by the U.S. Army Medical Research Acquisition Activity, 820 Chandler Street, Fort Detrick MD 21702-5014. The information does not necessarily reflect the position or the policy of the Government, and no official endorsement should be inferred. For purposes of this
article, information includes news releases, articles, manuscripts, brochures, advertisements, still and motion pictures, speeches, trade association proceedings, etc. References: [1] Kathryn Ziegler-Graham, PhD, et al.,
Estimating the Prevalence of Limb Loss in the United States - 2005 to 2050, Archives of Physical Medicine and Rehabilitation, 89 (2008): 422-429.
[2] O'Connor, P., Iraq war vet decides to have second leg amputated, Columbia Missourian, 2009.
[3] N. Dechev, W. L. Cleghorn, and S. Naumann, Multiple finger, passive adaptive grasp prosthetic hand, Mechanism and Machine Theory, 36(2001), pp. 1157-1173.
[4] Haruhisa Kawasaki, Tsuneo Komatsu, and Kazunao Uchiyama, Dexterous Anthropomorphic Robot Hand With Distributed Tactile Sensor: Gifu Hand II, IEEE/ASME Transactions on Mechatronics, Vol. 7, No. 3, September 2002, pp. 296-303.
[5] M. Zecca, S. Micera, M. C. Carrozza, and P. Dario, Control of Multifunctional Prosthetic Hands by Processing the Electromyographic Signal, Critical Reviews™ in Biomedical Engineering, 30(4–6), 2002, pp. 459–485.
[6] Claudio Castellini and Patrick van der Smagt, Surface EMG in advanced hand prosthetics, Biological Cybernetics, (2009) 100, pp. 35–47.
[7] C.J. De Luca, Myoelectrical manifestations of localized muscular fatigue in humans, Crit. Rev. Biomed. Eng., 11 (4), 1984, pp. 251-279.
[8] Terence D. Sanger, Bayesian Filtering of Myoelectric Signals, J Neurophysiol, 97, 2007, pp. 1839–1845.
[9] M. B. I. Reaz, M. S. Hussain and F. Mohd-Yasin, Techniques of EMG signal analysis: detection, processing, classification and applications, Biol. Proced. Online, 2006, 8(1), pp. 11-35.
[10] E. Kral, L. Vasek, V. Dolinay, P. Varacha, Usage of PSO Algorithm for Parameter Identification of District Heating Network Simulation Model, The 14th World Scientific and Engineering Academy and Society (WSEAS) International Conference on Systems, Corfu Island, Greece, July 22-24, 2010.
[11] A. Neubaur, The Intrinsic System Model of the Simple Genetic Algorithm with -Selection, Uniform Crossover and Bitwise Mutation, The 14th World Scientific and Engineering Academy and Society (WSEAS) International Conference
WSEAS TRANSACTIONS on SYSTEMSParmod Kumar, Chandrasekhar Potluri, Anish Sebastian, Steve Chiu, Alex Urfer, D. Subbaram Naidu, Marco P. Schoen
ISSN: 1109-2777 1061 Issue 10, Volume 9, October 2010

on Systems, Corfu Island, Greece, July 22-24, 2010.
[12] A. Sebastian, P. Kumar, M. P. Schoen, A Study on Hybridization of Particle Swarm and Tabu Search Algorithm for Unconstraint Optimization and Estimation, in The 14th World Scientific and Engineering Academy and Society (WSEAS) International Conference on Systems, Corfu Island, Greece, July 22-24, 2010.
[13] Lennart Ljung, System Identification ToolboxTM 7 User’s Guide, The MathWorks, Inc., 2010.
[14] Huimin Chen and Shuqing Huang, A Comparative study on Model Selection and Multiple Model Fusion, 7th International Conference on Information Fusion, 2005, pp. 820-826.
[15] Abd-Krim Seghouane, Maiza Bekara, and Gilles Fleury, A Small Sample Model Selection Criterion Based on Kullback’s symmetric Divergence, IEEE Transaction on Signal Processing, 2003, pp. 145-148.
[16] C. H. Chen, D. S. Naidu, M. P. Schoen, An Adaptive Control Strategy for a Five-Fingered Prosthetic Hand, The 14th World Scientific and Engineering Academy and Society (WSEAS) International Conference on Systems, Corfu Island, Greece, July 22-24, 2010.
WSEAS TRANSACTIONS on SYSTEMSParmod Kumar, Chandrasekhar Potluri, Anish Sebastian, Steve Chiu, Alex Urfer, D. Subbaram Naidu, Marco P. Schoen
ISSN: 1109-2777 1062 Issue 10, Volume 9, October 2010