Adapting to Climate Change in · PDF fileAdapting to Climate Change in Wales ... Geology,...
52
Adapting to Climate Change in Wales An Education Resource Pack for Teachers and Pupils of Key Stage 4
Transcript of Adapting to Climate Change in · PDF fileAdapting to Climate Change in Wales ... Geology,...

Adapting to Climate Change in Wales
An Education Resource Pack for Teachers and Pupils of Key Stage 4

Page 2
ForewordClimate change is one of the biggest challenges we are likely to face in the 21st Century. As a weather forecaster and presenter, I have observed how weather patterns have been changing, particularly in recent years.
Today’s young people are the decision-makers of the future, and so it is vitally important to ensure they have a clear and balanced view of potential climate change risks and an understanding of options and implications of adaptation.
This education pack explains the scientific basis of climate change and explores how everyday issues such as food supply, settlement, transport and health may be affected.
This pack will help teachers deliver high quality, balanced information and inspire young people to adapt their behaviour to ensure their future sustainability.
Derek Brockway, BBC Weather Forecaster and Presenter May 2011
A Weather Front Approaching

Page 3
ContentsPART 1 - Introduction
• Foreword 2
• Contents 3
• How to use this pack 4
• Introduction 5
PART 2 - The scientific background
• Theme 1: The global climate perspective 6
• Theme 2: The Welsh climate perspective 12
PART 3 - Impacts and adaptation options
• Theme 3: Food supply and natural resources 18
• Theme 4: Settlement 25
• Theme 5: Critical infrastructure 31
• Theme 6: Industry 38
• Theme 7: Health and wellbeing 44
PART 4 - Additional information
• List of figures and sources 50
• Glossary 52
Acknowledgements
We would like to thank our funders, the Beacons Programme for Wales, Countryside Council for Wales and IMCORE project for supporting this work. We would also like to thank the teachers and pupils of schools that participated in the workshops that were used to develop this education pack.
For further information, please contact: Rhoda Ballinger ([email protected]) Jeanette Reis ([email protected]) Tara Thrupp ([email protected]) School of Earth and Ocean Sciences, Cardiff University, Main Building, Park Place, Cardiff, CF10 3YE.

Page 4
How to Use This Pack This pack has been designed to support activities of teachers and pupils of Key Stage 4 Geography, Geology, Physics, Chemistry, Biology, Humanities, Personal and Social Education. It explores how changes in the climate change could impact citizens of Wales, and in particular how citizens could adapt to living in a different climate. Although the focus is on Wales, this packs draws on examples from all over the world.
The pack has been divided into a number of themes for ease of use. Themes are as follows:
Theme 1: The global climate perspective
Theme 2: The Welsh climate perspective
Theme 3: Food supply and natural resources
Theme 4: Settlement
Theme 5: Critical infrastructure
Theme 6: Industry
Theme 7: Health and wellbeing
Each theme has a number of sections. Sections for teachers include:
• Signposting for teachers to show which parts of the national curriculum are covered
• Key learning outcomes
• Teacher background information
• Activities (note: classroom activities are highlighted with the symbol )
• References (note: bilingual references are highlighted with the symbol ).
Sections for pupils include:
• Information about risk factors
• Information about adaptation options.
A glossary and list of information sources are provided at the end of the pack. There are also a number of “Did you know?” and “Have you ever considered?” boxes to encourage additional discussion about implications of adaptation options.
Page 5
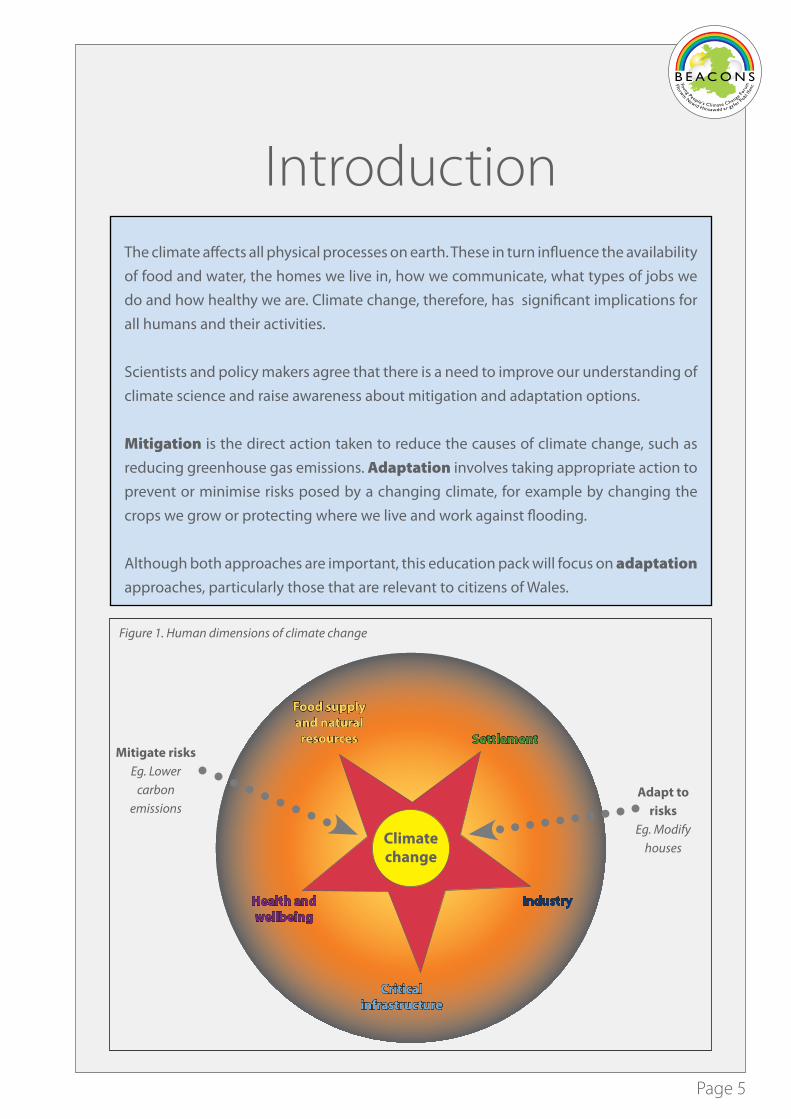
Introduction The climate affects all physical processes on earth. These in turn influence the availability of food and water, the homes we live in, how we communicate, what types of jobs we do and how healthy we are. Climate change, therefore, has significant implications for all humans and their activities.
Scientists and policy makers agree that there is a need to improve our understanding of climate science and raise awareness about mitigation and adaptation options.
Mitigation is the direct action taken to reduce the causes of climate change, such as reducing greenhouse gas emissions. Adaptation involves taking appropriate action to prevent or minimise risks posed by a changing climate, for example by changing the crops we grow or protecting where we live and work against flooding.
Although both approaches are important, this education pack will focus on adaptation approaches, particularly those that are relevant to citizens of Wales.
Figure 1. Human dimensions of climate change
Mitigate risksEg. Lower
carbon emissions
Food supply and natural
resources Settlement
Adapt to risks
Eg. Modify houses
Health and wellbeing
Critical infrastructure
Industry
Climate change

Page 6
The
Glo
bal
Cli
mat
e Pe
rsp
ecti
ve Theme 1: The Global Climate Perspective
Teacher Notes:
This section relates to the following units and themes within the national curriculum:Geography: Unit 1A Theme 2; Unit 1A Theme 8 Geology: Theme 3.3, Theme 5.2 Physics:- Chemistry: Theme 7 h and i Biology: - Humanities: Unit 1 Personal and Social Education: Section C
Key learning outcomes1. To understand key components of the greenhouse effect2. To understand the influence of humans on climate3. To understand predicted global climate changes

Page 7
The
Glo
bal
Cli
mat
e Pe
rsp
ecti
ve
Pupil NotesThe climate of the world is continually changing. In the past, this has been a result of natural factors such as volcanic eruptions, changes to ocean currents, planet Earth’s orbital changes and solar variation. More recently, scientific and media debate on the issue of global warming has focussed on the role of human activities, in particular the release of greenhouse gases such as carbon dioxide and methane. This section of the education pack will explore processes involved in climate change and consequences at a global level for temperature, precipitation and sea level.
Levels of carbon dioxide in the atmosphere significantly increased around 1900. This coincided with the Industrial Revolution. At this time, levels rose from about 250 parts per million to more than 375 parts per million.
Principle of the “Greenhouse Effect”The sun shines down on the surface of the earth. About half the heat naturally reflects back out into space. When greenhouse gases such as carbon dioxide and methane are released into our atmosphere, they trap heat and stop it reflecting back out into space. This causes additional warming of the earth surface, ocean and atmosphere… just like a greenhouse!
Figure 3. Global Carbon Dioxide Levels
Figure 2. The Greenhouse Effect
Source: www. global-greenhouse-warming.com
Did you know? Carbon dioxide is released into the atmosphere from volcanic eruptions and burning fossil fuels such as coal, oil and gas. However, most methane gas is produced by cattle!
Source: http://www.ipcc.ch/publications_and_data/ar4/syr/en/mains2-2.html
Did you know? The Greenhouse Effect keeps our planet warm enough for life.

Page 8
The
Glo
bal
Cli
mat
e Pe
rsp
ecti
veWhat Could Our Future Planet Look Like? Temperature and Precipitation
Assuming a medium level of greenhouse gas emissions, Northern latitudes are expected to warm most rapidly. By 2099, it is expected that the North Pole could have warmed by 7°C and areas around the equator could have warmed by around 3.5°C.
Assuming medium levels of greenhouse gas emissions, precipitation in the form of rain, snow, sleet and hail is expected to increase by up to 20% in many Northern areas during the months of December, January and February. However, significant decreases of up to 20% are expected for areas such as North East Africa and Central America.
Reductions in precipitation of up to 20% are expected during the months of June, July and August across much of Europe and Africa.
Figure 4. Predicted Temperature Changes in 2029 and 2099 (Compared with 1999 Figures)
Low level of greenhouse gas emissions
Medium level of greenhouse gas emissions
High level of greenhouse gas emissions
Source:http://www.ipcc.ch/publications_and_data/ar4/wg1/en/figure-spm-6.html
Did you know? It is very difficult to predict the amount of greenhouse gases we are likely to release in the future. The greater the amount released, the higher the predicted temperatures.
Figure 5. Precipitation Changes by 2099 (Compared with 1999 Figures)
December, January, February (UK Winter) June, July, August (UK Summer)
Source: http://www.ipcc.ch/publications_and_data/ar4/wg1/en/figure-spm-7.html

Page 9
The
Glo
bal
Cli
mat
e Pe
rsp
ecti
ve
Sea Level Change
Global average sea level rose by approximately 120m after the last Ice Age (21,000 years ago), but stabilized at its present position around 2000 years ago. Average global sea level is currently rising, although there are regional variations, depending on rates of ocean warming, quantity of melting ice and rates of land rise after the last glaciation, among other factors.
Water Expansion - Water expands as it warms up. This is thought by scientists to be the most dominant factor (>50%) in sea level change.
Melting Ice - The second most important factor is melting land ice. Water in glaciers and ice sheets has often been trapped as ice for tens of thousands of years. When land based glaciers and ice sheets melt, water flows into the sea and sea level rises.
Myth Alert!!!Icebergs and other types of sea ice do not cause sea level rise when they melt. Ice floats because it is less dense than water. When ice melts in a drink on a hot day, the glass does not overflow. In the same way, melting sea ice does not cause sea level rise.
Figure 6. Global Sea Level Rise by 2100 (Assuming Medium Emissions)
Figure 7. Global Sea Level Change Since 1955
Source: http://www.ipcc.ch/publications_and_data/ar4/wg1/en/faq-5-1-figure-1.html
Source: http://www.ipcc.ch/publications_and_data/ar4/wg1/en/figure-5-20.html
Did you know? Most of the world’s major cities lie less than 1m above sea level???
How Much? Global average sea levels have risen by 15cm in the last 100 years. Levels could increase by another 50cm in the next 100 years.

Page 10
The
Glo
bal
Cli
mat
e Pe
rsp
ecti
ve Activities1. (Geography Unit 1A, Theme 2) Run the simulation at http://www.ngfl-cymru.org.uk/eng/
cc-greenhouse-effect-mainpage/cc-greenhouse-effect.htm. What is the greenhouse effect and how have people’s actions affected this process?
2. (Geography Unit 1A, Theme 2; Humanities Unit 1) Watch this short video by David Attenborough about the science of climate change (3 minutes): http://www.youtube.com/watch?v=S9ob9WdbXx0. How conclusive is the range of evidence for human-induced climate change and what might cause uncertainty?
3. (Geography Unit 1A, Theme 2) Look at figures 4 and 5. What would the possible effects of climate change be in More Economically Developed Countries. Compare these with the impacts on Less Economically Developed Countries. Which is likely to be most severely affected and why?
4. (Geography Unit 1A, Theme 8) Look at figures 4 and 5. How do weather hazards across the world affect people, the economy and the environment?
5. (Geology, Theme 3.3) Using the internet, maps and aerial images, investigate the evidence for past and current fluctuations in continental ice and the effect on global sea levels.
6. (Geology, Theme 5.2) Investigate the media coverage of extreme weather events in the last 6 months and write a news article to summarise your findings.
7. (Chemistry Theme 7, Humanities Unit 1) Research some of the solutions to global warming such as carbon capture and trading. What are the advantages and disadvantages of each?
8. Poles Apart – an experiment to investigate how melting ice and snow affects sea levels available from: http://www.csiro.au/resources/poles-apart-activity.html Conduct the experiment and then answer the following questions:
a) What happens to the level of water in each glass?
b) Explain why there is a difference between the rise in water level in each glass?
c) How do the results relate to the impacts of melting icebergs in the Arctic?

Page 11
The
Glo
bal
Cli
mat
e Pe
rsp
ecti
veReferenceshttp://www.ipcc.ch- Graphics, maps and data sets to demonstrate principles of climate change, global temperature and sea level changes plus much more. http://www.ipcc.ch/publications_and_data/ar4/syr/en/mains3-3-2.html- Facts and figures on impacts of climate change for world regions http://www.ngfl-cymru.org.uk/eng/cc-greenhouse-effect-mainpage/cc-greenhouse-effect.htm- An interactive schematic model demonstrating the greenhouse effect http://www.csiro.au/resources/poles-apart-activity.html Poles apart – An experiment to investigate how melting ice and snow affects sea levels http://www.youtube.com/watch?v=S9ob9WdbXx0- A video clip of David Attenborough exploring the link between carbon dioxide and climate change http://sciencecases.lib.buffalo.edu/cs/collection/detail.asp?case_id=a479&id=479 - Role play game of an intern advising a US Senator

Page 12
The
Wel
sh C
lim
ate
Pers
pec
tive Theme 2:
The Welsh Climate Perspective
Teacher Notes:
This section relates to the following units and themes within the national curriculum:Geography: Unit 2A Themes 7 & 8 Geology: Unit 3.3 Physics: - Chemistry: Theme 7 h Biology: - Humanities: Unit 1 Personal and Social Education: Section C
Key learning outcomes1. To understand predicted Welsh temperature changes2. To understand predicted Welsh precipitation changes3. To understand predicted Welsh sea level changes
Page 13
The
Wel
sh C
lim
ate
Pers
pec
tive
Pupil Notes
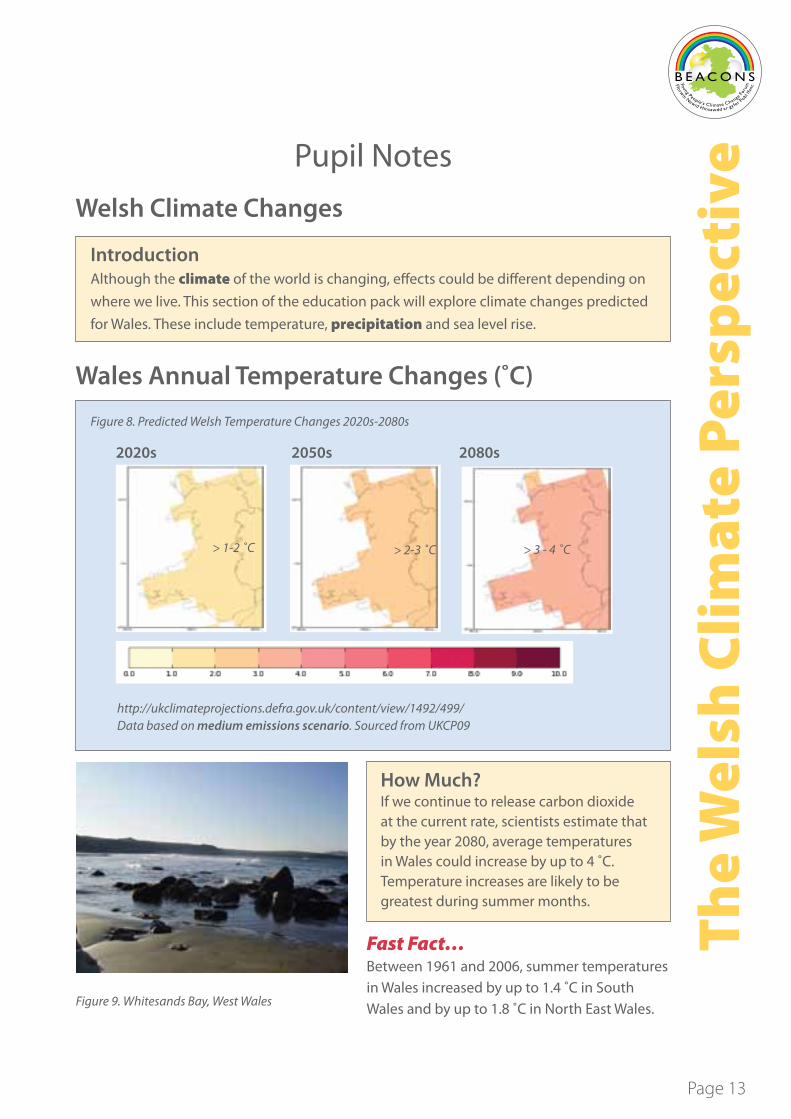
Introduction Although the climate of the world is changing, effects could be different depending on where we live. This section of the education pack will explore climate changes predicted for Wales. These include temperature, precipitation and sea level rise.
Wales Annual Temperature Changes (˚C)
Welsh Climate Changes
Figure 8. Predicted Welsh Temperature Changes 2020s-2080s
http://ukclimateprojections.defra.gov.uk/content/view/1492/499/ Data based on medium emissions scenario. Sourced from UKCP09
How Much? If we continue to release carbon dioxide at the current rate, scientists estimate that by the year 2080, average temperatures in Wales could increase by up to 4 ˚C. Temperature increases are likely to be greatest during summer months.
2020s 2050s 2080s
Fast Fact…Between 1961 and 2006, summer temperatures in Wales increased by up to 1.4 ˚C in South Wales and by up to 1.8 ˚C in North East Wales.Figure 9. Whitesands Bay, West Wales
> 1-2 ˚C > 2-3 ˚C > 3 - 4 ˚C

Page 14
The
Wel
sh C
lim
ate
Pers
pec
tive Precipitation (e.g. rain, snow, hail) patterns are expected to change across Wales. Scientists
estimate that precipitation could decrease in summer and increase in winter months.
Wales Precipitation Changes
Figure 10. Predicted Welsh Summer % Precipitation Changes
Figure 11. Predicted Welsh Winter % Precipitation Changes
Summer Precipitation % Change
Winter Precipitation % Change
How Much? By the 2080s summer rainfall may have reduced by up to 30% in some parts of Central and South Wales and up to 40% in some parts of West Wales.
By the 2080s winter rainfall may have increased by up to 30% in South and West Wales, particularly along the coast.
2020s 2050s 2080s
2020s 2050s 2080s
Sour
ce: h
ttp:
//uk
clim
atep
roje
ctio
ns.d
efra
.gov
.uk/
cont
ent/
view
/149
5/49
9/
Dat
a ba
sed
on m
ediu
m e
mis
sion
s sce
nario
Sour
ce: h
ttp:
//uk
clim
atep
roje
ctio
ns.d
efra
.gov
.uk/
cont
ent/
view
/149
8/49
9/#5
0
Dat
a ba
sed
on m
ediu
m e
mis
sion
s sce
nario
<0%-20% < 10-30% <10-40%
>0-10% >0-20% >0-30%
Page 15
The
Wel
sh C
lim
ate
Pers
pec
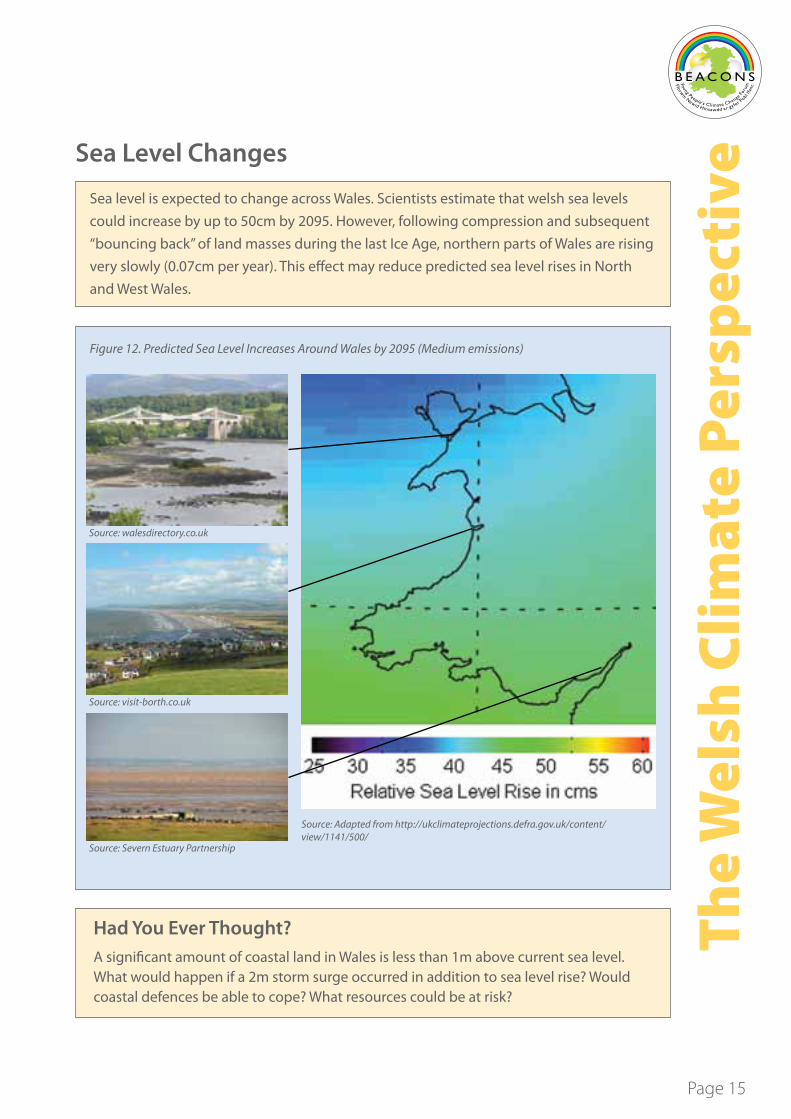
tiveSea level is expected to change across Wales. Scientists estimate that welsh sea levels
could increase by up to 50cm by 2095. However, following compression and subsequent “bouncing back” of land masses during the last Ice Age, northern parts of Wales are rising very slowly (0.07cm per year). This effect may reduce predicted sea level rises in North and West Wales.
Sea Level Changes
Figure 12. Predicted Sea Level Increases Around Wales by 2095 (Medium emissions)
Had You Ever Thought? A significant amount of coastal land in Wales is less than 1m above current sea level. What would happen if a 2m storm surge occurred in addition to sea level rise? Would coastal defences be able to cope? What resources could be at risk?
Source: Adapted from http://ukclimateprojections.defra.gov.uk/content/view/1141/500/
Source: walesdirectory.co.uk
Source: visit-borth.co.uk
Source: Severn Estuary Partnership

Page 16
The
Wel
sh C
lim
ate
Pers
pec
tive Activities
BBC Wales 21 February 2011 New Colwyn Bay Sea Defences to Protect 200 HomesContractors are due to start this week on the first phase of £5m plans to improve Colwyn Bay’s coastal defences and promenade facilities.
The initial phase is designed to protect more than 200 properties, the A55 and railway line opposite the northern entrance to Eirias Park.
“Without this work the railway line, railway station and the A55 are particularly at risk given their location running parallel to the waterfront for a significant distance,” said Councillor Mike Priestley, cabinet member for Conwy Council’s environment committee.
Source: http://www.bbc.co.uk/news/uk-wales-north-west-wales-12523484
1. Run the interactive Towyn activity at http://www.ngfl-cymru.org.uk/cc-how-might-i-be-affected/cc-coastal-flooding/cc-storms/cc-towyn.htm . Write a short story about what it would have been like to be caught up in the Towyn flooding. You could write it from the point of view of an older person stuck in their home or of a rescue worker.
2. (Geology 3.3) Visit a local stretch of coast and record evidence of previous raised sea levels using diagrams, photographs or maps.
3. (Geography 3.1) Check flood risks for your local area at: http://maps.environment-agency.gov.uk/wiyby/wiybyController?x=531500.0&y=181500.0&topic=floodmap&ep=map&scale=3&location=London,%20City%20of%20London&lang=_e&layerGroups=default&textonly=off. Now look at flood risk in Colwyn Bay without sea defences. Why are sea levels there changing and how might these changes affect people, the economy and the environment in the future?
4. (PSE Section C) Give your opinion on the importance of adapting to climate change in Wales and explore reasons why teenagers might think they do not need to adapt yet?
5. (PSE Section C and Humanities Unit 1) Watch http://www.bbc.co.uk/wales/ps/stories/164561.shtml Discuss ways in which young people can influence policy decisions about climate change in Wales.
Colwyn Bay, North Wales

Page 17
The
Wel
sh C
lim
ate
Pers
pec
tiveReferences
http://wales.gov.uk/docs/desh/publications/101006ccstratyoungpeoplesumen.pdf - Welsh Assembly Government Wales Strategy for Climate Change- Young People’s Version http://wales.gov.uk/walescarbonfootprint/home/youngpeople/?lang=en – Welsh Assembly Government website that helps communities reduce their carbon footprint and be more sustainable http://maps.environmentagency.gov.uk/wiyby/wiybyController?x=531500.0&y=181500.0&topic=floodmap&ep=map&scale=3&location=London,%20City%20of%20London&lang=_e&layerGroups=default&textonly=off -Environment Agency website that shows maps of flood risk with and without defences across the UK http://www.bbc.co.uk/wales/ps/stories/164561.shtml -Video clip about a youth group peacefully campaigning against a Merthyr Tydfil open-cast coal pit http://www.climate-wales.org.uk/documents/WhatdoesClimateChangemean forWales.pdf -Maps of projected climate figures for Wales http://www.ukcip.org.uk/ -UK Climate Impacts Programme- helps organisations and individuals adapt to climate change http://www.ngfl-cymru.org.uk/cc-how-might-i-be-affected/cc-coastal-flooding/cc-storms/cc-towyn.htm - Interactive example of an extreme flooding event.

Page 18
Foo
d s
up
ply
& n
atu
ral r
eso
urc
es Theme 3: Food Supply and
Natural Resources
Teacher Notes:
This section relates to the following units and themes within the national curriculum:Geography: Unit 1a Theme 2 and Theme 8 Geology: - Physics: - Chemistry: - Biology: Unit 1 Section a Humanities: Unit 1 outcome 3 Personal and Social Education: Section C
Key learning outcomes1. To understand how water supply could be affected by temperature, rainfall and
sea level change2. To understand how agriculture could be affected by temperature, rainfall and sea
level change3. To understand that biological systems are inter-related

Page 19
Foo
d s
up
ply
& n
atu
ral r
eso
urc
es
IntroductionFood supply and natural resources are likely to be affected by changes in temperature, rainfall and sea level. Availability of water, farming productivity and biodiversity are particularly susceptible.
Climate Risk Factor- TemperatureGlobal: Temperature changes are most significant for regions such as Northern Canada and Northern Russia (increases up to 7.5°C by 2099). Consequences for biodiversity are particularly significant.
Wales: Warmer summers (up to 4°C increase in summer by 2080) and milder winters may mean that ecosystems become unbalanced, some crops will no longer grow and livestock may require additional shelter from heat. Higher temperatures could also cause a reduction in water quality and encourage the growth of toxic algal blooms.
Climate Risk Factor- RainfallGlobal: Areas such as North Africa and Southern Europe may experience reductions of up to 20% in summer rainfall. This could impact on availability of drinking water, food supplies and suitability of the environment to support ecosystems.
Wales: Welsh summers may be drier (up to 40% by 2080) and winters wetter (up to 30% in West Wales by 2080). This could lead to more frequent summer droughts, with knock-on effects for natural resources.
Increased winter rainfall (up to 30% by 2080) could lead to increased flooding and waterlogging. Coastal locations along South and West Wales are most likely to be affected, although some areas along the North East coast are also at risk.
Climate Risk Factor- Sea LevelGlobal: Average global sea level changes of up to 50cm by 2100 have been predicted. Low lying countries such as the Netherlands, atolls and small islands are particularly at risk of submergence. In addition, natural biological habitats may experience “coastal squeeze” as they become trapped by man-made features such as roads or sea-walls and a rising sea level.
Wales: Welsh sea levels could increase by 50cm by 2095. Increases are expected to be slightly higher around South Wales and could lead to loss of agricultural land and contamination of freshwater lagoons by seawater.
Teachers Background Information About Food Supply and Natural Resources

Page 20
Foo
d s
up
ply
& n
atu
ral r
eso
urc
es Pupil Notes
Water availability across the world is likely to change as a result of decreased rainfall and increased temperatures. Many areas, such as Europe, Central and South America, parts of Africa and Australia could see a reduction of up to 20% in their water supply by 2060.
Other areas, such as North West Canada, East Africa, India and East China are predicted to have an increase of up to 20% in water supply by 2060. This could occur during intense downpours, increasing possibilities of flooding.
Water Supply
Figure 13. Change in Water Availability in 2060
Source: http://www.ciwem.org/policy-and-international/international/global-water-security.aspx (high emissions)
Adaptation Options • Develop drought-tolerant crops• Desalinate- remove salt from seawater • Irrigate• Increase water storage capacity • Recycle water • Use water meters and pricing for
domestic supply• Improve public understanding about
the importance of conserving water.
? Wales
Risk Factors• Reduced rainfall for human consumption• Increased temperatures lead to increase
evaporation of freshwater.
What Does This Mean for Wales?Scientists suggest that Welsh summers could be drier and winters wetter. Reduction in summer rainfall could lead to drought. By 2080, there could be a 40% reduction in summer rainfall in some parts of West Wales. These areas are predominantly agricultural areas, therefore require consistent supplies of water.
By 2080, increased winter rainfall of up to 30% could lead to increased run-off and waterlogging. Coastal locations along coastal South and West Wales are most likely to be affected, although some areas along the North East coast of Wales are also at risk.
Figure 14. Reservoir owned by Welsh Water Dŵr Cymru, Elan Valley, Mid Wales.
Source: Author

Page 21
Foo
d s
up
ply
& n
atu
ral r
eso
urc
esFarming productivity could decline across much of the world, as a result of reduced rainfall, increased temperatures and increased sea level. Water plays an important role in photosynthesis and helps to transport minerals around plant structures. It is also vital to support livestock. Reduced rainfall and increased temperatures are likely to impact directly on productivity, quality and suitability of crops and livestock.
Rising sea levels could result in large areas of agricultural land becoming submerged or contaminated by seawater. Impacts could be particularly severe for developing countries that rely heavily on farming as a source of income. For example, India, South Africa and Central USA could see a 50% reduction in agricultural productivity.
Farming
Figure 15. Projected changes to agricultural productivity by 2080
Adaptation Options • Grow crops suited to the new warmer climate• Grow crops more tolerant to salt• Alternate between livestock and arable farming • Invest in farm buildings to shelter livestock• Invest in irrigation systems• Grow hedges and dig ditches to prevent water runoff.
? Wales
What Does This Mean for Wales?Wales could benefit from an increase in agricultural productivity. Farmers may also be able to grow crops previously only viable in warmer regions (Eg. grapes and lemons). Growing seasons are likely to lengthen.
Don’t Forget the Fish!!!Some fish have moved northwards over the past 30 years by between 50 and 400km, with coldwater species such as monkfish and snake blenny moving the furthest.
Source: 2010-2011 MCCIP Annual Report Card
What are the advantages and
disadvantages of these?
Source:http://reliefweb.int/sites/reliefweb.int/files/resources/CB3BDC9ECC47A12DC12574DB006547D5-unep_AGR_wrl081007.pdf
Risk Factors • Increased temperatures • Reduced rainfall in some places• Inland flooding in some places• Coastal submergence • Saltwater intrusion.
Did You Know???The Welsh growing season has lengthened by about 1 month since 1990.

Page 22
Foo
d s
up
ply
& n
atu
ral r
eso
urc
es Biological diversity is likely to be affected by changing temperature, precipitation and sea level conditions. Biological ecosystems are delicately balanced systems and are particularly susceptible to damage from climate changes. Biodiversity is important because species depend on each other for survival. They act as food sources, as predators and as pollinators, among other roles. A diverse ecosystem is more likely to be robust and able to recover from a variety of disasters. A broad genetic structure also increases survival rates for individual species.
Biological Diversity
Figure 16. Projected impacts of climate change. Source: (Stern Review)
http://webarchive.nationalarchives.gov.uk/+/http://www.hm-treasury.gov.uk/d/Executive_Summary.pdf
Adaptation Options • Protect species and habitats from human activities and alien intrusion• Identify and monitor sensitive sites• Create biodiversity networks• Raise awareness of the importance of protecting biodiversity.
Scientists suggest that damage to coral reefs occurs after temperature increases of 0.5 °C and numbers of species facing extinction increases significantly after a 2°C increase in temperature.
Risk Factors • Higher temperatures may be
unsuitable for some species, but offer opportunities for alien species
• Increasing sea temperatures could lead to coral bleaching
• Increased rainfall and sea level could damage or destroy habitats
• Salt water intrusion may be unsuitable for some species.
Figure 17. Change in Plant Species Richness 1990-2007.
Source:http://archive.defra.gov.uk/evidence/statistics/environment/wildlife/download/pdf/biyp2010.pdf
Conclusion: Biodiversity in Great Britain has decreased across woodland, grassland and hedgerows, but improved on farmed arable land since 1990. This could be a result of active management by farmers.
1990 Level
% C
hang
e Sp
ecie
s Ri
chne
ss

Page 23
Foo
d s
up
ply
& n
atu
ral r
eso
urc
esActivities1. (Biology 1, Section a) With reference to figure 13, what is the effect of lack of water on
plant growth?
2. (Geography past paper question) Look at figure 15. Outline the factors that influence the sustainability of food supplies in Wales in the next 30 years. Assess their relative importance.
3. (Humanities Unit 1, outcome 3) Watch the video on http://www.youtube.com/watch?v=lhZlSsj_ge4 How should people and society respond to climate change when considering food supply?
4. Go to http://www.yourclimateyourlife.org.uk/9_buying_thought.html. How far did the Mackerel travel to your dinner plate? Produce a map using the link to help you calculate the distance travelled.
5. Go to web page http://www.climate-wales.org.uk/documents/carbon_footprints_final_bilingual.pdf How could agricultural practices in Wales be adapted to minimise greenhouse gas emissions?
6. What water saving devices could you use in your home? With this in mind, design a poster for young people.
7. Look at figure 15 (Agricultural Productivity). Discuss why Welsh agricultural productivity levels might increase.
8. Look at the poster on http://www.postersaigua.cat/en/doc/poster2_2.pdf. How much water a day do you think you use? Draw a bar chart of how much water you use during drinking, washing and flushing activities each day.
9. Go to web page http://frontpage.woodland-trust.org.uk/garden/ Look at the “Timings” section. Write a newspaper article that summarises how climate change is affecting the life cycles of oak, winter moth caterpillar and the great tit.
10. As sea levels rise, coastal habitats such as the one at Penclawdd near near Swansea become “squeezed” between coastal defences and rising sea levels. What could be done to protect such natural habitats?

Page 24
Foo
d s
up
ply
& n
atu
ral r
eso
urc
es Referenceshttp://www.farmingfutures.org.uk/sites/default/files/casestudy/pdf/general_adaptations.pdf - poster with options for agricultural adaptation ideas
http://www.woodlands-junior.kent.sch.uk/customs/questions/farming.html - a good introduction to geographical distribution of UK farming
http://www.defra.gov.uk/food-farm/crops/ - UK Department for Environment, Food and Rural Affairs- good overview of UK farming statistics
http://news.bbc.co.uk/1/hi/wales/8621228.stm -BBC news article about exotic welsh crops
http://www.countrysidesurvey.org.uk/outputs/wales-results-2007- Countryside Survey data results for 2007
http://www.youtube.com/watch?v=lhZlSsj_ge4 – YouTube video about a farmer in south-west England who is adapting his practices to a changing climate
http://www.strategies.org/docs/stickysituation_may02.pdf - teacher’s resource on climate change impacts to biodiversity and forestry from the Institute for Global Environmental Strategies
http://www.yourclimateyourlife.org.uk/9_buying_thought.html - Interactive food miles activity following the journey of food produce
http://www.climate-wales.org.uk/documents/carbon_footprints_final_bilingual.pdf - Farm carbon information resource from Farming Connect
http://www.postersaigua.cat/en/doc/poster2_2.pdf - Information poster on the uses of water
http://frontpage.woodland-trust.org.uk/garden/ - Interactive resource investigating climate change impacts to local UK wildlife
M.B. Charlton, A. Bailey and N. Arnell (2010) Water for Agriculture - Implications for Future Policy and Practice. Walker Institute for Climate System Research. Published by the Royal Agriculture Society for England.

Page 25
Sett
lem
entTheme 4:
Settlement
Teacher Notes:
This section relates to the following units and themes within the national curriculum:Geography: Unit 2a Theme 7, Unit 2a Theme 8 Geology: Unit 5.2 Physics:- Chemistry: Theme 7 Biology: - Humanities: Unit 1 outcome 3 Personal and Social Education: Section C
Key learning outcomes1. To understand how buildings could be affected by changing temperature, rainfall
and sea levels2. To understand how buildings could be protected against climate changes3. To understand how towns could be protected against climate changes

Page 26
Sett
lem
ent
IntroductionSettlements are likely to be affected by changes in temperature, rainfall and sea level. Existing and future buildings and towns may be very different to those we see today.
Climate Risk Factor- TemperatureGlobal: Temperature increases are most significant for regions such as North Russia and North Canada. Such regions could see temperature increases of up to 7.5°C by 2099, leading to melting ice-sheets and permafrost. This may allow previously uninhabitable regions to be populated.
Wales: Warmer summers (up to 4°C in summer by 2080) across most of Wales may mean that buildings could need to provide additional protection from the heat. High temperatures could make living conditions uncomfortable or dangerous, particularly for the elderly population and people with breathing conditions. Milder winters may mean that less heating is required for Welsh homes.
Climate Risk Factor- RainfallGlobal: Increased winter rainfall across areas such as Northern Europe and North East USA could lead to more frequent and more intense flooding events. Impacts could be more severe in urban areas, where the potential for natural absorption and runoff is limited by impervious concrete surfaces.
Wales: Welsh summers could be drier (up to 40% by 2080) and winters wetter (up to 30% by 2080). Ageing urban drainage systems could be under significant pressure during winter months, particularly in South and West Wales. This could lead to loss of life and damage to property.
Climate Risk Factor- Sea LevelGlobal: Global average sea level changes of up to 50cm by 2100 have been predicted. Most of the word’s major cities lie less than 1m above current sea level. Of particular concern is the scenario where storm surges occur in addition to sea level rise. If this happens, it is unlikely that existing sea defences would be able to protect urban areas.
Wales: Welsh sea levels could increase 50cm by 2095. Increases are expected to be greater around population centres of South Wales. Increased coastal erosion could also present problems for some coastal communities
Teacher Background Information About Settlement and Climate Change

Page 27
Sett
lem
entPupil Notes
Existing buildings may not be adequately designed or constructed to cope with increases in temperature, rainfall or sea level rise. Such buildings may require “retro-fitting”. Buildings constructed in the future may automatically include these features (see figure 18).
Existing and Future Buildings
Figure 18. Adapted house
Source: author
Adaptation Options • Install air conditioning equipment
and air vents to reduce air temperatures
• Plant trees around buildings to provide natural shade and absorb rainfall runoff
• Install rainwater collection systems to gather water and ensure outdoor gardens and surfaces are permeable
• Install flood barriers around houses to prevent flood waters entering
• Raise plug sockets and fit anti-backflow valves to domestic appliances
• Raise buildings up on stilts to avoid rising sea level
• Relocate.
Risk Factors• Increasing summer temperatures, humidity, and
heat wave frequency could increase heat stress and the need to cool buildings
• Drying soils can lead to subsidence of buildings• Flood waters can come from increased rainfall or
from sea level rise (or both).
Figure 20. A house built on stilts to protect from flood and tide damage, Florida.
Source: http://www.picturesfrom.com/fort-myers-beach/
Figure 19. An eco-house in St Davids, West Wales.
Source: author
Did You Know???During the period 1987-1997, the warmest decade on record, subsidence in the low-lying, peaty areas of South-East England cost the insurance industry over £4.5 billion.

Page 28
Sett
lem
ent
Existing towns and cities may not be adequately designed or constructed to cope with increases in temperature, rainfall or sea level rise. Such settlements may require wide-scale protection. Flooding events caused by storm surges, rising sea levels and heavy rainfall events are of particular concern for planners.
Towns and Cities
Figure 21. Welsh populations at risk of flooding
Did you know? Shoreline management plans have been created for the entire Welsh coast. These show which areas might be flooded or eroded and set out options for managing potential risks (see “where we want the coastline” above).
Source: http://www.environment-agency.gov.uk/static/documents/Research/ENV0005_Flooding_in_Wales_ENGLISH_AW_LR%281%29.pdf
Figure 22. An overflow channel close to the limit in Cardiff, January 2011.
Source: Author
Figure 23. Planners inspecting a new sea defence at Weston Super Mare Source: Author
Risk Factors• Tarmac and concrete
obstructs natural drainage and increases flood risk
• Urban drainage systems can be easily overwhelmed by heavy intense downpours
• Flooding could cause extensive damage to property, communication and transport links
• Flooding and heavy rainfall can also lead to landslides and erosion (eg. South Wales valleys).
Adaptation Options a) Where we want the coastline:
• Hold the coastal line using soft or hard coastal defences
• Advance the coastal line• Retreat from the coast• Do nothing
b) General planning activities: • Change land uses• Update drainage systems• Encourage more green spaces• Enforce climate-proof
development through the planning system.

Page 29
Sett
lem
entActivities
“Exercise Watermark” was a flood response exercise held in March 2011 to test abilities of emergency services to respond to flooding from the sea, river, surface waters and reservoirs. Images released as part of the exercise show how the Millennium Stadium, Bute Park and Ninian Park in Cardiff would all be submerged if not for flood protection. Environment and Sustainability Minister, Jane Davidson said: “Climate change means we will all have to adapt to the increased risk of flooding. No-one can stop flooding, but we can prepare”.
Cardiff is protected by sea walls and a barrage system that involves pumping water away from high risk flooding areas. These are “hard engineering options” and the decision has been made to “hold the line” along the coast at it’s present position. Along stretches of coast such as the Laugharne Estuary, “soft engineering schemes” such as use of saltmarshes are used to protect settlements.
Questions: 1. (Geography) Look through https://rctmoodle.org/pontyhigh/mod/resource/
view.php?id=681 . What are the advantages and disadvantages of hard and soft engineering strategies used to manage our coasts?
2. (Geography) When might it be appropriate to “retreat the line” or “do nothing” instead of “hold the line” when managing coasts?
3. (Geography) What is the most sustainable way to manage the Cardiff coastline in the face of rising sea levels?
4. Should it be up to us to re-locate villages for future generations or leave them to resolve their own problems?
5. Whose responsibility should it be to pay for house adaptation measures in 2060 - individuals, communities or the government?
Figure 24. An image of areas in Cardiff at risk of flooding if no defences were in place
Source: http://www.bbc.co.uk/news/uk-wales-12668954

Page 30
Sett
lem
ent Activities continued
6. Read the factsheet about storm surges at http://www.mfe.govt.nz/publications/climate/preparing-for-coastal-change-guide-for-local-govt/html/page7.html.
• How would your nearest stretch of coast be affected by a 2m storm surge? Which areas might be flooded?
• Which resources should be protected as priorities? Consider food supply and natural resources, settlement, critical infrastructure, industry, health and wellbeing of populations.
Referenceshttp://www.guardian.co.uk/environment/2010/mar/25/uk-homes-climate-change-adaptation -Guardian News article about the need to adapt homes to cope with climate change
http://www.metoffice.gov.uk/education/ - Meteorological Office teacher support and student activities, including case studies
http://www.climatechangewales.org.uk/public/college/key_stage_4/flood_maps/ - Climate Change Wales interactive flood map
http://www.ngfl-cymru.org.uk/cc-how-might-i-be-affected/cc-coastal-flooding/cc-storms/cc-towyn.htm National Grid for Learning Wales interactive case study of 1990 Towyn flooding
http://www.bbc.co.uk/news/uk-wales-12668954 - Operation Watermark BBC news article with image of Cardiff under water
http://www.strategies.org/discoverearth/lesson2.html - CO2 & You- DLESE (USA) resource with classroom activities to calculate household CO2 consumption
http://www.snh.org.uk/publications/on-line/advisorynotes/73/73.html - Scottish Natural Heritage’s overview of hard and soft sea defence options
https://rctmoodle.org/pontyhigh/mod/resource/view.php?id=681 – Coastal management presentation and information resource
http://www.mfe.govt.nz/publications/climate/preparing-for-coastal-change-guide-for-local-govt/html/page7.html - Fact sheet on storm surges from the New Zealand Ministry for the Environment.
Page 31
Cri
tica
l In
fras
tru
ctu
reTheme 5: Critical Infrastructure
Teacher Notes:
This section relates to the following units and themes within the national curriculum:Geography: Unit 1A Theme 2, Unit B Theme 12 Geology: Unit 5.2 Physics: Unit 2, Themes a and b Chemistry: Theme 7 Biology:- Humanities: Unit 1 Personal and Social Education: Section C
Key learning outcomes1. To understand how critical infrastructure could be affected by changing
temperature, rainfall and sea levels2. To understand how critical infrastructure could be protected against climate
changes3. To understand how critical infrastructure could adapt to take advantage of climate
changes

Page 32
Cri
tica
l In
fras
tru
ctu
re
IntroductionCritical infrastructure includes communication systems, transport systems and energy supply systems. These are vital to maintain our core functions and lifestyles. Existing and future critical infrastructure may need to be protected and adapted to cope with changing temperatures, rainfall and sea levels.
Climate Risk Factor- TemperatureGlobal: Increased summer temperatures around North Canada and North Russia of up to 7.5°C by 2099 may mean that oil and gas pipelines resting on permafrost may require stabilisation. In areas where summers are already hot, for example, around the equator, additional heat may warp or damage communication and transport systems.
Wales: Warmer summers (up to 4°C by 2080) across most of Wales may mean that existing communication, transport and energy supply infrastructure may need to offer additional protection from the heat. Alternatively, new systems could be designed to adapt to it.
Climate Risk Factor- RainfallGlobal: Increased winter rainfall and reduced summer rainfall may lead to flooding or subsidence of land. Critical infrastructure may need to be reinforced or relocated.
Wales: Winters could be significantly wetter. By 2080, increased winter rainfall of up to 30% could lead to more frequent and more severe flooding of roads, rail tracks, electricity sub-stations and telecommunications infrastructure. Eg. the main London to Swansea train track is currently occasionally flooded at St Fagans, near Cardiff. Such events could become more frequent.
Climate Risk Factor- Sea LevelGlobal: Average sea level changes of 50cm by 2100 could lead to submergence of coastal critical infrastructure. Loss of such important assets could seriously impact the sustainability of coastal communities. This is particularly the case for rural areas, where fewer alternatives are available.
Wales: Sea level increases of up to 50cm by 2095 could cause submergence of roads, railway lines, energy infrastructure and communication lines. Increased coastal erosion and rising water tables could also present problems, particularly for buried cables. These issues are of particular concern for planners along coastal South Wales, where population concentrations and supporting critical infrastructure co-incide with projections of greatest sea level increases.
Teacher Background Information About Critical Infrastructure and Climate Change
Page 33
Cri
tica
l In
fras
tru
ctu
rePupil Notes
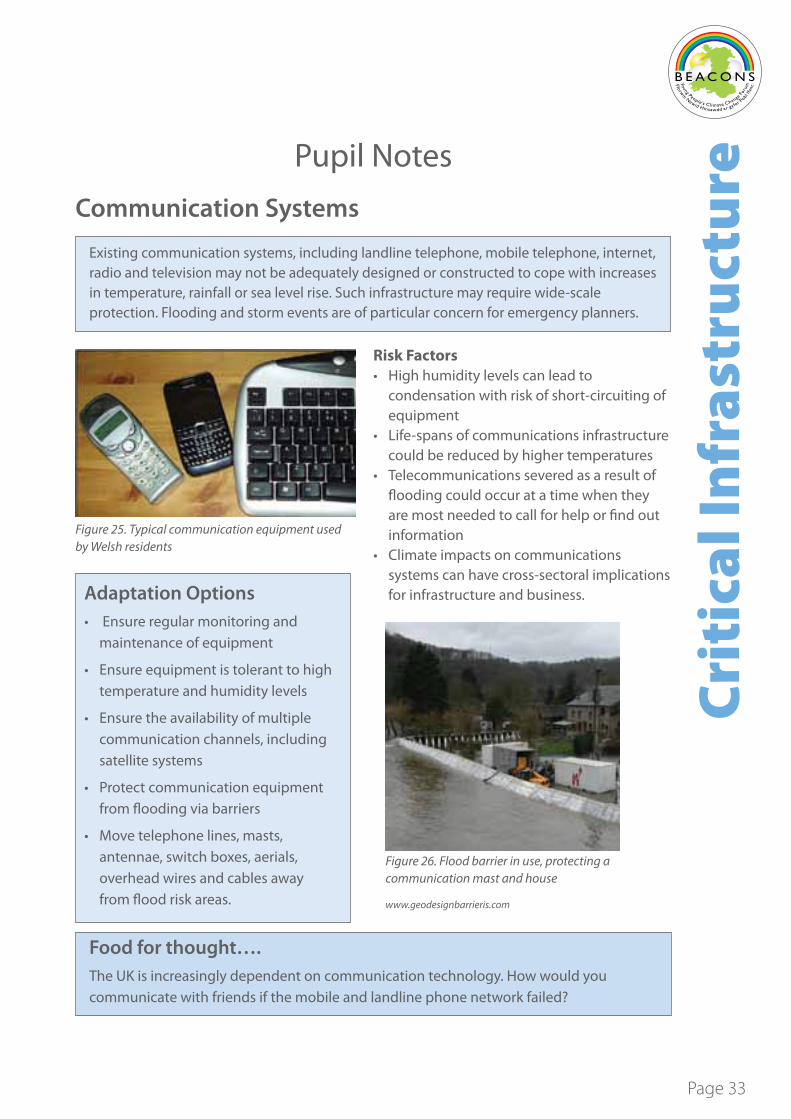
Existing communication systems, including landline telephone, mobile telephone, internet, radio and television may not be adequately designed or constructed to cope with increases in temperature, rainfall or sea level rise. Such infrastructure may require wide-scale protection. Flooding and storm events are of particular concern for emergency planners.
Communication Systems
Figure 25. Typical communication equipment used by Welsh residents
Adaptation Options • Ensure regular monitoring and
maintenance of equipment
• Ensure equipment is tolerant to high temperature and humidity levels
• Ensure the availability of multiple communication channels, including satellite systems
• Protect communication equipment from flooding via barriers
• Move telephone lines, masts, antennae, switch boxes, aerials, overhead wires and cables away from flood risk areas.
Food for thought…. The UK is increasingly dependent on communication technology. How would you communicate with friends if the mobile and landline phone network failed?
Risk Factors• High humidity levels can lead to
condensation with risk of short-circuiting of equipment
• Life-spans of communications infrastructure could be reduced by higher temperatures
• Telecommunications severed as a result of flooding could occur at a time when they are most needed to call for help or find out information
• Climate impacts on communications systems can have cross-sectoral implications for infrastructure and business.
Figure 26. Flood barrier in use, protecting a communication mast and house
www.geodesignbarrieris.com

Page 34
Cri
tica
l In
fras
tru
ctu
re Transport systems, including road, rail, air and port facilities may be at particular risk of damage from increases in temperature, rainfall and sea level. Such infrastructure may require wide-scale protection. Issues are particularly significant at coastal locations where flooding from heavy rainfall and sea level rise may co-incide.
Transport Systems
Figure 27. UK Port Imports and Exports
Eg. UK Summer 2007 floods During the summer of 2007, severe flooding left 10,000 people trapped on the M5 motorway and thousands of passengers were stranded at UK railway stations.
Source: http://www.dft.gov.uk/pgr/statistics/datatablespublications/maritime/ports/latest/portstatsbull.pdf
Figure 28. Conwy Valley Coastal Route
Risk Factors• Flooding and debris from
increased rainfall and sea level rise could prevent roads, railways, airports and ports from being used
• Softening and melting of roads due to higher temperatures
• Overheating of rail tracks • Overheating of underground
trains e.g. the London underground
• Subsidence of roads and bridges caused by changes in soil moisture
• Scouring of bridges from intense rainfall events
• Increased rainfall and storm events could lead to an increase in sedimentation in and around port structures, causing a problem for shipping movement.
Adaptation Options • Ensure transport infrastructure
is tolerant to high temperature levels
• Ensure availability of multiple transportation routes eg. Roads, bridges
• Protect transportation infrastructure from flooding via barriers and drainage systems
• Move/ build transportation infrastructure away from flood risk areas
• Dredge port approaches• Explore alternative transport
technology.
What are the advantages and disadvantages of these?

Page 35
Cri
tica
l In
fras
tru
ctu
reEnergy supply systems, including gas, electricity, nuclear and renewables may be at particular risk of damage from increases in temperature, rainfall and sea level. Such infrastructure may require wide-scale protection. Issues are particularly significant at coastal locations where flooding from heavy rainfall and rising sea levels may co-incide.
Energy Supply Systems
Figure 29. Infrastructure Assets in Flood Risk Areas in Wales
Had You Ever Thought??? Temperature increases could reduce demand for energy in winter (for heating) but increase demand in summer (for cooling).
Risk Factors• Sea level rise could flood coastal power
plants and supporting infrastructure• Gas pipelines could experience damage
due to ground erosion• Reduced summer rainfall could lessen
the performance of hydro-electric plants• Decreased rainfall could cause
difficulties for cooling nuclear power stations
• Intense rainfall events could cause increased surface run-off.
Adaptation Options • Ensure availability of multiple energy
sources• Protect energy supply infrastructure
from flooding via barriers and drainage systems
• Move energy supply infrastructure away from flood risk areas
• Encourage sensible use of energy • Explore alternative energy technology
(eg. Domestic wind and solar)
Page 36
Cri
tica
l In
fras
tru
ctu
re Activities1. (Humanities Unit 1) List as many communication systems as you can think of. How
many of these rely on electricity? What measures would emergency services need to put in place to ensure they could communicate with one another during power cuts?
2. (PSE Section C) Name three types of eco-friendly transport, and discuss the advantages and disadvantages of each for getting to school.
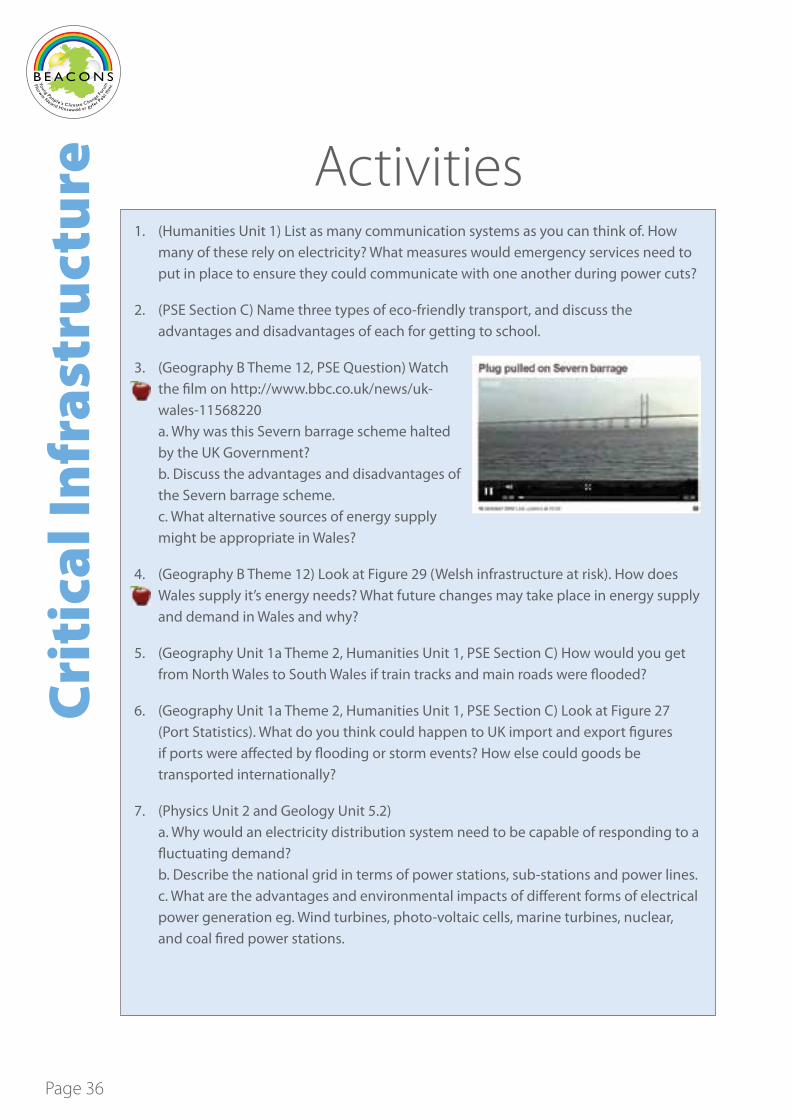
3. (Geography B Theme 12, PSE Question) Watch the film on http://www.bbc.co.uk/news/uk-wales-11568220 a. Why was this Severn barrage scheme halted by the UK Government? b. Discuss the advantages and disadvantages of the Severn barrage scheme. c. What alternative sources of energy supply might be appropriate in Wales?
4. (Geography B Theme 12) Look at Figure 29 (Welsh infrastructure at risk). How does Wales supply it’s energy needs? What future changes may take place in energy supply and demand in Wales and why?
5. (Geography Unit 1a Theme 2, Humanities Unit 1, PSE Section C) How would you get from North Wales to South Wales if train tracks and main roads were flooded?
6. (Geography Unit 1a Theme 2, Humanities Unit 1, PSE Section C) Look at Figure 27 (Port Statistics). What do you think could happen to UK import and export figures if ports were affected by flooding or storm events? How else could goods be transported internationally?
7. (Physics Unit 2 and Geology Unit 5.2) a. Why would an electricity distribution system need to be capable of responding to a fluctuating demand? b. Describe the national grid in terms of power stations, sub-stations and power lines. c. What are the advantages and environmental impacts of different forms of electrical power generation eg. Wind turbines, photo-voltaic cells, marine turbines, nuclear, and coal fired power stations.
Page 37
Cri
tica
l In
fras
tru
ctu
reReferenceshttp://www.bbc.co.uk/news/uk-wales-11568220 - BBC News story about a Severn Barrage Scheme http://www.gwynedd.gov.uk/upload/public/attachments/1046/ea__north_west_wales_cfmp_3.pdf - Environment Agency North West Wales Catchment Flood Management Plan. Map 1 shows roads and rail lines potentially at risk of flooding http://grdp.org/static/documents/Research/ENV0005_Flooding_in_Wales_ENGLISH_AW_LR%281%29.pdf – Table on Page 17 Shows Critical Infrastructure at Risk of Flooding in Wales.
Page 38
Ind
ust
ry Theme 6: Industry
Teacher Notes:
This section relates to the following units and themes within the national curriculum:Geography: Unit 1A Theme 2, Unit 2 Theme 8, Unit 1A Theme 2 Humanities: Unit 1 Geology: Unit 5.2 Physics:- Chemistry: Theme 7 h & i Biology:- Humanities: Humanities Unit 1 learning outcome 3 Personal and Social Education: Section C
Key learning outcomes1. To understand how industry could be affected by changing temperature, rainfall
and sea levels2. To understand how industry could be protected against climate changes3. To understand how industry could adapt and take advantage of climate changes
Page 39
Ind
ust
ry
IntroductionIndustry refers refers to the manufacture or processing of an economic good or provision of a service. Industries could be directly or indirectly affected by changes in temperature, rainfall and sea level. There may be opportunities to take advantage of a changing climate in some regions, particularly in relation to agricultural production, tourism increases, low carbon technologies and energy supply technologies.
Climate Risk Factor- TemperatureGlobal: Increased summer temperatures of up to 7.5°C may mean that new shipping routes open up in the Arctic and Antarctic as ice-sheets melt. Increased temperatures elsewhere may mean that industrial production, manufacturing and services may need to adapt. High temperatures particularly affect the operation of computing equipment, transport networks and energy supply (see critical infrastructure section).
Wales: As well as being indirectly affected by the advantages and disadvantages of global industrial changes, Wales tourism and agricultural sectors may benefit from warmer summers (up to 4°C in summer by 2080) and milder winters.
Climate Risk Factor- RainfallGlobal: Winters could be significantly wetter, particularly around North Russia and North East Canada. This could lead to increased flooding of natural resources, settlements and critical infrastructure. These are required to provide materials, labour, energy and transport for industrial processes. Summer droughts are also a possibility, with resulting lack of water for human consumption and industrial processes.
Wales: Winters could be significantly wetter (up to 30% by 2080). As well as being indirectly affected by global industrial activities, Wales could also directly experience flooding of natural resources, settlements and critical infrastructure. More extensive and more severe summer droughts are also a possibility.
Climate Risk Factor- Sea LevelGlobal: Average sea level changes of 50cm by 2100 could lead to increased flooding of coastal natural resources, settlements and critical infrastructure. Coastal erosion could also damage or remove defence structures.
Wales: The 50cm projected Welsh sea level increase by 2095 could adversely affect nuclear power sites and port operations based around the coast. If a storm surge occurred, in addition to sea level rise, this could overtop existing defence structures and cause widespread flooding.
Teacher Background Information About Industry and Climate Change
Page 40
Ind
ust
ry Pupil Notes
Climate change vulnerabilities of UK manufacturing and processing industries are mainly related to short term extreme weather events such as flooding, rather than gradual climate change. However, many UK based companies rely on global manufacturing, processing and transport operations to provide core products. Increased severity of tropical cyclones and water shortages in East and South-East Asia are likely to have significant impacts on UK business.
Manufacturing and Processing
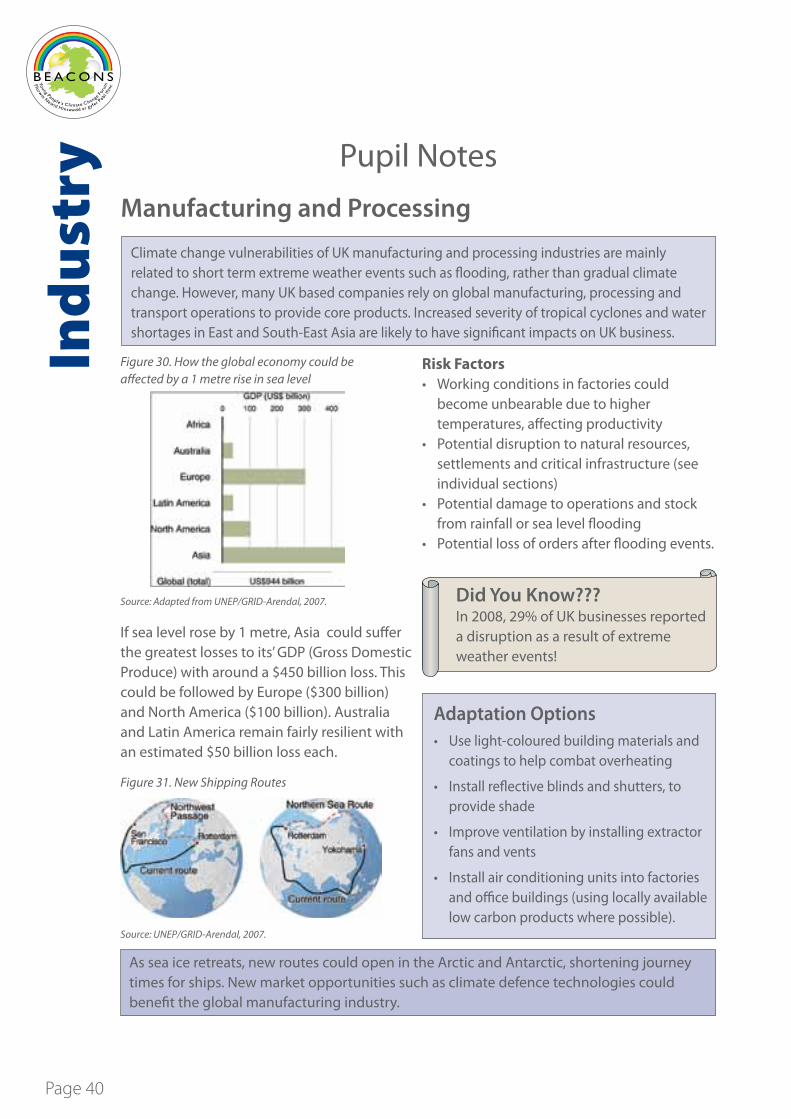
Figure 30. How the global economy could be affected by a 1 metre rise in sea level
Figure 31. New Shipping Routes
Adaptation Options • Use light-coloured building materials and
coatings to help combat overheating
• Install reflective blinds and shutters, to provide shade
• Improve ventilation by installing extractor fans and vents
• Install air conditioning units into factories and office buildings (using locally available low carbon products where possible).
As sea ice retreats, new routes could open in the Arctic and Antarctic, shortening journey times for ships. New market opportunities such as climate defence technologies could benefit the global manufacturing industry.
Risk Factors• Working conditions in factories could
become unbearable due to higher temperatures, affecting productivity
• Potential disruption to natural resources, settlements and critical infrastructure (see individual sections)
• Potential damage to operations and stock from rainfall or sea level flooding
• Potential loss of orders after flooding events.
Source: UNEP/GRID-Arendal, 2007.
Source: Adapted from UNEP/GRID-Arendal, 2007.
If sea level rose by 1 metre, Asia could suffer the greatest losses to its’ GDP (Gross Domestic Produce) with around a $450 billion loss. This could be followed by Europe ($300 billion) and North America ($100 billion). Australia and Latin America remain fairly resilient with an estimated $50 billion loss each.
Did You Know???In 2008, 29% of UK businesses reported a disruption as a result of extreme weather events!

Page 41
Ind
ust
ryThe service industry includes insurance, finance, administration, retail, leisure, tourism, the voluntary sector and the public sector. Disruptions to transportation and communication systems, potential flooding, warmer working conditions and potential increases on some services may mean that activities involving the service industry may need to adapt.
Service Industry
Figure 33. Summer beach visitors, Whitmore Bay, Barry Island.
Drier, warmer summers are expected to boost the Welsh tourism industry, especially along the coast, leading to potential increases in amenities, employment and revenue.
Risk Factors• Increased tourism could overwhelm small
coastal communities and put pressure on local amenities such as transport systems, sewage systems, water supplies and energy supplies
• Existing tourist destinations may face coastal erosion, flooding and squeeze from sea level rise
• Insurance companies may receive more climate related claims
• Emergency services may have to respond to more climate related calls
• Shops and offices may flood.
What are the advantages and disadvantages of these?
Figure 32. Flooded fish bar in Appleby
Source: http://www.brianthomas.net/pix/floods/index2.html
Source: Author
Adaptation Options • Improve capacities in coastal towns
that are likely to have more tourists e.g. build more energy and waste infrastructure (although in Wales, these might be conservation areas, therefore there might be very strict development laws
• Build roads and motorways away from flood risk areas
• Improve coastal defences at existing tourist hotspots
• Flood-proof individual offices, shops and restaurants.

Page 42
Ind
ust
ry Activities1. (Chemistry Theme 7) Play the CEO2 business
game on http://knowledge.allianz.com/ceo2/en_ext.html. Can you successfully run a chemical manufacturing company sustainably? Compare your results with the rest of the class.
2. (Geography Unit 1A, Theme 2, Humanities Unit 1) How can technology be used and people’s lifestyles changed to reduce the impacts of climate change in your local area?
3. (Geography Theme 8, Unit 2.2) With reference to Figure 30, compare the impact of a 1m rise in sea level between Asia and Europe’s GDP.
4. (Geography Theme 8, Unit 2.2) How do weather hazards affect the economy in Wales? Create a poster that shows some of the main risks to the manufacturing industry and describe potential adaptation options.
5. (Humanities Unit 1 Learning Outcome 3) Look at Figure 31 of new shipping routes. Why have these shipping routes emerged? What does this mean for global trade? Who is likely to benefit as a result?
6. (Humanities Unit 1 Learning Outcome 3/ PSE Section C) What political solutions may there be to the problem of climate change? Are they equitable?
7. If you were thinking about developing a new business in Wales that takes advantage of a changing climate, what sort of business would you develop and why? Create a powerpoint to pitch your ideas to potential funders.
8. Pemrokeshire National Park is protected for its natural beauty. If tourism activity in Wales increases, what can Park managers do to ensure tourists and developers do not damage the natural environment? Refer to http://www.pembrokeshirecoast.org.uk for ideas.

Page 43
Ind
ust
ryReferenceshttp://www.nationaltrust.org.uk/main/w-shifting_shores.pdf- report on tourism effects of climate change in the UK http://www.guardian.co.uk/environment/2007/feb/13/frontpagenews.ruralaffairs - news article on impacts of climate change on industry http://www.admiralgroup.co.uk/pdf/annualreports/2008/Business-review.pdf review of impacts of climate change on insurance companies and on business http://knowledge.allianz.com/ceo2/en_ext.html - CEO2 Climate Business interactive game http://www.pembrokeshirecoast.org.uk – Pembrokeshire Coast National Park website http://maps.grida.no/go/graphic/population-area-and-economy-affected-by-a-1-m-sea-level-rise-global-and-regional-estimates-based-on- - Web resource looking at economic affects of a 1 meter rise in sea level, from UNEP Grid, Environmental Knowledge for Change http://maps.grida.no/go/graphic/northern-sea-route-and-the-northwest-passage-compared-with-currently-used-shipping-routes - Potential new shipping routes that could open up as a result of melting sea ice, from UNEP Grid, Environmental Knowledge for Change.
Page 44
Hea
lth
& W
ellb
ein
g Theme 7: Health and Wellbeing
Teacher Notes:
This section relates to the following units and themes within the national curriculum:Geography: Unit 1A Theme 2, Unit B Theme 8 Geology: Unit 5.2 Physics:- Chemistry: Theme 7 Biology: Unit 1a Humanities: Unit 1 Learning outcome 3 Personal and Social Education: Section C
Key learning outcomes1. To understand how human health and wellbeing may be affected by temperature,
rainfall and sea level change2. To understand how human health and wellbeing support systems may adapt to
changing temperature, rainfall and sea levels.

Page 45
Hea
lth
& W
ellb
ein
g
IntroductionHuman health and wellbeing are likely to be affected by changes in temperature, rainfall and sea level. Risks as well as opportunities are likely to emerge.
Climate Risk Factor- TemperatureGlobal: Temperature increases of up to 5.5°C by 2099 in regions such as Australia and South East Asia are likely to increase occurrences of heatstroke, respiratory conditions, skin cancer and food poisoning.
Wales: Warmer Welsh summers (up to 4°C in summer by 2080) and milder winters may mean that global factors as outlined above may play a part in Welsh life, either directly or indirectly.
Climate Risk Factor- RainfallGlobal: Changes in rainfall patterns could lead to severe droughts in some areas (Eg. parts of Australia) and severe floods in others (Eg. North Europe). Droughts lead to long term famine, population displacement and conflicts for dwindling resources, while floods cause damage and destruction to essential resources and infrastructure. Diseases such as malaria, carried by mosquitos, thrive in hot areas with large areas of stagnant water. Levels of diseases such as malaria could increase in North Europe.
Wales: Wetter Welsh winters (up to 30% along South, West and North Wales coasts by 2080) could cause flooding. Flooding potentially affects environmental, economic, physical, social and psychological activities.
Drier Welsh summers (up to 40% in some parts of West Wales by 2080) could lead to moderate drought conditions. However, such conditions could also present opportunities for increased outdoor recreation and leisure activities, which in turn improve levels of health and wellbeing, are also a possibility.
Climate Risk Factor- Sea LevelGlobal: Average sea level changes of up to 50cm by 2100 could flood or erode coastal areas, possibly with the loss of large scale settlements, industries and sources of food. Such developments have implications for long term health and wellbeing of affected populations.
Wales: Sea level changes of up to 50cm by 2095 could cause flooding and erosion of coastal areas, particularly around South Wales. Displacement of settlements and potential loss of local facilities such as paths and slipways that are used for recreation could impact on health and wellbeing.
Teacher Background Information About Implications of Climate Change for Health and Wellbeing

Page 46
Hea
lth
& W
ellb
ein
g Pupil Notes
IntroductionHuman health and wellbeing are likely to be affected by changes in temperature, rainfall and sea level. Wellbeing includes physical, psychological, social, economic and environmental health. Risks as well as opportunities are likely to emerge.
Health and Wellbeing
Figure 34. Global Estimated Climate Change Deaths in the Year 2000
Risk Factors• Heat waves could increase the
number of hot-weather related deaths especially amongst the elderly, the young, and the sick
• Prolonged periods of sunshine could result in an increase of skin cancers and eye problems
• Bacteria may no longer die-off seasonally during prolonged cold spells, therefore diseases may spread more widely
• High levels of ground-level ozone could increase occurrence of respiratory diseases eg. Asthma
• Increased instances of food poisoning
• Loss of coastal recreation facilities
• Flooding could lead to death or physical/ mental injury
• Water supply and sanitation systems could become contaminated during flooding events
• Malnutrition and displacement of populations as a result of failed crops or flooding
• Conflicts over depleting resources could increase
• Loss of income from climate change events could lead to wide scale social and economic decline.
Source: http://maps.grida.no/go/graphic/estimated-deaths-attributable-to-climate-change-2000
These figures are likely to increase with rising global temperatures.
? Wales

Page 47
Hea
lth
& W
ellb
ein
g
• Educate the public about safe sun enjoyment and avoidance of food poisoning
• Reduce amount of ozone-producing traffic, especially in urban areas
• Train health professionals to recognise and treat new and unusual diseases
• Protect homes and businesses from heat by ventilation, shade and air conditioning systems
Adaptation Options
• Protect homes, businesses and facilities from flooding using hard and soft defences
• Monitor and improve drainage and sanitation systems
• Encourage diversification of economic investment
• Prepare emergency plans to cope with heatwaves, floods and mass migrations.
Figure 35. How climate change affects human health
What are the advantages and disadvantages of these?
Source: World Health Organisation
Figure 36. Thailand- some of the most severe climate risks will affect children
Source: World Health Organisation http://whqlibdoc.who.int/publications/2009/9789241598880_eng.pdf
The UK Health Protection Agency developed guidelines on the health risks posed by flooding in 2000.
This includes advice, such as:
- How to protect against infections
- Returning to a flooded home
- Food preparation and storage
- Drinking water.

Page 48
Hea
lth
& W
ellb
ein
g Activities1. (Geography Unit 1A Theme 2) In 2009, the Welsh Assembly Government developed
a, “Heatwave Plan for Wales”. This outlines measures organisations such as those responsible for health and social care can take to prepare and respond to high temperatures. http://www.conwy.gov.uk/upload/public/attachments/345/Wales_Heatwave_Plan.pdf Create an advertising poster that summarises how your local health and social care services could respond to protect the local elderly population during a heatwave.
2. (Geography Unit 1A Theme 2) Think about what recreational activities you undertake at weekends/after school/during the holidays. a. How could the changing climate affect these? b. Will the effects be positive or negative? c. Are there any new activities you might be able to undertake?
3. (Biology Unit 1a) Look at web page http://www.bbc.co.uk/learningzone/clips/the-climactic-and-human-factors-which-affect-the-distribution-of-malaria/6990.html (distribution of malaria with climate change). On a map, identify local areas of still water that might be suitable breeding grounds for mosquitos. How could local authorities minimise the spread of malaria?
4. (Humanities Unit 1 Learning outcome 3) Design a media campaign that explains to teenagers how to be safe in the sun.
5. (Humanities Unit 1 Learning outcome 3) Write a poem about food poisoning and how to avoid it.
6. (PSE Section C) Play the game SmogCity 2 on http://www.smogcity2.com/index.html . Which factor produces the greatest amount of smog? How could smog levels be reduced in your local town/ city?
7. Whose responsibility is it to influence an individual’s behavior- their own or the government? Discuss.
8. How can you take part in government decision-making, both locally and nationally? Discuss.

Page 49
Hea
lth
& W
ellb
ein
gReferenceshttp://www.adaptationatlas.org/index.cfm -Global Adaptation Atlas is an online, dynamic mapping tool that illustrates human impacts of climate change and adaptation activities across the themes of food, water, land, health and livelihood
http://www.who.int/globalchange/climate/en/ - World Health Organisation report on human health impacts of climate change
http://www.bbc.co.uk/climate/impact/human_health.shtml -News article on impacts of climate change on health
http://www.sunsmart.org.uk/schools/schoolsresources/index.htm#Worksheets Cancer Research UK Sun Smart campaign and worksheets
http://wales.gov.uk/topics/health/protection/environmental/publications/climate/?lang=en – Welsh Assembly Government’s report on health effects of climate change
http://www.heatedconfusion.html- explains how we sense heat
http://www.guardian.co.uk/environment/2007/feb/13/frontpagenews.ruralaffairs- Newspaper article to explain how erosion and rising seas threaten Wales’s most beautiful beaches
http://www.environment-agency.gov.uk/homeandleisure/floods/38329.aspx Instructions on how to make a community flood plan
http://serc.carleton.edu/introgeo/roleplaying/examples/globwarm.html -The World Watcher Project - The Global Warming project. - Students act as advisors to heads of state of several nations.
http://www.conwy.gov.uk/upload/public/attachments/345/Wales_Heatwave_Plan.pdf - The governments Heatwave Plan for Wales
http://www.bbc.co.uk/learningzone/clips/the-climactic-and-human-factors-which-affect-the-distribution-of-malaria/6990.html - BBC Learning Zone Class Clips video investigating climatic and human factors affecting the distribution of malaria.
http://www.smogcity2.com/index.html - Interactive air pollution simulator
http://maps.grida.no/go/graphic/estimated-deaths-attributable-to-climate-change-2000 - UNEP Grid map showing estimated deaths due to climate change for 2000
http://www.who.int/globalchange/publications/climchange.pdf - World Health Organization report on climate change and human health
http://whqlibdoc.who.int/publications/2009/9789241598880_eng.pdf - World Health Organisation publication looking at protecting us from the risks posed by climate change.

Page 50
List of figures and sourcesFigure Page
Figure 1. Human dimensions of climate change 5 Author
Figure 2. The Greenhouse Effect 7 http://www.global-greenhouse-warming.com/what-is-the-greenhouse-effect.html
Figure 3. Global Carbon Dioxide Levels 7 http://www.ipcc.ch/publications_and_data/ar4/syr/en/mains2-2.html
Figure 4. Predicted Temperature Changes in 2029 and 2099 (Compared with 1999 Figures) 8 http://www.ipcc.ch/publications_and_data/ar4/wg1/en/figure-spm-6.html
Figure 5. Precipitation Changes by 2099 (Compared with 1999 Figures) 8 http://www.ipcc.ch/publications_and_data/ar4/wg1/en/figure-spm-7.html
Figure 6. Predicted Global Sea Level Rise 9 http://www.ipcc.ch/publications_and_data/ar4/wg1/en/faq-5-1-figure-1.html
Figure 7. Global Sea Level Change Since 1955 9 http://www.ipcc.ch/publications_and_data/ar4/wg1/en/figure-5-20.html
Figure 8. Welsh Temperature Changes 2020s-2080s 13 http://ukclimateprojections.defra.gov.uk/content/view/1492/499/
Figure 9. Whitesands Bay, West Wales 13 Author
Figure 10. Welsh Summer % Precipitation Changes 14 http://ukclimateprojections.defra.gov.uk/content/view/1495/499/
Figure 11. Welsh Winter % Precipitation Changes 14 http://ukclimateprojections.defra.gov.uk/content/view/1498/499/#50
Figure 12. Sea Level Increases Around Wales by 2095 (Medium emissions) 15 http://ukclimateprojections.defra.gov.uk/content/view/1141/500/
Figure 13. Change in Water Availability in 2060 20 http://www.ciwem.org/policy-and-international/international/global-water-security.aspx
Figure 14. Reservoir owned by Welsh Water, Elan Valley, Mid Wales 20 Author
Figure 15. Projected changes to agricultural productivity by 2080 21 http://reliefweb.int/sites/reliefweb.int/files/resources/ CB3BDC9ECC47A12DC12574DB006547D5-unep_AGR_wrl081007.pdf
Figure 16. Projected impacts of climate change 22 (Stern Review) http://webarchive.nationalarchives.gov.uk/+/http://www.hm-treasury.gov.uk/ d/Executive_Summary.pdf
Figure 17. Change in Plant Species Richness 1990-2007 22 http://archive.defra.gov.uk/evidence/statistics/environment/wildlife/download/pdf/biyp2010.pdf
Figure 18. Adapted house 27 Author
Figure 19. An eco-house in St Davids, West Wales 27 Author
Figure 20. A house built on stilts to protect from flood and tide damage, Florida 27 http://www.picturesfrom.com/fort-myers-beach/

Page 51
List of figures and sourcesFigure Page
Figure 21. Welsh populations at risk of flooding 28 http://www.environment-agency.gov.uk/static/documents/Research/ ENV0005_Flooding_in_Wales_ENGLISH_AW_LR%281%29.pdf
Figure 22. An overflow channel close to the limit in Cardiff, January 2011 28 Author
Figure 23. Planners inspecting a new sea defence at Weston Super Mare 28 Author
Figure 24. An image of areas in Cardiff at risk of flooding if no defences were in place 29 http://www.bbc.co.uk/news/uk-wales-12668954
Figure 25. Typical communication equipment used by Welsh households 33 Author
Figure 26. Flood Barrier in use, protecting a communication mast and house. 33 www.geodesignbarrieris.com
Figure 27. UK Port Imports and Exports 34 http://www.dft.gov.uk/pgr/statistics/datatablespublications/maritime/ports/latest/portstatsbull.pdf
Figure 28. Conwy Valley Coastal Route 34 http://www.travelwales.org/server.php?show= ConWebDoc.13665
Figure 29. Infrastructure Assets in Flood Risk Areas in Wales 35 http://www.environment-agency.gov.uk/static/documents/Research/ ENV0005_Flooding_in_Wales_ENGLISH_AW_LR%281%29.pdf
Figure 30. How the global economy could be affected by a 1 metre rise in sea level 40 http://maps.grida.no/go/graphic/population-area-and-economy-affected-by-a-1-m-sea-level-rise- global-and-regional-estimates-based-on-
Figure 31. New Shipping Routes 40 http://maps.grida.no/go/graphic/northern-sea-route-and-the-northwest-passage- compared-with-currently-used-shipping-routes
Figure 32. Flooded fish bar in Appleby 41 http://www.brianthomas.net/pix/floods/index2.html
Figure 33. Summer beach visitors, Whitmore Bay, Barry Island. 41 Author
Figure 34. Global Estimated Climate Change Deaths in the Year 2000 46 http://maps.grida.no/go/graphic/estimated-deaths-attributable-to-climate-change-2000
Figure 35. How climate change affects human health 47 http://www.who.int/globalchange/climate/en/
Figure 36. Thailand- some of the most severe climate risks will affect children 47 http://whqlibdoc.who.int/publications/2009/9789241598880_eng.pdf

Page 52
GlossaryAdaptation: taking appropriate action to prevent or minimise risks posed by a changing climate, for example by changing the crops we grow or protecting where we live and work against flooding
Biodiversity: the variety of life on earth. It includes the diversity of individual species, the genetic diversity within species and the range of ecosystems that support them
Climate change: any change in climate over time, whether due to natural variability or as a result of human activity
Climate: the long term (over decades), wide-scale conditions that result in “typical weather” for a region eg. UK weather
Critical Infrastructure: assets that are essential for the functioning of society/economy such as communication, transport and energy supply systems
Emissions scenarios: descriptions of the levels of future greenhouse gases released via human activities. May be low, medium or high
Hard engineering options: the use of man made structures such as a seawalls to protect onshore coastal resources from the sea
Health: a state of physical, mental and social well-being
Medium emissions scenario: climate change projections based on the existing release rate of greenhouse gases
Mitigation: the direct action taken to reduce the causes of climate change, such as reducing greenhouse gas emissions
Natural Resources: a material source supplied by nature that is of economic and/or social importance or wealth such as timber, freshwater, minerals and fish
Permeable: A material that allows water to flow through it
Photosynthesis: a process that converts carbon dioxide into organic compounds, using the energy from sunlight
Precipitation: rain, sleet, snow or hail
Risk Assessment: a review of possible risks to a particular area and weighing up these risks against the benefits to determine what level of risk is acceptable
Soft engineering options: man-made structures that work with natural processes to protect onshore coastal resources from the sea. Are generally considered more sustainable and less expensive than hard engineering options. They include beach recharge with sand, and the encouragement of saltmarsh growth
Settlement: a community of people within one usually densely populated area
Storm surge: a rise in water-level on an open coast as a result of the combined impact of wind on the water surface, atmospheric pressure reduction, decreasing water depth and horizontal boundaries of adjacent water
Weather: the short term, locally specific conditions that result in day-to-day weather for a small area eg. South-West Wales
Wellbeing: the state of feeling healthy and happy.