Adaptation to Sea LevelAdaptation to Sea Level Rise in … · 2013-12-03 · Adaptation to Sea...
47
Adaptation to Sea Level Adaptation to Sea Level Rise in Saco Bay: Building R ili Resiliency Peter Slovinsky, Marine Geologist Mi G l i lS D t t f Maine Geological Survey, Department of Conservation Project Funding from: Project Funding from: In partnership with:
Transcript of Adaptation to Sea LevelAdaptation to Sea Level Rise in … · 2013-12-03 · Adaptation to Sea...

Adaptation to Sea LevelAdaptation to Sea Level Rise in Saco Bay: Building
R iliResiliencyPeter Slovinsky, Marine Geologist
M i G l i l S D t t fMaine Geological Survey, Department of Conservation
Project Funding from:Project Funding from:In partnership with:

Coastal Resiliency Project
Outreach, Education, and Partnership Development
State Agencies – Regional Planning Commissions - Municipalities

Project Timeline – Year 3!2007 2008 D l i H d R ili T l f2007-2008 – Developing Hazard Resiliency Tools for Municipalities (Pilot)
• GIS data development to support effortsp pp• Initial outreach to Saco Bay communities • Educational workshops on hazard data
2008-2009 – Enhancing Hazard Resiliency in Maine’s Coastal Towns (Project)
C ti d d ti l k h• Continued educational workshops• Meetings with Town officials• Additional outreach (Kennebunk and York)( )
2009-2010 – Increasing Storm Hazard Resiliency in Selected Coastal Towns (Project)Coastal Towns (Project)
• Working on identification, adaptation, implementation• SLAWG

Education – GIS Data and Tools
• Determining initial perspectives
Ed ti E i ti H d i H d V l bilit• Education on Existing Hazards using Hazard Vulnerability Assessment Tools
• Identification of Existing and Potential Future Hazards
• Development of appropriate Adaptation Techniques forDevelopment of appropriate Adaptation Techniques for the built and natural environments
di tid l t i t• e.g., ordinances, tidal management improvements, capital improvements, etc.
FOCUS ON SEA LEVEL IMPACTS

Framing the Problem
By how much? What will the potential impacts be?
Sea Level is RISING
What can WE do?

Sea Level, Portland, Maine1912-2009
0.200
0.300
0.000
0.100
MSL
)
y = 0.0058x - 11.581R2 = 0.7358
-0.200
-0.100
evat
ion
(ft, M
-0 500
-0.400
-0.300El
1.79 mm per yr or 0.6 ft (7.2") per century
-0.600
-0.500
1910 1920 1930 1940 1950 1960 1970 1980 1990 2000 2010
Time (years)
P.A. Slovinsky, Maine Geological Survey, February 2, 2010
Portland Tide gauge = global ocean over last century 1.8 mm/yr (IPCC, 2007).In Maine, this is the fastest in past 3000 years
(y )

Documented Sea Level Rise
2.0 mm/yr(1929 2006)(1929-2006)
2.1 mm/yr(1947-2006)
1.8 mm/yr (1912-2009)
Data courtesy of NOAA CO-OPS
1.8 mm/yr (1926-2001)

Measured Sea Level Changes in the Northeast
Station Historic Rate (mm/yr)
R2 50 yrs (“) 100 yrs (“) Length of Record
Boston MA 2 7 0 8454 5 2 10 4 85 yearsBoston, MA. 2.7 0.8454 5.2 10.4 85 years
Seavey Island, ME 1.8 0.5879 3.5 7.1 58 years
Portland, ME 1.8 0.7364 3.6 7.2 94 years
Bar Harbor, ME 2.1 0.7145 4.1 8.3 58 years
Eastport, ME 2.0 0.7493 4.0 8.1 76 years
Saint John NB 2 9 0 7529 5 8 11 6 70 yearsSaint John, NB 2.9 0.7529 5.8 11.6 70 years
Yarmouth, NS 2.9 0.7268 5.7 11.5 37 years
Halifax, NS 3.2 0.9246 6.3 12.6 106 years
Based on measurements, about 7-8” (0.6-0.7 feet) of sea level rise has occurred along the Maine coast.

Satellite altimetry (1992-2010) = global sea level 3.2 + 0.4 mm/yrPortland during same time period = 1.9 mm/yr http://sealevel.colorado.edu/

IPCC 3rd Assessment (Tech. Summary of Working Group I Report, Fig. 24, p. 74., 2001 )

Hugo Ahlenius, United Nations Environment Programme, 2007http://maps.grida.no/go/graphic/projected-sea-level-rise-for-the-21st-century

Coastal Sand Dune Rules (Chapter 355 NRPA)
In the coastal sand dune system Maine is planning for 2 feet ofIn the coastal sand dune system, Maine is planning for 2 feet of sea level rise over the next 100 years, which is generally a “middle-of-the road” prediction for global sea level rise.

Coastal wetlands
“Coastal wetlands” means all tidal and subtidallands; all areas with vegetation present that ist l t f lt t d i il i lttolerant of salt water and occurs primarily in saltwater or estuarine habitat; and any swamp, marsh,bog beach flat or other contiguous lowland that isbog, beach, flat or other contiguous lowland that issubject to tidal action during the highest tide levelfor each year in which an activity is proposed asy y p pidentified in tide tables published by the NationalOcean Service. Coastal wetlands may includeportions of coastal sand dunes.

Using the Sea Level Rise Inundation Tool
Steps:
1)D t t f LIDAR i ti1)Demonstrate accuracy of LIDAR in representing ground conditions.
2)Demonstrate accuracy in simulating existing2)Demonstrate accuracy in simulating existing conditions using tidal elevations to define marsh habitats and inundation
3) Simulate potential impacts of sea level rise on:a) Existing infrastructureb) Marsh habitat
4) Identify at-risk areas5) Identify adaptation strategies5) Identify adaptation strategies

Saco Bay – Hazards and Habitats
Marsh HabitatsScarborough River, Scarborough

“Groundtruthing”
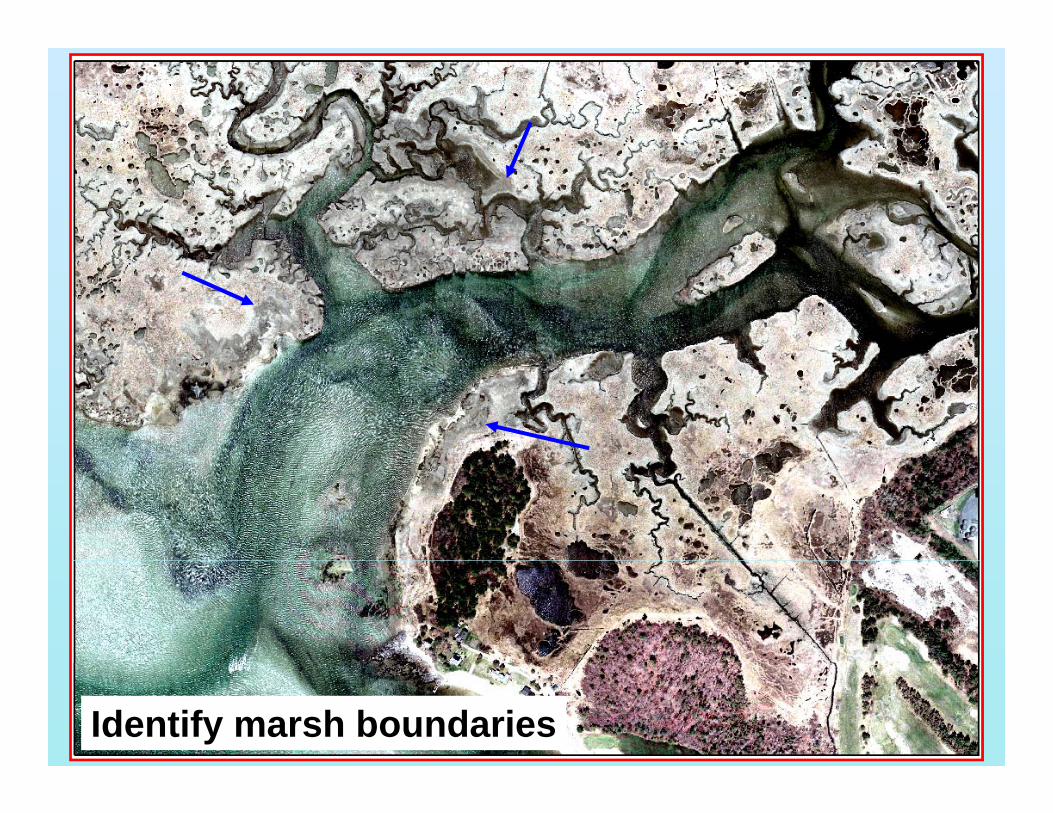
Identify marsh boundaries

Overlay LIDAR

Identify using tidal elevation rangesHigh Marsh = Abo e MHW and belo HATHigh Marsh = Above MHW and below HATLow Marsh = Above MLW and below MHWOpen Water = Below MLW

Use #1: Simulate Existing Conditions in Marshes


Use #2: Simulate Potential Future Marsh Conditions
Use #3: Identify low-lying uplands for marshtransgression

Simulation of Existing Conditions
Flooding and InundationOcean Park, Old Orchard Beach

Use #4: Simulate Existing Inundation
92.8 acres

Use #5: Simulate Inundation under Future Conditions
169.2 acres (83% increase)

Use #6: Examine Storm Impacts2007 Patriots’ Day Storm = HAT+2 ft
Indicator of Future Conditions!Indicator of Future Conditions!
0.5
1.0
Flood Depths (ft)HAT + 2 ft SL risedepth, ft
-1.0
-0.5
0.001002003004005006007008009001000
epth (ft)
Flood
-8 - -7
-7 - -6
-6 - -5
-5 - -4
-4 - -3 -3.0
-2.5
-2.0
-1.5
Floo
d de
d Depth (ft)
-3 - -2
-2 - -1
-1 - 0 -4.0
-3.5
DistanceDistance (m)

20072007 Patriots’ Day Storm
HAT+2 = Pats’ Day FloodingHAT+2 = Pats Day Flooding
Memorial Library
Temple St.

Memorial Library2-3 feet flooding2-3 feet flooding
T l StTemple St.2-3 feet flooding

Use #7: Simulate potential future storm impacts2007 Patriots’ Day Storm
Pl 2 f t f S l l Ri
20072007 Patriots’ Day Storm
HAT+2 = Pats’ Day FloodingPlus 2 feet of Sea level RiseHAT+2 = Pats Day Flooding
Memorial Library
Temple St.
Memorial Library
Temple St.
Flood Depths (ft)HAT + 2 ft SL risedepth, ft
-8 - -7
-7 - -6
-6 - -5
-5 - -4
-4 - -3
-3 - -2
-2 - -1
-1 - 0

Show Visualization Techniques (CanVis2.3)
Memorial Library

Visualization Techniques (CanVis2.3)
Temple Street

Simulation of Mapped Flood Conditions
Use #8: Simulate impacts to staticfloodplain

Existing A-zone (9 ft)

Future A-zone (11 ft)

RegionalRegionalAdaptation Techniques

W tl d R t ti
Adaptation TechniquesWetland RestorationOpen Space Designation/Acquisition“F t ” Fl d W tl d A“Future” Flood or Wetland Areas

Adaptation Techniques
Tidal Flow ControlNew locations?

E A R iEmergency Access ReroutingStormwater Improvements
April 16, 2007, approximately10:00 amImages courtesy of Bill Edwards, www.mainecoastimages.com and NOAA NWS

Adaptation Techniques
Elevation and sitingElevation and siting

Adaptation Techniques
Sea Level Rise as Future requirement?

Adaptation Techniques
Dune Restoration

Adaptation Techniques
Selective Structure Improvement

Adaptation Techniques
Utility Relocation

Sediment Management
• Within the CommunityCommunity
(intra)
• Within the Region (inter)

After 2004 2005 2009After 2004 Nourishment
2005-2009Survival

Regional interRegional, inter-community management ofmanagement of sediment can be undertakenundertaken.
Potential Uses:Potential Uses:• Beach Nourishment• Dune Restoration• Dune Restoration• Upland uses

Sea Level Adaptation Working Group (SLAWG)• Comment on regional federal/state beach nourishment/erosion control
• Identify infrastructure vulnerable to storms and sea level rise such as culverts, storm drains, bridges or tide gates;
• Use regional approaches to plan for improvements
• Recommend standardizing of floodplain management standards and building code interpretations across jurisdictions
• Recommend standardizing of ordinance review standards affecting the shorelands adjacent to Saco Bay;
St d di i / t l f t ti iti j i di ti f• Standardize review/controls for water activities across jurisdictions for structures/activities affected by sea level rise
P id bi di t i li ti f d l t• Provide non-binding comments on various applications for development review affecting Saco Bay
JT….tell us more about SLAWG!