
ACTUARIAL VALUATION REPORT - Shropshire … · he al t h w e al t h c areer actuarial valuation...
42
HEALTH WEALTH CAREER ACTUARIAL VALUATION REPORT SHROPSHIRE COUNTY PENSION FUND AS AT 31 MARCH 2016
-
Upload
dangnguyet -
Category
Documents
-
view
213 -
download
0
Transcript of ACTUARIAL VALUATION REPORT - Shropshire … · he al t h w e al t h c areer actuarial valuation...

H E A L T H W E A L T H C A R E E R
ACTUARIALVALUATION
REPORT
SHROPSHIRE COUNTYPENSION FUND
AS AT 31 MARCH 2016

A C T U A R I A L V A L U A T I O N A S A T 3 1 M A R C H 2 0 1 6S H R O P S H I R E C O U N T Y
P E N S I O N F U N D
M E R C E R i
CONTENTS
1. Introduction 1
2. Funding Strategy – Key Elements 2
3. Key results of the funding assessment 3· Solvency funding position 3· Primary contribution rate 4· Correcting the shortfall – secondary contribution rate 4
4. Experience since last valuation 5· Summary of key inter-valuation experience 5· Reasons for the change in funding position since the last actuarial valuation 6
5. Cashflows, risks and alternative funding positions 7· Benefit cashflows 7· Projected funding position at next actuarial valuation 8· Material risks faced by the Fund 8· Sensitivity of funding position to changes in key assumptions 8· Minimum risk funding position 9
APPENDICES
A. Assumptions 11· How the benefits are valued 11· Financial assumptions used to calculate the funding target 12· Demographic assumptions used 12· Assumptions used to calculate the primary contribution rate 16
B. Summary membership data 17C. Assets 18D. Scheme benefits 19E. Summary of income and expenditure 20F. Analysis of membership experience 21G. Rates and adjustments certificate issued in accordance with Regulation 62 22
· Primary contribution rate 22· Secondary contribution rate 22· Contribution amounts payable 22· Further adjustments 22· Regulation 62(8) 23
H. Schedule to the rates and adjustments certificate dated 31 March 2017 24I. Glossary 37

A C T U A R I A L V A L U A T I O N A S A T 3 1 M A R C H 2 0 1 6S H R O P S H I R E C O U N T Y
P E N S I O N F U N D
M E R C E R 1
1INTRODUCTION
This report is addressed to the Administering Authority of the Shropshire County Pension Fund(“the Administering Authority”) and is provided to meet the requirements of Regulation 62 of theLocal Government Scheme Regulations 2013 (as amended) (“the Regulations”). It describes thefactors considered by the Administering Authority when carrying out the actuarial valuation as at 31March 2016 and the decisions reached as a result.
The purpose of the actuarial valuation is for the Administering Authority to determine:
· The expected cost of providing the benefits built up by members at the valuation date (the“liabilities”), and compare this against the funds held by the Fund (the “assets”).
· The contributions needed to cover the cost of the benefits that active members will build up inthe future and other costs incurred in running the Fund (the ‘Primary Contribution Rate’).
· An appropriate plan for making up the shortfall if the Fund has less assets than liabilities. Thisplan will cover the amounts which will need to be paid (the ‘Secondary Contribution Rate’) andthe timeframe over which they will be paid (‘the Recovery Period’).
S I G N A T U R E
N A M E John Livesey Mark Wilson
Q U A L I F I C A T I O N Fellow of the Institute andFaculty of Actuaries
Fellow of the Institute andFaculty of Actuaries
D A T E 31 March 2017
This report uses various technical terms. These are explained in more detail in the explanatory boxes whichappear throughout this report, and in the Glossary at Appendix I.
This report has been prepared in accordance with the version of the Pensions Technical Actuarial Standard current atthe date this report is signed. It also complies with the relevant requirements of Technical Actuarial Standards R:Reporting Actuarial Information, D: Data and M: Modelling, where they apply to this report. These Standards are allissued by the Financial Reporting Council. The calculations referred to in the report use methods and assumptionsappropriate for reviewing the financial position of the Fund and determining a contribution rate for the future. Mercer doesnot accept liability to any third party in respect of this report; nor do we accept liability to the Administering Authority if theinformation provided in this report is used for any purpose other than that stated. The report may be disclosed tomembers and others who have a statutory right to see it. It may also be disclosed to any participating employer and, ifthe Administering Authority and Mercer consent, it may be disclosed to other third parties.

A C T U A R I A L V A L U A T I O N A S A T 3 1 M A R C H 2 0 1 6S H R O P S H I R E C O U N T Y
P E N S I O N F U N D
M E R C E R 2
2FUNDING STRATEGY – KEY ELEMENTS
Fundamental to the valuation results is the funding strategyadopted by the Fund. This funding strategy is set out in a specificdocument (the Funding Strategy Statement or FSS for short) whichis one of the Administering Authority’s key governance documentsfor the Fund. In essence, the FSS sets out an overview of theapproach to be used for the actuarial valuation. Amongst otherthings it outlines the assumptions, both economic anddemographic, to be used in calculating the value of the liabilitiesbuilt up and the contributions required to correct any fundingshortfall, and the contribution rate required to fund the benefits forfuture service. It also sets out the strategy for making good anyfunding shortfall, in particular how any shortfall is expected to befinanced in terms of the balance between future contributions andfuture investment returns, and the period over which any shortfall is expected to be recovered.
The principal elements of the funding strategy adopted for this actuarial valuation are as follows:
• Assumed rate of future CPI inflation – 2.2% p.a., based on the yields available on gilts andindex-linked gilts of appropriate duration less an adjustment of 1% p.a. to allow for thedifference between market-implied future RPI and estimated future CPI inflation
• Real investment returns over and above CPI for past service – 2.35% p.a., based on theanticipated real returns achievable on the Fund’s expected long-term investment strategy witha suitable margin for prudence.
• Real investment returns over and above CPI for future service – 2.75% p.a., based on theanticipated real returns achievable on future invested contributions.
• Future pay growth – 1% p.a. over the 4 years to April 2020, taking into account thegovernment’s policy on pay restraint in the public sector, and then 1.5% p.a. over and aboveCPI in the longer term.
• Baseline life expectancy based on a scheme-specific mortality study.
• Future mortality improvements based on the CMI 2015 model with a long-term improvementtrend of 1.5% p.a.
• An average recovery period for making good any shortfall of approximately 22 years. TheFSS sets out the circumstances in which this might vary from one employer to another.
The FSS is the AdministeringAuthority’s key governancedocument in relation to the
actuarial valuation. It sets outthe funding policies adopted, theactuarial assumptions used, and
the timescales over whichdeficits will be paid off.
Employers are consulted aboutthe FSS as part of the actuarial
valuation process.

A C T U A R I A L V A L U A T I O N A S A T 3 1 M A R C H 2 0 1 6S H R O P S H I R E C O U N T Y
P E N S I O N F U N D
M E R C E R 3
3KEY RESULTS OF THE FUNDINGASSESSMENT
SO L VENCY FUNDING PO SIT IONThe table below compares the assets and liabilities of the Fund at 31 March 2016. Figures are alsoshown for the last valuation as at 31 March 2013 for comparison.
The liability value at 31 March 2016 shown in the table above isknown as the Fund’s “solvency funding target”. The solvencyfunding target is calculated using assumptions that theAdministering Authority has determined are appropriate havingconsulted with the actuary, and are also set out in theAdministering Authority’s Funding Strategy Statement (FSS).
The chart shows that at 31 March 2016 there was a shortfall of£278m against the Fund’s solvency funding target. Analternative way of expressing the position is that the Fund’sassets were sufficient to cover 84% of its liabilities – thispercentage is known as the solvency funding level of the Fund.
At the previous valuation at 31 March 2013 the shortfall was£383m, equivalent to a solvency funding level of 76%. The keyreasons for the changes between the two valuations areconsidered in Section 4.
746 849
321385
551538
1,2351,494
76% 84%
0
250
500
750
1,000
1,250
1,500
1,750
2,000
Assets£1,235m
Liabilities£1,618m
Assets£1,494m
Liabilities£1,772m
£ m
Pensioners Deferreds Actives Assets
31 MARCH 2013 31 MARCH 2016Solvency funding level Solvency funding level
The LGPS Regulations require thecontributions to be set so as tosecure the Fund’s solvency andlong-term cost efficiency. In this
context solvency means being ableto meet the liabilities as and when
they arise, with long-term costefficiency meaning that contribution
levels should not be set so as togive rise to additional costs at a
later date. In practice, contributionlevels have been set so as to targeta solvency funding level of 100%,based on the funding parameters
outlined in Section 2 above.
A C T U A R I A L V A L U A T I O N A S A T 3 1 M A R C H 2 0 1 6S H R O P S H I R E C O U N T Y
P E N S I O N F U N D
M E R C E R 4
Further details of the way in which the solvency funding target has been calculated are set out inAppendix A.
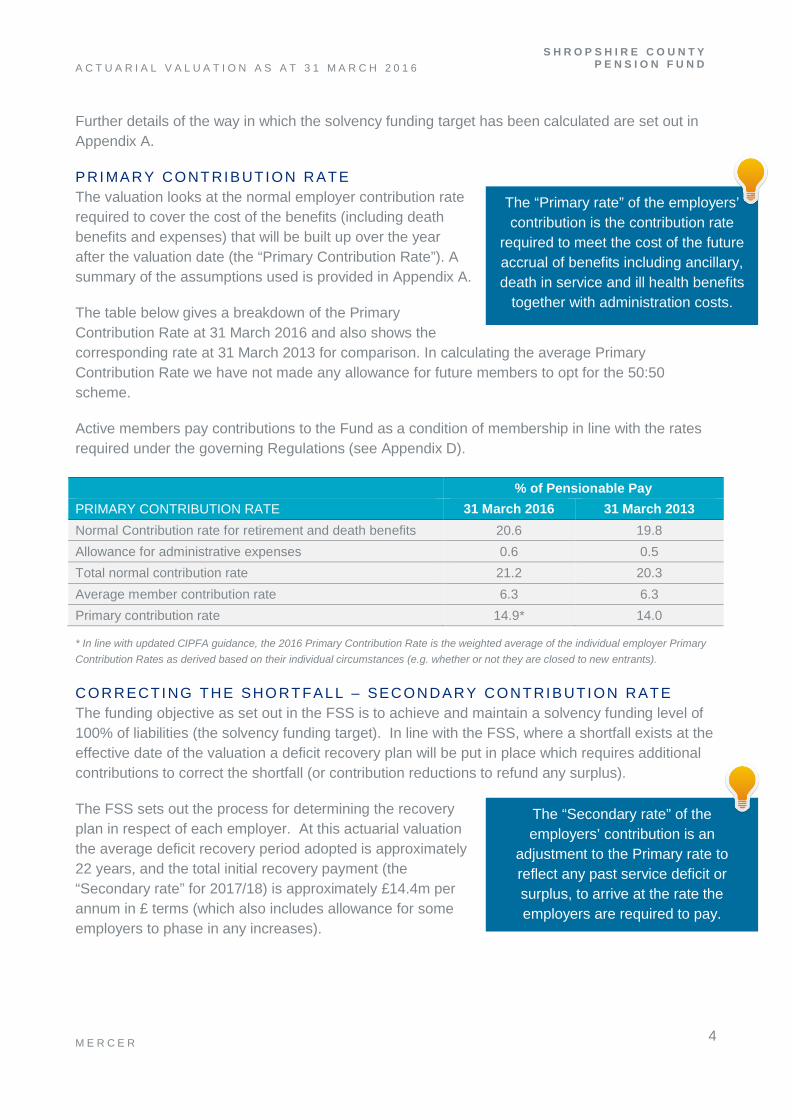
PRI MARY CONT RIBUT ION RATEThe valuation looks at the normal employer contribution raterequired to cover the cost of the benefits (including deathbenefits and expenses) that will be built up over the yearafter the valuation date (the “Primary Contribution Rate”). Asummary of the assumptions used is provided in Appendix A.
The table below gives a breakdown of the PrimaryContribution Rate at 31 March 2016 and also shows thecorresponding rate at 31 March 2013 for comparison. In calculating the average PrimaryContribution Rate we have not made any allowance for future members to opt for the 50:50scheme.
Active members pay contributions to the Fund as a condition of membership in line with the ratesrequired under the governing Regulations (see Appendix D).
% of Pensionable PayPRIMARY CONTRIBUTION RATE 31 March 2016 31 March 2013Normal Contribution rate for retirement and death benefits 20.6 19.8Allowance for administrative expenses 0.6 0.5Total normal contribution rate 21.2 20.3Average member contribution rate 6.3 6.3Primary contribution rate 14.9* 14.0
* In line with updated CIPFA guidance, the 2016 Primary Contribution Rate is the weighted average of the individual employer PrimaryContribution Rates as derived based on their individual circumstances (e.g. whether or not they are closed to new entrants).
CORRECTING THE SHO RT FALL – SECONDARY CONTRIBUT ION RATEThe funding objective as set out in the FSS is to achieve and maintain a solvency funding level of100% of liabilities (the solvency funding target). In line with the FSS, where a shortfall exists at theeffective date of the valuation a deficit recovery plan will be put in place which requires additionalcontributions to correct the shortfall (or contribution reductions to refund any surplus).
The FSS sets out the process for determining the recoveryplan in respect of each employer. At this actuarial valuationthe average deficit recovery period adopted is approximately22 years, and the total initial recovery payment (the“Secondary rate” for 2017/18) is approximately £14.4m perannum in £ terms (which also includes allowance for someemployers to phase in any increases).
The “Primary rate” of the employers’contribution is the contribution rate
required to meet the cost of the futureaccrual of benefits including ancillary,death in service and ill health benefits
together with administration costs.
The “Secondary rate” of theemployers’ contribution is an
adjustment to the Primary rate toreflect any past service deficit orsurplus, to arrive at the rate theemployers are required to pay.

A C T U A R I A L V A L U A T I O N A S A T 3 1 M A R C H 2 0 1 6S H R O P S H I R E C O U N T Y
P E N S I O N F U N D
M E R C E R 5
4EXPERIENCE SINCE LAST VALUATION
SUMMARY OF KEY I NTER -VAL UAT ION EX PERI ENCEThe last actuarial valuation was carried out with an effective date of 31March 2013. With effect from 1 April 2014 the scheme’s benefitstructure changed from a Final Salary Scheme to a Career AverageRevalued Earnings (CARE) Scheme, and the 2013 actuarial valuationtook these changes into account.
The average Pensionable Salary increase for the Fund members whowere in service for the whole of the inter-valuation period was 3.1% perannum.
Pensions in payment (in excess of Guaranteed Minimum Pensions(GMPs)) were increased as guaranteed under the Fund as follows:
· April 2014 2.7%· April 2015 1.2%· April 2016 0%
Over the intervaluation period, benefit inflation has averaged 1.3% p.a. Over the three years to 31March 2016 the investment return on the Fund’s assets has averaged 7.2% per annum (a mixtureof net and gross returns), meaning that the average real return has been about 5.9% p.a.
The outcomes from thevaluation are determinedboth by the assumptions
adopted for the future, andthe Fund’s historic
experience relative toassumptions made in thepast. In this section we
consider the effect of theFund’s experience over the
last three years.
A C T U A R I A L V A L U A T I O N A S A T 3 1 M A R C H 2 0 1 6S H R O P S H I R E C O U N T Y
P E N S I O N F U N D
M E R C E R 6
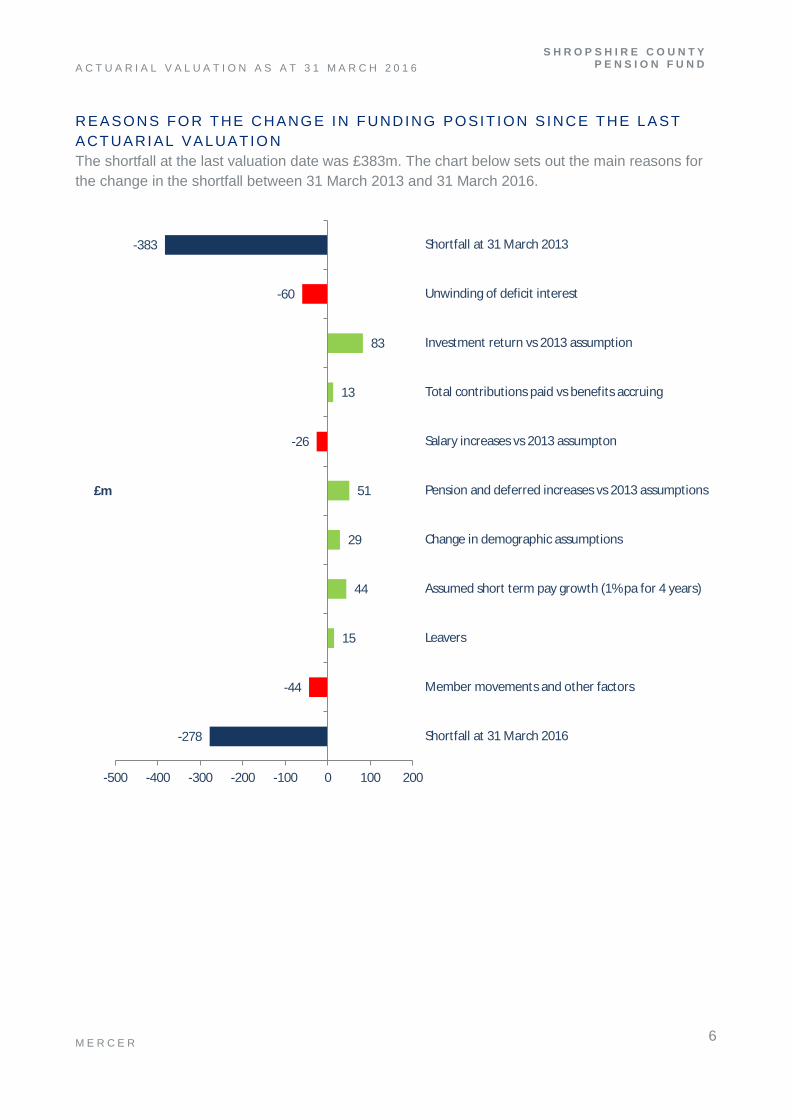
REASONS FO R THE CHANG E IN FUNDING POSIT ION S INCE THE L ASTACT UARI AL VALUAT IO NThe shortfall at the last valuation date was £383m. The chart below sets out the main reasons forthe change in the shortfall between 31 March 2013 and 31 March 2016.
-278
-44
15
44
29
51
-26
13
83
-60
-383
-500 -400 -300 -200 -100 0 100 200
Shortfall at 31 March 2016
Member movements and other factors
Leavers
Assumed short term pay growth (1% pa for 4 years)
Change in demographic assumptions
Pension and deferred increases vs 2013 assumptions
Salary increases vs 2013 assumpton
Total contributions paid vs benefits accruing
Investment return vs 2013 assumption
Unwinding of deficit interest
Shortfall at 31 March 2013
£m
A C T U A R I A L V A L U A T I O N A S A T 3 1 M A R C H 2 0 1 6S H R O P S H I R E C O U N T Y
P E N S I O N F U N D
M E R C E R 7
5CASHFLOWS, RISKS AND ALTERNATIVEFUNDING POSITIONS
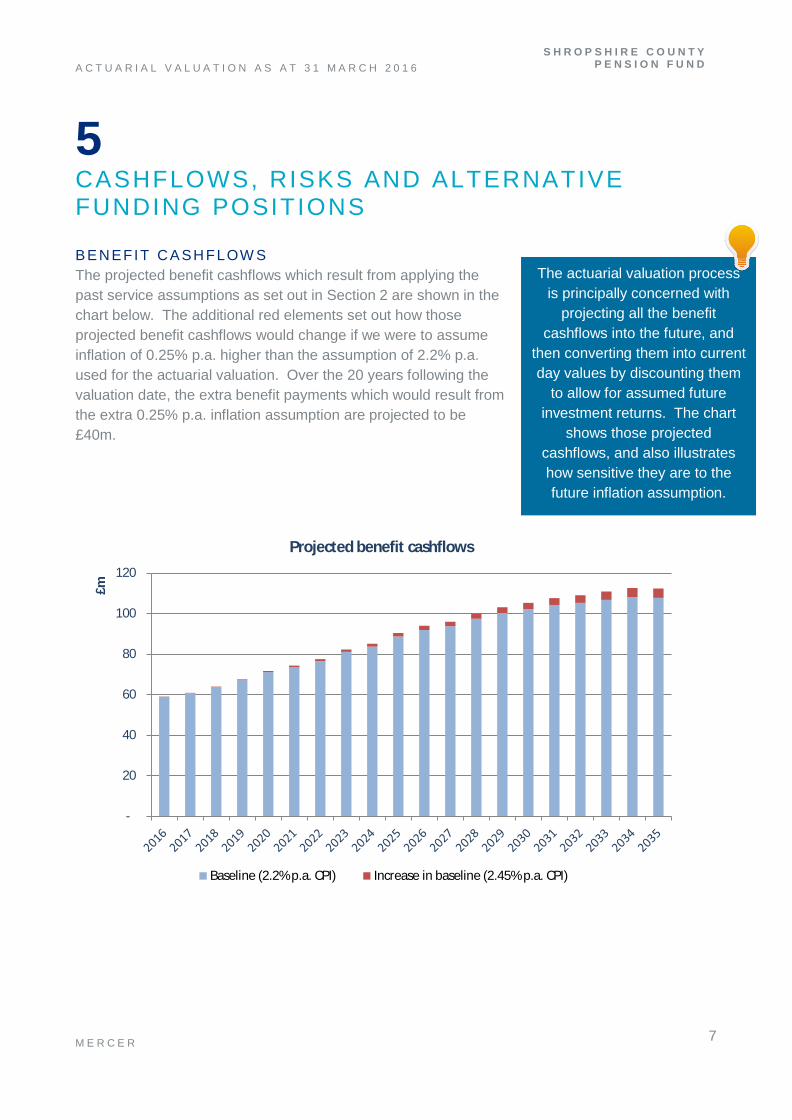
BENEFIT CASHFLOW SThe projected benefit cashflows which result from applying thepast service assumptions as set out in Section 2 are shown in thechart below. The additional red elements set out how thoseprojected benefit cashflows would change if we were to assumeinflation of 0.25% p.a. higher than the assumption of 2.2% p.a.used for the actuarial valuation. Over the 20 years following thevaluation date, the extra benefit payments which would result fromthe extra 0.25% p.a. inflation assumption are projected to be£40m.
The actuarial valuation processis principally concerned with
projecting all the benefitcashflows into the future, and
then converting them into currentday values by discounting them
to allow for assumed futureinvestment returns. The chart
shows those projectedcashflows, and also illustrateshow sensitive they are to thefuture inflation assumption.
-
20
40
60
80
100
120
£m
Projected benefit cashflows
Baseline (2.2% p.a. CPI) Increase in baseline (2.45% p.a. CPI)
A C T U A R I A L V A L U A T I O N A S A T 3 1 M A R C H 2 0 1 6S H R O P S H I R E C O U N T Y
P E N S I O N F U N D
M E R C E R 8
PROJ ECTED FUNDI NG PO SIT ION AT NEXT ACTUARI AL VALUAT IONAs part of this valuation, the Administering Authority has set a maximum recovery plan to pay offthe shortfall of approximately 22 years. The next actuarial valuation will take place with an effectivedate of 31 March 2019. If experience up to that date is in line with the assumptions made for thiscurrent actuarial valuation and contributions are paid at the agreed rates or amounts, the shortfallat 31 March 2019 would be £270m, equivalent to a funding level of 87%.
MAT ERI AL RI SKS FACED BY T HE FUNDThe Fund is subject to some potentially material risks that are, to an extent, outside theAdministering Authority’s control, but could affect the funding level. Any material worsening of thefunding level will mean more contributions are needed (either at an increased rate or at the samerate over a longer period) to be able to provide the benefits built up in the Fund – unlessexperience acts in other ways to improve the funding level. Examples of such risks, and how theAdministering Authority manages them, are:
· If an Employer becomes unable to pay contributions or to make good deficits in the future, theFund’s assets will be lower than expected and the funding level will be worse than expected.The Administering Authority regularly monitors the financial strength of the Employers so thatactions can be taken to mitigate (but not fully remove) the risk.
· If future investment returns on assets are lower than assumed in the valuation, the Fund’sassets will be lower, and the funding level worse, than expected. The Administering Authorityhas a process in place to monitor investment performance quarterly, and it reviews the Fund’sinvestment strategy alongside each actuarial valuation.
· If improvements in life expectancy are greater than assumed, the cost of benefits will increasebecause members are living longer than expected. This will mean the funding level will beworse than expected. The Administering Authority regularly reviews the Fund’s experience andensures that the assumptions it makes about members’ life expectancy take the most recentinformation available into account.
· If members make decisions about their options which increase the Fund’s liabilities, the fundinglevel will be worse than expected. An example would be if members commute less possiblepension for cash, than is being assumed. The Administering Authority reviews the Fund’sexperience at each valuation to ensure that their treatment of member options remainsappropriate.
SENSIT IV ITY OF FUNDI NG PO SIT ION TO CHANGES I N KEYASSUMPTIONSThe value placed on the Fund’s liabilities is critically dependent on the assumptions used to carryout the calculations. If future experience differs from the assumptions the Administering Authorityhas used after consulting with the Employers, then the projected future funding level will bedifferent from the level described above.

A C T U A R I A L V A L U A T I O N A S A T 3 1 M A R C H 2 0 1 6S H R O P S H I R E C O U N T Y
P E N S I O N F U N D
M E R C E R 9
To illustrate how sensitive the funding level is to experience being different from assumed, thetable below shows how the valuation results at 31 March 2016 would have differed given smallchanges in the key assumptions.
ASSUMPTION CHANGE
CHANGE INSHORTFALL AT31 MARCH 2016
(£M)
RESULTANTSHORTFALL AT31 MARCH 2016
(£M)Original solvency funding position - 278
Real investment return 0.25% lower than assumed 78 356
Pensionable Salary growth 0.25% higher than assumed 11 289
Members live one year longer than assumed 38 316
Growth assets fall by 25% 272 550
MI N I MUM RISK FUNDI NG POSIT IONIn assessing the value of the Fund’s liabilities (the funding target), allowance has been made forinvestment returns as described in Appendix A, taking into account the investment strategyadopted by the Fund, as set out in the Fund’s Investment Strategy Statement (ISS).
It is not possible to construct a portfolio of investments which produces a stream of income exactlymatching the expected liability outgo. However, it is possible to construct a portfolio which closelymatches the liabilities and represents the minimum risk investment position. Such a portfolio wouldconsist mainly of a mixture of long-term index-linked and fixed interest gilts. Investment of theFund’s assets in line with the minimum risk portfolio would minimise fluctuations in the Fund’songoing funding level between successive actuarial valuations.
If, at the valuation date, the Fund had been invested in this portfolio, then in carrying out thevaluation it would not be appropriate to make any allowance for out-performance of the Fundinvestments. In this event the value of the liabilities would have increased substantially, to£2,787m, and the funding level would have reduced correspondingly to 54%. If the actuarialassumptions are borne out in practice, the projected funding level on this basis at the next actuarialvaluation would be slightly lower at 52%.
The value of the liabilities on the solvency funding target assumptions was £1,772m, which is£1,015m less than the value on the minimum risk basis. The funding plan is therefore makingallowance for future investment returns of £1,015m over and above those available from theminimum risk investment portfolio.

A C T U A R I A L V A L U A T I O N A S A T 3 1 M A R C H 2 0 1 6S H R O P S H I R E C O U N T Y
P E N S I O N F U N D
M E R C E R 10
APPENDICES

A C T U A R I A L V A L U A T I O N A S A T 3 1 M A R C H 2 0 1 6S H R O P S H I R E C O U N T Y
P E N S I O N F U N D
M E R C E R 11
AASSUMPTIONS
HOW THE BENEFITS ARE VAL UEDIn order to calculate the liabilities, there is a need to make assumptions about various factors thataffect the cost of the benefits provided by the Fund – for example, how long members will live, orthe future level of inflation. The table below explains the key assumptions being made in thevaluation.
ASSUMPTION WHY IT IS IMPORTANT AND HOW IT IMPACTS ON THE LIABILITIES
Discount rate The majority of benefits in a pension fund are paid many years in the future.In the period before the benefits are paid, the Administering Authority investthe funds held by the fund with the aim of achieving a return on those funds.When calculating how much money is needed now to make these benefitpayments, it is appropriate to make allowance for the investment return thatis expected to be earned on these funds. This is known as “discounting”.The higher the investment return achieved, the less money needs to be setaside now to pay for benefits. The calculation reflects this by placing a lowervalue on the liabilities if the “discount rate” is higher.
Inflation Pensions in payment increase in line with price inflation. Salary growth isalso normally linked to price inflation in the long term. A higher inflationassumption will, all other things being equal, lead to a higher value beingplaced on the liabilities.
Pensionable Salary growth Benefits earned prior to 1 April 2014 for active members are based on theirsalaries immediately before retirement, so it is necessary to make anassumption about future Pensionable Salary growth. The higher thisassumption, the higher the value placed on the liabilities for activemembers.
Life expectancy Pensions are paid while the member (and potentially their spouse orpartner) is alive. The longer people live, the greater is the cost of providinga pension. Allowing for longer life expectancy therefore increases theliabilities.
The liabilities of the Fund are calculated projecting forward all of the future benefit cashflows anddiscounting them back to the effective date of the valuation, using these assumptions. Forexample, the liability for a single pensioner is calculated by estimating the amount of each pensionpayment they will receive in the future, multiplying by the probability that the member will still bealive by the date of each payment, and then discounting each payment back to the effective date ofthe valuation; and then summing up all of these discounted amounts. The liabilities for the wholeFund are calculated by summing the liabilities for each of the individual members.
A C T U A R I A L V A L U A T I O N A S A T 3 1 M A R C H 2 0 1 6S H R O P S H I R E C O U N T Y
P E N S I O N F U N D
M E R C E R 12
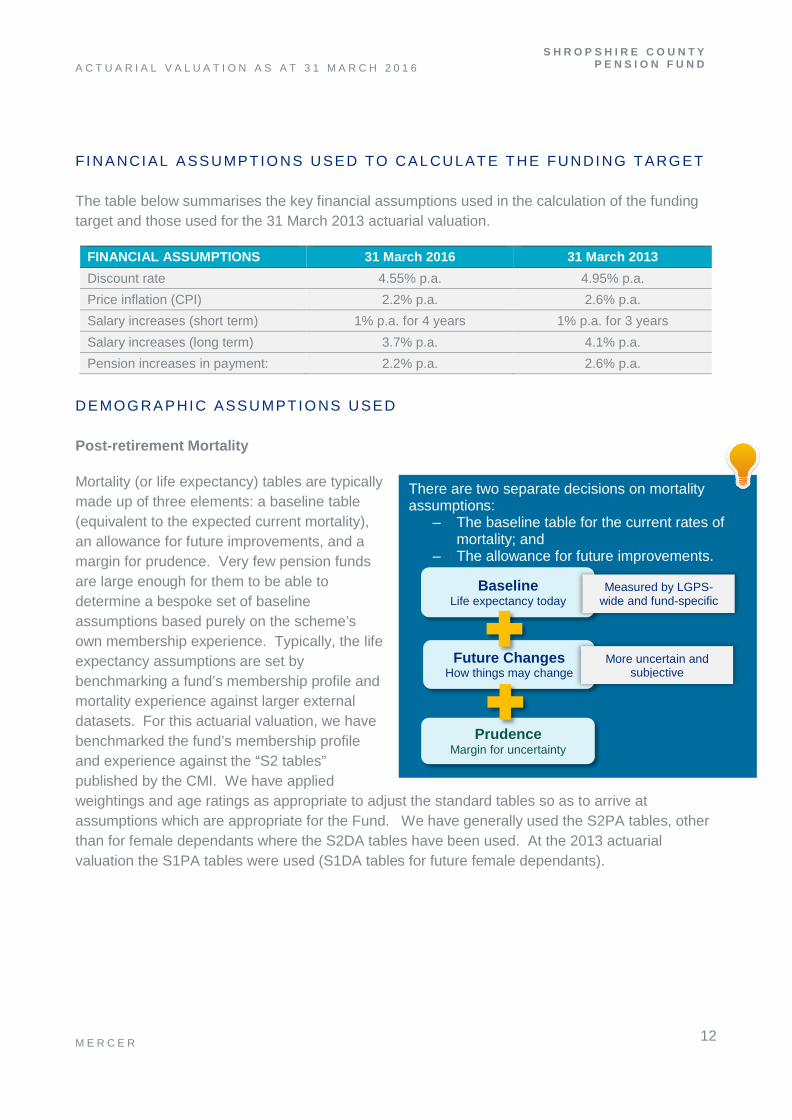
FI NANCI AL ASSUMPTIO NS USED TO CAL CULAT E THE FUNDI NG TARG ET
The table below summarises the key financial assumptions used in the calculation of the fundingtarget and those used for the 31 March 2013 actuarial valuation.
FINANCIAL ASSUMPTIONS 31 March 2016 31 March 2013Discount rate 4.55% p.a. 4.95% p.a.Price inflation (CPI) 2.2% p.a. 2.6% p.a.Salary increases (short term) 1% p.a. for 4 years 1% p.a. for 3 yearsSalary increases (long term) 3.7% p.a. 4.1% p.a.Pension increases in payment: 2.2% p.a. 2.6% p.a.
DEMOG RAPHIC ASSUMPTIO NS USED
Post-retirement Mortality
Mortality (or life expectancy) tables are typicallymade up of three elements: a baseline table(equivalent to the expected current mortality),an allowance for future improvements, and amargin for prudence. Very few pension fundsare large enough for them to be able todetermine a bespoke set of baselineassumptions based purely on the scheme’sown membership experience. Typically, the lifeexpectancy assumptions are set bybenchmarking a fund’s membership profile andmortality experience against larger externaldatasets. For this actuarial valuation, we havebenchmarked the fund’s membership profileand experience against the “S2 tables”published by the CMI. We have appliedweightings and age ratings as appropriate to adjust the standard tables so as to arrive atassumptions which are appropriate for the Fund. We have generally used the S2PA tables, otherthan for female dependants where the S2DA tables have been used. At the 2013 actuarialvaluation the S1PA tables were used (S1DA tables for future female dependants).
There are two separate decisions on mortalityassumptions:
– The baseline table for the current rates ofmortality; and
– The allowance for future improvements.
BaselineLife expectancy today
Future ChangesHow things may change
Measured by LGPS-wide and fund-specific
study
More uncertain andsubjective
PrudenceMargin for uncertainty

A C T U A R I A L V A L U A T I O N A S A T 3 1 M A R C H 2 0 1 6S H R O P S H I R E C O U N T Y
P E N S I O N F U N D
M E R C E R 13
The weightings and age ratings applied to the above are set out in the table below.
Current Status Retirement Type 2016 weighting/rating 2013 weighting/rating
Pensioner
Normal Health 95% males, 83% females 89% males, 89% females
Dependant 115% males, 93% females 139% males, 104% females
Ill Health 95% males, 83% females with an agerating of +3 years in each case
89% males, 89% females with anage rating of +3 years in each case
Future Dependants 113% males, 96% females 104% males, 94% females
Active
Normal Health 95% males, 83% females 89% males, 84% females
Ill Health 95% males, 83% females with an agerating of +4 years in each case
89% males, 84% females with anage rating of +4 years in each case
Deferred All 95% males, 83% females 106% males, 96% females
Active /Deferred Future Dependants 113% males, 96% females 101% males, 94% females
A weighting applied to an actuarial table has the effect of increasing or reducing the chance of survival at each age,which increases or reduces the corresponding life expectancy. Similarly, an age rating applied to an actuarial table hasthe effect of assuming that beneficiaries have a life expectancy equal to those older (or younger) than their actual age.
Future improvements are assumed to follow the CMI 2015 model with a 1.5% p.a. long-termimprovements trend. At the 2013 actuarial valuation the CMI 2012 model with a 1.5% p.a. long-term improvements trend was used.
The mortality assumptions used for the 31 March 2016 valuation result in the following lifeexpectancies.
YearsLife expectancy for a male aged 65 now 22.9Life expectancy at 65 for a male aged 45 now 25.1Life expectancy for a female aged 65 now 26.1Life expectancy at 65 for a female aged 45 now 28.4

A C T U A R I A L V A L U A T I O N A S A T 3 1 M A R C H 2 0 1 6S H R O P S H I R E C O U N T Y
P E N S I O N F U N D
M E R C E R 14
Pre-retirement Mortality
The following mortality tables (together with any appropriate weightings and age ratings) havebeen adopted for mortality rates in the period up to retirement.
31 March 2016 31 March 2013Base Table DxL08 tables with
adjustments of 80% (male)50% (female) to reflect theFund’s membership profile
AC00 tables with adjustmentsof 73% (male) and 60%
(female) to reflect the Fund’smembership profile
Allowance for Future Improvements CMI_2015 [1.5%] N/A
Commutation
It has been assumed that, on average, 50% ofretiring members will take the maximum tax-freecash available at retirement and 50% will take a3/80ths cash sum (the standard for pre April 2008service). The members have the option to commutepart of their pension at retirement in return for a lumpsum at a rate of £12 cash for each £1 per annum ofpension given up.
Early retirement
For those members who are entitled to receive their accrued benefits (or partof those benefits) prior to the Fund’s normal pension age, a proportion of theactive membership is assumed to retire in normal health prior to age 65, asset out below:
% retiring perannum
% retiring perannum
Age Males Females60 10 2061 8 1562 8 15
Retirement lump sums are less costly for theFund to provide than the alternative pension, as
members receive only £12 of each £1 p.a. ofpension given up. If members take the cashsum option at a higher rate than has beenassumed then this will normally lead to an
improvement in the funding level.
If members take earlyretirement to a greaterextent than has beenassumed then this will
typically lead to aworsening of the
funding level. This isbecause many
members are able totake substantial partsof their benefits fromage 60 without them
being reduced for earlypayment.
A C T U A R I A L V A L U A T I O N A S A T 3 1 M A R C H 2 0 1 6S H R O P S H I R E C O U N T Y
P E N S I O N F U N D
M E R C E R 15
% retiring perannum
% retiring perannum
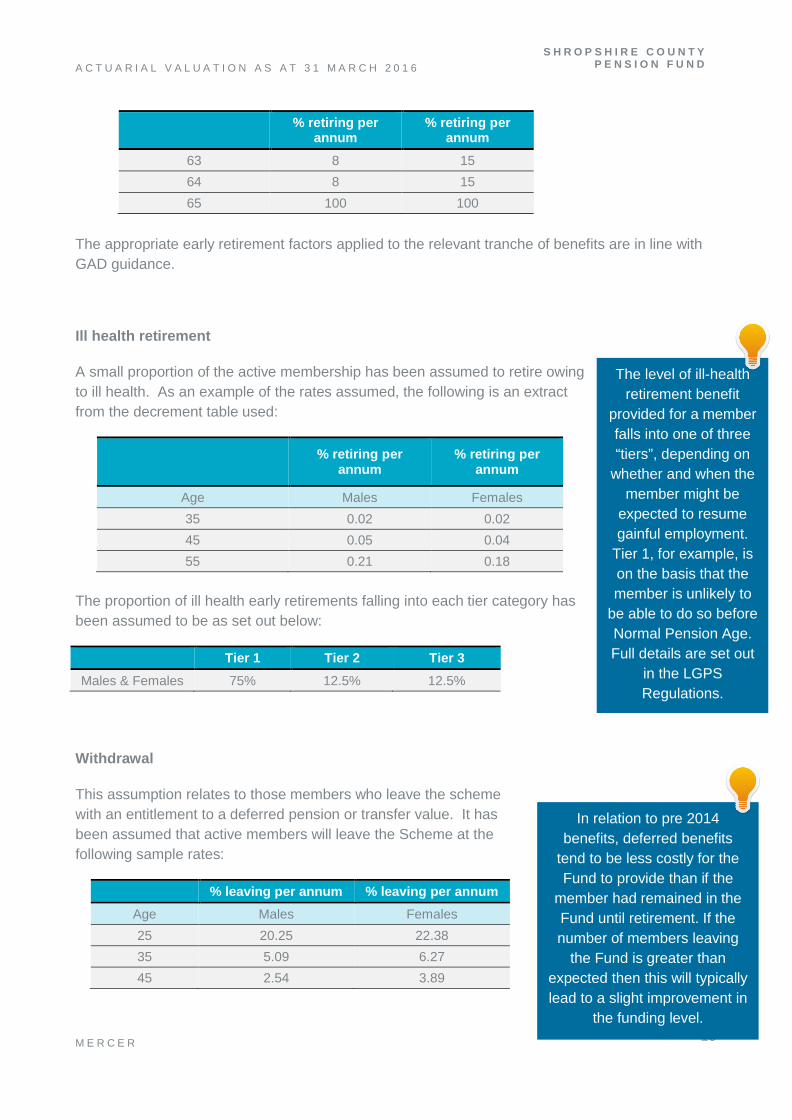
63 8 1564 8 1565 100 100
The appropriate early retirement factors applied to the relevant tranche of benefits are in line withGAD guidance.
Ill health retirement
A small proportion of the active membership has been assumed to retire owingto ill health. As an example of the rates assumed, the following is an extractfrom the decrement table used:
% retiring perannum
% retiring perannum
Age Males Females35 0.02 0.0245 0.05 0.0455 0.21 0.18
The proportion of ill health early retirements falling into each tier category hasbeen assumed to be as set out below:
Tier 1 Tier 2 Tier 3Males & Females 75% 12.5% 12.5%
Withdrawal
This assumption relates to those members who leave the schemewith an entitlement to a deferred pension or transfer value. It hasbeen assumed that active members will leave the Scheme at thefollowing sample rates:
% leaving per annum % leaving per annumAge Males Females25 20.25 22.3835 5.09 6.2745 2.54 3.89
The level of ill-healthretirement benefit
provided for a memberfalls into one of three“tiers”, depending on
whether and when themember might be
expected to resumegainful employment.
Tier 1, for example, ison the basis that themember is unlikely to
be able to do so beforeNormal Pension Age.Full details are set out
in the LGPSRegulations.
In relation to pre 2014benefits, deferred benefits
tend to be less costly for theFund to provide than if the
member had remained in theFund until retirement. If thenumber of members leaving
the Fund is greater thanexpected then this will typicallylead to a slight improvement in
the funding level.

A C T U A R I A L V A L U A T I O N A S A T 3 1 M A R C H 2 0 1 6S H R O P S H I R E C O U N T Y
P E N S I O N F U N D
M E R C E R 16
Partners’ and Dependants’ Proportions
It has been assumed that the proportions of members below will on deathgive rise to a dependant’s pension (spouse’s and partner’s), and thatspouses/partners of female (male) members are three years older(younger), on average than the member.
ASSUMPTIONS USED TO CALCUL ATE THE PRI MAR Y CO NTRIBUT IONRATE
The cost of future accrual (normal cost) has been calculated using the same actuarial assumptionsas used to calculate the funding target and recovery plan as set out above except that the financialassumptions adopted are as described below.
The financial assumptions for assessing the future service contribution rate should take account ofthe fact that contributions will be invested in market conditions applying at future dates, which areunknown at the effective date of the valuation, and which are not directly linked to marketconditions at the valuation date.
The financial assumptions in relation to future service (i.e. the normal cost) are not specificallylinked to investment conditions as at the valuation date itself, and are based on an overallassumed real return (i.e. return in excess of price inflation) of 2.75% per annum. This represents areduction of 0.25% per annum compared to the 2013 valuation , which increases the estimatedcost of providing LGPS benefits. With a long term average assumption for price inflation of 2.2%per annum, this gives rise to an overall discount rate of 4.95% p.a. (the corresponding discountrate at the 2013 actuarial valuation was 5.6% p.a.).
% spouse/partner % spouse/partnerAge Males Females25 43 4635 69 6045 72 6055 74 6065 76 55
If more members thanassumed have
partners then this willlead to an increase in
the number ofdependants pensionscoming into paymentover and above that
expected. This wouldlead to a worsening of
the funding level.

A C T U A R I A L V A L U A T I O N A S A T 3 1 M A R C H 2 0 1 6S H R O P S H I R E C O U N T Y
P E N S I O N F U N D
M E R C E R 17
BSUMMARY MEMBERSHIP DATA
The membership data is summarised in the table, with figures at the previous valuation shown forcomparison.
Data in relation to members of the Fund were supplied by the Funding administrator on behalf ofthe Administering Authority. The accuracy of the data provided has been relied on. Whilereasonableness checks on the data have been carried out, they do not guarantee thecompleteness or the accuracy of the data. Consequently Mercer does not accept any liability inrespect of its advice where it has relied on data that is incomplete or inaccurate.
31 March 2016 31 March 2013
Active members
Number 16,494 14,055
Total Pensionable Salaries (£000s p.a.) 222,358 206,915
Average Pensionable Salary (£ p.a.) 13,481 14,722
Average age (pension weighted) 49.2 49.3
Deferred pensioners
Number 18,762 14,828
Total deferred pensions revalued to valuation date(£000s p.a.) 22,003 18,133
Average deferred pension (£ p.a.) 1,173 1,223
Average age (pension weighted) 49.6 49.1
Pensioners
Number 11,083 9,655
Total pensions payable (£000s p.a.) 52,691 45,439
Average pension (£ p.a.) 4,754 4,706
Average age (pension weighted) 69.5 68.8
The above pensioner figures include current dependant pensioners.

A C T U A R I A L V A L U A T I O N A S A T 3 1 M A R C H 2 0 1 6S H R O P S H I R E C O U N T Y
P E N S I O N F U N D
M E R C E R 18
CASSETS
The market value of the Fund’s assets was £1,493,990,000 on the valuation date.
The Administering Authority’s investment strategy is to proportion the Fund’s assets by asset classas shown in the table below. The actual distribution of assets will vary over time due to changes infinancial markets. The table also shows the distribution of assets at the valuation date.
INVESTMENTSTRATEGY
ACTUAL MARKET VALUE OF ASSETSAT 31 MARCH 2016
% £000s %
UK equities 8.0% 114,082 7.6%
Global equities (includingpassive hedged)
44.0% 659,329 44.1%
Private equity 5.0% 65,688 4.4%
Hedge funds 10.0% 149,051 10.0%
Infrastructure 3.0% 21,371 1.4%
European property 5.0% 77,525 5.2%
LDI 3.5% - 0.0%
Unconstrained bonds: 21.5%
Absolute return bonds 204,602 13.7%
UK index-linked gilts 162,999 10.9%
Net assets including cash 0.0% 39,343 2.7%
Total 100% 1,493,990 100%
The Administering Authority also holds additional voluntary contributions (AVCs), which areseparately invested. These assets have been excluded from the market value shown as theyexactly match the value of the benefits they cover.
The details of the assets at the valuation date have been obtained from the audited accounts forthe Fund.
A C T U A R I A L V A L U A T I O N A S A T 3 1 M A R C H 2 0 1 6S H R O P S H I R E C O U N T Y
P E N S I O N F U N D
M E R C E R 19
DSCHEME BENEFITS
The benefits valued within our calculations are those in force at the effective date of the valuation.Full details of these can be found in the Local Government Pension Scheme Regulations 2013 (asamended):
The Local Government Pension Scheme Regulations 2013(http://www.legislation.gov.uk/uksi/2013/2356/contents/made)
The Local Government Pension Scheme (Transitional Provisions, Savings and Amendment)Regulations 2014 (http://www.legislation.gov.uk/uksi/2014/525/contents/made)
The direction by the Treasury dated 5 April 2016 under Section 59A of the Social SecurityPensions Act 1975 (http://www.lgpsregs.org/images/OtherGuidance/HMTDirectionApr2016.pdf)
We have made no allowance for other changes which may be introduced in the future.The Fund is also responsible for paying and, where appropriate, recharging to employers thebenefits arising from the award of compensatory added years (CAY) of service on prematureretirement. Unless these CAY benefits have been converted into “funded” benefits, they arenormally recharged to the relevant employer (together with associated pension increases), and soare excluded from the valuation.
The benefits that will emerge from money purchase AVCs paid by members, and SCAVCs paid byemployers, and the corresponding invested assets in respect of these AVCs and SCAVCs, havebeen excluded from the valuation.
UK and European law requires pension schemes to provide equal benefits to men and women inrespect of service after 17 May 1990 (the date of the “Barber” judgement) and this includesproviding equal benefits accrued from that date to reflect the differences in GMPs. There is noconsensus or legislative guidance as to what adjustments have to be made to scheme benefits tocorrect these inequalities for ongoing schemes (i.e. for schemes other than those which are in thePension Protection Fund). The valuation makes no allowance for removal of these inequalities. It isconsequently possible that additional funding will be required for equalisation once the law hasbeen clarified. It is recommended that the Administering Authority seek further professional adviceif it is concerned about this issue.

A C T U A R I A L V A L U A T I O N A S A T 3 1 M A R C H 2 0 1 6S H R O P S H I R E C O U N T Y
P E N S I O N F U N D
M E R C E R 20
ESUMMARY OF INCOME AND EXPENDITURE
INCOMEYEAR ENDING 31 MARCH
2014£000s
2015£000s
2016£000s
Total£000s
Fund at beginning of year 1,234,725 1,339,203 1,512,735 1,234,725
Contributions to Fund:
Employees 13,660 14,134 14,235 42,029
Employers 45,077 44,657 45,854 135,588
Transfer Values received 3,213 4,339 2,373 9,925
Investment income 19,823 19,248 19,322 58,393
Change in market value ofinvestments 96,882 172,465 (19,277) 250,070
EXPENDITUREYEAR ENDING 31 MARCH
2014 2015 2016 Total£000s £000s £000s £000s
Pensions for members/spouses/partners/dependants 47,094 51,090 53,069 151,253
Retiring allowances and deathgratuities 11,893 12,044 10,562 34,499
Withdrawals 8 81 245 334
Transfer Values paid 3,299 4,312 4,259 11,870
Investment expenses 9,915 12,471 11,693 34,254
Administration expenses 1,968 1,313 1,424 4,530
Fund at end of year 1,339,203 1,512,735 1,493,990 1,493,990
The details of the financial transactions during the inter-valuation period have been obtained fromthe audited accounts for the Fund.

A C T U A R I A L V A L U A T I O N A S A T 3 1 M A R C H 2 0 1 6S H R O P S H I R E C O U N T Y
P E N S I O N F U N D
M E R C E R 21
FANALYSIS OF MEMBERSHIP EXPERIENCE
The analysis below compares the actual experience over the 3 year period with the assumptionsused for the 2016 valuation.
ACTUAL EXPECTED %
Ill Health Retirements 37 51 73
Withdrawals 5,676 2,573 221
Pensioner Deaths (lives) 720 599 120
Pensioner Deaths (£000 p.a. of pension) 2,757 2,231 124
Note that actual withdrawals can include members moving to another LGPS Fund, bulk transfersand also transfers under the special transfer club terms.

A C T U A R I A L V A L U A T I O N A S A T 3 1 M A R C H 2 0 1 6S H R O P S H I R E C O U N T Y
P E N S I O N F U N D
M E R C E R 22
GRATES AND ADJUSTMENTS CERTIFICATEISSUED IN ACCORDANCE WITH REGULATION62
NAME OF FUND Shr ops h i re Coun t y Pe ns ion Fund
PRI MARY CONT RIBUT ION RATEI hereby certify that, in my opinion, the primary rate of the employers’ contribution for the wholeFund for each of the three years beginning 1 April 2017 is 14.9% of pensionable pay.
The primary rate of contribution for each employer for the three year period beginning 1 April 2017is set out in the attached schedule.
SECO NDARY CONTRI BUT ION R ATEI hereby certify that, in my opinion, the secondary rate of the employer’s contribution for the wholeFund for each of the three years beginning 1 April 2017 is as follows:
2017/18 £15.0 million minus 0.2% of pensionable pay2018/19 £15.5 million minus 0.2% of pensionable pay2019/20 £16.1 million minus 0.2% of pensionable pay
The secondary rate of contribution for each employer for each of the three years beginning 1 April2017 is set out in the attached schedule.
CONTRI BUT ION AMO UNTS PAYABL EThe total contribution payable for each employer is the total of the primary and secondary rates asdetailed in the attached schedule. Contributions will be paid monthly in arrears with each paymentnormally being due by the 19th of the following month unless otherwise noted in the schedule.
FURTHER ADJ USTMENTSA further individual adjustment shall be applied in respect of each non-ill health early retirementoccurring in the period of three years covered by this certificate. This further individual adjustmentwill be calculated in accordance with methods agreed from time to time between the Fund’sActuary and the Administering Authority.
The contributions set out in the attached schedule represent the minimum contribution which maybe paid by each employer in total over the 3 years covered by the certificate. Additionalcontributions or a different pattern of contributions may be paid if requested by the employerconcerned at the sole discretion of the Administering Authority as agreed with the Actuary. Thetotal contributions payable by each employer will be subject to a minimum of zero.

A C T U A R I A L V A L U A T I O N A S A T 3 1 M A R C H 2 0 1 6S H R O P S H I R E C O U N T Y
P E N S I O N F U N D
M E R C E R 23
The individual employer contributions may be varied as agreed by the Actuary and AdministeringAuthority to reflect any changes in contribution requirements as a result of any benefit costs beinginsured with a third party or parties including where the third party or parties participate in theFund.
In cases where an element of an existing Scheme employer's deficit is transferred to a newemployer on its inception, the Scheme employer's deficit recovery contributions, as shown on theschedule to this Certificate in Appendix H, may be reallocated between the Scheme employer andthe new employer to reflect this, on advice of the Actuary and as agreed with the AdministeringAuthority so that the total payments remain the same overall.
The Administering Authority and employer with advice from the Fund’s Actuary can agree thatcontributions payable under this certificate can be sourced under an alternative financingarrangement which provides the Fund with equivalent cash contributions.
REG UL AT ION 62(8 )No allowance for non-ill health early retirements has been made in determining the results of thevaluation, on the basis that the costs arising will be met by additional contributions. Allowance forill health retirements has been included in each employer’s contribution rate, on the basis of themethod and assumptions set out in the report.
Signature: Signature:
Name: John Livesey Name: Mark Wilson
Qualification: Fellow of the Institute Qualification:Fellow of the Instituteand Faculty of Actuaries and Faculty of Actuaries
Date of signing: 31 March 2017

A C T U A R I A L V A L U A T I O N A S A T 3 1 M A R C H 2 0 1 6S H R O P S H I R E C O U N T Y
P E N S I O N F U N D
M E R C E R 24
HSCHEDULE TO THE RATES AND ADJUSTMENTS CERTIFICATE DATED31 MARCH 2017
Employer
Primary rate2017/18 to
2019/20
Secondary rates Total Contribution rates
2017/18 2018/19 2019/20 2017/18 2018/19 2019/20
Scheme employers
Shropshire Council 14.8% *£7,434,300 *£7,373,900 *£7,314,00014.8% plus*£7,434,300
14.8% plus*£7,373,900
14.8% plus*£7,314,000
Telford & Wrekin Council 14.1% **£3,589,000 **£3,722,000 **£3,860,00014.1% plus
**£3,589,00014.1% plus
**£3,722,00014.1% plus
**£3,860,000
New College 12.6% £31,500 £32,700 £33,90012.6% plus
£31,50012.6% plus
£32,70012.6% plus
£33,900
North Shropshire College 14.8% £137,100 £142,200 £147,40014.8% plus£137,100
14.8% plus£142,200
14.8% plus£147,400
Shrewsbury Colleges Group 14.5% £196,100 £203,400 £210,90014.5% plus£196,100
14.5% plus£203,400
14.5% plus£210,900
Shropshire & Wrekin FireAuthority
13.9% £100,200 £103,900 £107,80013.9% plus£100,200
13.9% plus£103,900
13.9% plus£107,800
Telford College of Arts &Technology
14.7% £76,500 £79,300 £82,30014.7% plus
£76,50014.7% plus
£79,30014.7% plus
£82,300

A C T U A R I A L V A L U A T I O N A S A T 3 1 M A R C H 2 0 1 6S H R O P S H I R E C O U N T Y
P E N S I O N F U N D
M E R C E R 25
Employer
Primary rate2017/18 to
2019/20
Secondary rates Total Contribution rates
2017/18 2018/19 2019/20 2017/18 2018/19 2019/20
Designated / Resolution bodyAlbrighton Parish Council 19.6% Nil Nil Nil 19.6% 19.6% 19.6%Bayston Hill Parish Council 21.2% -1% -1% -1% 20.2% 20.2% 20.2%Bishops Castle TownCouncil
19.9% £100 £100 £100 19.9% plus £100 19.9% plus £100 19.9% plus £100
Bridgnorth Town Council 17.8% £16,200 £16,800 £17,40017.8% plus
£16,20017.8% plus
£16,80017.8% plus
£17,400Broseley Town Council 19.8% -1.6% -1.6% -1.6% 18.2% 18.2% 18.2%Church Stretton TownCouncil
21.4% £4,000 £4,100 £4,30021.4% plus
£4,00021.4% plus
£4,10021.4% plus
£4,300Dawley Hamlets ParishCouncil
27.4% -1% -1% -1% 26.4% 26.4% 26.4%
Donnington & Muxton ParishCouncil
16.8% £1,400 £1,500 £1,50016.8% plus
£1,40016.8% plus
£1,50016.8% plus
£1,500
Ellesmere Town Council 14.4% £1,400 £1,500 £1,50014.4% plus
£1,40014.4% plus
£1,50014.4% plus
£1,500Great Dawley Parish Council 11.8% -0.5% -0.5% -0.5% 11.3% 11.3% 11.3%Hadley & Leegomery ParishCouncil
16.0% -0.6% -0.6% -0.6% 15.4% 15.4% 15.4%
Hollinswood & RandlayParish Council
16.9% £1,200 £1,200 £1,30016.9% plus
£1,20016.9% plus
£1,20016.9% plus
£1,300Ketley Parish Council 16.4% -0.3% -0.3% -0.3% 16.1% 16.1% 16.1%
Ludlow Town Council 14.3% £9,300 £9,600 £10,00014.3% plus
£9,30014.3% plus
£9,60014.3% plus
£10,000

A C T U A R I A L V A L U A T I O N A S A T 3 1 M A R C H 2 0 1 6S H R O P S H I R E C O U N T Y
P E N S I O N F U N D
M E R C E R 26
Employer
Primary rate2017/18 to
2019/20
Secondary rates Total Contribution rates
2017/18 2018/19 2019/20 2017/18 2018/19 2019/20
Madeley Town Council 21.9% £700 £700 £800 21.9% plus £700 21.9% plus £700 21.9% plus £800Market Drayton TownCouncil
16.2% £5,700 £5,900 £6,10016.2% plus
£5,70016.2% plus
£5,90016.2% plus
£6,100Much Wenlock TownCouncil
20.4% £2,800 £2,900 £3,00020.4% plus
£2,80020.4% plus
£2,90020.4% plus
£3,000Newport Town Council 18.2% £100 £100 £100 18.2% plus £100 18.2% plus £100 18.2% plus £100
Oswestry Town Council 16.6% £11,700 £12,100 £12,60016.6% plus
£11,70016.6% plus
£12,10016.6% plus
£12,600Shifnal Town Council 22.8% £700 £700 £800 22.8% plus £700 22.8% plus £700 22.8% plus £800Shrewsbury Town Council 16.2% -1.4% -1.4% -1.4% 14.8% 14.8% 14.8%Shropshire Towns & RuralHousing
14.9% -0.3% -0.3% -0.3% 14.6% 14.6% 14.6%
Stirchley & Brookside ParishCouncil
14.8% £1,600 £1,600 £1,70014.8% plus
£1,60014.8% plus
£1,60014.8% plus
£1,700The Gorge Parish Council 19.3% Nil Nil Nil 19.3% 19.3% 19.3%
Wellington Town Council 19.6% £2,500 £2,600 £2,70019.6% plus
£2,50019.6% plus
£2,60019.6% plus
£2,700Wem Town Council 14.3% -2.9% -2.9% -2.9% 11.4% 11.4% 11.4%
West Mercia Energy 10.8% £168,000 £174,200 £180,70010.8% plus£168,000
10.8% plus£174,200
10.8% plus£180,700
Whitchurch Town Council 8.0% £3,800 £4,000 £4,100 8% plus £3,800 8% plus £4,000 8% plus £4,100Wrockwardine ParishCouncil
28.0% £500 £500 £500 28% plus £500 28% plus £500 28% plus £500

A C T U A R I A L V A L U A T I O N A S A T 3 1 M A R C H 2 0 1 6S H R O P S H I R E C O U N T Y
P E N S I O N F U N D
M E R C E R 27
Employer
Primary rate2017/18 to
2019/20
Secondary rates Total Contribution rates
2017/18 2018/19 2019/20 2017/18 2018/19 2019/20
Academies / schoolsAbraham Darby Academy 14.5% -1.1% -1.1% -1.1% 13.4% 13.4% 13.4%
Adams Grammar Academy 15.6% £31,600 £32,800 £34,00015.6% plus
£31,60015.6% plus
£32,80015.6% plus
£34,000Barrow 16-18 Free School 15.2% Nil Nil Nil 15.2% 15.2% 15.2%Bishops AnthonyEducational Trust
15.1% £13,500 £14,000 £14,60015.1% plus
£13,50015.1% plus
£14,00015.1% plus
£14,600
Bitterley C.E Primary School 15.5% £11,500 £11,900 £12,30015.5% plus
£11,50015.5% plus
£11,90015.5% plus
£12,300Bridgnorth Endowed School 17.0% £23,100 £24,000 £24,800 17% plus £23,100 17% plus £24,000 17% plus £24,800
Church Stretton Academy 16.1% £42,900 £44,500 £46,10016.1% plus
£42,90016.1% plus
£44,50016.1% plus
£46,100
Clee Hill Primary 14.9% £6,800 £7,100 £7,30014.9% plus
£6,80014.9% plus
£7,10014.9% plus
£7,300
Cleobury Mortimer School 14.3% £12,900 £13,400 £13,90014.3% plus
£12,90014.3% plus
£13,40014.3% plus
£13,900Communities AcademyTrust
14.3% £184,700 £191,500 £198,60014.3% plus£184,700
14.3% plus£191,500
14.3% plus£198,600
Corbet School Academy 17.9% £25,200 £26,100 £27,10017.9% plus
£25,20017.9% plus
£26,10017.9% plus
£27,100
Idsall School 16.5% £51,500 £53,400 £55,40016.5% plus
£51,50016.5% plus
£53,40016.5% plus
£55,400
Kickstart Academy 10.4% £2,500 £2,600 £2,70010.4% plus
£2,50010.4% plus
£2,60010.4% plus
£2,700

A C T U A R I A L V A L U A T I O N A S A T 3 1 M A R C H 2 0 1 6S H R O P S H I R E C O U N T Y
P E N S I O N F U N D
M E R C E R 28
Employer
Primary rate2017/18 to
2019/20
Secondary rates Total Contribution rates
2017/18 2018/19 2019/20 2017/18 2018/19 2019/20
Lacon Childe Academy 15.9% £31,200 £32,400 £33,60015.9% plus
£31,20015.9% plus
£32,40015.9% plus
£33,600
Lakelands School 15.1% £45,700 £47,400 £49,10015.1% plus
£45,70015.1% plus
£47,40015.1% plus
£49,100Lawley Village academy 6.9% £1,500 £1,600 £1,600 6.9% plus £1,500 6.9% plus £1,600 6.9% plus £1,600
Madeley Academy 16.1% £10,000 £10,400 £10,80016.1% plus
£10,00016.1% plus
£10,40016.1% plus
£10,800
Morville Academy 12.4% £1,100 £1,100 £1,20012.4% plus
£1,10012.4% plus
£1,10012.4% plus
£1,200
Newport Girls High School 15.2% £13,600 £14,100 £14,60015.2% plus
£13,60015.2% plus
£14,10015.2% plus
£14,600
Oldbury Wells School 15.5% £33,700 £35,000 £36,20015.5% plus
£33,70015.5% plus
£35,00015.5% plus
£36,200
Priorslee Primary Academy 15.3% £13,300 £13,800 £14,30015.3% plus
£13,30015.3% plus
£13,80015.3% plus
£14,300
The Priory School Trust 15.4% £72,300 £75,000 £77,70015.4% plus
£72,30015.4% plus
£75,00015.4% plus
£77,700
Severndale Academy 14.2% £133,800 £138,800 £143,90014.2% plus£133,800
14.2% plus£138,800
14.2% plus£143,900
Shrewsbury MAT 15.5% £123,200 £127,800 £132,50015.5% plus£123,200
15.5% plus£127,800
15.5% plus£132,500
Stokesay Primary School 15.9% £9,100 £9,400 £9,80015.9% plus
£9,10015.9% plus
£9,40015.9% plus
£9,800

A C T U A R I A L V A L U A T I O N A S A T 3 1 M A R C H 2 0 1 6S H R O P S H I R E C O U N T Y
P E N S I O N F U N D
M E R C E R 29
Employer
Primary rate2017/18 to
2019/20
Secondary rates Total Contribution rates
2017/18 2018/19 2019/20 2017/18 2018/19 2019/20
Stottesdon Primary 16.8% £4,200 £4,400 £4,50016.8% plus
£4,20016.8% plus
£4,40016.8% plus
£4,500
The Marches School 14.9% £83,000 £86,100 £89,30014.9% plus
£83,00014.9% plus
£86,10014.9% plus
£89,300
William Brookes School 15.1% £34,500 £35,800 £37,10015.1% plus
£34,50015.1% plus
£35,80015.1% plus
£37,100
Woodside Primary School 14.7% £29,400 £30,500 £31,60014.7% plus
£29,40014.7% plus
£30,50014.7% plus
£31,600
Woodside START Centre 11.7% £8,400 £8,700 £9,00011.7% plus
£8,40011.7% plus
£8,70011.7% plus
£9,000

A C T U A R I A L V A L U A T I O N A S A T 3 1 M A R C H 2 0 1 6S H R O P S H I R E C O U N T Y
P E N S I O N F U N D
M E R C E R 30
Employer
Primary rate2017/18 to
2019/20
Secondary rates Total Contribution rates
2017/18 2018/19 2019/20 2017/18 2018/19 2019/20
Admitted bodies (community)
Accord Housing Association 20.6% £44,100 £44,100 £44,10020.6% plus
£44,10020.6% plus
£44,10020.6% plus
£44,100Age UK Shropshire andTelford Wrekin
26.1% *£10,800 *£10,700 *£10,50026.1% plus*£10,800
26.1% plus*£10,700
26.1% plus*£10,500
Care Quality Commission 22.0% £51,800 £51,800 £51,800 22% plus £51,800 22% plus £51,800 22% plus £51,800Coverage Care - CrowmoorHouse
19.1% -2.9% -2.9% -2.9% 16.2% 16.2% 16.2%
Coverage Care Ltd 21.3% £155,300 £155,300 £155,30021.3% plus£155,300
21.3% plus£155,300
21.3% plus£155,300
Harper Adams UniversityCollege
14.3% £220,800 £229,000 £237,40014.3% plus£220,800
14.3% plus£229,000
14.3% plus£237,400
Ironbridge Gorge MuseumTrust
23.2% £47,500 £47,500 £47,50023.2% plus
£47,50023.2% plus
£47,50023.2% plus
£47,500Meres & Mosses 21.0% -0.4% -0.4% -0.4% 20.6% 20.6% 20.6%Severn Gorge CountrysideTrust
17.6% £2,800 £2,900 £3,00017.6% plus
£2,80017.6% plus
£2,90017.6% plus
£3,000Severnside HousingAssociation
18.8% £282,500 £282,500 £282,50018.8% plus£282,500
18.8% plus£282,500
18.8% plus£282,500
Shropshire Association ofLocal Councils
20.0% £2,300 £2,400 £2,500 20% plus £2,300 20% plus £2,400 20% plus £2,500
South Shropshire HousingAssociation
27.1% £139,900 £139,900 £139,90027.1% plus£139,900
27.1% plus£139,900
27.1% plus£139,900

A C T U A R I A L V A L U A T I O N A S A T 3 1 M A R C H 2 0 1 6S H R O P S H I R E C O U N T Y
P E N S I O N F U N D
M E R C E R 31
Employer
Primary rate2017/18 to
2019/20
Secondary rates Total Contribution rates
2017/18 2018/19 2019/20 2017/18 2018/19 2019/20
Wrekin Housing Trust 14.5% £517,800 £537,000 £556,80014.5% plus£517,800
14.5% plus£537,000
14.5% plus£556,800

A C T U A R I A L V A L U A T I O N A S A T 3 1 M A R C H 2 0 1 6S H R O P S H I R E C O U N T Y
P E N S I O N F U N D
M E R C E R 32
Employer
Primary rate2017/18 to
2019/20
Secondary rates Total Contribution rates
2017/18 2018/19 2019/20 2017/18 2018/19 2019/20
Admitted bodies (contractor)AIP - Ludlow School 23.8% -2% -2% -2% 21.8% 21.8% 21.8%AIP - SAT 21.5% Nil Nil Nil 21.5% 21.5% 21.5%AIP - Oldbury Wells 20.2% -0.8% -0.8% -0.8% 19.4% 19.4% 19.4%Catering Academy Ltd -Priory School
18.0% Nil Nil Nil 18% 18% 18%
Churchillls 27.1% -23.8% -23.8% -23.8% 3.3% 3.3% 3.3%HALO Leisure Services 20.1% Nil Nil Nil 20.1% 20.1% 20.1%Midland Heart Ltd 19.8% -0.8% -0.8% -0.8% 19% 19% 19%Mouchel Ltd 20.9% Nil Nil Nil 20.9% 20.9% 20.9%RAPT 15.5% -0.8% -0.8% -0.8% 14.7% 14.7% 14.7%Ringway 21.2% -10.1% -10.1% -10.1% 11.1% 11.1% 11.1%Santuary Group 19.7% -0.5% -0.5% -0.5% 19.2% 19.2% 19.2%Shropshire County LeisureTrust
17.2% -1.5% -1.5% -1.5% 15.7% 15.7% 15.7%
South Shropshire LeisureLtd
14.2% £2,600 £2,700 £2,80014.2% plus
£2,60014.2% plus
£2,70014.2% plus
£2,800Taylor Shaw - Bridgnorth 20.2% -5.6% -5.6% -5.6% 14.6% 14.6% 14.6%Telford & Wrekin ServicesLtd
21.1% -6.2% -6.2% -6.2% 14.9% 14.9% 14.9%
The Boathouse Ellesmere 21.6% £600 £600 £600 21.6% plus £600 21.6% plus £600 21.6% plus £600Veolia 20.0% -6.3% -6.3% -6.3% 13.7% 13.7% 13.7%

A C T U A R I A L V A L U A T I O N A S A T 3 1 M A R C H 2 0 1 6S H R O P S H I R E C O U N T Y
P E N S I O N F U N D
M E R C E R 33
Employer
Primary rate2017/18 to
2019/20
Secondary rates Total Contribution rates
2017/18 2018/19 2019/20 2017/18 2018/19 2019/20
Employers grouped with CouncilAquarius 14.1% 5.9% 5.9% 5.9% 20% 20% 20%Bethphage 14.8% 9.4% 9.4% 9.4% 24.2% 24.2% 24.2%Charlton School 14.1% 5.9% 5.9% 5.9% 20% 20% 20%Energize 14.8% 9.4% 9.4% 9.4% 24.2% 24.2% 24.2%Ercall Wood School 14.1% 5.9% 5.9% 5.9% 20% 20% 20%Greenacres School 14.8% 9.4% 9.4% 9.4% 24.2% 24.2% 24.2%Holy Trinity Academy (T&W) 14.1% 5.9% 5.9% 5.9% 20% 20% 20%Moorfield Primary School 14.1% 5.9% 5.9% 5.9% 20% 20% 20%The Strettons Mayfair Trust 14.8% 9.4% 9.4% 9.4% 24.2% 24.2% 24.2%

A C T U A R I A L V A L U A T I O N A S A T 3 1 M A R C H 2 0 1 6S H R O P S H I R E C O U N T Y
P E N S I O N F U N D
M E R C E R 34
Employer
Primary rate2017/18 to
2019/20
Secondary rates Total Contribution rates
2017/18 2018/19 2019/20 2017/18 2018/19 2019/20
Post valuation employersAddaction 18.8% Nil Nil Nil 18.8% 18.8% 18.8%AIP – Grange Primary 20.0% Nil Nil Nil 20% 20% 20%AIP - The Priory AcademyTrust (St Martins)
19.9% Nil Nil Nil 19.9% 19.9% 19.9%
AIP – Thomas Adams 19.7% Nil Nil Nil 19.7% 19.7% 19.7%Alveley Primary School 15.0% £4,800 £5,000 £5,200 15% plus £4,800 15% plus £5,000 15% plus £5,200Arch Initiatives 19.3% Nil Nil Nil 19.3% 19.3% 19.3%Dawley CE PrimaryAcademy
16.8% £17,100 £17,700 £18,40016.8% plus
£17,10016.8% plus
£17,70016.8% plus
£18,400
Ellesmere Primary Academy 15.7% £33,400 £34,600 £35,90015.7% plus
£33,40015.7% plus
£34,60015.7% plus
£35,900Enterprise South WestShropshire
17.6% Nil Nil Nil 17.6% 17.6% 17.6%
Fields Multi Academy Trust 16.5% £20,300 £21,100 £21,90016.5% plus
£20,30016.5% plus
£21,10016.5% plus
£21,900Ford Parish Council 9.9% -0.4% -0.4% -0.4% 9.5% 9.5% 9.5%Great Hanwood ParishCouncil
9.9% Nil Nil Nil 9.9% 9.9% 9.9%
Ludlow Infants School 16.4% £13,800 £14,300 £14,80016.4% plus
£13,80016.4% plus
£14,30016.4% plus
£14,800
Ludlow Junior School 16.3% £19,400 £20,100 £20,90016.3% plus
£19,40016.3% plus
£20,10016.3% plus
£20,900Oakengates Town Council 14.7% £500 £500 £500 14.7% plus £500 14.7% plus £500 14.7% plus £500

A C T U A R I A L V A L U A T I O N A S A T 3 1 M A R C H 2 0 1 6S H R O P S H I R E C O U N T Y
P E N S I O N F U N D
M E R C E R 35
Employer
Primary rate2017/18 to
2019/20
Secondary rates Total Contribution rates
2017/18 2018/19 2019/20 2017/18 2018/19 2019/20
St George's and PriorsleeParish Council
17.9% Nil Nil Nil 17.9% 17.9% 17.9%
Veolia ES UK Ltd 19.8% Nil Nil Nil 19.8% 19.8% 19.8%
Other interested bodies with no pensionable employees
Notes:
1. Cash payments in respect of £ lump sums marked * are payable by 30 April 2017. Cash payments in respect of £ lump sums marked ** are payable by 30April of the year in which they are due. These amounts have been reduced to reflect this early payment;
2. With the agreement of the Administering Authority employers may also opt to pay any other element of their employer contributions early, with either allthree years being paid in April 2017 or payment being made in the April of the year in question. The cash amounts payable will be reduced in return for thisearly payment as follows:
• Payments made in the April of the certified year will be reduced by 2.2% (i.e. the above amounts will be multiplied by 0.978)• 2018/19 payments made in April 2017 will be reduced by 6.5% (i.e. the above amounts will be multiplied by 0.935)• 2019/20 payments made in April 2017 will be reduced by 10.5% (i.e. the above amounts will be multiplied by 0.895)
Where an employer pays its % contributions early, it will need to estimate in advance the pensionable pay for the entire period, and a balancing adjustmentto reflect the actual pensionable pay over the period would be made at the end of the period (no later than 19th April or 22nd April as appropriate followingthe year end).
EmployerProportion of Pension
Increases to be Recharged%
Alveley Parish Council 100Drayton in Hales Burial Joint Committee 100Shropshire Adult College 100

A C T U A R I A L V A L U A T I O N A S A T 3 1 M A R C H 2 0 1 6S H R O P S H I R E C O U N T Y
P E N S I O N F U N D
M E R C E R 36
3. The percentages shown are percentages of pensionable pay and apply to all members, including those who are members under the 50:50 option under theLGPS from 1 April 2014;
4. The total contributions payable by each employer each year will be subject to a minimum of zero;
5. In cases where an element of an existing Scheme Employer’s deficit is transferred to a new employer on its inception, the Scheme Employer’s deficitrecovery contributions shown in this certificate may be reallocated between the Scheme Employer and the new employer to reflect this, on advice from theactuary.
6. There are a number of additional employers who no longer had any active members within the Fund as at the valuation date. Any final contributionrequirement for these employers will be assessed by the Fund in due course on the basis of actuarial advice.

A C T U A R I A L V A L U A T I O N A S A T 3 1 M A R C H 2 0 1 6S H R O P S H I R E C O U N T Y
P E N S I O N F U N D
M E R C E R 37
GLOSSARY
Actuarial Valuation: an investigation by an actuary into the ability of the Fund to meet its liabilities.For the LGPS the Fund Actuary will assess the funding level of each participating employer andagree contribution rates with the administering authority to fund the cost of new benefits and makegood any existing deficits as set out in the separate Funding Strategy Statement.
Best Estimate Assumption: an assumption where the outcome has a 50/50 chance of beingachieved.
Bonds: loans made to an issuer (often a government or a company) which undertakes to repay theloan at an agreed later date. The term refers generically to corporate bonds or government bonds(gilts).
Career Average Revalued Earnings Scheme (CARE): with effect from 1 April 2014, benefitsaccrued by members in the LGPS take the form of CARE benefits. Every year members will accruea pension benefit equivalent to 1/49th of their pensionable pay in that year. Each annual pensionaccrued receives inflationary increases (in line with the annual change in the Consumer PricesIndex) over the period to retirement.
Corporate Bond Basis: an approach where the discount rate used to assess the liabilities isdetermined based on the market yields of high quality corporate bond investments (usually at leastAA rated) based on the appropriate duration of the liabilities being assessed. This is usuallyadopted when an employer is exiting the Fund.
CPI: acronym standing for “Consumer Prices Index”. CPI is a measure of inflation with a basket ofgoods that is assessed on an annual basis. The reference goods and services differs from those ofRPI. These goods are expected to provide lower, less volatile inflation increases. Pensionincreases in the LGPS are linked to the annual change in CPI.
Deficit: the extent to which the value of the Fund’s past service liabilities exceeds the value of theFund’s assets.
Discount Rate: the rate of interest used to convert a cash amount e.g. future benefit paymentsoccurring in the future to a present value.
Employer Covenant: the degree to which an employer participating in an occupational pensionscheme is willing and able to meet the funding requirements of the scheme.
Employer's Future Service Contribution Rate: the contribution rate payable by an employer,expressed as a % of pensionable pay, as being sufficient to meet the cost of new benefits beingaccrued by active members in the future. The cost will be net of employee contributions and willinclude an allowance for the expected level of administrative expenses.

A C T U A R I A L V A L U A T I O N A S A T 3 1 M A R C H 2 0 1 6S H R O P S H I R E C O U N T Y
P E N S I O N F U N D
M E R C E R 38
Equities: shares in a company which are bought and sold on a stock exchange.
Solvency/Funding Level: the ratio of the value of the Fund’s assets and the value of the Fund’sliabilities expressed as a percentage.
Funding Strategy Statement: This is a key governance document that outlines how theadministering authority will manage employer’s contributions to the Fund.
Solvency Funding Target: an assessment of the present value of benefits to be paid in the future.The desired funding target is to achieve a solvency level of a 100% i.e. assets equal to the pastservice liabilities assessed on the ongoing concern basis.
Investment Strategy: the long-term distribution of assets among various asset classes that takesinto account the Funds objectives and attitude to risk.
Past Service Liabilities: this is the present value of the benefits accrued by members up to thevaluation date. It is assessed based on a set of assumptions agreed between the AdministeringAuthority and the Actuary.
Prepayment: the payment by employers of contributions to the Fund earlier than that certified bythe Actuary. The amount paid will be reduced compared to the certified amount to reflect the earlypayment.
Present Value: the value of projected benefit payments, discounted back to the valuation date.
Primary rate of the employers’ contribution: the contribution rate required to meet the cost of thefuture accrual of benefits including ancillary, death in service and ill health benefits together withadministration costs. It is expressed as a percentage of pensionable pay, ignoring any past servicesurplus or deficit, but allowing for any employer-specific circumstances, such as its membershipprofile, the funding strategy adopted for that employer, the actuarial method used and/or theemployer’s covenant. The Primary rate for the whole fund is the weighted average (by payroll) ofthe individual employers’ Primary rates.
Prudent Assumption: an assumption where the outcome has a greater than 50/50 chance of beingachieved i.e. the outcome is more likely to be overstated than understated. Legislation requires theassumptions adopted for an actuarial valuation to be prudent.
Real Return or Real Discount Rate: a rate of return or discount rate net of CPI inflation.
Recovery Plan: a strategy by which an employer will make up a funding deficit over a specifiedperiod of time (“the recovery period”, as set out in the Funding Strategy Statement.
Secondary rate of the employers’ contribution: an adjustment to the Primary rate to reflect any pastservice deficit or surplus, to arrive at the rate each employer is required to pay. The Secondaryrate may be expressed as a percentage adjustment to the Primary rate, and/or a cash adjustmentin each of the three years beginning 1 April in the year following that in which the valuation datefalls. The Secondary rate is specified in the rates and adjustments certificate. For any employer,the rate they are actually required to pay is the sum of the Primary and Secondary rates.

A C T U A R I A L V A L U A T I O N A S A T 3 1 M A R C H 2 0 1 6S H R O P S H I R E C O U N T Y
P E N S I O N F U N D
M E R C E R 39
Secondary rates for the whole fund in each of the three years shall also be disclosed. These willbe calculated as the weighted average based on the whole fund payroll in respect of percentagerates and as a total amount in respect of cash adjustments.
50/50 Scheme: in the LGPS, active members are given the option of accruing a lower benefit in the50/50 Scheme, in return for paying a lower level of contribution.

A C T U A R I A L V A L U A T I O N A S A T 3 1 M A R C H 2 0 1 6S H R O P S H I R E C O U N T Y
P E N S I O N F U N D
M E R C E R L I M I T E DNo 4 St Paul’s Square,Old Hall Street,Liverpool,L3 9SJwww.mercer.com
Mercer Limited is authorised and regulated by the Financial Conduct AuthorityRegistered in England No. 984275 Registered Office: 1 Tower Place West, Tower Place, London, EC3R 5BU