Activity-Based Costing and Just-In-Time Costing · chapter 5 Activity-Based Costing and ....
42
chapter 5 Activity-Based Costing and Just-In-Time Costing Learning Objectives After studying Chapter 5, you will be able to: • Explain the interrelationships among cost drivers, activities, and products in an activity-based cost system. • Describe the key components and cost flows in an activity-based cost system. • Distinguish between the two stages of cost allocation in an activity-based cost system. • Apply activity-based costing in a manufacturing setting. • Understand how activity-based costing is extended to nonmanufacturing settings. • Relate activity-based management to activity-based costing. • Describe the key elements of a just-in-time cost system. Chris Cheadle / All Canada Photos / SuperStock
Transcript of Activity-Based Costing and Just-In-Time Costing · chapter 5 Activity-Based Costing and ....

chapter 5
Activity-Based Costing and Just-In-Time Costing
Learning Objectives
After studying Chapter 5, you will be able to:
• Explain the interrelationships among cost drivers, activities, and products in an activity-based cost system.
• Describe the key components and cost flows in an activity-based cost system.
• Distinguish between the two stages of cost allocation in an activity-based cost system.
• Apply activity-based costing in a manufacturing setting.
• Understand how activity-based costing is extended to nonmanufacturing settings.
• Relate activity-based management to activity-based costing.
• Describe the key elements of a just-in-time cost system.
Chris Cheadle / All Canada Photos / SuperStock
sch80342_05_c05_181-222.indd 181 12/20/12 11:52 AM

CHAPTER 5Chapter Outline
Chapter Outline
5.1 Activity-Based CostingIssues Influencing Cost Management Systems DesignDefinition of Activity-Based CostingFlow of Costs Under Activity-Based CostingInfluence of Production Complexity
5.2 A Comprehensive Activity-Based Cost ExamplePreliminary Stage AllocationPrimary Stage AllocationComparing ABC to Traditional Volume-Based Costing
5.3 ABC and Nonmanufacturing Activities
5.4 Activity-Based Management
5.5 JIT CostingTesting . . . Testing
Cortell Laboratories was formed in 1993 and began its operations in testing vari-ous electrical characteristics of integrated circuits sent to it by manufacturers on the west coast. Cortell focused on a strategy of providing quicker turnaround times than had been offered by manufacturers’ labs or other outside labs. The strategy was successful and was marketed well. Within ten years, Cortell had annual revenues of over $30 million. Profit and cash flow, also highly positive, allowed Cortell to self-fund all expansion.
In 2010, Cortell began offering tests for transformers. Within one year, transformer testing was so successful that the lab was now running on three full shifts. In the midst of all this success, Harriet Cortell, the company president, is now faced with a dilemma. The marketing manager, Beth Jacobs, has come to her and argued that test-ing transformers is much more profitable than testing integrated circuits, and there-fore, the lab should concentrate more of its resources on marketing and performing transformer tests. To support her argument, Jacobs compiled costs and profit margins for each testing service. These figures showed that transformer testing was over 40 percent more profitable than testing integrated circuits. Cortell looked at the overhead allocated to the two types of tests and could hardly believe that each test was assigned the same amount of overhead per test. She knew that testing transformers involved more job orders and required more setups than testing integrated circuits. “Our cost-ing system is not reflecting the complexity of these tests,” claimed Cortell.
Several months earlier, Cortell had heard about an activity-based cost approach for assigning overhead costs. She immediately contacted the controller, Bill Kelector, and asked him to do an activity-based cost analysis.
sch80342_05_c05_181-222.indd 182 12/20/12 11:52 AM

CHAPTER 5Introduction
Introduction
Two major forces have combined to put great pressure on managerial accountants like Bill Kelector to provide improved cost information about their firms’ products and
services. These are global competition and automation in the workplace.
1. Global competitiveness. Most companies in nearly every industry face increased competition from direct competitors, whether from across the street or halfway around the world. Whether the technology is old (making iron and steel) or new (making high-definition televisions), the needs for accurate and relevant product cost data have grown dramatically. Competitiveness also means knowing the costs of product quality, reliable delivery, and waste (unproductive effort). Cost control takes on new meaning if a competitor can sell an item at a price that is 10 percent lower than another company’s production cost and still make money on the sale. Increasingly, companies are realizing that traditional volume-based cost systems are not using the “right” variables or collecting cost data in enough detail.
2. Automation of the workplace. Dramatic changes in production have also taken place. Another “industrial revolution” is what some people have called it. Com-puter power has introduced concepts like computer-aided design (CAD), computer-aided manufacturing (CAM), flexible manufacturing systems (FMS), and robotics. Computer power has allowed precise tasks to be programmed and machines to be designed to do those tasks. Likewise, computer power has enabled production managers to coordinate thousands of events, transactions, and possible courses of action. One outcome is a shift from heavy dependence on labor to technology. Direct labor costs were often a major product cost, and labor activity often reflected gen-eral activity in the plant. Now, in many companies, direct labor is a minor portion of a product’s total cost. Other production costs have grown tremendously because of equipment costs and support personnel needed to coordinate production. New activity measures are needed to link resources used with production activities. The traditional approach of allocating overhead costs using direct labor hours or direct labor cost is no longer relevant in companies that are highly automated.
Competition and automation have focused attention on getting more accurate, timely, and relevant costs for products and services. The concepts are very simple and have always been at the heart of cost accounting: Link the cost of resources used to the activity using the resources, and link the activity to the product being produced. Traditionally, the activ-ity measure used most often has been a volume measure: direct labor hours (or dollars). In recent years, there has been a recognition that the complexity of production, rather than volume, is the most important determinant of overhead costs. Cost systems known as activity-based costing reflect this new orientation.
Consider the following example of a company that manufactures ball-point pens in two different plants. In one plant, plant A, 30,000 identical pens are produced—all with black ink and black casings. In the other plant, plant B, 30,000 similar pens are also produced, but 10,000 have black ink, another 10,000 have blue ink, and the remaining 10,000 contain red ink. Likewise, those in plant B have a variety of casing colors: 8,000 are black, 12,000 are gold, and 10,000 are silver. Since each plant manufactures 30,000 pens, the amount of direct labor hours worked would be expected to be virtually the same in each plant. Therefore, using direct labor to allocate overhead costs to the two plants would result in
sch80342_05_c05_181-222.indd 183 12/20/12 11:52 AM

CHAPTER 5Section 5.1 Activity-Based Costing
the same amount of overhead costs assigned to each plant. Yet, plant B clearly consumes more overhead costs such as indirect labor costs relating to more machine change-overs, time spent on purchasing materials, and inventory management time. In other words, plant B manufactures more complex products, but traditional costing that uses direct labor to allocate overhead costs ignores this complexity. Activity-based costing not only considers volume when assigning overhead costs, but does so in ways that reflect the complexity of the various products.
This chapter presents the conceptual foundation for activity-based costing as a means of improving the accuracy of assigning costs to cost objectives—primarily to products and services. Many companies that have adopted activity-based cost systems have also insti-tuted just-in-time inventory systems. Later in the chapter, we discuss how adoption of just-in-time inventory systems has affected product costing.
5.1 Activity-Based Costing
Activity-based costing focuses on finding the cost of producing a product or service. In Chapter 1, we introduced cost of goods manufactured and the three traditional
groups of costs: direct materials, direct labor, and factory overhead. In past years, direct materials and direct labor were linked with products because of their obvious direct rela-tionships; all other manufacturing costs were traditionally lumped together as overhead. One activity measure, often direct labor, was used to attach all overhead costs to products. Many different overhead costs were combined and included:
1. Plant supervision salaries.2. Materials handling costs.3. Plant engineering costs.4. Setup or changeover costs.5. Supplies and indirect materials.6. Depreciation, taxes, and insurance on equipment.7. Energy and other utility costs.8. Repair and maintenance costs.
Ideally, every overhead cost item could be traced directly to specific products. This is just not possible. If we produce a million units of different types and sizes of batteries in a fac-tory, can the manager’s $100,000 salary be traced to the different batteries? No. Can we link the manager’s salary to certain factory activities, then link the activity costs to the dif-ferent batteries? Yes, but only with careful analysis and application. Activity-based cost-ing focuses on distributing costs that managers are unable to clearly identify with specific jobs or products (i.e., indirect costs).
Issues Influencing Cost Management Systems Design
Product costs are so critical to managerial decisions that greater precision and accuracy are needed today than were demanded in the past. Thus, a major effort is under way in many companies to upgrade their cost systems.
sch80342_05_c05_181-222.indd 184 12/20/12 11:52 AM

CHAPTER 5Section 5.1 Activity-Based Costing
The level of detail that a cost system needs is based on the following considerations:
1. The competitive environment, which will impact the degree of accuracy needed and the toleration of costing errors.
2. The homogeneity or heterogeneity of the products or services.3. The complexity of the production process.4. The volumes of each product or service produced.5. The costs of measuring and collecting activity and cost data.6. The impacts that more accurate and relevant data will have on managerial
behavior.
Detailed cost systems are expensive to design and to operate. Yet the value of better cost information can also be extremely high.
Definition of Activity-Based Costing
Activity-based costing (ABC) is a system of accounting that focuses on activities per-formed to produce products or services. Activities become the fundamental cost accumu-lation points. This is because it is activities such as purchasing, moving materials, and machine set-up that cause overhead costs to be incurred. Costs are traced to activities, and activities are traced to products based on each product’s use of the activities. We show these relationships for allocating costs in Figure 5.1.
Figure 5.1: An overall view of ABC cost linkgage
Under activity-based costing, an effort is made to identify and account for as many costs as possible as direct costs of production. Any cost that can reasonably be traced to a particular product or service is treated as a direct cost. For example, under the traditional cost system, the cost of setup time (the factory downtime incurred in converting from producing one product to another) is included in manufacturing overhead and applied to products on the basis of direct labor hours. Under ABC, setup time might be measured for each product line, and setup costs would be directly assigned to each part or product manufactured.
An ABC system identifies the major activities in a production process, aggregates those activities into activity centers, accumulates costs in activity centers, selects cost drivers that link activities to products, and assigns the costs of activities to products. We show this process in Figure 5.2. An activity center is a segment of the organization for which management wants the costs of a set of activities to be reported separately. A mechanism called a cost driver is used for linking a given activity’s pool of costs. A cost driver is an event, action, or activity that results in cost incurrence. It is any factor that causes costs to change. The basic concept is that cost drivers, such as number of purchase orders issued, measure the amount of resources a specific product uses. A cost function is created from the activity’s planned costs and cost driver activity level.
Products or ServicesResources
(Costs)Activities
An Overall View of ABC Cost Linkage
sch80342_05_c05_181-222.indd 185 12/20/12 11:52 AM

CHAPTER 5Section 5.1 Activity-Based Costing
Figure 5.2: An overall view of the ABC process
Although not always obvious, several different cost drivers could link an activity’s costs and the cost objective. In the materials handling case in Figure 5.2, four possible cost driv-ers are listed. Assume that pounds of materials moved is considered to be the most appropri-ate cost driver. We therefore divide the planned materials handling costs by the planned pounds to be moved. Cost per pound moved is the cost function. Then, the actual pounds handled in the production of a product times the cost per pound moved is the amount of materials handling costs assigned to that product. Again, the overall process is to identify the best cost driver that links costs and activities and then to use that cost driver to link activities with products (or other cost objectives).
Flow of Costs Under Activity-Based Costing
In applying ABC to a specific organization, we follow five basic steps:
1. Assemble similar actions into activity centers.2. Classify costs by activity center and by type of expense.3. Select cost drivers.4. Calculate a cost function to link costs and cost drivers with resource use.5. Assign costs to the cost objective—often the product cost.
These steps are consistent with Figure 5.2.
Step 1: Assemble Similar Actions into Activity Centers. The number of actions per-formed in any organization can be quite numerous. Although the ideal is to relate the cost of every action to a cost driver and then to the product, the costs of doing this can far exceed
Example: Moving and handling materials in the factory
Group similaractivities
Define activitycenters
Classify activitycenter costs
Identify costdrivers
Estimate costdriver activity
Create costdriver costfunction
Measure actualcost driver
activity
Assign coststo cost
objective
All activities thatmove materials,
parts, andproducts inthe plant
Materialshandling
Labor costsEquipment costsSupplies costs
Equipment repairs
Pounds movedPieces movedDollar value of materials movedNumber of parts moved
Plannedactivity Actual
activity
Materialshandling costsassigned toproductsproduced
Cost per pound movedCost per piece movedCost per dollar of materials movedCost per part number moved
sch80342_05_c05_181-222.indd 186 12/20/12 11:52 AM

CHAPTER 5Section 5.1 Activity-Based Costing
the benefits. Therefore, we combine actions into activity centers. Treating collections of actions as activity centers eliminates the need to measure and track the performance of numerous individual actions and costs.
One meaningful way of grouping actions is to classify them with different levels of activi-ties. A common outline is unit-level activities, batch-level activities, product-level activi-ties, and facility-level activities. Figure 5.3 illustrates the four types. Unit-level activities are performed each time a unit is produced or handled. These are repetitive activities. Direct labor or machining activities are examples. Costs of these activities vary with the number of units produced. Batch-level activities are performed each time a batch of goods is produced or handled. Machine setups, order processing, and materials han-dling are related to batches rather than individual units. The costs of these activities vary according to the number of batches but are common or fixed for all units in the batch. Product-level activities are those performed as needed to support the production of each different type of product or service. Maintaining bills of materials and routing infor-mation, processing engineering changes, and performing testing routines are examples of activities in this category. Facility-level activities are those which simply sustain a facil-ity’s general production process. Examples would include plant supervision and building occupancy. These costs are common to a variety of products and are the most difficult to link to product-specific activities. For this reason, many people question whether facility-level costs should be linked to products.
Figure 5.3: Levels of ABC activity groups
Unit-Level ActivitiesActivites: Assembly Stamping Machining
Resources used: Direct labor Direct materials Supplies ElectricityCost drivers: Direct labor hours Machine hours Number of units produced
Batch-Level ActivitiesActivites: Batch changovers (setups) Materials handling Order processing InspectionsResources used: Labor costs of setups Labor costs of materials handling Labor costs to process orders Labor costs to inspectCost drivers: Number of batches Number of setups Number of orders processed
Product-Level ActivitiesActivites: Production scheduling Product designing Parts and product testing Special handling and storingResources used: Specialized equipment Labor costs of design Testing facility costsCost drivers: Number of products Number of parts
Facility-Level ActivitiesActivites: Plant supervision Building occupancy Personnel administration
Resources used: Plant depreciation Insurance and property taxes Salaries of plant managementCost drivers: Number of employees Number of units produced Labor hours
sch80342_05_c05_181-222.indd 187 12/20/12 11:52 AM
CHAPTER 5Section 5.1 Activity-Based Costing
Traditionally, we classify overhead costs as variable or fixed. Relative to volume of out-puts, costs of unit-level activities are predominately variable while costs of the other three levels are predominately fixed. However, identifying batch-, product-, and facility-level activity centers helps in selecting cost drivers. Often, the cost perspective changes; many costs that are fixed relative to units of output are now variable relative to the cost driver. This is particularly true for batch- and product-level activities. Costs of facility-level activities remain primarily in the fixed category and are often apportioned or allocated to products in some arbitrary manner.
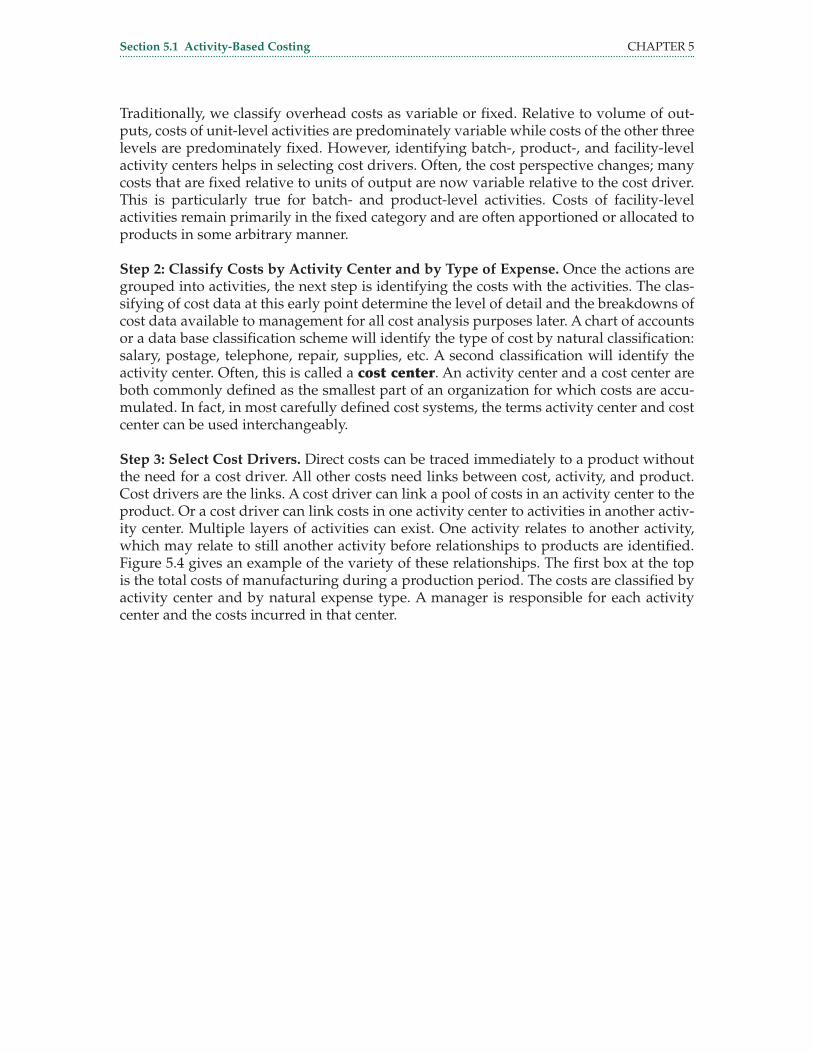
Step 2: Classify Costs by Activity Center and by Type of Expense. Once the actions are grouped into activities, the next step is identifying the costs with the activities. The clas-sifying of cost data at this early point determine the level of detail and the breakdowns of cost data available to management for all cost analysis purposes later. A chart of accounts or a data base classification scheme will identify the type of cost by natural classification: salary, postage, telephone, repair, supplies, etc. A second classification will identify the activity center. Often, this is called a cost center. An activity center and a cost center are both commonly defined as the smallest part of an organization for which costs are accu-mulated. In fact, in most carefully defined cost systems, the terms activity center and cost center can be used interchangeably.
Step 3: Select Cost Drivers. Direct costs can be traced immediately to a product without the need for a cost driver. All other costs need links between cost, activity, and product. Cost drivers are the links. A cost driver can link a pool of costs in an activity center to the product. Or a cost driver can link costs in one activity center to activities in another activ-ity center. Multiple layers of activities can exist. One activity relates to another activity, which may relate to still another activity before relationships to products are identified. Figure 5.4 gives an example of the variety of these relationships. The first box at the top is the total costs of manufacturing during a production period. The costs are classified by activity center and by natural expense type. A manager is responsible for each activity center and the costs incurred in that center.
sch80342_05_c05_181-222.indd 188 12/20/12 11:52 AM
CHAPTER 5Section 5.1 Activity-Based Costing
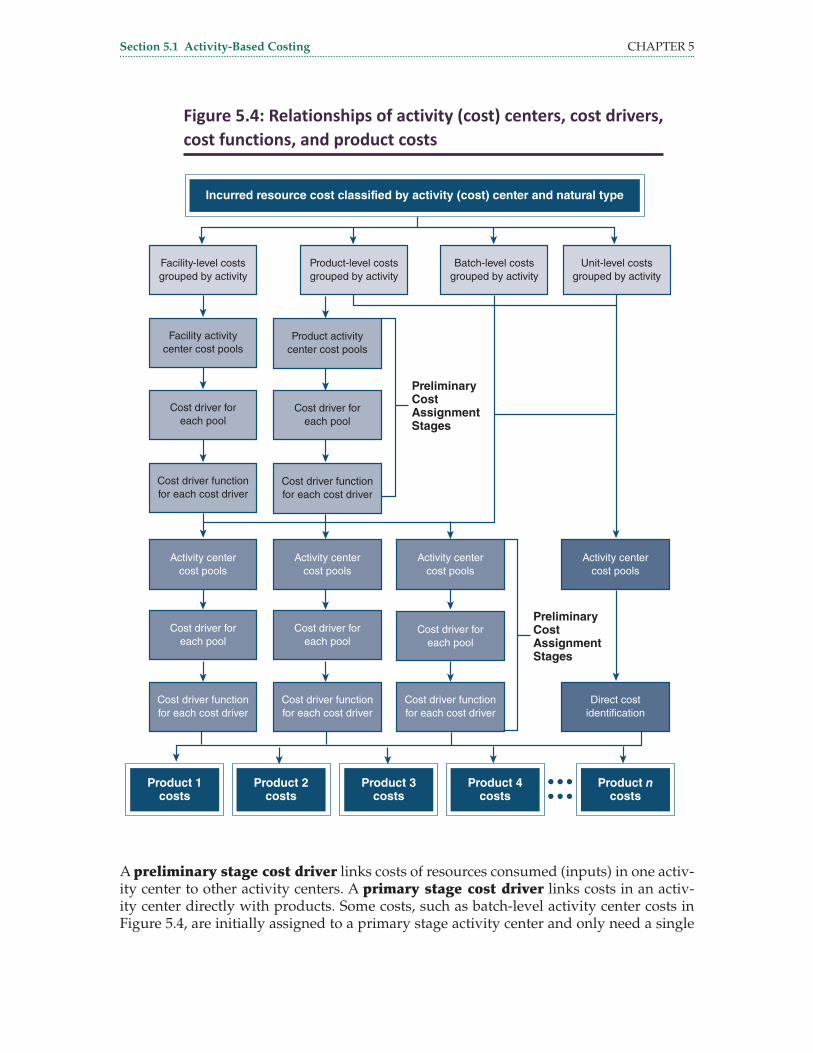
Figure 5.4: Relationships of activity (cost) centers, cost drivers, cost functions, and product costs
A preliminary stage cost driver links costs of resources consumed (inputs) in one activ-ity center to other activity centers. A primary stage cost driver links costs in an activ-ity center directly with products. Some costs, such as batch-level activity center costs in Figure 5.4, are initially assigned to a primary stage activity center and only need a single
Direct costidentification
Activity centercost pools
Activity centercost pools
Activity centercost pools
Activity centercost pools
Cost driver foreach pool
Cost driver foreach pool
Cost driver foreach pool
Cost driver functionfor each cost driver
Cost driver functionfor each cost driver
Cost driver functionfor each cost driver
Facility activitycenter cost pools
Product activitycenter cost pools
Cost driver foreach pool
Cost driver foreach pool
Cost driver functionfor each cost driver
Cost driver functionfor each cost driver
Facility-level costsgrouped by activity
Product-level costsgrouped by activity
Batch-level costsgrouped by activity
Unit-level costsgrouped by activity
Incurred resource cost classified by activity (cost) center and natural type
Product 1costs
Product 2costs
Product 3costs
Product 4costs
Product ncosts
PreliminaryCostAssignmentStages
PreliminaryCostAssignmentStages
sch80342_05_c05_181-222.indd 189 12/20/12 11:52 AM

CHAPTER 5Section 5.1 Activity-Based Costing
stage assignment process. These primary stage centers may collect reassigned costs from numerous preliminary stage activity centers—based on cost drivers that reflect activities and resources used.
The activity centers are typically one of four types, as described above. Direct costs of unit-level activity centers are assumed in Figure 5.4 to be always traceable to specific products. Batch-level activity center costs should also be traceable to specific products but often use a cost driver. Product-level activity center costs may be related to a specific product or may be grouped by activities before being assigned to products at the pri-mary stage. Facility-level activity center costs may go through multiple preliminary stages before being assigned to products.
ABC systems differ from traditional volume-based cost accounting systems in the num-ber and variety of cost drivers used to trace costs. Traditional cost accounting systems use very few drivers—often only direct labor hours or dollars, which are related to vol-ume of production. ABC systems, on the other hand, may use a multitude of cost drivers (for many different costs) that relate costs more closely to resources consumed and the activities occurring. In this way, ABC systems reflect the complexity of production and not just volume. Although not comprehensive, Figure 5.5 gives examples of cost drivers that might be found in an ABC system.
Figure 5.5: Common cost drivers used in actual ABC systems
Number of products or units. Number of machine hours used.
Number of labor minutes per piece. Number of vendors.
Amount of labor cost incurred. Number of purchasing and ordering hours.
Value of materials in a product. Numberofcustomeroptionsperproduct.
Number of materials moves. Number of accessories.
Number of materials handling hours. Numberoftimesordered.
Numberoftimeshandled. Number of units scrapped.
Number of parts received per month. Number of engineering change orders.
Number of part numbers maintained. Number of die impressions.
Number of part numbers in a product. Number of units reworked.
Amount of hazardous materials. Volume of scrap—by weight or units.
Number of new parts introduced. Number of customer orders processed.
Number of setup hours. Squarefeetusedbyanactivity.
Number of setups. Number of employees.
Accountants must work with management to discover and identify activities and cost drivers. This is done through interviewing, process observation, simulation, diagram-ming, and analysis of current information systems.
Step 4: Calculate a Cost Function. Managers choose a driver for each of the cost pools to determine a rate per cost driver unit, a percentage of other cost amounts, or an allocation percentage. This cost function could be based on either planned or actual costs and activ-ity levels. In Chapter 3, we discussed the creation of predetermined overhead rates using
sch80342_05_c05_181-222.indd 190 12/20/12 11:52 AM

CHAPTER 5Section 5.1 Activity-Based Costing
planned costs and activity levels. Using planned activity levels and costs for an example, if costs of the setup activity center cost pool totaled $25,000, if setup hours were the cost driver, and if 500 hours were expected, the cost function would be $50 per setup hour. Costs are then distributed to products as setup hours are incurred. This approach is the same as that discussed in Chapter 3, except for the use of a different type of cost driver.
Step 5: Assign Costs to the Cost Objective. The final step is distributing costs to the users of the resources. The cost pool, the cost driver, and the cost function now combine to deter-mine how much cost is charged to each resource user. If this is at a preliminary stage, the users are predominately other activity centers. Thus, a group of costs are now reassigned to other cost pools based on use. If the activity center is at the primary stage, the users are the products themselves. In the setup example, if 60 hours of setup time were used for Product A’s production, $3,000 would be charged to Product A. All costs entering the manufacturing process during a given time period are eventually assigned to products.
Influence of Production Complexity
The primary goal of ABC for product costing is to generate accurate product costs. In general, this means the cost accounting system must handle the complexity of production while minimizing possible distortions caused by cost assignment processes. Production complexity plays a significant role in determining whether the costs of two or more activi-ties can be combined and traced to a product by means of a single cost driver and still be assigned accurately. If a company wants more accurate product costs, it must increase the number of activity centers, cost pools, and cost drivers. Since the introduction of a new cost driver in the system has a cost/benefit value, most companies face a trade-off between more cost drivers, greater detail, and more expensive data processing versus more data aggregation and less expensive data processing. Two important issues that affect cost driver selection are product diversity and batch-size diversity.
Product diversity refers to the degree to which each product differs in the number of activities (that is, resources or inputs) required. The greater the difference in how two products use resources or inputs, the greater the distortion a single cost driver will make in tracing costs to these products. For example, producing an ornate bathroom faucet fix-ture may consume labor-intensive production resources, while producing a kitchen sink faucet may consume machine-intensive resources. Some products are simply larger than other products. A console model versus a portable model is one example. The size of the product influences how the product is produced and which resources are required.
The complexity of a product is determined by the differences in how a product is manu-factured and by the number of options a manufacturer has for its products. Deluxe models and products with many customer options, for example, increase the manufacturing dif-ficulty. Each option adds an extension to the production process. However, supervision and other departmental costs are not necessarily influenced by these options. Materials inputs may differ by product. Some materials may require more handling from the receiv-ing dock through the storeroom to the production floor. In other cases, certain materials may require longer machining time or more time in trimming processes. Some products may have a high degree of vertical integration, from raw materials to finished products. Others are merely assembled from purchased parts.
sch80342_05_c05_181-222.indd 191 12/20/12 11:52 AM

CHAPTER 5Section 5.2 A Comprehensive Activity-Based Costing Example
Batch-size diversity occurs when products are manufactured in different-size batches. Batches refer not only to production orders but also to order quantities of raw materials and to shipping quantities of finished goods. In an automotive stamping plant, a weekly run of hood stampings for a popular model may be 3,000 units, while a very similar, but higher priced model hood, may have a biweekly run of 500.
Although we normally think of differing batch sizes when we produce different prod-ucts, batch-size diversity can also occur with the same product over time. For instance, this week the production order consists of 500 units. Due to an increase in demand, the production schedule for next week calls for 800 units. Just-in-time production encourages producing only what is needed immediately—often smaller batches and more frequently. Frequent batch runs may also require that more attention be given to minimizing setup time and cost. In traditional cost systems, setup costs are added to other overhead costs, losing the separate identity and cost detail of setup activities. In ABC systems, a separate cost pool for setup costs would typically be formed and would be assigned to products using cost drivers such as setup hours or number of setups. Both of these cost drivers reflect batch-size diversity, with the former measure being more detailed and, thus, often more appropriate.
If computer resources were free and if managers had unlimited amounts of analysis time, more and more detail could be captured and evaluated. Since this is not the case, very practical decisions must be made. In large ABC applications, the number of cost driv-ers (both preliminary and primary) used across an entire facility may be as low as 20 or as high as several hundred. Often, a high percentage of costs are assigned using a small number of drivers. The cost system’s design should allow judgments to be made about the number of cost pools and cost drivers and should allow for cost pools and cost drivers to be changed easily when the need arises.
5.2 A Comprehensive Activity-Based Costing Example
Guttman Cafeterias has just completed the installation of an activity-based cost system. The firm operates cafeterias within office buildings, factories, hospitals, and other
institutions. These cafeterias produce and serve three standard meals: breakfast, lunch, and dinner. Activity centers consist of four support centers and two operating centers. The volume for October is as follows:
Breakfast Lunch Dinner
# of Meals 22,000 15,000 12,000
sch80342_05_c05_181-222.indd 192 12/20/12 11:52 AM

CHAPTER 5Section 5.2 A Comprehensive Activity-Based Costing Example
The activity centers’ traceable costs for October and cost drivers are as follows:
Activity center information
Code Activity center Materials Labor Other costs Cost driver
Support Centers:
120 Occupancy $60,000 Square feet used
130 Data Processing 30,000 Transactions processed
140 Personnel Benefits 9,000 Payroll cost
220 Materials Handling 16,000 Materials cost
Operating Centers:
410 Cooking $18,000 $10,000 20,000 Cooking hours
420 Serving 14,000 20,000 15,000 Serving hours
Total $32,000 $30,000 $150.000
Activities are grouped and activity centers are determined as a result of special studies. Each activity center has one cost driver. For example, the cost driver selected for Occu-pancy is square feet of space used by each activity.
The materials and labor costs are directly traceable to the three meals as follows:
Materials Labor
Breakfast:
Cooking $ 1,000 $ 2,000
Serving 4,000 2,000
Lunch:
Cooking 6,000 2,000
Serving 2,000 8,000
Dinner:
Cooking 11,000 6,000
Serving 8,000 10,000
Total $32,000 $30,000
As for the other costs, cost drivers are selected after analysis of past cost behavior and activity levels within each activity center (i.e., relationship with resource usage). First, the other costs of the support centers are assigned to the operating centers. This is the prelimi-nary stage allocation.
sch80342_05_c05_181-222.indd 193 12/20/12 11:52 AM

CHAPTER 5Section 5.2 A Comprehensive Activity-Based Costing Example
Preliminary Stage Allocation
The cost driver data for the preliminary stage cost assignments are as follows:
Cost driver data—preliminary stage allocation
Activity centers using resources:
Code Activity center Cost driver 410 420
120 Occupancy Square feet used 80,000 40,000
130 Data Processing Transactions processed
120,000 180,000
140 Personnel Benefits Payroll cost $10,000 $20,000
220 Materials Handling Materials cost $18,000 $14,000
Cost functions for each of the support centers are developed as follows:
Activity center Calculation Cost function
Occupancy $60,000/(80,000140,000) $0.50 per square foot
Data Processing $30,000/(120,0001180,000) $0.10 per transaction
Personnel Benefits $9,000/($10,0001$20,000) 30% of payroll cost
Materials Handling $16,000/(18,0001$14,000) 50% of materials cost
Using these cost functions, the following costs are assigned to the two operating centers:
Cooking:
$0.50(80,000) 1 $0.10(120,000) 1 .30($10,000) 1 .50($18,000) 5 $64,000
Serving:
$0.50(40,000) 1 $0.10(180,000) 1 .30($20,000) 1 .50($14,000) = $51,000
Having made these preliminary cost assignments, the operating centers contain both direct costs and costs that have been assigned to them from the support centers. Both of these costs will be then assigned to meals using primary cost drivers.
Primary Stage Allocation
In the primary stage, costs are assigned from the Cooking and Serving centers to the three meals. The activities and cost drivers are as follows for each meal:
sch80342_05_c05_181-222.indd 194 12/20/12 11:52 AM

CHAPTER 5Section 5.2 A Comprehensive Activity-Based Costing Example
Cost driver data—primary stage allocation
Cost driver activity linked to each meal
Code Activity center Cost driver Breakfast Lunch Dinner
410 Cooking Cooking hours
2,000 3,000 5,000
420 Serving Serving hours 2,500 1,500 1,000
As can be seen, different meals use different amounts of the resources in each activity center. Overhead cost functions for each of the operating centers are developed as follows:
Activity center Calculation Overhead cost function
Cooking ($20,0001$64,000)/(2,00013,00015,000) $8.40 per cooking hour
Serving ($15,0001$51,000)/(2,50011,50011,000) $13.20 per serving hour
Using these cost functions, the following overhead costs are assigned to the three products:
Breakfast: $8.40(2,000) 1 $13.20(2,500) 5 $49,800
Lunch: $8.40(3,000) 1 $13.20(1,500) 5 $45,000
Dinner: $8.40(5,000) 1 $13.20(1,000) 5 $55,200
Materials and labor costs which are directly traceable are added to determine the total meal costs:
Cost item Breakfast Lunch Dinner
Materials $ 5,000 $ 8,000 $19,000
Labor 4,000 10,000 16,000
Overhead 49,800 45,000 55,200
Total cost $58,800 $63,000 $90,200
Note that the total cost assigned to these meals equals the sum of the costs reported by the five activity centers (i.e., $58,800 1 $63,000 1 $90,200 = $32,000 1 $30,000 1 $150,000, or $212,000). Per unit costs for each meal are:
Breakfast: $58,800/22,000 = $2.67
Lunch: $63,000/15,000 = $4.20
Dinner: $90,200/12,000 = $7.52
sch80342_05_c05_181-222.indd 195 12/20/12 11:52 AM

CHAPTER 5Section 5.2 A Comprehensive Activity-Based Costing Example
Comparing ABC to Traditional Volume-Based Costing
As discussed, traditional volume-based cost systems unfortunately have paid less atten-tion to the cause-and-effect relationships between resources used and production activi-ties. Assume that the prior cost system in use by Guttman Cafeterias assigned overhead costs to meals using labor dollars. This is a common approach to assigning overhead. Let us also assume that the preliminary cost assignment steps are the same under either approach. Since $150,000 of total overhead cost is incurred and total labor cost is $30,000, an overhead rate of $5 for each $1 of labor is added to each product. The product costs would be as follows:
Total Breakfast Lunch Dinner
Direct materials $32,000 $5,000 $8,000 $19,000
Direct labor 30,000 4,000 10,000 16,000
Overhead costs (500% of labor) 150,000 20,000 50,000 80,000
Total meal costs $212,000 $29,000 $68,000 $115,000
Number of meals 22,000 15,000 12,000
Traditional cost per unit $1.32 $4.53 $9.58
ABC cost per unit $2.67 $4.20 $7.52
Difference
Traditional minus ABC cost $(1.35) $0.33 $2.06
Percentage of ABC cost (50.6%) 7.9% 27.4%
A dramatic picture appears. Using a cost system very common in many companies today, two of the three products have large cost differences: Breakfast and Dinner. Guttman had over-costed Dinners by 27.4 percent. This is a far more profitable meal than Guttman’s management had thought. Guttman may be losing Dinner business because of its higher than necessary price. Conversely, Breakfast is less profitable than previously thought. With traditional costing, Breakfast received a disproportionately low amount of overhead allocation because its labor cost of $4,000 was much lower than those of Lunch and Dinner ($10,000 and $16,000, respectively). However, Breakfast consumed overhead resources, namely serving hours per unit, comparable to the other two meals. Breakfast prices might need to be raised to cover its actual use of resources.
ABC is also considered superior to volume-based costing when a company’s sales mix includes the following two types of products or services:
• high volume, low complexity• low volume, high complexity
To illustrate, suppose Reznick Food Corporation produces 50,000 boxes of “Bland,” a breakfast cereal where each piece has the same shape, color, and flavor (high volume, low complexity). The company also produces 10,000 boxes of “Wow!,” a cereal having a variety of shapes, colors, and flavors (low volume, high complexity). Setup costs of $2,000
sch80342_05_c05_181-222.indd 196 12/20/12 11:52 AM

CHAPTER 5Section 5.2 A Comprehensive Activity-Based Costing Example
and materials handling costs of $9,000 are to be assigned to the two cereals. The following activity information is obtained:
“Bland” “Wow!”
Direct labor hours 25,000 2,500
Production runs 10 20
Materials moves 50 40
Volume-based costing, using direct labor hours, would assign the costs as follows:
“Bland”: ($2,000 1 $9,000) 3 (25,000 / 27,500) = $10,000
“Wow!”: ($2,000 1 $9,000) 3 (2,500 / 27,500) = $1,000
An ABC system would use the number of production runs to assign setup costs and the number of materials moves to assign materials handling costs, as follows:
“Bland”: [$2,000 3 (10 / 30)] 1 [$9,000 3 (50 / 90)] = $5,667
“Wow!”: [$2,000 3 (20 / 30)] 1 [$9,000 3 (40 / 90)] = $5,333
After dividing these assigned costs by 50,000 boxes for “Bland” and 10,000 boxes for “Wow!,” we obtain the following costs per box:
“Bland” “Wow!”
Volume-based costing $0.20 $0.10
Activity-based costing $0.11 $0.53
Compared to ABC, volume-based costing has over-costed the high volume, low com-plexity product (“Bland”), while under-costing the low volume, high complexity product (“Wow!”). This distortion is known as product cross-subsidization and has caused com-panies that use volume-based costing to set high prices for high volume, low complex-ity products and low prices for low volume, high complexity products. These prices can result in losing customers to competitors for the high volume, low complexity products and losing money on the low volume, high complexity products. Signals that companies may be experiencing product cross-subsidization include the inability to break into new markets or to maintain current market share as a result of competitors’ seeming ability to price below cost.
Whether ABC costs are “correct” or not, they would appear to be more accurate than the traditional costs. ABC makes a greater effort to match resource use, costs, activities, and products.
sch80342_05_c05_181-222.indd 197 12/20/12 11:52 AM

CHAPTER 5Section 5.3 ABC and Nonmanufacturing Activities
5.3 ABC and Nonmanufacturing Activities
Historically, manufacturing-related costs comprised the bulk of a manufacturing orga-nization’s total costs. Only manufacturing-related costs are considered product costs
for external reporting purposes. In recent times, emphasis on accounting for nonmanufac-turing costs such as selling, distribution, general administration, and research and devel-opment has grown. One reason is that nonmanufacturing costs are a growing portion of companies’ total costs. Another reason is that, due to computerization, it has become less costly to develop alternate accounting systems within a company. Therefore, in addition to the cost system needed for external reporting, companies now find it worthwhile to maintain alternate systems more useful for internal purposes such as pricing, control, decision making, and performance evaluation. With the growing emphasis on account-ing for nonmanufacturing costs, manufacturing firms who have adopted ABC for man-ufacturing-related activities are increasingly expanding their implementation of ABC to include nonmanufacturing activities.
Contemporary Practice 5.1
ABC Applications in the U.K.
U.K. companies who adopted ABC reported the following purposes to which ABC systems were being put to use in 1999 (Innes, Mitchell, & Sinclair, 2000):
Application Percent
Costreduction 90
Pricing 81
Performance measurement 74
Cost modeling 65
Budgeting 55
Customerprofitabilityanalysis 52
Output decisions 52
New product/service design 42
Inventoryvaluation 16
Other 16
sch80342_05_c05_181-222.indd 198 12/20/12 11:52 AM
CHAPTER 5Section 5.5 JIT Costing
In addition to manufacturing firms, the usage of ABC is growing in the service sector. Com-petitive pressures in industries such as health care, financial services, telecommunications, and transportation have led to increased cost consciousness on the part of managers. Not only is ABC being used to assess costs associated with various services, but, increasingly, it is also being used to determine costs associated with particular customers. Customer prof-itability analysis is becoming an increasingly important issue with management.
5.4 Activity-Based Management
Aside from product costing purposes, ABC systems are also used to improve the opera-tions of an organization. This extension of ABC is often referred to as activity-based
management (ABM). The ABM philosophy is that the activities identified for ABC can also be used for cost management and performance evaluation purposes.
One aspect of ABM which evolves from activity analysis is the identification and elimi-nation of nonvalue-added costs. Activities and their costs that are eliminated without deterioration of product quality and value can reduce total production time and increase profitability. For instance, many companies have adopted just-in-time production systems in an effort to eliminate activities related to storing and handling inventories.
Another aspect of ABM is the determination of efficiency and effectiveness measures for all cost generating activities. Traditionally, accountants have been concerned only with financial performance measures. With ABM, performance evaluation of activities has been expanded to include many nonfinancial measures. Measures dealing with quality and productivity have become particularly prominent. Indeed, the phenomenon of total qual-ity management is considered part of ABM. Examples of nonfinancial quality measures include product defect rates, number of customer complaints, number of engineering change orders, and amount of rework. Examples of nonfinancial productivity measures include the ratio of value-added time to total production time, amount of production per day per employee, and square footage required per day per unit of output.
ABM also encompasses innovations such as target costing, continuous improvement, employee empowerment, and benchmarking. These cost management and performance evaluation issues are discussed in detail in Chapter 12. The remainder of this chapter cov-ers an ABM topic which deals with product costing: JIT costing.
5.5 JIT Costing
To reduce nonvalue-added costs, many companies in recent years have adopted just-in-time (JIT) systems. These systems generally have the following characteristics:
1. Raw materials, work in process, and finished goods inventories are reduced as much as possible, if not eliminated. Costs associated with inventories, such as storage and moving, are considered to add no value to the product. As such, the production system operates on a demand-pull basis. Raw materials are pur-chased only as demanded by production needs; production is scheduled only as demanded by sales orders.
sch80342_05_c05_181-222.indd 199 12/20/12 11:52 AM

CHAPTER 5Section 5.5 JIT Costing
2. Since little or no inventory buffers exist at various work stations, problems such as defective materials or machine breakdowns not only stop work at that station but also cause shutdowns at subsequent stations. Thus, total quality programs are emphasized in JIT environments.
3. Long-term agreements are negotiated with a small number of suppliers. The criteria for selecting suppliers focus on dependable delivery and quality.
4. Layouts of production facilities are structured in the form of focused factories, i.e., “factories within a factory.” To simplify activities, especially materials han-dling, machines are grouped in arrangements that allow a worker or a team of workers to perform a variety of sequential operations. These arrangements are often referred to as manufacturing cells.
5. JIT is facilitated by automation in various forms—flexible manufacturing systems, automated materials handling systems, numerically-controlled machines, com-puter integrated manufacturing systems, etc. Thus, in JIT environments, direct labor cost is usually not significant and sometimes even nonexistent.
Due to these characteristics, firms with JIT systems sometimes record costs differently from how it is discussed in Chapter 3. Just-in-time (JIT) costing differs from traditional costing with regard to the accounts used and the timing of cost recording. Specifically, three major differences exist. First, instead of using separate accounts for Raw Materials and Work in Process, JIT costing combines these into a Raw and In-Process Inventory (RIP) account. The rationale is that the amount of work in process at any particular time will be low.
A second difference is that since direct labor is usually a minor cost item in a JIT setting, no separate account for direct labor in JIT costing is created. Rather, direct labor is combined with overhead into a Conversion Cost account. In some companies, direct labor is actually included in the Overhead account.
The third difference relates to the application of overhead. In traditional environments, overhead is applied to products as they are being produced. As such, overhead is applied to and recorded into the Work in Process account. In JIT costing, overhead is not applied to products until they are completed. No Work in Process account exists to accumulate con-version costs. When products are completed under JIT costing, conversion cost is applied to the Finished Goods account. In more “pure” JIT systems, the conversion cost is applied or added to Cost of Goods Sold, since the goods are sold soon after production is com-pleted. JIT costing is sometimes termed backflush costing because the product costs are “flushed” out of the accounting system and are attached to the products only after they are completed. This is the reverse of the traditional approach which attaches costs to prod-ucts, via the Work in Process account, as products are being produced.
Just as the Overhead account is closed out in the traditional cost system, the Conversion Cost account in the JIT system is closed out at the end of the period. In Chapter 3 we stated that Overhead should be closed out to Cost of Goods Sold or prorated among Cost of Goods Sold, Work in Process, and Finished Goods. With JIT costing, Conversion Cost would typically be closed out just to Cost of Goods Sold.
sch80342_05_c05_181-222.indd 200 12/20/12 11:52 AM
CHAPTER 5Section 5.5 JIT Costing
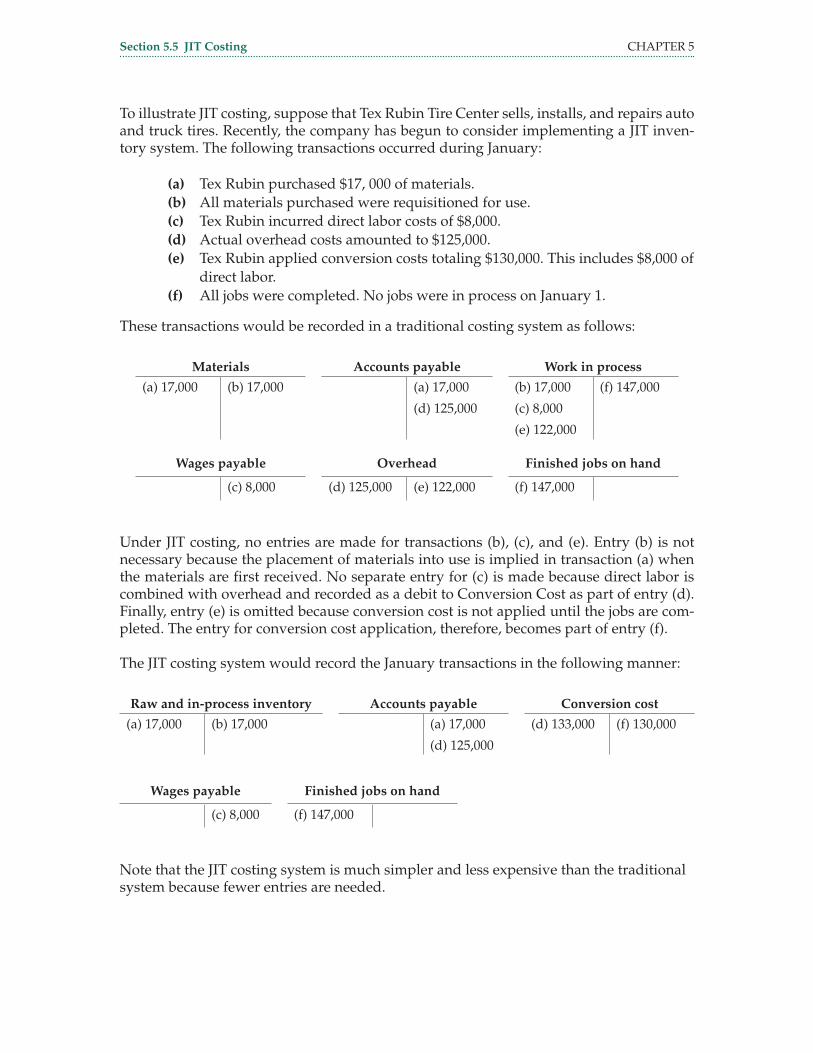
To illustrate JIT costing, suppose that Tex Rubin Tire Center sells, installs, and repairs auto and truck tires. Recently, the company has begun to consider implementing a JIT inven-tory system. The following transactions occurred during January:
(a) Tex Rubin purchased $17, 000 of materials.(b) All materials purchased were requisitioned for use.(c) Tex Rubin incurred direct labor costs of $8,000.(d) Actual overhead costs amounted to $125,000.(e) Tex Rubin applied conversion costs totaling $130,000. This includes $8,000 of
direct labor.(f) All jobs were completed. No jobs were in process on January 1.
These transactions would be recorded in a traditional costing system as follows:
Materials Accounts payable Work in process
(a) 17,000 (b) 17,000 (a) 17,000
(d) 125,000
(b) 17,000
(c) 8,000
(e) 122,000
(f) 147,000
Wages payable Overhead Finished jobs on hand
(c) 8,000 (d) 125,000 (e) 122,000 (f) 147,000
Under JIT costing, no entries are made for transactions (b), (c), and (e). Entry (b) is not necessary because the placement of materials into use is implied in transaction (a) when the materials are first received. No separate entry for (c) is made because direct labor is combined with overhead and recorded as a debit to Conversion Cost as part of entry (d). Finally, entry (e) is omitted because conversion cost is not applied until the jobs are com-pleted. The entry for conversion cost application, therefore, becomes part of entry (f).
The JIT costing system would record the January transactions in the following manner:
Raw and in-process inventory Accounts payable Conversion cost
(a) 17,000 (b) 17,000 (a) 17,000
(d) 125,000
(d) 133,000 (f) 130,000
Wages payable Finished jobs on hand
(c) 8,000 (f) 147,000
Note that the JIT costing system is much simpler and less expensive than the traditional system because fewer entries are needed.
sch80342_05_c05_181-222.indd 201 12/20/12 11:52 AM

CHAPTER 5Problem for Review
Chapter Summary
Activity-based costing is a system of accounting that focuses on activities performed to produce items or services. The activities are the primary building blocks in cost
accumulation. Cost drivers are used to identify costs with activities and to identify activi-ties with products. Preliminary stage cost drivers assign support activity costs to other activity centers. Primary stage cost drivers relate costs of activities to products or services.
In designing an activity-based cost system, five basic steps are followed. First, assemble similar actions into activity groups. This process involves categorizing activities as unit level, batch level, product level, and facility level. Second, classify costs by activity group and by expense. Third, select the appropriate preliminary stage and primary stage cost drivers. This process eliminates distortions in cost allocations to products that result from production complexity. Fourth, calculate a cost function to link costs and the cost driver activity. Finally, fifth, assign costs to the cost objective (often the product cost).
ABC can also be applied to nonmanufacturing activities and to service organizations. Activity-based management involves the analysis of activities for cost management and performance evaluation issues.
JIT costing differs from traditional cost systems in three respects. First, JIT costing does not use a Work in Process account. Second, JIT costing combines direct labor and over-head into one account. Third, in JIT costing, overhead is not applied to products until the products are completed.
Problem for Review
Lowy Manufacturing Company makes a variety of backpacks. The activity centers and budgeted information for the year are:
Activity center Overhead costs Cost driver Activity center rate
Materials handling $ 300,000 Weight of materials $ 0.30 per pound
Cutting 1,800,000 Number of shapes $3.00 per shape
Assembly 4,600,000 Direct labor hours $12.00 per labor hour
Sewing 1,200,000 Machine hours $8.00 per machine hour
Two styles of backpacks were produced in December: the EasyRider and the Overnighter. The quantities and other operating data for the month are:
EasyRider Overnighter
Direct materials weight in pounds 50,000 15,000
Assembly direct labor hours 7,500 1,200
Sewing machine hours 12,500 1,800
Units produced 5,000 1,000
Number of shapes 35,000 15,000
sch80342_05_c05_181-222.indd 202 12/20/12 11:52 AM

CHAPTER 5Problem for Review
Questions:
1. Using the activity center rates, find the total overhead costs charged to each prod-uct during the month.
2. Calculate a per unit cost for each backpack.3. With the information given, compute the budgeted level for each cost driver
upon which the activity center rates were based.
Solution:
1.
Total overhead costs traced to products: EasyRider Overnighter
Materials handling:
50,000 3 $0.30 $ 15,000
15,000 3 $0.30 $ 4,500
Cutting:
35,000 3 $3 105,000
15,000 3 $3 45,000
Assembly:
7,500 3 $12 90,000
1,200 3 $12 14,400
Sewing:
12,500 3 $8 100,000
1,800 3 $8 14,400
Total costs $310,000 $78,300
2.
Unit costs: EasyRider Overnighter
Total costs $310,000 $78,300
Units 5,000 1,000
Unit costs $ 62.00 $ 78.30
3.
Budgeted levels for cost drivers:
Materials handling $300,000 / $0.30 = 1,000,000 pounds
Cutting $1,800,000 / $3 = 600,000 shapes
Assembly $4,600,000 / $12 = 383,333 labor hours
Sewing $1,200,000 / $8 = 150,000 machine hours
sch80342_05_c05_181-222.indd 203 12/20/12 11:52 AM

CHAPTER 5Key Terms
Key Terms
activity-based costing (ABC) A system of accounting that focuses on activities per-formed to produce products or services.
activity-based management (ABM) A management approach that focuses on activities with the objective of improving operations.
activity center A segment of the organi-zation for which management wants the costs of a set of activities to be reported separately.
backflush costing The costing approach used in JIT systems, in which product costs are “flushed” out of the accounting system and are attached to the products only after they are completed.
batch-level activities Activities that are performed each time a batch of goods is produced or handled.
batch-size diversity The manufacturing of products in different size batches.
cost center A responsibility center where control exists over the incurrence of cost.
demand-pull A production system in which raw materials are purchased only as demanded by production needs, and production is scheduled only as demanded by sales orders.
facility-level activities Activities that sus-tain a facility’s general production process.
focused factory A factory layout that per-mits the production of a single product or family of products.
just-in-time (JIT) systems Systems whose objective is to eliminate waste by pro-ducing a product only when it is needed and only in the quantities demanded by customers.
just-in-time (JIT) costing A method of product costing used for JIT systems.
manufacturing cells Machines that are grouped in arrangements that allow a worker or team of workers to perform a variety of sequential operations.
nonvalue-added costs Costs that can be eliminated without deterioration of prod-uct quality and value.
preliminary stage cost driver A cost driver in an ABC system that assigns costs from activities to other activities.
primary stage cost driver A cost driver in an ABC system that assigns costs from activities to the cost objectives.
product cross-subsidization Cost distor-tion resulting from over-costing one prod-uct and under-costing another one.
product diversity The degree to which each product differs in the number of activities required.
product-level activities Activities that are performed as needed to support the pro-duction of each different type of product or service.
unit-level activities Activities that are performed each time a unit is produced or handled.
sch80342_05_c05_181-222.indd 204 12/20/12 11:52 AM

CHAPTER 5Exercises
Questions for Review And Discussion
1. Describe the relationships among resources, activities, and products.2. Identify the five basic steps in applying activity-based costing to a costing
problem.3. Define an activity center. How many activity centers can exist in one production
department? Explain.4. Describe the differences among unit-level activities, batch-level activities, and
product-level activities.5. Explain the difference between a preliminary stage cost driver and a primary
stage cost driver.6. What is meant by product diversity? Why is it important in product costing?7. What factors have led to an increased emphasis on accounting for nonmanufac-
turing costs, such as selling, distribution, general administration, and research and development?
8. Identify the key characteristics associated with JIT systems (other than cost recording issues).
9. Why is JIT costing sometimes referred to as backflush costing?
Exercises
5-1. Classification of Activities. Lubin Electronics, Inc. makes avionics equipment for private aircraft manufacturers. The production process takes place in three departments. The following costs were budgeted for February:
Computer programming—production $ 27,000
Custodial wages—plant 4,500
Depreciation—machinery 95,000
Depreciation—plant 60,000
Electricity—machinery 11,600
Electricity—plant 7,400
Engineering design 36,000
Equipment maintenance—wages 14,100
Equipment maintenance—parts and supplies 2,900
Heating—plant 3,200
Inspection—production 3,800
Insurance—plant 10,000
Property taxes 9,300
Raw materials, components, subassemblies 280,000
Setup wages 19,000
sch80342_05_c05_181-222.indd 205 12/20/12 11:52 AM

CHAPTER 5Exercises
Questions:
1. Identify each of the costs as one of the following:(a) A unit-level activity.(b) A batch-level activity.(c) A product-level activity.(d) A facility-level activity.
2. Specify an appropriate cost driver for tracing to the products the costs that are associated with the various activity levels previously identified.
5-2. Appropriateness of ABC. Zalik Industries has identified the following activity centers and cost drivers:
Activity center Cost driver
Purchasing Number of purchase orders
Materials handling Number of parts
Setups Number of setups
Cutting Number of parts
Assembly Direct labor hours
Painting Number of units painted
Two customer orders were received for the month. The cost drivers appearing on each order are as follows:
Cost drivers Order 1 Order 2
Number of purchase orders 3 6
Number of parts 8 4
Number of setups 6 2
Direct labor hours 35 15
Number of units painted 11 33
Question:
1. Assuming the company traditionally allocated these costs using direct labor hours, how would activity-based costing, with the indicated cost drivers, im-prove the allocation of costs to products on the two customer orders?
sch80342_05_c05_181-222.indd 206 12/20/12 11:52 AM

CHAPTER 5Exercises
5-3. Choosing an Activity Base. Costs and activity levels over the past three months are as follows for Mindi Stuart Enterprises, which operates a national chain of car washes:
December January February
Activity center total costs $ 20,000 $ 30,000 $ 40,000
Labor hours 1,000 1,000 1,000
Machine hours 3,000 4,500 6,000
Pounds of materials used 10,000 12,000 14,000
Number of cars washed 120,000 130,000 140,000
Question:
1. Which activity measure would appear to be the best cost driver for this cost cen-ter? Comment.
5-4. Overhead Cost Assignment. Litzman Enterprises manufactures two types of hats: Black and White. The overhead activities, costs, and related data are as fol-lows:
Black White Activity center costs
Receiving orders 120 180 $ 9,000
Machine hours 3,000 2,000 $90,000
Setups 50 25 $12,000
Shipping orders 250 150 $22,000
Question:
1. Using activity based costing, determine the overhead costs assigned to each of the two hats.
5-5. Cost Control with ABC. The Flying Llama Travel Agency of Lima, Peru, budgets its agents’ expenses based on the following activities, cost drivers, and cost functions:
Activities Cost drivers Cost functions
Operations Kilometers traveled 0.60 New Sol per kilometer
Entertainment Admission expenses 15.00 New Sol per passenger
Trips Trip agent costs 300.00 New Sol per trip
sch80342_05_c05_181-222.indd 207 12/20/12 11:52 AM

CHAPTER 5Exercises
Juanita Garcia spent 8,200 New Sol in September. She ran 10 trips, had 20 persons per trip, and traveled a total of 4,000 kilometers. Other agents’ spending averaged 8,600 New Sol.
Question:
1. Using activity-based costing, comment on Garcia’s spending for September. Also, comment on the spending of the other agents.
5-6. Job Costing with Volume-Based Costing and with ABC. Bergen Corporation has four categories of overhead, with expected costs for next year as follows.
Maintenance $820,000
Materials Handling 180,000
Inspection 390,000
Setups 315,000
Job #58 is scheduled for next year and has the following estimates:
Direct materials $82,000
Direct labor (2,000 hours) $97,000
Number of inspections 95
Number of setups 88
Number of machine hours 4,500
Number of materials moves 185
Sixty thousand direct labor hours are budgeted for next year. Expected activity for the activity-based cost drivers that could be used are:
Machine hours 34,000
Material moves 18,000
Setups 31,000
Quality inspections 37,000
Questions:
1. Determine the total cost of Job #58 if direct labor hours are used as the cost driver for overhead.
2. Determine the total cost of Job #58 if activity-based costing is used.
sch80342_05_c05_181-222.indd 208 12/20/12 11:52 AM

CHAPTER 5Exercises
5-7. Activity Center Rates. The following budgeted activity data and costs are from Chernin Laundromats:
Activity centers Direct costs Support costs Percentage of space used
Number of employees
Preliminary centers:
Administration $64,000 20%
Maintenance 75,000
Primary centers:
Washing $123,000 45,000 60% 30
Drying 69,000 88,000 20% 20
Administration uses number of employees as its cost driver. Maintenance uses percent-age of space used as its cost driver. Washing uses machine hours as its cost driver and has budgeted 42,300 hours this month. Drying also uses machine hours as its cost driver and has budgeted 40,100 hours this month.
Question:
1. Find the cost rates that will be used this month in each primary center.
5-8. Product Costing with ABC. Linda Irvin, the controller of Sonya Electronics, wishes to use activity-based costing for a new circuit board produced for person-al computers. Irvin has identified the following activities associated with circuit board production and the related conversion costs forecast for the period:
Activity Conversion cost
Purchasing of parts $ 72,000
Starting the product 90,000
Inserting the components 150,000
Soldering the boards 180,000
Testing the quality 140,000
The cost drivers which Irvin intends to use, as well as the amounts of activity forecast for the period, are:
Activity Cost driver Cost driver amounts
Purchasing of parts Number of parts purchased 12 per board
Starting the product Number of boards started 60,000
Inserting the components Number of insertions 10 per board
Soldering the boards Number of boards soldered 60,000
Testing the quality Number of testing hours 2,000
sch80342_05_c05_181-222.indd 209 12/20/12 11:52 AM

CHAPTER 5Exercises
Each circuit board has anticipated direct materials costs of $36. In addition, each circuit board takes, on average, 15 minutes to test.
Question:
1. Determine the cost of a circuit board produced by Sonya Electronics.
5-9. Finding Missing Costs. Susan Robinson, the operations manager for Flink Tow-ing Service, is unable to locate the 2014 budget. You have managed to recover the following information for her:
Activity center Budgeted overhead cost Cost driver Budgeted cost driver levelDispatching $14,000 Number of calls 350 callsTowing 42,000 Towing hours 600 hoursBilling & Collection 15,000 Pages of forms
processed5,000 pages
Miscellaneous Overhead
? Labor hours 10,000 hours
You have also obtained the following information pertaining to the Southern Region, which you learned was assigned an overhead cost of $9,500:
Labor hours 2,000
Number of calls 50
Towing hours 55
Pages of forms processed 430
Question:
1. Determine the amount of Miscellaneous Overhead that was budgeted for 2014.
5-10. Overhead Cost Assignment. Helene’s Tennis Experts is a company that special-izes in installing and resurfacing tennis courts. Using ABC, the company has assigned all overhead costs into five cost pools. The budgeted amounts for these cost pools and their associated cost drivers are:
Overhead cost pool Budgeted costs Cost driver Budgeted level for cost driver
Purchasing & materials-related
$230,000 Materials costs $1,450,000
Engineering 97,000 Engineering hours 5,300 hoursOffice & storage rental
125,000 Square feet of jobs 478,500 sq. ft.
Equipment depreciation
150,000 Direct labor cost $998,000
General administration
280,000 Direct labor hours 88,000 hours
sch80342_05_c05_181-222.indd 210 12/20/12 11:52 AM

CHAPTER 5Exercises
The company has just completed resurfacing Thompson Park Tennis Courts, which had the following cost driver data:
Materials cost $39,000
Direct labor cost $15,200
Engineering hours 62
Square feet 4,100
Direct labor hours 75
Question:
1. Determine the total overhead cost that would be assigned to Thompson Park Tennis Courts.
5-11. Preliminary and Primary Stage Allocations. Maryland Forklift Manufacturing produced 100 electric forklifts and 150 propane forklifts during the year. Andy Weber, the controller, reported the following traceable costs, other than direct materials and direct labor, for its activity centers:
Activity center Costs
Plant Administration $ 66,000
Setup Operations 24,000
Materials Handling 47,000
Machining 180,000
Assembly 150,000
Data for the preliminary stage cost assignment are as follows:
Activity centers using resources and receiving costs
Activity center Setup Operations Machining Assembly
Plant Administration 5% 40% 55%
Materials Handling 65% 35%
Data for the primary stage cost assignment are as follows:
Cost driver activity linked to each product
Activity center Cost driver Electric Propane
Setup Operations Number of setups 30 setups 20 setups
Machining Machine hours 250 hours 150 hours
Assembly Labor hours 6,000 hours 9,000 hours
sch80342_05_c05_181-222.indd 211 12/20/12 11:52 AM

CHAPTER 5Problems
Question:
Determine the overhead cost per unit assigned to each type of forklift.
5-12. Recording Transactions Under JIT Costing. Hyeun-Suk Rhee, owner of Taegu Supply Company in South Korea, which manufactures chopsticks for restau-rants, has recently decided to implement a JIT cost system. Transactions (in South Korean won) for August are as follows:
(a) Raw materials were purchased at the cost of W950, 000.(b) All materials purchased were requisitioned for production.(c) Direct labor costs of W2,500,000 were incurred.(d) Actual factory overhead costs amounted to W6,000,000.(e) Applied conversion costs totaled W8,100,000. This included W2,500,000 of
direct labor.(f) All units were completed.
Question:
1. Enter the August transactions into T-accounts. Label these entries by the identify-ing letters.
Problems
5-13. Activities and Cost Drivers for an Employment Agency. Kelsey Relocation Services is an employment agency working specifically with mid-level executives looking for new career opportunities or seeking employment after a layoff. The company views its product as placements. These are identified in four categories: employer-paid fee, applicant-paid fee, out-placement contract, and executive-search contract.
The agency incurs a number of costs in performing its services. Those costs are classified as operating expenses as follows:
sch80342_05_c05_181-222.indd 212 12/20/12 11:52 AM
CHAPTER 5Problems
Acct # Account title
402 Salaries and Wages
403 Payroll Taxes
404 Employee Benefits
408 Office Supplies (postage, stationery, etc.)
409 Dues and Publications
410 Utilities
412 Rent
413 Repairs and Maintenance (contracted from outside)
420 Business Promotion
421 Auto Expenses
422 Travel Expenses
430 Professional Fees
432 Collection Expenses
435 License
441 Property Taxes
444 Insurance Costs
445 State Franchise Tax
447 Bad Debt Expense
448 Depreciation and Amortization
449 Miscellaneous
Questions:
1. Classify each cost as related to unit-level, batch-level, product-level, or facility-level activities. Indicate an appropriate cost driver for each cost.
2. With the information from Part (1), group costs into logical activity groups and specify a cost driver for each activity group.
3. Explain what differences exist between applying activity-based costing to a manufacturing firm and to an employment agency.
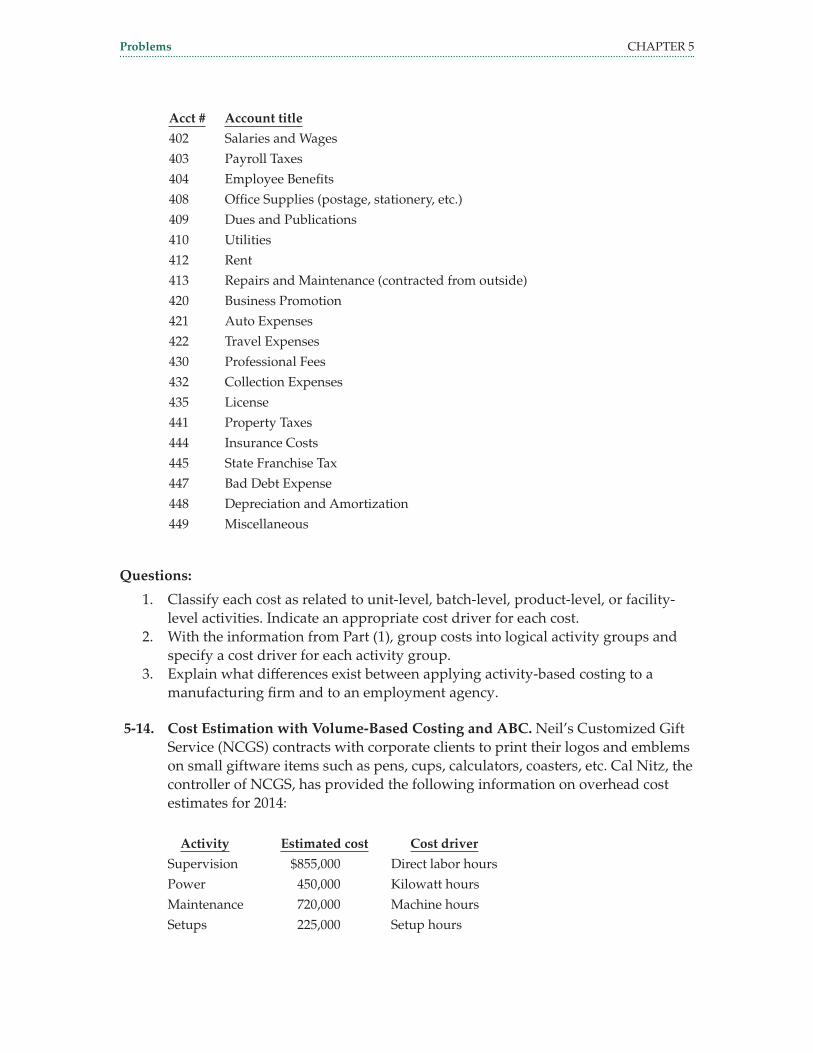
5-14. Cost Estimation with Volume-Based Costing and ABC. Neil’s Customized Gift Service (NCGS) contracts with corporate clients to print their logos and emblems on small giftware items such as pens, cups, calculators, coasters, etc. Cal Nitz, the controller of NCGS, has provided the following information on overhead cost estimates for 2014:
Activity Estimated cost Cost driver
Supervision $855,000 Direct labor hours
Power 450,000 Kilowatt hours
Maintenance 720,000 Machine hours
Setups 225,000 Setup hours
sch80342_05_c05_181-222.indd 213 12/20/12 11:52 AM

CHAPTER 5Problems
The following are estimated 2014 and planned January activity levels of the cost drivers:
Cost driver Estimated activity for 2014 Planned level in Jan. 2014
Direct labor hours 300,000 35,000
Kilowatt hours 150,000 12,000
Machine hours 120,000 10,000
Setup hours 100,000 8,000
Questions:
1. Estimate overhead costs for January 2014 using direct labor hours as the alloca-tion base.
2. Estimate overhead costs for January 2014 using activity-based costing.
5-15. Overhead Cost Assignment – ABC and Overall Rates. Kallus Airlines uses activity-based costing for its ground handling department. The department has assigned all overhead costs into seven activity cost pools. The budgeted amounts and the associated cost drivers for these cost pools are as follows:
Activity cost pool Budgeted costs Cost driver Budgeted level for cost driver
Loading and unloading cargo
$ 250,000 Pounds of cargo 2,000,000 lbs.
Directing planes to and from gates
110,000 Directing distance 5,500 miles
Loading and unloading baggage
300,000 Bags loaded & unloaded
100,000 bags
Communicating with pilots
80,000 Communication time
2,000 hours
Fueling planes 450,000 Fueling time 10,000 hours
Deicing planes 75,000 Deicing time 1,000 hours
Locating mishandled bags
200,000 Number of inquiries
5,000 inquiries
Total $1,465,000
A flight has just been completed with the following cost driver information available:
Pounds of cargo 40,000
Directing distance (miles) 1.5
Bags loaded & unloaded 200
Communication hours 0.9
Fueling hours 2.2
Deicing hours 0
Number of inquiries 3
sch80342_05_c05_181-222.indd 214 12/20/12 11:52 AM

CHAPTER 5Problems
Questions:
1. Determine the total overhead cost that would be assigned to the flight.2. Compare the total overhead cost computed in Part (1) with one obtained by us-
ing an overall overhead rate based on number of bags loaded and unloaded.
5-16. ABC and Volume-Based Costing for Marketing Studies. Janet Emerson & As-sociates, a marketing research firm, uses ABC and has budgeted the following overhead costs and cost drivers (10,000 direct labor hours were budgeted):
Activities Cost driver Budgeted cost Budgeted activity level
Phoning Number of calls $25,000 80,000
Mailing Number of mailings 15,000 40,000
Personal visits Miles driven 10,000 50,000
The following data were collected on three market research studies completed:
Study #15 Study #19 Study #23
Direct materials cost $ 6,020 $ 5,425 $ 4,885
Direct labor cost $15,660 $12,235 $19,650
Direct labor hours 140 110 175
Number of calls 500 300 700
Number of mailings 7,000 6,000 2,000
Miles driven 900 1,300 1,600
Questions:
1. Using volume-based costing with direct labor hours as the cost driver, calculate the total cost of each of the three studies.
2. Using ABC, calculate the total cost of each of the three studies.
5-17. Two-stage Allocation and Overhead Rates. Koonin Corp. has provided the fol-lowing information about overhead costs traceable to its activity centers:
Activity center Overhead cost Cost driver
Maintenance $90,000 Maintenance hours
Receiving 40,000 Receiving orders
Fabrication 150,000 Labor hours
Assembly 280,000 Machine hours
sch80342_05_c05_181-222.indd 215 12/20/12 11:52 AM

CHAPTER 5Problems
The following activities were reported:
Activity center Maintenance hours Receiving orders Labor hours Machine hours
Fabrication 200 30 1700 450
Assembly 800 120 1300 550
Overhead allocations involving Maintenance and Receiving are performed in the prelimi-nary stage; overhead costs for Fabrication and Assembly are assigned to products in the primary stage.
Question:
1. Compute the overhead rates for product costing in Fabrication and Assembly.
5-18. Distortion of Product Profitability. The Chromosome Manufacturing Company produces two products, X and Y. The company president, Gene Mutation, is concerned about the fierce competition in the market for product X. He notes that competitors are selling X for a price well below Chromosome’s price of $12.70. At the same time, he notes that competitors are pricing product Y almost twice as high as Chromosome’s price of $12.50.
Mr. Mutation has obtained the following data for a recent time period:
Product X Product Y
Number of units 11,000 3,000
Direct materials cost per unit $3.23 $3.09
Direct labor cost per unit $2.22 $2.10
Direct labor hours 10,000 2,500
Machine hours 2,100 2,800
Inspection hours 80 100
Purchase orders 10 30
Mr. Mutation has learned that overhead costs are assigned to products on the basis of direct labor hours. The overhead costs for this time period consisted of the following items:
Overhead cost item Amount
Inspection costs $16,200
Purchasing costs 8,000
Machine costs 49,000
Total $73,200
sch80342_05_c05_181-222.indd 216 12/20/12 11:52 AM

CHAPTER 5Problems
Questions:
1. Using direct labor hours to allocate overhead costs, determine the gross margin per unit for each product.
2. Using activity-based costing, determine the gross margin per unit for each product.
3. How do your answers to Parts (1) and (2) help explain the observations made by Gene Mutation about competitors?
5-19. Overhead Rates and Cost Comparisons. Joe Asher’s Machine Shop makes re-placement parts for automotive transmissions. It produces three basic products: gears, shafts, and casings. The company is budgeting activity for 2014. The activ-ity centers, costs, and cost drivers are as follows:
Activity center Budgeted cost Cost driver
Materials handling $ 312,400 Direct materials cost
Production scheduling 116,000 Number of production orders
Setups 144,600 Number of setups
Manual machinery 986,000 Direct labor hours
Automated machinery 3,212,000 Machine hours
Finishing 1,798,000 Direct labor hours
Packaging and shipping 234,000 Number of orders shipped
The following data are predicted for 2014:
Gears Shafts Casings
Units produced 10,000 2,000 700
Direct materials cost per unit $ 60 $ 80 $ 100
Number of production orders 40 20 10
Number of setups 20 10 14
Direct labor hours 20,000 10,000 8,400
Machine hours 30,000 15,000 2,800
Number of orders shipped 1,000 1,500 70
Questions:
1. Compute an overhead rate for each activity center. Round calculations to four decimal places.
2. Compute an overall rate for the combined activities based on direct labor hours. Round calculations to four decimal places.
3. Show how much overhead is budgeted for gears, shafts, and casings using the activity center rates and the overall rate.
4. Calculate an overall rate for the combined activities based on the total number of units.
sch80342_05_c05_181-222.indd 217 12/20/12 11:52 AM

CHAPTER 5Problems
5. Show how much overhead is budgeted for gears, shafts, and casings using the rate in Part (4).
6. Explain why the overhead costs differ in Parts (3) and (5).
5-20. Activity-Based Costing for a Tour Company. Ozzie Tour Company provides tours in Australia and uses an activity-based cost system. The basic 10-day pack-age covers the east coast, including Sydney, Melbourne, Canberra, Brisbane, and the Great Barrier Reef. The deluxe 21-day package adds the outback, west coast, and other areas, including Darwin, Tasmania, Adelaide, Perth, and Alice Springs. Direct labor (drivers, tour guides) and materials costs (e.g., fuel, brochures, vari-ous drinks and refreshments) for 2014 were (in Australian dollars):
10-day package 21-day package
Direct labor A$670,000 A$1,770,000
Materials A$10,800 A$22,400
The following additional information for 2014 was provided by the owner, David Rogut:
Activity (cost driver) level
Activity Overhead cost Cost driver 10-day package 21-day package
Advertising A$56,700 No. of ads 150 175
Organizing itinerary
A$89,300 No. of tours 55 72
Touring A$380,500 No. of tourists 2,725 3,130
Question:
Compute the total cost per tour for each of the two tour packages.
5-21. Analysis of Accounts With JIT Costing. L.D. Ferreira, general manager of a highly automated coffee production plant in Sao Paulo, Brazil, has provided the following information for transactions that occurred during October. All amounts are in Brazilian real. The production plant uses a JIT cost system.
(a) Raw materials costing R$300, 000 were purchased.(b) All materials purchased were requisitioned for production.(c) Direct labor costs of R$200,000 were incurred.(d) Actual factory overhead costs amounted to R$995,000.(e) Applied conversion costs totaled R$1,300,000. This includes the direct
labor cost.(f) All units were completed and immediately sold.
sch80342_05_c05_181-222.indd 218 12/20/12 11:52 AM

CHAPTER 5Problems
Questions:
1. Determine the October 31 balance in the Cost of Goods Sold account. No adjust-ment has been made for overapplied or underapplied conversion cost.
2. What was the amount of overapplied or underapplied conversion cost for the month?
5-22. JIT and Conventional Costing. DeKalb Industrial Products manufactures auto-mated materials-handling systems. The company currently uses a conventional job cost system. During November, the company plans to purchase $96,000 of raw materials. Of this amount, 75 percent will be used for current production, while the remainder will serve as a buffer in inventory. Direct labor cost is ex-pected to be $18,000 during November, and the actual factory overhead is antici-pated to total $85,000. The applied factory overhead is expected to be $90,000. By the end of the month, two materials-handling systems should be completed; no systems were in process at the beginning of the month or at the end of the month.
Robert Cohen, the owner, has been considering the use of a JIT inventory system. If imple-mented at the beginning of November, only the materials needed for current production would be purchased.
Questions:
1. Using T-accounts, enter the November transactions for the purchase and usage of materials under:(a) Conventional costing.(b) JIT costing.
2. Using T-accounts, enter the November transactions for the labor and actual over-head costs under:(a) Conventional costing.(b) JIT costing.
3. Using T-accounts, enter the November transactions for the application of over-head costs and the completion of the materials-handling systems under:(a) Conventional costing.(b) JIT costing.
sch80342_05_c05_181-222.indd 219 12/20/12 11:52 AM

CHAPTER 5Case: Druid Valley Apartments
Case: Druid Valley ApartmentsDruid Valley Apartments (DVA) has 18 apartment buildings with a total of 600 units—420 two-bedroom units and 180 one-bedroom units. Also, the complex contains a sports area which has a basketball court, exercise room, tennis court, and two activity rooms. The sports area was used by 475 residents this past year. DVA currently has 1,580 tenants—280 in one-bedroom units and 1,300 in two-bedroom units. The one-bedroom apartments occupy 90,000 square feet, while the two-bedroom apartments occupy 275,000 square feet. The sports area occupies 35,000 square feet.
Jerry Siegel, DVA’s Chief Operations Officer, oversees the day-to-day operations of the apartment complex. Doug Ross supervises the sports area. He organizes programs, classes, and other activities. The facilities are managed by Bruce Gaynes, who oversees the staff for building maintenance and grounds. Sylvia Miller does the bookkeeping and Colleen Weston is the secretary/receptionist.
The following expense report for the past year was given to Jerry Siegel:
Expense items Amounts
Administrativesalaries $ 227,000
Custodial costs 177,000
Maintenance costs 90,000
Instructor/trainer costs 60,000
Grounds costs 55,000
Heat and electricity 42,000
Water 98,000
Officesupplies 13,000
Buildingdepreciation 795,000
Equipmentdepreciation 130,000
Liability and property insurance
720,000
Advertising 51,000
Telephone 17,000
Newsletter 10,000
Interest 20,000
Postage 11,000
Miscellaneous 27,000
Total Expenses $2,543,000
Siegel wondered what it cost to operate the apartment units and the sports area. He con-tacted his CPA, Jay Starkman, who convinced him to install an activity-based costing (ABC) system. Siegel engaged Starkman to do this. (continued)
sch80342_05_c05_181-222.indd 220 12/20/12 11:52 AM

CHAPTER 5Case: Druid Valley Apartments
Case: Druid Valley Apartments (continued)After discussions with DVA staff, Starkman developed a list of eight activities that seemed to capture the operations at DVA:
No. Activity
1 Attractingnewresidents
2 Servicing current residents
3 Maintaining the buildings
4 Maintaining the grounds
5 Cleaning the apartments/sports area
6 Providingrecreationalprograms
7 Collectingrentandfees
8 Sustaining the business
Activity 6, “providing recreational programs,” included classes, personal training, resident meetings, and any other events that took place in the sports area. Activity 8, “sustain-ing the business,” is a catchall that includes tasks such as accounting, purchasing, general office management, and human resource management.
Starkman’s next task was to assign costs to the eight activities. He asked all DVA adminis-trative personnel to fill out estimates of how they spent their time, on average, during the past year. These estimates were as follows:
J. Siegel D. Ross B. Gaynes S. Miller C. Weston
Salary: $67,000 $48,000 $44,000 $35,000 $33,000
Activity:
Attractingnewresidents 10% 5%
Servicing current residents 20% 20% 15% 10%
Maintaining the buildings 5% 30%
Maintaining the grounds 5% 25%
Cleaning the apts./sports area 5% 30%
Providing rec. programs 65%
Collectingrentandfees 10% 60%
Sustaining the business 45% 10% 15% 25% 90%
Total 100% 100% 100% 100% 100%
Some costs were assigned entirely to one activity. These included interest expense, instruc-tor/trainer costs, custodial costs, maintenance costs, and grounds costs. The latter three costs consist of wages to workers as well as various supplies. Office supplies, equipment depreciation, telephone, postage, and miscellaneous expenses were distributed evenly to all eight activities. The remaining costs were assigned as follows: (continued)
sch80342_05_c05_181-222.indd 221 12/20/12 11:52 AM

CHAPTER 5Case: Druid Valley Apartments
Case: Druid Valley Apartments (continued)
Cost Assignment
Heat and electricity 10%toactivity1;20%toactivity2;40%toactivity6;10%toactivity7;20%toactivity8
Water 70%toactivity2;15%toactivity4;15%toactivity6
Buildingdepreciation 95%toactivity2;5%toactivity6
Liability and property insurance 60%toactivity2;10%toactivity6;theremainderevenly
Advertising 90%toactivity1;10%toactivity6
Newsletter 75%toactivity2;25%toactivity6
After this cost assignment, Starkman decided to allocate evenly the costs that had been assigned to activity 8 to the other seven activities. Having done this, he then assigned the costs of these seven activities to the one-bedroom units, two-bedroom units, and sports area using the following cost drivers:
Activities Cost driver Cost objects
Attractingnewresidents Number of units 1-bedroom units, 2-bedroom units
Servicing current residents Number of residents 1-br. units, 2-br. units, sports area
Maintaining the buildings square footage 1-br. units, 2-br. units, sports area
Maintaining the grounds square footage 1-br. units, 2-br. units, sports area
Cleaning the apts./sports area Number of residents 1-br. units, 2-br. units, sports area
Providingrecreationalprograms sports area
Collectingrentandfees Number of residents 1-br. units, 2-br. units, sports area
Questions:
1. Determine the total costs assigned to the one-bedroom units, two-bedroom units, and the sports area. For the apartment units, also compute the costs per unit. Com-ment on these costs.
sch80342_05_c05_181-222.indd 222 12/20/12 11:52 AM