Activation in the Right Posterior Temporal Region of 7...
27
Universidade do Minho Escola de Psicologia Sandra Cristina Carvalho Queirós Activation in the Right Posterior Temporal Region of 7-Month-Olds to Upright Point-Light Walkers: A fNIRS Study outubro de 2017 UMinho|2017 Sandra Cristina Carvalho Queirós Activation in the Right Posterior Temporal Region of 7-Month-Olds to Upright Point-Light Walkers: A fNIRS Study
Transcript of Activation in the Right Posterior Temporal Region of 7...

Universidade do Minho
Escola de Psicologia
Sandra Cristina Carvalho Queirós
Activation in the Right Posterior Temporal Region of 7-Month-Olds to Upright Point-Light Walkers: A fNIRS Study
outubro de 2017UM
inho
|201
7
Sandra
Crist
ina C
arv
alh
o Q
ueir
ós
Act
ivati
on in t
he R
ight
Post
eri
or
Tem
pora
l R
egi
on o
f 7
-Month
-Old
s to
Upri
ght
Poin
t-Lig
ht
Walk
ers
: A
fN
IRS
Study

Sandra Cristina Carvalho Queirós
Activation in the Right Posterior
Temporal Region of 7-Months-Olds to
Upright Point-Light Walkers: A fNIRS
Study
Dissertação de Mestrado
Mestrado Integrado em Psicologia
Trabalho efetuado sob a orientação do
Doutor Alfredo Pereira
outubro de 2017


Index
Acknowledgements .................................................................................................................... ii
Resumo ...................................................................................................................................... iv
Abstract ...................................................................................................................................... v
Introduction ................................................................................................................................ 6
Methods .................................................................................................................................... 10
Participants ........................................................................................................................... 10
Stimuli and Experimental Design ......................................................................................... 11
Procedure .............................................................................................................................. 12
NIRS Recording and processing ........................................................................................... 13
Results ...................................................................................................................................... 14
Individual channel analysis .................................................................................................. 14
ROI analysis ......................................................................................................................... 18
Discussion ................................................................................................................................ 19
Limitations ............................................................................................................................... 22
Bibliography ............................................................................................................................. 23
Tables Index
Table 1: Sample Sociodemographic ........................................................................................ 10
Table 2: Number of valid trial for condition for each participant ........................................... 15
Table 3: Fisher-Pitman Permutation Test results for all channels and Upright PLW and
Spatially Scrambled PLW conditions ...................................................................................... 17
Table 4: Results of Fisher-Pitman Permutation test for ROI analysis .................................... 19
Figures Index
Figure1: Stimuli used in baseline and experimental conditions .............................................. 11
Figure2: Experimental design ................................................................................................. 12
Figure 3: Example of the array and positioning of the probe ................................................. 14
Figure 4: Averaged mean concentration changes(µm) in HbO2 and HHb across all subjects
per channel. .............................................................................................................................. 16
Figure 5: Mean concentration changes, in ROI, for Upright PLW and Spatially Scrambled
PLW ......................................................................................................................................... 18

iii
Acknowledgements
First of all, I want to thank to my family. Nothing in the last five years would have been
possible without them, their patient, and motivation. To my mom, specially, because she
supported all my dreams and never allowed me to quit.
To Doctor Alfredo Pereira, for so many knowledge opportunities and for allowing me
to make this dissertation a research project based on the two areas that interest me the most.
Thank you for all the Statistics lessons, paper discussions, and for being a role model.
To Isabel Lisboa for all her help, all the teaching, patience and for always being an
inspiration. Science is only possible because of people like her and I am very grateful for this
amazing opportunity.
To Juliana Serra for all the help with data collection and for all the conversations about
psychology and sharing of experiences.
To Daniel Basso, for all the help with the more technical details and his amazing
programming knowledge.
To the Laboratory of Visualization and Perception team, in particular to Mariana Silva,
for the last years.
To all my friends. Thank you for all the help, support and for the amazing experiences
that we share. Thank you for always being there.
To all parents and infants that spent their time for participating in this study. This work
will not be possible without them.
“Science is a beautiful gift to humanity; we should not distort it.”
A.P.J.Abdul Kalam

iv
Ativação na Região Posterior Temporal Direita, aos 7 Meses de Idade, para Point-Light
Walkers Canónicos: Um Estudo fNIRS
Resumo
Os seres humanos são especialmente hábeis a distinguir o movimento de seres vivos dos outros
tipos de movimento. Estudos desenvolvimentais indicam que a preferência pelo movimento
biológico (MB) é observável desde cedo na infância. Recentemente, tem-se procurado
compreender as bases neuronais associadas a este processo. Uma conclusão consistente nos
estudos conduzidos com técnicas de neuroimagem e eletrofisiologia é que o Sulco Temporal
Superior (STS) direito parece estar associado ao processamento de MB assim como à cognição
social. No entanto, a via neuro-desenvolvimental associada a este processo não é clara. O
presente estudo, conduzido com fNIRS, mediu a resposta hemodinâmica na Região Posterior
Temporal direita –que inclui a STS - a um estímulo padrão em estudo do MB, Point-Light
Walkers (PLW). Testaram-se sujeitos com sete meses de idade (n = 11), num design
experimental intra-sujeito, com duas condições experimentais: um PLW canónico e (2) um
Spatially Scrambled PLW, ambos em aproximação. Os resultados demonstraram resposta
hemodinâmica ao PLW canónico, comparativamente ao Spatially Scrambled PLW na região
temporal posterior direita. Estes resultados parecem confirmar os resultados anteriores e, que
nesta idade, o MB é processado de uma forma diferente de outro tipo de movimento nesta
região.
Palavras-Chave: Movimento Biológico (MB); Região Temporal Posterior; functional
near-infrared spectroscopy (fNIRS); Desenvolvimento Infantil; Point-Light Walker (PLW)
v
Activation in the Right Posterior Temporal Region of 7-Months-Olds to Upright Point-Light
Walkers: A fNIRS Study
Abstract
Humans are particularly good in distinguishing the movements of living beings from another
type of motions. Studies conducted with children showed that the preference for biological
motion (BM) can be observed early in infancy. Recently, researchers are focusing on
understanding the neurological basis associated to the processing of BM. One conclusion that
has been consistent across the studies conducted with neuroimage and electrophysiological
techniques is that the right Superior Temporal Sulcus (STS) seems to be associated to BM’s
processing and with social cognition. However, the developmental path associated with this
process is unclear. The present study, conducted with fNIRS, measured the haemodynamic
response in right posterior temporal region – an area that includes the right posterior STS- to a
standard stimuli of BM study, Point-light walkers (PLW). Seven-months-olds infants (n = 11)
were tested in a within-subjects blocked design with two experimental conditions: (1) an
Upright PLW and (2) a Spatially Scrambled PLW, both approaching. The results demonstrated
haemodynamic response for the Upright PLW, compared to the Spatially Scrambled PLW, in
the right posterior temporal region. These results are in accordance with previous findings and
that, at this age, BM is processed differently from other types of motion in this region.
Key-Words: Biological Motion (BM); Right Temporal Posterior Region; functional
near-infrared spectroscopy (fNIRS); Infant Development, Point-Light Walker (PLW).

6
Introduction
We live in a dynamic moving world and from all different kinds of motion, we seem to
be particularly tuned to Biological Motion. The term Biological Motion (BM) has been coined
by Gunnar Johansson to refer to the ambulatory patterns of terrestrial bipeds and quadrupeds
(Hoffman & Flinchbaugh, 1982). This type of motion, is typically a semi-rigid motion: when a
vertebrate moves, its limbs and torso undergo a specific pattern of non-linear motion
constrained by the rigid skeletal structure of its supporting body. Spatial relationships among
certain body parts are continuously changing (e.g. the motion of the arm and the motion of the
hip), whereas spatial relations between other parts remain invariant, i.e: the distance between
their connected joints is rigid and does not change , for example the distance between the elbow
and shoulder (Bardi, Regolin, & Simion, 2011).
The seminal work of Johansson (1973) introduced a technique for studying biological
motion using only minimal information: he attached small illuminated dots to the major joints
of a human participant and created a Point-Light Walker (PLW); from these, the motion of a
person walking could readily be identified. Johansson showed that the human visual system
only needs five to ten dots in adequate combinations of proximal motion to give the vivid
impression of a person walking and that we need no more than 200ms of stimuli presentation
to identify a PLW (Johansson, 1973). This technique is one of the most robust and replicable
methodologies used in the study of the processing of BM and has the advantage of allowing the
separation of information revealed by motion from other sources of information (e.g.: form,
texture, color, etc.). The Point Light Displays (PLD) technique has been largely used in studies
with adults but also with infants. Canonical PLW is the most common stimulus used in this
research field and consists of a PLW in an upright orientation. Most of the studies contrasted
performance between canonical PLW’s with manipulations, namely inversion, masking and
other types of motion (random or not), using tasks of discrimination, preferential looking and
force-choice paradigms. The use of PLD is important in the extent that it allows us to study the
impact of specific motion properties in BM’s perception: a key question in this research field
is the contribution of the global motion structure, the local relation between the dots , and each
individual dot’s motion to BM perception (Bertenthal & Pinto, 1994).
Developmental studies, using behavioral tasks, show that visual sensitivity to BM
emerges early on: by four-six months of age, infants exhibit a preference for a canonical point-
light human walker over an inverted walker or a random motion (Fox & McDaniel, 1982) and
by five months of age infants are sensitive to local rigidity on an upright PLW but not in inverted

7
PLW’s (Bertenthal, Proffitt, & Kramer, 1987). In fact, more recent studies conducted with
newborns found that a preference for biological motion is present at birth: one study conducted
with two-day-old newborns that used a point-light hen as stimulus found a visual preference for
an upright hen over a random motion or an upside-down display (Simion, Regolin, & Bulf,
2008). By nine months of age, infants discriminate a human point-light walker from similar
displays with scrambled spatial relationship (Bertenthal, Proffitt, Spetner, & Thomas, 1985)
which suggests that at least by that age infants detect a structure consistent with a human form
in PLDs. Another experiment conducted with two-day-old infants demonstrated that newborns
discriminate between a walking and a scrambled hen, however the subjects did not show any
preference for the walking hen compared to the scrambled hen (Bardi et al., 2011). Additionally,
another study conducted with three day-old infants demonstrated that newborns do not exhibit
any preference for a PLW over random motion when both stimuli had a translational component
(Bidet-Ildei, Kitromilides, Orliaguet, Pavlova, & Gentaz, 2014). The outcome of these studies
suggests that since early infancy, humans are sensitive to some spatial relationships between
the elements that compose biological motion although this topic is not completely understood.
In neuroimaging studies one brain area has been consistently associated with BM
processing: the Superior Temporal Sulcus (STS), an area linked to social cognition (Pavlova,
2011; Troje, 2013). The study of this connection, has received important contributions from
neuroimaging and electrophysiological techniques. These techniques also revealed several
brain areas involved in BM processing. Grossman et al. (2006) conducted a study with
functional magnetic resonance imaging (fMRI) in adults and compared neural activation
elicited by BM vs Scrambled Motion, using the PLD technique. Their main finding was a single
locus of activation for biological motion was found in the posterior STS (Grossman et al.,2000).
Their results were corroborated by other studies, such as Vaina, Solomon, Chowdhury, Sinha,
and Belliveau (2001) and Beauchamp, Lee, Haxby, and Martin (2003).
Recently, several neurodevelopmental studies have started mapping BM processing in
infancy, in particular electroencephalography (EEG) studies. Reid, Hoehl, and Striano (2006)
conducted one study with infants and EEG on BM’s processing. Their results indicate that, by
eight months of age, right parietal regions are involved in the detection and assessment of
biological motion and that brain activity has a larger amplitude for a PLW with upright
orientation in the right hemisphere when compared with an inverted PLW. Hirai and Hiraki
(2005) tested eight-month-olds infants, using EEG, to study the neural correlates to the
perception of BM when presented with upright PLW and scrambled Motion. The main from
this study were: (1) during perception of BM, the average amplitude of response in the right
8
hemisphere was greater than in the left hemisphere; and (2) response to BM was significantly
greater than to scrambled motion. The main activation observed corresponded to the T5/T6
areas (using the 10-20 system), which are in the occipital-temporal region. The results of this
study appear to coincide with prior work on biological motion processing in adults, suggesting
that right occipital-temporal region, including the STS, plays an important role in BM’s
perception. Finally, Marshall and Shipley (2009) collected event-related potential (ERP) data
from five-months-old infants using a set of PLDs performing different actions. Infants were
presented with two conditions of PLDs, (1) upright canonical sequences (running, walking,
throwing a ball and kicking a ball) and (2) position-scrambled versions of the same sequences.
They hypothesized that infants would be sensitive to the contrast between scrambled and
canonical displays. Their results revealed that, at mid-parietal and occipital sites, the canonical
stimuli produced a more positive-going wave-form to the scrambled stimuli. At the temporal
and parietal sites, the wave-form elicited for the scrambled PLD’s was more positive than the
waveform to the canonical displays. In summary, this study provided converging evidence that
by five months, the processing of the upright human motion is sensitive to disruptions in global
form.
Infants reveal differences in the processing of upright PLW and scrambled PLW’s.
Behavioural studies indicate a discrimination since very early between BM, scrambled and
random motion (Bertenthal, Proffitt, & Cutting, 1984; Bertenthal, Proffitt, Kramer, & Spetner,
1987; Fox & McDaniel, 1982). Neurophysiological studies also indicate different neural
responses for an upright PLW vs scrambled motion in occipito-temporal region, specifically in
the right hemisphere (Hirai & Hiraki, 2005; Marshall & Shipley, 2009). These observations
suggest that global motion structure is important for BM processing. The STS, localized in the
temporal area, seems to play an important role for the BM processing to. However, EEG studies
have a poor spatial resolution making localization and in particular determining if STS is
involved in BM processing difficult.
Another (relatively novel) technique that has been used to study infants is functional
near-infrared spectroscopy (fNIRS). fNIRS measures patterns of the haemodynamic activity
based on near-infrared light that is emitted by sources located on the head, is reflected by the
cortex, and is detected by the detectors placed in the head. The attenuation (or loss) of this light
(in a wavelength range of 650-1000 nm) is due to both absorption and scattering effects within
the cortical tissues (Lloyd-Fox, Blasi, & Elwell, 2010). As scattering is assumed to be constant
(León-Carrión & León-Domínguez, 2012), the changes measured in the attenuation of near-
infrared light can be used for calculate the changes in oxy-haemoglobin (HbO2), deoxy-

9
haemoglobin (HHb) and total haemoglobin (HbT) in the eliminated tissue. The changes in the
concentration of these chromophores can be used as surrogate markers of brain blood flow and
hence provide a means of investigating brain function (Lloyd-Fox et al., 2010); fNIRS is non-
invasive, portable and relatively inexpensive with a good spatial resolution (when compared to
EEG) and good temporal resolution (higher than fMRI) which makes it a useful technique to
study the functional activation of an infant’s brain. In recent years, a growing number of studies
examined BM processing using fNIRS in infants. Although the number of studies with fNIRS
is increasing, most them focused on face perception and used stimulus with intact color and
texture information (in contrast to PLWs). Nevertheless, they provided the first important
findings: in infants as young as five months of age areas located around the STS region activate
to dynamic social stimuli (Lloyd‐Fox et al., 2009); infants between seven-eight months show
greater differences between HbO2 and HHb for upright PLD’s, compared to inverted PLD and
in the right hemisphere (Ichikawa, Kanazawa, Yamaguchi, & Kakigi, 2010).
In a recent study, Lisboa, Miguel, Sampaio, Mouta, Santos & Pereira (2017) conducted
an experiment with seven-month infants and fNIRS, using Point-Light Walkers for the first
time in a fNIRS study. Participants watched front-facing approaching stimuli in three different
experimental stimuli (an intact upright PLW, the same PLW inverted and one single frame of
the upright PLW) and their results demonstrated that, in the right middle-posterior temporal
cortex, mean concentration change of oxy-haemogoblin was significantly different from
baseline only in the upright PLW condition. This was the first study to measure hemodynamic
response specifically to an important class of highly-controlled stimuli (PLW’s) and the study
results supports findings from behavioral studies, only the canonical PLW elicited a
haemodynamic response.
In summary, both behavioral and neurophysiological studies indicate that global motion
structure is important for BM processing. However, there is no fNIRS study that has directly
compared intact global motion structure, as present in canonical PLW’s, with a scrambled
version of the PLW that maintains the local dot motion but disrupts global motion structure, as
present for instance in a PLW where we add a random fixed offset to every point. For this
reason, the present study involved a combination of two experimental stimuli: one is the upright
PLW used by Lisboa et al. (2017), and the other consist of a spatially scrambled PLW, based
on the upright PLW but with a disrupted global motion structure.

10
Specifically, we ask: in seven-month-olds, the right posterior temporal region has
different hemodynamic responses for upright PLW vs a spatially scrambled PLW? We
hypothesized that the hemodynamic response is higher for upright PLW compared to a spatially
scrambled PLW. This hypothesis is based in accordance with previous behavioral studies that
indicate discrimination between PLW vs scrambled PLW’s or random motion and ERP’s
studies that shown higher neural activation for upright PLW when compared with other PLD’s.
Methods
Participants
The final sample consisted of eleven infants (N = 16, n = 11) aged between seven and
eight months of age (4 females, mean age = 7 months and 24 days, SD = 11 days; see table 1
for details). An additionally five subjects were tested but their data was excluded because they
did not accomplish inclusion criteria (n = 4) or due to equipment failure (n = 1) (attrition rate =
31.25 %). Subjects were recruited through direct contacts with their parents. All parents were
informed of the procedure of the experiment and gave informed consent, as approved by the
University of Minho.
Table 1
Sample Sociodemographic.
Characterization of the sample
Number of infants 11
Age at birth (weeks) 39 weeks (12 days)
Age at study (Months, days) 7 months and 24 days (11 days)
Weight at birth (g) 3141.27 (522)
Height at birth (cm) 48.55 (2.52)
Cesarean delivers 1 (9%)
Apgar 1 9.27 (0.44)
Apgar 10 10
Head circumference (cm) 44.78 (1.62)
Nasion inion (cm) 27.24 (1.42)
Age of the mother (Years) 33.27 (3.24)
Age of the father (Years) 35.54 (2.57)
Note: Standard Deviations appear in parentheses after the mean, except for cesarean delivers
that is presented in absolute number followed by the percentage.

11
A sociodemographic questionnaire was used to evaluate some general information about
the infant’s development – only typically developing infants were included in the final sample
(birth weight > 2kg; gestation period > 37 weeks; Apgar > 7) – see table 1.
Stimuli and Experimental Design
Two different approaching PLWs were used: (1) an Up-Right Point Light Walker
(Upright PLW) and (2) a Spatially Scrambled Point-Light Walker (Spatially Scrambled PLW)
(see figure 1) both translating over the viewer’s frontal plane.
The upright PLW consisted of a male model (13 dots) walking two steps from the back
to the front in the frontal plane, for details on motion acquisition and stimulus construction see
Mouta, Santos, and López-Moliner (2012); Lisboa et al. (2017). The area covered by the
stimulus in visual angle ranged between 13° 41' x 5° 43’, initially, and 24° 48’ x 24° 48’ at a
viewing distance of 50 cm.
For the Spatially Scrambled PLW, each dot of point-light display corresponded to a dot
representing a joint of the PLW with exact same motion vectors found in the Upright PLW, but
the initial starting positions were randomized. This manipulation left the motion paths of each
joint intact, but perturbed the coherent spatial relations among the dots- the global motion
structure. Both stimuli were generated with Blender (Open source 3D program), version 2.78,
with a resolution of 1440 x 900 pixels and a frame rate of 60 frames.
The stimulus used in the baseline condition consisted of a static image, made from the
middle frame, of the Spatially Scrambled PLW; this frame was extracted from another
Spatially Scrambled PLW, different from the one used for the experimental condition (see
figure 1).
Figure 1. Stimuli used in baseline and experimental conditions (baseline, Up-Right PLW,
Spatial Scrambled PLW, respectively).

12
Subjects participated in a within-subjects blocked design comprised of two experimental
conditions (Upright PLW and Spatially Scrambled PLW) and one baseline condition. There
were eight blocks: four blocks with an Upright PLW and the other four with a Spatially
Scrambled PLW. The presentation order of the blocks was randomized. Each block contained
a baseline period (18 seconds) and an experimental period (10 seconds).
In both periods (baseline and experimental), fruits and pleasant sounds were introduced
to draw and keep the infant’s attention (Ichikawa et al., 2010). Thus, baseline period contained
the presentation of a still frame from the Spatially Scrambled SPLW for 4 seconds, followed
by the presentation of the fruit image together with the pleasant sound (500 ms) – this was
looped four times per block. Additionally, the experimental period comprised the presentation
of one of the two experimental stimuli (2 seconds), followed by a fruit with a pleasant sound
(500 ms); this sequence was repeated four times per block. The baseline period was longer, in
accordance with the majority of studies conducted with infants and fNIRS, to allow the
hemodynamic response initiated during the experimental condition to return to a baseline level
(Lloyd-Fox et al., 2010), since it is typically necessary more than 10 seconds for the
hemodynamic response to return to baseline (Taga, Asakawa, Maki, Konishi, & Koizumi,
2003). Both experimental conditions were randomized and counterbalanced for each
participant.
Figure 2. Experimental design.
Procedure
Initially, the parent answered to a sociodemographic questionnaire and measurements
of the infant’ head circumference, nasion-inion and ear-to-ear distance were made, in order to
mark the CZ point in the infant’s head. Then, the parent and the infant were sent to the fNIRS
room and the probe was placed in infant’s head, using the marked Cz as the main reference for
cap placement. During the experiment, infants sat on their parent’s lap and watched the stimuli
on the monitor with a viewing distance of, approximately, 50 cm. The parent was instructed to
refrain from interacting with the infant during the stimuli presentation and no talking was
allowed during the recording. An experimenter sat next to the infant, tapping the screen to

13
redirecting his/her attention whenever the infant looked away. Infants were also allowed to use
a pacifier or/and rubbers toys to stay calm during the session.
The experiment ended when the infants watched all experimental design (i.e. after 16
trials) or when the infants became bored or fussy. During the experiment, each infant watched
the stimulus passively while their brain activity was recorded and their visual fixations were
videotaped. Fixation towards the screen was coded to assess the valid trials for each infant. To
be included in final sample the following inclusion criteria need to be fulfilled: a) look, at least,
five seconds to the experimental stimuli in each trial and b) at least three valid trials in each
experimental condition.
To prevent the infant from becoming tired and/or fussy a pause was made on the middle
of the stimulus presentation.
NIRS Recording and processing
The UCL optical topography system (Everdell et al., 2005) was used to register the
haemodynamic response in theright posterior temporal region. During the experiment, infants
used an elastic cap (Easycap, GmBH), that was built using as reference the 10-5 system (Jurcak,
Tsuzuki, & Dan, 2007). To ensure the alignment of the probe in the head, with the 10-5 system,
we measured head circumference and nasion-inion distance. The mean average for head
circumference was 44,78 cm (SD = 1,55 cm) and the nasion-inion distance was 27,24 cm (SD
= 1,42 cm). The array was composed of six optodes (that emitted continuous near-infrared light
at two fixed wavelengths of 780 and 850 nm) and three detectors (that captured data at 10Hz),
containing a total of nine channels (see figure 4). The probe was customized to position these
nine channels over the right posterior Superior Temporal area (Lloyd-Fox et al., 2014). The two
channels that crossed the middle of array (the longest channels, 12 and 17), had a 54-36mm
source-detector separation and the other seven (channels 10, 11, 14, 15, 17, and 18) had 20-
22mm. Additionally, we recorded more 9 channels in the motor area but their data was not used
in this study. To confirm the correct location of the channels, we took photos of the infant’s cap
placement.
Raw data was converted into .nirs format for analysis in the HOMER2 system (Huppert,
Diamond, Franceschini, & Boas, 2009). The signal in every .nirs files was visually inspected
for each channel and channels 12 and 16 were eliminated in all infants because of low intensity
of the signal. After, we applied a wavelet motion correction (0.5 Hz) to remove motion artefacts.
Following this correction, data was bandpass filtered, using a low-pass filter (0.5 Hz). Then the
filtered data of each wavelength was converted to relative concentration of HbO2 and HHb by
applying the Beer-Lambert Law (Kocsis, Herman, & Eke, 2006).

14
Finally, HbO2 and HHb concentration was baseline corrected and block averaged from
-2 s before the onset of each trial and +10 s after trial offset. The mean concentration changes
for each channel was calculated at 10Hz. Based on that, the mean concentration for each
channel between all subjects was calculated, for the two experimental conditions.
Results
For statistical analysis, four time windows of 5s after the onset of the stimulus were
defined for the mean hemodynamic concentration change analysis. The data was not normally
distributed (Shapiro-Wilk, all p’s < .05) and standard transformations to normality did not yield
a normally distributed random variable; for this reason, we used a non-parametric test, the
Fisher-Pitman Permutation test. Analysis were conducted in R, using the coin package
(Hothorn, Hornik, Van De Wiel, & Zeileis, 2008).
Initially, statistical tests were conducted, for each channel, on the pre-selected four time
windows, and for each condition (Upright PLW and Spatially Scrambled PLW), with the
purpose of testing if the concentration changes in HbO2 were different than zero. After this
initial analysis, we identified spatially continuous channels (as in Biondi, Boas, and Wilcox
(2016), with similar activation patterns, that could be grouped together and identified one
Region of Interest (ROI) defined by channels 10, 11, 13, 14 and 15. The same statistical test
was applied in the same time windows, for both experimental conditions. Finally, we tested if
the differences in mean HbO2 between the two experimental conditions were statistically
significant.
Individual channel analysis
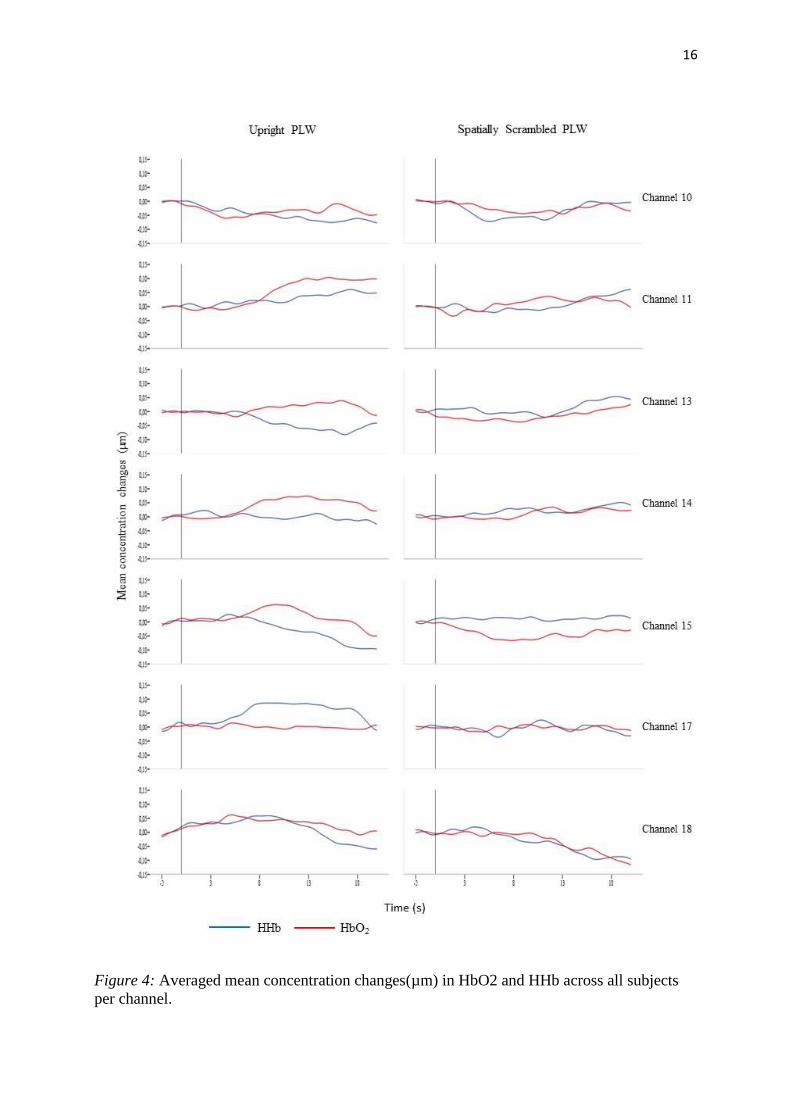
Fisher-Pitman Permutation test was conducted for HbO2 and HHb concentration
changes and for each channel. Figure 5 shows the average mean concentration changes, HbO2
Figure 3. Example of the array and positioning of the probe.

15
and HHb, for all subjects across the six channels (10, 11, 13, 14, 15, 17, 18) and for the two
experimental conditions.
Table 2
Number of valid trial for condition for each participant
Number of valid trials
Subject Upright PLW Spatially Scrambled PLW
1 3 6
2 4 4
3 5 5
4 8 7
5 4 4
6 6 6
7 4 7
8 5 6
9 6 5
10 5 5
11 6 8
Total 56 63
Fisher-Pitman permutation test compared the mean concentration changes in HbO2 and
HHb (during the four time windows previous described) evoked by each experimental condition
for the six channels in relation to baseline (see Table 3).
For the Upright PLW condition a significant increase in HbO2 was found both on
channels 10 and 11; marginally significant activations were also found on channel 11 in another
time window and on channel 14.
On channel 10, statistically significant results were found around 0-5s (Z = 1.83, p = .01) and
channel 11 at 10-15s (Z = 2.05, p = .03). Additionally, marginally significant results were also
found for channel 11 in time window between 15-20s (Z = 1.72, p = .06) and for channel 14
between 10-15 (Z = 1.6, p = 0.09).
Relative to an HHb decrease, only marginally significant results were found on channels
10 and 15 in the Upright PLW condition. For channel 10 in the time window 15-20s (Z =-1.74,
p = .05), channel 15 in the time window 10-15s (Z = -1.75, p = .08) and 15-20s (Z = -1.82, p =
.06).
16
Figure 4: Averaged mean concentration changes(µm) in HbO2 and HHb across all subjects
per channel.

17
Table 3
Fisher-Pitman Permutation Test results for all channels and Upright PLW and Spatially
Scrambled PLW conditions
Channel
Time
window
Upright PLW Spatially Scrambled PLW
∆HbO2 (µm) ∆HHb(µm) ∆HbO2(µm) ∆HHb (µm)
Z p Z p Z p Z p
10 ]0,5] 1.83 0.01** -0.79 0.52 -0.44 0.68 -1.77 0.06†
]5,10] -1.09 0.33 -0.99 0.39 -1.03 0.34 -1.85 0.07†
]10,15] 0.75 0.53 -1.34 0.19 -0.83 0.54 -1.52 0.14
]15,20] -0.58 0.64 -1.74 0.05* -0.4 0.66 -0.13 0.89
11 ]0,5] -0.62 0.56 0.57 0.58 -0.94 0.38 -0.28 0.82
]5,10] 0.85 0.43 0.61 0.56 0.31 0.79 -0.88 0.43
]10,15] 2.05 0.03* 0.78 0.5 0.54 0.64 -0.00 1
]15,20] 1.72 0.06† 0.89 0.5 0.43 0.67 -0.95 0.39
13 ]0,5] -0.15 0.9 -0.12 0.93 -1.59 0.11 0.58 0.56
]5,10] 0.13 0.93 -0.79 0.51 -1.54 0.15 -0.12 0.91
]10,15] 0.94 0.36 -1.58 0.13 -0.63 0.55 -0.05 0.98
]15,20] 0.46 0.67 -1.09 0.33 0.3 0.78 1.30 0,24
14 ]0,5] -0.23 0.82 0.63 0.72 -0.29 0.78 0.37 0.73
]5,10] 1.44 0.17 0.05 0.95 -0.08 0.94 0.97 0.44
]10,15] 1.6 0.09† 0.02 0.98 1.24 0.24 0.77 0.46
]15,20] 0.82 0.63 -0.19 0.86 0.99 0.36 1.06 0.30
15 ]0,5] 0.32 0.94 0.37 0.70 -1.65 0.08 0.74 0.51
]5,10] 1.29 0.21 0.22 0.85 -2.33 0.01** 0.45 0.74
]10,15] 1.23 0.22 -1.75 0.08† -2.02 0.03* 0.24 0.86
]15,20] -0.38 0.73 -1.82 0.06† -0.93 0.41 0.29 0.8
17 ]0,5] 0.14 0.92 1.10 0.28 -0.49 0.65 -0.36 0.72
]5,10] 0.06 0.96 1.94 0.04* 0.00 0.99 -0.42 0.68
]10,15] -0.08 0.99 1.62 0.01** -0.26 0.8 0.08 0.94
]15,20] -0.05 0.98 0.68 0.55 -0.08 0.95 -0.17 0.87
18 ]0,5] 0.99 0.35 1.08 0.34 -0.29 0.81 0.84 0.44
]5,10] 0.89 0.41 1.28 0.23 -0.19 0.86 0.73 0.48
]10,15] 0.71 0.49 0.45 0.67 -1.53 0.09 -2.46 0.01**
]15,20] 0.09 0.92 -0.94 0.35 -1.85 0.05* -2.73 0.00***
Note: † p ≤ .1; * p ≤ .05; ** p ≤ .01; *** p ≤ .001

18
For the Spatially Scrambled PLW condition, a significantly decrease in HbO2 changes
in the channel 15 for time window between 5-10s (Z = -2.33, p < .01) and 10-15 s (Z = -2.02;
p = .03) was registered. Also, marginally significant decreases were registered for channel 15
in time window between 0-5s (Z = -1.65, p = .08) and for channel 18 in the time window 10-
15s (Z = -1.53, p = .09) and 15-20s (Z = -1.85, p = .05). Importantly, these results are not
associated with a typical NIRS’ functional response.
On the contrary, HHb significant changes were associated with a functional response on
channel 18, that showed a significant HHb decrease between 10-15s (Z = -2.46, p = .01) and
25-20s (Z = -2.73, p < .01). Channel 15 also registered marginally significant decreases in HHb
changes in time window 0-5s (Z = -1.77, p =. 06) and 5-10s (Z = -1.85; p = .07).
ROI analysis
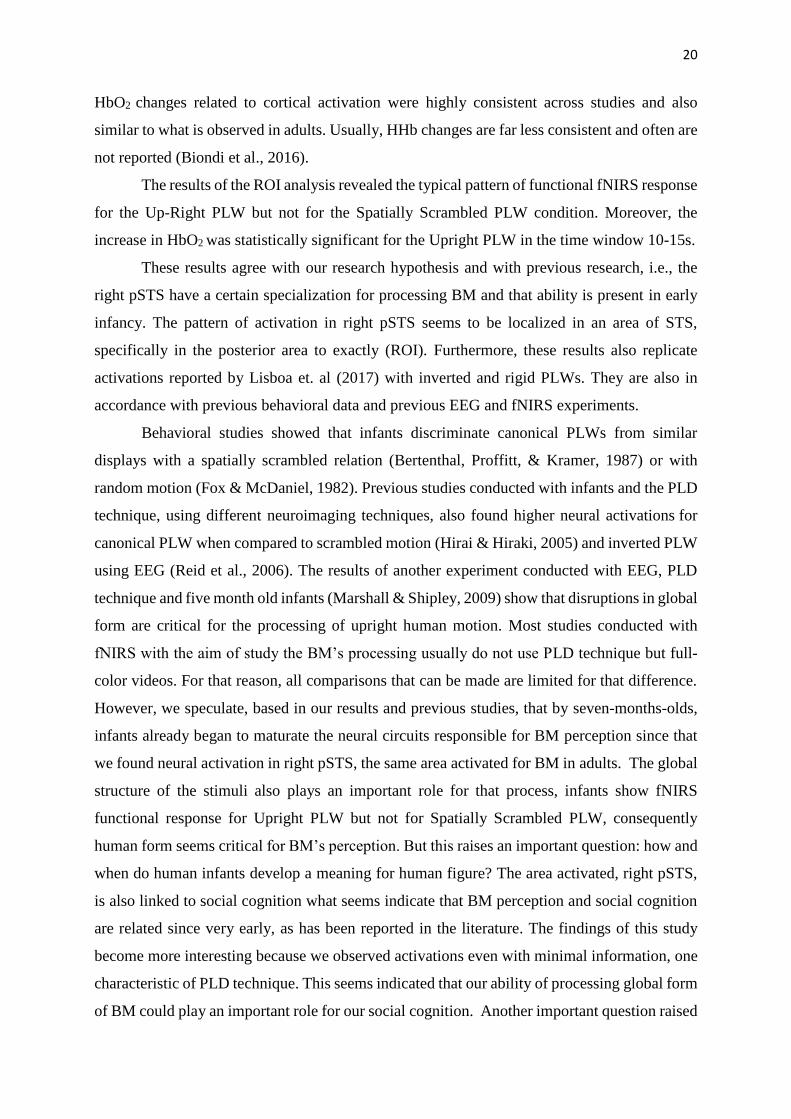
Fisher-Pitman Permutation test results are summarized in table 4. Marginally significant
increases in HbO2 changes were found for Upright PLW, in the time window 10-15s (Z = 1.84,
p = .06). For Spatially Scrambled PLW we did find any significant increase in HbO2 changes.
Finally, both experimental conditions (Upright PLW and Spatially Scrambled PLW)
were tested (see figure 6) for a mean concentration changes in HbO2, in the time window 10-
15s. The Fisher-Pitman Permutation test result indicated a significant difference between the
conditions 10-15s (Z = 2.05, p < 0.05).
Figure 5. Mean concentration changes, in ROI, for Upright PLW and Spatially Scrambled PLW
(left). HBO2 mean concentration changes for Upright PLW and Spatially Scrambled PLW, in
ROI (right).

19
Table 4
Results of Fisher-Pitman Permutation test for ROI analysis
∆HbO2 (µm) ∆HHb(µm)
Condition Time
Window
Z p Z p
Upright PLW
]0,5] -0.79 0.45 0.09 0.92
]5,10] 0.93 0.37 -0.53 0.64
]10,15] 1.84 0.06† -1.14 0.28
]15,20] 0.74 0.51 -0.88 0.45
Spatially
Scrambled
PLW
]0,5] -1.11 0.29 -0.59 0.93
]5,10] -1.13 0.30 -0.39 0.72
]10,15] -0.41 0.69 -0.21 0.87
]15,20] 0.025 0.98 1.09 0.30
Note: † p ≤ .1
Discussion
We measured the response in the right posterior temporal region to Upright PLW and
Spatially Scrambled PLW and hypothesized that an Upright PLW would elicit higher neural
activations, as measured by the increase in HbO2 concentration, compared to a Spatially
Scrambled PLW. Our fNIRS array and the use of this technique does not allow for a direct
localization in the right STS – the array measured a larger right posterior temporal region; we
can infer that the area covered for the array is the pSTS because of a co-registration study,
between fNIRS and fMRI, conducted by Lloyd-Fox et al. (2014). The fNIRS response, for
Upright PLW condition, indicates significant increases in HbO2, in two individual channels
(channel 10 and channel 11) and a marginally significant increase in channel 14. Additionally,
when the signal was visually inspected (see figure 4) the typical functional fNIRS response –
increase in HbO2 and decrease in HHb – could be observed in all channels, except for channels
17 and 18 in the Upright condition. In contrast, in the Spatially Scrambled PLW condition,
increase in HbO2 was not significant in any of the individual channels and the visual inspection
of the hemodynamic response does not reveal the typical functional fNIRS activation.
Typical functional response in fNIRS in adults shows an increase in oxy-haemogoblin
(HBO2) and a (relatively smaller) decreased in deoxy-haemogoblin (HHb) (Villringer &
Chance, 1997). However, this pattern of response is not so clear in infants; (Lloyd-Fox et al.,
2010) conducted a review across studies done with infants and fNIRS and concluded that only
20
HbO2 changes related to cortical activation were highly consistent across studies and also
similar to what is observed in adults. Usually, HHb changes are far less consistent and often are
not reported (Biondi et al., 2016).
The results of the ROI analysis revealed the typical pattern of functional fNIRS response
for the Up-Right PLW but not for the Spatially Scrambled PLW condition. Moreover, the
increase in HbO2 was statistically significant for the Upright PLW in the time window 10-15s.
These results agree with our research hypothesis and with previous research, i.e., the
right pSTS have a certain specialization for processing BM and that ability is present in early
infancy. The pattern of activation in right pSTS seems to be localized in an area of STS,
specifically in the posterior area to exactly (ROI). Furthermore, these results also replicate
activations reported by Lisboa et. al (2017) with inverted and rigid PLWs. They are also in
accordance with previous behavioral data and previous EEG and fNIRS experiments.
Behavioral studies showed that infants discriminate canonical PLWs from similar
displays with a spatially scrambled relation (Bertenthal, Proffitt, & Kramer, 1987) or with
random motion (Fox & McDaniel, 1982). Previous studies conducted with infants and the PLD
technique, using different neuroimaging techniques, also found higher neural activations for
canonical PLW when compared to scrambled motion (Hirai & Hiraki, 2005) and inverted PLW
using EEG (Reid et al., 2006). The results of another experiment conducted with EEG, PLD
technique and five month old infants (Marshall & Shipley, 2009) show that disruptions in global
form are critical for the processing of upright human motion. Most studies conducted with
fNIRS with the aim of study the BM’s processing usually do not use PLD technique but full-
color videos. For that reason, all comparisons that can be made are limited for that difference.
However, we speculate, based in our results and previous studies, that by seven-months-olds,
infants already began to maturate the neural circuits responsible for BM perception since that
we found neural activation in right pSTS, the same area activated for BM in adults. The global
structure of the stimuli also plays an important role for that process, infants show fNIRS
functional response for Upright PLW but not for Spatially Scrambled PLW, consequently
human form seems critical for BM’s perception. But this raises an important question: how and
when do human infants develop a meaning for human figure? The area activated, right pSTS,
is also linked to social cognition what seems indicate that BM perception and social cognition
are related since very early, as has been reported in the literature. The findings of this study
become more interesting because we observed activations even with minimal information, one
characteristic of PLD technique. This seems indicated that our ability of processing global form
of BM could play an important role for our social cognition. Another important question raised
21
by our results is: is it possible that subjects with impairments in BM processing show a deficit
in social development? The research field of the link between BM and social cognition is
relatively new but clearly is a research field that need more studies.
In the present study, the stimuli used maintained the translation component, which is an
innovation since most studies conducted in this research field use stimuli without translation (e.
g. treadmill). The problem of using stimuli without translation is the lack of an ecological
approach since that the movement of others human beings that we perceive in our everyday life
is composed by that component. The importance of the translation displacement in BM’ s
perception has become an important topic of discussion. A study conducted by Bidet-Ildei et
al. (2014), with newborns, suggested that translational displacement is important for visual
processing of BM. When newborns were presented with a PLW and random motion, both with
translation, did not exhibit any preference. However, our results, with an Upright PLW and
Spatially Scrambled PLW, show a different result for infants with seven-months-old. Although
both stimuli have translational displacement was exhibit higher neural response to Upright
PLW condition. In this sense, it will be interesting conducted the same experimental design of
this study with newborns to verified if the pattern of the haemodynamic response is different
from what was found in this study.
The difference registered between the channels of ROI and channels 17 and 18 could be
an interesting result, some previous studies (Lloyd‐Fox et al., 2009; Pelphrey, Morris,
Michelich, Allison, & McCarthy, 2005) already report similar results, however need
complementary studies.
This study was also a continuation of the study conducted by Lisboa et al. (2007) with
some methodological changes, especially in the duration of the stimuli. Our results indicate that
even with shorter stimuli it is possible to elicit the typical hemodynamic response. This is an
important experimental improvement given that has reduced the attrition rate. Another
difference between both experimental designs was the number of trials. The experimental
designed of Lisboa et al. (2017) comprised 48 trials and the one used in this study comprised
32trials. The reduction of trials also was important for the reduction of the attrition rate.
In summary, this study seems be in accordance with previous research about the neural
basis of BM’s processing. The results indicate that by seven-months old infants already activate
the same brain area, right pSTS, that adults for BM. The form also seems be an important feature
for this activation, what is in accordance with previous EEG studies. As a continuity study of
Lisboa et al. (2007), our results corroborate the previous findings and the new experimental
design adjustments revealed themselves as an important improvement.

22
Limitations
This study had some limitations. The main limitation was the small sample. The haemodynamic
response in infants have a significant variance and as our sample was small this variance had
some implication in results.
Another limitation of this study is related with the material. The array used only allow
recording for the right pSTS, but it would also be interesting to record the left pSTS, in order
to understand if the pattern of haemodynamic response is the same. It has been shown that the
processing of BM’s seems to be lateralized to the right hemisphere in adults but can we observe
the same at seven months old?
The combination between fNIRS and fMRI would be interesting for a better
understanding of the hemodynamic response in pSTS in infants. fNIRS is considered a good
technique but the spatial resolution of data does not allow answer some question raised, as the
existence of a specific area in right pSTS for BM.

23
Bibliography
Bardi, L., Regolin, L., & Simion, F. (2011). Biological motion preference in humans at birth:
role of dynamic and configural properties. Developmental science, 14(2), 353-359.
Beauchamp, M. S., Lee, K. E., Haxby, J. V., & Martin, A. (2003). FMRI responses to video
and point-light displays of moving humans and manipulable objects. Journal of
cognitive neuroscience, 15(7), 991-1001.
Bertenthal, B. I., & Pinto, J. (1994). Global processing of biological motions. Psychological
science, 5(4), 221-225.
Bertenthal, B. I., Proffitt, D. R., & Cutting, J. E. (1984). Infant sensitivity to figural coherence
in biomechanical motions. Journal of experimental child psychology, 37(2), 213-230.
Bertenthal, B. I., Proffitt, D. R., & Kramer, S. J. (1987). Perception of biomechanical motions
by infants: implementation of various processing constraints. Journal of Experimental
Psychology: Human Perception and Performance, 13(4), 577.
Bertenthal, B. I., Proffitt, D. R., Kramer, S. J., & Spetner, N. B. (1987). Infants' encoding of
kinetic displays varying in relative coherence. Developmental psychology, 23(2), 171.
Bertenthal, B. I., Proffitt, D. R., Spetner, N. B., & Thomas, M. A. (1985). The development of
infant sensitivity to biomechanical motions. Child development, 531-543.
Bidet-Ildei, C., Kitromilides, E., Orliaguet, J.-P., Pavlova, M., & Gentaz, E. (2014).
Preference for point-light human biological motion in newborns: contribution of
translational displacement. Developmental psychology, 50(1), 113.
Biondi, M., Boas, D. A., & Wilcox, T. (2016). On the other hand: Increased cortical
activation to human versus mechanical hands in infants. NeuroImage, 141, 143-153.
Everdell, N., Gibson, A., Tullis, I., Vaithianathan, T., Hebden, J., & Delpy, D. (2005). A
frequency multiplexed near-infrared topography system for imaging functional
activation in the brain. Review of Scientific Instruments, 76(9), 093705.
Fox, R., & McDaniel, C. (1982). The perception of biological motion by human infants.
Science, 218(4571), 486-487.
Grossman, E., Donnelly, M., Price, R., Pickens, D., Morgan, V., Neighbor, G., & Blake, R.
(2006). Brain areas involved in perception of biological motion. Brain, 12(5).
Hirai, M., & Hiraki, K. (2005). An event-related potentials study of biological motion
perception in human infants. Cognitive Brain Research, 22(2), 301-304.
Hoffman, D., & Flinchbaugh, B. (1982). The interpretation of biological motion. Biological
cybernetics, 42(3), 195-204.

24
Hothorn, T., Hornik, K., Van De Wiel, M. A., & Zeileis, A. (2008). Implementing a class of
permutation pests: the coin package.
Huppert, T. J., Diamond, S. G., Franceschini, M. A., & Boas, D. A. (2009). HomER: a review
of time-series analysis methods for near-infrared spectroscopy of the brain. Applied
optics, 48(10), D280-D298.
Ichikawa, H., Kanazawa, S., Yamaguchi, M. K., & Kakigi, R. (2010). Infant brain activity
while viewing facial movement of point-light displays as measured by near-infrared
spectroscopy (NIRS). Neuroscience letters, 482(2), 90-94.
Johansson, G. (1973). Visual perception of biological motion and a model for its analysis.
Perception & psychophysics, 14(2), 201-211.
Jurcak, V., Tsuzuki, D., & Dan, I. (2007). 10/20, 10/10, and 10/5 systems revisited: their
validity as relative head-surface-based positioning systems. NeuroImage, 34(4), 1600-
1611.
Kocsis, L., Herman, P., & Eke, A. (2006). The modified Beer–Lambert law revisited. Physics
in medicine and biology, 51(5), N91.
León-Carrión, J., & León-Domínguez, U. (2012). Functional near-infrared spectroscopy
(fNIRS): principles and neuroscientific applications Neuroimaging-Methods: InTech.
Lisboa, I.C., Miguel, H., Sampaio, A., Mouta, S., Santos, J.A., Pereira, A. F. (underreview).
SpecificTemporal Activationsto Canonical Point-Light-Walkersat7-months –a fNIRS
study.Cortex
Lloyd-Fox, S., Blasi, A., & Elwell, C. (2010). Illuminating the developing brain: the past,
present and future of functional near infrared spectroscopy. Neuroscience &
Biobehavioral Reviews, 34(3), 269-284.
Lloyd-Fox, S., Richards, J. E., Blasi, A., Murphy, D. G., Elwell, C. E., & Johnson, M. H.
(2014). Coregistering functional near-infrared spectroscopy with underlying cortical
areas in infants. Neurophotonics, 1(2), 025006-025006.
Lloyd‐Fox, S., Blasi, A., Volein, A., Everdell, N., Elwell, C. E., & Johnson, M. H. (2009).
Social perception in infancy: a near infrared spectroscopy study. Child development,
80(4), 986-999.
Marshall, P. J., & Shipley, T. F. (2009). Event-related potentials to point-light displays of
human actions in 5-month-old infants. Developmental Neuropsychology, 34(3), 368-
377.
Mouta, S., Santos, J. A., & López-Moliner, J. (2012). The time to passage of biological and
complex motion. Journal of Vision, 12(2), 21-21.
25
Pavlova, M. A. (2011). Biological motion processing as a hallmark of social cognition.
Cerebral Cortex, 22(5), 981-995.
Pelphrey, K. A., Morris, J. P., Michelich, C. R., Allison, T., & McCarthy, G. (2005).
Functional anatomy of biological motion perception in posterior temporal cortex: an
fMRI study of eye, mouth and hand movements. Cerebral Cortex, 15(12), 1866-1876.
Reid, V. M., Hoehl, S., & Striano, T. (2006). The perception of biological motion by infants:
An event-related potential study. Neuroscience letters, 395(3), 211-214.
Simion, F., Regolin, L., & Bulf, H. (2008). A predisposition for biological motion in the
newborn baby. Proceedings of the National Academy of Sciences, 105(2), 809-813.
Taga, G., Asakawa, K., Maki, A., Konishi, Y., & Koizumi, H. (2003). Brain imaging in
awake infants by near-infrared optical topography. Proceedings of the National
Academy of Sciences, 100(19), 10722-10727.
Troje, N. F. (2013). What is biological motion?: Definition, stimuli and paradigms. Social
perception: Detection and interpretation of animacy, agency, and intention, 13-36.
Vaina, L. M., Solomon, J., Chowdhury, S., Sinha, P., & Belliveau, J. W. (2001). Functional
neuroanatomy of biological motion perception in humans. Proceedings of the National
Academy of Sciences, 98(20), 11656-11661.
Villringer, A., & Chance, B. (1997). Non-invasive optical spectroscopy and imaging of
human brain function. Trends in neurosciences, 20(10), 435-442.