Action Plan for CO2 emissions redution - icao.int · State Aviation Administration of Ukraine...
76
State Aviation Administration of Ukraine Action plan of Ukraine for reducing aviation CO2 emissions Document approved on 5 October 2018
Transcript of Action Plan for CO2 emissions redution - icao.int · State Aviation Administration of Ukraine...

State Aviation Administration of Ukraine
Action plan of Ukraine for
reducing aviation CO2 emissions
Document approved on 5 October 2018


FOREWORD
Ukraine supports the position to comply a global approach for monitoring and reducing of
aviation emissions that includes implementation of the ICAO Resolution A37-19 provisions (Consolidated statement of continuing ICAO policies and practices related to environmental protection –
Climate change), encourages States to submit their action plans outlining their respective policies and
actions to achieve a global annual average fuel efficiency improvement of 2 per cent until 2020 and an aspirational global fuel efficiency improvement rate of 2 per cent per annum from 2021 to 2050.
According to the decision of the European Civil Aviation Conference all ECAC Member States,
including Ukraine, agreed to provide its National Plan to ICAO and coordinated the format of such plan.
State aviation administration of Ukraine with the support of leading scientists and experts was
created the Working Group for development of the Action Plan with the assistance of aviation industry
representatives whose activity may effect on the final result: airlines, airports, fuel suppliers, air
navigation service provider, etc.
The objective of Ukrainian action plan is to calculate and forecast the CO2 aviation emission and
implementation of appropriate measures to reduce and prevent pollution.

ACTION PLAN OF UKRAINE
Content
INTRODUCTION
CURRENT STATE OF AVIATION IN UKRAINE
CO2 EMISSIONS INVENTORIES, FORECASTS AND BASELINE CALCULATION
ECAC BASELINE SCENARIO AND ESTIMATED BENEFITS OF IMPLEMENTED
MEASURES
SECTION 1- Supra-national actions, including those led by the EU
SECTION 2- National Actions in Ukraine
CONCLUSION
Contact information for Ukraine focal point for the action plan:
Authority name: STATE AVIATION ADMINISTRATION OF UKRAINE
Point of Contact: Ivan Iatsenko
Street Address Peremohy ave, 14
Country: Ukraine
City: Kyiv
Telephone Number: +380443515632
Fax Number: +380443515632
E-mail address: [email protected]

INTRODUCTION
Ukraine is a member of the International Civil Aviation Organization (ICAO) from 09 September 1992,
European Civil Aviation Conference (ECAC) from 15 December 1999 and European Organization for the Safety of Air Navigation (EUROCONTROL) from 1 January 2004. ECAC is an intergovernmental organisation
covering the widest grouping of Member States1 of any European organisation dealing with civil aviation. It is
currently composed of 44 Member States, and was created in 1955.
Ukraine is also member of the World Trade Organization (WTO) from 2008 year
ECAC States share the view that environmental concerns represent a potential constraint on the future development of the international aviation sector, and together they fully support ICAO’s ongoing efforts to
address the full range of these concerns, including the key strategic challenge posed by climate change, for the
sustainable development of international air transport.
Ukraine, like all of ECAC’s forty-four States, is fully committed to and involved in the fight against climate
change, and works towards a resource-efficient, competitive and sustainable multimodal transport system.
Ukraine recognises the value of each State preparing and submitting to ICAO a State Action Plan on emissions reductions, as an important step towards the achievement of the global collective goals agreed at the 37 th Session
of the ICAO Assembly in 2010.
In that context, all ECAC States submitting to ICAO an Action Plan, regardless of whether or not the 1% de
minimis threshold is met, thus going beyond the agreement of ICAO Assembly Resolution A/37-19. This is the Action Plan of Ukraine.
Ukraine shares the view of all ECAC States that a comprehensive approach to reducing aviation emissions is
necessary, and that this should include:
i. emission reductions at source, including European support to CAEP work
ii. research and development on emission reductions technologies, including public-private partnerships
iii. the development and deployment of low-carbon sustainable alternative fuels, including research and operational
initiatives undertaken jointly with stakeholders
iv. the optimisation and improvement of Air Traffic Management, and CNS infrastructure within Europe.
v. Applying of global approaches to reduce the negative impact of international aviation to the environment.
In Europe, many of the actions which are undertaken within the framework of this comprehensive approach are in practice taken at a supra-national level, most of them led by the EU. They are reported in Section 1 of this
Action Plan, where Ukraine’s involvement in them is described, as well as that of stakeholders.
In Ukraine a number of actions are undertaken at the national level, including by stakeholders, in addition to
those of a supra-national nature. These national actions are reported in Section 2 of this Plan.
In relation to actions which are taken at a supranational level, it is important to note that:
The extent of participation will vary from one State and another, reflecting the priorities and circumstances of each State (economic situation, size of its aviation market, historical and institutional context, such as EU/ non
EU). The ECAC States are thus involved to different degrees and on different timelines in the delivery of these
1 Albania, Armenia, Austria, Azerbaijan, Belgium, Bosnia and Herzegovina, Bulgaria, Croatia, Cyprus, Czech Republic, Denmark, Estonia, Finland, France, Georgia, Germany, Greece, Hungary, Iceland, Ireland, Italy,
Latvia, Lithuania, Luxembourg, Malta, Moldova, Monaco, Montenegro, Netherlands, Norway, Poland, Portugal, Romania, San Marino, Serbia, Slovakia, Slovenia, Spain, Sweden, Switzerland, The former Yugoslav Republic of
Macedonia, Turkey, Ukraine, and the United Kingdom

common actions. When an additional State joins a collective action, including at a later stage, this broadens the effect of the measure, thus increasing the European contribution to meeting the global goals.
Nonetheless, acting together, the ECAC States have undertaken to reduce the region’s emissions through a
comprehensive approach which uses each of the pillars of that approach.

CURRENT STATE OF AVIATION IN UKRAINE
Structure of aviation sector
President of Ukraine and Cabinet of Ministers of Ukraine shall ensure implementation of the aviation development policy of Ukraine in accordance with the Constitution and Laws of Ukraine.
Authorized body for civil aviation is the Central Executive (governmental) Body on Civil Aviation that shall be
established and which status shall be defined by the President of Ukraine (hereinafter referred to as the Civil Aviation Authority). Authorized executive body for state aviation is the Ministry of Defense.
Civil Aviation Authority and the Ministry of Defense within their powers are entrusted with regulation of
Ukraine’s airspace.
State Aviation Administration of Ukraine (SAAU) is a Civil Aviation Authority of Ukraine established by the
Cabinet of Mibisters of Ukraine Edict from 08October 2014 №520/.
State Aviation Administration of Ukraine shall implement the Ukraine’s state policy and strategy for aviation
development, and it shall exercise regulation of civil aviation in such areas:
- ensuring aviation safety, aviation security, ecological safety, economic and information security;
- creation of conditions for development of aviation activity, air transportation and its servicing, exercising
aerial works and flights of general aviation; - air traffic management and airspace regulation of Ukraine;
- representation of Ukraine in the international civil aviation organizations and in external relations in the field
of civil aviation; - drafting, adoption and implementation of aviation rules;
- certification of aviation entities and facilities;
- issue of licenses for economic activities pertaining to rendering services on transportation of passengers and/or
cargo by air as well as authorization of air lines operation and assignment to air carriers; - continuous supervision and monitoring of the observance of the requirements set by legislation, including
aviation rules of Ukraine.
State Aviation Administration of Ukraine is a duly authorized and independent body with regard to ensuring utilization of the airspace of Ukraine by aviation entities of Ukraine and oversight the provision of air
navigation services.
For the purpose of aviation safety State Aviation Administration of Ukraine shall cooperate with law-
enforcement agencies and other executive bodies.
State Aviation Administration of Ukraine web address: http://www.avia.gov.ua/
The Ukrainian State Air Traffic Service Enterprise (UkSATSE) is the main air navigation services provider
of Ukraine as well as core for the Integrated Civil-Military Air Traffic Management System of Ukraine (ICMS). The Enterprise is authorized by the Governmental Regulation Body for provision of Air Navigation Services in
the ATS airspace of Ukraine and in the part of the high seas of the Black Sea, where the responsibility for the
provision of ATS is delegated to Ukraine (hereinafter referred to as ATS airspace of Ukraine) by International Civil Aviation Organization (ICAO). This identifies the mission and main tasks of UkSATSE.
Main tasks:
- Air Traffic Management: Air Traffic Services, Airspace Management and Air Traffic Flow Management
in the airspace of Ukraine; - radio-technical and electrical provision of ATS and flight operation;
- provision of activity and development of the Joint Civil-Military ATM System Units;
- alerting Services and participation in Search and Rescue operations; - provision of airspace users with Aeronautical Information;
- modernization and development of the Air Navigation System of Ukraine;
- training and refresher training of the UkSATSE experts; - provision of social development and security of its personnel.

The Ukrainian State Air Traffic Service Enterprise web address: http://uksatse.ua
Participation in International Organisations
1992 - Ukraine became the Full Member State of International Civil Aviation Organisation (ICAO)
1994 - Accession of UkSATSE to International Federation of Air Traffic Controllers' Associations (IFATCA)
1995 - Signature of Bilateral Agreement between Ukraine and Central Route Charges Office (EUROCONTROL)
1997 - Accession of UkSATSE to Air Traffic Control Association (ATCA)
1997 - Introduction of new Flight Information Region (FIR) boundaries over the Black Sea 1998 - UkSATSE became a founder member of Civil Air Navigation Services Organisation (CANSO)
1999 - Ukraine became the Member State of European Civil Aviation Conference (ECAC)
1999 - Ratification of the Agreement between the EBRD and the Government of Ukraine concerning the Ukrainian ANS Modernisation Project by Ukrainian Parliament
1999 - UkSATSE joined International Organisation Information Co-ordinating Council on Air Navigation
Charges (IKSANO)
1999 - Conclusion of Agreement between UkSATSE and the EUROCONTROL Central Flow Management Unit (CFMU)
2000 - UkSATSE became the 33rd Member State of International Federation of Air Traffic Safety Electronics
Associations (IFATSEA) 2003 - UkSATSE initiates creation of the Regional Air Navigation Services Development Association (RADA)
2004 - Ukraine became the 33rd Member State of EUROCONTROL. Experts of UkSATSE are fully engaged in
EUROCONTROL activities 2005 - Contract between SELEX Sistemi Integrati S.p.A. (Italy) and UkSATSE for Supply and Installation of
Approach Radars (Dnipropetrovs'k, Kyiv, L'viv, Odesa, Simferopol')
2006 - Ukraine hosted NATO Air Traffic Management Committee (NATMC) Plenary Session
Name Date of Founding Date of Entrance
International aviation organisations, where Ukraine is a member
ICAO 1944 1992
ECAC 1954 1999
EUROCONTROL 1963 2004
International aviation organisations, where UkSATSE is a member
IFATCA 1961 1994
ATCA 1956 1997
CANSO 1998 1998
IKSANO 1999 1999
IFATSEA 1972 2000
Education
Aviation degree in Ukraine can be obtained in three aviation universities. Kyiv National Aviation University is recognized as a leader of higher aviation education in Ukraine. Kyiv Aviation University cooperates closely
with Civil Aviation authorities across the world and even has a special ICAO institute in its structure.
Kirovograd flight academy is famous for pilot training and Kharkov Aerospace academy is recognized for
preparing best specialists in the fields of space research, aircraft manufacturing and aeronautical engineering. Kharkov University is closely connected to the industry.

National Aviation Policy
Ukraine, with a large power-consuming economy and correspondingly high emissions of greenhouse gases, is
committed to the prevention of global climate change.
The primary task of the Government of Ukraine is to create and implement a national policy directed to fulfill
the obligations of Ukraine within the framework of the international treaties.
The major legislative document of Ukraine in aviation activity is Air Code of Ukraine in force since 19 May
2011 № 3393VI which regulates among other questions the question of environmental protection. This chapter
include requirements about:
- Maximum acceptable level of aviation noise, air engine emissions established by the Aviation Rules of Ukraine.
- Compensation for damage caused as result of the aviation activity.
- Limitations and prohibitions for civil aircraft if they exceed noise levels established by the Civil Aviation
Authority.
- Limitations and prohibitions taking account taking account of measures aimed to reduction of noise levels
at the airport and in its vicinity including: - Technical noise reduction at the source.
- Space zoning of the airport adjacent territory and a proper zone planning.
- Operational measures to reduce aircraft noise and emissions.
- The cost of the measures aimed at reduction and prevention in noise and emissions shall be funded by
airport taxes taking account ICAO recommendations.
Other Laws of Ukraine in environmental field:
- "About atmospheric air protection", from 16.10.1992, № 2708-XII
- "About ecological expertise", from 09.02.1995, № 46/95-ВР
- "About sanitary and epidemiological population welfare ", from 24.02.1994, № 4005-XII
- "About environmental protection", from 26.06.1991, № 1268-XII
- “About high danger objects”, from 15.05.2003, № 762-IV
- “About main strategy in state ecological policy of Ukraine for 2020 year”from 21.12.2010 № 2818-VI
Convention on International Civil Aviation, signed at Chicago on 7 December 1944, hereinafter referred to as
the Chicago, ratified by Ukraine on 10 August1992, Ukraine has the obligation to implement and enforce such
provisions of Convention, as well as standards set out in annexes.
United Nations Framework Convention on Climate Change, ratified by Verkhovna Rada of Ukraine on 29
October, 1996. The objective of the treaty is to stabilize greenhouse gas concentrations in the atmosphere at a
level that would prevent dangerous anthropogenic interference with the climate system. Ukraine corresponds to Annex I countries which have ratified the Protocol have committed to reduce their emission levels of
greenhouse gasses to targets that are mainly set below their 1990 levels. They may do this by allocating reduced
annual allowances to the major operators within their borders. Ukraine adopted list of regulations concerning prevention of climate change. Among them Law of Ukraine "About atmospheric air protection" from
16.10.1992, № 2708-XII.
Kyoto Protocol to the United Nations Framework Convention on Climate Change, adopted by Ukraine on 04
February, 2004.
Committee on Aviation Environmental Protection. ICAO's current environmental activities are largely
undertaken through the Committee on Aviation Environmental Protection (CAEP), which was established by
the Council in 1983, superseding the Committee on Alircraft Noise (CAN) and the Committee on Aircraft Engine Emissions (CAEE).
CAEP assists the Council in formulating new policies and adopting new Standards on aircraft noise and aircraft
engine emissions.
Ukraine is a member of CAEP and took active part in working groups and steering groups.

National Airlines network
List of national airlines that include carriers executing regular and charter flights
№ Operator
1. Limited Liability Company “Kharkiv Airlines”
2. Privet Enterprise PoltavAvia
3. Limited Liability Company “Wind Rose” Aviation Company
4. Limited Liability Company “Aircompany “Meridian”, Ltd
5. Private joint-stock company “Bukovyna” airlines”
6. Limited Liability Company “Aircompany “ZetAvia”
7. Limited Liability Company “Ukrainian Airlines company “AEROSTAR”
8. Private Corporation “International Joint-Stock Aviation Company “Urga”
9. Limited Liability Company Wizz Air Ukraine Airlines LLC
10. Flight School CONDOR LLC
11. SE “Production Association Yuzhny Machine–Building Works named after O.M. Makarov”
Aviation Transport Company “YUZMASHAVIA”
12. Limited Liability Company “Atlasjet Ukraine”
13. Limited Liability Company “Europa Air”
14. Antonov Company
15. Joint Stock Company “Aviation Company “Dniproavia”
16. “DART” Limited Liability Company
17. Private Stock Company “Ukraine International Airlines”
18. Private Joint Stock Company “Airline ”Ukraine-AirAlliance
19. State Air Enterprise “Ukraine”
20. Limited Liability Company “Maximus Airlines”
21. Public Liability Company Motor Sich JSC
22. Avia Styl Private Joint Stock Company
23. Anda Eir Limited liability company
24. Limited Liability Company “Shovkoviy Shlyah” Ltd
25. State enterprise KHORIV-AVIA
26. Limited Liability Company Bravo Airways
27. Limited Liability Company “Aircompany ”ISD Avia” Ltd
28. YanEir LTD
29. Aircompany Prominterservice Limited Liability Company
30. Limited Liability Company “CAVOK AIR”
31. Limited Liability Company AEROJET LTD
32. “Aircompany Constanta” Private Joint-Stock Company
33. NikolaevAir Limited Liability Company
34. Private joint-stock company “Air Columbus”
35. Kremenchuk Flight College of National Aviation University
36. Kharkiv Aeroclub named after V.S. Grizodubova of DSS of Ukraine
37. Joint Stock Company “Aviation Company “Dniproavia”
38. State Aviation Company “Kherson-Avia”
39. Air Alanna Limited Liability Company
40. Kirovograd Flight Academy of the National Aviation University
41. Limited Liability Company Aviation-Transport Agency “Kroonk” Ltd
42. Ukrainian State Air Traffic Service Enterprise
43. Limited liability company “Aircompany “Rosavia”

44. “Air company BORA
45. Limited Liability Company “Prostor Avia” Ltd
46. Association with limited liability “Breeze” Ltd
47. Private Joint Stock Company “Aviation Company “Ukrainian helicopters”
48. Enterprise “Aviation company “AgroaviaDnipro”
49. Limited Partnership Production Commercial Firm “Ukraviatechservis”
50. Aerovis Airlines LTD
51. Private Enterprise “Proskuriv-Avia”
52. Limited Partnership “Turaerodan”
53. Limited Liability Company Challenge Aero Ukraine LLC
54. “Global Air Company” Limited Liability Partnership
55. Private Enterprise “Yunikom Avia”
56. Enterprise aviation company AgroaviaDnipro
57. Limited Liability Company “YugAvia” LLC
58. Vulkan AIR Limited Liability Company
59. Azur Air Ukraine Limited Liability Company
60. Aircompany Khors Limited Liability Company
61. Atlasjet Ukraine Limited Liability Company
62. Europe Air Limited Liability Company
63. Alpha Air Limited Liability Company
64. Anda Air Limited Liability Company
65. Ukrainian Wings Limited Liability Company
66. Skyaviatrans Limited Liability Company

National Airports network of Ukraine
Institutionally 18 airports are independent bodies, 2 airports are state-owned enterprises, 14 are municipal enterprises, 4 are community property enterprises.
# AIRPORTS
1 International airport "Borispol" State
2 International airport "Dnipropetrovsk" community property
3 International airport "Kiev" (Zhuliany) municipal
4 International airport "Ivano-Frankivsk" community property
5 International airport "Krivyi Rig" municipal
6 International airport "Lviv" State
7 International airport "Zaporizhzhia" municipal
8 Airport Zhitomir community property
9 International airport "Odessa" municipal
10 International airport "Chernivtsi" municipal
11 International airport "Rivne" municipal
12 International airport "Kharkiv" community property
13 Airport "Sumy" municipal
14 Airport "Ternopil" municipal
15 Airport "Vinnitsa" (Havryshivka) municipal
16 Airport "Cherkasy" municipal
17 Airport "Poltava" Municipal
18 Airport Kherson Municipal
19 Airport Uzhhorod Municipal

13
Economic information related to the contribution of international aviation
In recent years there has been a significant reduction in the basic performance of the aviation industry. The main factors that led to the demand decline for air travel and caused consequent
breakdown of the current economic situation in general are the next : military-political situation in the
state, annexation of the Crimea, safety recommendations from the international organizations and the
EU regarding avoidance of that area of Ukraine using alternative airspace routes. Several national airports not working during the year and many airlines have significantly reduced their route network.
During the reporting year, 29 airlines operated on the market of passenger and cargo air transportation,
of which 19 carried passenger transport. The number of passengers carried increased by 99.3% compared to the previous year and
amounted to 16498.9 thousand pax, which indicates the restoration of the Ukrainian market of
passenger air services after the decline of 2014-2015. According to the results of 2017, 95 percent of the total passenger traffic was made by 6 leading
airlines: Ukraine International Airlines, Azur Air Ukraine, Wind Rose, Yanyeir, Bravo and Atlas
Ukraine.
Volumes of cargo and mail shipment fell by 29.6 percent and amounted to 52.3 thousand tons. Transportation of goods and mail carried by 18 domestic airlines, most of the transport - is charter
flights to other states within the framework of UN humanitarian and peaceful programs, as well as
contracts and agreements with other customers. Commercial flights of domestic and foreign airlines served 19 Ukrainian airports and airfields.
It should be noted that today, about 98 percent of total passenger traffic and mail traffic are
concentrated in 7 leading airports - Boryspil, Kiev (Zhulyany), Odessa, Lviv, Kharkiv, Dnipropetrovsk and Zaporizhzhya.
CO2 EMISSIONS INVENTORIES, FORECASTS AND BASELINE CALCULATION
INTERNATIONAL AVIATION CO2 EMISSIONS INVENTORIES
Ukraine ratified the United Nations Framework Convention on Climate Change on 29 October, 1996
as an Annex I country. One of the commitments of parties to the Convention is to compile national inventories of their emissions sources.
For domestic flights, emissions are considered to be part of the national inventory of the country within
which the flights occur. For international flights, inventories are also calculated and reported to
UNFCCC under the terminology "emissions from international aviation bunker fuels".
Ukraine also adopted Kyoto Protocol to the United Nations Framework Convention on Climate
Change, on 2004.
Due to this, the calculation of the Baseline for Ukraine has been based on the available information on National Inventories reported to UNFCCC, and provided by the Ministry of Ecology and Natural
Resources of Ukraine. The methodology used for the calculation of those inventories follows the IPCC
2006 Guidelines for National Greenhouse Gas Inventories.
As Ukraine has established this systematic way to estimate, report and verify GHG emissions, those
procedures will be used to ensure that the estimation, reporting and verification of CO2 emissions in its
action plan is undertaken in accordance with the ICAO Guidance on States Action Plans Appendix E
recommendations.
CO2 EMISSIONS INVENTORIES METHODOLOGY (UNFCCC)
Emissions estimation was conducted separately for aircraft with jet and turboprop engines, which use jet
fuel, and equipped with piston engines, which use aviation kerosene.

For aircraft emissions estimation equipped with jet and turboprop engines, was used method correspond
to the Tier 3a of the IPCC sectoral approach.
The next tendencies directly affecting the level of aircraft emissions were observed.
In the period of 2001-2004 there was a dramatic increase of the number of domestic flights, and in 2008-
2009 dramatic fall, caused by decline of business activity. This led to corresponding changes in the level
of CO2 emissions. At the same time there have been changes in the structure of the fleet, which operates
domestic flights. Since 2000, there has been a constant renewal of USSR-produced aircraft (AN-24, AN-26, Yak-40, Yak-42) on modern aircrafts (Embraer, Boeing, Airbus), which in 2000 year was made
more than 95% of all domestic flights and in 2010 performed about 50% of all domestic flights.
In recent years there has been a significant reduction in the basic performance of the aviation industry. The main factors that led to the demand decline for air travel and caused consequent breakdown of the
current economic situation in general are the next: military-political situation in the state, annexation of
the Crimea, safety recommendations from the international organizations and the EU regarding avoidance of that area of Ukraine using alternative airspace routes. Several national airports not
working during the year and many airlines have significantly reduced their route network.
Separation of aircraft emission
Emissions from domestic aviation include all emissions from aircraft flights, departure and arrival airports of which located on the territory of Ukraine. Emissions from international aviation include
emissions from the flights where departure airports are located in the territory of Ukraine, and the
destination airport - outside Ukraine.
Calculation of aircraft emissions
It was used data based on departures of aircrafts from airports situated on the territory of Ukraine. Data about flight include next information according to each flight:
- date and time of flight;
- depart and destination points;
- air company; - aircraft code by ICAO.
Assessment of aircraft emissions was making in 2 steps: preliminary data processing and aircraft
emissions calculation.
Estimation of aircraft emissions has been produced in accordance with the detailed methodology
EMEP/CORINAIR, which correspond to the Tier 2b.
Fuel consumption:
Fuel consumption cycle per LTO cycle taken according to the methodology EMEP / CORINAIR, and
fuel consumption at cruise was calculated according to the flight length.
The length of the flight was defined as orthodromic distance between departure and destination points, taking into account the deflection coefficient of the actual flight path and orthodromic. Deflection
coefficient was taken as 1.095.
For recalculation of jet fuel consumption from mass units into energy units, as shown in the methodology EMEP / CORINAIR, it used low-value calorific capacity equal to 44.59 MJ / kg.
Calculation of CO2 emissions:
Coefficient of СО2 emissions for reactive fuel was taken as 19,5 tonne С/ТJ.

INTERNATIONAL BUNKERS AND MULTILATERAL OPERATIONS
Last data from the Ukrainian National Inventory reported to UNFCCC:
Year Greenhouse Gas
Source
Aggregate
Consumption Data
Implied Co2
Emission Factor
Co2
Emissions
(TJ) (t/TJ) (Gg)
1990 Jet Kerosene 33 118,66 71,50 2 367,98
1991 Jet Kerosene 28 596,93 71,50 2 044,68
1992 Jet Kerosene 24 075,20 71,50 1 721,38
1993 Jet Kerosene 19 553,47 71,50 1 398,07
1994 Jet Kerosene 15 031,74 71,50 1 074,77
1995 Jet Kerosene 10 510,02 71,50 751,47
1996 Jet Kerosene 5 988,29 71,50 428,16
1997 Jet Kerosene 5 809,65 71,50 415,39
1998 Jet Kerosene 5 548,23 71,50 396,70
1999 Jet Kerosene 5 082,83 71,50 363,42
2000 Jet Kerosene 5 036,98 71,50 360,14
2001 Jet Kerosene 5 059,46 71,50 361,75
2002 Jet Kerosene 5 696,22 71,50 407,28
2003 Jet Kerosene 6 650,57 71,50 475,52
2004 Jet Kerosene 8 062,97 71,50 576,50
2005 Jet Kerosene 8 923,37 71,50 638,02
2006 Jet Kerosene 10 529,95 71,50 752,89
2007 Jet Kerosene 11 944,43 71,50 854,03
2008 Jet Kerosene 13 057,95 71,50 933,64
2009 Jet Kerosene 11 457,15 71,50 819,19
2010 Jet Kerosene 12 478,25 71,50 892,19
2011 Jet Kerosene 11 097,27 71,50 793,44
2012 Jet Kerosene 10 242,71 71,50 732,35

TOTAL CO2 EMISSIONS
0,00
500 000,00
1 000 000,00
1 500 000,00
2 000 000,00
2 500 000,00
199019921994199619982000200220042006200820102012
CO2 emissions trend
YEAR Domestic aviation СО2 emissions, Gg
International aviation СО2 emissions, Gg
TOTAL
1990 781,30 2367,98 3149,28
1991 597,92 2044,68 2642,60
1992 454,03 1721,38 2175,41
1993 343,18 1398,07 1741,25
1994 259,31 1074,77 1334,08
1995 197,50 751,47 948,97
1996 146,14 428,16 574,30
1997 116,23 415,39 531,62
1998 115,07 396,70 511,77
1999 107,68 363,42 471,10
2000 101,04 360,14 461,18
2001 102,06 361,75 463,81
2002 119,09 407,28 526,37
2003 158,46 475,52 633,98
2004 185,45 576,50 761,95
2005 176,06 638,02 814,08
2006 197,16 752,89 950,05
2007 213,06 854,03 1067,09
2008 210,08 933,64 1143,72
2009 143,98 819,19 963,17
2010 141,55 892,19 1033,74
2011 223,46 793,44 1 016,90
2012 222,05 732,35 954,40

TRAFFIC FORECASTS
Annual IFR Movements and 2011-2021 average annual growth.
2011 2012 2013 2014 2015 2016 2017 2018 2019 2020 2021 AAG
R
2021/
2014
H - - - - 135 133 147 163 178 194 211 -5,5%
B 453 466 494 312 132 128 138 149 160 171 183 -7,4%
L - - - - 130 122 128 136 144 151 158 -9,2%
Annual growth rates and 2011-2021 average annual growth.
2011 2012 2013 2014 2015 2016 2017 2018 2019 2020 2021 AAGR
2021/
2014
H - - - - -57% -
1,6%
11,0
%
10% 9,4
%
9,2
%
8,3
%
-5,5%
B 5,5% 2,9
%
6,0
%
-37% -58% -
3,5%
8,0
%
8,2
%
7,3
%
7,2
%
6,5
%
-7,4%
L - - - - -5,8%
-5,8%
5% 6,2%
5,4%
5,3%
4.7%
-9,2%
Source: EUROCONTROL (Feb. 2015)
BASELINE CALCULATION AND EXPECTED RESULTS
0,00
500 000,00
1 000 000,00
1 500 000,00
2 000 000,00
2 500 000,00
3 000 000,00
3 500 000,00
1990 1992 1994 1996 1998 2000 2002 2004 2006 2008 2010 2012
CO2 Emissions Ukraine DataTn CO2international…

The State Aviation Administration of Ukraine has decided to calculate a Baseline as a suitable element
of its action plan, to estimate the levels of fuel consumption, CO2 emissions, and air traffic (expressed in
RTK) that can be expected in the time horizons of 2020 and 2025. Such “business as usual” scenario will be used as the reference to estimate the expected results once the measures identified on the Action
Plan are implemented and will represent the projected fuel consumption and CO2 emissions willing to
reach as results.
To calculate the baseline for the evaluation of the Action Plan measures, it has been estimated an average year growth of air traffic (RTK) of 5,3% from 2010-2020 and 4,5% from 2020 to 2025 taken
from the EUROCONTROL forecasts included in the previous paragraph.
Methodological approach
The baseline calculation is based on the extrapolation of past trend data in order to determine future
levels of fuel consumption and traffic, and through the calculation of a Fuel Efficiency Metric, following
the recommendations of the ICAO Guidance Material for the Development of States Action Plans.
Historic data sources:
Historic data from fuel consumption have been taken from the official National Emissions Inventory, as
described above.
Historic Traffic data expressed in RTK have been taken from the ICAO database provided through the APER Website.
Fuel efficiency metric:
Following the ICAO Guidance, the fuel efficiency metric expresses the rate of efficiency improvement over time, and its calculation is based on the following metric:
Fuel efficiency = Volume of fuel/RTK (1)
This metric is an indicator of the efficiency of fuel usage (in liters) per tonne of revenue load carried (passengers, freight and mail).
METHOD 3 OF ICAO GUIDANCE
Following ICAO Guidance Method 3, the baseline for Ukraine has been calculated as follows:
1. Getting fuel consumption data (volume of fuel) and traffic (RTK) for the latest available years.
2. Determining the RTK future scenarios by considering EUROCONTROL Ukrainian forecasts.
3. Determining the projected volume of fuel for the 2010-2025 scenarios, assuming the same
growth rate as for the RTK as follows:
Volume of fuel year n+1 = Volume of fuel year n x (1 + RTK growth)
Such methodology is equivalent to apply the following formula:
Volume of fuel year n+1= efficiency factor year n* RTK year n+1
To estimate CO2 emissions expressed in Kg from fuel consumption expressed in L, a 0’8 Kg/L density has been considered.
Then the expected results will be estimated though subtracting the fuel gains due to additional measures
to the projected fuel consumption.
On the following tables, the baseline calculation results for both international and total fuel and CO2
emissions are presented.
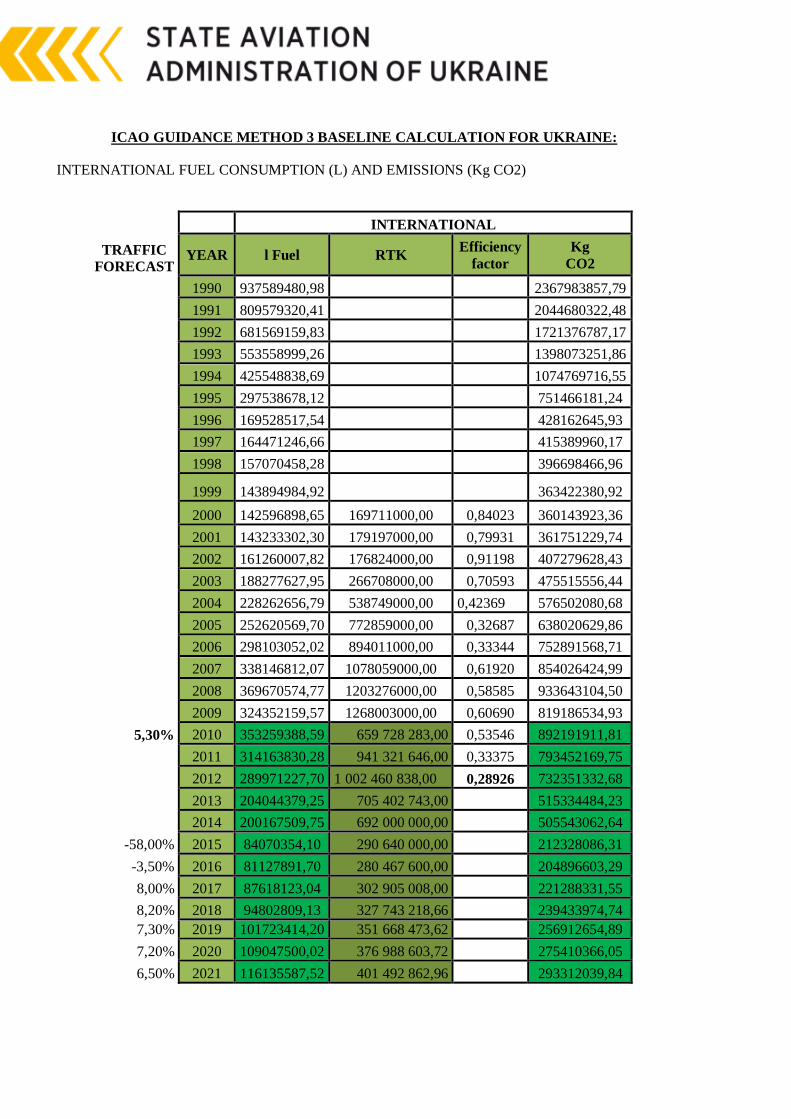
ICAO GUIDANCE METHOD 3 BASELINE CALCULATION FOR UKRAINE:
INTERNATIONAL FUEL CONSUMPTION (L) AND EMISSIONS (Kg CO2)
INTERNATIONAL
TRAFFIC
FORECAST YEAR l Fuel RTK
Efficiency
factor
Kg
CO2
1990 937589480,98 2367983857,79
1991 809579320,41 2044680322,48
1992 681569159,83 1721376787,17
1993 553558999,26 1398073251,86
1994 425548838,69 1074769716,55
1995 297538678,12 751466181,24
1996 169528517,54 428162645,93
1997 164471246,66 415389960,17
1998 157070458,28 396698466,96
1999 143894984,92 363422380,92
2000 142596898,65 169711000,00 0,84023 360143923,36
2001 143233302,30 179197000,00 0,79931 361751229,74
2002 161260007,82 176824000,00 0,91198 407279628,43
2003 188277627,95 266708000,00 0,70593 475515556,44
2004 228262656,79 538749000,00 0,42369 576502080,68
2005 252620569,70 772859000,00 0,32687 638020629,86
2006 298103052,02 894011000,00 0,33344 752891568,71
2007 338146812,07 1078059000,00 0,61920 854026424,99
2008 369670574,77 1203276000,00 0,58585 933643104,50
2009 324352159,57 1268003000,00 0,60690 819186534,93
5,30% 2010 353259388,59 659 728 283,00 0,53546 892191911,81
2011 314163830,28 941 321 646,00 0,33375 793452169,75
2012 289971227,70 1 002 460 838,00 0,28926 732351332,68
2013 204044379,25 705 402 743,00 515334484,23
2014 200167509,75 692 000 000,00 505543062,64
-58,00% 2015 84070354,10 290 640 000,00 212328086,31
-3,50% 2016 81127891,70 280 467 600,00 204896603,29
8,00% 2017 87618123,04 302 905 008,00 221288331,55
8,20% 2018 94802809,13 327 743 218,66 239433974,74
7,30% 2019 101723414,20 351 668 473,62 256912654,89
7,20% 2020 109047500,02 376 988 603,72 275410366,05
6,50% 2021 116135587,52 401 492 862,96 293312039,84

5,10% 2022 122058502,48 421 968 998,97 308270953,87
2023 128283486,11 443 489 417,92 323992772,52
2024 134825943,90 466 107 378,23 340516403,92
2025 141702067,04 489 878 854,52 357882740,52
TOTAL FUEL CONSUMPTION (L) AND EMISSIONS (Kg CO2)
TRAFFIC
FORECAST
TOTAL
YEAR l Fuel RTK Efficiency
factor
Kg
CO2
1990 1.253.570.808,76 3.166.018.435
1991 1.051.050.179,16 2.654.532.332
1992 864.639.226,18 2.183.732.830
1993 691.682.537,23 1.746.913.416
1994 529.707.437,40 1.337.829.104
1995 376.684.391,49 951.354.099
1996 227.934.945,64 575.672.499
1997 210.781.075,04 532.348.683
1998 202.749.280,48 512.063.583
1999 186.582.480,61 471.232.713
2000 182.631.282,99 184.586.000,00 0,98941 461.253.568
2001 183.681.857,73 195.209.000,00 0,94095 463.906.900
2002 208.457.269,78 190.424.000,00 1,09470 526.479.681
2003 251.053.205,65 288.817.000,00 0,86925 634.059.976
2004 301.762.175,29 588.180.000,00 0,51304 762.130.550
2005 322.528.267,45 827.229.360,00 0,38989 814.577.392
2006 376.429.744,44 935.686.000,00 0,40230 950.710.963
2007 422.689.385,69 581 105 187,00 0,72739 1.067.544.313
2008 452.939.714,20 655 000 000,00 0,69151 1.143.944.542
2009 381.370.433,69 596 000 000,00 0,63988 963.189.167
5,30% 2010 409 338 031,36 703 000 000,00 0,58227 1 033 824 132
2011 401 418 072,97 992 000 000,00 0,40466 1 013 821 485
2012 376 636 412,20 1 062 000 000,00 0,35465 951 232 923
2013 272 015 186,59 767 000 000,00 687 001 555
2014 254 637 423,69 718 000 000,00 643 112 277
-58,00% 2015 106 947 717,95 301 560 000,00 270 107 156
-3,50% 2016 103 204 547,82 291 005 400,00 260 653 406
8,00% 2017 111 460 911,65 314 285 832,00 281 505 678
8,20% 2018 120 600 706,40 340 057 270,22 304 589 144
7,30% 2019 129 404 557,97 364 881 450,95 326 824 152
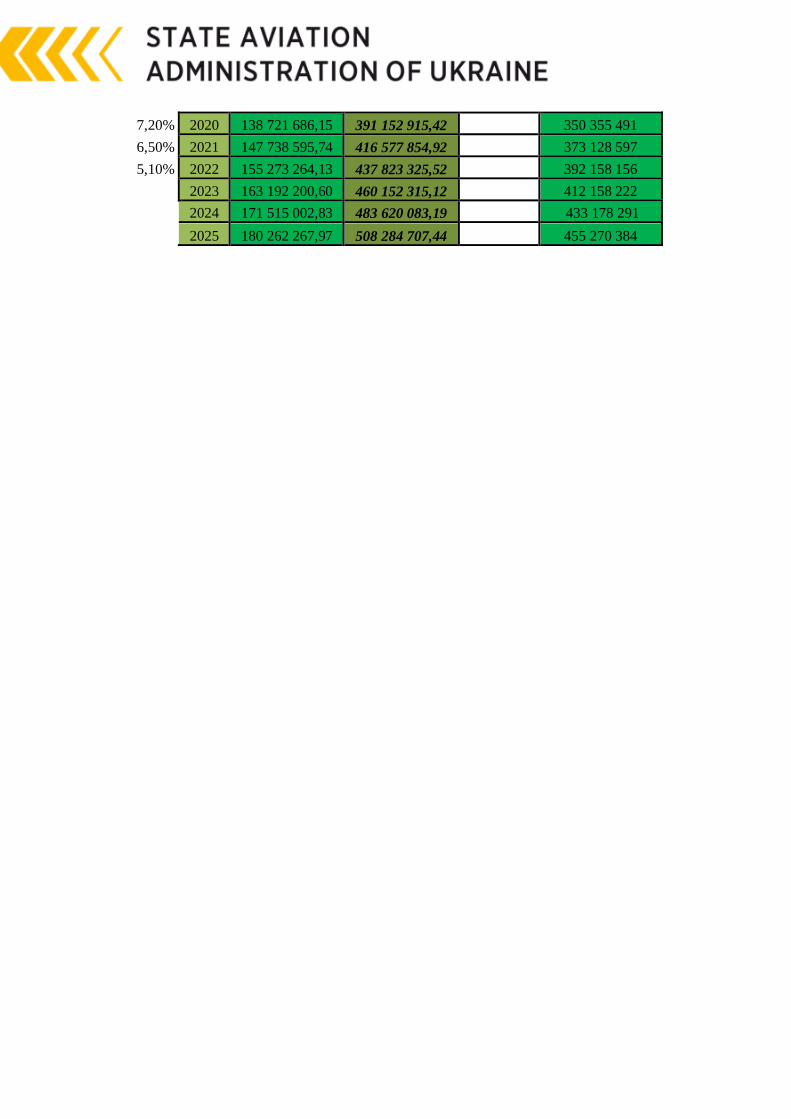
7,20% 2020 138 721 686,15 391 152 915,42 350 355 491
6,50% 2021 147 738 595,74 416 577 854,92 373 128 597
5,10% 2022 155 273 264,13 437 823 325,52 392 158 156
2023 163 192 200,60 460 152 315,12 412 158 222
2024 171 515 002,83 483 620 083,19 433 178 291
2025 180 262 267,97 508 284 707,44 455 270 384
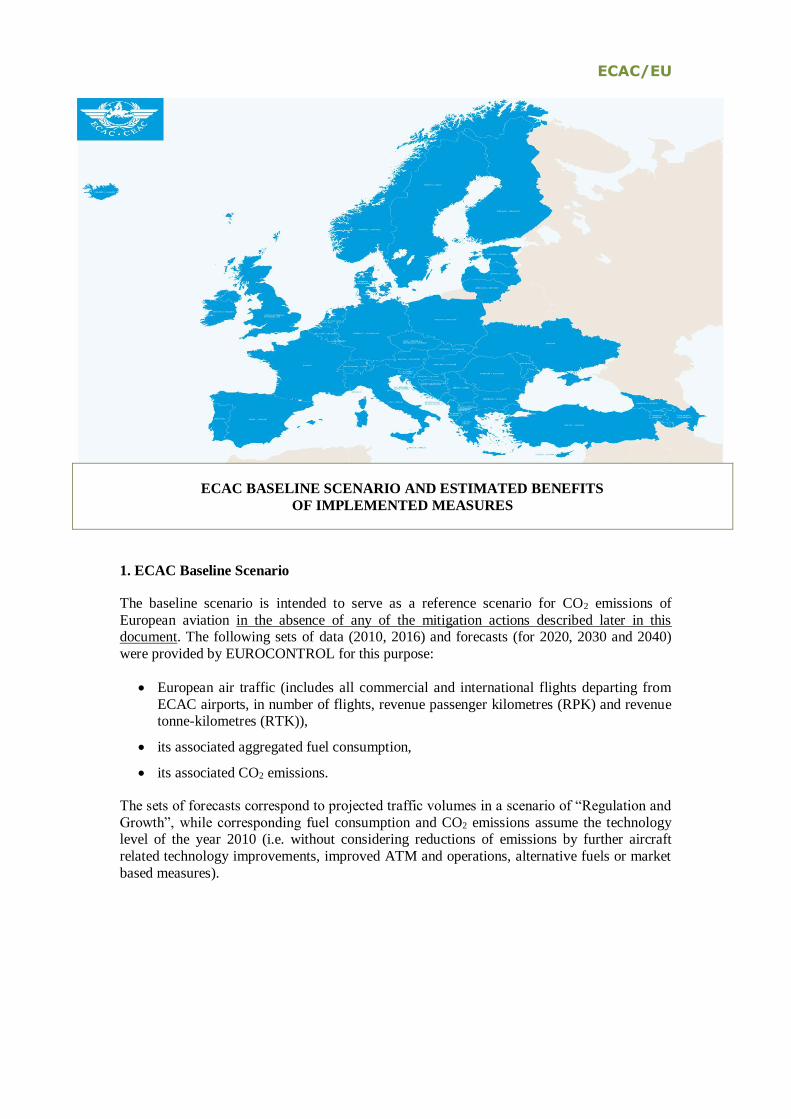
ECAC/EU
ECAC BASELINE SCENARIO AND ESTIMATED BENEFITS
OF IMPLEMENTED MEASURES
1. ECAC Baseline Scenario
The baseline scenario is intended to serve as a reference scenario for CO2 emissions of
European aviation in the absence of any of the mitigation actions described later in this document. The following sets of data (2010, 2016) and forecasts (for 2020, 2030 and 2040)
were provided by EUROCONTROL for this purpose:
European air traffic (includes all commercial and international flights departing from
ECAC airports, in number of flights, revenue passenger kilometres (RPK) and revenue tonne-kilometres (RTK)),
its associated aggregated fuel consumption,
its associated CO2 emissions.
The sets of forecasts correspond to projected traffic volumes in a scenario of “Regulation and
Growth”, while corresponding fuel consumption and CO2 emissions assume the technology level of the year 2010 (i.e. without considering reductions of emissions by further aircraft
related technology improvements, improved ATM and operations, alternative fuels or market
based measures).

ECAC/EU
Traffic Scenario “Regulation and Growth”
As in all forecasts produced by EUROCONTROL, various scenarios are built with a specific storyline and a mix of characteristics. The aim is to improve the understanding of factors that
will influence future traffic growth and the risks that lie ahead. In the 20 year forecasts
published by EUROCONTROL the scenario called ‘Regulation and Growth’ is constructed as the ‘most likely’ or ‘baseline’ scenario for traffic, most closely following the current trends. It
considers a moderate economic growth, with some regulation particularly regarding the social
and economic demands.
Amongst the models applied by EUROCONTROL for the forecast the passenger traffic sub-
model is the most developed and is structured around five main group of factors that are taken
into account:
Global economy factors represent the key economic developments driving the demand for air transport.
Factors characterizing the passengers and their travel preferences change patterns in travel demand and travel destinations.
Price of tickets set by the airlines to cover their operating costs influences passengers’ travel decisions and their choice of transport.
More hub-and-spoke or point-to-point networks may alter the number of connections and flights needed to travel from origin to destination.
Market structure describes size of aircraft used to satisfy the passenger demand
(modelled via the Aircraft Assignment Tool).
Table 1 presents a summary of the social, economic and air traffic related characteristics of
three different scenarios developed by EUROCONTROL. The year 2016 serves as the
baseline year of the 20-year forecast results2 updated in 2018 by EUROCONTROL and
presented here. Historical data for the year 2010 are also shown later for reference.
2 Challenges of Growth 2018: Flight forecast, EUROCONTROL September 2018 (to be published)

ECAC/EU
Table 1. Summary characteristics of EUROCONTROL scenarios:
Global Growth Regulation and
Growth
Fragmenting World
2023 traffic growth High Base Low
Passenger
Demographics (Population)
Aging
UN Medium-fertility variant
Aging
UN Medium-fertility variant
Aging
UN Zero-migration variant
Routes and
Destinations Long-haul No Change Long-haul
Open Skies EU enlargement later
+Far & Middle-East
EU enlargement
Earliest
EU enlargement
Latest
High-speed rail
(new & improved connections)
20 city-pairs
faster implementation
20 city-pairs
20 city-pairs
later implementation.
Economic
conditions
GDP growth
Stronger
Moderate
Weaker
EU Enlargement +5 States, Later +5 States, Earliest +5 States, Latest
Free Trade
Price of travel
Global, faster
Limited, later
None
Operating cost Decreasing Decreasing No change
Price of CO2 in
Emission Trading Scheme
Moderate Lowest Highest
Price of oil/barrel Low Lowest High
Change in other
charges
Noise:
Security:
Noise:
Security:
Noise:
Security:
Structure
Network
Hubs: Mid-East
Europe Turkey
Pt-to-pt: N-Atlant.
Hubs: Mid-East
Europe&Turkey
Pt-to-pt: N-Atlant.
No change
Market Structure
Industry fleet
forecast +
STATFOR assumptions
Industry fleet
forecast +
STATFOR assumptions
Industry fleet forecast
+ STATFOR assumptions

ECAC/EU
Further assumptions and results for the baseline scenario
The ECAC baseline scenario was generated by EUROCONTROL for all ECAC States. It covers all commercial international passenger flights departing from ECAC airports, as
forecasted in the aforementioned traffic scenario. The number of passengers per flight is
derived from Eurostat data.
EUROCONTROL also generates a number of all-cargo flights in its baseline scenario.
However, no information about the freight tonnes carried is available. Hence, historical and
forecasted cargo traffic have been extracted from another source (ICAO3). This data, which is
presented below, includes both belly cargo transported on passenger flights and freight
transported on dedicated all-cargo flights.
Historical fuel burn and emission calculations are based on the actual flight plans from the
PRISME data warehouse used by EUROCONTROL, including the actual flight distance and
the cruise altitude by airport pair. These calculations were made for 98% of the passenger flights; the remaining flights in the flight plans had information missing. Determination of the
fuel burn and CO2 emissions for historical years is built up as the aggregation of fuel burn and
emissions for each aircraft of the associated traffic sample. Fuel burn and CO2 emission
results consider each aircraft’s fuel burn in its ground and airborne phases of flight and are obtained by use of the EUROCONTROL IMPACT environmental model. While historical
traffic data is used for the year 2016, the baseline fuel burn and emissions in 2016 and the
forecast years (until 2040) are modelled in a simplified approach on the basis of the
historical/forecasted traffic and assume the technology level of the year 2010.
The following tables and figures show the results for this baseline scenario, which is intended
to serve as a reference case by approximating fuel consumption and CO2 emissions of
European aviation in the absence of mitigation actions.
Table 2. Baseline forecast for international traffic departing from ECAC airports
Year
Passenger
Traffic
(IFR
movements)
(million)
Revenue
Passenger
Kilometres4
RPK
(billion)
All-Cargo
Traffic (IFR
movements)
(million)
Freight Tonne
Kilometres
transported5
FTKT
(billion)
Total Revenue
Tonne
Kilometres14,6
RTK
(billion)
2010 4.6 1,218 0.20 45.4 167.2
2016 5.2 1,601 0.21 45.3 205.4
2020 5.6 1,825 0.25 49.4 231.9
2030 7.0 2,406 0.35 63.8 304.4
2040 8.4 2,919 0.45 79.4 371.2
Table 3. Fuel burn and CO2 emissions forecast for the baseline scenario
3 ICAO Long-Term Traffic Forecasts, Passenger and Cargo, July 2016. 4 Calculated based on 98% of the passenger traffic. 5 Includes passenger and freight transport (on all-cargo and passenger flights). 6 A value of 100 kg has been used as the average mass of a passenger incl. baggage (ref: ICAO).

ECAC/EU
Year
Fuel
Consumption
(109 kg)
CO2 emissions
(109 kg)
Fuel efficiency
(kg/RPK)
Fuel efficiency
(kg/RTK)
2010 37.98 120.00 0.0310 0.310
2016 46.28 146.26 0.0287 0.287
2020 49.95 157.85 0.0274 0.274
2030 61.75 195.13 0.0256 0.256
2040 75.44 238.38 0.0259 0.259
For reasons of data availability, results shown in this table do not include cargo/freight traffic.
Figure 2. Forecasted traffic until 2040 (assumed both for the baseline and implemented
measures scenarios)

ECAC/EU
Figure 3. Fuel consumption forecast for the baseline and implemented measures scenarios
(international passenger flights departing from ECAC airports)
2. ECAC Scenario with Implemented Measures,
Estimated Benefits of Measures
In order to improve fuel efficiency and to reduce future air traffic emissions beyond the
projections in the baseline scenario, ECAC States have taken further action. Assumptions for
a top-down assessment of effects of mitigation actions are presented here, based on modelling results by EUROCONTROL and EASA. Measures to reduce aviation’s fuel consumption and
emissions will be described in the following chapters.
For reasons of simplicity, the scenario with implemented measures is based on the same traffic volumes as the baseline case, i.e. EUROCONTROL’s ‘Regulation and Growth’
scenario described earlier. Unlike in the baseline scenario, the effects of aircraft related
technology development, improvements in ATM/operations and alternative fuels are considered here for a projection of fuel consumption and CO2 emissions up to the year 2040.
Effects of improved aircraft technology are captured by simulating fleet roll-over and
considering the fuel efficiency improvements of new aircraft types of the latest generation
(e.g. Airbus A320NEO, Boeing 737MAX, Airbus A350XWB etc.). The simulated future fleet of aircraft has been generated using the Aircraft Assignment Tool (AAT) developed
collaboratively by EUROCONTROL, EASA and the European Commission. The retirement
process of the Aircraft Assignment Tool is performed year by year, allowing the determination of the amount of new aircraft required each year. In addition to the fleet
rollover, a constant annual improvement of fuel efficiency of 0.96% per annum is assumed to
aircraft deliveries during the last 10 years of the forecast (2030-2040). This rate of

ECAC/EU
improvement corresponds to the ‘medium’ fuel technology scenario used by CAEP to
generate the fuel trends for the Assembly.
The effects of improved ATM efficiency are captured in the Implemented Measures Scenario on the basis of efficiency analyses from the SESAR project. Regarding SESAR
effects, baseline deployment improvements of 0.2% in terms of fuel efficiency are assumed to
be included in the base year fuel consumption for 2010. This improvement is assumed to rise to 0.3% in 2016 while additional improvements of 2.06% are targeted for the time period
from 2025 onwards7. Further non-SESAR related fuel savings have been estimated to amount
to 1.2% until the year 2010, and are already included in the baseline calculations8.
Regarding the introduction of sustainable alternative fuels, the European ACARE roadmap
targets described in section B chapter 2.1 of this document are assumed for the implemented
measures case. These targets include an increase of alternative fuel quantities to 2% of
aviation’s total fuel consumption in the year 2020, rising linearly to 25% in 2035 and 40% in 2050. An average 60% reduction of lifecycle CO2 emissions compared to crude-oil based JET
fuel was assumed for sustainable aviation fuels, which is in line with requirements from
Article 17 of the EU’s Renewable Energy Directive (Directive 2009/28/EC)9. The resulting
emission savings are shown in Table 6 and Figure 4 in units of equivalent CO2 emissions on a
well-to-wake basis. Well-to-wake emissions include all GHG emissions throughout the fuel lifecycle, including emissions from feedstock extraction or cultivation (including land-use
change), feedstock processing and transportation, fuel production at conversion facilities as
well as distribution and combustion10.
For simplicity, effects of market-based measures including the EU Emissions Trading
Scheme (ETS) and ICAO’s Carbon Offsetting and Reduction Scheme for International Aviation (CORSIA) on aviation’s CO2 emissions have not been modelled explicitly in the
top-down assessment of the implemented measures scenario presented here. CORSIA aims
for carbon-neutral growth (CNG) of aviation, and this target is therefore shown in Figure 411.
Tables 4-6 and Figures 3-4 summarize the results for the scenario with implemented
measures. It should be noted that Table 4 shows direct combustion emissions of CO2 (assuming 3.16 kg CO2 per kg fuel), whereas Table 6 and Figure 4 present equivalent CO2
emissions on a well-to-wake basis. More detailed tabulated results are found in Appendix A.
Table 4. Fuel burn and CO2 emissions forecast for the Implemented Measures Scenario (new
aircraft technology and ATM improvements only)
7 See SESAR1 D72 “Updated Performance Assessment in 2016” document, November 2016, project
B05, project manager: ENAIRE.
8 See SESAR1 D107 “Updated Step 1 validation targets – aligned with dataset 13”, project B.04.01, December 2014, project manager: NATS.
9 According to article 17 of the EU RED (Directive 2009/28/EC), GHG emission savings of at least 60% are required for biofuels produced in new installations in which production started on or after 1 January 2017.
10 Well-to-wake CO2e emissions of fossil-based JET fuel are calculated by assuming an emission index of 3.88 kg CO2e per kg fuel (see DIN e.V., "Methodology for calculation and declaration of energy consumption and GHG emissions of transport services (freight and passengers)", German version EN 16258:2012), which is in accordance with 89 g CO2e per MJ suggested by ICAO CAEP AFTF.
11 Note that in a strict sense the CORSIA target of CNG is aimed to be achieved globally (and hence not necessarily in each world region).

ECAC/EU
Year
Fuel
Consumption
(109 kg)
CO2 emissions
(109 kg)
Fuel efficiency
(kg/RPK)
Fuel efficiency
(kg/RTK)
2010 37.98 120.00 0.0310 0.310
2016 46.24 146.11 0.0286 0.286
2020 49.03 154.93 0.0245 0.245
2030 57.38 181.33 0.0242 0.242
2040 67.50 213.30 0.0237 0.237
For reasons of data availability, results shown in this table do not include cargo/freight traffic.
Table 5. Average annual fuel efficiency improvement for the Implemented Measures
Scenario (new aircraft technology and ATM improvements only)
Period Average annual fuel
efficiency improvement (%)
2010-2016
-1.36%
2016-
2020 -1.40%
2020-2030
-1.11%
2030-2040
-0.21%
Table 6. Equivalent (well-to-wake) CO2e emissions forecasts for the scenarios described in
this chapter
Year
Well-to-wake CO2e emissions (109 kg)
%
improvement
by
Implemented
Measures
(full scope)
Baseline
Scenario
Implemented Measures Scenario
Aircraft
techn.
improvements
only
Aircraft techn.
and ATM
improvements
Acft. techn. and
ATM
improvements +
alternative fuels
2010 147.3 NA
2016 179.6 179.6 179.4 179.4 -0.1%
2020 193.8 190.4 190.2 187.9 -3.0%

ECAC/EU
2030 239.6 227.6 222.6 199.5 -16.7%
2040 292.7 267.7 261.9 214.8 -26.6%
For reasons of data availability, results shown in this table do not include cargo/freight traffic. Note that fuel consumption is assumed to be unaffected by the use of alternative fuels.
Figure 4. Equivalent (well-to-wake) CO2 emissions forecast for the baseline and
implemented measures scenarios
As shown in Figures 3-4, the impact of improved aircraft technology indicates an overall
8.5% reduction of fuel consumption and CO2 emissions in 2040 compared to the baseline scenario. Whilst the data to model the benefits of ATM improvements and sustainable
alternative fuels shown in Figure 4 may be less robust, they are nevertheless valuable
contributions to reduce emissions further. Overall fuel efficiency, including the effects of new aircraft types and ATM-related measures, is projected to improve by 24% between 2010 and
2040.
Under the currently assumed aircraft and ATM improvement scenarios, the rate of fuel efficiency improvement is expected to slow down progressively until 2040. Aircraft
technology and ATM improvements alone will not be sufficient to meet the post-2020 carbon
neutral growth objective of aviation, nor will the use of alternative fuels even if Europe’s
ambitious targets for alternative fuels are met. This confirms that additional action,
particularly market-based measures, are required to fill the gap.

ECAC/EU
B. ACTIONS TAKEN COLLECTIVELY THROUGHOUT
EUROPE
1. AIRCRAFT-RELATED TECHNOLOGY DEVELOPMENT
2. ALTERNATIVE FUELS
3. IMPROVED AIR TRAFFIC MANAGEMENT AND
INRASTRUCTURE USE
4. ECONOMIC/MARKET-BASED MEASURES
5. EU INITIATIVES IN THIRD COUNTRIES
6. SUPPORT TO VOLUNTARY ACTIONS
ECAC/EU
1. AIRCRAFT-RELATED TECHNOLOGY DEVELOPMENT
1.1 Aircraft emissions standards (Europe's contribution to the development of the
aeroplane CO2 standard in CAEP)
European Member States fully supported the work achieved in ICAO’s Committee on
Aviation Environmental Protection (CAEP), which resulted in an agreement on the new
aeroplane CO2 Standard at CAEP/10 meeting in February 2016, applicable to new aeroplane type designs from 2020 and to aeroplane type designs that are already in-production in 2023.
Europe significantly contributed to this task, notably through the European Aviation Safety
Agency (EASA) which co-led the CO2 Task Group within CAEP’s Working Group 3, and which provided extensive technical and analytical support.
The assessment of the benefits provided by this measure in terms of reduction in European
emissions is not provided in this action plan. Nonetheless, elements of assessment of the overall contribution of the CO2 standard towards the global aspirational goals are available in
CAEP.

ECAC/EU
1.2 Research and development
Clean Sky is an EU Joint Technology Initiative (JTI) that aims to develop and mature breakthrough “clean technologies” for air transport globally. By accelerating their
deployment, the JTI will contribute to Europe’s strategic environmental and social priorities,
and simultaneously promote competitiveness and sustainable economic growth.
Joint Technology Initiatives are specific large-scale EU research projects created by the
European Commission within the 7th Framework Programme (FP7) and continued within the
Horizon 2020 Framework Programme. Set up as a Public Private Partnership between the European Commission and the European aeronautical industry, Clean Sky pulls together the
research and technology resources of the European Union in a coherent programme that
contributes significantly to the ’greening’ of global aviation.
The first Clean Sky programme (Clean Sky 1 - 2011-2017) has a budget of €1.6 billion, equally shared between the European Commission and the aeronautics industry. It aims to
develop environmental friendly technologies impacting all flying-segments of commercial
aviation. The objectives are to reduce aircraft CO2 emissions by 20-40%, NOx by around 60%
and noise by up to 10dB compared to year 2000 aircraft.
What has the current JTI achieved so far?
It is estimated that Clean Sky resulted in a reduction of aviation CO2 emissions by more than 32% with respect to
baseline levels (in 2000), which represents an aggregate of
up to 6 billion tonnes of CO2 over the next 35 years
This was followed up with a second programme (Clean Sky 2 – 2014-2024) with the
objective to reduce aircraft emissions and noise by 20 to 30% with respect to the latest technologies entering into service in 2014. The current budget for the programme is
approximately €4 billion.
The two Interim Evaluations of Clean Sky in 2011 and 2013 acknowledged that the
programme is successfully stimulating developments towards environmental targets. These preliminary assessments confirm the capability of achieving the overall targets at completion
of the programme.
Main remaining areas for RTD efforts under Clean Sky 2 are:
Large Passenger Aircraft: demonstration of best technologies to achieve the environmental goals whilst fulfilling future market needs and improving the
competitiveness of future products.
Regional Aircraft: demonstrating and validating key technologies that will enable a
90-seat class turboprop aircraft to deliver economic and environmental performance
and a superior passenger experience.
Fast Rotorcraft: demonstrating new rotorcraft concepts (tilt-rotor and compound helicopters) technologies to deliver superior vehicle versatility and performance.
Airframe: demonstrating the benefits of advanced and innovative airframe structures
(like a more efficient wing with natural laminar flow, optimised control surfaces,
control systems and embedded systems, highly integrated in metallic and advanced

ECAC/EU
composites structures). In addition, novel engine integration strategies and innovative
fuselage structures will be investigated and tested.
Engines: validating advanced and more radical engine architectures.
Systems: demonstrating the advantages of applying new technologies in major areas
such as power management, cockpit, wing, landing gear, to address the needs of a future generation of aircraft in terms of maturation, demonstration and Innovation.
Small Air Transport: demonstrating the advantages of applying key technologies on
small aircraft demonstrators to revitalise an important segment of the aeronautics
sector that can bring key new mobility solutions.
Eco-Design: coordinating research geared towards high eco-compliance in air vehicles over their product life and heightening the stewardship with intelligent Re-
use, Recycling and advanced services.
In addition, the Technology Evaluator will continue to be upgraded to assess technological
progress routinely and evaluate the performance potential of Clean Sky 2 technologies at both
vehicle and aggregate levels (airports and air traffic systems). More details on Clean Sky can
be found at the following link: http://www.cleansky.eu/
2. ALTERNATIVE FUELS
2.1 European Advanced Biofuels Flightpath
Within the European Union, Directive 2009/28/EC on the promotion of the use of energy
from renewable sources (“the Renewable Energy Directive” – RED) established mandatory targets to be achieved by 2020 for a 20% overall share of renewable energy in the EU and a
10% share for renewable energy in the transport sector. Furthermore, sustainability criteria
for biofuels to be counted towards that target were established12. Directive 2009/28/EC of
the European Parliament and of the Council of 23/04/2009 on the promotion of the use of
energy from renewable sources, details in its Article 17 that ‘with effect from 1 January 2017, the greenhouse gas emission saving from the use of biofuels and bioliquids taken into account
for the purposes referred to in points (a), (b) and (c) of paragraph 1 shall be at least 50 %.
From 1 January 2018 that greenhouse gas emission saving shall be at least 60 % for biofuels
and bioliquids produced in installations in which production started on or after 1 January 2017’.
In November 30, 2016, the European Commission (EC) presented a proposal to the EU
Council and the European Parliament for a recast of the Renewable Energy Directive for 2030.
12 Directive 2009/28/EC of the European Parliament and of the Council of 23/04/2009 on the
promotion of the use of energy from renewable sources and amending and subsequently repealing Directives 2001/77/EC and 2003/30/EC, Article 17 Sustainability criteria for biofuels
and bioliquids, at pp. EU Official Journal L140/36-L140/38

ECAC/EU
To promote the deployment and development of low carbon fuels, such as advanced biofuels,
it is proposed to introduce after 2020 an obligation requiring fuel suppliers to sell a gradually
increasing share of renewable and low-emission fuels, including advanced biofuels and renewable electricity (at least 1.5% in 2021 increasing to at least 6.8% by 2030).
To promote innovation the obligation includes a specific sub-quota for advanced biofuels,
increasing from 0.5% in 2021 to at least 3.6% in 2030. Advanced biofuels are defined as biofuels that are based on a list of feedstocks; mostly lignocellulosic material, wastes and
residues.
Aviation and marine sectors are explicitly covered in the proposal. In fact, it is proposed that advanced alternative fuels used for aviation and maritime sectors can be counted 1.2 times
towards the 6.8% renewable energy mandate. This would provide an additional incentive to
develop and deploy alternative fuels in the aviation sector.
In February 2009, the European Commission's Directorate General for Energy and Transport initiated the SWAFEA (Sustainable Ways for Alternative Fuels and Energy for Aviation)
study to investigate the feasibility and the impact of the use of alternative fuels in aviation.
The SWAFEA final report was published in July 201113. It provides a comprehensive
analysis on the prospects for alternative fuels in aviation, including an integrated analysis of
the technical feasibility, environmental sustainability (based on the sustainability criteria of
the EU Directive on renewable energy14) and economic aspects. It includes a number of recommendations on the steps that should be taken to promote the take-up of sustainable
biofuels for aviation in Europe.
In March 2011, the European Commission published a White Paper on transport15. In the
context of an overall goal of achieving a reduction of at least 60% in greenhouse gas
emissions from transport by 2050 with respect to 1990, the White Paper established a goal of
low-carbon sustainable fuels in aviation reaching 40% by 2050.
Source: ACARE Strategic Research and Innovation Agenda, Volume 2
As a first step towards
delivering this goal,
in June 2011 the European
Commission, in close coordination with Airbus, leading European airlines (Lufthansa, Air
France/KLM, & British Airways) and key European biofuel producers (Choren Industries,
Neste Oil, Biomass Technology Group and UOP), launched the European Advanced
Biofuels Flight-path. This industry-wide initiative aims to speed up the commercialisation of
aviation biofuels in Europe, with the objective of achieving the commercialisation of
sustainably produced paraffinic biofuels in the aviation sector by reaching an aggregated 2 million tonnes consumption by 2020.
13http://www.icao.int/environmental-
protection/GFAAF/Documents/SW_WP9_D.9.1%20Final%20report_released%20July2011.pdf
14 Directive 2009/28/EC of the European Parliament and of the Council of 23 April 2009 on the
promotion of the use of energy from renewable sources and amending and subsequently repealing Directives 2001/77/EC and 2003/30/EC
15 Roadmap to a Single European Transport Area – Towards a competitive and resource efficient
transport system, COM (2011) 144 final
ACARE Roadmap targets regarding share alternative
sustainable fuels:
Aviation to use:
- at minimum 2% sustainable alternative fuels in 2020;
- at minimum 25% sustainable alternative fuels in 2035;
- at minimum 40% sustainable alternative fuels in 2050

ECAC/EU
This initiative is a shared and voluntary commitment by its members to support and promote
the production, storage and distribution of sustainably produced drop-in biofuels for use in
aviation. It also targets establishing appropriate financial mechanisms to support the construction of industrial "first of a kind" advanced biofuel production plants. The Biofuels
Flight path is explained in a technical paper, which sets out in more detail the challenges and
required actions16.
More specifically, the initiative focuses on the following:
1. Facilitating the development of standards for drop-in biofuels and their certification for use in commercial aircraft,
2. Working together across the full supply chain to further develop worldwide accepted
sustainability certification frameworks,
3. Agree biofuel take-off arrangements over a defined period of time and at a reasonable
cost,
4. Promote appropriate public and private actions to ensure the market uptake of paraffinic biofuels by the aviation sector,
5. Establish financing structures to facilitate the realisation of 2nd Generation biofuel
projects,
6. Accelerate targeted research and innovation for advanced biofuel technologies, and especially algae, and
7. Take concrete actions to inform the European citizen of the benefits of replacing
kerosene with certified sustainable biofuels.
When the Flightpath 2020 initiative began in 2010, only one production pathway was
approved for aviation use; renewable kerosene had only been produced at very small scale
and only a handful of test and demonstration flights had been conducted using it. Since then,
worldwide technical and operational progress in the industry has been remarkable. Four different pathways for the production of renewable kerosene are now approved and several
more are expected to be certified soon. A significant number of flights using renewable
kerosene have been conducted, most of them revenue flights carrying passengers. Production has been demonstrated at up to industrial scale for some of the pathways. Distribution of
renewable kerosene through an airport hydrant system was also demonstrated in Oslo in 2015.
In 2016 the European commission tendered support and secretariat functions for the Flightpath 2020, which had so far depended on the initiative of the individual members. This
€1.5m tender was won by a consortium run by SENASA, which started the work supporting
the Flightpath at the end of 2016.
16 https://ec.europa.eu/energy/sites/ener/files/20130911_a_performing_biofuels_supply_chain.pdf

ECAC/EU
Performed flights using bio-kerosene
IATA: 2000 flights worldwide using bio-kerosene blends performed by
22 airlines between June 2011 and December 2015
Lufthansa: 1 189 Frankfurt-Hamburg flights using 800 tonnes of bio-
kerosene (during 6 months period June - December 2011)
KLM: a series of 200 Amsterdam-Paris flights from September 2011 to December 2014, 26 flights New York-Amsterdam in 2013, and 20 flights
Amsterdam-Aruba in 2014 using bio-kerosene
Air France: A series of 50 Paris – Toulouse flights evaluating SIP
kerosene in 2014/2015
Since late 2015, bio kerosene is regularly available as a fuel blend at
Oslo airport. Total throughput so far can be approximatively estimated
at 2000 tonnes. Attribution to individual flights is no longer possible except on an accounting basis as the fuel is commingled in the normal
hydrant fuelling infrastructure of the airport.
Production (EU)
Neste (Finland): by batches
- Frankfurt-Hamburg (6 months) 1 189 flights operated by Lufthansa: 800
tonnes of bio-kerosene
- Itaka: €10m EU funding (2012-2015):ca. 1 000 tonnes
Biorefly: €13.7m EU funding: 2000 tonnes per year– BioChemtex (Italy)
BSFJ Swedish Biofuels: €27.8m EU funding (2014-2019)

ECAC/EU
2.2 Research and Development projects on alternative fuels in aviation
In the time frame 2011-2016, 3 projects have been funded by the FP7 Research and
Innovation program of the EU.
ITAKA: €10m EU funding (2012-2015) with the aim of assessing the potential of a specific
crop (camelina) for providing jet fuel. The project aims entailed testing the whole chain from
field to fly and assessing the potential beyond the data gathered in lab experiments, gathering experiences on related certification, distribution and economic aspects. For a feedstock,
ITAKA targeted European camelina oil and used cooking oil in order to meet a minimum of
60% GHG emissions savings compared to the fossil fuel jetA1.
SOLAR-JET: This project has demonstrated the possibility of producing jet-fuel from CO2
and water. This was done by coupling a two-step solar thermochemical cycle based on non-
stoichiometric ceria redox reactions with the Fischer-Tropsch process. This successful
demonstration is further complemented by assessments of the chemical suitability of the solar kerosene, identification of technological gaps, and determination of the technological and
economical potentials.
Core-JetFuel: €1.2m EU funding (2013-2017) this action evaluated the research and innovation “landscape” in order to develop and implement a strategy for sharing information,
for coordinating initiatives, projects and results and to identify needs in research,
standardisation, innovation/deployment and policy measures at European level. Bottlenecks of research and innovation will be identified and, where appropriate, recommendations for the
European Commission will be made with respect to the priorities in the funding strategy. The
consortium covers the entire alternative fuel production chain in four domains: Feedstock and
sustainability; conversion technologies and radical concepts; technical compatibility, certification and deployment; policies, incentives and regulation. CORE-Jet Fuel ensures
cooperation with other European, international and national initiatives and with the key
stakeholders. The expected benefits are enhanced knowledge amongst decision makers, support for maintaining coherent research policies and the promotion of a better
understanding of future investments in aviation fuel research and innovation.
In 2015, the European Commission launched projects under the Horizon 2020 research
programme with production capacities of the order of several thousand tonnes per year.
In addition, in 2013 the Commission tendered the HBBA study (High Biofuel Blends in
Aviation). This study analysed in detail the blending behaviour of fossil kerosene with bio
kerosene produced by the various pathways either already approved or undergoing the technical approval process. It also analysed the impact of bio kerosene on various types of
aircraft fuel seals, plus the effect of different bio-kerosenes on aircraft emissions. The final
report on this research was published in early 2017 and is available at:
https://ec.europa.eu/energy/sites/ener/files/documents/final_report_for_publication.pdf.

ECAC/EU
3. IMPROVED AIR TRAFFIC MANAGEMENT AND INFRASTRUCTURE USE
The EU's Single European Sky Initiative and SESAR
3.1 SESAR Project
The European Union's Single European Sky (SES) policy aims to reform Air Traffic
Management (ATM) in Europe in order to enhance its performance in terms of its capacity to
manage larger volumes of flights in a safer, more cost-efficient and environmental friendly manner.
The initial SES aims with respect to the 2005 performance were to:
Triple capacity of ATM systems,
Reduce ATM costs by 50%,
Increase safety by a factor of 10, and
Reduce the environmental impact by 10% per flight.
SESAR, the technology pillar of the Single European Sky, contributes to the Single Sky's performance targets by defining, developing, validating and deploying innovative
technological and operational solutions for managing air traffic in a more efficient manner.
Guided by the European ATM Master Plan, the SESAR Joint Undertaking (JU) is responsible
for defining, developing, validating and delivering technical and operation solutions to modernise Europe’s air traffic management system and deliver benefits to Europe and its
citizens. The SESAR JU research programme has been split into 2 phases, SESAR 1 (from
2008 to 2016) and SESAR 2020 (starting in 2016). It is delivering solutions in four key areas, namely airport operations, network operations, air traffic services and technology enablers.
The SESAR contribution to the SES high-level goals set by the Commission are continuously
reviewed by the SESAR JU and are kept up to date in the ATM Master Plan.
ECAC/EU
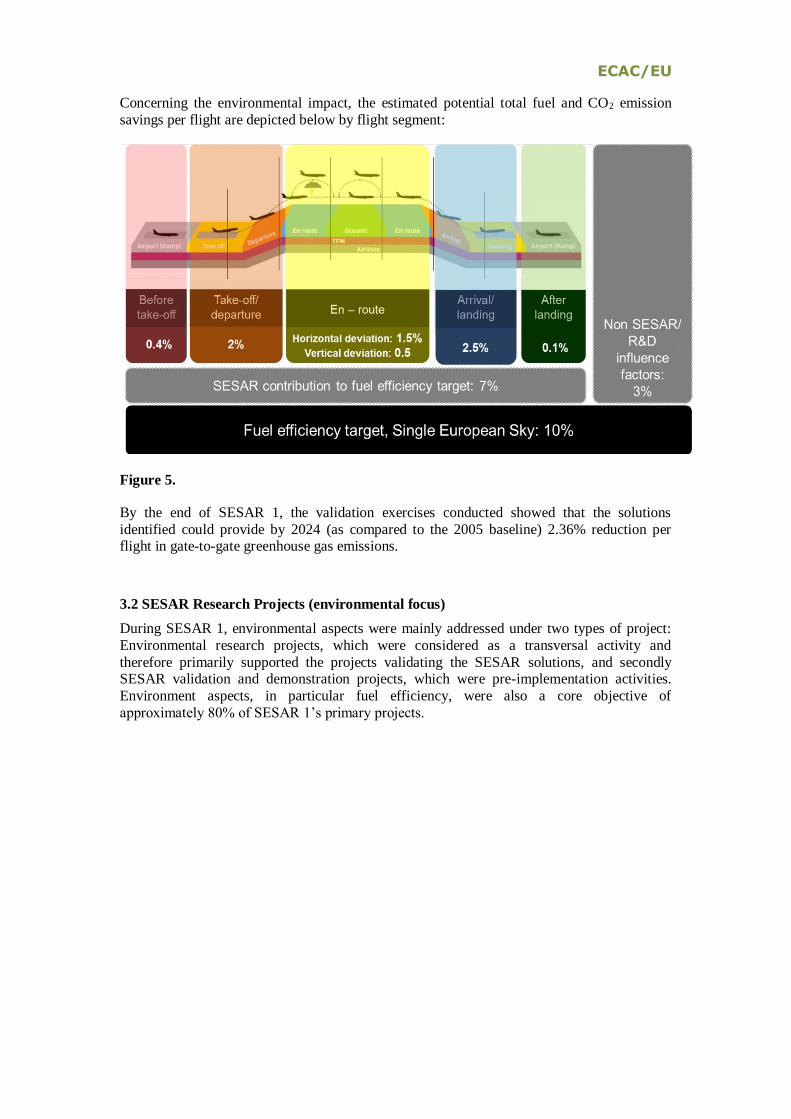
Concerning the environmental impact, the estimated potential total fuel and CO2 emission
savings per flight are depicted below by flight segment:
Figure 5.
By the end of SESAR 1, the validation exercises conducted showed that the solutions
identified could provide by 2024 (as compared to the 2005 baseline) 2.36% reduction per flight in gate-to-gate greenhouse gas emissions.
3.2 SESAR Research Projects (environmental focus)
During SESAR 1, environmental aspects were mainly addressed under two types of project:
Environmental research projects, which were considered as a transversal activity and
therefore primarily supported the projects validating the SESAR solutions, and secondly SESAR validation and demonstration projects, which were pre-implementation activities.
Environment aspects, in particular fuel efficiency, were also a core objective of
approximately 80% of SESAR 1’s primary projects.

ECAC/EU
Environmental Research Projects:
The four Environmental research projects have been completed:
Project 16.03.01 dealt with the “Development of the Environment validation
framework (Models and Tools)”);
Project 16.03.02 addressed the “Development of environmental metrics”;
Project 16.03.03 dealt with the “Development of a framework to establish
interdependencies and trade-off with other performance areas”;
Project 16.03.07 considered “Future regulatory scenarios and risks”.
In the context of Project 16.03.01, a first version of the IMPACT tool was developed by
EUROCONTROL providing SESAR primary projects with the means to conduct fuel
efficiency, aircraft emissions and noise assessments, from a web-based platform, using the
same aircraft performance assumptions. IMPACT successfully passed the verification and validation process of the ICAO Committee on Aviation Environmental Protection Modelling
and Database Group CAEP. Project 16.06.03 also ensured the continuous
development/maintenance of other tools covering aircraft greenhouse gas (GHG) assessment (AEM), and local air quality issues (Open-ALAQS). It should be noted that these tools were
developed to cover the research and the future deployment phase of SESAR, as well as to
support European states and agencies in conducting environmental impact assessments for
operational or regulatory purposes.
In the context of Project 16.03.02, a set of metrics for assessing GHG emissions, noise, and
airport local air quality were documented. The metrics identified by Project 16.03.02 will be
gradually implemented in IMPACT.
Project 16.03.03 produced a comprehensive analysis of the issues related to environmental
impact interdependencies and trade-offs.
Project 16.03.07 conducted a review of the then current environmental regulatory measures as applicable to ATM and SESAR deployment, and another report presenting an analysis of
environmental regulatory and physical risk scenarios in the form of user guidance. It
identifies both those concept of operations and Key Performance Areas which are most likely
to be affected by these risks and the future operational solutions that can contribute to mitigating them. It also provides a gap analysis identifying knowledge gaps or uncertainties
which require further monitoring, research or analysis.
Project 16.06.03, was the SESAR Environment support and coordination project which ensured the coordination and facilitation of all the Environmental research project activities
whilst supporting the SESAR/AIRE/DEMO projects in the application of the material
produced by the research projects. In particular, this project delivered an Environment Impact Assessment methodology providing guidance on how to conduct an assessment, which
metrics to use, and dos and don’ts for each type of validation exercise with a specific
emphasis on flight trials.
The above-mentioned SESAR 1 environmental project deliverables constitute the reference material that SESAR2020 should be using.

ECAC/EU
SESAR demonstration projects:
In addition to its core activities, the SESAR JU co-financed projects where ATM stakeholders
worked collaboratively to perform integrated flight trials and demonstrations of solutions.
These aimed to reduce CO2 emissions for surface, terminal, and oceanic operations and
substantially accelerate the pace of change. Between 2009 and 2012, the SESAR JU co-financed a total of 33 “green” projects in collaboration with global partners, under the
Atlantic Interoperability Initiative to Reduce Emissions (AIRE).
A total of 15 767 flight trials were conducted under AIRE, involving more than 100 stakeholders, demonstrating savings ranging from 20 to 1 000kg of fuel per flight (or 63 to 3
150 kg of CO2), and improvements in day-to-day operations. Another nine demonstration
projects took place from 2012 to 2014, also focusing on the environment, and during 2015/2016 the SESAR JU co-financed fifteen additional large-scale demonstration projects,
which were more ambitious in geographic scale and technology. More information can be
found at http://www.sesarju.eu
A key feature leading to the success of AIRE is that it focused strongly on operational and procedural techniques rather than new technologies. AIRE trials used technology that was
already in place, but until the relevant AIRE project came along, air traffic controllers and
other users hadn’t necessarily thought deeply about how to make the best operationally use of that technology. For example, because of the AIRE initiative and the good cooperation
between NAV Portugal and FAA, in New York and St Maria oceanic airspace lateral
separation optimisation is given for any flight that requests it.
Specific trials were carried for the following improvement areas/solutions as part of the AIRE
initiative:
a. Use of GDL/DMAN systems (pre-departure sequencing system / Departure Manager)
in Amsterdam, Paris and Zurich,
b. Issue of Target-Off Block time (TOBT), calculation of variable taxiout time and issue
of Target-Start-up Arrival Time (TSAT) in Vienna,
c. Continuous Descent Operations (CDOs or CDAs) in Amsterdam, Brussels, Cologne, Madrid, New York, Paris, Prague, Pointe-à-Pitre, Toulouse, and Zurich,
d. CDOs in Stockholm, Gothenburg, Riga, La Palma; Budapest and Palma de Majorca
airports using RNP-AR procedures,
e. Lateral and vertical flight profile changes in the NAT taking benefit of the implementation of Automatic Dependent Surveillance-Broadcast (ADS-B)
surveillance in the North Atlantic,
f. Calculation of Estimated Times of Arrival (ETA) allowing time based operations in Amsterdam,
g. Precision Area Navigation - Global Navigation Satellite System (PRNAV GNSS)
Approaches in Sweden,
h. Free route in Lisbon and Casablanca, over Germany, Belgium, Luxembourg,
Netherlands in the EURO-SAM corridor, France, and Italy,
i. Global information sharing and exchange of actual position and updated
meteorological data between the ATM system and Airline AOCs for the vertical and lateral optimisation of oceanic flights using a new interface.
The AIRE 1 campaign (2008-2009) demonstrated, with 1,152 trials performed, that significant savings can already be achieved using existing technology. CO2 savings per flight
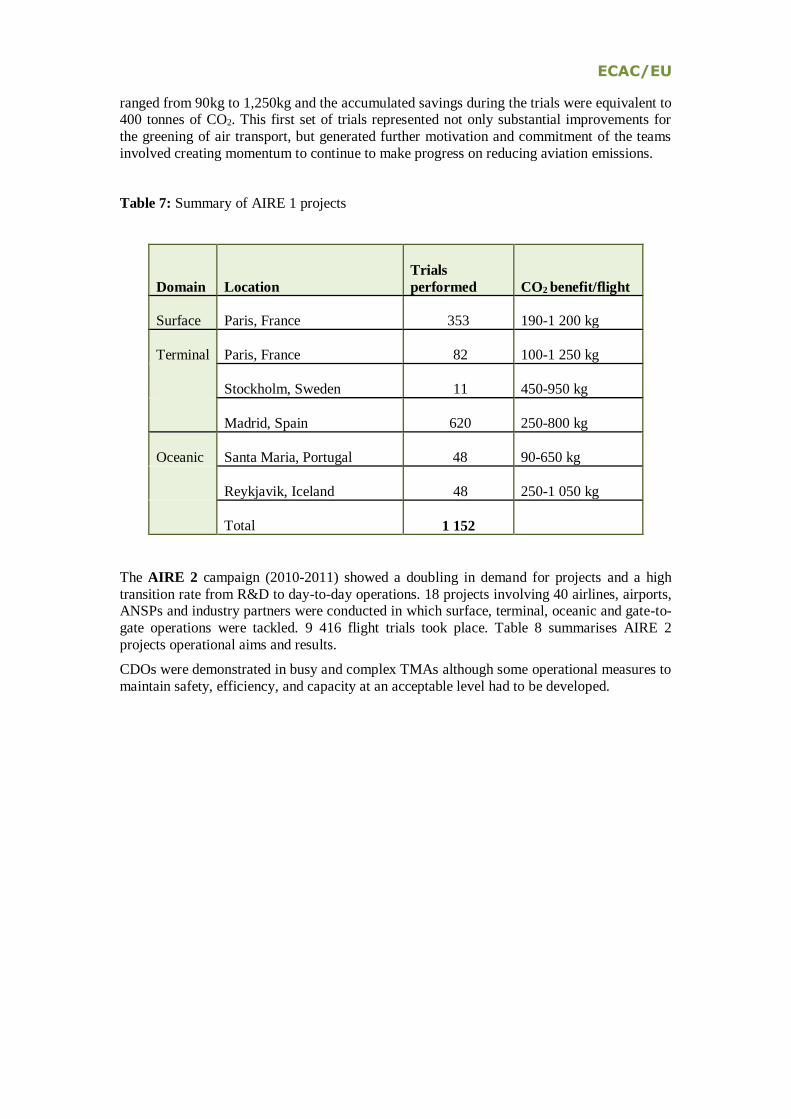
ECAC/EU
ranged from 90kg to 1,250kg and the accumulated savings during the trials were equivalent to 400 tonnes of CO2. This first set of trials represented not only substantial improvements for
the greening of air transport, but generated further motivation and commitment of the teams
involved creating momentum to continue to make progress on reducing aviation emissions.
Table 7: Summary of AIRE 1 projects
Domain Location
Trials
performed CO2 benefit/flight
Surface Paris, France 353 190-1 200 kg
Terminal Paris, France 82 100-1 250 kg
Stockholm, Sweden 11 450-950 kg
Madrid, Spain 620 250-800 kg
Oceanic Santa Maria, Portugal 48 90-650 kg
Reykjavik, Iceland 48 250-1 050 kg
Total 1 152
The AIRE 2 campaign (2010-2011) showed a doubling in demand for projects and a high
transition rate from R&D to day-to-day operations. 18 projects involving 40 airlines, airports, ANSPs and industry partners were conducted in which surface, terminal, oceanic and gate-to-
gate operations were tackled. 9 416 flight trials took place. Table 8 summarises AIRE 2
projects operational aims and results.
CDOs were demonstrated in busy and complex TMAs although some operational measures to
maintain safety, efficiency, and capacity at an acceptable level had to be developed.

ECAC/EU
Table 8: Summary of AIRE 2 projects
Project name Location Operation Objective
CO2 and
Noise
benefits per
flight (kg)
Number
of
flights
CDM at Vienna
Airport
Austria CDM notably
pre-departure
sequence
CO2 &
Ground
Operational
efficiency
54 208
Greener airport
operations
under adverse conditions
France CDM notably
pre-departure
sequence
CO2 &
Ground
Operational efficiency
79 1 800
B3 Belgium CDO in a
complex radar
vectoring environment
Noise & CO2 160-315; -
2dB
(between 10 to 25 Nm
from
touchdown)
3 094
DoWo - Down
Wind
Optimisation
France Green STAR &
Green IA in
busy TMA
CO2 158-315 219
REACT-CR Czech republic
CDO CO2 205-302 204
Flight Trials for
less CO2
emission during transition
from en-route to
final approach
Germany Arrival vertical
profile
optimisation in high density
traffic
CO2 110-650 362
RETA-CDA2 Spain CDO from ToD CO2 250-800 210
DORIS Spain Oceanic: Flight
optimisation
with ATC coordination &
Data link
(ACARS, FANS CPDLC)
CO2 3 134 110
ONATAP Portugal Free and Direct
Routes
CO2 526 999
ENGAGE UK Optimisation of cruise altitude
and/or Mach
number
CO2 1 310 23
RlongSM (Reduced
UK Optimisation of cruise altitude
CO2 441 533

ECAC/EU
longitudinal Separation
Minima)
profiles
Gate to gate
Green Shuttle
France Optimisation of
cruise altitude profile & CDO
from ToD
CO2 788 221
Transatlantic
green flight PPTP
France Optimisation of
oceanic trajectory
(vertical and
lateral) & approach
CO2 2 090+
1 050
93
Greener Wave Switzerland Optimisation of
holding time
through 4D slot allocation
CO2 504 1 700
VINGA Sweden CDO from ToD
with RNP STAR and RNP
AR.
CO2 & noise 70-285;
negligible change to
noise
contours
189
AIRE Green Connections
Sweden Optimised arrivals and
approaches
based on RNP
AR & Data link. 4D
trajectory
exercise
CO2 & noise 220
25
Trajectory
based night
time
The
Netherlands
CDO with pre-
planning
CO2 + noise TBC 124
A380 Transatlantic
Green Flights
France Optimisation of taxiing and
cruise altitude
profile
CO2 1 200+
1 900
19
Total 9 416
The AIRE 3 campaign comprised 9 projects (2012-2014) and 5199 trials summarised in table
9.
Table 9: Summary of AIRE 3 projects
Project name Location Operation Number
of Trials
Benefits per flight

ECAC/EU
AMBER Riga
International
Airport
Turboprop aircraft to fly
tailored Required
Navigation Performance
– Authorisation Required
(RNP-AR) approaches
together with Continuous
Descent Operations
(CDO),
124 230 kg reduction in
CO2 emissions per
approach; A reduction
in noise impact of 0.6
decibels (dBA).
CANARIAS La Palma and
Lanzarote
airports
CCDs and CDOs 8 Area Navigation-
Standard Terminal
Arrival Route (RNAV
STAR) and RNP-AR
approaches
34-38 NM and 292-
313 kg of fuel for La
Palma and 14 NM and
100 kg of fuel for
Lanzarote saved.
OPTA-IN Palma de
Mallorca
Airport
CDOs 101 Potential reduction of
7-12% in fuel burn
and related
CO2 emissions
REACT plus Budapest
Airport
CDOs and CCOs 4 113 102 kg of fuel
conserved during each
CDO
ENGAGE Phase
II
North Atlantic –
between Canada
& Europe
Optimisation of cruise
altitude and/or Mach
number
210 200-400 litres of fuel
savings;
An average of 1-2% of
fuel burn
SATISFIED EUR-SAM
Oceanic corridor
Free routing 165 1.58 t CO2 emissions
SMART Lisbon flight
information
region (FIR),
New York
Oceanic and
Santa Maria FIR
Oceanic: Flight
optimisation
250 3.13 t CO2 per flight
WE-FREE Paris CDG,
Venice, Verona,
Milano Linate,
Pisa, Bologna,
Torino, Genoa
airports
Free routing 128 693 kg CO2 for CDG-
Roma Fiumicino; 504
kg CO2 for CDG
Milano Linate

ECAC/EU
MAGGO Santa Maria FIR
and TMA
Several enablers 100 The MAGGO project
couldn’t be concluded
3.3 SESAR2020 Environmental Performance Assessment
SESAR2020 builds upon the expectations of SESAR1 and of the deployment baseline.
It is estimated that around 50.0m MT of fuel per year will be burned by 2025, ECAC wide, by around 10m flights. The SESAR2020 Fuel Saving Ambition (10%) equate to 500kg per flight
or around 1.6 t CO2 per flight, including:
• SESAR2020 Fuel Saving target for Solutions (6.8%) = 340kg/flight or 1 t CO2/flight,
• SESAR 1 Fuel Saving performance (1.8%) = 90kg/flight
or 283kg of CO2/flight,
• SESAR Deployment Baseline Fuel Saving performance (0.2%) = 10kg/flight or 31kg
of CO2/flight,
• Non-SESAR ATM improvements (1.2%) = 60kg/flight or 189Kg of CO2/flight.
It has to be noted that, while the SESAR 1 baseline was 2005, the SESAR2020 baseline is 2012.
Figure 6.
SESAR2020 has put in place a methodology that should allow a close monitoring of the expected fuel saving performance of each Solution, and of the overall programme. But, at this
point of the SESAR2020 programme, it is too early to assess with a good level of confidence
the gap between the expected fuel-saving benefit of each SESAR Solution and its
demonstrated potential from the results of the validation exercises.
340 kg/flight
90 kg/flight
60 kg/flight
10 kg/flight
SESAR 500kg Fuel Saving Ambition repartition
SESAR 2020 Fuel Saving targetfor Solutions (6.8%)
SESAR 1 Fuel Savingperformance (1.8%)
Non-SESAR ATMimprovements (1.2%)
SESAR Deployment BaselineFuel Saving performance(0.2%)

ECAC/EU
However, 30 out of the 85 SESAR2020 Solutions have the potential to generate fuel savings. Table 10 provides the Top 10 Solutions with the biggest expected fuel saving potential:
Table 10: Summary of SESAR2020 projects offering the greatest potential fuel savings
Solution Short description + Fuel saving rational Operational environment
(OE/ Sub-OEs)
benefitting
PJ.07-01
Airspace User
Processes for
Trajectory Definition
This Solution refers to the development of processes related to the Flight Operation Centre (FOC) aimed
at managing and updating the shared business
trajectory, and fully integrating FOCs in the ATM Network processes. These processes respond to the
need to accommodate individual airspace users’
business needs and priorities without compromising the performance of the overall ATM system or the
performance of other stakeholders. This will also
ensure continuity in the Collaborative Decision
Making process throughout the trajectory lifecycle.
The benefits will come through anticipation and
choice of the optimal route and reduction of vertical
inefficiencies, which will reduce costs and fuel burn. No real impact on airport is expected.
Mainly for:
Terminal Very High
Complexity
En-route Very High Complexity
Some benefit but much lower for:
Terminal High, Medium,
Low Complexity
En-route High, Medium Complexity
PJ.10-01C
Collaborative
Control
This Solution refers to coordination by exception rather than coordination by procedure and is
facilitated by advanced controller tools, reducing
the need for coordination agreements, fewer
boundary constraints and the ability to combine sectors into multisector planner teams.
The existence of clear procedures for collaborative
control reduces the need for coordination and results in a more streamlined method of operation close to
a sector boundary. This may bring a reduction in the
number of level-offs and, thus, bring a partial improvement in fuel efficiency.
Mainly for:
Terminal Very High
Complexity
En-route Very High
Complexity
Some benefit but much
lower for:
Terminal High, Medium,
Low Complexity
En Route High, Medium Complexity
PJ.10-02b
Advanced
Separation Management
This Solution aims to further improve the quality of
services of separation management in the en-route
and TMA operational environments by introducing automation mechanisms and integrating additional
information (ATC intent, aircraft intent).
Controller tools will enable earlier and more precise detection and resolution of conflicts. This will
reduce the need for vectoring and enable de-
Mainly for:
Terminal Very High
Complexity
En-route Very High
Complexity
Some benefit but much

ECAC/EU
confliction actions to be taken earlier and through the usage of closed clearances. Those will be
managed more proactively on-board, and benefit
fuel efficiency. Clearances issued by the ATCOs
may, in some situations, take into account aircraft derived data related to airline preferences, bringing
an improvement in fuel efficiency.
lower:
Terminal High, Medium,
Low Complexity
En-route High, Medium
Complexity
PJ.09-03
Collaborative
Network Management
Functions
This Solution allows for network management
based on transparency, performance targets and
agreed control mechanisms. The work enables a real-time visualisation of the evolving Airport
Operation Plan (AOP) and Network Operating Plan
(NOP) planning environment (such as demand pattern and capacity bottlenecks) to support airspace
user and local planning activities.
Thanks to this Solution, the increased efficiency of the performance of the system due to more
optimised trajectory with airlines preference will
result in fuel burn reductions.
Mainly for:
En-route Very High
Complexity
Some benefit but much
lower for:
Terminal very High, High,
Medium Complexity
En-route High, Medium Complexity
Airport very large, large,
medium
PJ.01-02
Use of Arrival
and Departure
Management Information
for Traffic
Optimisation
within the TMA
This Solution brings near real time traffic management to the TMA, taking advantage of
predicted demand information provided by arrival
and departure management systems from one or multiple airports. This will allow the identification
and resolution of complex interacting traffic flows
in the TMA and on the runway, through the use of
AMAN and DMAN flow adjustments and ground holdings.
Traffic optimisation obtained thanks to this Solution
will reduce the need for tactical interventions and will result in more efficient flights, and increased
flight efficiency will save fuel.
Mainly for:
Terminal Very High
Complexity
En-route Very High Complexity
Some benefit but much
lower for:
Terminal very High, High,
Medium, Low Complexity
En-route High, Medium Complexity
PJ2-01
Wake
turbulence separation
optimization
This Solution refers to the use of downlinked
information from aircraft to predict wake vortex and
determine appropriate wake-vortex minima dynamically, thereby optimising runway delivery.
Wake turbulence separation optimization should
reduce airborne delays due to arrival capacity limitations linked to wake separations.
For major airports that are today constrained in peak
hours, the use of:
- optimised wake category scheme or pairwise
separations can either be translated into added
capacity (as described above) or additional
resilience in case of perturbation.
Mainly for:
Airports and TMAs with
High and Medium complexity.
• Any runway
configuration. • Airports with mainly
strong headwinds.
• Capacity constrained airports or airports with
observed delay.

ECAC/EU
- time based separation will reduce the effect of a headwind on the arrival flow rate and thus
increase the predictability of the scheduling process.
On less constrained airports, significant improvement can also be observed by employing
reduced separation applied on a time based
separation basis in the specific runway configuration or wind conditions responsible for a
large part of the airport delay.
This increases the flexibility for Controllers to
manage the arrival traffic due to the separation minima reduction.
The weather dependant reduction of wake
separation, considering the allowable increase of throughput, is expected to be a major mitigation of
delay and to provide for an increase in the flexibility
for Controllers to manage the arrival traffic due to the reduction in the required wake separations.
The reduction of delay will generate fuel saving.
PJ.09-02
Integrated local DCB
processes
This Solution sees the seamless integration of local
network management with extended air traffic control planning and arrival management activities
in short-term and execution phases. The work will
improve the efficiency of ATM resource management, as well as the effectiveness of
complexity resolutions by closing the gap between
local network management and extended ATC
planning.
The increased efficiency of the performance of the
system due to more optimised trajectory with
airlines preference will result in fuel burn reductions.
Mainly for:
Airport Very large
Some benefit but much
lower for: Terminal very High, High, Medium
Complexity
En-route very High, High,
Medium Complexity
Airport large, medium
PJ.01-03
Dynamic and
Enhanced Routes and
Airspace
This Solution brings together vertical and lateral
profile issues in both the en-route and TMA phases
of flight, with a view to creating an end-to-end optimised profile and ensuring transition between
free route and fixed route airspace. The Solution
will be supported by new controller tools and enhanced airborne functionalities.
Significant fuel efficiency benefits are expected
from Continuous Descent (CDO) / Continuous
Climb Operations (CCO) in high density operations.
CDO / CCO permit closer correlation of the actual
with optimal vertical profile, to take into account
the preference of the Airspace User for the most efficient climb / descent profile for the flight.
Implementation of enhanced conformance
monitoring / alerting by both ground and airborne
Mainly for:
Terminal Very High
Complexity
Some benefit but much
lower for:
Terminal High, Medium
Complexity
ECAC/EU
systems reduce the likelihood of ATCO intervention in the climb / descent, so reducing the potential for
tactical level offs.
PJ.02-08
Traffic optimisation
on single and
multiple
runway airports
This Solution refers to a system that enables tower
and approach controllers to optimise runway operations arrival and/or departure spacing and
make the best use of minimum separations, runway
occupancy, runway capacity and airport capacity.
Imbalances known more than 3 hours ahead allow to re-planning inbound traffic from the originating
airport or reconsider Airport Transit View (ATV)
on behalf of airlines reducing delays due to airport constraints up to 20%. Planning runway closures or
runway changes in the optimum periods of the day
will minimize the time spent re-routing air and ground traffic during the execution phase. Sharing
this information with the different actors will
provide the NOP with more accurate forecasts for
arrival and departure time in order to coordinate the subsequent target times.
There should be some fuel gains as a direct consequence of improved predictability, both for
departures and arrivals (less variability ==> less
patch stretching, holdings ...).
Mainly for:
Terminal Very High Complexity
• Single and Multiple
runways • Preferably Congested
large and medium size
airports
PJ.08-01
Management
of Dynamic
Airspace configurations
This Solution refers to the development of the process, procedures and tools related to Dynamic
Airspace Configuration (DAC), supporting
Dynamic Mobile Areas of Type 1 and Type 2. It consists of the activation of Airspace configurations
through an integrated collaborative decision making
process, at national, sub-regional and regional levels; a seamless and coordinated approach to
airspace configuration, from planning to execution
phases, allowing the Network to continuously adapt
to demand pattern changes in a free route environment) and ATC sector configurations
adapted to dynamic TMA boundaries and both fixed
and dynamic elements.
This solution increased efficiency enabling
optimised flight trajectories and profiles with the
end result being reduced fuel burn, noise and CO2 emissions.
Advanced Airspace Management should decrease
Airspace Users fuel consumption and reduce flight time.
Optimised trajectory and a more direct route as a
result of enhanced situation awareness through real airspace status update and seamless civil-military
Mainly for:
En-route Very High
Complexity
Some benefit but much
lower for:
En-route High, Medium Complexity

ECAC/EU
coordination by AFUA application.

ECAC/EU
ECAC members have always been strong supporters of a market-based measure scheme for
international aviation to incentivise and reward good investment and operational choices, and
so welcomed the agreement on the Carbon Offsetting and Reduction Scheme for International
Aviation (CORSIA). The 31 EEA states in Europe have already implemented the EU
Emissions Trading System (ETS), including the aviation sector with around 500 aircraft
operators participating in the cap and trade approach to limit CO2 emissions. It was the first
and is the biggest international system capping greenhouse gas emissions. In the period 2012
to 2018 EU ETS has saved an estimated 100 million tonnes of intra-European aviation CO2
emissions.
4.1 The EU Emissions Trading System
The EU Emissions Trading System (EU ETS) is the cornerstone of the European Union's
policy to tackle climate change, and a key tool for reducing greenhouse gas emissions cost-
effectively, including from the aviation sector. It operates in 31 countries: the 28 EU Member
States, Iceland, Liechtenstein and Norway. The EU ETS is the first and so far the biggest
international system capping greenhouse gas emissions; it currently covers half of the EU's
CO2 emissions, encompassing those from around 12 000 power stations and industrial plants
in 31 countries, and, under its current scope, around 500 commercial and non-commercial
aircraft operators that fly between airports in the European Economic Area (EEA). The EU
ETS Directive has recently been revised in line with the European Council Conclusions of
October 201417 that confirmed that the EU ETS will be the main European instrument to
17 http://www.consilium.europa.eu/en/meetings/european-council/2014/10/23-24/
4. ECONOMIC/MARKET-BASED MEASURES

ECAC/EU
achieve the EU's binding 2030 target of an at least 40% domestic reduction of greenhouse
gases compared to 199018 .
The EU ETS began operation in 2005; a series of important changes to the way it works took
effect in 2013, strengthening the system. The EU ETS works on the "cap and trade" principle.
This means there is a "cap", or limit, on the total amount of certain greenhouse gases that can
be emitted by the factories, power plants, other installations and aircraft operators in the
system. Within this cap, companies can sell to or buy emission allowances from one another.
The limit on allowances available provides certainty that the environmental objective is
achieved and gives allowances a market value. For aviation, the cap is calculated based on the
average emissions from the years 2004-2006. Aircraft Operators are entitled to free allocation
based on an efficiency benchmark, but this might not cover the totality of emissions. The
remaining allowances need to be purchased from auctions or from the secondary market. The
system allows aircraft operators to use aviation allowances or general (stationary
installations) allowances to cover their emissions.
By 30th April each year, companies, including aircraft operators, have to surrender allowances
to cover their emissions from the previous calendar year. If a company reduces its emissions,
it can keep the spare allowances to cover its future needs or sell them to another company that
is short of allowances. The flexibility that trading brings ensures that emissions are cut where
it costs least to do so. The number of allowances reduces over time so that total emissions
fall.
As regards aviation, legislation to include aviation in the EU ETS was adopted in 2008 by the
European Parliament and the Council19. The 2006 proposal to include aviation in the EU
ETS, in line with the resolution of the 2004 ICAO Assembly deciding not to develop a global
measure but to favour the inclusion of aviation in open regional systems, was accompanied by
a detailed impact assessment20. After careful analysis of the different options, it was
concluded that this was the most cost-efficient and environmentally effective option for
addressing aviation emissions.
In October 2013, the Assembly of the International Civil Aviation Organisation (ICAO)
decided to develop a global market-based mechanism (MBM) for international aviation
emissions. Following this agreement the EU decided to limit the scope of the EU ETS to
flights between airports located in the European Economic Area (EEA) for the period 2013-
2016 (Regulation 421/2014), and to carry out a new revision in the light of the outcome of the
2016 ICAO Assembly. The temporary limitation follows on from the April 2013 'stop the
clock' decision21 adopted to promote progress on global action at the 2013 ICAO Assembly.
18 Directive (EU) 2018/410 of the European Parliament and of the Council of 14 March 2018
amending Directive 2003/87/EC to enhance cost-effective emission reductions and low-carbon investments, and Decision (EU) 2015/1814, https://eur-lex.europa.eu/legal-
content/EN/TXT/?uri=CELEX%3A32018L0410
19 Directive 2008/101/EC of the European Parliament and of the Council of 19 November 2008 amending Directive 2003/87/EC so as to include aviation activities in the scheme for greenhouse gas
emission allowance trading within the Community, http://eur-lex.europa.eu/legal-content/EN/TXT/?uri=CELEX:32008L0101
20 http://ec.europa.eu/clima/policies/transport/aviation/documentation_en.htm
21 Decision No. 377/2013/EU derogating temporarily from Directive 2003/87/EC establishing a scheme for greenhouse gas emission allowance trading within the Community, http://eur-
lex.europa.eu/LexUriServLexUriServ.do?uri=CELEX:32013D0377:EN:NOT
ECAC/EU
The European Commission assessed the outcome of the 39th ICAO Assembly and, in that
light, made a new legislative proposal on the scope of the EU ETS. Following the EU
legislative process, this Regulation was adopted in December 201722.
The legislation maintains the scope of the EU ETS for aviation limited to intra-EEA flights. It
foresees that once there is clarity on the nature and content of the legal instruments adopted
by ICAO for the implementation of CORSIA, as well as about the intentions of other states
regarding its implementation, a further assessment should take place and a report be presented
to the European Parliament and to the Council considering how to implement CORSIA in
Union law through a revision of the EU ETS Directive. This should be accompanied, where
appropriate, by a proposal to the European Parliament and to the Council to revise the EU
ETS Directive that is consistent with the Union economy-wide greenhouse gas emission
reduction commitment for 2030 with the aim of preserving the environmental integrity and
effectiveness of Union climate action.
The Regulation also sets out the basis for the implementation of CORSIA. It provides for
European legislation on the monitoring, reporting and verification rules that avoid any
distortion of competition for the purpose of implementing CORSIA in European Union law.
This will be undertaken through a delegated act under the EU ETS Directive.
The EU ETS has been effectively implemented over recent years on intra-EEA flights, and
has ensured a level playing field with a very high level of compliance23. It will continue to be
a central element of the EU policy to address aviation CO2 emissions in the coming years.
The complete, consistent, transparent and accurate monitoring, reporting and verification of
greenhouse gas emissions remains fundamental for the effective operation of the EU ETS.
Aviation operators, verifiers and competent authorities have already gained wide experience
with monitoring and reporting; detailed rules are prescribed by Regulations (EU)
N°600/201224 and 601/2012.25
The EU legislation establishes exemptions and simplifications to avoid excessive
administrative burden for the smallest operators of aircraft. Since the EU ETS for aviation
took effect in 2012 a de minimis exemption for commercial operators – with either fewer than
243 flights per period for three consecutive four-month periods or flights with total annual
emissions lower than 10 000 tonnes CO2 per year applies. This means that many aircraft
operators from developing countries are exempted from the EU ETS. Indeed, over 90 States
have no commercial aircraft operators included in the scope of the EU ETS. In addition, from
2013 flights by non-commercial aircraft operators with total annual emissions lower than 1
22 Regulation (EU) 2017/2392 of the European Parliament and of the Council of 13 December 2017
amending Directive 2003/87/EC to continue current limitations of scope for aviation activities and to prepare to implement a global market-based measure from 2021, http://eur-lex.europa.eu/legal-
content/EN/TXT/?uri=uriserv:OJ.L_.2017.350.01.0007.01.ENG&toc=OJ:L:2017:350:TOC
23 Report on the functioning of the European carbon market, COM(2017) 693 final, https://ec.europa.eu/commission/sites/beta.../report-functioning-carbon-market_en.pdf
24 Commission Regulation (EU) No 600/2012 of 21 June 2012 on the verification of greenhouse gas emission reports and tonne-kilometre reports and the accreditation of verifiers pursuant to Directive
2003/87/EC of the European Parliament and of the Council, http://eur-lex.europa.eu/legal-content/EN/TXT/PDF/?uri=CELEX:32012R0600&from=EN
25 Regulation (EU) No 601/2012 of the European Parliament and of the Council of 21 June 2012 on the
monitoring and reporting of greenhouse gas emissions pursuant to Directive 2003/87/EC of the European Parliament and of the Council, http://eur-lex.europa.eu/legal-
content/EN/ALL/?uri=CELEX:32012R0601

ECAC/EU
000 tonnes CO2 per year are excluded from the EU ETS. A further administrative
simplification applies to small aircraft operators emitting less than 25 000 tonnes of CO2 per
year, who can choose to use the small emitters' tool rather than independent verification of
their emissions. In addition, small emitter aircraft operators can use the simplified reporting
procedures under the existing legislation. The recent amendment to extend the intra-EEA
scope after 2016 includes a new simplification, allowing aircraft operators emitting less than
3 000 tCO2 per year on intra-EEA flights to use the small emitters' tool.
The EU legislation foresees that, where a third country takes measures to reduce the climate
change impact of flights departing from its airports, the EU will consider options available in
order to provide for optimal interaction between the EU scheme and that country’s measures.
In such a case, flights arriving from the third country could be excluded from the scope of the
EU ETS. This will be the case between the EU and Switzerland following the agreement to
link their respective emissions trading systems, which was signed on 23rd November 2017.
The EU therefore encourages other countries to adopt measures of their own and is ready to
engage in bilateral discussions with any country that has done so. The legislation also makes
it clear that if there is agreement on global measures, the EU shall consider whether
amendments to the EU legislation regarding aviation under the EU ETS are necessary.
Impact on fuel consumption and/or CO2 emissions
The environmental outcome of an emissions trading system is determined by the emissions
cap. Aircraft operators are able to use allowances from outside the aviation sector to cover
their emissions. The absolute level of CO2 emissions from the aviation sector itself can
exceed the number of allowances allocated to it, as the increase is offset by CO2 emissions
reductions in other sectors of the economy covered by the EU ETS.
With the inclusion of intra-European flights in the EU ETS it has delivered around 100 MT of
CO2 reductions/offsets between 2012 and 2018. The total amount of annual allowances to be
issued will be around 38 million, whilst verified CO2 emissions from aviation activities
carried out between aerodromes located in the EEA has fluctuated between 53.5 MT CO2 in
2013 and 61MT in 2016. This means that the EU ETS is now contributing more than 23 MT
CO2 of emission reductions annually26, or around 100 MT CO2 over 2012-2018, partly within
the sector (airlines reduce their emissions to avoid paying for additional units) or in other
sectors (airlines purchase units from other ETS sectors, which would have to reduce their
emissions consistently). While some reductions are likely to be within the aviation sector,
encouraged by the EU ETS's economic incentive for limiting emissions or use of aviation
biofuels, the majority of reductions are expected to occur in other sectors.
Putting a price on greenhouse gas emissions is important to harness market forces and achieve
cost-effective emission reductions. In parallel to providing a carbon price which incentivises
emission reductions, the EU ETS also supports the reduction of greenhouse gas emissions
through €2.1bn fund for the deployment of innovative renewables and carbon capture and
storage. This funding has been raised from the sale of 300 million emission allowances from
the New Entrants' Reserve of the third phase of the EU ETS. This includes over €900m for
supporting bioenergy projects, including advanced biofuels.
26 Report on the functioning of the European carbon market, COM(2017) 693 final,
https://ec.europa.eu/commission/sites/beta.../report-functioning-carbon-market_en.pdf

ECAC/EU
In addition, through Member States' use of EU ETS auction revenue in 2015, over €3.5bn has
been reported by them as being used to address climate change. The purposes for which
revenues from allowances should be used encompass mitigation of greenhouse gas emissions
and adaptation to the inevitable impacts of climate change in the EU and third countries.
These will reduce emissions through: low-emission transport; funding research and
development, including in particular in the field of aeronautics and air transport; providing
contributions to the Global Energy Efficiency and Renewable Energy Fund, and measures to
avoid deforestation.
In terms of its contribution towards the ICAO global goals, the states implementing the EU
ETS have delivered, in “net” terms, a reduction of around 100 MT of aviation CO2 emissions
over 2012-2018 for the scope that is covered, and this reduction will continue to increase in
the future under the new legislation. Other emission reduction measures taken, either
collectively throughout Europe or by any of the 31 individual states implementing the EU
ETS, will also contribute towards the ICAO global goals. Such measures are likely to
moderate the anticipated growth in aviation emissions.
Table 11: Summary of estimated EU-ETS emission reductions
Estimated emissions reductions resulting from the EU-ETS
Year Reduction in CO2 emissions
2012-2018 100 MT
The table presents projected benefits of the EU-ETS based on the current scope (intra-
European flights).
4.2 The Carbon Offsetting and Reduction Scheme for International Aviation
In October 2016, the Assembly of ICAO confirmed the objective of targeting CO2-neutral
growth as of 2020, and for this purpose to introduce a global market-based measure for
compensating CO2 emissions above that level, namely Carbon Offsetting and Reduction
Scheme for International Aviation (CORSIA). The corresponding resolution is A39-3:
Consolidated statement of continuing ICAO policies and practices related to environmental
protection – Global Market‐based Measure (MBM) scheme.
According to the Assembly Resolution, the average level of CO2 emissions from international
aviation covered by the scheme between 2019 and 2020 represents the basis for carbon
neutral growth from 2020, against which emissions in future years are compared. In any year
from 2021 when international aviation CO2 emissions covered by the scheme exceed the
average baseline emissions of 2019 and 2020, this difference represents the sector's offsetting
requirements for that year.

ECAC/EU
CORSIA is divided into 3 phases27: There is a pilot phase (2021-2023), a first phase (2024-
2026) and a second phase (2027-2035). During CORSIA’s pilot phase and the first phase,
participation from states is voluntary. The second phase applies to all ICAO Member States.
CORSIA Implementation Plan Brochure (© ICAO)
Exempted are States with individual share of international aviation activities in RTKs, in year
2018 below 0.5 per cent of total RTKs and States that are not part of the list of States that
account for 90 per cent of total RTKs when sorted from the highest to the lowest amount of
individual RTKs. Additionally Least Developed Countries (LDCs), Small Island Developing
States (SIDS) and Landlocked Developing Countries are exempted as well.
CORSIA operates on a route-based approach. The offsetting obligations of CORSIA shall
apply to all aircraft operators on the same route between States, both of which are included in
the CORSA. Exempted are a) emissions form aircraft operators emitting less than 10 000
tCO2 emissions from international aviation per year, b) emissions from aircraft whose
Maximum Take Off Mass (MTOM) is less than 5 700 kg, and c) emissions from
humanitarian, medical and firefighting operations.
According to the “Bratislava Declaration” from September 3rd 2016 the Directors General of
Civil Aviation Authorities of the 44 ECAC Member States declared their intention to
implement CORSIA from the start of the pilot phase, provided certain conditions were met.
This shows the full commitment of the EU, its Member States and the other Member States of
ECAC to counter the expected in-sector growth of total CO2 emissions from air transport and
to achieving overall carbon neutral growth.
27 Further information on https://www.icao.int/environmental-protection/Pages/market-based-
measures.aspx

ECAC/EU
5. EU INITIATIVES IN THIRD COUNTRIES
5.1 Multilateral projects
At the end of 2013 the European Commission launched a project with a total budget of €6.5
million under the name "Capacity building for CO2 mitigation from international aviation".
The 42-month project, implemented by the ICAO, boosts less developed countries’ ability to
track, manage and reduce their aviation emissions. In line with the call from the 2013 ICAO
Assembly, beneficiary countries will submit meaningful State action plans for reducing
aviation emissions. They then and received assistance to establish emissions inventories and
pilot new ways of reducing fuel consumption. Through the wide range of activities in these
countries, the project contributes to international, regional and national efforts to address
growing emissions from international aviation. The beneficiary countries are the following:
Africa: Burkina Faso, Kenya and Economic Community of Central African States (ECCAS)
Member States: Angola, Burundi, Cameroon, Central African Republic, Chad, Republic of
Congo, Democratic Republic of Congo, Equatorial Guinea, Gabon, Sao Tome and Principe.
Caribbean: Dominican Republic and Trinidad and Tobago.
Preceding the ICAO Assembly of October 2016 sealing the decision to create a global MBM
scheme, a declaration of intent was signed between Transport Commissioner Violeta Bulc
and ICAO Secretary General Dr Fang Liu, announcing their common intention to continue
cooperation to address climate change towards the implementation of the ICAO Global
Market Based Measures. On adoption of a decision by the ICAO Assembly on a GMBM, the
parties intended to jointly examine the most effective mechanisms to upgrade the existing
support mechanism and also to continue similar assistance, including cooperation and
knowledge sharing with other international organisations, with the aim of starting in 2019.
The "Capacity building for CO2 mitigation from international aviation" has been of enormous
value to the beneficiary countries. A second project has been initiated by the European
Commission aimed at assisting a new set of countries on their way to implementing the

ECAC/EU
CORSIA. Further details will be published upon signature of the contract with the different
parties.
Additionally, initiatives providing ASEAN Member States with technical assistance on
implementing CORSIA have been initiated in 2018 and will possibly be extended further in
2019. The ARISE plus project dedicates an activity under result 3 - ‘strengthened national
capabilities of individual ASEAN Members States and aligned measures with ICAO SARPs’.
To achieve this, the project will support workshops in 2018 on capacity building and
technical assistance, especially for the development or enhancement of actions plans. This
will provide a genuine opportunity to pave the way for the effective implementation of further
potential assistance and foster States readiness for their first national aviation emission report
at the end of 2019.
EASA is also implementing Aviation Partnership Projects (APPs) in China, South Asia and
Latin America (including the Caribbean) as well as projects funded by DG NEAR and DG
DEVCO in other regions. This can enable the EU to form a holistic view of progress on
CORSIA implementation worldwide.
In terms of synergies, the South Asia and South East Asia environmental workshops could
engage with key regional stakeholders (ICAO Asia Pacific office, regulatory authorities,
airline operators, verification bodies), and thereby assess the level of readiness for CORSIA
on wider scale in the Asia Pacific region. This preparatory work would help focus the
subsequent FPI CORSIA project and create economies of scale in order to maximise the
benefits of the project, which needs to be implemented within an ambitious timescale.

61
6. SUPPORT TO VOLUNTARY ACTIONS
6.1 ACI Airport Carbon Accreditation
This is a certification programme for carbon management at airports, based on carbon mapping and
management standards specifically designed for the airport industry. It was launched in 2009 by ACI
EUROPE, the trade association for European airports.
The underlying aim of the programme is to encourage and enable airports to implement best practice carbon
and energy management processes and to gain public recognition of their achievements. It requires airports
to measure their CO2 emissions in accordance with the World Resources Institute and World Business Council for Sustainable Development GHG Protocol and to get their emissions inventory assured by an
independent third party.
This industry-driven initiative was officially endorsed by EUROCONTROL and the European Civil Aviation
Conference (ECAC). It is also officially supported by the United Nations Environmental Programme (UNEP). The programme is overseen by an independent Advisory Board.
At the beginning of this reporting year (May 2016) there were 156 airports in the programme. Since then, a
further 36 airports have joined and 3 have withdrawn, bringing the total number of airports at the end of this reporting year (May 2017) to 189 covering 38.1 % of global air passenger traffic.
In 2017, for the first time, airports outside Europe achieved the highest accreditation status: 1 airport in
North America, 5 in Asia-Pacific and 1 in Africa have been recognised as carbon neutral. European airports doubled their pledge and set the bar at 100 European airports becoming carbon neutral by 2030 from the 34
currently assessed to be carbon neutral.
Airport Carbon Accreditation is a four-step programme, from carbon mapping to carbon neutrality. The four steps of certification are: Level 1 “Mapping”, Level 2 “Reduction”, Level 3 “Optimisation”, and Level 3+
“Carbon Neutrality”.

Figure 7: Four steps of Airport Carbon Accreditation
Levels of certification (ACA Annual Report 2016-2017)
One of its essential requirements is the verification by external and independent auditors of the data provided
by airports. Aggregated data are included in the Airport Carbon Accreditation Annual Report thus ensuring transparent and accurate carbon reporting. At level 2 of the programme and above (Reduction, Optimisation
and Carbon Neutrality), airport operators are required to demonstrate CO2 reductions associated with the
activities they control.
For historical reasons European airports remain at the forefront of airport actions to voluntarily mitigate and
reduce their impact on climate change. The strong growth momentum was maintained for the reporting year which ended with 116 airports in the programme. These airports account for 64.8% of European passenger
traffic and 61% of all accredited airports in the programme this year.
Anticipated benefits:
The Administrator of the programme has been collecting CO2 data from participating airports over the past
five years. This has allowed the absolute CO2 reduction from the participation in the programme to be
quantified.
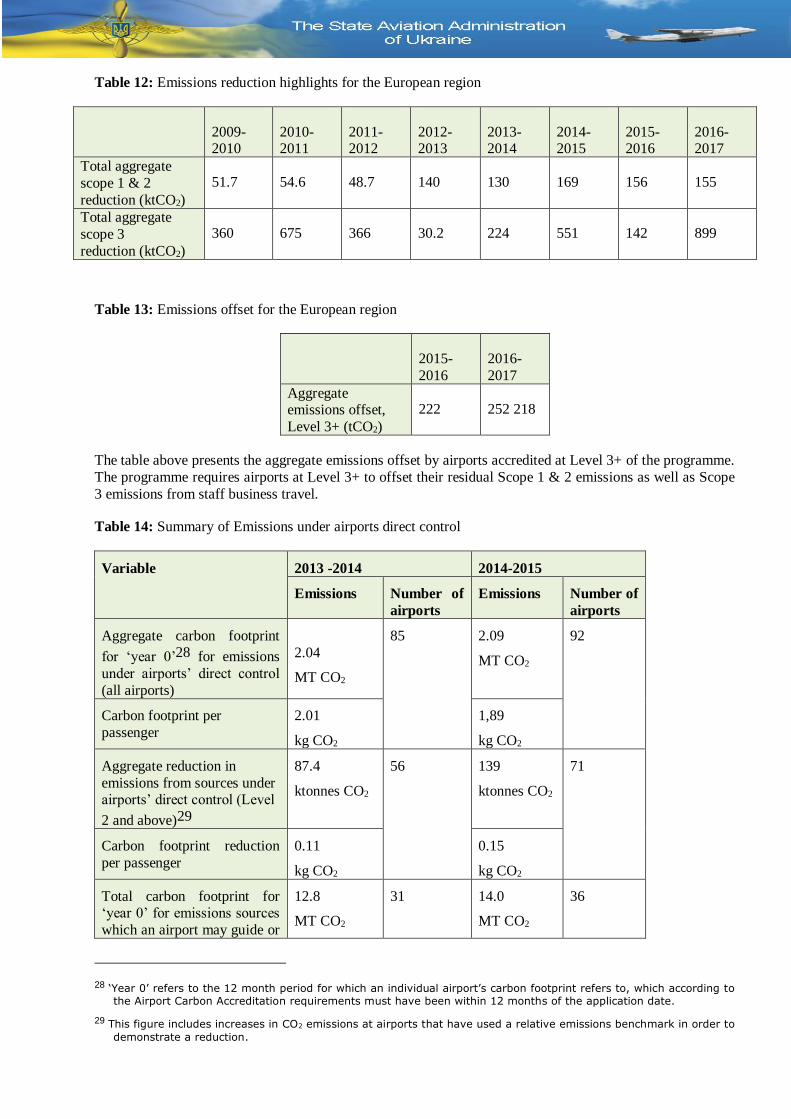
Table 12: Emissions reduction highlights for the European region
2009-2010
2010-2011
2011-2012
2012-2013
2013-2014
2014-2015
2015-2016
2016-2017
Total aggregate
scope 1 & 2
reduction (ktCO2)
51.7 54.6 48.7 140 130 169 156 155
Total aggregate
scope 3
reduction (ktCO2)
360 675 366 30.2 224 551 142 899
Table 13: Emissions offset for the European region
2015-
2016
2016-
2017
Aggregate emissions offset,
Level 3+ (tCO2)
222 252 218
The table above presents the aggregate emissions offset by airports accredited at Level 3+ of the programme.
The programme requires airports at Level 3+ to offset their residual Scope 1 & 2 emissions as well as Scope
3 emissions from staff business travel.
Table 14: Summary of Emissions under airports direct control
Variable 2013 -2014 2014-2015
Emissions Number of
airports
Emissions Number of
airports
Aggregate carbon footprint
for ‘year 0’28 for emissions
under airports’ direct control
(all airports)
2
2.04
MT CO2
85
2.09
MT CO2
92
Carbon footprint per
passenger
2.01
kg CO2
1,89
kg CO2
Aggregate reduction in
emissions from sources under airports’ direct control (Level
2 and above)29
87.4
ktonnes CO2
56 139
ktonnes CO2
71
Carbon footprint reduction
per passenger
0.11
kg CO2
0.15
kg CO2
Total carbon footprint for ‘year 0’ for emissions sources
which an airport may guide or
12.8
MT CO2
31 14.0
MT CO2
36
28 ‘Year 0’ refers to the 12 month period for which an individual airport’s carbon footprint refers to, which according to the Airport Carbon Accreditation requirements must have been within 12 months of the application date.
29 This figure includes increases in CO2 emissions at airports that have used a relative emissions benchmark in order to
demonstrate a reduction.

influence (level 3 and
above)30
Aggregate reductions from
emissions sources which an
airport may guide or influence
224
ktonnes CO2
551
ktonnes CO2
Total emissions offset (Level
3+)
181
ktonnes CO2
16 294
ktonnes CO2
20
Its main immediate environmental co-benefit is the improvement of local air quality.
Costs for the design, development and implementation of Airport Carbon Accreditation have been borne by
ACI EUROPE. Airport Carbon Accreditation is a non-for-profit initiative, with participation fees set at a
level aimed at allowing for the recovery of the aforementioned costs.
The scope of Airport Carbon Accreditation, i.e. emissions that an airport operator can control, guide and
influence, implies that aircraft emissions in the LTO cycle are also covered. Thus, airlines can benefit from
the gains made by more efficient airport operations to see a decrease in their emissions during the LTO cycle. This is consistent with the objective of including aviation in the EU ETS as of 1 January 2012
(Directive 2008/101/EC) and can support the efforts of airlines to reduce these emissions.
30 These emissions sources are those detailed in the guidance document, plus any other sources that an
airport may wish to include.

APPENDIX A –
DETAILED RESULTS FOR ECAC SCENARIOS FROM SECTION A
1. BASELINE SCENARIO (technology freeze in 2010)
a) International passenger and cargo traffic departing from ECAC airports
Year
Passenger
Traffic
(IFR
movements)
(million)
Revenue
Passenger
Kilometres31
RPK
(billion)
All-Cargo
Traffic (IFR
movements)
(million)
Freight Tonne
Kilometres
transported32
FTKT
(billion)
Total Revenue
Tonne
Kilometres42,
33 RTK
(billion)
2010 4.6 1,218 0.20 45.4 167.2
2016 5.2 1,601 0.21 45.3 205.4
2020 5.6 1,825 0.25 49.4 231.9
2030 7.0 2,406 0.35 63.8 304.4
2040 8.4 2,919 0.45 79.4 371.2
Note that the traffic scenario shown in the table is assumed for both the baseline and implemented measures
scenarios.
b) Fuel consumption and CO2 emissions of international passenger traffic departing from ECAC airports
Year
Fuel
Consumption
(109 kg)
CO2
emissions
(109 kg)
Well-to-wake
CO2e
emissions (109
kg)
Fuel efficiency
(kg/RPK)
Fuel efficiency
(kg/RTK)
2010 37.98 120.00 147.3 0.0310 0.310
2016 46.28 146.26 179.6 0.0287 0.287
2020 49.95 157.85 193.8 0.0274 0.274
2030 61.75 195.13 239.6 0.0256 0.256
2040 75.44 238.38 292.7 0.0259 0.259
For reasons of data availability, results shown in this table do not include cargo/freight traffic.
31 Calculated based on 98% of the passenger traffic for which sufficient data is available. 32 Includes passenger and freight transport (on all-cargo and passenger flights). 33 A value of 100 kg has been used as the average mass of a passenger incl. baggage (ref: ICAO).

2. IMPLEMENTED MEASURES SCENARIO
2A) EFFECTS OF AIRCRAFT TECHNOLOGY IMPROVEMENT AFTER 2010
Fuel consumption and CO2 emissions of international passenger traffic departing from ECAC airports, with
aircraft technology improvements after 2010 included:
Year
Fuel
Consumption
(109 kg)
CO2
emissions
(109 kg)
Well-to-wake
CO2e
emissions (109
kg)
Fuel efficiency
(kg/RPK)
Fuel efficiency
(kg/RTK)
2010 37.98 120.00 147.3 0.0310 0.310
2016 46.28 146.26 179.6 0.0286 0.286
2020 49.08 155.08 190.4 0.0270 0.245
2030 58.65 185.34 227.6 0.0247 0.247
2040 68.99 218.01 267.7 0.0242 0.242
For reasons of data availability, results shown in this table do not include cargo/freight traffic.
2B) EFFECTS OF AIRCRAFT TECHNOLOGY AND ATM IMPROVEMENTS AFTER 2010
Fuel consumption and CO2 emissions of international passenger traffic departing from ECAC airports, with
aircraft technology and ATM improvements after 2010:
Year
Fuel
Consumption
(109 kg)
CO2
emissions
(109 kg)
Well-to-wake
CO2e
emissions (109
kg)
Fuel efficiency
(kg/RPK)
Fuel efficiency
(kg/RTK)
2010 37.98 120.00 147.3 0.0310 0.310
2016 46.24 146.11 179.4 0.0286 0.286
2020 49.03 154.93 190.2 0.0245 0.245
2030 57.38 181.33 222.6 0.0242 0.242
2040 67.50 213.30 261.9 0.0237 0.237
For reasons of data availability, results shown in this table do not include cargo/freight traffic.

2C) EFFECTS OF AIRCRAFT TECHNOLOGY AND ATM IMPROVEMENTS
AND ALTERNATIVE FUELS
Fuel consumption and CO2 emissions of international passenger traffic departing from ECAC airports, with
aircraft technology and ATM improvements as well as alternative fuel effects included:
Year
Fuel
Consumption
(109 kg)
CO2
emissions
(109 kg)
Well-to-wake
CO2e
emissions (109
kg)
Fuel efficiency
(kg/RPK)
Fuel efficiency
(kg/RTK)
2010 37.98 120.00 147.3 0.0310 0.310
2016 46.24 146.11 179.4 0.0286 0.286
2020 49.03 154.93 187.9 0.0245 0.245
2030 57.38 181.33 199.5 0.0242 0.242
2040 67.50 213.30 214.8 0.0237 0.237
For reasons of data availability, results shown in this table do not include cargo/freight
traffic. Note that fuel consumption is assumed to be unaffected by the use of alternative fuels.

LIST OF ABBREVIATIONS
ACARE – Advisory Council for Research and Innovation in Europe
ACARS – Aircraft Communications Addressing and Reporting System
ACA – Airport Carbon Accreditation
ACC – Area Control Centres
ACCAPEG – Aviation and Climate Change Action Plan Expert Group
ACI – Airports Council International
APER TG - Action Plans for Emissions Reduction Task Group of the ECAC/EU Aviation and Environment
Working Group (EAEG)
EAER – European Aviation Environmental Report
AEM – Advanced Emission Model
AFTF – Alternative Fuels Task Force (of ICAO CAEP)
AIRE – The Atlantic Interoperability Initiative to Reduce Emissions
ANS – Air Navigation Service
ATC – Air Traffic Control
ATM – Air Traffic Management
BAU – Business as Usual
CAEP – Committee on Aviation Environmental Protection
CCD – Continuous Climb Departures
CDA – Continuous Descent Approach
CDM - Collaborative Decision Making
CDA – Continuous Descent Approach
CDO - Continuous Descent Operations
CNG – Carbon neutral growth
CORSIA - Carbon Offsetting and Reduction Scheme for International Aviation
CPDLC – Controller-Pilot Data Link Communications
EASA – European Aviation Safety Agency
EC – European Commission
ECAC – European Civil Aviation Conference
EEA – European Economic Area
EFTA – European Free Trade Association
EU – European Union
EU ETS – the EU Emissions Trading System
FAB – Functional Airspace Block
FANS – Future Air Navigation System
FP7 - 7th Framework Programme

GHG – Greenhouse Gas
GMBM – Global Market-based Measure
Green STAR – Standard Arrival
Green IA – Initial Approach
HVO – Hydro-treated Vegetable Oil
ICAO – International Civil Aviation Organisation
IFR – Instrumental Flight Rules
IPCC – Intergovernmental Panel on Climate Change
IPR – Intellectual Property Right
JTI – Joint Technology Initiative
LTO cycle – Landing/Take-off Cycle
MBM – Market-based Measure
MT – Million tonnes
OFA - Operational Focus Area
RED – Renewable Energy Directive
RNAV – Area Navigation
RNP AR – Required Navigation Performance Authorization Required
RNP STAR – Required Navigation Performance Standard Arrival
RPAS – Remotely Piloted Aircraft
RPK – Revenue Passenger Kilometre
RTK – Revenue Tonne Kilometre
RTD – Research and Innovation
SES – Single European Sky
SESAR – Single European Sky ATM Research
SESAR JU – Single European Sky ATM Research Joint Undertaking
SESAR R&D – SESAR Research and Development
SWAFEA – Sustainable Ways for Alternative Fuels and Energy for Aviation
SWIM – System Wide Information Management
TMA - Terminal Manoeuvring Area
ToD – Top of Descent
UNEP – United Nations Environmental Programme

SECTION 2- NATIONAL ACTIONS IN UKRAINE
1. IMPROVED AIR TRAFFIC MANAGEMENT AND INFRASTRUCTURE USE
The main National Stakeholders involved in ATM in Ukraine are the following:
- The Regulator, the State Aviation Administration (SAA);
- Air Navigation Service Provider, UkSATSE;
Their activities are detailed in the following subchapters and their relationships are shown in the diagramme
below.
The Ukrainian State Air Traffic Services Enterprise (UkSATSE) is undertaken a set of measures for the
optimization of the national Air Navigation System and the Integrated Civil-Military Air Traffic Management
System of Ukraine (ICMS).
One of main activities is the implementation of Performance-Based Navigation (PBN).
a) Introduction of Performance-Based Navigation (PBN)
PBN is one of the main initiatives of the ICAO Global Air Navigation Plan and is one of the activities in modernization of Ukrainian airspace. Implementation of PBN will contribute to the optimization of the Ukrainian
airspace, with a positive effect on fuel efficiency and related CO2 emissions both in the Terminal areas and en-
route airspace.
In order to implement PBN in a harmonized way, Ukraine developed the document named ‘Implementation of PBN: Strategy and Roadmap 2013-2025’. This document was approved at the SAA level in 2013 and presented to
the community at one of EUR PBN TF regular meetings.
This document distinguishes the following timeline:
short term: now – end of 2015;
medium term: 2016 – end of 2019;

long term: 2020+.
At the 36th Session of the ICAO Assembly, it has been agreed by Resolution A36/23: ―All the contracting States
should have a PBN implementation plan in place by 2009 to ensure a globally harmonized and coordinated
transition to PBN by 2016.‖
This resolution was superseded in 2010 by the 37th ICAO Assembly Resolution A37/11 with the following specific
requirements:
-Implementation of RNAV and RNP operations (where required) for en route and terminal areas according to established timelines and intermediate milestones;
- Implementation of approach procedures with vertical guidance (APV) (Baro- VNAV and/or augmented
GNSS), including LNAV only minima for all instrument runway ends, either as the primary approach or as a back-up for precision approaches by 2016 with intermediate milestones as follows: 30 per cent by 2010, 70 per cent by
2014; and
- Implementation of straight-in LNAV only procedures, as an exception to 2) above, for instrument runways at
aerodromes where there is no local altimeter setting available and where there are no aircraft suitably equipped for APV operations with a maximum certificated take-off mass of 5 700 kg or more.
In complement to the global ICAO intention the following pan-European tasks were assessed and legally approved
in Local Single Sky Implementation (LSSIP) Ukraine (formally known as LCIP) document:
- NAV03: Implementation of Precision Area Navigation RNAV (P-RNAV);
- NAV10: Implement Approach Procedures with Vertical Guidance (APV).
By introducing the PBN environment supported by GNSS technology, SAA wants to facilitate more efficient use of airspace and more flexibility for procedure design, which cooperatively result in improved safety, capacity,
predictability, operational efficiency, fuel economy, and environmental effects.
Objectives
The strategic objectives established by SAAU in accordance with ICAO framework for Ukrainian air navigation system up to 2025 are:
- to improve flight safety by recognition of multi-constellation GNSS navigation with a backup ground-based
infrastructure; - to develop a interoperable harmonised CNS/ATM system supported by modern ATM techniques, flow
performance metrics and perspective CNS capabilities;
- to improve airports accessibility with GNSS/APV approaches;
- to improve operational efficiency by implementation of CDO, Free Routes and ETA concepts; - to protect environment by reducing fuel emission, noise pollution over sensitive areas.
More efficient air traffic management on terminal control area (tma):
b) TMA implementation of PBN
Based on the global planning by the ICAO Assembly Resolution A37/11 and the regional planning by
EUROCONTROL, legally approved in Local Single Sky Implementation (LSSIP) Ukraine (formally known as
LCIP), taking into account the high level of PBN equipage of international traffic to/from Ukraine and the relative low PBN equipage of domestic traffic, the following principles were applied for the implementation roadmap for
TMA’s in Ukraine:
- At short term perspective RNAV 1 is introduced to facilitate IFR traffic in all TMA’s with considerable international traffic with a temporary exemption for GA and domestic air traffic to follow
conventional routes.
- At medium term perspective RNAV 1 will become mandatory for all IFR traffic in all TMA’s serving international flights. Timing will be dependent on operational need and aircraft equipage. Consideration
be given to A-RNP introduction in Kyiv TMA. At domestic aerodromes RNAV 1 will be introduced only if there is
an operational need.
- At long term perspective A-RNP is introduced for all IFR traffic in all TMA’s serving international
flights. Consideration will be given to A-RNP mandatory in Kyiv TMA. This also implies that mandatory carriage

of GNSS is needed. A-RNP mandatory in other TMA’s only if there has been shown an operational need and
adequate aircraft PBN equipage for minimum 90 % of all traffic.
Currently RNAV 1 ICAO PBN specification is implemented in following TMAs:
Kyiv TMA AIRAC AMDT 04/12 EFF 31 MAY 2012
Kharkiv TMA AIRAC AMDT 03/12 EFF 03 MAY 2012
Dnipropetrovs’k TMA AIRAC AMDT 05/12 EFF 23 AUG 2012
L’viv TMA AIRAC AMDT 07/12 EFF 13 DEC 2012
Odesa TMA AIRAC AMDT 01/14 EFF 06 FEB 2014
Detailed planning information is contained in ‘Implementation of PBN: Strategy and Roadmap 2013-2025’, which
is publicly available at the SAA’ official web site
c) Continuous Descent Operations
Implementation of Area Navigation, is expected to facilitate the development of Continuous Descent Operations
(CDO) procedures in a second phase.
CDO in Kyiv (Boryspil’) Airport was implemented in the end of 2013.
Implementation of CDO in Kyiv (Zhuliany), Odesa, Dnipropetrovs’k, L’viv and
Kharkiv (Osnova) Airports is expected to be done around 2015 – 2016.
Continuous Descent Operations (CDO) describes the optimum way to reduce noise and emissions produced during
the approach. The procedure makes full advantage of the onboard Flight Management System by planning an uninterrupted idle decelerating descent to intercept final approach landing. This not only minimizes noise
disturbance, it also reduces fuel consumption and emissions during the approach phase.
The procedure requires air traffic control to apply specific, or minimum, speeds to inbound aircraft and to pass adequate ―range from touchdown‖ information to a pilot to ensure he can manage his aircraft‘s vertical profile. Such
speed control maximizes runway capacity.
The nature and extent of the benefit from CDO will vary depending on the local situation but would typically include significant reductions in noise, fuel and emissions in the areas prior to the point at which the Instrument
Landing System (ILS) is acquired for the approach. This is usually between 10 and 25 nautical miles (18-37
kilometers) from the airport.
Taking into account the facts that the aircraft guidance system needs some time to capture the ILS localizer and glide slope and the aircraft has to be stabilized for landing in a timely manner, it is preferable to intercept the final
straight in segment not later than at a height of approximately 2000 ft AAL. The final straight in segment of the
CDO includes the avoidance of the application of noise and drag produced by flaps and undercarriage until the latest possible moment.
All of these improvements depend on the provision of accurate real-time data on aircraft position and intent, and
improvements in flight data processing systems and CNS systems, particularly data communications. They also depend on new technology in navigation systems performance.
d) Collaborative Environmental Management
Ukraine is studying the implementation of Collaborative Environmental Management (CEM) on Kyev Boryspil airport by dec 2013.
CEM is a commonly agreed strategic management process for establishing an airport environmental partnership,
between the key operational stakeholders at an airport. This partnership will prioritise and meet environmental challenges caused by the direct environmental impacts of aircraft operations.
In more mature CEM levels, the stakeholders at an airport will work collaboratively to enhance an airport‘s
environmental performance, by introducing a range of practical improvements. Key CEM aims include:
■ a more unified and coordinated interface between airport operational stakeholders;

■ reduction of the risk of environmentally related conflict between the stakeholders;
■ to facilitate links between CEM airports to foster sharing of good practice
More efficient air traffic management on en-route operations:
e) RVSM airspace
Reduced Vertical Separation Minimum (RVSM) is applicable in volume of Ukraine airspace between FL 290 and FL 410 inclusive, except for State aircraft.
f) Flexible Use of Airspace (civil/military)
Ukrainian authorities through enhanced civil/military coordination, established a national framework for the
flexible use of Airspace (civil/military), ensuring that any airspace segregation is temporary and based on real use for a specified time period according to user requirements.
According to ICAO and EUROCONTROL recommendations, the implementation of the FUA concept has benefits
in both civil and military aviation with:
Increased flight economy offered through a reduction in distance, time and fuel;
The establishment of an enhanced Air Traffic Services (ATS) route network and associated sectorisation
providing:
- An increase in Air Traffic Control (ATC) capacity;
- A reduction in delays to General Air Traffic;
- More efficient ways to separate Operational and General Air Traffic;
- Enhanced real-time civil/military co-ordination;
- A reduction in airspace segregation needs;
The definition and use of temporary airspace reservation that are more closely in line with military operational
requirements and that better respond to specific military requirements.
The implementation of Advanced Airspace Management (LSSIP AOM19) is planned by the end of 2016.
The improved planning process refers to the use of specific procedures allowing Aircraft Operators (AOs) to optimise their flight
planning in order to achieve a more efficient utilization of available airspace through more dynamic responses to specific short
notice or real-time airspace status changes, requirements and route optimisation at the pre-tactical and/or tactical levels.
Consequently, the implementation of Advanced Airspace Management (LSSIP AOM19) will lead to the next expected environment benefits: aircraft emissions will be reduced through the use of more optimum routes/trajectories.
g) En-route Area Navigation (RNAV)
In 1998, B-RNAV became mandatory as the primary means of navigation in all ECAC en-route airspace from FL95 and above while VOR/DME should remain available for reversionary navigation and for use on domestic
ATS routes in the lower airspace, as appropriate.
The development of PBN for en-route operations in Ukraine airspace should be in line with European planning as developed by the ICAO European Program coordinating Group.
In accordance with ‘Implementation of PBN: Strategy and Roadmap 2013-2025’ approved by SAA in
2013,Ukraine plans to implement (B) RNAV -5 and (P) RNAV 1 in the following steps:
• Presently RNAV- 5 above FL 275;
• 2013 - 2016 RNAV- 5 ( upper and lower airspace);
2016+ RNAV 1.
h) Free Route Airspace Concept
Since 05 March 2015 Ukraine has implemented Free Route Airspace (FRAU) Step 1 during the Night Time within
4 current UTAs: (UTA L'viv, UTA Kyiv, UTA Dnipropetrovs'k-North, UTA Odesa-North) from FL275 to FL660.
The implementation of FRAU allows airspace users to reduce flight distances and flight time due
to more available direct flights within FRAU, and as a result to reduce fuel burn and CO2 emission.
The development of FRAU Step 2 is discussed, that will include flight operations within defined airspace during
H24. That will result in an improved capacity, flexibility and flight efficiency which will generate cost savings for
aircraft operators while maintaining safety standards. This Step is quite actual for Ukraine because mainly flight operations are during Day Time.
Calculations in other European Airspaces show that the concept can drive to an average saving of between 1-1,5 %
(fuel and flying time).
This section includes information on the basket of possible measures to be taken in Ukraine, according to the capacity of national key agents to implement then.
2. AIRCRAFT RELATED TECHNOLOGY DEVELOPMENT
Research & Development
Ukraine-based Antonov Design Bureau, a scientific and technical complex named after Oleg Konstantinovich
(O.K.) Antonov, designs transport, regional, and special purpose aircraft. The bureau is engaged in designing and
building new prototype aircraft and modifications of earlier designs, providing their operational support and
follow-up engineering work on the aircraft service life extension. Specifically, Antonov offers basic and conversion training of flight and maintenance crews, sends high-skilled specialists to render assistance in mastering the aircraft
and training local personnel, provides international air transportation of cargoes including oversized ones on a
charter basis, participates in the international co-operation in the field of aircraft and equipment design and manufacture, and develops land transit vehicles. Among its designs are the An-124 and the An-225, the world's
largest plane, which can carry things no other aircraft can. The An-124 was originally designed for military use,
while the An-225 was designed to carry the Soviet space shuttle. These giants have been marketed in the West since the late 1980s. Besides enjoying a corner on the outsized air freight market, Antonov aircraft have made
possible previously inconceivable logistical undertakings, and their ability to quickly transport huge pieces of
equipment across the world has saved mining, construction, and manufacturing industries from costly downtime.
Fields of commercial activity of Antonov include:
Aircraft construction and manufacture
Airfreight services (Antonov Airlines)
Aircraft maintenance and upgrading Aerospace related engineering support
Operation of the Gostomel airport (Antonov Airport)
Trolley bus construction and manufacture (a spin-off, using existing technical expertise).
Air Start project. Satellite launch from the modified version of Ruslan.
The State Aviation Administration of Ukraine has undertaken a consultation process with national stakeholders, to identify the potential basket of measures currently ongoing or planned to be implemented, that could have potential
CO2 emissions reductions in international flights.

75
ESTIMATED BENEFITS AND CONCLUSION
The State Aviation Administration of Ukraine through the measures included in this Action Plan is willing to
contribute achieving ICAO’s climate change goals for international aviation, as stated in Assembly Resolution A37-19: A global annual average fuel efficiency improvement of 2 per cent until 2020 and an aspirational
global fuel efficiency improvement rate of 2 per cent per annum from 2021 to 2050, calculated on the basis
of volume of fuel used per revenue tonne kilometre performed;
The estimated expected benefits in terms of fuel savings and emissions reductions of the basket of measures
included in this plan are the following:
AIRCRAFT RELATED TECHNOLOGY DEVELOPMENT:
2 % annual efficiency improvement (accumulated 16%) till 2020 (including RTK efficiency optimization, through adaptation of aircraft fleets to specific airlines needs)
IMPROVED AIR TRAFFIC MANAGEMENT AND INFRASTRUCTURE USE
5 % accumulated efficiency improvement in 2020
BASKET OF POSSIBLE OPERATIONAL OR ADDITIONAL MEASURES TO BE TAKEN IN UKRAINE,
ACCORDING TO THE CAPACITY OF NATIONAL KEY AGENTS
6 % accumulated efficiency improvement in 2020
EXPECTED RESULTS:
The estimated results in terms of fuel and CO2 emissions savings are summarized in the following table:
CONCLUSION:
Year Tot RTK Int RTK
Tot Fuel (L)
after measures
Int Fuel (L)
after measures
Tot CO2 (Kg)
after measures
Int CO2 (Kg)
after measures
2012 1062000000,00 1002460838,00 376636412,20 289971227,70 951232922,66 732351332,68
2013 767000000,00 705402743,00 266574882,86 203279212,83 673261524,15 505027794,55
2014 718000000,00 692000000,00 244451926,75 198666253,43 617387786,19 485321340,13
2015 301560000,00 290640000,00 100530854,87 83124562,61 253900727,07 199588401,13
2016 291005400,00 280467600,00 94948184,00 79910973,33 239801133,50 188504875,02
2017 314285832,00 302905008,00 100314820,48 85975283,23 253355110,61 199159498,39
2018 340057270,22 327743218,66 106128621,63 92669745,92 268038446,80 210701897,77
2019 364881450,95 351668473,62 111287919,86 99053174,57 281068770,39 220944883,21
2020 391152915,42 376988603,72 116526216,36 105776075,02 294298612,05 231344707,48
2021 416577854,92 401492862,96 121145648,51 112216011,44 305965449,88 240515872,67
2022 437823325,52 421968998,97 124218611,30 117481308,64 313726524,70 246616763,10
2023 460152315,12 443489417,92 127289916,47 122991792,31 321483413,03 252714362,56
2024 483620083,19 466107378,23 130351402,15 128758776,43 329215501,27 258792466,98
2025 508284707,44 489878854,52 133394078,30 134794091,27 336900084,16 264833227,98

It is estimated that through the combination of measures included in this Action Plan, the accumulated emissions savings in 2020 could be around 231344.707 tons CO2.
0,00
100 000,00
200 000,00
300 000,00
400 000,00
500 000,00
600 000,00
700 000,00
800 000,00
900 000,00
1 000 000,0020
08
2009
2010
2011
2012
2013
2014
2015
2016
2017
2018
2019
2020
2021
2022
2023
2024
2025
Наз
ван
ие
оси
International emissions baseline & emissions after the improvements
Emissions with technologyimprovementsEmissions with techno & ATMimprovementsEmissions with techno & ATM& Basket improvementsBaseline Emissions