![KMBT C454-20160106100325admin.wyk.edu.hk/documents/A02 Fr. Kelly Educational Fund Ltd... · OHK$300 OHK$500 C]HK$1000 DOthers HK$ (Please fill in and return the direct debit authorization](https://static.fdocuments.us/doc/165x107/5afdd54e7f8b9a994d8e185d/kmbt-c454-fr-kelly-educational-fund-ltdohk300-ohk500-chk1000-dothers-hk.jpg)
ACTER Poster 2011 edited V2 - International Islamic...
10
ACTER 2011: Call for Posters Curriculum Track and Its Influences on High School Dropout Likelihood Rosemaliza Mohd Kamalludeen PhD Candidate Career and Technical Education Virginia Polytechnic Institute and State University Introduction/Need for Research Among numerous studies conducted on the causes and remedies of high school dropouts, but very few relate to the curriculum. Plank, DeLuca, and Estacion (2008) reported the curriculum being a vital part of the school environment as “the combination of all courses taken throughout a high school career” (p. 346) significantly determines a student’s path after high school. Among factors constantly reported to predict high school dropout rates were race (Griffin, 2002; Silver, Sanders & Zarate, 2008), socioeconomic status (Christle, Jolivette & Nelson, 2007), poor academic achievement (Plank, 2001; Silver et al 2008), and institutional environment (Christle et al, 2007; Knesting, 2008; Silver et al, 2008). Since curriculum defines a student’s academic career (Plank et al, 2008), different curriculum tracks might produce different persistence outcomes. Therefore, the purpose of this study is to investigate any significant differences in dropping out of high school likelihood among students of different curriculum tracks. Conceptual framework Figure 1 illustrates the conceptual framework that guides this study. Figure 1: Conceptual Framework Demographics (gender, race, SES) Prior academic achievement (math, reading) Curriculum track School type (public/private) Likelihood of dropping out of high school
Transcript of ACTER Poster 2011 edited V2 - International Islamic...

ACTER 2011: Call for Posters Curriculum Track and Its Influences on High School Dropout Likelihood
Rosemaliza Mohd Kamalludeen
PhD Candidate Career and Technical Education
Virginia Polytechnic Institute and State University
Introduction/Need for Research Among numerous studies conducted on the causes and remedies of high
school dropouts, but very few relate to the curriculum. Plank, DeLuca, and Estacion (2008) reported the curriculum being a vital part of the school environment as “the combination of all courses taken throughout a high school career” (p. 346) significantly determines a student’s path after high school.
Among factors constantly reported to predict high school dropout rates were
race (Griffin, 2002; Silver, Sanders & Zarate, 2008), socio-‐economic status (Christle, Jolivette & Nelson, 2007), poor academic achievement (Plank, 2001; Silver et al 2008), and institutional environment (Christle et al, 2007; Knesting, 2008; Silver et al, 2008). Since curriculum defines a student’s academic career (Plank et al, 2008), different curriculum tracks might produce different persistence outcomes. Therefore, the purpose of this study is to investigate any significant differences in dropping out of high school likelihood among students of different curriculum tracks.
Conceptual framework
Figure 1 illustrates the conceptual framework that guides this study. Figure 1: Conceptual Framework
Demographics (gender, race, SES)
Prior academic achievement (math, reading)
Curriculum track
School type (public/private)
Likelihood of dropping out of high school
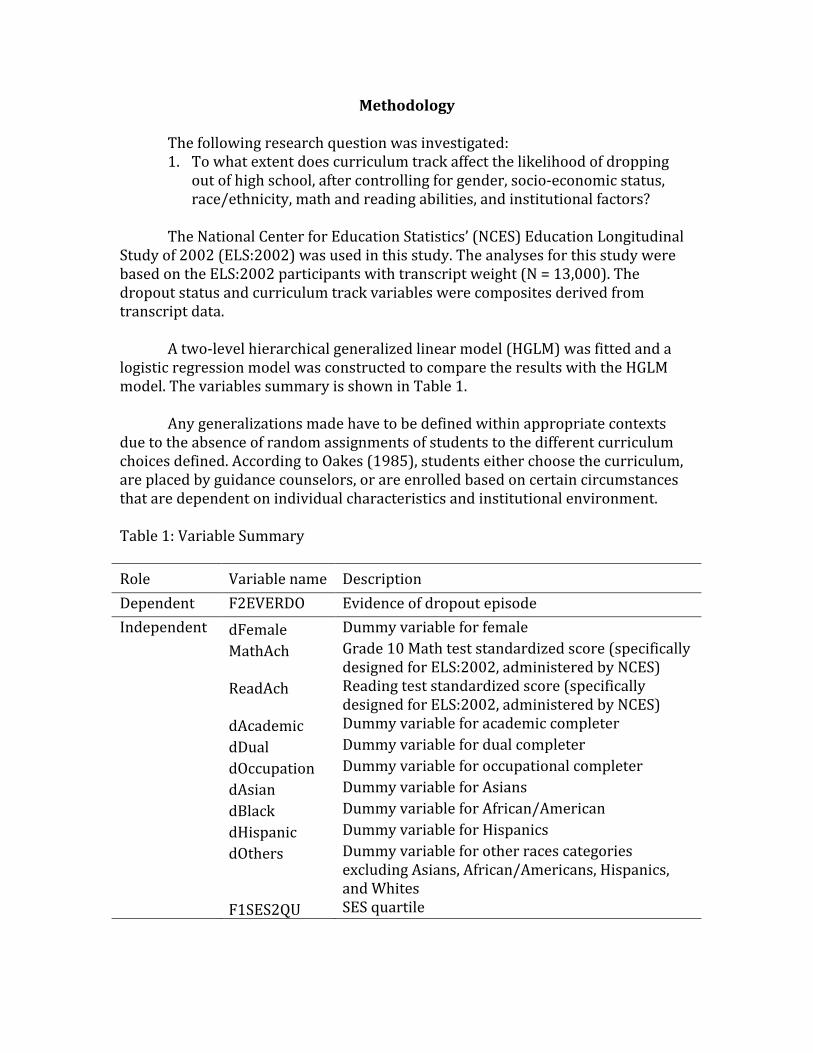
Methodology
The following research question was investigated: 1. To what extent does curriculum track affect the likelihood of dropping
out of high school, after controlling for gender, socio-‐economic status, race/ethnicity, math and reading abilities, and institutional factors?
The National Center for Education Statistics’ (NCES) Education Longitudinal
Study of 2002 (ELS:2002) was used in this study. The analyses for this study were based on the ELS:2002 participants with transcript weight (N = 13,000). The dropout status and curriculum track variables were composites derived from transcript data.
A two-‐level hierarchical generalized linear model (HGLM) was fitted and a logistic regression model was constructed to compare the results with the HGLM model. The variables summary is shown in Table 1.
Any generalizations made have to be defined within appropriate contexts
due to the absence of random assignments of students to the different curriculum choices defined. According to Oakes (1985), students either choose the curriculum, are placed by guidance counselors, or are enrolled based on certain circumstances that are dependent on individual characteristics and institutional environment. Table 1: Variable Summary
Role Variable name Description Dependent F2EVERDO Evidence of dropout episode Independent dFemale Dummy variable for female MathAch Grade 10 Math test standardized score (specifically
designed for ELS:2002, administered by NCES) ReadAch Reading test standardized score (specifically
designed for ELS:2002, administered by NCES) dAcademic Dummy variable for academic completer dDual Dummy variable for dual completer dOccupation Dummy variable for occupational completer dAsian Dummy variable for Asians dBlack Dummy variable for African/American dHispanic Dummy variable for Hispanics dOthers Dummy variable for other races categories
excluding Asians, African/Americans, Hispanics, and Whites
F1SES2QU SES quartile
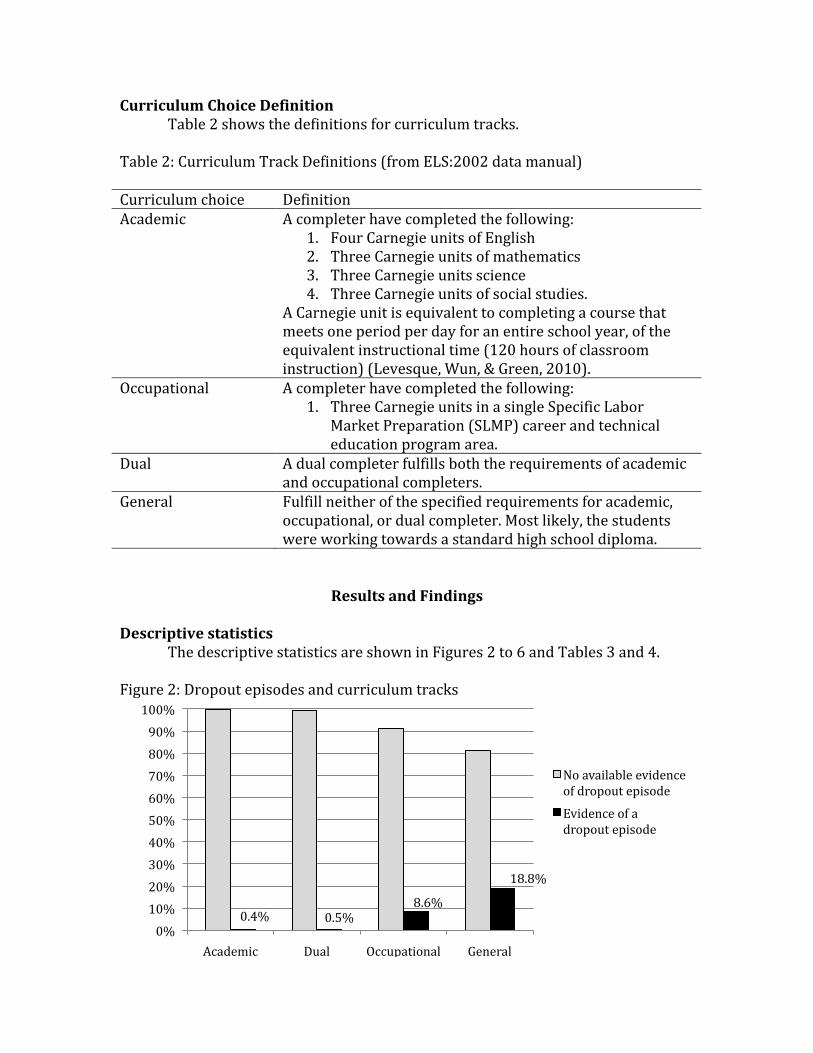
Curriculum Choice Definition Table 2 shows the definitions for curriculum tracks. Table 2: Curriculum Track Definitions (from ELS:2002 data manual) Curriculum choice Definition Academic A completer have completed the following:
1. Four Carnegie units of English 2. Three Carnegie units of mathematics 3. Three Carnegie units science 4. Three Carnegie units of social studies.
A Carnegie unit is equivalent to completing a course that meets one period per day for an entire school year, of the equivalent instructional time (120 hours of classroom instruction) (Levesque, Wun, & Green, 2010).
Occupational A completer have completed the following: 1. Three Carnegie units in a single Specific Labor
Market Preparation (SLMP) career and technical education program area.
Dual A dual completer fulfills both the requirements of academic and occupational completers.
General Fulfill neither of the specified requirements for academic, occupational, or dual completer. Most likely, the students were working towards a standard high school diploma.
Results and Findings
Descriptive statistics The descriptive statistics are shown in Figures 2 to 6 and Tables 3 and 4. Figure 2: Dropout episodes and curriculum tracks
0.4% 0.5% 8.6%
18.8%
0% 10% 20% 30% 40% 50% 60% 70% 80% 90% 100%
Academic Dual Occupational General
No available evidence of dropout episode
Evidence of a dropout episode
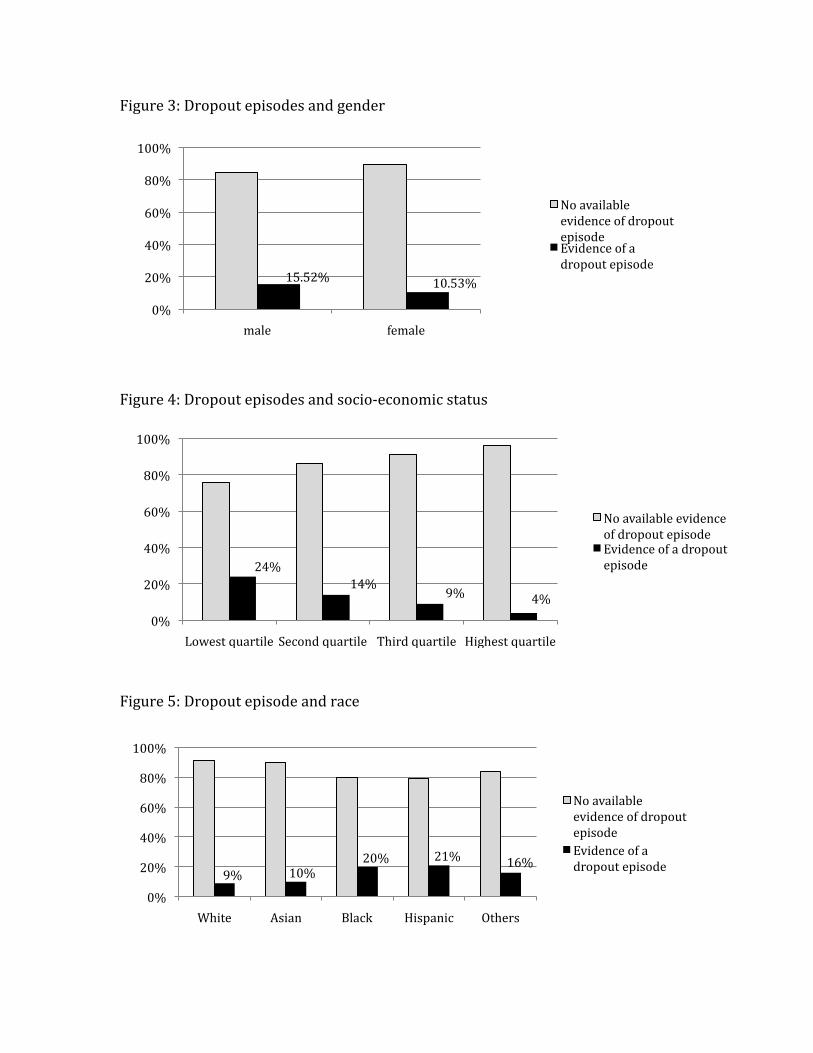
Figure 3: Dropout episodes and gender
Figure 4: Dropout episodes and socio-‐economic status
Figure 5: Dropout episode and race
15.52% 10.53%
0%
20%
40%
60%
80%
100%
male female
No available evidence of dropout episode Evidence of a dropout episode
24% 14%
9% 4% 0%
20%
40%
60%
80%
100%
Lowest quartile Second quartile Third quartile Highest quartile
No available evidence of dropout episode Evidence of a dropout episode
9% 10% 20% 21% 16%
0%
20%
40%
60%
80%
100%
White Asian Black Hispanic Others
No available evidence of dropout episode Evidence of a dropout episode
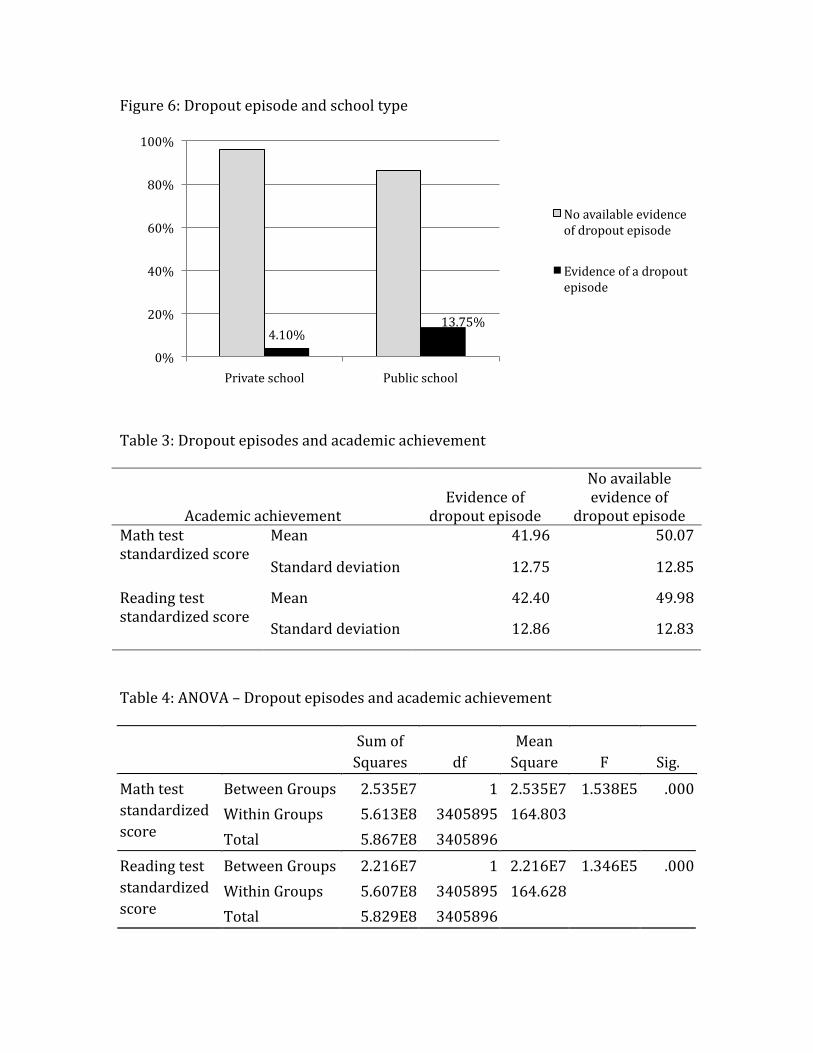
Figure 6: Dropout episode and school type
Table 3: Dropout episodes and academic achievement
Academic achievement Evidence of
dropout episode
No available evidence of
dropout episode Mean 41.96 50.07 Math test
standardized score Standard deviation 12.75 12.85
Mean 42.40 49.98 Reading test standardized score
Standard deviation 12.86 12.83
Table 4: ANOVA – Dropout episodes and academic achievement
Sum of Squares df
Mean Square F Sig.
Between Groups 2.535E7 1 2.535E7 1.538E5 .000 Within Groups 5.613E8 3405895 164.803
Math test standardized score Total 5.867E8 3405896
Between Groups 2.216E7 1 2.216E7 1.346E5 .000 Within Groups 5.607E8 3405895 164.628
Reading test standardized score Total 5.829E8 3405896
4.10% 13.75%
0%
20%
40%
60%
80%
100%
Private school Public school
No available evidence of dropout episode
Evidence of a dropout episode
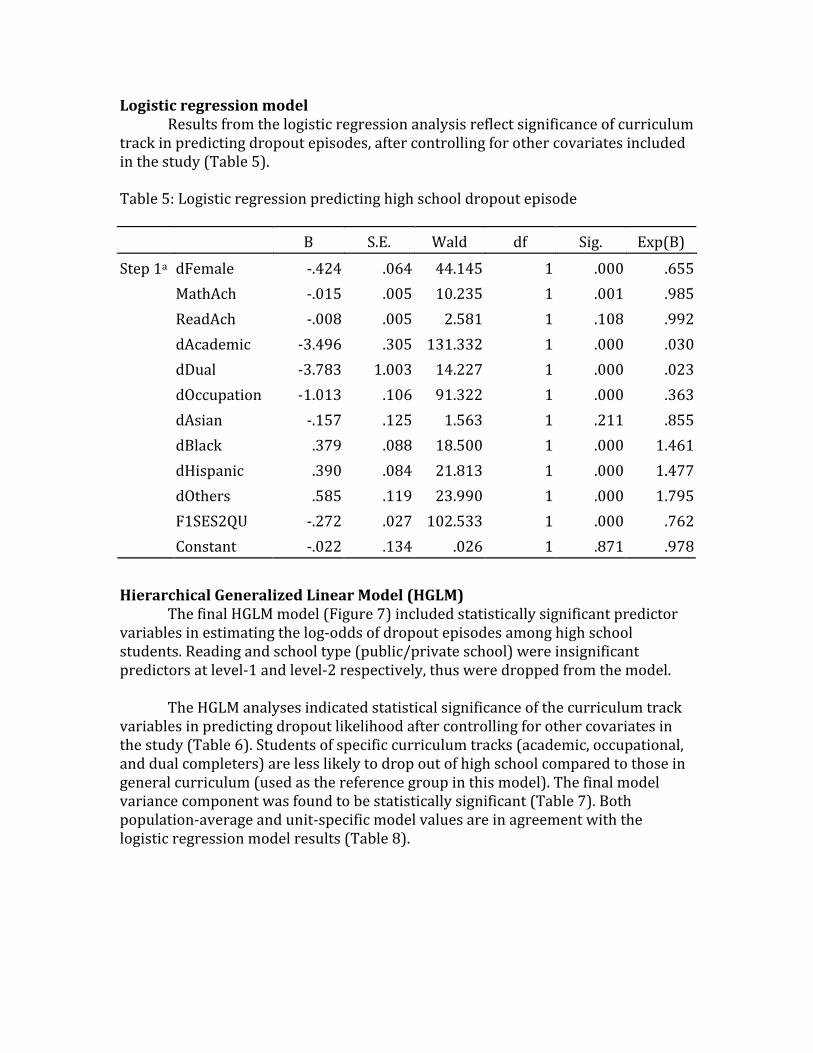
Logistic regression model Results from the logistic regression analysis reflect significance of curriculum track in predicting dropout episodes, after controlling for other covariates included in the study (Table 5). Table 5: Logistic regression predicting high school dropout episode
B S.E. Wald df Sig. Exp(B) dFemale -‐.424 .064 44.145 1 .000 .655 MathAch -‐.015 .005 10.235 1 .001 .985 ReadAch -‐.008 .005 2.581 1 .108 .992 dAcademic -‐3.496 .305 131.332 1 .000 .030 dDual -‐3.783 1.003 14.227 1 .000 .023 dOccupation -‐1.013 .106 91.322 1 .000 .363 dAsian -‐.157 .125 1.563 1 .211 .855 dBlack .379 .088 18.500 1 .000 1.461 dHispanic .390 .084 21.813 1 .000 1.477 dOthers .585 .119 23.990 1 .000 1.795 F1SES2QU -‐.272 .027 102.533 1 .000 .762
Step 1a
Constant -‐.022 .134 .026 1 .871 .978
Hierarchical Generalized Linear Model (HGLM) The final HGLM model (Figure 7) included statistically significant predictor variables in estimating the log-‐odds of dropout episodes among high school students. Reading and school type (public/private school) were insignificant predictors at level-‐1 and level-‐2 respectively, thus were dropped from the model.
The HGLM analyses indicated statistical significance of the curriculum track variables in predicting dropout likelihood after controlling for other covariates in the study (Table 6). Students of specific curriculum tracks (academic, occupational, and dual completers) are less likely to drop out of high school compared to those in general curriculum (used as the reference group in this model). The final model variance component was found to be statistically significant (Table 7). Both population-‐average and unit-‐specific model values are in agreement with the logistic regression model results (Table 8).
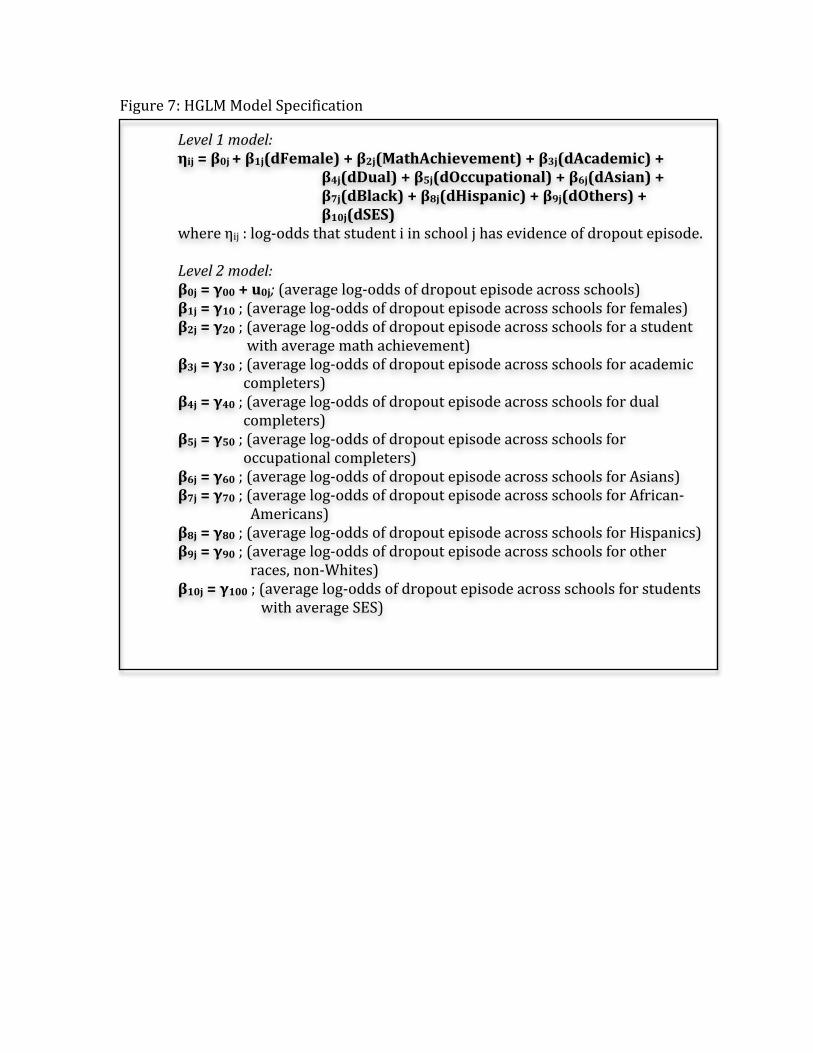
Figure 7: HGLM Model Specification
Level 1 model: ηij = β0j + β1j(dFemale) + β2j(MathAchievement) + β3j(dAcademic) +
β4j(dDual) + β5j(dOccupational) + β6j(dAsian) + β7j(dBlack) + β8j(dHispanic) + β9j(dOthers) + β10j(dSES)
where ηij : log-‐odds that student i in school j has evidence of dropout episode. Level 2 model: β0j = γ00 + u0j; (average log-‐odds of dropout episode across schools) β1j = γ10 ; (average log-‐odds of dropout episode across schools for females) β2j = γ20 ; (average log-‐odds of dropout episode across schools for a student
with average math achievement) β3j = γ30 ; (average log-‐odds of dropout episode across schools for academic
completers) β4j = γ40 ; (average log-‐odds of dropout episode across schools for dual
completers) β5j = γ50 ; (average log-‐odds of dropout episode across schools for
occupational completers) β6j = γ60 ; (average log-‐odds of dropout episode across schools for Asians) β7j = γ70 ; (average log-‐odds of dropout episode across schools for African-‐
Americans) β8j = γ80 ; (average log-‐odds of dropout episode across schools for Hispanics) β9j = γ90 ; (average log-‐odds of dropout episode across schools for other
races, non-‐Whites) β10j = γ100 ; (average log-‐odds of dropout episode across schools for students
with average SES)

Table 6: Final model -‐ Final estimation of fixed effects
Unit-‐specific model Population-‐average model Fixed effect
Coefficient P-‐value Coefficient P-‐value
INTRCPT1, BO; INTRCPT2, G00 -‐2.162514 0.000 -‐2.244568 0.000 DFEMALE slope, B1; INTRCPT2, G10 -‐0.340159 0.006 -‐0.333276 0.006 MATHAC slope, B2; INTRCPT2, G20 -‐0.022841 0.000 -‐0.022330 0.000 DACAD slope, B3; INTRCPT2, G30 -‐3.732993 0.000 -‐3.687269 0.000 DDUAL slope, B4; INTRCPT2, G40 -‐4.241670 0.017 -‐4.195212 0.015 DOCCU slope, B5; INTRCPT2, G50 -‐1.167774 0.000 -‐1.140394 0.000 DASIAN slope, B6; INTRCPT2, G60 0.320432 0.246 0.319390 0.210 DBLACK slope, B7; INTRCPT2, G70 0.779028 0.000 0.778052 0.000 DHISPAN slope, B8; INTRCPT2, G80 0.601637 0.001 0.594320 0.001 DOTHERS slope, B9; INTRCPT2, G90 0.704075 0.004 0.690834 0.004 SES slope, B10; INTRCPT2, G100 -‐0.234827 0.000 -‐0.229222 0.000 Table 7: Final unit-‐specific model – Final estimation of variance components Random effect Std
deviation Variance component
df Chi-‐square P-‐value
INTRCPT1, UO 0.61656 0.38014 737 1113.10499 0.000
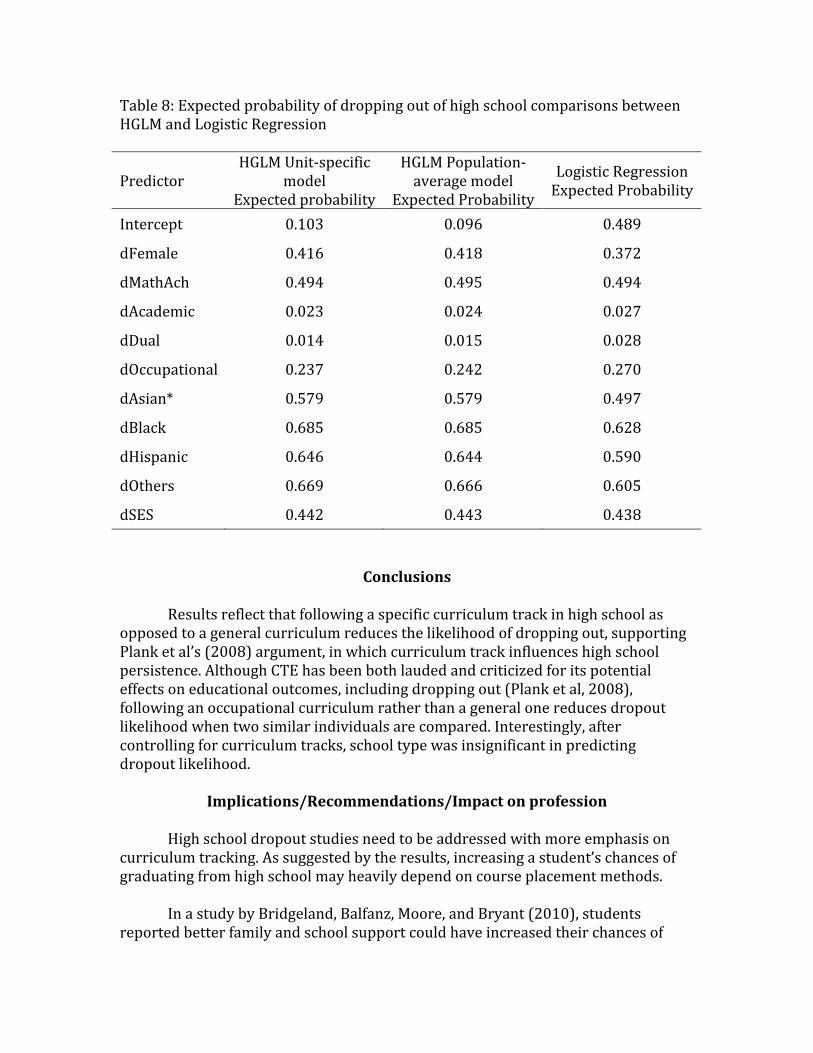
Table 8: Expected probability of dropping out of high school comparisons between HGLM and Logistic Regression
Predictor HGLM Unit-‐specific
model Expected probability
HGLM Population-‐average model
Expected Probability
Logistic Regression Expected Probability
Intercept 0.103 0.096 0.489
dFemale 0.416 0.418 0.372
dMathAch 0.494 0.495 0.494
dAcademic 0.023 0.024 0.027
dDual 0.014 0.015 0.028
dOccupational 0.237 0.242 0.270
dAsian* 0.579 0.579 0.497
dBlack 0.685 0.685 0.628
dHispanic 0.646 0.644 0.590
dOthers 0.669 0.666 0.605
dSES 0.442 0.443 0.438
Conclusions
Results reflect that following a specific curriculum track in high school as
opposed to a general curriculum reduces the likelihood of dropping out, supporting Plank et al’s (2008) argument, in which curriculum track influences high school persistence. Although CTE has been both lauded and criticized for its potential effects on educational outcomes, including dropping out (Plank et al, 2008), following an occupational curriculum rather than a general one reduces dropout likelihood when two similar individuals are compared. Interestingly, after controlling for curriculum tracks, school type was insignificant in predicting dropout likelihood.
Implications/Recommendations/Impact on profession
High school dropout studies need to be addressed with more emphasis on curriculum tracking. As suggested by the results, increasing a student’s chances of graduating from high school may heavily depend on course placement methods.
In a study by Bridgeland, Balfanz, Moore, and Bryant (2010), students
reported better family and school support could have increased their chances of

graduation. Choosing curriculum should be a collaborative effort between students, parents, and the school. Students should know their interests and strengths to decide on courses to enroll in. Parents should be aware of different graduation paths. Schools should provide necessary facilities to equip the students with alternatives to encourage persistence.
One important limitation of this study is the absence of curriculum track random assignment. More sophisticated statistical methods such as the propensity score matching method could be utilized to produce better conclusions on the influence of curriculum track in dropout studies.
References Bridgeland, J., Balfanz, R., Moore, L., Friant, R., & Civic, E. (2010). Raising their voices:
Engaging students, teachers, and parents to help end the high school dropout epidemic. Civic Enterprises, Retrieved from ERIC database.
Christle, C. A., Jolivette, K., & Nelson, C. M. (2007). School characteristics related to
high school dropout rates. Remedial and Special Education, 28(6), 325-‐339. Griffin, B. W. (2002). Academic disidentification, race, and high school dropouts. The
High School Journal, 85(4), 71-‐81. doi: 10.1353/hsj.2002.0008 Knesting, K. (2008). Students at risk for school dropout: Supporting their
persistence. Preventing School Failure, 52(4), 3-‐10. Retrieved from Education Research Complete database.
National Center for Education Statistics (2010). Fast facts. Retrieved from
http://nces.ed.gov/fastfacts/display.asp?id=16 Oakes, J. (1985). Keeping track: How schools structure inequality. New Haven: Yale
University Press. Plank, S., DeLuca, S., & Estacion, A. (2008). High school dropout and the role of
career and technical education: A Survival Analysis of Surviving High School. Sociology of Education, 81(4), 345-‐370. Retrieved from ERIC database.
Silver, D., Saunders, M., & Zarate, E. (2008). What factors predict high school
graduation in the Los Angeles Unified School District. California Dropout Research Project. Santa Barbara: University of California.