Experimental Obesity Mandm5migu4zj3pb.cloudfront.net/manuscripts/106000/106570/JCI71106570.pdf ·...
7
Experimental Obesity in Man: Cellular Character of the Adipose Tissue LESTER B. SALANS, EDWARD S. HORTON, and ETHAN A. H. SIMS From the Department of Medicine, Dartmouth Hitchcock Medical Center, Hanover, New Hampshire 03755, and the University of Vermont Medical School, Burlington, Vermont 05041 A B S T R A C T Studies of adipose tissue cellularity were carried out in a group of nonobese adult male volunteers who gained 15-25% of their body weight as the result of prolonged high caloric intake. Adipose cell size (lipid content per cell) was determined in tissue obtained from three subcutaneous sites (gluteal, anterior abdominal wall, and triceps) and total adipose cell number esti- mated from measurement of total body fat. Five experimental subjects gained an average of 16.2 kg of body weight, of which 10.4 kg was determined to be fat. Expansion of the adipose mass was accompanied by a significant and relatively uniform increase in fat cell size in each subcutaneous site tested. Total adipose cell number did not change as a result of weight gain and expansion of the adipose depot in adult life. Subsequent loss of weight and restoration of original body fat was associataed with a reduction in adipose cell size at each subcutaneous site, but no change in total number. In two control subjects who neither gained nor lost weight there were no changes in total adipose cell number or cell size. These observations suggest that expansion and retraction of the adipose depot in adult life is accom- panied by changes in adipose cell size only. Significant differences in both the size and total num- ber of adipose cells were observed between subjects in both the experimental and control groups. In addition, within individuals of both groups there were significant differences in cell size when adipose cells from the three subcutaneous sites were compared. These findings indi- cate that wide variations in adipose cell size and number exist in nonobese individuals having similar adipose depot sizes. This work was presented in part at the general meeting of The American Federation for Clinical Research, Atlantic City, N. J., 3 May 1970. Received for publication 19 October 1970 and in revised form 24 November 1970. INTRODUCTION Obesity is characterized by an increased adipose tissue mass. The enlargement of the adipose depot may be the result of an increase in the number or size (lipid content per cell) of its constituent fat cells. It has been sug- gested that definition of the cellular character of this expanded tissue may provide a means for categorizing different patterns of human obesity and may lead to a more rational therapeutic approach (1). Consideration of the cellular character of the adipose tissue may be of more than just morphologic interest since it has recently been demonstrated that some aspects of glucose toler- ance, insulin secretion and sensitivity, and adipose tis- sue metabolism are influenced by adipose cell size and number (2, 3). Human obesity of early onset is accompanied by a marked increase in adipose cell number and to a lesser extent in adipose cell size (1). Weight loss by dietary restriction is achieved solely by reduction in adipose cell size and the hypercellularity persists. Glucose intolerance and hyperinsulinemia in these individuals is associated with the presence of enlarged, insulin-resistant fat cells in the adipose depot, abnormalities which disappear upon weight loss and reduction in fat cell size (2). Similar abnormalities of impaired glucose tolerance and hyper- insulinemia are seen in human obesity of adult onset, but little is known of the cellular and metabolic character of their expanded adipose depot and of its relationship to the metabolic disorders. Earlier studies of experimentally induced obesity in adult man indicate that expansion of the adipose depot is accompanied by an increase in the size of fat cells in the subcutaneous tissue of the gluteal region (4). It was postulated that the adipose depot enlarged as a result of a generalized increase in fat cell size but that there was no change in total adipose cell number. The current studies were undertaken to more clearly define the cellular char- The Journal of Clinical Investigation Volume 50 1971 1005
Transcript of Experimental Obesity Mandm5migu4zj3pb.cloudfront.net/manuscripts/106000/106570/JCI71106570.pdf ·...

Experimental Obesity in Man: Cellular
Character of the Adipose Tissue
LESTER B. SALANS, EDWARDS. HORTON,and ETHANA. H. SIMS
From the Department of Medicine, Dartmouth Hitchcock Medical Center,Hanover, NewHampshire 03755, and the University of Vermont MedicalSchool, Burlington, Vermont 05041
A B S T R A C T Studies of adipose tissue cellularity werecarried out in a group of nonobese adult male volunteerswho gained 15-25% of their body weight as the resultof prolonged high caloric intake. Adipose cell size (lipidcontent per cell) was determined in tissue obtained fromthree subcutaneous sites (gluteal, anterior abdominalwall, and triceps) and total adipose cell number esti-mated from measurement of total body fat.
Five experimental subjects gained an average of 16.2kg of body weight, of which 10.4 kg was determined to befat. Expansion of the adipose mass was accompanied bya significant and relatively uniform increase in fat cellsize in each subcutaneous site tested. Total adipose cellnumber did not change as a result of weight gain andexpansion of the adipose depot in adult life. Subsequentloss of weight and restoration of original body fat wasassociataed with a reduction in adipose cell size at eachsubcutaneous site, but no change in total number. In twocontrol subjects who neither gained nor lost weightthere were no changes in total adipose cell number orcell size. These observations suggest that expansion andretraction of the adipose depot in adult life is accom-panied by changes in adipose cell size only.
Significant differences in both the size and total num-ber of adipose cells were observed between subjects inboth the experimental and control groups. In addition,within individuals of both groups there were significantdifferences in cell size when adipose cells from the threesubcutaneous sites were compared. These findings indi-cate that wide variations in adipose cell size and numberexist in nonobese individuals having similar adiposedepot sizes.
This work was presented in part at the general meeting ofThe American Federation for Clinical Research, AtlanticCity, N. J., 3 May 1970.
Received for publication 19 October 1970 and in revisedform 24 November 1970.
INTRODUCTION
Obesity is characterized by an increased adipose tissuemass. The enlargement of the adipose depot may be theresult of an increase in the number or size (lipid contentper cell) of its constituent fat cells. It has been sug-gested that definition of the cellular character of thisexpanded tissue may provide a means for categorizingdifferent patterns of human obesity and may lead to amore rational therapeutic approach (1). Considerationof the cellular character of the adipose tissue may be ofmore than just morphologic interest since it has recentlybeen demonstrated that some aspects of glucose toler-ance, insulin secretion and sensitivity, and adipose tis-sue metabolism are influenced by adipose cell size andnumber (2, 3).
Human obesity of early onset is accompanied by amarked increase in adipose cell number and to a lesserextent in adipose cell size (1). Weight loss by dietaryrestriction is achieved solely by reduction in adipose cellsize and the hypercellularity persists. Glucose intoleranceand hyperinsulinemia in these individuals is associatedwith the presence of enlarged, insulin-resistant fat cellsin the adipose depot, abnormalities which disappear uponweight loss and reduction in fat cell size (2). Similarabnormalities of impaired glucose tolerance and hyper-insulinemia are seen in human obesity of adult onset, butlittle is known of the cellular and metabolic character oftheir expanded adipose depot and of its relationship tothe metabolic disorders.
Earlier studies of experimentally induced obesity inadult man indicate that expansion of the adipose depotis accompanied by an increase in the size of fat cells inthe subcutaneous tissue of the gluteal region (4). It waspostulated that the adipose depot enlarged as a result of ageneralized increase in fat cell size but that there was nochange in total adipose cell number. The current studieswere undertaken to more clearly define the cellular char-
The Journal of Clinical Investigation Volume 50 1971 1005
acter of the adipose depot when it is expanded and con-tracted by experimental means in adult human volunteers.
METHODSSubjects. All subjects were inmates of the Vermont State
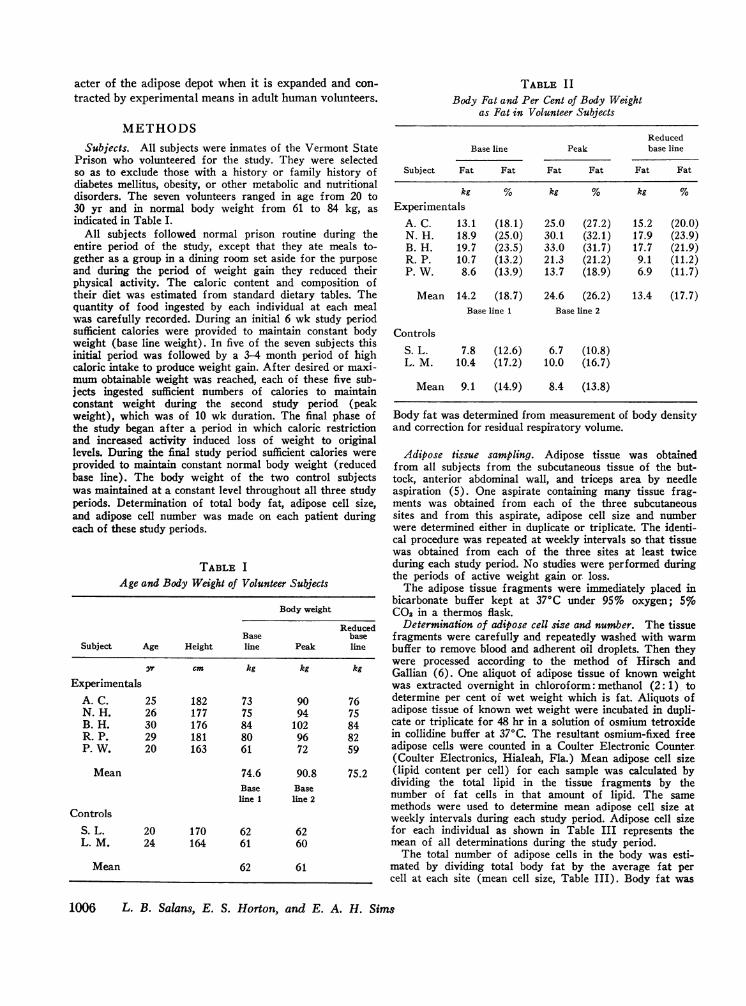
Prison who volunteered for the study. They were selectedso as to exclude those with a history or family history ofdiabetes mellitus, obesity, or other metabolic and nutritionaldisorders. The seven volunteers ranged in age from 20 to30 yr and in normal body weight from 61 to 84 kg, asindicated in Table I.
All subjects followed normal prison routine during theentire period of the study, except that they ate meals to-gether as a group in a dining room set aside for the purposeand during the period of weight gain they reduced theirphysical activity. The caloric content and composition oftheir diet was estimated from standard dietary tables. Thequantity of food ingested by each individual at each mealwas carefully recorded. During an initial 6 wk study periodsufficient calories were provided to maintain constant bodyweight (base line weight). In five of the seven subjects thisinitial period was followed by a 3-4 month period of highcaloric intake to produce weight gain. After desired or maxi-mumobtainable weight was reached, each of these five sub-jects ingested sufficient numbers of calories to maintainconstant weight during the second study period (peakweight), which was of 10 wk duration. The final phase ofthe study began after a period in which caloric restrictionand increased activity induced loss of weight to originallevels. During the final study period sufficient calories wereprovided to maintain constant normal body weight (reducedbase line). The body weight of the two control subjectswas maintained at a constant level throughout all three studyperiods. Determination of total body fat, adipose cell size,and adipose cell number was made on each patient duringeach of these study periods.
TABLE IAge and Body Weight of Volunteer Subjects
Body weight
ReducedBase base
Subject Age Height line Peak line
yr cm kg kg kg
ExperimentalsA. C. 25 182 73 90 76N. H. 26 177 75 94 75B. H. 30 176 84 102 84R. P. 29 181 80 96 82P. W. 20 163 61 72 59
Mean 74.6 90.8 75.2Base Base
line I line 2
ControlsS. L. 20 170 62 62L. M. 24 164 61 60
Mean 62 61
TABLE I IBody Fat and Per Cent of Body Weight
as Fat in Volunteer Subjects
ReducedBase line Peak base line
Subject Fat Fat Fat Fat Fat Fat
kg % kg % kg %
ExperimentalsA. C. 13.1 (18.1) 25.0 (27.2) 15.2 (20.0)N. H. 18.9 (25.0) 30.1 (32.1) 17.9 (23.9)B. H. 19.7 (23.5) 33.0 (31.7) 17.7 (21.9)R. P. 10.7 (13.2) 21.3 (21.2) 9.1 (11.2)P. W. 8.6 (13.9) 13.7 (18.9) 6.9 (11.7)
Mean 14.2 (18.7) 24.6 (26.2) 13.4 (17.7)Base line 1 Base line 2
ControlsS. L. 7.8 (12.6) 6.7 (10.8)L. M. 10.4 (17.2) 10.0 (16.7)
Mean 9.1 (14.9) 8.4 (13.8)
Body fat was determined from measurement of body densityand correction for residual respiratory volume.
Adipose tissue sampling. Adipose tissue was obtainedfrom all subjects from the subcutaneous tissue of the but-tock, anterior abdominal wall, and triceps area by needleaspiration (5). One aspirate containing many tissue frag-ments was obtained from each of the three subcutaneoussites and from this aspirate, adipose cell size and numberwere determined either in duplicate or triplicate. The identi-cal procedure was repeated at weekly intervals so that tissuewas obtained from each of the three sites at least twiceduring each study period. No studies were performed duringthe periods of active weight gain or. loss.
The adipose tissue fragments were immediately placed inbicarbonate buffer kept at 370C under 95% oxygen; 5%CO2 in a thermos flask.
Determination of adipose cell size and number. The tissuefragments were carefully and repeatedly washed with warmbuffer to remove blood and adherent oil droplets. Then theywere processed according to the method of Hirsch andGallian (6). One aliquot of adipose tissue of known weightwas extracted overnight in chloroform: methanol (2: 1) todetermine per cent of wet weight which is fat. Aliquots ofadipose tissue of known wet weight were incubated in dupli-cate or triplicate for 48 hr in a solution of osmium tetroxidein collidine buffer at 370C. The resultant osmium-fixed freeadipose cells were counted in a Coulter Electronic Counter(Coulter Electronics, Hialeah, Fla.) Mean adipose cell size(lipid content per cell) for each sample was calculated bydividing the total lipid in the tissue fragments by thenumber of fat cells in that amount of lipid. The samemethods were used to determine mean adipose cell size atweekly intervals during each study period. Adipose cell sizefor each individual as shown in Table III represents themean of all determinations during the study period.
The total number of adipose cells in the body was esti-mated by dividing total body fat by the average fat percell at each site (mean cell size, Table III). Body fat was
1006 L. B. Salans, E. S. Horton, and E. A. H. Sims

calculated from under-water weighing as described by Gold-man and Buskirk (7) except that body density was measuredby immersion in the supine position (8). The residual lungvolume used in the calculations was measured by a closed-circuit helium dilution technique (9) with subjects in thesame position in air as when being weighed under water.There was no difference in residual lung volume betweenbase line and peak body weight.
RESULTSBody weight
Table I indicates the body weight of each individualand the mean body weight of the group at each study
period. Prolonged high caloric intake resulted in a meanweight gain of 16.2 kg in the group, with an individualrange of from 9 to 19 kg. This represents a 20.9% in-crease in body weight for the group as a whole with in-dividual gains ranging from 14.8 to 25.3%. Caloric re-striction restored body weight to normal. There was nochange in the body weight of the two control subjectsfrom base line 1 to base line 2.
Body fatThese changes in body weight were largely due to
changes in body fat as is shown in Table II. Prolonged
TABLE I I IAdipose Cell Size (@sg TG/cell)-Individual Subjects
Subject Study period Gluteal Abdomen Triceps
ExperimentalA. C. Base line 0.46 ±0.02* 0.31 ±0.01t 0.45 ±0.02
Peak 0.99 ±0.16* 0.76 ±0.01t 0.85 ±0.04Reduced base line 0.50 410.02 0.49 4=0.08 0.52 4:0.01
Pi <0.001 <0.001 <0.001
N. H. Base line 0.61 4:0.03* 0.51 -1:0.03 0.56 4:0.02Peak 0.88 :40.02 0.86 :1:0.02 0.86 ±0.07Reduced base line 0.44 ±0.01* 0.52 410.11 0.39 4:0.0811
P§ <0.01 <0.001 <0.001
B. H. Base line 0.65 40.01* 0.54 ±0.01 0.60 40.0211Peak 1.02 :410.02 0.85 ±0.05t 1.04 :1:0.0411Reduced base line 0.52 :i10.03 0.39 ±0.021 0.46 ±0.0311
P§ <0.001 <0.001 <0.001R. P. Base line 0.37 ±0.03* 0.32 40.01t 0.25 40.0311
Peak 0.72 40.01* 0.65 ±0.14: 0.50 ±0.0311Reduced base line 0.36 ±:0.02* 0.23 ±0.02t 0.25 40.0111
P§i <0.001 <0.001 <0.001
P. W. Base line 0.41 ±0.02* 0.31 40.04 0.28 40.011Peak 0.71 ±t0.03* 0.43 40.08 0.54 40.0411Reduced base line 0.31 ±0.02* 0.28 ±0.02 0.23 ±0.01
Pi, <0.001 <0.001 <0.001
ControlS. L. Base line 1 0.34 ±0.01* 0.24 ±0.03 0.28 ±0.021
Base line 2 0.35 ±0.02* 0.22 ±0.01 0.29 40.01P§i NS¶ NS NS
L. M. Base line 1 0.40 ±0.02* 0.25 ±0.02 0.27 40.0311Base line 2 0.34 ±0.03 0.24 ±0.03 0.25 ±0.0311
P§i NS NS NS
Values represent the mean ±SD of all determinations of adipose cell size in each individualat each subcutaneous site during each study period. TG = triglyceride. Significance levelswere determined from F ratios calculated by two-way analysis of variance.* P < 0.05 gluteal cell size vs. abdomen cell size within a study period.t P < 0.05 abdomen cell size vs. triceps cell size within a study period.§ P for comparisons of adipose cell size between base line and peak, between peak and re-duced base line, and between base line 1 and base line 2.
11 P < 0.05 triceps cell size vs. gluteal cell size within a study period.¶ NS = nonsignificant (P > 0.05).
Fat Cell Size and Number in Experimental Obesity 1007
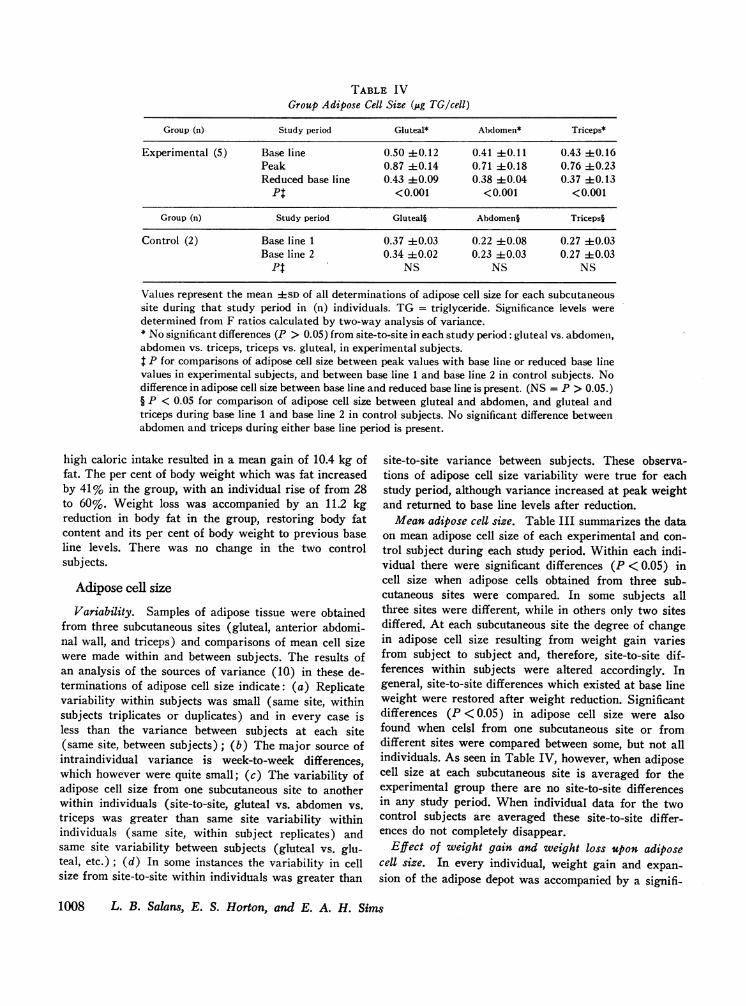
TABLE IV
Group Adipose Cell Size (,ug TG/cell)
Group (n) Study period Gluteal* Abdomen* Triceps*
Experimental (5) Base line 0.50 +0.12 0.41 -:0.11 0.43 40.16Peak 0.87 -0.14 0.71 40.18 0.76 40.23Reduced base line 0.43 +0.09 0.38 i0.04 0.37 h0.13
Pt <0.001 <0.001 <0.001
Group (n) Study period Gluteal§ Abdomen§ Triceps§
Control (2) Base line 1 0.37 dt0.03 0.22 d0.08 0.27 i0.03Base line 2 0.34 40.02 0.23 d0.03 0.27 +0.03
Pt NS NS NS
Values represent the mean -SD of all determinations of adipose cell size for each subcutaneoussite during that study period in (n) individuals. TG = triglyceride. Significance levels weredetermined from F ratios calculated by two-way analysis of variance.* No significant differences (P > 0.05) from site-to-site in each study period: gluteal vs. abdomen,abdomen vs. triceps, triceps vs. gluteal, in experimental subjects.$ P for comparisons of adipose cell size between peak values with base line or reduced base linevalues in experimental subjects, and between base line 1 and base line 2 in control subjects. Nodifference in adipose cell size between base line and reduced base line is present. (NS = P > 0.05.)§ P < 0.05 for comparison of adipose cell size between gluteal and abdomen, and gluteal andtriceps during base line 1 and base line 2 in control subjects. No significant difference betweenabdomen and triceps during either base line period is present.
high caloric intake resulted in a mean gain of 10.4 kg offat. The per cent of body weight which was fat increasedby 41% in the group, with an individual rise of from 28to 60%. Weight loss was accompanied by an 11.2 kgreduction in body fat in the group, restoring body fatcontent and its per cent of body weight to previous baseline levels. There was no change in the two controlsubjects.
Adipose cell size
Variability. Samples of adipose tissue were obtainedfrom three subcutaneous sites (gluteal, anterior abdomi-nal wall, and triceps) and comparisons of mean cell sizewere made within and between subjects. The results ofan analysis of the sources of variance (10.) in these de-terminations of adipose cell size indicate: (a) Replicatevariability within subjects was small (same site, withinsubjects triplicates or duplicates) and in every case isless than the variance between subjects at each site(same site, between subjects); (b) The major source ofintraindividual variance is week-to-week differences,which however were quite small; (c) The variability ofadipose cell size from one subcutaneous site to anotherwithin individuals (site-to-site, gluteal vs. abdomen vs.triceps was greater than same site variability withinindividuals (same site, within subject replicates) andsame site variability between subjects (gluteal vs. glu-teal, etc.); (d) In some instances the variability in cellsize from site-to-site within individuals was greater than
site-to-site variance between subjects. These observa-tions of adipose cell size variability were true for eachstudy period, although variance increased at peak weightand returned to base line levels after reduction.
Mean adipose ceU size. Table III summarizes the dataon mean adipose cell size of each experimental and con-trol subject during each study period. Within each indi-vidual there were significant differences (P < 0.05) incell size when adipose cells obtained from three sub-cutaneous sites were compared. In some subjects allthree sites were different, while in others only two sitesdiffered. At each subcutaneous site the degree of changein adipose cell size resulting from weight gain variesfrom subject to subject and, therefore, site-to-site dif-ferences within subjects were altered accordingly. Ingeneral, site-to-site differences which existed at base lineweight were restored after weight reduction. Significantdifferences (P < 0.05) in adipose cell size were alsofound when celsl from one subcutaneous site or fromdifferent sites were compared between some, but not allindividuals. As seen in Table IV, however, when adiposecell size at each subcutaneous site is averaged for theexperimental group there are no site-to-site differencesin any study period. When individual data for the twocontrol subjects are averaged these site-to-site differ-ences do not completely disappear.
Effect of weight gain and weight loss upon adiposecell size. In every individual, weight gain and expan-sion of the adipose depot was accompanied by a signifi-
1008 L. B. Salans, E. S. Horton, and E. A. H. Sims
cant increase in the size of the fat cells at each site tested(Table III, P < 0.01). As a group the increase in meanadipose cell size was relatively uniform for all sites (Ta-ble IV, 74-77%); however, as shown in Table III, indi-vidually there was considerable variation from site tosite (41-144%). Weight loss in every case, was associ-ated with a significant reduction of fat cells size (P <0.01); again, as a group, relatively uniform for eachsite tested (Table IV, 87-107%), but, individually vari-able from site to site (Table III, 55-182%). Althoughas a group adipose cell size at each subcutaneous sitewas smaller after weight reduction compared to the origi-nal base line, the differences were not statistically sig-nificant. This was due to individual and site-to-site vari-ability: in some subjects cell size at one or more siteswas smaller after weight loss (N. H., B. H., P. W.), inone cell size was larger (A. C.), and in many sites therewas no change.
The two control subjects in whom body weight re-mained constant had no change in adipose cell size atany of the three sites.
Adipose cell number
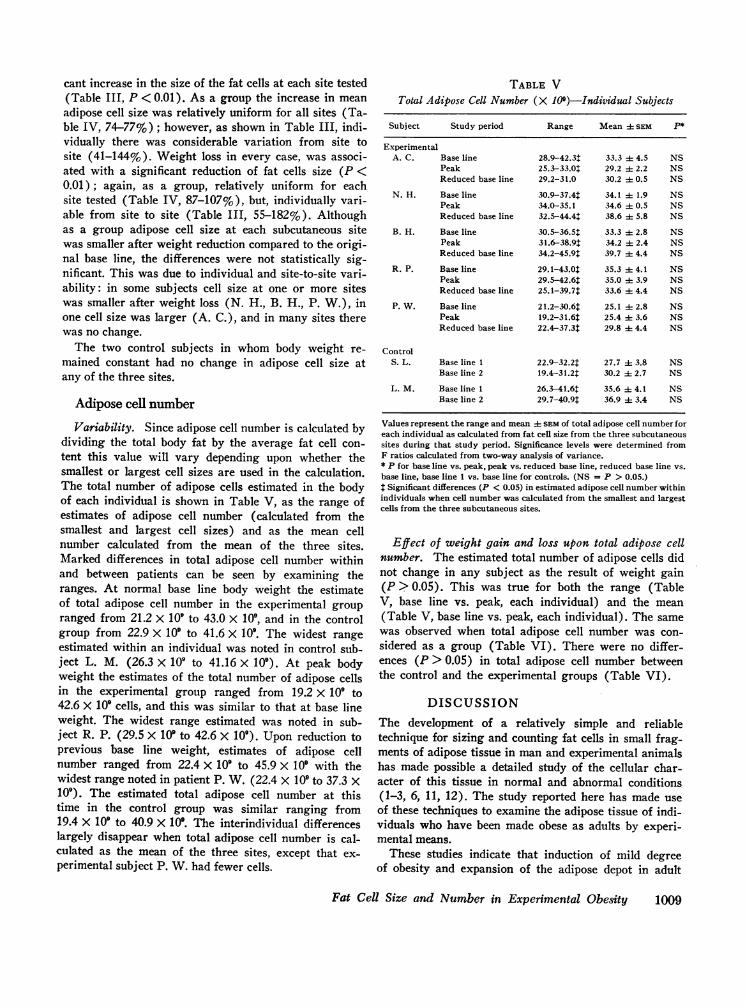
Variability. Since adipose cell number is calculated bydividing the total body fat by the average fat cell con-tent this value will vary depending upon whether thesmallest or largest cell sizes are used in the calculation.The total number of adipose cells estimated in the bodyof each individual is shown in Table V, as the range ofestimates of adipose cell number (calculated from thesmallest and largest cell sizes) and as the mean cellnumber calculated from the mean of the three sites.Marked differences in total adipose cell number withinand between patients can be seen by examining theranges. At normal base line body weight the estimateof total adipose cell number in the experimental groupranged from 21.2 X 10' to 43.0 X 10⁹, and in the controlgroup from 22.9 X 10⁹ to 41.6 X 10⁹. The widest rangeestimated within an individual was noted in control sub-ject L. M. (26.3 x 10⁹ to 41.16 x 10⁹). At peak bodyweight the estimates of the total number of adipose cellsin the experimental group ranged from 19.2 X 10⁹ to42.6 X 10' cells, and this was similar to that at base lineweight. The widest range estimated was noted in sub-ject R. P. (29.5 x 10' to 42.6 X 10⁹). Upon reduction toprevious base line weight, estimates of adipose cellnumber ranged from 22.4 X 10⁹ to 45.9 X 10⁹ with thewidest range noted in patient P. W. (22.4 X 10' to 37.3 X10⁹). The estimated total adipose cell number at thistime in the control group was similar ranging from19.4 X 109 to 40.9 X 10⁹. The interindividual differenceslargely disappear when total adipose cell number is cal-culated as the mean of the three sites, except that ex-perimental subject P. W. had fewer cells.
TABLE V
Total Adipose Cell Number (X 109)-Individual Subjects
Subject Study period Range Mean A SEM P*
ExperimentalA. C. Base line 28.9-42.34 33.3 - 4.5 NS
Peak 25.3-33.0$ 29.2 h 2.2 NSReduced base line 29.2-31.0 30.2 4 0.5 NS
N. H. Base line 30.9-37.4: 34.1 ± 1.9 NSPeak 34.0-35.1 34.6 : 0.5 NSReduced base line 32.5-44.41 38.6 h 5.8 NS
B. H. Base line 30.5-36.5: 33.3 ± 2.8 NSPeak 31.6-38.9: 34.2 A 2.4 NSReduced base line 34.2-45.9$ 39.7 i 4.4 NS
R. P. Base line 29.1-43.0: 35.3 4 4.1 NSPeak 29.5-42.6: 35.0 4 3.9 NSReduced base line 25.1-39.7: 33.6 4 4.4 NS
P. W. Base line 21.2-30.6: 25.1 4 2.8 NSPeak 19.2-31.6: 25.4 4 3.6 NSReduced base line 22.4-37.3$ 29.8 ± 4.4 NS
ControlS. L. Base line 1 22.9-32.2$ 27.7 4 3.8 NS
Base line 2 19.4-31.24 30.2 ± 2.7 NS
L. M. Base line 1 26.3-41.6t 35.6 h 4.1 NSBase line 2 29.7-40.94 36.9 :1 3.4 NS
Values represent the range and mean k SEMof total adipose cell number foreach individual as calculated from fat cell size from the three subcutaneoussites during that study period. Significance levels were determined fromF ratios calculated from two-way analysis of variance.* P for base line vs. peak, peak vs. reduced base line, reduced base line vs.base line, base line 1 vs. base line for controls. (NS = P > 0.05.)t Significant differences (P < 0.05) in estimated adipose cell number withinindividuals when cell number was calculated from the smallest and largestcells from the three subcutaneous sites.
Effect of weight gain and loss upon total adipose cellnumber. The estimated total number of adipose cells didnot change in any subject as the result of weight gain(P > 0.05). This was true for both the range (TableV, base line vs. peak, each individual) and the mean(Table V, base line vs. peak, each individual). The samewas observed when total adipose cell number was con-sidered as a group (Table VI). There were no differ-ences (P > 0.05) in total adipose cell number betweenthe control and the experimental groups (Table VI).
DISCUSSIONThe development of a relatively simple and reliabletechnique for sizing and counting fat cells in small frag-ments of adipose tissue in man and experimental animalshas made possible a detailed study of the cellular char-acter of this tissue in normal and abnormal conditions(1-3, 6, 11, 12). The study reported here has made useof these techniques to examine the adipose tissue of indi-viduals who have been made obese as adults by experi-mental means.
These studies indicate that induction of mild degreeof obesity and expansion of the adipose depot in adult
Fat Cell Size and Number in Experimental Obesity 1009
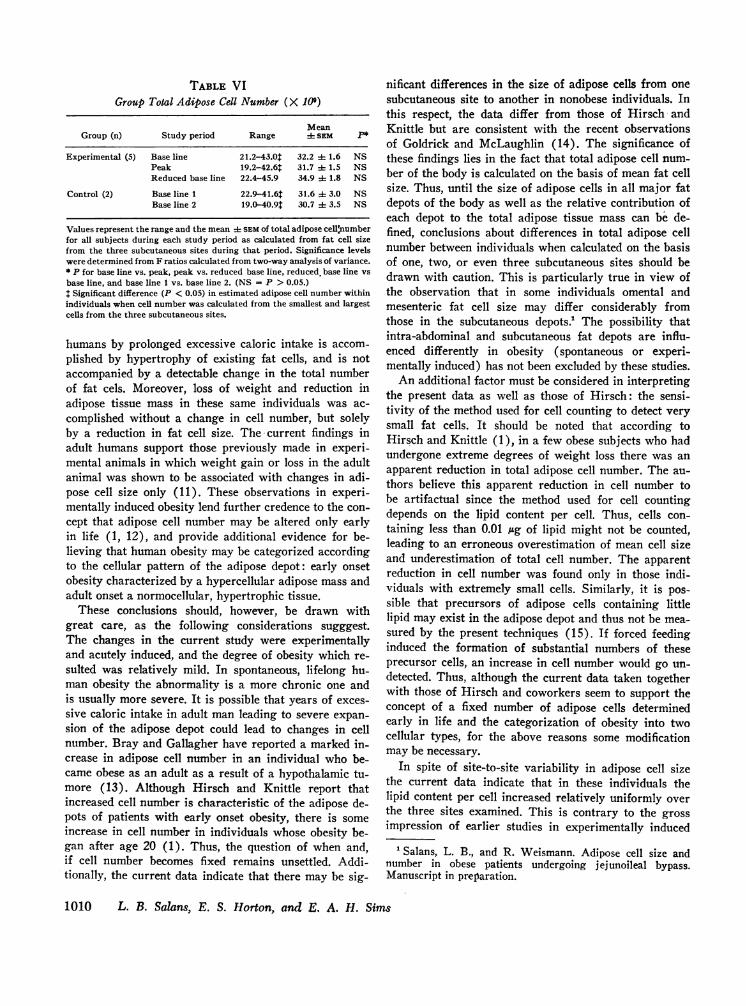
TABLE VIGroup Total Adipose Cell Number (X 109)
MeanGroup (n) Study period Range :1: SEM P*
Experimental (5) Base line 21.2-43.0: 32.2 41 1.6 NSPeak 19.2-42.6: 31.7 h 1.5 NSReduced base line 22.4-45.9 34.9 A 1.8 NS
Control (2) Base line 1 22.9-41.6: 31.6 A 3.0 NSBase line 2 19.0-40.9: 30.7 4 3.5 NS
Values represent the range and the mean :4: SEMof total adipose celltnumberfor all subjects during each study period as calculated from fat cell sizefrom the three subcutaneous sites during that period. Significance levelswere determined from F ratios calculated from two-way analysis of variance.* P for base line vs. peak, peak vs. reduced base line, reduced. base line vsbase line, and base line 1 vs. base line 2. (NS = P > 0.05.): Significant difference (P < 0.05) in estimated adipose cell number withinindividuals when cell number was calculated from the smallest and largestcells from the three subcutaneous sites.
humans by prolonged excessive caloric intake is accom-plished by hypertrophy of existing fat cells, and is notaccompanied by a detectable change in the total numberof fat cels. Moreover, loss of weight and reduction inadipose tissue mass in these same individuals was ac-complished without a change in cell number, but solelyby a reduction in fat cell size. The current findings inadult humans support those previously made in experi-mental animals in which weight gain or loss in the adultanimal was shown to be associated with changes in adi-pose cell size only (11). These observations in experi-mentally induced obesity lend further credence to the con-cept that adipose cell number may be altered only earlyin life (1, 12), and provide additional evidence for be-lieving that human obesity may be categorized accordingto the cellular pattern of the adipose depot: early onsetobesity characterized by a hypercellular adipose mass andadult onset a normocellular, hypertrophic tissue.
These conclusions should, however, be drawn withgreat care, as the following considerations sugggest.The changes in the current study were experimentallyand acutely induced, and the degree of obesity which re-sulted was relatively mild. In spontaneous, lifelong hu-man obesity the abnormality is a more chronic one andis usually more severe. It is possible that years of exces-sive caloric intake in adult man leading to severe expan-sion of the adipose depot could lead to changes in cellnumber. Bray and Gallagher have reported a marked in-crease in adipose cell number in an individual who be-came obese as an adult as a result of a hypothalamic tu-more (13). Although Hirsch and Knittle report thatincreased cell number is characteristic of the adipose de-pots of patients with early onset obesity, there is someincrease in cell number in individuals whose obesity be-gan after age 20 (1). Thus, the question of when and,if cell number becomes fixed remains unsettled. Addi-tionally, the current data indicate that there may be sig-
nificant differences in the size of adipose cells from onesubcutaneous site to another in nonobese individuals. Inthis respect, the data differ from those of Hirsch andKnittle but are consistent with the recent observationsof Goldrick and McLaughlin (14). The significance ofthese findings lies in the fact that total adipose cell num-ber of the body is calculated on the basis of mean fat cellsize. Thus, until the size of adipose cells in all major fatdepots of the body as well as the relative contribution ofeach depot to the total adipose tissue mass can be de-fined, conclusions about differences in total adipose cellnumber between individuals when calculated on the basisof one, two, or even three subcutaneous sites should bedrawn with caution. This is particularly true in view ofthe observation that in some individuals omental andmesenteric fat cell size may differ considerably fromthose in the subcutaneous depots.' The possibility thatintra-abdominal and subcutaneous fat depots are influ-enced differently in obesity (spontaneous or experi-mentally induced) has not been excluded by these studies.
An additional factor must be considered in interpretingthe present data as well as those of Hirsch: the sensi-tivity of the method used for cell counting to detect verysmall fat cells. It should be noted that according toHirsch and Knittle (1), in a few obese subjects who hadundergone extreme degrees of weight loss there was anapparent reduction in total adipose cell number. The au-thors believe this apparent reduction in cell number tobe artifactual since the method used for cell countingdepends on the lipid content per cell. Thus, cells con-taining less than 0.01 /Ag of lipid might not be counted,leading to an erroneous overestimation of mean cell sizeand underestimation of total cell number. The apparentreduction in cell number was found only in those indi-viduals with extremely small cells. Similarly, it is pos-sible that precursors of adipose cells containing littlelipid may exist in the adipose depot and thus not be mea-sured by the present techniques (15). If forced feedinginduced the formation of substantial numbers of theseprecursor cells, an increase in cell number would go un-detected. Thus, although the current data taken togetherwith those of Hirsch and coworkers seem to support theconcept of a fixed number of adipose cells determinedearly in life and the categorization of obesity into twocellular types, for the above reasons some modificationmay be necessary.
In spite of site-to-site variability in adipose cell sizethe current data indicate that in these individuals thelipid content per cell increased relatively uniformly overthe three sites examined. This is contrary to the grossimpression of earlier studies in experimentally induced
1Salans, L. B., and R. Weismann. Adipose cell size andnumber in obese patients undergoing jejunoileal bypass.Manuscript in preparation.
1010 L. B. Salans, E. S. Horton, and E. A. H. Sims

human obesity in which it appeared that the excess sub-cutaneous fat was preferentially deposited in centralrather than peripheral depots (4). Such differences mayreflect differences in the total number of fat cells in agiven subcutaneous depot.
The data in the current study do not indicate that thosesubjects who were fatter initially and who gained moreweight (A. C., N. H., B. H.) had either more cells or atendency towards a change in cell number when com-pared to their leaner colleagues (R. P., P. W., S. L.,L. M.).
The mean values for adipose cell size in the seven pa-tients of this study are below those reported by Hirschand Knittle using the same technique (1). One possibleexplanation may lie in differences in body weight be-tween the two groups: individuals in the current studyweighing less. Hirsch and Knittle do not provide in-formation on the body weights of their nonobese group.Other differences in technical procedures between thetwo laboratories may play a role in these differences.
The present studies indicate that experimentally in-duced obesity in adult humans is achieved primarily byan increase in adipose cell size without a change in adi-pose cell number. It is well recognized that weight gainand increased adiposity under these conditions are as-sociated with the development of abnormalities of carbo-hydrate and lipid metabolism. The mechanism(s) bywhich this occurs is unknown. Studies currently in prog-ress in these laboratories are examining the role of fac-tors such as dietary intake and physical activity as wellas adipose cell size and insulin sensitivity in the develop-ment of these metabolic abnormalities of obesity (3, 16).
ACKNOWLEDGMENTSThe excellent technical assistance of Miss Marie LaFranceand Mr. William Hamilton is gratefully acknowledged. Re-sidual lung volumes were performed by Dr. J. Keighly, Car-diopulmonary Division, Dartmouth Medical School.
This study was supported by Grant No. AM 13321 andAM 10254 from the Institute of Arthritis and Metabolismof the National Institutes of Health and from Grant No.G-69-5 from the Life Insurance Medical Research Fund.
REFERENCES1. Hirsch, J., and J. L. Knittle. 1970. Cellularity of obese
and nonobese human adipose tissue. Fed. Proc. 29: 1516.
2. Salans, L. B., J. L. Knittle, and J. Hirsch. 1968. Therole of adipose cell size and adipose tissue insulin sensi-tivity in the carbohydrate intolerance of human obesity.J. Clin. Invest. 47: 153.
3. Salans, L., E. Horton, and E. A. Sims. 1970. Influence offat cell size and dietary carbohydrate intake on adiposetissue insulin sensitivity in adult onset obesity. Clin.Res. 18: 463.
4. Sims, E. A. H., R. F. Goldman, C. M. Gluck, E. S.Horton, P. C. Kelleher, and D. W. Rowe. 1968. Ex-perimental obesity in man. Trans. Ass. Amer. Physi-cians Philadelphia. 81: 153.
5. Hirsch, J., J. W. Farquhar, E. H. Ahrens, Jr., M. L.Peterson, and W. Stoffel. 1960. Studies of adipose tissuein man: a microtechnic for sampling and analysis. Amer.J. Clin. Nutr. 8: 499.
6. Hirsch, J., and E. Gallian. 1968. Methods for the de-termination of adipose cell size in man and animals. J.Lipid Res. 9:110.
7. Goldman, R. F., and E. R. Buskirk. 1961. Body volumemeasurement by underwater weighing: description of amethod. In Techniques for Measuring Body Composition.J. Brozek and A. Henschel, editors. National Academyof Science National Research Council, Washington. 78.
8. Katch, F., E. D. Michael, and S. M. Horvath. 1967. Es-timation of body volume by underwater weighing: de-scription of a simple method. J. Appl. Physiol. 23: 811.
9. Meneely, G. R., and N. L. Kaltreider. 1949. The volumeof the lung determined by helium dilution: descriptionof the method and comparison with other procedures.J. Clin. Invest. 28: 129.
10. Dixon, W. J., and F. J. Massey, Jr. 1957. Introductionto Statistical Analysis. McGraw-Hill Book Company,NewYork. 2nd edition. 139.
11. Hirsch, J., and P. W. Han. 1969. Cellularity of ratadipose tissue: effects of growth, starvation and obesity.J. Lipid. Res. 10: 77.
12. Knittle, J. L., and J. Hirsch. 1968. Effect of early nutri-tion on the development of rat epididymal fat pads:cellularity and metabolism. J. Clin. Invest. 47: 2091.
13. Bray, G. A., and T. F. Gallagher, Jr. 1970. Regulatoryobesity in man. Clin. Res. 18: 537.
14. Goldrick, R. B., and G. M. McLoughlin. 1970. Lipolysisand lipogenesis from glucose in human fat cells of dif-ferent sizes: effects of insulin, epinephrine, and theophyl-line. J. Clin. Invest. 49: 1213.
15. Hollenberg, C. H., and A. Vost. 1968. Regulation ofDNA synthesis in fat cells and stromal elements fromrat adipose tisuse. J. Clin. Invest. 47: 2485.
16. Horton, E. S., C. F. Runge, and E. A. H. Sims. 1970.Forearm metabolism in human experimental obesity.J. Clin. Invest. 49: 45a. (Abstr.)
Fat Cell Size and Number in Experimental Obesity 1011