
ACTA Structilia · Acta Structilia. 2018:25(2) Tydskrif vir die fisiese en ....
191
Vol 25 No 2 2018 http://dx.doi.org/10.18820/24150487 Tydskrif vir die fisiese en ontwikkelingswetenskappe Journal for the physical and development sciences ACTA Structilia
Transcript of ACTA Structilia · Acta Structilia. 2018:25(2) Tydskrif vir die fisiese en ....

Vol 25 No 2 2018 http://dx.doi.org/10.18820/24150487
Tydskrif vir die fisiese en ontwikkelingswetenskappe
Journal for the physical and development sciences
ACTA
Structilia

Acta Structilia2018:25(2)Uitgegee deur die Universiteit van die VrystaatBloemfontein9300
ISSN 1023-0564e-ISSN 2415-0487DOI: http://dx.doi.org/10.18820/24150487/as25i22018 KopieregUniversiteit van die VrystaatBloemfontein
Uitleg: SUN MeDIA Bloemfontein
AdresDie RedakteurActa StructiliaInterne Posbus 47Universiteit van die VrystaatPosbus 3399300 BloemfonteinTel +27 51 4012248Faks +27 51 4013324
E-pos: [email protected]
Acta Structilia2018:25(2)Published by the University of the Free StateBloemfontein9300
ISSN 1023-0564e-ISSN 2415-0487DOI: http://dx.doi.org/10.18820/24150487/as25i22018 CopyrightUniversity of the Free StateBloemfontein
Layout: SUN MeDIA Bloemfontein
AddressThe EditorActa StructiliaInternal Post Box 47University of the Free StateP O Box 3399300 BloemfonteinTel +27 51 4012248Fax +27 51 4013324
Email: [email protected]

Acta Structilia2018:25(2)Tydskrif vir die fisiese en ontwikkelingswetenskappe
Acta Structilia is ’n Suid-Afrikaanse geakkrediteerde tydskrif, wat publikasie geleenthede bied vir onafhanklik gerefereerde artikels deur plaaslike en buitelandse navorsers op die terreine van die fisiese en ontwikkelingswetenskappe. Elke gekeurde artikel word as sodanig aangedui. Die redaksie oorweeg Afrikaanse of Engelse artikels oor onderwerpe binne studie velde soos: argitektuur, stads- en streekbeplanning, bourekenkunde, konstruksie- en projekbestuur, bou-ekonomie, ingenieurswese, die eiendomsbedryf en die ontwikkelingsveld rondom gemeenskapsbouprojekte. Acta Structilia verskyn twee keer per jaar onder die vaandel van die Universiteit van die Vrystaat. Die tydskrif word gelewer aan die betrokke navorsingsinstansies, Suider-Afrikaanse universiteite met bogemelde navorsings-departemente, Suid-Afrikaanse navorsingsbiblioteke, geselekteerde buitelandse instansies en intekenaars. Menings en kritiek in die tydskrif is dié van die outeur(s). Publikasie daarvan is nie ’n aanvaarding dat die Redaksie of die Universiteit van die Vrystaat verantwoordelikheid daarvoor aanvaar nie.
Intekengeld:
Suid-Afrika: R100 per kopieInternasionaal: VSA$40 per kopie
Journal for the physical and development sciences
Acta Structilia is a South African accredited journal for independently adjudicated research articles on any topic in the field of the physical and development sciences. Each peer refereed article is indicated as such in the journal. The editorial staff considers articles in English and Afrikaans, written from any responsible point of view on subjects in any applicable field of scholarship, i.e. architecture, urban and regional planning, quantity surveying, construction management and project management, building economy, engineering and property or community development. Acta Structilia is published biannually by the University of the Free State. The journal is forwarded to all relevant research units and universities, Southern African research libraries, selected research institutions and libraries abroad, and to subscribers. Views and opinions expressed in this journal are those of the author(s). Publication thereof does not indicate that the Editorial Staff or the University of the Free State accept responsibility for it.
Subscription fees:
South Africa: R100 per copyInternational: US$40 per copy

Redaksie • Editorial Staff
Redakteur • Editor-in-Chief Prof. K Kajimo-Shakantu (Department of QuantitySurveying and Construction Management, University of the Free State, South Africa)
Adjunkredakteur • Deputy Editors Dr MM Campbell (Department of Town and Regional Planning, University of the Free State, South Africa)
Mr HB Pretorius (Department of Architecture, University of the Free State, South Africa)
Assistentredakteur • Assistant Editor Mrs AE Beukes (Department of Quantity Surveying and Construction Management, University of the Free State, South Africa)
Redaksionele Raad • Editorial board
Dr K Agyekum (Department of Building Technology, Kwame Nkrumah University of Science and Technology, Ghana)Mr T Ayalew (Department of Construction Management, Addis Ababa University, Ethiopia)Prof. G Crafford (Department of Quantity Surveying, Nelson Mandela University, South Africa)Dr G di Castri (Italian Institute of Chartered Engineers, Milan, Italy) Dr A Elkhalifia (Department of Construction Management and Economics, University of Khartoum, Sudan)Dr JA Fapohunda (Department of Construction Management and Quantity Surveying, Cape Peninsula University of Technology, South Africa)Prof. TC Haupt (Faculty of Engineering, Mangosuthu University of Technology, South Africa)Mrs E Hefer (Department of Construction Management and Quantity Surveying, Durban University of Technology, South Africa)Dr R Jimoh (Department of Building, Federal University of Technology, Minna, Nigeria)Mr C Kabuka (Director of Legal, Compliance and Regulatory, IHS Zambia Limited, Zambia)Mr A Kerin (President, Slovenian Project Management Association, Slovenia)Prof. K London (Property Construction & Project Management, RMIT University, Australia)Emer Prof. G McLachlan (Architect, Port Elizabeth, South Africa) Prof. K Michell (Deparment of Construction Economics and Management, University of Cape Town, South Africa)Mr I Moss (Department of Construction Management and Quantity Surveying, Walter Sisulu University of Technology, South Africa)Dr S Mukiibi (Department of Architecture and planning, Makerere University, Uganda)Mr C Musonda (Chairman Sherwood Greene Properties, Zambia)Prof. G Ofori (School of the Built Environment and Architecture, London South Bank University, London, United Kingdom)Mr MA Oladapo (Chief Executive, Murty International Limited, Nigeria)Dr S Ramabodu (QS-online Quantity Surveyors, Bloemfontein, South Africa)Dr I Saidu (Department of Quantity Surveying, Federal University of Technology, Minna, Nigeria)Prof. JJ Smallwood (Department of Construction Management, Nelson Mandela University, South Africa)Dr P Smith (Program Director of Construction project Management in the School of Building at University of Technology Sydney, Australia)Prof. J Tookey (Department of the Built Environment, AUT University, New Zealand)Mr K Trusler (EduTech Director, The Association of South African Quantity Surveyors, South Africa)Mr B van den Heever (Bert van den Heever Quantity Surveyors and Project Managers, South Africa)Prof. C Vosloo (Department of Architecture, University of Johannesburg, South Africa)Prof. BG Zulch (Department of Construction Economics, University of Pretoria, South Africa)

Acta Structilia Jaargang 25 Volume
Nommer 2 Number Desember 2018 December
Inhoud • Contents
Navorsingsartikels • Research articles
Adoption of BIM in the construction Mutonyi Nasila 1 industry in Kenya Chris Cloete
Factors influencing the performance of Kofi Agyekum 39 safety programmes in the Ghanaian Barbara Simons construction industry Yeboah Botchway
Evaluating credit accessibility predictors Olanrewaju Balogun 69 among small and medium contractors in Justus Agumba the South African construction industry Nazeem Ansary
The use and benefits of Quick Response Tashmika Ramdav 94 Codes for construction materials in Nishani Harinarain South Africa
Conversion of industrial wastes into Frank Ikechukwu Aneke 119 marginal construction materials Bankole Awuzie
The impact of the Construction Mandy Malindi 138 Regulations 2014 on a water utility’s John Smallwood projects’ health and safety (H&S) performance in South Africa
Boekresensie • Book review
Built: The hidden stories behind our Pierre Oosthuizen 178 structures by Roma Agrawal
Inligting aan outeurs · Information for authors 180

The South African Council for the Quantity Surveying Profession endorsesActa Structilia
The South African Council for the Quantity Surveying Profession (SACQSP) has simplified the submission and assessment of Continuining Professional Development (CPD) requirements of registered persons. CPD submission now requires disclosure of the number of hours invested meaningfully in activities in two main categories. Category 1 activities are those arranged or presented by or to ‘external’ organisatins such as participation in conferences, congresses, workshops or seminars, presentation of lectures, external examination for academic programmes, publication of articles in journals or magazines, other similar activities. Category 2 activities are less formal ‘internal’ activities such as in-house training or seminars, small group discussions, self-study of journals, magazines, articles on web pages, etc.
To assist registered persons with access to journal articles related to quantity surveying and, more generally, built environment issues, the SACQSP at its meeting in March 2007 adopted a recommendation to endorse the journal, Acta Structilia, which publishes quality, peer-reviewed articles and is accredited by the Department of Education.
Council encourages registered persons to peruse Acta Structilia and similar peer-reviewed journals as one of the alternative options to accumulate CPD credits in Category 2 activities. For a limited period, Council will encourage the circulation of Acta Structilia to registered persons.
Professor RN NkadoPresident
Royal Institution of Chartered Surveyors (RICS) supports Acta Structilia
Royal Institution of Chartered Surveyors (RICS) supports the aims and objectives of Acta Structilia and welcomes the efforts being made to improve our knowledge and understanding of the built environment, particularly in an African context.
1
Navorsingsartikels • Research articles
Mutonyi Nasila
Mr Mutonyi M. Nasila, Department of Construction Economics, University of Pretoria, Private Bag X20, Hatfield, Pretoria, South Africa. Beglin Woods Architects, Kenya, PO Box 22759, Nairobi. Phone: +254 723 872 479, email: <[email protected]>
Chris Cloete
Prof. Chris Cloete, SACSC Chair in Shopping Centre Studies, Department of Construction Economics, University of Pretoria, Private Bag X20, Hatfield, Pretoria, South Africa. Phone: +27 795192717, email: <[email protected]> ORCID: 0000-0002-0800-1679
DOI: http://dx.doi.org/10.18820/24150487/as25i2.1ISSN: 1023-0564e-ISSN: 2415-0487Acta Structilia 2018 25(2): 1-38© Creative Commons With Attribution (CC-BY)
Adoption of Building Information Modelling in the construction industry in Kenya
Peer reviewed and revised
*The authors declared no conflict of interest for the article or title
AbstractThe current implementation of Building Information Modelling (BIM) by construction professionals in the Kenyan construction industry is an area of concern. BIM is increasingly being applied worldwide to improve communication between project stakeholders, visualization of design, detect potential clashes, reduced re design during project implementation, improve design quality, reduce costs, and improve the rate of return for projects. However, the application of BIM in the Kenyan construction industry is still lagging, resulting in poor co-ordination of information among construction project stakeholders. This study deter mines the current state of BIM application, the benefits of BIM application and the BIM application barriers in Kenya. A quantitative research approach was used and data was collected, using an online questionnaire survey from 310 registered construction professionals selected by stratified sampling. The benefits and barriers factors that influence BIM application in Kenya were rated and set as the independent variables with ‘years of experience’ and ‘total completed projects’ as the dependent variables. The data was analysed using the Statistical Package for the Social Sciences (SPSS) version 24. Principal components analysis (PCA) was used to extract the main factors for benefits and barriers of BIM implementation. Chi-square tests were used to determine relation -ships between independent and dependent variables. Improved communication was ranked as the most important BIM benefit, while the high cost of buying and updating soft ware was ranked as the main barrier to the application of BIM. Based on the results of the study, improved design quality is influenced by the number of

Acta Structilia 2018: 25(2)
2
years of experience one has in the building construction industry. The number of projects undertaken by a company using BIM in any capacity has an influence on greater productivity, due to easy retrieval of information. It is recommended that BIM training should be undertaken by software vendors in vocational and tertiary institutions as well as in construction firms. In addition, the government should formulate policies and standards to support the use of BIM. This study adds to the body of knowledge about BIM application in Nairobi, Kenya that is beneficial to developers, architects, engineers, quantity surveyors, project managers, contractors, and facility managers. Keywords: Building information modelling (BIM), BIM adoption, Kenyan construction sector
Abstrak Die huidige toepassing van Bou-Inligting Modellering (BIM) deur professionele konsultante in die konstruksiebedryf in Kenia is ’n bron van kommer. BIM word toenemend wêreldwyd toegepas om kommunikasie tussen projekbelanghebbendes te verbeter, ontwerpe te visualiseer, potensiële botsings te identifiseer, herontwerp tydens projekimplementering te verminder, ontwerpkwaliteit te verbeter, koste te verminder en die opbrengskoers van projekte te verhoog. Die stadige aanvaarding van BIM in die konstruksie bedryf in Kenia het swak koördinasie van inligting tussen betrokkenes in konstruksie-projekte tot gevolg. Hierdie studie ondersoek die huidige stand van BIM-toepassing, voordele van BIM-toepassing en BIM-toepassinghindernisse in Kenia. ’n Kwantitatiewe navorsingsbenadering is gebruik en data is ingesamel, met behulp van ’n aanlyn-vraelysopname van 310 geregistreerde konstruksie-werknemers wat gekies is deur gestratifiseerde steekproefneming. Die voordele en hindernisse wat BIM-toepassing in Kenia beïnvloed, is gemeet en gestel as die onafhanklike veranderlikes met ‘jare ondervinding’ en ‘totale voltooide projekte’ as die afhanklike veranderlikes. Die data is geanaliseer met behulp van die Statistiese Pakket vir die Sosiale Wetenskappe (SPSS) weergawe 24. Principal component analysis (PCA) is gebruik om die beangrikste faktore vir voordele en hindernisse van BIM-implementering te bepaal. Chi-square toetse is gebruik om verhoudings tussen onafhanklike en afhanklike veranderlikes te bepaal. Verbeterde kommunikasie is as die belangrikste voordeel van BIM beskou, terwyl die hoë koste van die aankoop en opdatering van sagteware as die belangrikste hindernisse tot BIM-toepassing beskou is. Volgens bevindinge word die verbeterde ontwerpkwaliteit beïnvloed deur die aantal jare ondervinding in die boukonstruksiebedryf. Die aantal projekte wat deur ’n maatskappy onderneem word met BIM in enige hoedanigheid beïnvloed groter produktiwiteit as gevolg van maklike herwinning van inligting. Daar word aanbeveel dat BIM-opleiding deur sagtewareleweransiers onderneem word in beroeps- en tersiêre instellings en konstruksiemaatskappye. Daarbenewens moet die regering beleide en standaarde formuleer om die gebruik van BIM te ondersteun. Die studie dra by tot die korpus van kennis oor die toepassing van BIM in Nairobi, Kenia, en behoort van waarde te wees vir ontwikkelaars, argitekte, ingenieurs, bourekenaars, projekbestuurders, kontrakteurs, en fasiliteitsbestuurders.Sleutelwoorde: Bou-Inligtingsmodellering (BIM), aanvaarding van BIM, Keniaanse konstruksiebedryf

Nasila & Cloete • Adoption of Building Information ...
3
1. IntroductionThe construction sector is one of the key drivers of economic growth in Kenya, accounting for 7% of the gross national product (Turner & Townsend, 2017). Despite its critical role in the Kenyan economy, the construction sector is faced with various challenges that have decreased the productivity and the rate of return on investments. Among the most important challenges is the poor collaboration of information among stakeholders. This has led to increased wastage, cost overruns, rework, time overruns, and miscommunication among project stakeholders (Balah & Akut, 2015: 60). The old-fashioned two-dimensional (2D) approach to execute projects in the built environment industry impedes the efficient exchange of data among all stakeholders which occurs in all stages of the project development, namely from concept to construction and eventually to the management of the facility that is in operation (Rohena, 2011). The introduction of Building Information Modelling (BIM) in the construction industry brought about new ways of conceiving, designing, constructing, and operating new buildings (Azhar, Khalfan & Jaqsood, 2012: 15).
BIM is extensively used worldwide to design a visual presentation of the building process used to enhance the exchange of information among construction professionals (architects, engineers, quantity surveyors, and project managers) in digital format (Eastman, Teicholtz, Sacks & Sacks, 2008; Silva, Salvado, Couto & Vale e Azevedo, 2016: 476). Martínez-Rojas, Durán-Álvarez, Martínez-Aires & López-Alonso (2015) emphasize three major types of digital data involved in BIM: the three-dimensional modelling of a building (geometric), a description of the properties of the components (semantic), and details of the interrelationships between properties and components (topological).
Appropriate application of BIM by construction professionals (architects, engineers, project managers, and facility managers) allows for benefits relating to five main aspects, namely design, scheduling, documentation, budgeting, and communication (Azhar et al., 2012). However, application of BIM is also subject to several obstacles, including (in order of importance) the high cost of execution, lack of awareness about the utilization of BIM, absence of government support for its application, absence of training facilities, deficient research and innovation, and absence of laws and policies mandating its use (Adebimpe & Etiene, 2016: 232).
BIM is a relatively new concept in Kenya and the adoption and implementation thereof is slow, because Kenya has different

Acta Structilia 2018: 25(2)
4
regulation bodies for the different sections of the building industry. These professionals’ bodies are the Board of Registration of Architects and Quantity Surveyors (BORAQS), the Engineers’ Board of Kenya (EBK), and the Institute of Construction Project Managers in Kenya (ICPMK). The anticipated audience for BIM is, therefore, fragmented and lacking a united focus to adopt and implement BIM in large-scale and complex building projects (Njue & Musyimi, 2017: 86).
Communication failures between the design and construction teams, due to fragmented information, is an area of concern and highlights the need to determine the views of these professionals on the status of implementation of BIM in the Kenyan construction industry, as well as its benefits and impediments to its implementation.
2. Literature review
2.1 Building information modelling concept
Every single developing meaning of BIM depicts its transformative abilities and effect on the Architecture, Engineering, and Construction (AEC) industry and, very recently, on facility management (Kassem, Iqbal, Kelly et al., 2014: 127). BIM is not a new idea; early investigations were done on BIM since the 1970s. For instance, the use of personal computers (PCs) as opposed to representations in building design was contemplated as early as 1970 (Matarneh & Hamed, 2017b: 326). Eastman, Teicholz, Sacks and Liston (2011) considered BIM as “…the key medium to plan critical thinking, coordination and for correspondence”. Since then, several studies have been carried out on the application of integrated computer technologies in design and construction management (Matarneh & Hamed, 2017b: 327).
Eastman et al. (2008) note that, due to BIM innovation, a precise virtual model of a building is developed carefully and, once finalized, the computer-produced model contains the exact geometry and important information expected to help in the design, manufacture, and procurement of an actual building. BIM is not only a technology, but also a process. The technology part of BIM enables stakeholders to picture at an early stage any opportunities in the design, construction or functional issues, while the process segment allows for close cooperation and integration of roles played by all members of the design and construction team (Azhar et al., 2012).
The BIM concept is based primarily on the reconciliation of procedures, upheld by an information-rich 3D display that permits one to clearly follow the entire life cycle of the project (Sampaio,
Nasila & Cloete • Adoption of Building Information ...
5
2017: 195). In addition, all factors considered, it is expected that the entire procedure is more direct and simpler in exchange of data among all stakeholders, in developing the design, and later in the administration of the building. The collaborative feature in BIM plays a vital role in all aspects of construction and project management, including design, scheduling, estimating, resource allocation, supply chain management, an account of deliverables during construction, and structural management (Bhuskade, 2015: 834; Kushwaha, 2016: 102). The ability of BIM to do parametric design and store data about the life cycle of buildings can be used to investigate and regulate energy consumption, initial costs, ongoing costs in a building, as well as the implementation of other sustainable design principles in the construction industry (Anbouhi, Farahza & Ayatollahi, 2016: 99).
Silva et al. (2016) provide a summary of the implementation of BIM in various countries (see also Khosrowshahi & Arayici, 2012; Hadzaman, Takim & Nawawi, 2015; Enshassi & AbUHamra, 2017; Telaga, 2018; Ahuja et al., 2018).
2.1.1 Levels of Building Information Modelling maturity
The essence of categorising BIM into maturity levels from 0 to 3 is to substantiate the types of technical and collaborative working involved at each level and give a comprehensive explanation of the processes, tools, and techniques used (CDBB, 2011: 15-16). The United Kingdom adopted a unique system that describes the credentials of the designers and the design teams by assessing the BIM process applied against a diagram that outlines the four levels of BIM process maturity (Sacks, Gurevich & Shrestha, 2016: 491). The four levels include:
• 0 – CAD: Basic CAD features using only drawings, lines, arcs and text. Unmanaged CAD probably 2D, with paper (or electronic paper) as the most likely data exchange mechanism;
• 1 – ‘Lonely BIM’: Includes some basic 3D elements, beginning of BIM;
• 2 – ‘Collaborative BIM’: Includes the required information, supply chain management, and requires teams to be working together with 3D BIM, however with no obligation for the 4D programme, 5D cost and operation elements to be included within the model, and

Acta Structilia 2018: 25(2)
6
• 3 – ‘Intelligent BIM’: Full integration of the BIM model into the life cycle management of the project.
2.2 Awareness level of Building Information Modelling
Adebimpe and Etiene (2016: 233) as well as Kugbeadjor, Suresh and Renukappa (2015: 540) emphasise that expanding awareness on BIM utilization and its advantages is the first and most vital stride to its implementation, to be done through government intervention, training, and retraining of building sector experts and association of the different expert bodies in the building industry. Although education and training assume a major part in the BIM appropriation process, a noteworthy number of associations are hesitant to invest in BIM, principally because of the cost involved (Kugbeadjor et al., 2015: 533).
Adebimpe and Etiene (2016: 233) caution that expanded awareness in the application of BIM ought to be done by utilising reasonable means and by considering the unique nature of the national construction industry. Important professional bodies, agencies and associations, working together, ought to advise the legislature on the advantages of implementing BIM.
The following recommendations may be made on increasing the awareness of BIM in the construction industry (Matarneh & Hamed, 2017b: 333):
• Government should set standards and codes for BIM industry; • Proper and open standards have a noteworthy part to play
in the achievement of BIM as a development factor. There is a requirement for all-encompassing co-appointment among the business’ partners, including the administration, business, BIM vendors, customers, and instructional associations;
• To address the deficiency of BIM professionals, the industry and scholastic foundations should come together to create syllabuses that are in accordance with improvements in industry practice and techniques, and
• To establish a framework within each firm to guarantee that the professionals hold, really apply and likewise share the information picked up from such BIM projects.
2.3 Application of Building Information Modelling
BIM offers a variety of applications in the construction industry (Shaikh, Raju, Malim, & Jayaraj, 2016: 206). Three-dimensional modelling and rendering can be produced, design drawings and shop drawings

Nasila & Cloete • Adoption of Building Information ...
7
can be generated, and construction standards can be reviewed by examining object parameters, while cost estimates and construction schedules can be applied in renovations, maintenance, and operations to make facility management more efficient (Sarkar & Modi, 2015: 54). In addition, various examinations and simulations can be carried out on the model to enhance the overall performance of any project (Azhar, Nadeem, Mok & Leung, 2008). In summary, BIM projects facilitate efficient administration of construction projects and can be applied in all construction project stages: pre-construction stage, construction stage and post-construction stage (Latiffi, Mohammed, Kasim & Fathi, 2013: 3).
2.3.1 Pre-construction stage
The use of BIM during the pre-construction stage is more visible than during the construction and post-construction stages, considering the executions associated with this stage, for example, design, scheduling and estimating (Latiffi et al., 2013: 3). Sarkar and Modi (2015: 55) conclude that BIM can be applied in the pre-construction phase for conceptual design, sketching, space planning, site inventory, and guaranteeing programme consistency with respect to site-related variables.
2.3.2 Construction stage
Yamazaki, Tabuchi, Kataoka and Shimazaki (2014) note that challen ges in the construction procedure are quickly compre-hended and tackled by reviewing forms generated by BIM during the construction phase. In addition to creative engineering and enhanced construction innovations, basic investigation in the construction procedure, mechanized crash checking innovation, continuous construction simulation, and 3D estimation innovation are keys to productively utilizing BIM during construction (Yamazaki et al., 2014).
2.3.3 Post-construction stage
In the post-construction stage, BIM keeps track of built asset, manages facilities proactively, enables scheduled maintenance, and provides a review of maintenance history (Latiffi et al., 2013: 3). Sarkar and Modi (2015: 55) emphasise that, in this stage, BIM allows facility management to be implemented in relation to renovations, maintenance, operation, cost estimation by investigating the quantities of materials, and construction sequencing to make scheduling more consistent.

Acta Structilia 2018: 25(2)
8
2.4 Benefits of using Building Information Modelling
Application of BIM in the construction industry can help overcome most of the challenges encountered in the process of design and construction relating to the exchange of data between members of the project team. Latiffi et al. (2013: 4) emphasise that the benefits of implementing BIM in construction projects are related to five main aspects: design, scheduling, documentation, budget, and communication.
Generally, BIM technology allows for efficient collaboration of project stakeholders by allowing changes done by members of the design team to be updated in real-time and shared to all project stakeholders (Doumbouya, Gao & Guan, 2016). BIM has the capacity to minimize rework, design errors, omissions, design conflicts, and changes during construction processes (Matarneh & Hamed, 2017b: 332).
Table 1 illustrates BIM applications for all stakeholders in the building construction industry.
Table 1: BIM applications for project stakeholders in the building construction industry
BIM application Owners Designers Contractors Facility managers
Visualization X X X X
Options analysis X X X
Sustainability analysis X X
Quantity surveying X X
Cost estimation X X X
Site logistics X
Phasing and 4D scheduling X X
Constructability analysis X X
Building performance analysis X X X X
Building management X X
Source: AWzhar et al., 2012: 22

Nasila & Cloete • Adoption of Building Information ...
9
In summary, the benefits of adopting BIM and using BIM technology on projects in the construction industry are:
• Reduce rework during construction;• Maximize productivity;• Reduce conflict/changes; • Clash detection;• Enhance collaboration and communication;• Improve visualization;• Improve project documentation; • Enhance design review;• Faster and more effective method;• Improve quality;• Reduced construction time; • Reduce contingencies, and• Reduce construction cost (Azhar et al., 2012: 22; Adebimpe
& Etiene, 2016: 233; Matarneh & Hamed, 2017b: 332; Chan, 2014: 31; Gerges, Austin, Mayouf et al., 2017: 7; Shaikh et al., 2016: 207; Eastman et al., 2008; Silva et al., 2016: 479).
2.5 Barriers to the implementation of Building Information Modelling
The implementation of any innovation technology is confronted with difficulties prior to full implementation (Matarneh & Hamed, 2017a: 189). Like any other innovative technology, several obstacles hamper the implementation of BIM in the building construction industry. Azhar et al. (2012: 25) classify BIM application-related challenges in two broad categories: technology-related challenges and process-related challenges. The following are some of the key technology- and process-related challenges encountered in BIM adoption in the building construction industry:
• Lack of support and incentives from construction policymakers to professionals and experts using BIM;
• Lack of standards and codes for BIM application;• Lack of awareness about BIM, resulting in professionals
comparing BIM to CAD;• Lack of client demand;• Lack of a BIM specialist in the region and majority of non-
expert staff in architectural firms;

Acta Structilia 2018: 25(2)
10
• High costs (software, hardware upgrade, training, and time);• BIM requires radical changes in workflow, practices, and
procedures and, therefore, resistance to change from design and construction firms;
• Too many legal barriers;• Lacking due to exchange and interoperability;• Inadequate BIM application research and development; • Lack of IT infrastructure to successfully implement BIM, and• Professionals in the industry entrenched in the current 2D
drafting practices and the steep learning curve to develop BIM expertise (Adebimpe & Etiene, 2016: 233; Matarneh & Hamed, 2017a: 189; Chan, 2014: 32; Gerges et al., 2017: 9; Shaikh et al., 2016: 207; Eastman et al., 2008; Silva et al., 2016: 479).
The review of the literature on BIM revealed that application of BIM in the construction industry helps overcome most of the challenges encountered in the process of design and construction relating to exchanging data between members of the project team (project owners, designers, contractors, and facility managers). The benefits of implementing BIM in construction projects relate to five main aspects: design, scheduling, documentation, budget, and communication (Azhar et al., 2012; Latiffi et al., 2013: 4).
Despite these benefits, the application of BIM encounters a number of obstacles, including, in order of importance, the high cost of execution; lack of awareness on the utilization of BIM; absence of government support for its application; absence of training facilities to promote its utilization; deficient research and innovation, and absence of laws and policies mandating its utilization (Adebimpe & Etiene, 2016: 232). These barriers have contributed to the low level of BIM application and awareness in the construction industry (Matarneh & Hamed, 2017a: 189; Balah & Akut, 2015).
3. ResearchThe purpose of the research was to determine the current status of implementation of BIM in the Kenyan construction industry, as well as its benefits and impediments to its implementation. A quantitative research design was adopted. This type of design allows for the use of structured questionnaire surveys, enabling researchers to generalise their findings from a sample of a population (Creswell, 2003: 5). In the questionnaire, two constructs (benefits [consisting of 25 measurements] and barriers [consisting of 16 measurements]) were extracted and set respectively as the variables for the benefits

Nasila & Cloete • Adoption of Building Information ...
11
and barriers of BIM application in the Kenyan construction industry (Netemeyer, Bearden & Sharma, 2003). Exploratory factor analysis (EFA) was used to assess these measured variables in terms of their validity and reliability. EFA is a technique that analyses the characteristics of each of the defined BIM benefits and barriers (original variables), in order to reduce it to a common score (smaller number of factors), by examining relationships among these quantitative factors (Pallant, 2013: 192; Yong & Pearce, 2013: 80; Rossoni, Engelbert & Bellegard, 2016: 200). Several factor analysis methods are available, but principle component analysis (PCA) was used, because the Eigenvalues could be extracted, which explains whether the factors tested had or had not a noticeable effect on people’s responses to the variables in the original test (analysed construct) (Rossoni et al., 2016: 201; Yang, Shen & Ho, 2009: 163-164; Pallant, 2013: 192). Inferential analysis was used to establish the degree of association respectively between the number of years and the number of projects undertaken, tested against the application of BIM technology in the Kenyan construction industry (Fisher, 1978).
3.1 Sampling method and size
A combined list of 1 599 members, registered in Kenya, was obtained from official bodies of the Board of Registration of Architects and Quantity Surveyors (BORAQS); the Engineers’ Board of Kenya (EBK) and the Institute of Construction Project Managers in Kenya (ICPMK). The list was stratified between those members involved in architecture (736), quantity surveying (397), engineering (376), and project management (90).
Stratified sampling was used to divide the population in smaller proportional groups, Shi (2015: 3) resulting in a sample size of 310 representing architects (163), quantity surveyors (51), engineers (65), and project managers (31). The advantage of this method is that it narrows the difference between different types of individuals in the sample through classification (Shi, 2015: 3). The sample size for research done in construction-related populations was calculated in accordance with the table recommended by Krejcie & Morgan (1970: 608). From the table, the recommended sample size for a population of 1 000 is 278, and for 10 000, 370. This recommendation validates the sample size of 310 as efficient for the population of 1 599.
3.2 Response rate
Out of the 310 questionnaires sent out, a total of 195 completed questionnaires were returned, resulting in a high response rate of 63%.
Acta Structilia 2018: 25(2)
12
3.3 Data collection
An online structured questionnaire survey was distributed to 310 participants by sharing the questionnaire link (https://freeonlinesurveys.com/s/AfUfnTRr) through text messages and social media platforms such as Facebook, WhatsApp, LinkedIn, Twitter, Google and Yahoo e-mail. The survey was opened on 26 September 2017 and closed on 1 December 2018.
Topics on BIM application used in the questionnaire were extracted from reviews of the literature, resulting in the formulation of a questionnaire divided into four sections. Section one on respondent’s profile elicited personal information on years of experience in the construction industry as well as in the use of BIM, number of projects undertaken using BIM, software based for projects, and the type of tools used for BIM. It also obtained information on the type of employer and the nature of the job of the respondents. Section 2 set four questions on the awareness of BIM, in general, as perceived by the participants. Section 3 set one question on the benefits of BIM, consisting of 25 measures. Section 4 set one question on the barriers of BIM implementation, consisting of 15 measures. The respondents were required to indicate their level of agreement, in practice, with these measures defining the importance of BIM application. The data from these measurements forms the variables used in the EFA, which tested the validity and reliability of the measured factors. To reduce the respondent’s bias, closed-ended questions were preferred for Sections two, three and four (Vicente & Reis, 2010: 260).
3.4 Data analysis and interpretation of findings
The Statistical Package for Social Science (SPSS) version 24 was used to determine the factor analysability of the BIM application variables, using inferential statistics (Pallant, 2013).
Descriptive statistics based on frequencies and percentages was used to measure central tendency and dispersion in order to describe the characteristics of the respondents as well as the current status of BIM application in the construction industry (Naoum, 2007: 103).
To rank the importance of the barriers and benefits of BIM application respectively, the measures on barriers (15) and benefits (25) were rated on a five-point Likert scale. Likert-type or frequency scales use fixed choice response formats and are designed to obtain levels of agreement by measuring attitudes or opinions (Bowling, 1997). The following scale measurement was used regarding mean scores, where 1= least important (≥ 1.00 ≤ and <1.80), 2 = somewhat important

Nasila & Cloete • Adoption of Building Information ...
13
(≥ 1.81 and ≤ 2.60), 3 = neutral (≥ 2.61 and ≤ 3.40), 4 = important (≥3.41 and ≤ 4.20), and 5 = most important (≥4.21 and ≤ 5.00).
Cronbach’s alpha values were extracted to analyse the internal consistency of reliability of the variables in the questions on BIM application (Kolbehdori & Sobhiyah, 2014: 347; Wahab, Ayodele & Moody, 2010: 67). Acceptable values of Cronbach’s alpha would range from 0.70 to 0.95 (Tavakol & Dennick, 2011: 54-55, Garson, 2013: 30). In the current study, a cut-off value of 0.70 was preferred.
To confirm whether the data from the measurements was sufficient for factor analysis (test the validity), the Kaiser-Meyer-Olkin (KMO) test (Lorenzo-Seva, Timmerman & Kiers, 2011) and the Bartlett’s sphericity test (Hair, Black, Babin et al., 2006: 110) were performed. In the KMO test, as the values of the test vary from 0 to 1, values above 0.7 are recommended as being desirable for applying EFA (Hair et al., 2006). A statistically significant Bartlett test (p < 0.05) indicates that sufficient correlations exist between the variables to continue with the factor analysis (Hair et al., 2006: 110; Pallant, 2013: 190).
For factor extraction, Principal Components Analysis (PCA) was used, as this method allows for extracting Eigenvalues where the highest Eigenvalues in the data are, therefore, the principal components in the data, and they are retained to form a set of variables with new names/labels (Rossoni et al., 2016: 102). PCA also allows for running Scree tests to determine the number of factors to retain. For this study, all components extracted that are above the initial Eigenvalue of 1 are retained (Kaiser, 1960). Components were chosen according to the correlation between the variables. For something to be labeled as a component (and give a new name), it should have at least 3 representative variables (Tabachnick & Fidell, 2013).
The Pearson’s chi-square (P-value) test for independence was used to determine if there was a relationship between the number of years and the number of projects (dependent variables) undertaken and the application of BIM technology (independent variables) in the Kenyan construction industry.
• Null hypothesis H0: There is no association between the two statements.
• Alternative hypothesis H1: There exists at least some significant association.
The P-value (or the calculated probability) is the probability of the event occurring by chance, if the null hypothesis is true (Kamanga & Stern, 2013: 82). The pairs of variables analysed were limited to

Acta Structilia 2018: 25(2)
14
those with an observed P-value less than 0.100 (p < 0.100) with the significance level of (0.100). All pairs of variables with P-values above 0.100 were not considered and thus not included in this article.
3.5 Limitation of the study
It should be noted that, although the study was not conducted throughout Kenya, all professionals in the construction industry are registered in Nairobi. In addition, the professionals in the sample population are active across the country and hence the data is representative of the whole of Kenya.
3.6 Ethical clearance
The online questionnaire was circulated with an introductory message stating the aim, purpose, and confirmation that all information received will be treated with strict confidentiality and for academic purposes only. Prior to data collection, a formal request in writing to get authorization to collect data from construction professionals was done to relevant professional bodies in Kenya.
4. Results and discussionAlthough 195 completed responses were received, only 146 responses were valid for reporting results on the barriers, and 137 responses were valid for reporting the results on the benefits of applying BIM in the construction industry.
4.1 Respondent’s profile
Tables 2 and 3 show the general demographic and work experience data of the respondents. Based on frequency of occurrence, the vast majority of the respondents have 0-2 years’ (45.8%) experience of BIM in the construction industry and (30.7%) have between 6-8 years’ experience. Of the respondents, 47.3 % are consultants and 35.5% work for private clients. The vast majority (52.1%) of the respondents are in the field of architecture. Whereas most of the professionals (42.8%) had undertaken a fairly limited number of projects (less than 5), nearly a third (32.7%) had completed 9 or more projects using BIM. Archicad was used predominantly as software as well as BIM tool.

Nasila & Cloete • Adoption of Building Information ...
15
Table 2: Respondent’s profile on employer and experienceRespondent’s
profile Categories Frequency Percentage Std deviation
Type of employer
Public client 17 10.1
1.586
Private client 60 35.5Contractor 11 6.5Subcontractor 1 .6Consultant 80 47.3Total 169 100.0
Experience in the construction industry
0-2 years 22 13.3
1.221
3-5 years 49 29.56-8 years 51 30.79-11 years 21 12.712 or more 23 13.9Total 166 100.0
Experience in using BIM
0-2 years 77 45.8
1.166
3-5 years 43 25.66-8 years 29 17.39-11 years 10 6.012 or more 9 5.4Total 168 100.0
Table 3: Respondent’s profile on occupation and BIM useRespondent’s
profile Categories Frequency Percentage Std deviation
Nature of present job
Architecture 87 52.1
1.172
Project management 20 12.0
Engineering 33 19.8Quantity surveying 27 16.2Total 167 100.0
Projects undertaken using BIM
0-2 74 44.0
1.3183-5 32 19.06-8 7 4.29 or more 55 32.7Total 168 100.0
Software used for projects
ArchiCAD 96 58.5
0.872Revit 26 15.9AutoCAD 41 25.0Google Sketchup 1 0.6Total 164 100.0
Type of BIM tool used for projects
ArchiCAD 98 60.9
0.843Revit 25 15.5AutoCAD 38 23.6Total 161 100.0

Acta Structilia 2018: 25(2)
16
4.2 Current status of the implementation of Building Information Modelling
Based on the frequency results from Table 3, very few respondents have undertaken projects using BIM. This confirms that the current adoption of BIM is still very low. These findings agree with results obtained by Matarneh & Hamed (2017a: 189), which indicate that the current state of BIM implementation in Jordan is still lagging, since only large AEC organisations (5%) have prompted a serious move towards BIM in certain categories, while 95% of organisations are not using BIM in any capacity.
Table 4 shows the current status of BIM application as perceived by the respondents.
Table 4: Current status of BIM application in the construction industry
Respondent’s profile Categories Frequency Percentage Std deviation
Awareness of BIM and its benefits
Yes 149 88.7
0.408No 15 8.9
Unknown 4 2.4
Total 168 100.0
BIM is the future of project management
Agree 161 95.8
0.379Disagree 1 0.6
Unknown 6 3.6
Total 168 100.0
Stakeholders not clear on the role of BIM in project management
Agree 152 90.5
0.501Disagree 6 3.6
Unknown 10 6.0
Total 168 100.0
Additional training on BIM application is necessary
Agree 167 100
0.000Disagree 0 0
Unknown 0 0
Total 167 100.0
Based on frequencies, results show that most of the stakeholders are not yet clear about the role of BIM in project management and thus require additional training. These findings are also consistent with the results obtained by Abuhamra (2015) and Shaikh et al. (2016: 207), confirming that the level of BIM awareness is low among

Nasila & Cloete • Adoption of Building Information ...
17
construction professionals. Balah and Akut (2015) carried out a similar study in Nigeria and found that only 30% of stakeholders claimed to be aware of BIM, with only 7% of the respondents having a proper understanding of BIM.
4.3 Benefits of implementing Building Information Modelling
Table 5 ranks the mean scores to show which of the 25 variables measuring the benefits when applying BIM applications in construction are considered important by construction professionals.
Table 5: Ranking of benefits using BIM
Kaiser-Meyer-Olkin value = .810Bartlett’s Test of Sphericity = 1,478.553 (p-value is 0.000)
Cronbach-alpha .907
Variable measure benefits of BIM implementation(N=137) (1= least important ….. 5= most important)
Rank Mean Std. deviation
V12 Improved management of projects schedule milestones 12 4.18 .756
V13 Improved design quality 4 4.36 .716
V14 Efficiencies from reuse of data or details (enter once use many) 14 4.14 .778
V15 Enhanced energy efficiency and sustainability of the building 10 4.20 .839
V16 Allowing increased energy analysis of the building 16 4.04 .839
V17 Reduced redesign challenges during project implementation =3 4.39 .825
V18 Fewer change orders at the construction stage 14 4.14 .917
V19 Earlier and more accurate design visualization 2 4.46 .675
V20 Generation of accurate and consistent 2D drawings at any stage 8 4.23 .675
V21 Improved site analysis =20 3.82 .972
V22 Improved communication between project parties 1 4.47 .718
V23 Improved communication among various divisions of the same company 7 4.29 .749
V24 Improved project information management =3 4.39 .634
V25 Potentially improved whole life asset management 17 4.01 .840

Acta Structilia 2018: 25(2)
18
Kaiser-Meyer-Olkin value = .810Bartlett’s Test of Sphericity = 1,478.553 (p-value is 0.000)
Cronbach-alpha .907
Variable measure benefits of BIM implementation(N=137) (1= least important ….. 5= most important)
Rank Mean Std. deviation
V26 Enhanced management of security and safety information =20 3.82 .865
V27 Improved maintenance due to Building Automation System 15 4.07 .763
V28 Enhanced project information collaboration among stakeholders 6 4.30 .679
V29 Potentially improved maintenance of the facility, due to the as-built model 13 4.16 .797
V30 Enhanced work coordination with subcontractors/supply chain 10 4.20 .784
V31 Allowing accurate site logistics plans 18 3.98 .870
V32 Improved coordination in the construction phase 5 4.34 .701
V33 Greater predictability of project time and cost =9 4.22 .846
V34 Greater productivity, due to easy retrieval of information =9 4.22 .694
V35 Improved conflicts detection 11 4.19 .896
V36 Improved human resources management 21 3.81 .912
The respondents indicated the most important benefits of applying BIM in the construction industry in Kenya, with mean score ratings above >4.21 as: improve communication (4.47); accurate design visualization (4.46); improve project information management (4.39); reduce redesign challenges during project implementation (4.39); improve design quality (4.36), improve coordination in the construction phase (4.34); enhance project information collaboration among stakeholders (4.30); improve communication among various divisions of the same company (4.29); generation of accurate and consistent 2D drawings at any stage (4.23); greater predictability of project time and cost (4.22), and greater productivity, due to easy retrieval of information (4.22).
The Cronbach alpha was greater than 0.70 at .907, indicating acceptable internal reliability as recommended by Hair et al. (2006: 102). The Kaiser-Meyer-Olkin (KMO) measure was .810, indicating that the data were sufficient for factor analysis. The Bartlett’s Test of Sphericity (p=0.00) with significance of p<0.05 showed that there is some relationship between the variables. These results suggest that the data on the benefits of BIM can be used for factor analysis.

Nasila & Cloete • Adoption of Building Information ...
19
4.3.1 Factor analysis of Building Information Modelling benefits
The 25 benefits variables were subjected to component analysis in order to study the trend of inter-correlations between variables and to group these variables with similar characteristics into a set of reduced variables according to the hidden components in the collected data. The results report the component extraction, Eigenvalues, correlation and interpretation.
In Figure 1, the scree plot consists of the Eigenvalues and the data points above the break (point of inflexion), which are the components that are meaningful to retain. Using a cut-off value of initial Eigenvalues greater than one (>1.0), there were 7 components that explain a cumulative variance of 66.07%.
Figure 1: Scree plot for factors of BIM benefits
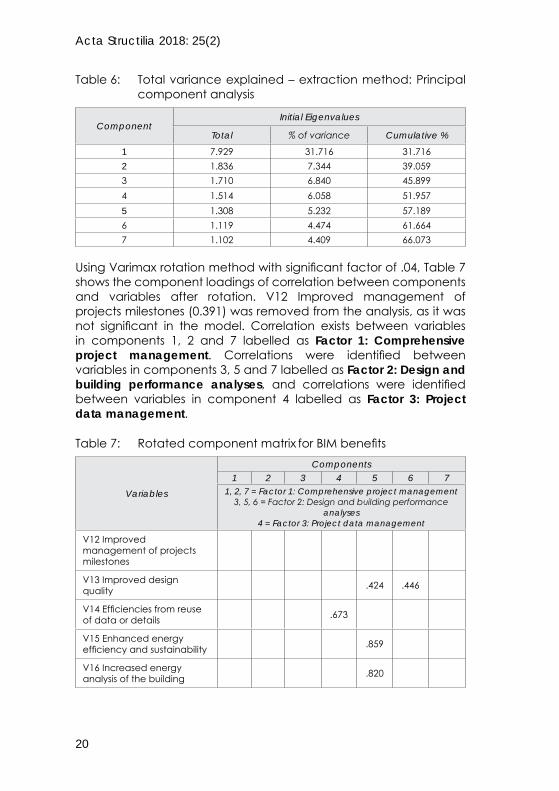
The scree plot confirms the finding of retaining seven components. As a result, components from eight to twenty-five are not significant and thus not included for analysis. Table 6 shows the seven components that are meaningful to retain, where component 1 explains 31.716% of the total variance; component 2, 7.344%; component 3, 6.840%; component 4, 6.058%; component 5, 5.232%; component 6, 4.474%, and component 7, 4.409%.
Acta Structilia 2018: 25(2)
20
Table 6: Total variance explained – extraction method: Principal component analysis
ComponentInitial Eigenvalues
Total % of variance Cumulative %
1 7.929 31.716 31.7162 1.836 7.344 39.0593 1.710 6.840 45.8994 1.514 6.058 51.9575 1.308 5.232 57.1896 1.119 4.474 61.6647 1.102 4.409 66.073
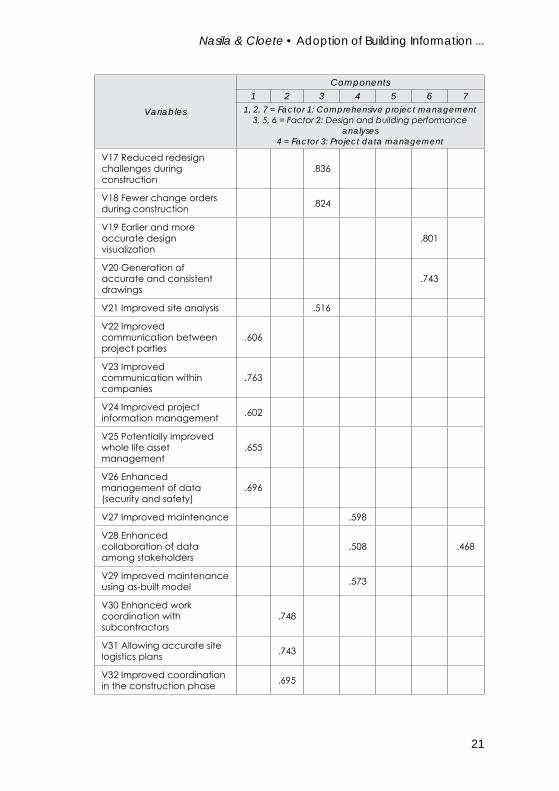
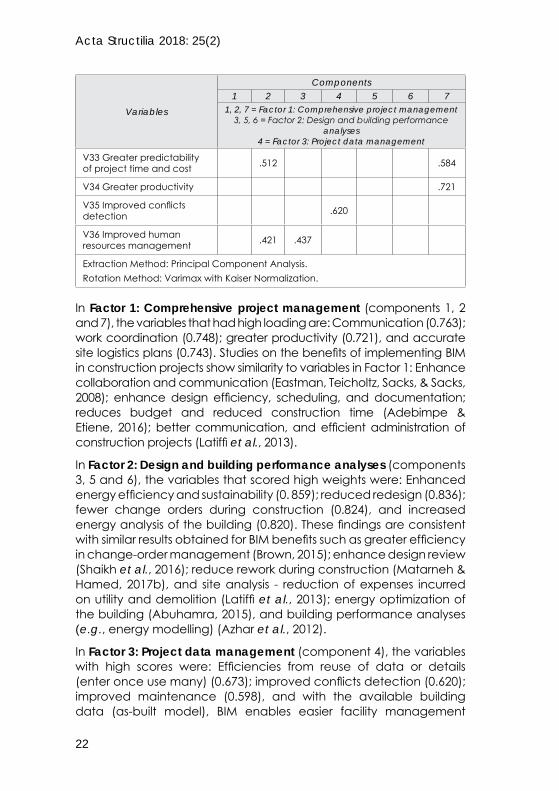
Using Varimax rotation method with significant factor of .04, Table 7 shows the component loadings of correlation between components and variables after rotation. V12 Improved management of projects milestones (0.391) was removed from the analysis, as it was not significant in the model. Correlation exists between variables in components 1, 2 and 7 labelled as Factor 1: Comprehensive project management. Correlations were identified between variables in components 3, 5 and 7 labelled as Factor 2: Design and building performance analyses, and correlations were identified between variables in component 4 labelled as Factor 3: Project data management.
Table 7: Rotated component matrix for BIM benefits
Variables
Components1 2 3 4 5 6 7
1, 2, 7 = Factor 1: Comprehensive project management3, 5, 6 = Factor 2: Design and building performance
analyses4 = Factor 3: Project data management
V12 Improved management of projects milestones
V13 Improved design quality .424 .446
V14 Efficiencies from reuse of data or details .673
V15 Enhanced energy efficiency and sustainability .859
V16 Increased energy analysis of the building .820
Nasila & Cloete • Adoption of Building Information ...
21
Variables
Components1 2 3 4 5 6 7
1, 2, 7 = Factor 1: Comprehensive project management3, 5, 6 = Factor 2: Design and building performance
analyses4 = Factor 3: Project data management
V17 Reduced redesign challenges during construction
.836
V18 Fewer change orders during construction .824
V19 Earlier and more accurate design visualization
.801
V20 Generation of accurate and consistent drawings
.743
V21 Improved site analysis .516
V22 Improved communication between project parties
.606
V23 Improved communication within companies
.763
V24 Improved project information management .602
V25 Potentially improved whole life asset management
.655
V26 Enhanced management of data (security and safety)
.696
V27 Improved maintenance .598
V28 Enhanced collaboration of data among stakeholders
.508 .468
V29 Improved maintenance using as-built model .573
V30 Enhanced work coordination with subcontractors
.748
V31 Allowing accurate site logistics plans .743
V32 Improved coordination in the construction phase .695
Acta Structilia 2018: 25(2)
22
Variables
Components1 2 3 4 5 6 7
1, 2, 7 = Factor 1: Comprehensive project management3, 5, 6 = Factor 2: Design and building performance
analyses4 = Factor 3: Project data management
V33 Greater predictability of project time and cost .512 .584
V34 Greater productivity .721
V35 Improved conflicts detection .620
V36 Improved human resources management .421 .437
Extraction Method: Principal Component Analysis. Rotation Method: Varimax with Kaiser Normalization.
In Factor 1: Comprehensive project management (components 1, 2 and 7), the variables that had high loading are: Communication (0.763); work coordination (0.748); greater productivity (0.721), and accurate site logistics plans (0.743). Studies on the benefits of implementing BIM in construction projects show similarity to variables in Factor 1: Enhance collaboration and communication (Eastman, Teicholtz, Sacks, & Sacks, 2008); enhance design efficiency, scheduling, and documentation; reduces budget and reduced construction time (Adebimpe & Etiene, 2016); better communication, and efficient administration of construction projects (Latiffi et al., 2013).
In Factor 2: Design and building performance analyses (components 3, 5 and 6), the variables that scored high weights were: Enhanced energy efficiency and sustainability (0. 859); reduced redesign (0.836); fewer change orders during construction (0.824), and increased energy analysis of the building (0.820). These findings are consistent with similar results obtained for BIM benefits such as greater efficiency in change-order management (Brown, 2015); enhance design review (Shaikh et al., 2016); reduce rework during construction (Matarneh & Hamed, 2017b), and site analysis - reduction of expenses incurred on utility and demolition (Latiffi et al., 2013); energy optimization of the building (Abuhamra, 2015), and building performance analyses (e.g., energy modelling) (Azhar et al., 2012).
In Factor 3: Project data management (component 4), the variables with high scores were: Efficiencies from reuse of data or details (enter once use many) (0.673); improved conflicts detection (0.620); improved maintenance (0.598), and with the available building data (as-built model), BIM enables easier facility management

Nasila & Cloete • Adoption of Building Information ...
23
(0.573). This finding agrees with similar studies that identified BIM benefits such as BIM enhances collaboration and communication among stakeholders (Eastman, Teicholtz, Sacks & Sacks, 2008); clash detection (Shaikh et al., 2016), and BIM allows for easier facility maintenance, due to existing building data (Ahn & Cha, 2014).
4.4 Barriers in the implementation of Building Information Modelling
Table 8 ranks the mean scores to show which of the 15 variables measuring the barriers when applying BIM applications in construction are considered important by construction professionals.
Table 8: Ranking of barriers in implementing BIM
Kaiser-Meyer-Olkin value = .829
Bartlett’s Test of Sphericity = 734.417 (p-value is 0.000)
Cronbach-alpha 0.856
Variable measure barriers of BIM application(N=146) (1 = least important …..5 = most
important)Rank Mean Std. deviation
V37 High cost of buying and updating software 1 4.32 .909
V38 Lack of awareness of BIM by stakeholders 4 4.10 .938
V39 Lack of knowledge of BIM application by stakeholders =5 4.08 .903
V40 Lack of awareness of benefits of BIM by stakeholders 8 3.95 .985
V41 Lack of government regulations to support implementation of BIM 12 3.60 1.218
V42 Lack of training at the university and colleges on BIM application 3 4.16 1.044
V43 Poor collaboration of BIM information among stakeholders 7 4.01 .887
V44 Resistance to adopt new technology due to change in workflow system in companies
6 4.06 .948
V45 Inadequate finance in small firms to start new workflow system for BIM 2 4.18 .902
V46 Lack of government regulations to support implementation of BIM 14 3.49 1.188
V47 Lack of demand and interest from the clients on the application of BIM in the design and construction of projects
13 3.55 1.192
Acta Structilia 2018: 25(2)
24
Kaiser-Meyer-Olkin value = .829
Bartlett’s Test of Sphericity = 734.417 (p-value is 0.000)
Cronbach-alpha 0.856
Variable measure barriers of BIM application(N=146) (1 = least important …..5 = most
important)Rank Mean Std. deviation
V48 Lack of case studies in Nairobi, Kenya that have implemented BIM and realised positive investment returns
11 3.65 1.124
V49 Lack of training for architects and engineers, due to costly training requirements in terms of time and money
=5 4.08 .851
V50 Uncertainties over interoperability of BIM software with other software 10 3.68 .995
V51 Lack of BIM standards 9 3.75 1.062
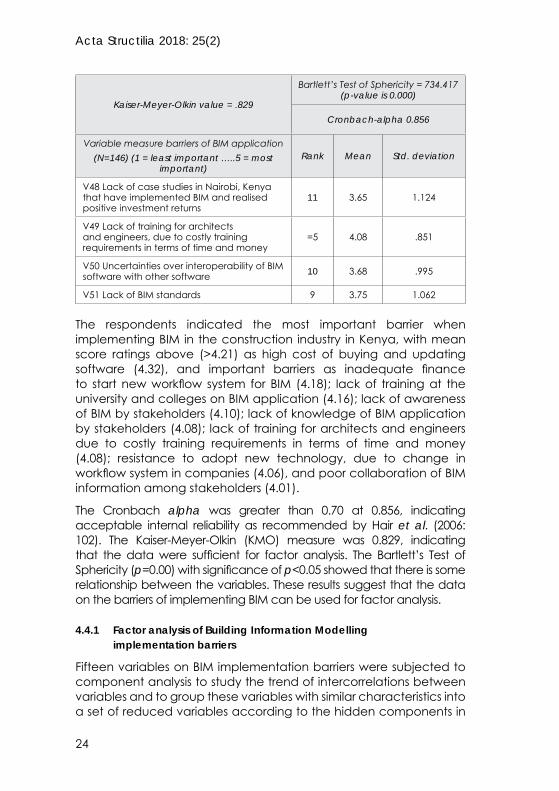
The respondents indicated the most important barrier when implementing BIM in the construction industry in Kenya, with mean score ratings above (>4.21) as high cost of buying and updating software (4.32), and important barriers as inadequate finance to start new workflow system for BIM (4.18); lack of training at the university and colleges on BIM application (4.16); lack of awareness of BIM by stakeholders (4.10); lack of knowledge of BIM application by stakeholders (4.08); lack of training for architects and engineers due to costly training requirements in terms of time and money (4.08); resistance to adopt new technology, due to change in workflow system in companies (4.06), and poor collaboration of BIM information among stakeholders (4.01).
The Cronbach alpha was greater than 0.70 at 0.856, indicating acceptable internal reliability as recommended by Hair et al. (2006: 102). The Kaiser-Meyer-Olkin (KMO) measure was 0.829, indicating that the data were sufficient for factor analysis. The Bartlett’s Test of Sphericity (p=0.00) with significance of p<0.05 showed that there is some relationship between the variables. These results suggest that the data on the barriers of implementing BIM can be used for factor analysis.
4.4.1 Factor analysis of Building Information Modelling implementation barriers
Fifteen variables on BIM implementation barriers were subjected to component analysis to study the trend of intercorrelations between variables and to group these variables with similar characteristics into a set of reduced variables according to the hidden components in

Nasila & Cloete • Adoption of Building Information ...
25
the collected data. The results report the component extraction, Eigenvalues, correlation, and interpretation.
In Figure 2, the scree plot consists of the Eigenvalues and the data points above the break (point of inflection), which are the components that are meaningful to retain. Using a cut-off value of initial Eigenvalues greater than one (>1.0), three components explain a cumulative variance of 53.16%.
Figure 2: Scree plot for factors for BIM application barriers
The scree plot confirms the finding of retaining three components. As a result, components from four up to fifteen are not significant and thus not included for analysis. Table 9 shows the three components that are meaningful to retain, where component 1 explains 34.695% of the total variance; component 2 explains 9.386%, and component three explains 9.088% of the variance.

Acta Structilia 2018: 25(2)
26
Table 9: Total variance explained: Extraction method (principal component analysis)
ComponentInitial Eigenvalues
Total % of variance Cumulative %
1 5.204 34.695 34.695
2 1.408 9.386 44.081
3 1.363 9.088 53.169
Using Varimax rotation method with significant factor of .04, Table 10 shows the component loadings of correlation between components and variables after rotation. Correlation exists between variables in component 1 labelled as Factor 1: High cost of buying software and lack of training. Correlations were identified between variables in components 2 labelled as Factor 2: Lack of BIM standards and regulations, and correlations were identified between variables in component 3 labelled as Factor 3: Lack of BIM awareness and inadequate finance.
Table 10: Rotated component matrixa for BIM application barriers
Variables
Components
1 2 3
Factor 1: High cost of buying software
and lack of training
Factor 2: Lack of BIM standards
and regulations
Factor 3: Lack of BIM awareness
and inadequate
finance
V37 High cost of buying and updating software .606
V38 Lack of awareness of BIM by stakeholders .648
V39 Lack of knowledge of BIM application by stakeholders .793
V40 Lack of awareness of benefits of BIM by stakeholders .545
V41 Lack of government regulations to support implementation of BIM .876
V42 Lack of training at the university and colleges on BIM application .504
V43 Poor collaboration of BIM information among stakeholders .604

Nasila & Cloete • Adoption of Building Information ...
27
Variables
Components
1 2 3
Factor 1: High cost of buying software
and lack of training
Factor 2: Lack of BIM standards
and regulations
Factor 3: Lack of BIM awareness
and inadequate
finance
V44 Resistance to adopt new technology, due to change in workflow system within companies
.674
V45 Inadequate finance in small firms to start new workflow system for BIM
.689
V46 Lack of government regulations to support implementation of BIM .861
V47 Lack of demand and interest from the clients on the application of BIM in the design and construction of projects
.546
V48 Lack of case studies in Nairobi, Kenya that have implemented BIM and realised positive investment returns
.489 .464
V49 Lack of training for architects and engineers, due to costly training requirements in terms of time and money
.615
V50 Uncertainties over interoperability of BIM software with other software
.631
V51 Lack of BIM standards .454
Extraction method: Principal Component AnalysisRotation method: Varimax with Kaiser Normalization
a. Rotation converged in 4 iterations.
In Factor 1: High cost of buying software and lack of training (component 1), the variables that had high loading were inadequate finance in small firms to start new workflow system for BIM (0.689); resistance to adopt new technology, due to change in workflow system within companies (0.674); uncertainties over interoperability of BIM software with other software (0. 631), and lack of training for architects and engineers, due to costly training requirements in terms of time and money (0. 615). Studies on the barriers of implementing BIM in construction projects show similarity to variables in Factor 1: Lack of awareness about BIM resulting in professionals comparing
Acta Structilia 2018: 25(2)
28
BIM to CAD (Gerges et al., 2017); high costs (software, hardware upgrade, training, and time) (Shaikh et al., 2016), and the majority of service providers are not actively using BIM technologies on their projects due to increased costs (Eastman et al., 2008).
In Factor 2: Lack of BIM standards and regulations (component 2), the variables that scored high weights were lack of government regulations to support implementation of BIM (0.861), and lack of government regulations to support implementation of BIM (0.861). These findings concur with results obtained from similar studies such as lack of standards and codes for BIM application (Chan, 2014), and absence of government support (Matarneh & Hamed, 2017b). In their study, Matarneh & Hamed (2017a) recommend that governments should set standards and codes for BIM industry at both the hierarchical and undertaking store network level.
In Factor 3: Lack of BIM awareness and inadequate finance (component 3), the variables with high scores were lack of knowledge of BIM application by stakeholders (0.793); lack of awareness of BIM by stakeholders (0.648), and high cost of buying and updating software (0.606). These findings concur with results from other studies on BIM awareness. Abuhamra (2015) and Shaikh (2016) confirm that the level of BIM awareness is low among the construction professionals in Gaza strip and Mumbai (India), respectively. Balah and Akut (2015) state that only 30% of stakeholders in Nigeria were knowledgeable of BIM, with only 7% of the respondents having a proper understanding of the concept of BIM. These findings confirm that the level of BIM awareness is still very low in the Nigerian construction industry.
4.5 Inferential analysis
The main objective of this analysis was to establish the degree of association between the number of years and the number of projects undertaken by AEC professions and some of the application of BIM technology by constructing two hypotheses (null and alternative). The hypotheses will be stated as follows:
• Null hypothesis H0: There is no association between the two statements.
• Alternative hypothesis H1: There exists at least some significant association.
For purposes of this article, only the pairs of variables with Asymptotic Significance (2-sided) (P-values) below 0.100 (p < 0.100) were considered, because it shows that the null hypothesis is rejected and that the association between two variables is statistically significant.
Nasila & Cloete • Adoption of Building Information ...
29
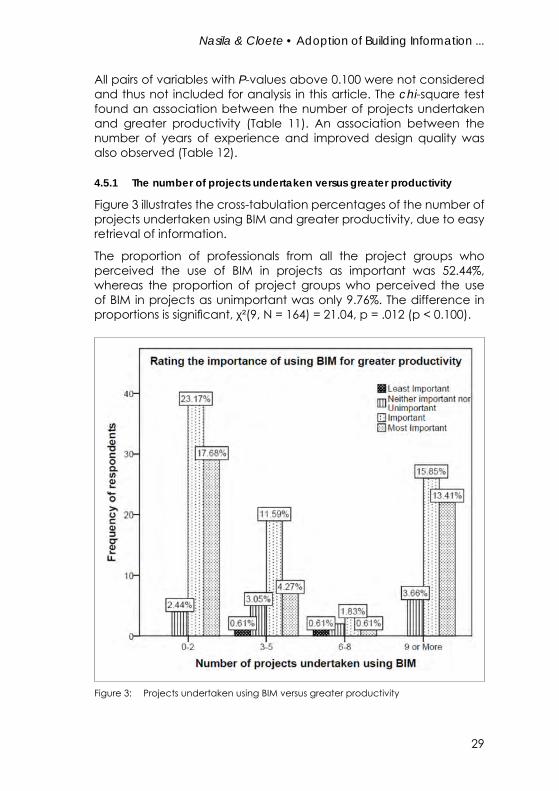
All pairs of variables with P-values above 0.100 were not considered and thus not included for analysis in this article. The chi-square test found an association between the number of projects undertaken and greater productivity (Table 11). An association between the number of years of experience and improved design quality was also observed (Table 12).
4.5.1 The number of projects undertaken versus greater productivity
Figure 3 illustrates the cross-tabulation percentages of the number of projects undertaken using BIM and greater productivity, due to easy retrieval of information.
The proportion of professionals from all the project groups who perceived the use of BIM in projects as important was 52.44%, whereas the proportion of project groups who perceived the use of BIM in projects as unimportant was only 9.76%. The difference in proportions is significant, χ²(9, N = 164) = 21.04, p = .012 (p < 0.100).
Figure 3: Projects undertaken using BIM versus greater productivity

Acta Structilia 2018: 25(2)
30
Table 11 shows the calculated results of the chi-square test of independence comparing the frequency of number of projects undertaken by a company using BIM in achieving greater productivity, due to easy retrieval of information. The chi-square test found an association between the number of projects undertaken and greater productivity, χ2(9, N = 164) = 21.046, p = .012 (p < 0.100).
The observed P-value (0.012) is far less than the level of significance (0.100) and thus the number of projects undertaken by a company using BIM in any capacity has an influence on greater productivity, due to easy retrieval of information.
Table 11: Projects undertaken using BIM versus greater productivity.
Chi-square test Value df Asymptotic significance
Pearson chi-square 21.046a 9 .012
Likelihood ratio 15.565 9 .077
Linear-by-linear association .295 1 .587
N of valid cases 164
a.8 cells (50.0%) have expected count less than 5. The minimum expected count is .09
4.5.2 Number of years of experience versus improved design quality
Figure 4 illustrates the cross-tabulation percentages of the number of years of experience in the construction industry and improved design quality. The proportion of professionals from all the years of experience groups who perceived improved design quality as important was 44.57%, whereas the proportion of all the years of experience groups who perceived improved design quality as unimportant was only 5.41%. The difference in proportions is significant, χ2(16, N = 166) = 28.380, p =.028 (p < 0.100)
Table 12 shows the calculated results of the chi-square test of independence comparing the frequency of years of experience in the construction industry in achieving improved design quality. The chi-square test found an association between the number of years of experience and design quality, χ2(16, N = 166) = 28.380, p =.028 (p < 0.100).
The observed P-value (0.0208) is far less than the level of significance (0.100) and thus the null hypothesis is rejected in favour of the alternative hypothesis. Based on the results of the study, improved design quality is influenced by the number of years of experience one has in the building construction industry.

Nasila & Cloete • Adoption of Building Information ...
31
Figure 4: Years of experience versus improved design quality
Table 12: Years of experience versus improved design quality
Chi-square tests Value Df Asymptotic significance
Pearson chi-square 28.380a 16 .028Likelihood ratio 25.782 16 .057Linear-by-linear association .824 1 .364
N of valid cases 166a.8 cells (50.0%) have expected count less than 5. The minimum expected count is .09.
5. Conclusions and recommendations
The study established that the current status of BIM application among professionals in the Kenyan construction industry is still lagging. Based on the results obtained, the vast majority (90.5%) of the respondents agree that construction industry stakeholders are not yet clear about

Acta Structilia 2018: 25(2)
32
the role of BIM in project management. This finding indicates that BIM is still a very new concept in the Kenyan construction industry.
Most of the benefits of BIM application were rated as highly important, with a weighted average score higher than 4.0 (80.0%). Among all indicators, improved communication between project parties with a mean of 4.47 (89.4%) had the highest rating and hence, was regarded as the most important indicator. Correlation of BIM benefit variables using factor analysis identified factors 1, 2 and 7 as ‘Comprehensive project management’, factors 3, 5, and 6 as ‘Design and building performance analyses’, and factor 4 as ‘Project data management’.
The majority of the BIM application barriers were rated as highly important, with a weighted average score higher than 4.0 (80%). Among all indicators, the high cost of buying and updating software with a mean of 4.32 (86.4%) had the highest rating and hence, the most important indicator. Correlation of BIM application barrier variables using factor analysis identified factor 1 as ‘High cost of buying software and lack of training”’, factor 2 as ‘Lack of BIM standards and regulations’, and factor 3 as ‘Lack of BIM awareness and inadequate finances’.
Based on inferential analysis, the results indicate that the number of projects undertaken using BIM has a considerable influence on greater productivity, due to easy retrieval of information. In addition, improved design quality is influenced by the number of years of experience one has in the building construction industry.
It is recommended that construction firms explore available subscriptions for BIM products that allow a more flexible way to purchase the software through affordable instalments (monthly, quarterly, or annual subscription fee). Tertiary institutions and small firms should also sign up for free versions of BIM software. In addition, BIM training by software vendors should be undertaken in vocational and tertiary institutions as well as construction firms. The government should also formulate policies, BIM standards and regulations to support BIM implementation by introducing state incentives such as tax credit for clients, professionals and contractors using BIM in their projects. This will enhance the application of BIM in the Kenyan construction industry.

Nasila & Cloete • Adoption of Building Information ...
33
ReferencesAbuHamra, L.A.A. 2015. An investigation into building information modeling (BIM) application in architecture, engineering and construction (AEC) industry in Gaza Strip, Gaza: Islamic University of Gaza. [online] Available at: <http://library.iugaza.edu.ps/thesis/116796.pdf> [Accessed: 29 June 2017].
Adebimpe, O. & Etiene, M. 2016. Assessment of the level of awareness and limitations on the use of building information modelling in Lagos State Akerele. International Journal of Scientific and Research Publications, 6(2), pp. 229-234.
Ahn, D. & Cha, H. 2014. Integration of building maintenance data in application of Building Information Modeling (BIM). Journal of Building Construction and Planning Research, 2(2), pp. 166-172. DOI:10.4236/jbcpr.2014.22015.
Ahuja, R., Sawhney, A., Jain, M., Arif, M. & Rakshit, S. 2018. Factors influencing BIM adoption in emerging markets – the case of India. International Journal of Construction Management, DOI: 10.1080/15623599.2018.1462445.
Anbouhi, M.H., Farahza, N. & Ayatollahi, S.M. 2016. Analysis of thermal behavior of materials in the building envelope using building information modeling (BIM) – A case study approach. Open Journal of Energy Efficiency, 5(3), pp. 88-106. https://doi.org/10.4236/ojee.2016.53009
Azhar, S., Khalfan, M. & Maqsood, T. 2012. Building information modelling (BIM): Now and beyond. Australasian Journal of Construction, 12(4), pp. 15-28.
Azhar, S., Nadeem, A., Mok, J.Y.N. & Leung, B.H.Y. 2008. Building information modelling (BIM): A new paradigm for visual interactive modelling and simulation for construction projects. In: Proceedings of the 1st International Conference on Construction in Developing Countries (ICCIDC–I) “Advancing and Integrating Construction Education, Research & Practice”, 4-5 August 2008, Karachi, Pakistan, pp. 435-446.
Balah, R.N.M. & Akut, K.L. 2015. Assessment of building information modelling (BIM) knowledge in the Nigerian construction industry. International Journal of Civil & Environmental Engineering IJCEE-IJENS, 15(6), pp. 60-69.

Acta Structilia 2018: 25(2)
34
Bhuskade, S. 2015. Building information modelling (BIM). International Research Journal of Engineering and Technology (IRJET), 2(2), pp. 834-841.
Bowling, A. 1997. Research methods in health. Buckingham: Open University Press.
Brown, N.C. 2015. BIM benefits for contractors. [online]. Available at: <https://conappguru.com/workflow/bim-benefits-for-contractors/> [Accessed: 29 June 2017].
CDBB (Centre for Digital Built Britain). 2011. A report for the Government construction client group. Building Information Modelling (BIM) working party strategy paper. Cambridge, University of Cambridge: CDBB. [online] Available at: <https://www.cdbb.cam.ac.uk/Resources/ResoucePublications/BISBIMstrategyReport.pdf> [Accessed: 29 June 2017].
Chan, C.T.W. 2014. Barriers of implementing BIM in construction industry from the designers’ perspective: A Hong Kong experience. Journal of System and Management Sciences, 4(2), pp. 24-40.
Creswell, J.W. 2003. Research design, qualitative and quantitative approaches. London: Sage.
Doumbouya, L., Gao, G. & Guan, C. 2016. Adoption of the building information modelling (BIM) for construction project effectiveness: The review of BIM benefits. American Journal of Civil Engineering and Architecture, 4(3), pp. 74-79.
Eastman, C., Teicholz, P., Sacks, R. & Liston, K. 2011. BIM handbook, a guide to building information modelling. Hoboken: John Wiley & Sons, Inc.
Eastman, C., Teicholtz, P., Sacks, R. & Sacks, K. 2008. BIM handbook: A guide to building information modelling for owners, managers, designers, engineers and contactor. Wiley: Hoboken. https://doi.org/10.1002/9780470261309
Enshassi, A. & AbuHamra, L. 2017. Challenges to the utilization of BIM in the Palestinian construction industry. Proceedings of the 34th International Symposium on Automation and Robotics in Construction (ISARC 2017), 28 June-1 July 2017, Taipei, Taiwan, China: International Association for Automation and Robotics in Construction (I.A.A.R.C), pp. 938-944. https://doi.org/10.22260/ISARC2017/0130
Fisher, R.A. 1978. Statistical methods and scientific inference. 3rd edition. London: Collier Macmillan.
Nasila & Cloete • Adoption of Building Information ...
35
Garson, G.D. 2013. Scales and measures. Asheboro, NC: Statistical Associates Publishers.
Gerges, M., Austin, S., Mayouf, M., Ahiakwo, O., Jaeger, M., Saad, A. & Gohary, T-E. 2017. An investigation into the implementation of building information modelling in the Middle East. Journal of Information Technology in Construction (ITcon), 22, pp. 1-15.
Hadzaman, N.A.H., Takim, R. & Nawawi, A.H. 2015. BIM roadmap strategic implementation plan: Lesson learnt from Australia, Singapore and Hong Kong. In: Raidén, A.B. & Aboagye-Nimo, E. (Eds). Proceedings of the 31st Annual ARCOM Conference, 7-9 September 2015, Lincoln, UK, Association of Researchers in Construction Management, pp. 611-620.
Hair, J.F., Black, W.C., Babin, J.B., Andersen, R.E. & Taham, R.I. 2006. Multivariate data analysis. 6th edition. Upper Saddle River, NJ: Pearson/Prentice Hall.
Kaiser, H.F. 1960. The application of electronic computers to factor analysis. Educational and Psychological Measurement, 20, pp. 141-151. https://doi.org/10.1177/001316446002000116
Kamanga, M. & Stern, W. 2013. Causes of delay in road construction projects in Malawi. Journal of the South African Institution of Civil Engineering, 55(3), pp. 79-85.
Kassem, M., Iqbal, N., Kelly, G., Lockley, S. & Dawood, N. 2014. Building information modelling: Protocols for collaborative design processes. Journal of Information Technology in Construction (ITcon), 19, pp. 126-149.
Khosrowshahi, F. & Arayici, Y. 2012. Roadmap for implementation of BIM in the UK construction industry. Engineering, Construction and Architectural Management, 19(6), pp. 610-635. DOI: https://doi.org/10.1108/09699981211277531.
Kolbehdori, S. & Sobhiyah, M.H. 2014. Effect of negotiations about the formation of construction consortium on consortium successful performance in Iran’s construction industry. International Journal of Management, Accounting and Economy, 1(5), pp. 346-349.
Krejcie, R.V. & Morgan, D.W. 1980. Determining sample size for research activities. Educational and Psychological Measurement, 30, pp. 607-610. https://doi.org/10.1177/001316447003000308
Kugbeadjor, W., Suresh, S. & Renukappa, S. 2015. BIM awareness and readiness of postgraduate built environment students in West Midlands universities. Working Paper, pp. 531-543. [online] Available at: <https://pdfs.

Acta Structilia 2018: 25(2)
36
semanticscholar.org/3be8/dff7213c808d575b57e5d0891770859d259e.pdf> [Accessed: 19 March 2017].
Kushwaha, V. 2016. Contribution of building information modelling (BIM) to solve problems in architecture, engineering and construction (AEC) industry and addressing barriers to implementation of BIM. International Research Journal of Engineering and Technology (IRJET), 3(1), pp. 100-105.
Latiffi, A., Mohammed, S., Kasim, N. & Fathi, M.S. 2013. Building information modelling (BIM) application in construction planning. International Journal of Construction Engineering and Management, 2(4A), pp. 1-6.
Lorenzo-Seva, U., Timmerman, M.E. & Kiers, H.A. 2011. The Hull method for selecting the number of common factors. Multivariate Behavioral Research, 46(2), pp. 340-364. https://doi.org/10.1080/00273171.2011.564527
Martínez-Rojas, M., Durán-Álvarez, J., Martínez-Aires, M. & López-Alonso, M. 2015. Analysis of the BIM applications for the architecture, engineering and construction project management: A bibliometric approach. Sibragec-Elagec 2015 De 7 A 9 De Outubro – São Carlos – Sp, 7(9): 504-510. [Online] Available at: <http://www.infohab.org.br/sibraelagec2015/artigos/SIBRAGECELAGEC_2015_submission_111.pdf> [Accessed: 20 August 2017].
Matarneh, R. & Hamed, S. 2017a. Exploring the adoption of building information modelling (BIM) in the Jordanian construction industry. Journal of Architectural Engineering Technology, 6(1), p. 189. DOI: 10.4172/2168-9717.1000189.
Matarneh, R. & Hamed, S. 2017b. Barriers to the adoption of building information modelling in the Jordanian building industry. Open Journal of Civil Engineering, 7, pp. 325-333. DOI: https://doi.org/10.4236/ojce.2017.73022.
Naoum, S. 2007. Dissertation research and writing for construction students. London: Routledge, Taylor & Francis.
Netemeyer, R.G., Bearden, W.O.E. & Sharma, S. 2003. Scaling procedures: Issues and applications. Thousand Oaks, CA: Sage. https://doi.org/10.4135/9781412985772
Njue, P. & Musyimi, M. 2017. Building information modelling in urbanizing Kenya. In: Wang, H. & Ledwon, S. (Eds). Proceedings of the Joint OAPA-ISOCARP Conference/53rd ISOCARP Congress, 24-27 October 2017, Portland, Oregon, USA. USA: ISOCARP, pp. 85-97.

Nasila & Cloete • Adoption of Building Information ...
37
Pallant, J. 2013. SPSS survival manual: A step-by-step guide to data analysis using IBM SPSS. 5th edition. Crows Nest, Australia: Allen and Unwin.
Rohena, R. 2011. Building information modelling (BIM) implementation in naval construction. El Paso, TX: The University of Texas.
Rossoni, L., Engelbert, R. & Bellegard, N.L. 2016. Normal science and its tools: Reviewing the effects of exploratory factor analysis in management. Revista de Administração, 51(2), pp. 198-211. https://doi.org/10.5700/rausp1234
Sacks, R., Gurevich, U. & Shrestha, P. 2016. A review of building information modelling protocols, guides and standards for large construction clients. Journal of Information Technology in Construction (ITcon), 21, pp. 479-503.
Sampaio, A.Z. 2017. BIM as a computer-aided design methodology in civil engineering. Journal of Software Engineering and Applications, 10(2), pp. 194-210. DOI: https://doi.org/10.4236/jsea.2017.102012.
Sarkar, D. & Modi, R. 2015. Applications of building information modelling (BIM) to real estate projects of Ahmedabad. International Advanced Research Journal in Science, Engineering and Technology, 2(9), pp. 54-58.
Shaikh, A.A., Raju, R., Malim, N.L. & Jayaraj, G.K. 2016. Awareness and adoption of BIM in construction industry. International Journal on Recent and Innovation Trends in Computing and Communication, 4(4), pp. 204-208.
Shi, F. 2015. Study on a stratified sampling investigation method for resident travel and the sampling rate. Discrete Dynamics in Nature and Society, Volume 2015, 3/22/2015, pp. 1-7. DOI: http://dx.doi.org/10.1155/2015/496179
Silva, M.J., Salvado, F., Couto, P. & Vale e Azevedo, Á. 2016. Roadmap proposal for implementing building information modelling (BIM) in Portugal. Open Journal of Civil Engineering, 6(3), pp. 475-481. https://doi.org/10.4236/ojce.2016.63040
Tabachnick, B.G. & Fidell, L.S. 2013. Using multivariate statistics. 6th edition. Boston, MA: Allyn & Bacon.
Tavakol, M. & Dennick, R. 2011. Making sense of Cronbach’s alpha. International Journal of Medical Education, 2, pp. 53-55. https://doi.org/10.5116/ijme.4dfb.8dfd

Acta Structilia 2018: 25(2)
38
Telaga, A.S. 2018. A review of BIM (Building Information Modelling) implementation in Indonesia construction industry. In: Proceedings of the 7th AIC-ICMR on Sciences and Engineering, 18-20 October 2017, Banda Aceh, Indonesia, Vol. 352, Paper 012030.
Turner & Townsend. 2017. International construction market survey 2017. s.l.: Turner & Townsend.
Vicente, P. & Reis, E. 2010. Using questionnaire design to fight nonresponse bias in web surveys. Social Science Computer Review, 28(2), pp. 251-267. DOI: 10.1177/0894439309340751.
Wahab, O.M., Ayodele, A.E. & Moody, J.O. 2010. TLC phytochemical screening in some Nigerian Loranthaceae. Journal of Pharmacognosy and Phytotherapy, 2(5), pp. 64-70.
Yamazaki, Y., Tabuchi, T., Kataoka, M. & Shimazaki, D. 2014. 3D/BIM applications to large-scale complex building projects in Japan. International Journal of High-Rise Buildings, 3(4), pp. 311-323.
Yang, J., Shen, Q. & Ho, M. 2009. An overview of previous studies in stakeholder management and its implications for the construction industry. Journal of Facilities Management, 7(2), pp. 159-175. https://doi.org/10.1108/14725960910952532
Yong, G. & Pearce, S. 2013. A beginner’s guide to factor analysis: Focusing on exploratory factor analysis. Tutorials in Quantitative Methods for Psychology, 9(2), pp. 79-94. https://doi.org/10.20982/tqmp.09.2.p079

39
Navorsingsartikels • Research articles
Kofi Agyekum
Dr Kofi Agyekum, Lecturer, Department of Building Technology, Kwame Nkrumah University of Science and Technology, Kumasi, Ghana. Phone: +233 246 761 879, email: <[email protected]>
Barbara Simons
Dr Barbara Simons, Lecturer, Department of Building Technology, Kwame Nkrumah University of Science and Technology, Kumasi, Ghana. Phone: +233 243 483 224, email: <[email protected]>
Seth Yeboah Botchway
Mr Seth Yeboah Botchway, Graduate/Research Assistant, Department of Building Technology, Kwame Nkrumah University of Science and Technology, Kumasi, Ghana. Phone: +233 248 637 501, email: <[email protected]>
DOI: http://dx.doi.org/10.18820/24150487/as25i2.2ISSN: 1023-0564e-ISSN: 2415-0487Acta Structilia 2018 25(2): 39-61© Creative Commons With Attribution (CC-BY)
Factors influencing the performance of safety programmes in the Ghanaian construction industry
Peer reviewed and revised
*The authors declared no conflict of interest for this title or article
AbstractAlthough proper safety management in construction is of prime importance, evidence from literature suggests that many developing countries do not consider safety adequately. This article examines the factors that influence the performance of safety management programmes in the Ghanaian Construction Industry. The objectives set to achieve this aim include identifying the safety elements incorporated in the safety programmes of construction firms, and determining the factors that negatively influence the performance of such elements. For objectivity, a quantitative survey was conducted among safety managers of 60 D1 building construction firms located in the Kumasi and Greater Accra regions of Ghana. The questionnaire was structured into three parts, which sought the respondents’ profile, identified the safety elements incorporated in the firms’ safety programmes, and identified the factors that negatively influence the performance of the safety elements. Following a detailed literature review, the respondents were asked to rate 13 elements and 17 factors on a Likert scale. Data was analysed using the Statistical Package for Social Sciences (SPSS) Version 22. In addition to determining the reliability of the various constructs, the MSs, modes and standard deviations were obtained. The findings revealed that all of the 13 elements were incorporated in the firms’ safety programmes. The key elements identified include ‘providing safety managers on site’; ‘providing written and comprehensive safety and health plans’; ‘introducing project-specific training and regular safety meetings’; ‘providing safety and

Acta Structilia 2018: 25(2)
40
health orientation training’, and ‘involving employees in safety and evaluation’. The findings further revealed that 16 of the 17 factors negatively influence the performance of the firms’ safety programmes. The identified factors were, among others, ‘insufficient communication of safety programmes’; ‘lack of workers’ self-protection and awareness’; ‘contractors ignoring safety, due to the time pressures of the project schedule’; ‘poor personal attitudes towards safety’, and ‘ineffective laws and lack of enforcement’. Findings from this study should be useful to construction practitioners seeking to improve the safety records of their firms.Keywords: Safety performance, safety programmes, safety elements, construction projects
AbstrakAlhoewel behoorlike veiligheidsbestuur in konstruksie van groot belang is, dui die bewyse uit die literatuur daarop dat baie ontwikkelende lande, veiligheid, nie genoeg oorweeg nie. Hierdie artikel ondersoek die faktore wat die prestasie van veiligheidsbestuursprogramme in die Ghanese Konstruksiebedryf beïnvloed. Die doelwitte wat gestel word om hierdie doel te bereik, sluit in die identifisering van die veiligheidselemente wat in die veiligheidsprogramme van konstruksiefirmas ingesluit is, en die bepaling van die faktore wat die prestasie van sulke elemente negatief beïnvloed. Vir objektiwiteit is 'n kwantitatiewe opname onder veiligheidsbestuurders van 60 D1 boukonstruksiefirmas in die Kumasi en Greater Accra-streke van Ghana gedoen. Die vraelys is in drie dele gestruktureer: Die respondente se profiel, die veiligheidselemente wat in die veiligheidsprogramme van die firmas opgeneem is, en die faktore wat die prestasie van die veiligheidselemente negatief beïnvloed. Na aanleiding van 'n gedetailleerde literatuuroorsig, is die respondente gevra om 13 elemente en 17 faktore op 'n Likert-skaal te gradeer. Data is geanaliseer met behulp van die SPSS Weergawe 22, Statistiese Pakket vir Sosiale Wetenskappe. Benewens die bepaling van die betroubaarheid van die verskillende konstrukte, is die MSs, modusse en standaardafwykings verkry. Die bevindings het getoon dat al die 13 elemente in die firmas se veiligheidsprogramme opgeneem is. Die sleutelelemente wat geïdentifiseer word, sluit in 'veiligheidsbeheerders op die terrein'; 'skriftelike en omvattende veiligheids- en gesondheidsplanne voorsien'; 'projekspesifieke opleiding en gereelde veiligheidsvergaderings bekendstel'; 'veiligheid en gesondheid oriëntering opleiding', en 'werknemers in veiligheid en evaluering'. Die bevindings het verder onthul dat 16 van die 17 faktore die prestasie van die firmas se veiligheidsprogramme negatief beïnvloed. Die geïdentifiseerde faktore was onder meer 'onvoldoende kommunikasie van veiligheidsprogramme'; 'gebrek aan werkers se selfbeskerming en bewustheid'; 'kontrakteurs ignoreer veiligheid, weens die tydsdruk van die projekskedule'; 'swak persoonlike houdings teenoor veiligheid', en 'oneffektiewe wette en gebrek aan handhawing'. Bevindings uit hierdie studie behoort nuttig te wees vir konstruksiepraktisyns wat die veiligheidsrekords van hul firmas wil verbeter.Sleutelwoorde: Konstruksieprojekte, veiligheidsverrigting, veiligheidsprogramme, veiligheidselemente

Agyekum, Simons & Botchway • Factors influencing the performance...
41
1. IntroductionSeveral studies have been conducted on safety issues in the Ghanaian Construction Industry (GCI) (Mustapha, Aigbavboa & Thwala, 2016: 11; Mustapha, 2016: 46; Kheni & Braimah, 2014: 24; Dadzie, 2013: 35; Kheni, Gibb & Dainty, 2010: 1104; Kheni, Dainty & Gibb, 2008: 23). Some of these studies determine how the clauses on appropriate health and safety standards in the Labour Act 651 are used on construction sites (Dadzie, 2013: 36); others examine the institutional and legal environments relating to health and safety management in the construction industry (Kheni & Braimah, 2014: 23), while still others examine the occupational health and safety implementation barriers (Mustapha, 2016: 46); improve occupational health and safety challenges (Mustapha, Aigbavboa & Thwala, 2016: 11); develop a guidance framework for managing health and safety in Adaptive Retrofit Projects (Danso, Badu, Adadzie, Nani & Manu, 2015: 73), and examine the influence of the contextual environment within which Ghanaian construction SMEs manage occupational health and safety (Kheni et al., 2010: 1104). A further study has established the existence of safety management programmes in the GCI (Yankah, 2012: 56).
Despite the safety management programmes in the GCI, the rate at which accidents occur on construction sites keeps escalating (Danso et al., 2015: 73; Kheni & Braimah, 2014: 24; Olutuase, 2014: 2; Dadzie, 2013: 36). Studies on effective safety management programmes in the vast majority of countries include and discuss the different elements in these programmes that help reduce the incident rates (López-Arquillos, Rubio-Romero, Carrillo-Castrillo & Suarez-Cebador, 2015: 286). However, from the literature available, it is not known which safety programme elements are incorporated in the safety programmes in the GCI. Neither is it known whether there are factors that negatively influence the performance of such safety programmes.
It is against this background that this study was initiated to examine the factors that influence the performance of safety management programmes in the GCI. To achieve this aim, the study set out two objectives: to identify the safety programme elements incorporated in the safety programmes of construction firms, and to determine the factors that negatively influence the performance of safety programmes on construction sites. Identifying such factors will help management ensure that proper strategies are put in place to deal with such issues, which, in the long term, will cause a massive reduction in accidents that occur on GCIs.

Acta Structilia 2018: 25(2)
42
2. Literature reviewIn order to understand the performance of safety management programmes in the GCI, it is important to introduce the current theory on the safety management concepts included in this study. The existing theory focuses on the general state of health and safety management in the GCI; construction safety management systems; programmes and their elements for construction safety, and factors that influence the performance of construction safety programmes.
2.1 Health and safety management in the Ghanaian construction industry
The GCI plays a vital role in achieving socio-economic development goals, providing shelter, infrastructure and employment, thus contributing significantly to the overall Gross Domestic Product (GDP) of the nation (Dadzie, 2013: 35; Anaman & Osei-Amponsah, 2007: 4). The GCI relies heavily on labour-intensive methods. Coupled with the fact that construction work is carried out in constantly changing working environments, this poses significant health and safety risks such as injuries, accidents, and loss of skilled workers (Dadzie, 2013: 35; Cheng, Ryan & Kelly, 2012: 363; Alhajeri, 2011: 20; Fugar & Agyakwah-Baah, 2010: 110; Kheni et al., 2010: 1104; Menzel & Gutierrez, 2010: 180; Kheni et al., 2008: 23; Haslam Hide, Gibb, Gyi, Pavitt, Atkinson & Duff 2005: 403). To deal with occupational health and safety issues, the Ghanaian government introduced several regulatory bodies that deal with safety issues occuring in all industries of Ghana (Annan, Addai & Tulashie, 2015: 146). These regulatory bodies include: The Mining and Minerals Regulations 1970 LI 665; The Workman’s Compensation Law 1987; The Ghana Health Services and Teaching Hospital Act 2003 (ACT 651); The Radiation Protection Instrument LI 1559 of 1993, an amendment of the Ghana Atomic Energy Act 204 of 1963, and The EPA Act 1994 (ACT 490) (Annan et al., 2015: 146).
Despite the vast literature recorded on the state of health and safety on construction sites in Ghana, no health and safety regulations have been specifically developed for the construction industry to date (Kheni & Braimah, 2014: 24). However, the institutionalisation of the Factories, Offices and Shops Act 1970 made provision for a few sections dedicated to construction. The Act serves as a preventive measure for health and safety, in general (Dadzie, 2013: 35), and defines safety for factories, offices, shops, ports, and construction. The Act designates the minister for manpower, development and labour to make regulations in respect of construction works in order

Agyekum, Simons & Botchway • Factors influencing the performance...
43
to address specific hazards (Kheni & Braimah, 2014: 25). Section 57 of the Act is specifically directed at building and civil engineering works. Some of the relevant sections, as stated in Section 57(1), include: Sections 6 to 8 which require construction companies to register their sites and to report workplace accidents and dangerous occurrences to the Factory Inspectorate Department; Sections 10 to 12; Section 19 which requires companies to provide toilet facilities on site; Section 20 requires companies to provide wholesome drinking water on site; Section 25 requires companies to provide personal protective equipment for their workers and to take preventive measures to control or prevent specific hazards on sites, to Section 31. Other requirements are outlined in Sections 33 to 40; 43 to 54, and 60 to 87. In addition to the Factories, Offices and Shops Act 1970, the International Labour Organization’s Code of Practice on Health and Safety on construction sites is also in operation in Ghana. The document provides guidelines in the implementation of the health and safety practice on construction sites for all workers. It also outlines the steps to be taken, including the provision of adequate welfare facilities; personal protective equipment appropriate for a job, and maintenance of a safe working environment for all workers on site (Dadzie, 2013: 35).
The above details clearly indicate that, although not complete, there is some form of institutional framework that ensures the proper monitoring and management of health and safety issues on construction sites in Ghana. However, according to Dadzie (2013: 35), the level of compliance with health and safety provisions in the Labour Act of Ghana is poor, since its adherence and practice on construction sites is low.
2.2 Construction safety management systems
Safety management relates to the actual practices, roles and functions that are associated with remaining safe (Kirwan, 1998: 72). Vinodkumar and Bhasi (2011: 499) infer that “safety management is regarded as a sub-system of the total organizational management, and it is usually carried out through an organization’s safety management system with the aid of various safety management practices”.
Safety management systems have been designed for different construction sites in different countries, and the safety factors included in such systems differ from one country to the other, mainly because of the cultural differences in the construction industries (Ismail, Doostdar & Harun, 2012: 418; Ali, Abdullah & Subramaniam,

Acta Structilia 2018: 25(2)
44
2009: 474; Aksorn & Hadikusumo, 2008: 416; Fang, Xie, Huang & Li, 2004: 45; Wokutch & VanSandt, 2000: 370).
In the GCI, effective safety management systems are usually made up of practices that comply with occupational health and safety requirements stipulated by the International Labour Organization (ILO) (Yankah, 2012: 56).
2.3 Construction safety programmes
The key objectives of adopting and implementing any construction safety programme is to avoid unacceptable behaviour that may cause accidents on site; to discover and report any unusual behaviour that may cause accidents, and to ensure that accidents are reported and handled properly (Abdelhamid & Everett, 2000: 54; Al Haadir & Panuwatwanich, 2011: 89). Henshaw (2004: 1) opines that effective safety programmes have trifold benefits such as protection of human life, cost reduction, and boost of employee morale and drive. Literature indicates that ‘written safety policies’, ‘accident investigation and report’, ‘safety records’, ‘safety manuals’, ‘safety checklists’, ‘accident statistical analysis’, ‘formal safety organizational structure’, ‘safe inspection’, ‘safety training scheme’, ‘safe work practices’, ‘safety meetings’, ‘safety audit’, ‘safe promotion’, ‘safety committees at project sites’, and ‘safety committee at company’ level are among the safety management programmes or practices that are put in place on construction sites (Wachter & Yorio, 2014: 118; Ismail, Doostdar & Harun, 2012: 420). In the quest to minimize the disruptions caused by accidents on sites, construction industries implement safety management programmes that seek to prevent the occurrence of accidents rather than essentially managing such accidents (Olutuase, 2014: 1). In general, construction firms that implement and follow the procedures set out in these programmes are expected to have highly safe construction sites and better project performance (Ismail, Doostdar & Harun, 2012: 419; Olutuase, 2014: 2). Studies conducted by Hinze and Gambatese (2003: 162) and Findley, Smith, Kress, Petty & Enoch (2004: 18) reveal that outstanding safety performance is closely related to construction projects where an operational safety programme is established, implemented and maintained.
Bottani, Monica and Vignali (2009: 157) reveal that, although safety management programmes are found to improve safety performance on construction sites, the majority of projects do not establish such systems on site. According to Cheng et al. (2012: 34), inadequate commitment to such safety management programmes
Agyekum, Simons & Botchway • Factors influencing the performance...
45
on construction sites leads to reduced safety awareness among workers on the site. For such safety management programmes to be effective, competent safety personnel should be made responsible for determining and implementing the required preventive measures (Olutuase, 2014: 1).
2.4 Elements of construction safety programmes
López-Arquillos et al. (2015: 287) and Hallowell (2010: 28) confirm that construction safety programmes are made up of certain key safety elements such as ‘upper management support’; ‘employee involvement in safety and evaluation’; ‘substance abuse programmes’; ‘written and comprehensive safety and health plans’; ‘project-specific training and regular safety meeting’; ‘subcontractor selection and management’; ‘job hazard analyses and communication’; ‘record-keeping and accident analyses’; ‘emergency response planning’; ‘safety and health committees’; ‘safety manager on site’; ‘safety and health orientation training’, and ‘frequent worksite inspections’. For the purposes of this study, these elements will be set as the key safety elements tested in safety programmes of participating construction firms. Table 1 introduces and describes these elements.
Table 1: Safety programme elements and descriptions
Safety programme element Description
Upper management support
The upper management must be committed to ensuring worker safety and health as the primary aim of a firm. Such commitments must be demonstrated through the participation in regular safety meetings, serving on committees, and providing funding for other safety and health programme elements.
Involvement of employee in safety and evaluation
This entails the inclusion of all employees in the formulation and execution of other programme elements. With respect to health and safety activities, employees can perform job hazard analysis, participate in tools box talks, or perform inspections. Evaluating employees’ safety performance includes considering safety metrics during regular employee performance evaluations.
Substance abuse programmes
Being able to identify and prevent the abuse of substances by workers. This includes random testing and testing after injury.
Written and comprehensive safety and health plan
A plan that documents project-specific safety and health objectives, goals and methods for achieving success.

Acta Structilia 2018: 25(2)
46
Safety programme element Description
Project-specific training and regular safety meeting
Establishing and communicating project-specific safety goals, plans and policies prior to the construction phase of the project.
Subcontractor selection and management
Considering safety and health performance during the selection and management of subcontractors.
Job hazard analysis and communication
Reviewing and recording activities that are associated with a construction process, highlighting potential hazardous exposures, and documenting safe work practices that prevent injury.
Record-keeping and accident analysis
Regularly reporting the specifics of all accidents, including information such as time, location, work-site conditions and cause.
Emergency response planning
A plan that documents a firm’s policies and procedures in case of a serious incident such as fatality.
Safety and health committees
Committees that have the power to effect changes and set policies consist of a diverse group such as supervisors, labourers, representatives of key subcontractors, among others.
Safety and health and orientation training
Participation of all new hires or transfers in orientation and training sessions that have a specific focus on safe work practices and company safety policies.
Safety manager on site
Employing a safety and health professional whose primary responsibility is to perform and direct the implementation of safety and health programme elements and serve as a resource for employees.
Sources: López-Arquillos et al., 2015: 287; Hallowell, 2010: 28
A survey conducted among large construction firms in Ghana revealed that each of the firms admitted to having safety management programmes in place (Yankah, 2012: 72). However, there was no evidence of the various elements that were incorporated in such safety programmes, making it necessary to seek the views of practitioners on some key elements that are incorporated in the safety management programmes of construction firms.

Agyekum, Simons & Botchway • Factors influencing the performance...
47
2.5 Factors that influence the performance of safety programmes
The monitoring of safety performance programmes at all stages of construction projects is inevitable, because safety rules and regulations not only overcome issues such as poor quality work, unsafe working conditions, and lack of environmental control, but also reduce costs and enhance productivity (Wehbe, Hattab & Hamzeh, 2016: 340; Koehn & Datta, 2003: 565; Pheng & Shiua, 2000: 32). Hsu, Su, Kao, Shu, Lin & Tseng (2012: 6) define safety performance as the overall performance of the organisation’s safety management system in terms of safe operation. Factors that influence the performance of safety programmes in the construction industry have been extensively studied. Studies conducted in Hong Kong, Kuwait, Uganda, China, Saudi Arabia, South Africa, Honduras, India, Malawi, and Jordan, among others, indicate that ‘extensive subcontracting’; ‘inadequate safety training’; ‘absence of safety officers on site’; ‘ineffective laws and lack of enforcement’; ‘extensive use of foreign workers’; ‘lack of workers’ self-protection and awareness’; ‘uncooperative clients and inadequate work procedures’; ‘poor accident record-keeping’, and ‘lack of management commitment to safety budget allocation’ are all factors that affect the performance of safety programmes (Irumba, 2014; 112; Alkilani, Jupp & Sawhney, 2013: 150; Chiocha, Smallwood & Emuze, 2011: 72; Al Humaidi & Tan, 2010: 74; Zou & Zhang, 2009: 623; Farooqui, Arif & Rafeeqi, 2008: 78; Teo, Haupt & Feng, 2008: 490; Gibb & Bust, 2006: 77; Tam, Zeng & Deng, 2004: 570). Yu, Ding, Zhou & Luo (2004: 133) also suggest that ‘lack of an emergency response plan which includes detailed response procedures; workers’ unsafe operating of equipment and unsafe work practices’, and ‘contractors ignoring safety due to the time pressures of the project schedule’ affect the performance of safety programmes. Other researchers also identified the following factors: poor personal attitudes (Fang, Chen & Wong, 2006: 578); poor personal motivation (Johnson, 2003: 40); inadequate safety meetings (El-Mashaleh, Rababeh & Hyari, 2009: 65); inefficient training and enforcement systems (Fang et al., 2006: 578; Toole, 2002: 206); poor equipment maintenance (Toole, 2002: 206); inadequate evaluation of programme (Abudayyeh, Fredericks, Butt & Shaar, 2006: 167-174); insufficient communication (Abudayyeh et al., 2006: 169), and inadequate resource allocation (Abudayyeh et al., 2006: 169). Table 2 introduces and describes the various factors.
For the purposes of this study, these elements will be set as the factors tested for negatively influencing the performance of safety programmes in participating firms.

Acta Structilia 2018: 25(2)
48
Table 2: Factors that influence the performance of safety programmes and descriptions
No.Factors influencing the performance of safety
programmesDescription
1 Extensive subcontracting
Where the subcontractor(s) employed by the main contractor do not have the needed expertise to understand or is/are unwilling to abide by the main contractor’s safety programmes.
2 Inefficient training and enforcement systems
Where new hires and old employees are not given enough orientation and training sessions that have a specific focus on safe work practices and company safety policies. Where employers, managers and supervisors do not receive training on safety concepts and their responsibility for protecting workers’ rights and responding to workers’ reports and concerns.
3 Absence of safety officers on site
Where there is no safety and health officer to perform and direct the implementation of safety and health programmes in the firm.
4 Ineffective laws and lack of enforcement
Where there are no written laws to document project-specific safety and health goals and objectives, and lack of enforcement of such laws as a result of the absence of a safety officer.
5 Extensive use of foreign workers
Extensively using or hiring workers who are not originally employed by the firm and who do not understand the firm’s safety programmes.
6 Lack of workers’ self-protection and awareness
Where the workers lack the necessary knowledge on how to protect themselves against injury or in case injury occurs. Workers and their representatives are not involved in all aspects of the programme, including setting goals, identifying and reporting hazards, and so on.
7Uncooperative clients and inadequate work procedures
Where management does not set expectations for clients, managers, supervisors, workers and for the overall project. The overall work procedures are not clearly outlined, and there are no specific actions to improve worker safety and health.
8 Poor accident record-keeping
Poor or no reporting on the specifics of all accidents, including information such as time, location, worksite conditions and cause.

Agyekum, Simons & Botchway • Factors influencing the performance...
49
No.Factors influencing the performance of safety
programmesDescription
9Lack of management commitment to safety budget allocation
Management does not demonstrate its commitment to eliminating hazards and improving workplace safety and health. No safety and health goals are established, and there are inadequate provisions made in terms of resources and support for the programme.
10 Lack of an emergency response plan
There is no plan that documents a firm’s policies and procedures in case of a serious incident such as fatality.
11Contractors ignoring safety due to the time pressures of the project schedule
Where management refuses to critically follow its safety programmes, only because the project is behind schedule.
12 Poor personal attitudes
Where all the workers, including the contractors and temporary workers, duly understand their roles and responsibilities under the programme, but decide not to follow as such.
13 Poor personal motivation
Where workers are not provided with the equipment needed to carry out their various activities. Where there are potential barriers to workers’ participation in the programme (e.g., language, lack of information, disincentives, and so on).
14 Inadequate safety meetings
Where there are no or hardly any safety meetings to inform workers on any changes or amendments in the safety programmes.
15 Poor equipment maintenance
Where the equipment used is poorly maintained to the extent that it poses a hazard to the potential users.
16 Inadequate evaluation of safety programme
Where control measures are not periodically evaluated for effectiveness. There are no laid down processes or procedures to monitor the performance of the programmes, verify the implementation of the programme, and identify the shortcomings and opportunities for improvement. Where there are no necessary actions taken to improve the programme and overall safety and health performance.
17 Insufficient communication
Where management does not communicate the hazards present at the worksite and the hazards created on site by contract workers. There is no coordination on work planning and scheduling to identify and resolve any conflicts that could impact on the safety programme.

Acta Structilia 2018: 25(2)
50
3. Research methodologyThe purpose of this research was to examine the factors that influence the performance of safety management programmes in the GCI, using a quantitative research approach. This approach allows for the use of structured questionnaire surveys, enabling researchers to generalise their findings from a sample of a population (Creswell, 2014; Hallowell, 2010: 27; Kheni et al. 2010: 1107). The questionnaire rated the elements incorporated in the safety programmes of construction firms as well as the factors that negatively influence the performance of these safety programmes. A quantitative research approach supports the use of interval Likert-type scales to measure data (Netemeyer, Bearden & Sharma, 2003). Quantitative research also allows for the use of descriptive statistics to analyse data (Brown, 2011: 11). Several data-analysis strategies are available. For this study, however, the MSs of interval data were used to calculate the central tendency in the data and to determine the composite (average) score of the Likert-type scale constructs (Nahm, 2016: 9; Jamieson, 2004: 1217).
3.1 Sampling and response rate
Building construction firms in Ghana should be registered according to the categories criteria set out by the Ghanaian Ministry of Water Resources, Works and Housing (MWRWH). The four categories of company classifications are D (building), K (civil engineering), E (electrical works), and G (plumbing works) (Ayarkwa, Agyekum, Adinyira & Osei-Asibey, 2012: 5). The MWRWH also provides four financial sub-classifications within these categories, namely Classes 1 (>500,000 USD), 2 (200,000 - 500,000 USD), 3 (75,000 - 200,000 USD) and 4 (>75,000 USD) (Asare-Yeboah, 2016: 10). These classifications set the limits for the companies with respect to their assets, plant and labour holdings, together with the nature and size of projects in which they can engage. Class 1 has the highest resource base, and decreases through Classes 2, 3 and 4 in that order (Ayarkwa et al., 2012: 5). For this study, D1 (building construction firms), located in the Kumasi and Greater Accra regions of Ghana, was used, because cities in these two regions serve as the hub for these large construction firms. The inclusion of a contractor’s name in the MWRWH register is not compulsory (MWRWH, 2011). The snowball sampling approach was thus used to select a small population of known D1 individual firms from the MWRWH registry and expanded the sample by asking those initial participants to identify others that should participate in the study (Alvi, 2016: 35). The D1 firms in the sample were known to have some safety programmes in place, although such programmes

Agyekum, Simons & Botchway • Factors influencing the performance...
51
do not clearly indicate the key elements outlined in Table 1. A list compiled from D1 firms resulted in a total sample of 60 firms used in this study.
3.2 Data collection
Using a face-to-face interview session, a structured questionnaire survey was conducted among safety managers of D1 building construction firms located in the Kumasi and Greater Accra regions of Ghana, from March 2017 to September 2017.
Topics on safety programmes used in the questionnaire were extracted from reviews of the literature, resulting in the formulation of a questionnaire divided into three sections. Section one on respondents’ profile obtained demographic information on years of experience in the GCI, number of projects involved in the GCI, and availability of site safety programmes.
Section two is a set of 13 Likert-scale items on the construct safety programme elements (coded as SPE 1 to SPE 13) (see Table 1). Respondents were required to indicate their level of agreement on the inclusion of these elements in order to examine what safety programme elements are incorporated in the safety programmes of construction firms in Ghana.
Section three is a set of 17 Likert-scale items on the construct factors that influence the performance of safety programmes (coded as FSP 1 to FSP 17) (see Table 2). Respondents were required to indicate their level of agreement on these factors in order to examine if there are factors that negatively influence the performance of safety elements.
The data from these measurements forms the Likert-scale items used in the descriptive analysis of this study. To reduce the respondent’s bias, closed-ended questions were preferred for sections 2 and 3 (Akintoye & Main, 2007: 601). The questionnaire was administered to the study sample, along with a covering letter stating the purpose of the research, and the guarantee that the information given by the respondents would be treated as confidential and that no names would be mentioned in the research. Interview questionnaires were completed anonymously to ensure a true reflection of the respondents’ views and to meet the ethical criterion of confidentiality. It was also assumed that the respondents were sincere in their responses because of their anonymity.

Acta Structilia 2018: 25(2)
52
3.3 Analysis and interpretation of the data
A 5-point interval Likert scale was used to measure how strongly respondents felt regarding the statements or questions in the Likert-scale constructs. Likert scales are effective where numbers can be used to quantify the results of measuring behaviours, attitudes, preferences, and even perceptions (Wegner, 2012: 11; Leedy & Ormrod, 2005: 185).
For the purposes of analysis, it is important to note that the scale intervals were equally distributed, where 1 = not included/highly insignificant, 2 = least included/insignificant, 3 = neutral, 4 = included/significant, and 5 = highly included/highly significant.
Data was analysed using frequencies and MS rankings. For a factor to be considered significant, the MS should be 3.0 and above. To measure the existence of internal reliability in the Likert-type scales, the Cronbach’s alpha coefficient was calculated and reported (Gliem & Gliem, 2003: 88). Cronbach’s alpha coefficient indicates the average correlation among all the items that make up the scale, in order to determine the reliability of the measuring instrument (Tavakol & Dennick, 2011: 53; Maree & Pietersen, 2007: 214). The alpha coefficient can range between 0 and 1, where 1 = perfect internal reliability, and 0 = no internal reliability (Pallant, 2011). For the purposes of this study, a minimum level of 0.5 was set as an acceptable level of internal reliability.
The Statistical Package for Social Sciences (SPSS) version 22 (Pallant, 2011) was used to calculate the Cronbach’s alpha, to process the interval scales, and to analyse them using descriptive statistics such as means, modes, and standard deviations.
The frequencies and percentages of responses were generated and reported, in order to analyse the respondents’ profile. The percentages, frequencies, mean, mode, and standard deviation of responses were generated, in order to analyse the safety elements incorporated. Only the mean of the items was reported to show the central tendency and to combine the MSs of the entire set of items in the construct to generate the composite (average) score for the elements.
The percentages, frequencies, mean, mode, and standard deviation of responses were generated, in order to analyse the factors that negatively influence the performance of the safety elements. Only the mean of the items was used to show the central tendency and to rank the factors in order of the most influential to the least influential.

Agyekum, Simons & Botchway • Factors influencing the performance...
53
4. Results and discussion
4.1 Demography of respondents and firms
Table 3 presents a summary of the demographic characteristics of the respondents and their firms. Experience is crucial when it comes to safety issues, in general. A large proportion (70%) of the respondents had over 10 years’ work experience in the GCI, indicating their capability to provide well-informed responses. However, 30% of the respondents have between 1 and 10 years’ work experience in the GCI. The results further indicate that 80% of the respondents have been involved in 7 or more projects within the GCI, enabling them to make knowledgeable contributions to issues pertaining to safety. The respondents further indicated that site safety programmes have been in place for all the projects in which they have been involved, thus confirming Yankah’s (2012: 56) assertion.
Table 3: Demographic characteristics of respondents
Demographic details Frequency Percentage
Type of works engaged in
Number of years of experience in the GCI:
1-5 years 10 17%
6-10 years 8 13%
Over 10 years 42 70%
Number of projects involved in the GCI:
1-3 2 3%
4-6 10 17%
7-10 20 33%
Above 10 28 47%
Availability of site safety programmes:
Yes 60 100%
No 0 0%

Acta Structilia 2018: 25(2)
54
4.2 Safety programme elements incorporated in the firms’ safety programmes
This part of the research intended to identify the safety programme elements which the construction firms surveyed include in their safety programmes. Respondents had to rate the elements on a 5-point Likert scale, where 1 = not included, 2 = least included, 3 = neutral, 4 = included, and 5 = highly included; or ‘unsure’. The data for the safety elements evaluated obtained a Cronbach’s alpha score of 0.50, which can be confirmed as reliable.
Although, at the initial stages of the questionnaire administration, the respondents had issues understanding the contents of these safety elements, a further description of the various elements (as indicated in Table 1) eased their doubts and facilitated their understanding and better answering of the questionnaire.
Table 4 shows the MSs, modes, and standard deviations of the various elements studied. The results reveal that the MSs of all the 13 safety programme elements evaluated by the respondents are significantly greater than the mean value of 3.0. Thus, in the opinion of the respondents, all the 13 elements are incorporated in the firms’ safety programmes. The findings further reveal that ‘providing safety managers on site’; ‘providing written and comprehensive safety and health plans’; ‘introducing project-specific training and regular safety meetings’; ‘providing safety and health orientation training’; ‘involving employees in safety and evaluation’, and ‘emergency response planning’ are the six key elements introduced by the firms into their safety programmes. The remaining elements, including ‘job hazard analyses and communication’; ‘safety and health committees’; ‘record-keeping and accident analyses’; ‘subcontractor selection and management’; ‘frequent worksite inspections’; ‘upper management support’, and ‘substance abuse programmes’ were all significant and, to some extent, also introduced in their safety programmes.
Table 4 shows that 57% of the respondents incorporated the element SPE 11 into their safety programmes. SPE 11 obtained a MS of 4.23, indicating that provision of safety managers on site is an element that is included in the safety programmes of the firms surveyed. A similar trend is observed in the elements SPE 4 and SPE 5, which had 78% and 50% of the respondents, respectively, indicating that such elements are incorporated in their safety programmes. The MSs of 3.90 and 3.87 obtained by these elements (SPE 4 and SPE 5) indicate that provision of ‘written and comprehensive safety and health plans’, and the provision of ‘project-specific training and regular

Agyekum, Simons & Botchway • Factors influencing the performance...
55
safety meetings’ are further elements that are included in the safety programmes of the firms surveyed. The remainder of the elements (SPE 12, SPE 2, SPE 9, SPE 7, SPE 10, SPE 8, SPE 6, SPE 13, SPE 1, and SPE 3) saw a slight change in the respondents’ views. For instance, 42% to 100% of the respondents were neutral about the incorporation of these elements (i.e., SPE 12, SPE 2, SPE 9, SPE 7, SPE 10, SPE 8, SPE 6, SPE 13, SPE 1, and SPE 3) in their safety programmes. This notwithstanding, those elements obtained MSs that were significantly greater than or equal to the mean value of 3.0 (see Table 4). Hence, they were considered as elements that were significantly included in the firms’ safety programmes.
These findings simultaneously confirm and contradict those identified in other studies. For instance, a study conducted by Hallowell (2010: 30) reveals that not all the 13 elements were practised by construction organizations located within the USA. The majority (approximately 81%) of such firms, however, implemented roughly 10 out of the 13 elements. This notwithstanding, some of the findings obtained in this section agree with those obtained by Hallowell (2010: 30).
Construction firms in the USA also considered elements such as ‘regular written safety programmes’; ‘emergency response plan’, and ‘project-specific training’ that were incorporated in the safety programmes of Ghanaian construction firms (Hallowell, 2010: 30). However, elements such as employing a safety manager on site, which was ranked first in this study, was infrequently practised in the USA. Table 4 also shows that ‘subcontractor selection and management’ and ‘upper management support’ were ranked 10 and 12, respectively. Although incorporated, it was not given higher priority, thus agreeing well with Hallowell’s (2010: 30) finding. The finding from this study further corroborates that of López-Arquillos et al. (2015: 289). In their study, job hazard analysis and communication, safety and health orientation training, and safety manager on site were all considered and implemented in safety programmes of civil engineering organizations located in Spain. The introduction of substance abuse programmes, which was considered the last option among construction firms in Ghana, were not considered significant at all by the firms in Spain.

Acta Structilia 2018: 25(2)
56
Tabl
e 4:
Saf
ety
prog
ram
me
elem
ents
incl
uded
in th
e fir
ms’
safe
ty p
rogr
amm
es
Cro
nbac
h’s a
lpha
0.5
0
Cod
eSa
fety
pro
gram
me
elem
ent
1= N
ot in
clud
ed ..
......
. 5=
High
ly
incl
uded
Des
crip
tive
stat
istic
sRa
nk
1 %2 %
3 %4 %
5 %Un
sure
%M
ean
Mod
eSt
d.
dev
.
SPE
11Sa
fety
man
ager
on
site
00
1057
330
4.23
4.00
0.62
1
SPE
4W
ritte
n an
d c
ompr
ehen
sive
safe
ty a
nd h
ealth
pl
ans
02
1378
70
3.90
4.00
0.51
12
SPE
5Pr
ojec
t-spe
cific
trai
ning
and
regu
lar s
afet
y m
eetin
g0
327
5020
03.
874.
000.
763
SPE
12Sa
fety
and
hea
lth o
rient
atio
n tra
inin
g0
042
4018
03.
763.
000.
744
SPE
2Em
ploy
ee in
volv
emen
t in
safe
ty a
nd e
valu
atio
n0
348
427
03.
513.
000.
685
SPE
9Em
erge
ncy
resp
onse
pla
nnin
g0
1549
1818
03.
403.
000.
966
SPE
7Jo
b ha
zard
ana
lyse
s and
com
mun
icat
ion
015
5017
180
3.38
3.00
0.95
7
SPE
10Sa
fety
and
hea
lth c
omm
ittee
s2
367
235
03.
263.
000.
698
SPE
8Re
cord
-kee
ping
and
acc
iden
t ana
lyse
s0
1850
2012
03.
253.
000.
899
SPE
6Su
bcon
tract
or se
lect
ion
and
man
agem
ent
20
8315
00
3.12
3.00
0.45
10
SPE
13Fr
eque
nt w
orks
ite in
spec
tions
718
3835
20
3.06
3.00
0.94
11
SPE
1Up
per m
anag
emen
t sup
port
20
950
30
3.03
3.00
0.44
12
SPE
3Su
bsta
nce
abus
e pr
ogra
mm
es0
010
00
00
3.00
3.00
0.00
13
Ave
rage
MS
(com
posit
e sc
ore)
3.44

Agyekum, Simons & Botchway • Factors influencing the performance...
57
Table 4 indicates a composite score (average MS) of 3.44 for the safety programme elements, indicating that, on the mean evaluation scale, respondents generally “agree” that these elements should be incorporated in the safety programmes of construction firms in Ghana.
The differences between some of the findings in this study compared to those of Hallowell (2010: 30) and López-Arquillos et al. (2015: 289) are purely due to the differences in organizational culture. USA and Spain are developed countries, whereas Ghana is a developing country. As a result, the cost associated with the implementation of some of these elements is higher in the developed country than in a developing country. This is well iterated by Hallowell (2010: 30) who found that elements such as ‘employing a site-specific safety manager’; ‘inspections and trainings’, and ‘regular safety meetings’ were the three most expensive and costly safety programme elements as defined in dollars in investment per million dollars of project scope. These three elements were, however, among the first five elements incorporated in the safety programmes of Ghanaian construction firms.
4.3 Factors that negatively influence the performance of safety programmes
This part of the research also intended to identify the factors that negatively influence the performance of safety programmes among the construction firms surveyed. Respondents had to rate the elements on a 5-point Likert scale, where 1 = highly insignificant, 2 = insignificant, 3 = neutral, 4 = significant, and 5 = highly significant; or ‘unsure’. The data for the factors evaluated obtained a Cronbach’s alpha score of 0.70, which can be confirmed as reliable.
The various factors that negatively influence the performance of the safety programmes were described (see Table 2) to ease the respondents’ doubts, thus facilitating their understanding and better answering of the questionnaire.
The results shown in Table 5 reveal that the MSs of 16 out of the 17 factors evaluated by the respondents are significantly greater than the mean value of 3.0. Thus, in the respondents’ opinion, 16 of the 17 factors negatively influence the performance of safety programmes. The findings further reveal the 6 key factors that negatively influence the performance of safety programmes, namely ‘insufficient communication’; ‘lack of workers’ self-protection and awareness’; ‘contractors ignoring safety due to the time pressures of the project schedule’; ‘poor personal attitudes’;

Acta Structilia 2018: 25(2)
58
‘ineffective laws and lack of enforcement’, and ‘poor equipment maintenance’. The remaining factors, including ‘inadequate safety meetings’; ‘inadequate evaluation of safety programme’; ‘lack of an emergency response plan’; ‘lack of management commitment to safety budget allocation’; ‘poor accident record-keeping’; ‘uncooperative clients and inadequate work procedures’; ‘extensive use of foreign workers’; ‘absence of safety officers on site’; ‘inefficient training and enforcement systems’, and ‘extensive subcontracting’, were also considered to negatively influence the performance of the safety programmes. The respondents were, however, not in agreement with ‘poor personal motivation’ being an influencing factor.
Table 5 shows that 9 of the 17 factors received maximum percentage rating by the respondents as significant factors that influence the performance of safety programmes in the firms surveyed. These factors include FSP 17 (rated by 17% of the respondents as significant), FSP 12 (50%), FSP 4 (40%), FSP 14 (48%), FSP 16 (78%), FSP 10 (52%), FSP 9 (60%), FSP 5 (42%), and FSP 3 (40%). All these factors obtained MSs greater than the mean value of 3.00, indicating that such factors significantly affected the performance of safety programmes in the firms. Four of the 17 factors also received maximum percentage rating by the respondents as highly significant factors that influence the performance of safety programmes. These factors include FSP 6 (56%), FSP 11 (53%), FSP 15 (47%), and FSP 8 (33%). These factors obtained MSs of 4.52, 4.43, 4.06, and 3.63, respectively, indicating the significance of such factors in negatively influencing the performance of safety programmes. Furthermore, 3 of the 17 factors received maximum rating by the respondents as neutral. These factors include FSP 7(37%), FSP 2 (60%), and FSP 1 (77%). Although the respondents rated these factors on the neutral bases, it can be noted that the MSs of all the three factors were above the mean value of 3.00, an indication that such factors negatively influenced the performance of safety programmes. The respondents rated factor FSP 13 as insignificant, with a percentage rating of 55%, highly reflective of its MS being lower than the mean value of 3.0.
Studies conducted in Hong Kong, Kuwait, Uganda, China, Saudi Arabia, and South Africa (Irumba, 2014: 112; Al Humaidi & Tan, 2010: 74; Zou & Zhang, 2009: 623; Teo et al., 2008: 490; Tam et al., 2004: 570) revealed that ‘extensive subcontracting’ and ‘absence of adequate safety training’ were among the key factors influencing the performance of safety programmes in the construction industry.

Agyekum, Simons & Botchway • Factors influencing the performance...
59
However, in the current study (Table 5), ‘extensive subcontracting’ and ‘absence of adequate safety training’ (in this case, inefficient safety training and enforcement systems) were ranked 16 and 15, respectively. This indicates that, although the construction organizations in Ghana view these factors as possible influencing factors of safety programme performance, they were not that much of a threat. Table 4 explains this and indicates that ‘subcontractor selection and management’ and ‘safety and health orientation training’ were, to some extent, incorporated in safety programmes of construction firms in Ghana. In countries such as Honduras, India, Malawi and Jordan, factors such as ‘absence of safety officers on site’ and ‘ineffective laws and lack of enforcement’ were viewed as influencing the performance of safety programmes on site (Alkilani et al., 2013: 150; Chiocha et al., 2010: 72), because the researchers agree with Hallowell (2010: 31) that it is expensive to implement such elements in the safety programmes. In the current study (Table 5), it is revealed that ‘absence of safety officers on site’ and ‘ineffective laws and lack of enforcement’ were ranked 14 and 5, respectively.
Table 5 (next page) indicates a composite score (average MS) of 3.83 for the factors that influence the performance of safety programmes, indicating that, on the mean evaluation scale, respondents generally “agree” that these factors might influence the performance of safety programmes in the GCI.
The absence of safety officers on site, being ranked 14, depicts the reason why it is among the elements incorporated in safety programmes in Ghana. However, for the respondents to indicate that ‘ineffective laws and lack of enforcement’ (Table 5) is a key factor that influences the performance of safety programmes in the GCI needs attention. In Kuwait, Pakistan, China, Jordan, Botswana, Egypt, Nigeria, South Africa, Malawi, and so on, factors such as ‘extensive use of foreign workers’; ‘lack of workers’ self-protection and awareness’; ‘uncooperative clients and inadequate work procedures’; ‘poor accident record-keeping’, and ‘lack of management commitment to safety budget allocation’ were all viewed as factors influencing the performance of safety programmes in the construction industry. This corroborates the findings from this study.
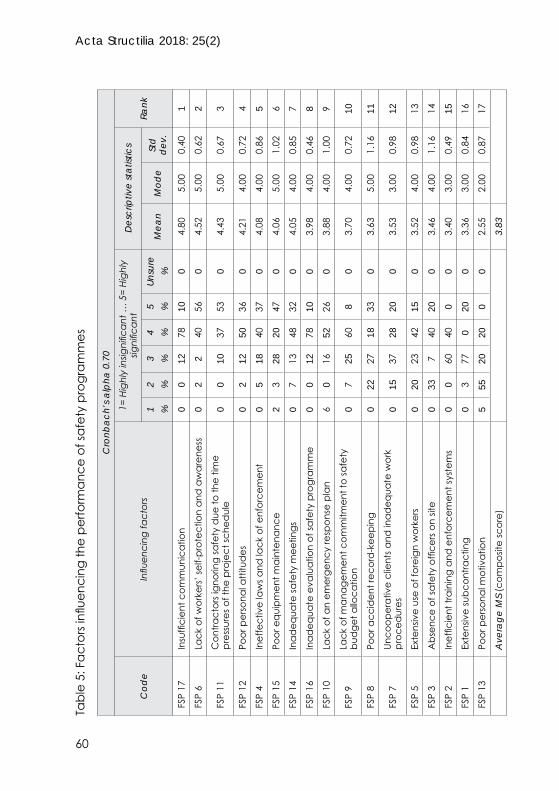
Acta Structilia 2018: 25(2)
60
Tabl
e 5:
Fac
tors
influ
enci
ng th
e pe
rform
ance
of s
afet
y pr
ogra
mm
es
Cro
nbac
h’s a
lpha
0.7
0
Cod
eIn
fluen
cing
fact
ors
1= H
ighl
y in
signi
fican
t … 5
= Hi
ghly
sig
nific
ant
Des
crip
tive
stat
istic
sRa
nk1 %
2 %3 %
4 %5 %
Unsu
re%
Mea
nM
ode
Std
d
ev.
FSP
17In
suffi
cien
t com
mun
icat
ion
00
1278
100
4.80
5.00
0.40
1
FSP
6La
ck o
f wor
kers
’ sel
f-pro
tect
ion
and
aw
aren
ess
02
240
560
4.52
5.00
0.62
2
FSP
11C
ontra
ctor
s ign
orin
g sa
fety
due
to th
e tim
e pr
essu
res o
f the
pro
ject
sche
dul
e0
010
3753
04.
435.
000.
673
FSP
12Po
or p
erso
nal a
ttitu
des
02
1250
360
4.21
4.00
0.72
4
FSP
4In
effe
ctiv
e la
ws a
nd la
ck o
f enf
orce
men
t0
518
4037
04.
084.
000.
865
FSP
15Po
or e
quip
men
t mai
nten
ance
23
2820
470
4.06
5.00
1.02
6
FSP
14In
adeq
uate
safe
ty m
eetin
gs0
713
4832
04.
054.
000.
857
FSP
16In
adeq
uate
eva
luat
ion
of sa
fety
pro
gram
me
00
1278
100
3.98
4.00
0.46
8
FSP
10La
ck o
f an
emer
genc
y re
spon
se p
lan
60
1652
260
3.88
4.00
1.00
9
FSP
9La
ck o
f man
agem
ent c
omm
itmen
t to
safe
ty
bud
get a
lloca
tion
07
2560
80
3.70
4.00
0.72
10
FSP
8Po
or a
ccid
ent r
ecor
d-k
eepi
ng0
2227
1833
03.
635.
001.
1611
FSP
7Un
coop
erat
ive
clie
nts a
nd in
adeq
uate
wor
k pr
oced
ures
015
3728
200
3.53
3.00
0.98
12
FSP
5Ex
tens
ive
use
of fo
reig
n w
orke
rs0
2023
4215
03.
524.
000.
9813
FSP
3A
bsen
ce o
f saf
ety
offic
ers o
n sit
e0
337
4020
03.
464.
001.
1614
FSP
2In
effic
ient
trai
ning
and
enf
orce
men
t sys
tem
s0
060
400
03.
403.
000.
4915
FSP
1Ex
tens
ive
subc
ontra
ctin
g0
377
020
03.
363.
000.
8416
FSP
13Po
or p
erso
nal m
otiv
atio
n5
5520
200
02.
552.
000.
8717
Ave
rage
MS
(com
posit
e sc
ore)
3.83

Agyekum, Simons & Botchway • Factors influencing the performance...
61
5. ConclusionNumerous studies have been conducted on health and safety issues in the GCI. However, in the absence of empirical studies to examine the influencing factors against the performance of safety programmes, this study was conducted to fill a necessary gap. The study sought to examine the factors that influence the performance of safety management programmes in the GCI. To achieve this aim, the study set out two objectives: to identify the safety programme elements incorporated in the safety programmes of construction firms and to determine the factors that negatively influence the performance of such elements.
With respect to the first objective, the respondents agreed that all the 13 elements were incorporated in the safety programmes of the firms surveyed. It was further revealed that ‘providing safety managers on site’; ‘providing written and comprehensive safety and health plans’; ‘introducing project-specific training and regular safety meetings’; ‘providing safety and health orientation training’; ‘involving employees in safety and evaluation’, and ‘emergency response planning’ are the six key elements introduced by Ghanaian construction firms in their safety programmes.
With respect to the second objective, the findings revealed that 16 of the 17 factors, which the respondents evaluated, negatively affected the performance of safety programmes on construction sites. It was also revealed that ‘insufficient communication of safety programmes’; ‘lack of workers’ self-protection and awareness’; ‘contractors ignoring safety due to the time pressures of the project schedule’; ‘poor personal attitudes towards safety’; ‘ineffective laws and lack of enforcement’, and ‘poor equipment maintenance’ are the six key factors that negatively influence the performance of safety programmes. This study provides a broad perspective on the issues that hinder the development of safe working practices in the GCI. Currently, in Ghana, although the majority of first-class construction companies have safety programmes in place, it is not clear which key safety elements have been incorporated in such programmes. The safety elements identified in this study gave insight into which elements are of priority to such construction companies. Identifying the factors that negatively influence the performance of the safety programmes should be useful to construction practitioners seeking to improve the safety records of their firms.

Acta Structilia 2018: 25(2)
62
6. Limitation of the studyAlthough the objectives set out in this article were duly achieved, there are some limitations. Key among the limitations was the relatively small sample size of the respondents (in this case, 60 construction firms). This small sample size is attributed to the limitation in getting access to up-to-date information on registered building construction firms in good standing in Ghana. This means that, although the current findings can reflect the current state of safety issues in the GCI, the views of other relevant firms may not have been included. Future studies could be carried out to include other relevant construction firms that may have been excluded from the current study. Since performance is a two-way issue and this study only considered those factors that negatively influence performance, a future study could be conducted to determine how the performance of the various factors could be improved.
ReferencesAbdelhamid, T.S. & Everett J.G. 2000. Identifying root causes of construction accidents. Journal of Construction Engineering and Management, 126(1), pp. 52-60. https://doi.org/10.1061/(ASCE)0733-9364(2000)126:1(52)
Abudayyeh, O., Fredericks, T., Butt, S. & Shaar, A. 2006. An investigation of management’s commitment to construction safety. International Journal of Project Management, 24(2), pp. 167-174. https://doi.org/10.1016/j.ijproman.2005.07.005
Akintoye, A. & Main, J. 2007. Collaborative relationships in construction: The UK contractor’s perception. Engineering, Construction and Architectural Management, 14(6), pp. 597-617. https://doi.org/10.1108/09699980710829049
Aksorn, T. & Hadikusumo, B.W.H. 2008. Critical success factors influencing safety program performance in Thai construction projects. Safety Science, 46(4), pp. 709-727. https://doi.org/10.1016/j.ssci.2007.06.006
Al Haadir, S. & Panuwatwanich, K. 2011. Critical success factors for safety programme implementation among construction companies in Saudi Arabia. Procedia Engineering, 14(2011), pp. 148-155. https://doi.org/10.1016/j.proeng.2011.07.017
Alhajeri, M. 2011. Health and safety in the construction industry: Challenges and solutions in the UAE. Unpublished PhD thesis , Coventry, UK: Coventry University.

Agyekum, Simons & Botchway • Factors influencing the performance...
63
Al Humaidi, H.M. & Tan, H.M. 2010. Construction safety in Kuwait. Journal of Performance in Constructed Facilities, 24(1), pp. 70-77. https://doi.org/10.1061/(ASCE)CF.1943-5509.0000055
Ali, H., Abdullah, N.A.C. & Subramaniam, C. 2009. Management practice in safety culture and its influence on workplace injury. Disaster Prevention and Management, 18(5), pp. 470-477. https://doi.org/10.1108/09653560911003660
Alkilani, S.Z., Jupp, J. & Sawhney, A. 2013. Issues of construction health and safety in developing countries: A case of Jordan Australasian. Journal of Construction Economics and Buildings, 13(3), pp. 141-156. https://doi.org/10.5130/AJCEB.v13i3.3301
Alvi, M.H. 2016. A manual for selecting sampling techniques in research. Pakistan: University of Karachi, Iqra University.
Anaman, K.A. & Osei-Amponsah, C. 2007. Analysis of causality links between the growth of the construction industry and growth of the macro-economy in Ghana. Construction Management and Economics, 25(9), pp. 951-961. https://doi.org/10.1080/01446190701411208
Annan, J.S., Addai, E.K. & Tulashie, S.K. 2015. A call for action to improve occupational health and safety in Ghana and a critical look at the existing legal requirement and legislation. Safety and Health at Work, 6(2), pp. 146-150. https://doi.org/10.1016/j.shaw.2014.12.002
Asare-Yeboah, K. 2016. Best practice: Procurement of contracting and engineering services. Speech delivered at CESA Infrastructure Indaba, Durban, South Africa, 7 November. [online]. Available at: <http://www.cesa.co.za/sites/default/files/20161107_S3_2_Procuring%20Contracting%20&%20Engineering%20Services%20_Best%20Practices_Ing%20K%20Asare-Yeboah.pdf> [Accessed: 12 June 2017].
Ayarkwa, J., Agyekum, K., Adinyira, E. & Osei-Asibey, D. 2012. Barriers to successful implementation of lean construction in the Ghanaian building industry. Journal of Construction, 5(1), pp. 3-11.
Bottani, E., Monica, L. & Vignali, G. 2009. Safety management systems: Performance differences between adopters and non-adopters. Safety Science, 47(2009), pp. 155-162. https://doi.org/10.1016/j.ssci.2008.05.001
Brown, J.D. 2011. Likert items and scales of measurement? JAL Testing & Evaluation SIG Newsletter, 15(1), pp. 10-14.
Cheng, E.W.L., Ryan, N. & Kelly, S. 2012. Exploring the perceived influence of safety management practices on project performance

Acta Structilia 2018: 25(2)
64
in the construction industry. Safety Science, 50(2), pp. 363-369. https://doi.org/10.1016/j.ssci.2011.09.016
Chiocha, C., Smallwood, J. & Emuze, F. 2011. Health and safety in the Malawian construction industry. Acta Structilia, 18(1), pp. 68-80.
Creswell, J.W. 2014. Research design: Qualitative, quantitative and mixed methods approaches. 4th edition. Thousand Oaks, CA: Sage.
Dadzie, J. 2013. Perspectives of consultants on health and safety provisions in the Labour Act: A study into theory and practical. Engineering Management Research, 2(1), pp. 34-42. https://doi.org/10.5539/emr.v2n1p34
Danso, F.O., Badu, E., Adadzie, D.K., Nani, G. & Manu, P. 2015. Towards a framework for the management of health, safety and well-being on adaptive-retrofit projects in Ghana. In: Arcom Doctoral Workshop - Health, Safety and Wellbeing, Edinburgh, Scotland, UK, 11 February 2015.
El-Mashaleh, M.S., Rababeh, S.M. & Hyari, K.H. 2009. Utilizing data envelopment analysis to benchmark safety performance of construction contractors. International Journal of Project Management, 28(1), pp. 61-67. https://doi.org/10.1016/j.ijproman.2009.04.002
Fang, D., Chen, Y. & Wong, L. 2006. Safety climate in construction industry: A case study in Hong Kong. Journal of Construction Engineering and Management, 132(6), pp. 573-584. https://doi.org/10.1061/(ASCE)0733-9364(2006)132:6(573)
Fang, D.P., Xie, F., Huang, X.Y. & Li, H. 2004. Factor analysis-based studies on construction workplace safety management in China. International Journal of Project Management, 22(1), pp. 43-49. https://doi.org/10.1016/S0263-7863(02)00115-1
Farooqui, R.U., Arif, F. & Rafeeqi, S.F. 2008. Safety performance in construction industry of Pakistan. In: Proceedings of the First International Conference on Construction in Developing Countries, Karachi, Pakistan, 4-5 August, pp. 74-87.
Findley, M., Smith, S.M., Kress, T., Petty, G. & Enoch, K. 2004. Safety program elements in construction: Which ones best prevent injuries and control related workers’ compensation costs? Professional Safety, 49(2) pp. 14-21.
Fugar, F.G.K. & Agyakwa-Baah, A.B. 2010. Delays in building construction projects in Ghana. Australian Journal of Construction Economics and Building, 10(1/2), pp. 103-116. https://doi.org/10.5130/ajceb.v10i1/2.1592

Agyekum, Simons & Botchway • Factors influencing the performance...
65
Gibb, A. & Bust, P. 2006. Construction health and safety in developing countries. Loughborough, Great Britain: European Construction Institute.
Gliem, R. & Gliem, J. 2003. Calculating, interpreting, and reporting Cronbach’s alpha reliability coefficient for Likert-type scales. In: Midwest Research-to-Practice Conference in Adult, Continuing, and Community Education, The Ohio State University, Columbus, OH, 8-10 October, pp. 82-88.
Hallowell, M. 2010. Cost-effectiveness of construction safety programme elements. Construction Management and Economics, 28(1), pp. 25-34. https://doi.org/10.1080/01446190903460706
Haslam, R.A., Hide, S.A., Gibb, A.G.F., Gyi, D.E., Pavitt, T., Atkinson, S. & Duff, A.R. 2005. Contributing factors in construction accidents. Applied Ergonomics, 36(4), pp. 401-415. https://doi.org/10.1016/j.apergo.2004.12.002
Henshaw, J.L. 2004. Safety and health add value to your business, workplace and life. In: Proceedings of the 8th Biennial Governors Pacification Rim Safety and Health Conference, 13-14 September 2004, Ochu, Hawaii.
Hinze, J. & Gambatese, J. 2003. Factors influencing safety performance of specialty contractors. Journal of Construction Engineering and Management, 129(2), pp. 159-164. https://doi.org/10.1061/(ASCE)0733-9364(2003)129:2(159)
Hsu, I.Y., Su, T.S., Kao, C.S., Shu, Y.L., Lin, P.R. & Tseng, J.L. 2012. Analysis of business safety performance by structural equation models. Safety Science, 50(2012), pp. 1-11. https://doi.org/10.1016/j.ssci.2011.04.012
Irumba, R. 2014. Spatial analysis of construction accidents in Kampala, Uganda. Safety Science, 64 (2014), pp. 109-120. https://doi.org/10.1016/j.ssci.2013.11.024
Ismail, Z., Doostdar, S. & Harun, Z. 2012. Factors influencing the implementation of a safety management system for construction sites. Safety Science, 50(2012), pp. 418-423. https://doi.org/10.1016/j.ssci.2011.10.001
Jamieson, S. 2004. Likert scales: How to (ab)use them. Medical Education, 38(12), pp. 1212-1218. https://doi.org/10.1111/j.1365-2929.2004.02012.x
Johnson, S.E. 2003. Behavioural safety theory: Understanding the theoretical foundation. Journal of Professional Safety, 48(10), pp. 39-44.
Kheni, N.A. & Braimah, C. 2014. Institutional and regulatory frameworks for health and safety administration: Study of the construction industry in Ghana. International Refereed Journal of Engineering and Sciences, 3(2), pp. 24-34.

Acta Structilia 2018: 25(2)
66
Kheni, N.A., Gibb, A.G.F. & Dainty, A.R.J. 2010. Health and safety management within small and medium-sized enterprises (SMEs) in developing countries: Study of contextual influences. Journal of Construction Engineering and Management, 136(10), pp. 1104-1115. https://doi.org/10.1061/(ASCE)CO.1943-7862.0000218
Kheni, N.A., Dainty, A.R.J. & Gibb, A.G.F. 2008. Health and safety management in developing countries: A study of construction SMEs in Ghana. Construction Management and Economics, 26(11), pp. 1159-1169. https://doi.org/10.1080/01446190802459916
Kirwan, B. 1998. Safety management assessment and task analysis – a missing link? In: Hale, A. & Baram, M. (Eds), Safety management: The challenge of change. Oxford, UK: Elsevier, pp. 67-92.
Koehn, E.E. & Datta, N.K. 2003. Quality, environmental, and health and safety management systems for construction engineering. Journal of Construction Engineering and Management, 129(5), pp. 562-569. https://doi.org/10.1061/(ASCE)0733-9364(2003)129:5(562)
Leedy, P.D. & Ormrod, J.E. 2005. Practical research: Planning and design. 8th edition. Harlow: Pearson.
López-Arquillos, A., Rubio-Romero, J.C., Carrillo-Castrillo, J. & Suarez-Cebador, M. 2015. Effectiveness of construction safety programme elements. In: Cortes, P., Maeso-Gonzales, E. & Escudero-Santana, A. (Eds). Proceedings, Enhancing synergies in a collaborative environment. Lecture Notes in Management and Industrial Engineering, Switzerland: Springer International Publishing, pp. 285-289. https://doi.org/10.1007/978-3-319-14078-0_32
Maree, K. & Pietersen, J. 2007. The quantitative research process. In: Maree, K. (Ed.). First steps in research. Pretoria: Van Schaik, pp. 145-153.
Menzel, N.N. & Gutierrez, A.P. 2010. Latino worker perceptions of construction risks. American Journal of Industrial Medicine, 53(2), pp. 179-187. https://doi.org/10.1002/ajim.20735
Mustapha, Z. 2016. Revised health and safety compliance model for the Ghanaian construction industry. International Journal of Engineering, Science and Technology, 8(2), pp. 46-51. https://doi.org/10.4314/ijest.v8i2.4
Mustapha, Z., Aigbavboa, C. & Thwala, W.D. 2016. Occupational health and safety challenges in Ghana: The way forward. In: Whala, W.D. & Aigbavboa, C.O. (Eds). Proceedings of the International Conference on Infrastructure Development in Africa, 10-12 July, Johannesburg, South Africa, pp. 11-15.

Agyekum, Simons & Botchway • Factors influencing the performance...
67
MWRWH (Ministry of Water Resource, Works and Housing). 2011. List of registered building contractors in Ghana. [online]. Available at: <http://www.mwrwh.gov.gh/index.php/classification> [Accessed: 18 June 2017].
Nahm, F.S. 2016. Nonparametric statistical tests for the continuous data: The basic concept and the practical use. Korean Journal of Anesthesiology, 69(1), pp. 8-14. https://doi.org/10.4097/kjae.2016.69.1.8
Netemeyer, R.G., Bearden, W.O.E. & Sharma, S. 2003. Scaling procedures: Issues and applications. Thousand Oaks, CA: Sage. https://doi.org/10.4135/9781412985772
Olutuase, S.O. 2014. A study of safety management in the Nigerian construction industry. IOSR Journal of Business and Management, 16(3), pp. 1-10. https://doi.org/10.9790/487X-16350110
Pallant, J. 2011. A step by step guide to data analysis using SPSS program survival manual. 4th edition. Crow’s Nest, Australia: Allen & Unwin.
Pheng, L.S. & Shiua, S.C. 2000. The maintenance of construction safety: Riding on ISO 9000 quality management systems. Journal of Quality in Maintenance Engineering, 6(1), pp. 28-44. https://doi.org/10.1108/13552510010311327
Tam, C.M., Zeng, S.X. & Deng, Z.M. 2004. Identifying elements of poor construction safety management in China. Safety Science, 42(7), pp. 569-586. https://doi.org/10.1016/j.ssci.2003.09.001
Tavakol, M. & Dennick, R. 2011. Making sense of Cronbach’s alpha. International Journal of Medical Education, 2, pp. 53-55. https://doi.org/10.5116/ijme.4dfb.8dfd
Teo, A.L., Haupt, T.C. & Feng, Y. 2008. Construction health and safety performance in developing and developed countries: A parallel study in South Africa and Singapore. In: Hinze, J., Boehner, S. & Lew, J. (Eds). Proceedings of CIB W99 International Conference, 14th Rinker International Conference on Evolution of and Directions in Construction Safety and Health, 9-11 March 2008, Gainesville, Florida, pp. 485-499.
Toole, T. 2002. Construction site safety roles. Journal of Construction Engineering and Management, 128(3), pp. 203-210. https://doi.org/10.1061/(ASCE)0733-9364(2002)128:3(203)
Vinodkumar, M.N. & Bhasi, M. 2011. A study on the impact of management system certification on safety management. Safety Science, 49(2011), pp. 498-507. https://doi.org/10.1016/j.ssci.2010.11.009
Acta Structilia 2018: 25(2)
68
Wachter, J.K. & Yorio, P.L. 2014. A system of safety management practices and worker engagement for reducing and preventing accidents: An empirical and theoretical investigation. Accident Analysis and Prevention, 68(2014), pp.117-130. https://doi.org/10.1016/j.aap.2013.07.029
Wegner, T. 2012. Applied business statistics methods and excel-based applications solutions manual. 4th edition. Cape Town, South Africa: Juta.
Wehbe, F., Hattab, M.A. & Hamzeh, F. 2016. Exploring associations between resilience and construction safety networks. Safety Science, 82(2016), pp. 338-351. https://doi.org/10.1016/j.ssci.2015.10.006
Wokutch, R. & VanSandt, C. 2000. OHS management in the United States and Japan: The DuPont and the Toyota models. In: Frick, K., Jensen, P., Quinlan, M. & Wilthagen, T. (Eds). Systematic OHS management: Perspectives on an international development. Amsterdam: Pergamon, pp. 367-389.
Yankah, K. 2012. Health and safety management practices by building contractors in the Ashanti region. Unpublished Master of Science in Construction Management thesis. Kumasi, Ghana, KNUST: Department of Building Technology.
Yu, Q.Z., Ding, L.Y., Zhou, C. & Luo, H.B. 2014. Analysis of factors influencing safety management for metro construction in China. Accident Analysis and Prevention, 68(2014), pp. 131-138. https://doi.org/10.1016/j.aap.2013.07.016
Zou, P. & Zhang, G. 2009. Comparative study on the perception of construction safety risks in China and Australia. Journal of Construction Engineering and Management, 135(7), pp. 620-627. https://doi.org/10.1061/(ASCE)CO.1943-7862.0000019

69
Navorsingsartikels • Research articles
Olanrewaju BalogunMr Olanrewaju A. Balogun, Master’s, Department of Construction Management and Quantity Surveying, University of Johannesburg, corner Siemert and Beit Streets, Doornfontein, 2028, Johannesburg, South Africa. Phone: + (27) 713 822 103, email: <[email protected]>
Justus AgumbaDr Justus N. Agumba, Department of Construction Management and Quantity Surveying, Durban University of Technology corner Botanic Road and Steve Biko Road, Block S3 level 2, Durban, South Africa. Phone: + (27) 713 373 2466, email: <[email protected]>
Nazeem AnsaryMr Nazeem Ansary, Department of Building Sciences, Tshwane University of Technology, Pretoria, South Africa. Phone: + (27) 12 382 5242, email: <[email protected]>
DOI: http://dx.doi.org/10.18820/24150487/as25i2.3ISSN: 1023-0564e-ISSN: 2415-0487Acta Structilia 2018 25(2): 69-93© Creative Commons With Attribution (CC-BY)
Evaluating credit accessibility predictors among small and medium contractors in the South African construction industry
Peer reviewed and revised
*The authors declared no conflict of interest for this title or article
AbstractThe importance of small and medium construction enterprises (SMEs) in the South African economy has been recognised. However, construction SMEs are faced with difficulties in accessing credit from financial institutions. Furthermore, past research has failed to reach consensus on the demographic and socio-economic factors that predict credit accessibility for construction SMEs in South Africa. This study determines the predicting demographic and socio-economic factors for credit accessibility for construction SMEs from financial institutions in South Africa. A quantitative research approach was used and data was collected, using a questionnaire survey from 250 construction SMEs who were conveniently sampled. The demographic and company profile factors predicting credit accessibility were modelled and set as the independent variables with credit accessibility to the construction SMEs as the dependent variable, irrespective of the amount obtained from financial institutions. The data was analysed using the Statistical Package for the Social Sciences (SPSS) version 22. Binary logistic regression analysis was used to analyse the predictors of obtaining credit. In the first model, the results revealed that the credit accessed irrespective of the amount and those who did not receive credit at all, when modelled with the conceptualised predictors suggested, showed no significant predictors of obtaining credit. However, in the second model, when the conceptualised predictors were modelled with full and partial credit, the results

Acta Structilia 2018: 25(2)
70
established that age group, current position in the organisation, tax number and location were good predictors of obtaining full credit. The findings of this study cannot be generalised across South Africa, as the study was conducted only in the Gauteng province. The value of this study informs owners of SMEs in the construction industry to provide their age and current position in the organisation when applying for credit. They should also provide the tax number and the location of the business in order to improve their chances of obtaining full credit from financial institutions. Keywords: Credit accessibility, determinants of credit accessibility, full credit, small and medium enterprises
Abstrak Die belangrikheid van klein en medium konstruksie-ondernemings (KMO’s) in die Suid-Afrikaanse ekonomie is erken. Konstruksie KMO’s word egter gekonfronteer met probleme om krediet by finansiële instellings te kry. Daarbenewens het vorige navorsing misluk om konsensus te bereik oor die demografiese en sosio-ekonomiese faktore wat krediettoeganklikheid vir konstruksie-KMO’s in Suid-Afrika voorspel. Hierdie studie bepaal die bepalende demografiese en sosio-ekonomiese faktore vir krediettoeganklikheid vir konstruksie KMO’s by finansiële instellings in Suid-Afrika. ’n Kwantitatiewe navorsingsbenadering is gevolg en data is ingesamel deur gebruik te maak van ’n vraelysopname onder 250 konstruksie-KMO’s. Die demografiese en maatskappy profielfaktore wat krediettoeganklikheid voorspel, is gemodelleer en gestel as die onafhanklike veranderlikes. Krediettoeganklikheid vir die konstruksie KMO is die afhanklike veranderlike, ongeag die bedrag wat verkry is van finansiële instellings. Die data is geanaliseer deur gebruik te maak van die Statistical Package for the Social Sciences (SPSS) versie 22. Binêre logistieke regressie-analise is gebruik om die voorspellers van die verkryging van krediet te analiseer. In die eerste model het die resultate getoon dat die krediet wat toeganklik is ongeag die bedrag en diegene wat nie krediet ontvang het nie, wanneer dit gemodelleer is met die konseptualiseerde voorspellers wat voorgestel word, geen beduidende voorspellers toon van die verkryging van krediet nie. In die tweede model waar die konseptualiseerde voorspellers egter met volle en gedeeltelike kredietmodelle gemodelleer is, het die resultate bepaal dat ouderdomsgroep, huidige posisie in die organisasie, belastingnommer en werkplek goeie voorspellers was om volle krediet te verkry. Die bevindinge van hierdie studie kan nie oor Suid-Afrika veralgemeen word nie, omdat die studie slegs in die Gauteng-provinsie uitgevoer is. Die waarde van hierdie studie stel eienaars van KMO’s in die konstruksiebedryf in kennis om hul ouderdom en huidige posisie in die organisasie te verskaf wanneer hulle om krediet aansoek doen. Hulle moet ook die belastingnommer en die ligging van die besigheid verskaf om hul kanse om volle krediet van finansiële instellings te verkry, te verbeter.Sleutelwoorde: Bepalers van krediettoeganklikheid, krediettoeganklikheid, volle krediet, klein- en medium-ondernemings
1. IntroductionThe term ‘Small and Medium Enterprises’ (SMEs) is defined by commonly used criteria such as the number of employees, total net assets, sales and investment level. The main criteria is the number of permanent employees in an organisation (Aduda, Magutu & Wangu,

Balogun, Agumba & Ansary • Evaluating credit accessibility...
71
2012: 205). Aduda et al. (2012: 205) define SMEs as companies that employ up to 300 employees and have total assets and sales of up to $15 million. However, in the South African construction industry, the term ‘small enterprise’ is defined as a company that employs 50 or less employees and has an annual turnover of less than R5 million. Medium enterprises employ between 51 and 200 employees and have less than R20 million turnover annually (RSA, 1996: 15).
In South Africa, SMEs contribute not only to the economy, but also, together with co-operatives, towards defeating the scourges of unemployment, poverty and inequality (Small Enterprise Finance Agency (SEFA), 2016). During 2017, R1 billion was injected in the South African economy to assist 43,000 SMMEs and co-operatives. This amount, in turn, helped create and maintain close to 56,000 jobs (SEFA, 2017).
Despite the importance of SMMEs to the South African economy, the small and medium construction enterprises (SMEs) sector is still described as, to a large extent, underdeveloped; lacking the sophistication enjoyed by larger well-established contractors; left on the periphery of the mainstream economy, and not participating fully in the economy (Department of Public Works, 1999). Martin (2010) opines that SMEs face a lack of competencies, including knowledge of pricing procedures, contractual rights, and obligations; law, management techniques, and principles, as well as technology. Furthermore, the Construction Industry Development Board (CIDB, 2008) indicates that SMEs’ formal education is based on construction trade training such as carpentry, plumbing, electrical installation, and bricklaying. It can be argued that this level of training might impede SMEs’ knowledge of financial management. Other studies in South Africa have revealed that capacity and financial resources are major challenges among SMEs (Fatoki, 2014; Agumba, Adegoke & Otieno, 2005). According to Grimsholm and Poblete (2011), SMEs are not able to access finance or credit, thus stifling their growth and capability.
It is vital to note that the concept of credit is predated by the use of money. This can be traced to as far back as the Code of Hammurabi, established in approximately 1750 B.C. (Nagarajan, 2011: 109). From its beginnings, credit has been used as a selling tool, to bind customers to a particular vendor, and to allow them to acquire more substantial goods for which they do not have the necessary capital (Mandell, 1990). The theory of credit suggests that financial institutions would be more willing to extend credit if, in case of default, they could easily enforce contracts by forcing repayment or seizing collateral.

Acta Structilia 2018: 25(2)
72
To some extent, the amount of credit in a country would depend on the existence of legislation that protects the creditors’ rights on proper procedures that lead to repayment (Aduda et al., 2012: 203).
It is accepted that SMEs are a vehicle of economic empowerment in the construction and other industries in South Africa. However, they are faced with numerous constraints to enable them to maximize their economic potential. Furthermore, construction SMEs find it difficult to access the credit for which they applied, let alone any credit at all. It can be unequivocally indicated that there is a paucity of studies in South Africa to establish the determinants predicting full credit and partial credit accessibility and to assess the determinants predicting construction SMEs’ accessing the credit or not. Lack of consensus on the predictors of credit accessibility among SMEs is a problem that must be solved. To find solutions for the predictors of credit accessibility for construction SMEs, it was important to determine the factors that prevent construction SMEs from accessing credit. To do so, the socio-economic and demographic determinants predicting full credit accessibility for SMEs from financial institutions were assessed and evaluated by means of regression statistics testing whether participating SMEs received full credit, part of the credit, or no credit at all.
2. Literature review
2.1 Challenges preventing SMEs from accessing credit
According to Alhassan & Sakara (2014: 33) and Bondinuba (2012: 25), the factors that stifle SMEs from accessing credit include informational barriers, lack of management expertise, high default rate, and monitoring. Banks face these challenges in lending credit to SMEs. Bondinuba (2012: 25) found that the main challenges that make it difficult for SMEs to access finance include policy regulation, inadequate financial infrastructure, stringent collateral security requirements, and a lack of institutional capacity of the SMEs sector. Kayanula & Quartey (2000) and the World Bank Report (2014) established that the non-availability and cost of finance as well as the legal framework and policies regarding investment, together with a lack of proper bookkeeping among SMEs, fail to provide the right support infrastructure to facilitate SMEs lending by the financial institutions in Ghana.
Angela and Motsa Associates (2004) as well as Foxcroft, Wood, Kew, Herrington and Segal (2002) reveal that entrepreneurs face several problems in their efforts to access and borrow finance for

Balogun, Agumba & Ansary • Evaluating credit accessibility...
73
business purposes, particularly from banks. The main problems are a lack of collateral, refusal to use own collateral, failure to make a remarkable own contribution, blacklisting, failure to review attractive financial records and/or lack of business plans, and high risk of small entrepreneurs.
In South Africa, banks advance four main reasons for their reluctance to extend credit to small enterprises, namely high administrative costs of small-scale lending, asymmetric information, high-risk perception, and lack of collateral (Mazanai & Fatoki, 2012: 60). The Organization for Economic Cooperation and Development (OECD) (2006: 9) argues that the difficulties that SMEs encounter when trying to access financing can be due to an incomplete range of financial products and services, regulatory rigidities or gaps in the legal framework, or a lack of information on both the bank’s and the SME’s side. Banks may avoid providing financing to certain types of SMEs, in particular, start-ups and very young firms that typically lack sufficient collateral, or firms whose activities offer the possibilities of high returns, but at a substantial risk of loss (OECD, 2006: 11-12).
2.2 Predictors of credit accessibility
Kimutai and Ambrose (2013) establish that most of the commercial banks ration credit, in order to reduce risk and to avoid the risk of adverse selection and moral hazard. Therefore, the key factors that influence credit rationing by banks are loan characteristics, firm characteristics, and observable characteristics.
Critical factors such as the availability of a business plan, collateral, maintenance of a good relationship (networking), managerial competency, a good credit score (capacity to pay; experience in credit use), and the borrower’s character (attitude towards risk) define the requirements for SMEs to have access to financial institutions and bank credit (Aduda et al., 2012; Fatoki, 2014; Fatoki & Odeyemi, 2010). Together with financial activities such as business registration, documentation/recording, and asset ownership (Nkuah, Tanyeh & Gaeten, 2013), the profile of the business terms of number of employees, size, sector and form of the business in the economy form some of the crucial factors to be successful in accessing bank finance (Alhassan & Sakara, 2014; Kira & He, 2012; Musamali & Tarus, 2013).
In South Africa, educational achievement, investment in production costs, access to market information, and membership of the cooperative negatively influence access to credit, specifically for entrepreneurs in the farming industry (Etonihu, Rahaman & Usman,

Acta Structilia 2018: 25(2)
74
2013; Pandula, 2011). A separate study by Chauke, Motlhatlhana, Pfumayaramba and Anim (2013) found that the predictors for credit accessibility by smallholder farmers were attitude towards risk, distance between lender and borrower, perception on loan repayment, perception on lending procedures, and total value of assets (Chauke & Anim, 2013; Dzadze, Osei Mensah, Aidoo & Nurah, 2012). Gender, marital status, lack of guarantor, and high interest rates predicted access to credit among rural framers (Ololade & Olagunju, 2013: 20). These factors might be different from those in the construction sector, hence reinforcing the need for the study.
Other factors such as membership with business association, capital, and economic conditions were considered to be moderately important in availing credit to SMEs (Aduda et al., 2012; Pandula, 2011).
In view of these discussions, it is evident that a wide range of factors set the profile of lenders and predict credit accessibility to financial institutions. These factors can be grouped into the demographic and company profile factors that predict full credit accessibility from financial institutions for lenders.
2.3 The demographic and socio-economic determinants of credit accessibility
For the purposes of this article, the demographic and socio-economic determinants of gaining credit accessibility for SMEs were set as gender, age group, current position of the owner, type of business ownership, business tax number, location of the company, and collateral/security.
2.3.1 Gender
According to Wilson (2017), gender plays a significant role in accessing credit. A number of studies have shown that, in SMEs, females are more constrained and face more obstacles than their male counterparts in accessing credit (Carter, 2011; Roper & Scott, 2009). In their study of SMEs regarding the impact of gender on accessing credit, Irwin and Scott (2010) established that females obtain credit more easily compared to their male counterparts. It can, therefore, be argued that gender predicts credit accessibility.
2.3.2 Age group
The perception that a particular age group tends to behave differently from other age groups means that, for instance, older SMEs’ owners/managers mostly appear to be at risk (Nakano & Nguyen, 2011) and do not want to apply for bank loans. Younger
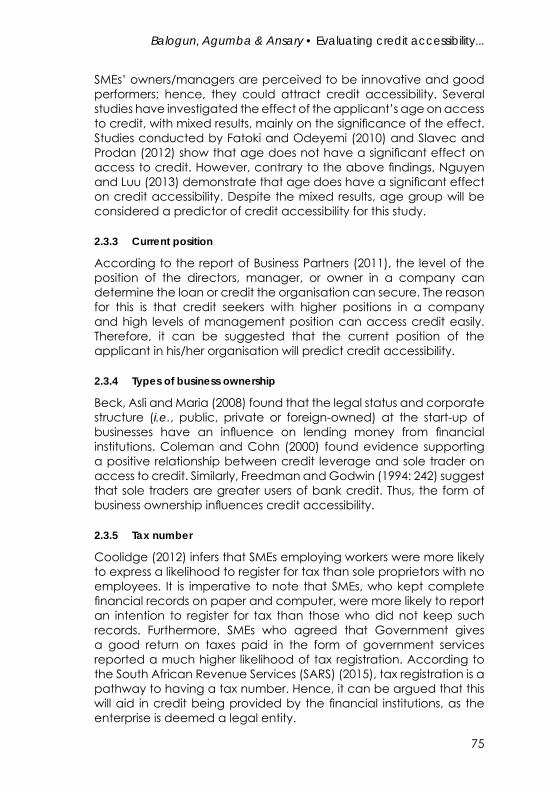
Balogun, Agumba & Ansary • Evaluating credit accessibility...
75
SMEs’ owners/managers are perceived to be innovative and good performers; hence, they could attract credit accessibility. Several studies have investigated the effect of the applicant’s age on access to credit, with mixed results, mainly on the significance of the effect. Studies conducted by Fatoki and Odeyemi (2010) and Slavec and Prodan (2012) show that age does not have a significant effect on access to credit. However, contrary to the above findings, Nguyen and Luu (2013) demonstrate that age does have a significant effect on credit accessibility. Despite the mixed results, age group will be considered a predictor of credit accessibility for this study.
2.3.3 Current position
According to the report of Business Partners (2011), the level of the position of the directors, manager, or owner in a company can determine the loan or credit the organisation can secure. The reason for this is that credit seekers with higher positions in a company and high levels of management position can access credit easily. Therefore, it can be suggested that the current position of the applicant in his/her organisation will predict credit accessibility.
2.3.4 Types of business ownership
Beck, Asli and Maria (2008) found that the legal status and corporate structure (i.e., public, private or foreign-owned) at the start-up of businesses have an influence on lending money from financial institutions. Coleman and Cohn (2000) found evidence supporting a positive relationship between credit leverage and sole trader on access to credit. Similarly, Freedman and Godwin (1994: 242) suggest that sole traders are greater users of bank credit. Thus, the form of business ownership influences credit accessibility.
2.3.5 Tax number
Coolidge (2012) infers that SMEs employing workers were more likely to express a likelihood to register for tax than sole proprietors with no employees. It is imperative to note that SMEs, who kept complete financial records on paper and computer, were more likely to report an intention to register for tax than those who did not keep such records. Furthermore, SMEs who agreed that Government gives a good return on taxes paid in the form of government services reported a much higher likelihood of tax registration. According to the South African Revenue Services (SARS) (2015), tax registration is a pathway to having a tax number. Hence, it can be argued that this will aid in credit being provided by the financial institutions, as the enterprise is deemed a legal entity.

Acta Structilia 2018: 25(2)
76
2.3.6 Location of the business
According to Berger and Udell (2006) and Gilbert (2008), SME firms that are geographically nearer to lending institutions are more likely to gain access to the financial institution. This means that financial institutions can utilise available qualitative information more easily to establish the credibility of the SME applicants. Fatoki and Asah (2011) support this and affirm that SMEs located in towns are more successful in accessing credit compared to those in rural areas. These studies, therefore, propose that the location of the business predicts credit accessibility.
2.3.7 Collateral security
In lending agreements, collateral is a borrower’s pledge of specific property to a lender to secure repayment of a loan (Joan, 1995). The collateral serves as protection for a lender against a borrower’s default. If a borrower defaults on a loan, that borrower forfeits the property pledged as collateral. The lender then becomes the owner of the collateral. Joan (1995) established that collateral is a major determinant of credit accessibility by SMEs.
3. Research method and design This study determined the predictors for gaining full credit accessibility for construction SMEs from financial institutions in South Africa. A quantitative research design was adopted, in which the use of structured questionnaire surveys enables researchers to generalise their findings from a sample of a population (Creswell, 1994). In this study, using logistic regression analysis, the socio-economic and demographic data from construction SMEs in South Africa were used to test and set the predictors of accessing full credit. In the questionnaire, factors preventing SMEs from accessing credit from financial institutions were rated and then ranked as the list of constraints experienced by SMEs from accessing credit (Creswell, 2005).
3.1 Sampling method and size
A list provided by the CIDB shows a total of 5,000 grade 1; 5,000 grade 2; 2,461 grade 3; 2,797 grade 4, and 1,758 grade 5 registered construction SMEs in South Africa, resulting in a population of 17,016. Non-probability convenience sampling was used to select participants from this population who were registered with the CIDB, but located in the city of Johannesburg Metropolitan Municipality, city of Tshwane Metropolitan Municipality, Ekurhuleni Metropolitan

Balogun, Agumba & Ansary • Evaluating credit accessibility...
77
Municipality, and the West Rand District Municipality as grade 1 to 6 contractors. From this list, a total sample of 250 SME contractors were selected for this study. This sample size is supported by the sample size table of Israel (1992), at a sampling precision of +/-7%. The table gives recommended sample sizes for general research activities, applicable to any defined population. From the table, the recommended sample size for a population of >15,000 is 201. This recommendation validates the sample size of 250 as efficient for the population of 17,016 (Israel, 1992: 3).
3.2 Response rate
From the sample of 250 construction SMEs, a total of 179 SMEs completed and returned the questionnaire survey responses in the period August to November 2015, resulting in a response rate of 71.60%. According to Moyo and Crafford (2010: 68), contemporary built-environment survey response rates range between 7% and 40%, in general.
3.3 Data collection
A structured questionnaire was distributed using the drop-and-collect method as well as electronically via email to a selected sample of 250 SME contractors in the Gauteng province, South Africa. The topics on accessing full credit used in the questionnaire were extracted from reviews of the literature, resulting in the formulation of a questionnaire divided into three sections. Section one, on the respondent’s profile, obtained personal information on age, gender, population group, education qualification, marital status, current position, and years of experience in business. Section two obtained the company profile information, which included location of the business, ownership, construction industry development board (CIDB) grading, number of full-time employees, and requirements of financial institutions (e.g., collateral and tax number). These socio-economic and demographic data form the independent variables used in the binary logistic regression analysis. Section three sets questions that rate the factors preventing SMEs from accessing credit. To reduce the respondent’s bias, closed-ended questions were preferred for section three (Akintoye & Main, 2007: 601).
The questionnaires were completed anonymously. The collection of the data and the presentation of the results cannot harm the respondents or their employing organisations in any way.

Acta Structilia 2018: 25(2)
78
3.4 Data analysis and interpretation of findings
The Statistical Package for Social Sciences (SPSS) version 22 was used to perform the binary logistic regression analysis (Pallant, 2013). Logistic regression is recommended over linear regression when modelling dichotomous responses, allowing the researcher to estimate probabilities of the response occurring (Hosmer & Lemeshow, 2000).
To analyse the socio-economic and demographic data, the logistic regression coded these independent variables as gender (male 1 and female 2); age group (30 years and below 1, 31 years to 39 years 2, 40 years to 49 years 3, and 50 years and above 4); current position (director 1, owner 2, manager 3, and manager/owner 4); ownership (sole proprietorship 1, partnership 2, limited partnership 3, limited liability company 4, and corporation (for-profit) 5; tax number (No, 0, and Yes, 1); location of business (city of Johannesburg Metropolitan Municipality 1, city of Tshwane Metropolitan Municipality 2, Ekurhuleni Metropolitan Municipality 4, and West Rand District Municipality 4); collateral (No, 0, and Yes, 1).
For the analysis of credit accessibility, the logistic regression coded the dichotomous responses as “yes” = 1 and “no” = 0. The regression analysis modelled the dependent variables into two tests. In test one (Table 4), the predictors of accessing full credit were defined as “Yes” = having accessed full credit, and “No” = having accessed part of the credit. In test two (Table 6), the predictors of accessing credit were defined as “Yes” = accessed credit; and “No” = did not access credit.
To test whether the data used in the model was good enough for the binary logistic regression, the Hosmer-Lemeshow goodness-of-fit test was used. This test (Table 5) compares the observed and expected frequencies of events and non-events in order to assess how well the model fits the data (Hosmer & Lemeshow, 2013). For this study, the significance level was set at 0.05. This means that, if the p-value for the goodness-of-fit test is higher than 0.05, the model can be used for statistical analysis.
To predict the independent variables’ influence on credit accessibility (dependent variables), mathematical model 1 was set up as:
ln (p/1-p) = β0 + β1x1 + β2x2 +… + βkxk ............................................. (1)
where p is the estimated probability of passing, and x1, x2, …, xk are independent variables.

Balogun, Agumba & Ansary • Evaluating credit accessibility...
79
The specific logistic regression was modelled as follows:
ln (p/1-p) = β0 + β1Gender + β2Age Group + β3CurPostion + β4TypesBusOwnSh + β5TaxNo + β6LocBus + β7Collateral ε.
(p/1-p) is the odds ratio, where (p) is the probability of the response occurring divided by (1-p), which is the probability of it not occurring. To find a relationship between the dependent and independent variables, the maximum likelihood of the odds ratio’s values is defined as: >1 (positive association); =1 (no association), and <1 (negative association). In reporting the level of significance (p-value), a value of >0.05 means that the independent variable shows little significance to be set as a predictor to gain full credit and a value of <0.05 means that the independent variable shows a strong significance to be set as a predictor to gain full credit.
The factors preventing SMEs from accessing credit were measured using a 5-point Likert scale. Likert-type or frequency scales use fixed choice response formats and are designed to measure attitudes or opinions (Bowling, 1997). For the purposes of analysis and interpretation, the following scale measurement was used regarding mean scores (MSs), where 1 = Strongly disagree (≥ 1.00 ≤ and <1.80); 2 = Disagree (≥ 1.81 and ≤ 2.60); 3 = Neutral (≥ 2.61 and ≤ 3.40); 4 = Agree (≥3.41 and ≤ 4.20), and 5 = Strongly agree (≥4.21 and ≤ 5.00). The data were captured using the SPSS program, upon which the findings were reviewed against the foregoing literature review.
3.5. Limitation(s) of the study
The study cannot be generalised across South Africa, as the study was conducted only in the Gauteng province.
4. Results and discussionsTable 1 shows the socio-economic and demographic data of respondents. Based on frequency of occurrence, the majority of the respondents were males (63%). The majority of the respondents was in the age group between 40 and 49 years of age (51%). Of the respondents, 82% occupied the position of owners, and 98% of the SMEs are sole proprietors. The majority (41%) of the SMEs were located in the city of Johannesburg metropolitan.

Acta Structilia 2018: 25(2)
80
Table 1: Profile of respondents and organisation
Gender Frequency Percentage
Male 112 63
Female 67 37
Age group
30 years and below 2 1
31-39 years 49 27
40-49 years 92 51
50 years and above 36 20
Current position
Director 29 16
Owner 146 82
Manager 3 2
Manager/owner 1 1
Ownership
Sole proprietorship 175 98
Partnership 2 1
Limited partnership 1 1
Limited liability company (LLC) 1 1
Location of company
City of Johannesburg metropolitan 74 41
City of Tshwane metropolitan 42 24
Ekurhuleni metropolitan 34 19
West Rand district municipality 29 16
Based on the scale measurement used regarding MSs, Table 2 shows the ranking of the factors preventing SMEs from accessing credit, as perceived by the respondents.
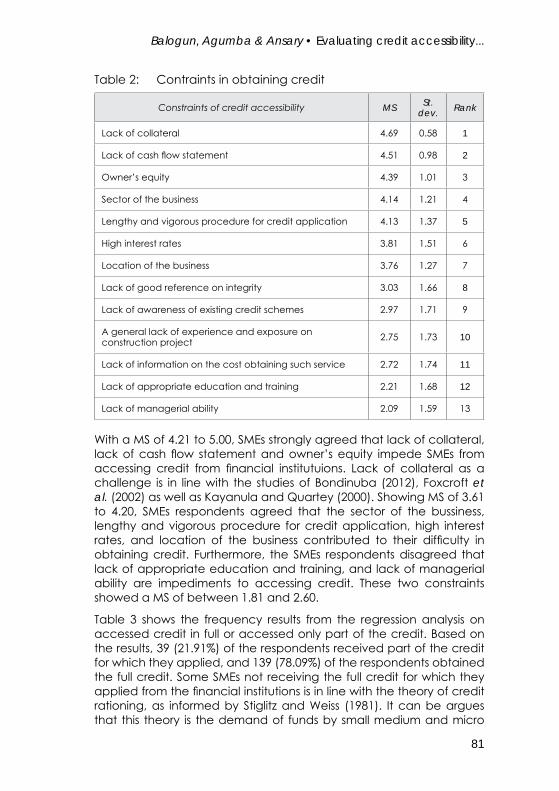
Balogun, Agumba & Ansary • Evaluating credit accessibility...
81
Table 2: Contraints in obtaining credit
Constraints of credit accessibility MS St. dev. Rank
Lack of collateral 4.69 0.58 1
Lack of cash flow statement 4.51 0.98 2
Owner’s equity 4.39 1.01 3
Sector of the business 4.14 1.21 4
Lengthy and vigorous procedure for credit application 4.13 1.37 5
High interest rates 3.81 1.51 6
Location of the business 3.76 1.27 7
Lack of good reference on integrity 3.03 1.66 8
Lack of awareness of existing credit schemes 2.97 1.71 9
A general lack of experience and exposure on construction project 2.75 1.73 10
Lack of information on the cost obtaining such service 2.72 1.74 11
Lack of appropriate education and training 2.21 1.68 12
Lack of managerial ability 2.09 1.59 13
With a MS of 4.21 to 5.00, SMEs strongly agreed that lack of collateral, lack of cash flow statement and owner’s equity impede SMEs from accessing credit from financial institutuions. Lack of collateral as a challenge is in line with the studies of Bondinuba (2012), Foxcroft et al. (2002) as well as Kayanula and Quartey (2000). Showing MS of 3.61 to 4.20, SMEs respondents agreed that the sector of the bussiness, lengthy and vigorous procedure for credit application, high interest rates, and location of the business contributed to their difficulty in obtaining credit. Furthermore, the SMEs respondents disagreed that lack of appropriate education and training, and lack of managerial ability are impediments to accessing credit. These two constraints showed a MS of between 1.81 and 2.60.
Table 3 shows the frequency results from the regression analysis on accessed credit in full or accessed only part of the credit. Based on the results, 39 (21.91%) of the respondents received part of the credit for which they applied, and 139 (78.09%) of the respondents obtained the full credit. Some SMEs not receiving the full credit for which they applied from the financial institutions is in line with the theory of credit rationing, as informed by Stiglitz and Weiss (1981). It can be argues that this theory is the demand of funds by small medium and micro

Acta Structilia 2018: 25(2)
82
enterprises (SMMEs) and the supply of funds (Mazanai & Fatoki, 2012). Furthermore, one respondent did not indicate whether the company received full or partial credit. However, Table 6 justifies this finding, as the respondent indicated that the company did not receive credit at all.
Table 3: Full or partial credit accessed
Credit accessed Respondents Regression code Percentage
Accessed partial credit 39 No 21.91
Accessed full credit 139 Yes 78.09
Total 178 100.00
Table 4 shows the results of the binary logistic regression, in which the model tested demographic and socio-economic independent variables against the dependent variable (full credit accessibility) for their significance to be set as predictors of accessing full credit. With significance (p-value) levels of more than 0.050, gender (0.075) and type of ownership (1.000) did not predict full credit accessibility.
Reporting a significance level of less than 0.050, the results showed that the age group 40-49 years was more likely to receive full credit than applicants who were in the age group 30 years and below. This finding correlates with the findings of Nguyen and Luu (2013) as well as with those of Abdulsaleh and Worthington (2013: 38). It is interesting to note that applicants who are 30 years and younger are likely to receive partial credit rather than full credit. With a significance (p-value) level of less than 0.050, the current position predictor predicted full credit accessibility. The finding is in line with the findings of Business Partners (2011). However, it is interesting to note that no category of the current position held in the SMEs predicted full credit accessibility, as they all showed a significance (p-value) level greater than 0.05.
The study found that, when the SMEs provided their tax numbers, they had a greater probability of accessing full credit, compared to those who did not provide their tax numbers. The level of significance was less than 0.05 at 0.015, hence a strong predictor. Furthermore, the SMEs whose premises were in Location, Ekurhuleni metropolitan municipality in Gauteng province had a higher probability of getting full credit, compared to SMEs in the city of Johannesburg metropolitan municipality. This predicator was significant at 0.043, which was less than 0.05. The odds ratio showed that getting the full credit was 0.246 more than those SMEs in the city of Johannesburg. This finding is supported by Berger and Udell (2006) and by Fatoki and Asah (2014). Berger and Udell (2006) indicate that the geographic location of a

Balogun, Agumba & Ansary • Evaluating credit accessibility...
83
firm’s close proximity to the financial institution had an influence on the firm obtaining credit. On the other hand, Fatoki & Asah (2014) indicate that those in urban areas were more likely to obtain credit than those in rural areas. Therefore, it can be suggested that the location of the business is vital for credit accessibility.
Although the respondents ranked collateral as one of the variables that constrain credit accessibility, it is important to mention that, in the binary regression analysis, collateral did not show as a predictor of credit accessibility among construction SMEs. Therefore, collateral is not included in Tables 4 and 7, showing the results for predictors of accessing credit.
Table 4: Predictors of accessing full credit
VariableExp. (B)
Odds ratio
95% C.I. for
EXP (B)
Lower
95% C.I. for EXP (B)
Upper
P-value
Gender (1) 2.102 0.929 4.757 0.075Age group 0.133
Age group 31-40 years (1) 135383335.572 0.000 0.999
Age group 40-49 years (2) 0.269 0.079 0.916 0.036
Age group 50 years and over (3) 0.668 0.215 2.074 0.485
Current position 0.040Current position owner (1) 0.000 0.000 . 1.000Current position manager (2) 0.000 0.000 . 1.000
Current position manager/owner (3) 2.191 0.000 . 1.000
Ownership 1.000Ownership partnership (1) 0.000 0.000 . 1.000Ownership limited partnership (2) 1.357 0.000 . 1.000
Ownership limited liability company (LLC) (3) 1.274 0.000 . 1.000
Tax number (1) 0.050 0.004 0.564 0.015Location (municipality) 0.085
Location, City of Tshwane Metropolitan Municipality (1)
0.785 0.218 2.828 0.711
Location, Ekurhuleni Metropolitan Municipality (2)
0.246 0.063 0.958 0.043
Location, West Rand District Municipality (3) 0.707 0.175 2.863 0.627
3470747228046773200.000 0.999
Dependent variable: full credit accessibility (0 = partial credit; 1 = full credit) sig. at 5%
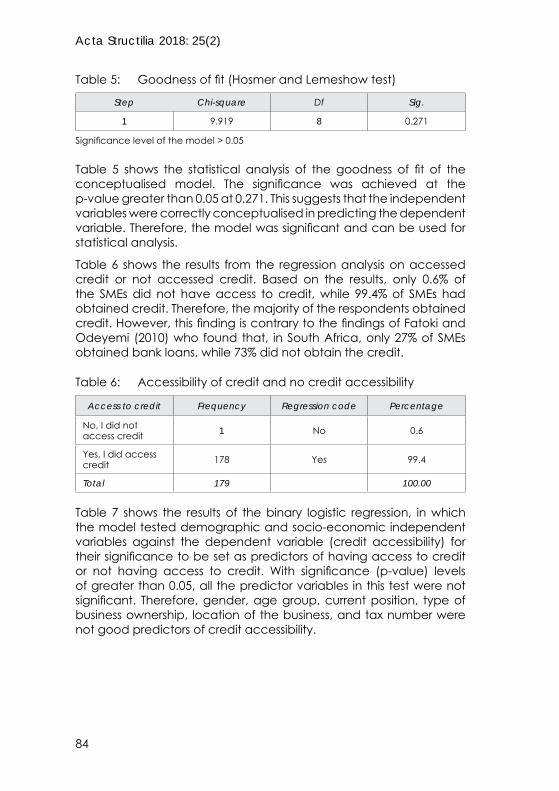
Acta Structilia 2018: 25(2)
84
Table 5: Goodness of fit (Hosmer and Lemeshow test)
Step Chi-square Df Sig.
1 9.919 8 0.271
Significance level of the model > 0.05
Table 5 shows the statistical analysis of the goodness of fit of the conceptualised model. The significance was achieved at the p-value greater than 0.05 at 0.271. This suggests that the independent variables were correctly conceptualised in predicting the dependent variable. Therefore, the model was significant and can be used for statistical analysis.
Table 6 shows the results from the regression analysis on accessed credit or not accessed credit. Based on the results, only 0.6% of the SMEs did not have access to credit, while 99.4% of SMEs had obtained credit. Therefore, the majority of the respondents obtained credit. However, this finding is contrary to the findings of Fatoki and Odeyemi (2010) who found that, in South Africa, only 27% of SMEs obtained bank loans, while 73% did not obtain the credit.
Table 6: Accessibility of credit and no credit accessibility
Access to credit Frequency Regression code Percentage
No, I did not access credit 1 No 0.6
Yes, I did access credit 178 Yes 99.4
Total 179 100.00
Table 7 shows the results of the binary logistic regression, in which the model tested demographic and socio-economic independent variables against the dependent variable (credit accessibility) for their significance to be set as predictors of having access to credit or not having access to credit. With significance (p-value) levels of greater than 0.05, all the predictor variables in this test were not significant. Therefore, gender, age group, current position, type of business ownership, location of the business, and tax number were not good predictors of credit accessibility.

Balogun, Agumba & Ansary • Evaluating credit accessibility...
85
Tabl
e 7:
Pre
dic
tors
of a
cces
sing
cred
it
Var
iabl
eEx
p. (B
)O
dd
s rat
io95
% C
.I. fo
r EXP
(B)
Low
er95
% C
.I. fo
r EXP
(B)
Uppe
rP-
valu
e
Gen
der
(1)
1.54
70.
812
2.94
70.
184
Age
gro
up
0.37
6
31-4
0 ye
ars (
1)0.
499
0.01
615
.716
0.69
3
40-4
9 ye
ars (
2)0.
838
0.33
42.
101
0.70
7
50 y
ears
and
ove
r (3)
1.55
70.
695
3.48
60.
282
Cur
rent
pos
ition
0.
526
Ow
ner (
1)10
5019
0579
.980
0.00
0.
1.00
0
Man
ager
(2)
1665
2037
59.3
640.
000
.1.
000
Man
ager
/ow
ner (
3)63
1500
3273
.235
0.00
0.
1.00
0
Ow
ners
hip
0.99
4
Partn
ersh
ip (1
)0.
000
0.00
0.
1.00
0
Limite
d p
artn
ersh
ip (2
)0.
000
0.00
0.
1.00
0
Limite
d lia
bilit
y co
mpa
ny (L
LC) (
3)1.
733
0.00
0.
1.00
0
Tax
num
ber (
1)0.
324
0.04
52.
353
0.26
5
Loca
tion
(mun
icip
ality
) 0.
587
City
of T
shw
ane
Met
ropo
litan
Mun
icip
ality
(1
)0.
577
0.22
21.
498
0.25
9
Ekur
hule
ni M
etro
polit
an M
unic
ipal
ity (2
)0.
520
0.17
81.
521
0.23
2
Wes
t Ran
d D
istric
t Mun
icip
ality
(3)
0.49
90.
169
1.47
00.
207
3470
7472
2804
6773
200.
000
Dep
end
ent v
aria
ble:
cre
dit
acce
ssib
ility
(0 =
no
cred
it ac
cess
ed; 1
= c
red
it ac
cess
ed) s
ig. a
t 5%
Acta Structilia 2018: 25(2)
86
5. Conclusions The study elicited data from construction SMEs personnel who are conversant with the credit accessibility within their enterprise. The analysed data results indicate that SMEs agreed that a lack of collateral/security, lack of cash flow statement and owners’ equity prevent them from accessing credit. However, despite the constraints of accessing credit, which could be a stumbling block, the results show that the majority of the participating SMEs received credit, whether in full or partially. The construction SMEs that obtained credit partially can be impeded in their progress. It can be suggested that, when construction SMEs receive part of the credit, they might apply for credit in other financial institutions or request financial assistance from friends, in order to cover for the deficit.
The age and current position held within a construction SME predicted full accessibility to credit when applicants apply for credit from financial institutions. However, the results of current position do not suggest which specific position within the construction SME predicted credit accessibility. It is imperative to note that the study did not test who was responsible for applying for the credit. Hence, in terms of applying for the credit, the current position held by the participating respondents in their firms was not the credit applicant. Furthermore, tax number and location of the business in the Gauteng province were also predicators of full credit accessibility. However, the gender of the respondent, type of business ownership, and collateral (security) did not predict full credit accessibility by SMEs. However, when the predictors were modelled with whether the SMEs received credit or did not receive credit, the predictors were not good determinants.
6. RecommendationsBased on the conclusions, the study recommends the findings to different stakeholders, namely government, financial institutions, and construction SMEs.
6.1 Recommendations to government
The government needs to encourage construction SMEs to approach financial institutions to apply for credit, as the majority of the SMEs indicated that they obtained credit. Hence, the suggestion from literature that SMEs are not able to access credit can be rejected.
The government needs to be informed of the challenges indicated by the construction SMEs. These restrict them from receiving credit. These

Balogun, Agumba & Ansary • Evaluating credit accessibility...
87
are collateral (security), owners’ equity and cash flow statement. Hence, government could help construction SMEs overcome some of these challenges.
6.2 Recommendation to financial institutions
The financial institutions should be informed of the impediments indicated by the construction SMEs as constraints in accessing credit. These constraints are collateral (security), owners’ equity, and cash flow statement.
6.3 Recommendation to construction SMEs
Construction SMEs should be informed that they should provide the age and current position in the organisation of the person applying for the credit. The information will enable the financial institutions to deal with owners and, in case they are checking older applicants, the age will assist. They should also provide the tax number and the location of the business. The tax number will indicate that the business entity is registered and is thus legal.
7. Further study • Further research could determine if the findings of this
research are consistent across different sectors. Since the study concentrated on SMEs in the construction sector in only the Gauteng province in South Africa, further research in other sectors will shed more light on the findings of this study.
• In addition, the need to replicate this research in the other eight provinces of South Africa in the construction industry will confirm if the results of this research can be generalised across the country.
• This study can also be carried out in other African countries for comparative purposes.
• Although the study establishes some predictors for access to full credit, not all the variables were good predictors. Therefore, a further study can be undertaken to justify these findings.
• The study proposes the use of stepwise logistic regression in future study.
Acta Structilia 2018: 25(2)
88
References Abdulsaleh, A. & Worthington, A. 2013. Small and medium-sized enterprises financing: A review of literature. International Journal of Business and Management, 8(14), pp. 36-54 . https://doi.org/10.5539/ijbm.v8n14p36
Aduda, J., Magutu, O.P. & Wangu, G.M. 2012. The relationship between credit scoring practices by commercial banks and access to credit by small and medium enterprises in Kenya. International Journal of Humanities and Social Science, 2(9), pp. 203-213.
Agumba, J.N., Adegoke, I.O. & Otieno, F.A.O. 2005. Evaluating project management techniques in small and medium enterprises delivering infrastructure in South Africa construction industry. In: Proceedings of the 3rd Postgraduate Conference, Construction Industry Development, Eskom Convention Centre, Midrand, Johannesburg, South Africa, 9-11 October, pp. 52-65.
Akintoye, A. & Main, J. 2007. Collaborative relationships in construction: The UK contractor’s perception. Engineering, Construction and Architectural Management, 14(6), pp. 597-617. http://dx.doi.org/10.1108/09699980710829049.
Alhassan, F. & Sakara, A. 2014. Socio-economic determinants of small and medium enterprises’ (SMEs) access to credit from the Barclays Bank in Tamale-Ghana. International Journal of Humanities and Social Science Studies, I(II), pp. 26-36, September.
Angela Motsa & Associates. 2004. SMME finance sector background paper: A review of key documents on SMME Finance 1994-2004. Johannesburg: Fin Mark Trust.
Beck, T., Asli, D-K. & Maria, S.M.P. 2008. Bank financing for SMEs around the world: Drivers, obstacles, business models, and lending practices. Policy Research Working Paper 4785. World Bank, Washington, DC.
Berger, A.N. & Udell, G.F. 2006. A more complete conceptual framework for SME finance. Journal of Banking & Finance, 30(11), pp. 2945-2966. https://doi.org/10.1016/j.jbankfin.2006.05.008
Bondinuba, F.W. 2012. Exploring the challenges and barriers in accessing financial facilities by small and medium construction firms in Ghana. Civil and Environmental Research, 2(6), pp. 25-35.
Bowling, A. 1997. Research methods in health. Buckingham, UK: Open University Press.

Balogun, Agumba & Ansary • Evaluating credit accessibility...
89
Business Partners. 2011. Investing in entrepreneurs. Making big things happen for small businesses. [online]. Available at: <https://www.businesspartners.co.za/en-za/corporate%20centre/Shareholder-Information/Documents/Financial-results/2011-Annual-Report.pdf> [Accessed: 28 May 2018].
Carter, S. 2011. The rewards of entrepreneurship: Exploring the incomes, wealth, and economic well-being of entrepreneurial households. Entrepreneurship Theory and Practice, 35(1), pp. 39-55. https://doi.org/10.1111/j.1540-6520.2010.00422.x
Chauke, P.K. & Anim, F.D.K. 2013. Predicting access to credit by smallholder irrigation farmers: A logistic regression approach. Journal of Human Ecology, 42(3), pp. 195-202. https://doi.org/10.1080/09709274.2013.11906594
Chauke, P.K., Motlhatlhana, M.L., Pfumayaramba, T.K. & Anim, F.D.K. 2013. Factors influencing access to credit: A case study of smallholder farmers in the Capricorn district of South Africa. African Journal of Agricultural Research, 8(7), pp. 582-585.
Coleman, S. & Cohn, R. 2000. Small firms’ use of financial leverage: Evidence from 1993 survey of small business finances. Journal of Business Entrepreneurship, 12(3), pp. 81-98.
CIDB (Construction Industry Development Board). 2008. Construction health and safety in South Africa, status and recommendations. Pretoria: CIDB.
Coolidge, J. 2012. Findings of tax compliance cost surveys in developing countries. eJournal of Tax Research, 10(2), pp. 250-287.
Creswell, J.W. 1994. Research design, qualitative and quantitative approaches. London: Sage.
Creswell, J.W. 2005. Educational research. Planning, conducting, and evaluating quantitative and qualitative research. Thousand Oaks, CA: Sage.
Department of Public Works. 1999. White paper on creating an enabling environment for reconstruction growth and development in the construction industry, Government Printers, Republic of South Africa. [online]. Available at: <http://www.info.gov.za/ whitepaper/1999/environment.html> [Accessed: 1 February 2017].
Dzadze, P., Osei Mensah, J., Aidoo, R. & Nurah, G.K. 2012. Factors determining access to formal credit in Ghana: A case study of smallholder farmers in the Abura-Asebu Kwamankese district of

Acta Structilia 2018: 25(2)
90
central region of Ghana. Journal of Development and Agricultural Economics, 4(14), pp. 416-423.
Etonihu, K.I., Rahman, S.A. & Usman, S. 2013. Determinants of access to agricultural credit among crop farmers in a farming community of Nasarawa State, Nigeria. Journal of Development and Agricultural Economics, 5(5), pp. 192-196.
Fatoki, O, 2014. Factors influencing the financing of business start-ups by commercial banks in South Africa. Mediterranean Journal of Social Sciences, 5(20), pp. 94-100. https://doi.org/10.5901/mjss.2014.v5n20p94
Fatoki, O. & Asah, F. 2011. The impact of firm and entrepreneurial characteristics on access to debt finance by SMEs in King Williams’ Town, South Africa. International Journal of Business and Management, 6(8), pp. 170-179. https://doi.org/10.5539/ijbm.v6n8p170
Fatoki, O. & Odeyemi, A. 2010. Which new small and medium enterprises in South Africa have access to bank credit? International Journal of Business and Management, 5(10), pp. 128-136. https://doi.org/10.5539/ijbm.v5n10p128
Foxcroft, M., Wood, E., Kew, J., Herrington, M. & Segal, N. 2002. Global Entrepreneurship Monitor: South African Executive Report, Graduate School of Business: University of Cape Town.
Freedman, J. & Godwin, M. 1994. Incorporating the micro-business: Perceptions and misconceptions. In: Hughes, A. & Storey, D.J. (Eds). Finance and the small firm, London: Routledge, pp. 232-283.
Gilbert, B.A. 2008. New venture performance: Does location matter? [online]. Available at: <http://ftp.zew.de/pub/zew-docs/entrepreneurship/Gilbert.pdf> [Accessed: 28 May 2018].
Grimsholm, E. & Poblete, L. 2011. Internal and external factors hampering SME growth: A qualitative case study of SMEs in Thailand. Unpublished Master’s thesis, Gotland University.
Hosmer, D.W. & Lemeshow, S. 2000. Applied logistic regression. New York: Wiley. https://doi.org/10.1002/0471722146
Irwin, D. & Scott, J.M. 2010. Barriers faced by SMEs in raising bank finance. International Journal of Entrepreneurial Behavior & Research, 16(3), pp. 245-259. doi.org/10.1108/13552551011042816. https://doi.org/10.1108/13552551011042816

Balogun, Agumba & Ansary • Evaluating credit accessibility...
91
Israel, G.D. 1992. Sampling the evidence of extension program impact: Determining sample size. [online]. Available at: <https://www.tarleton.edu/academicassessment/documents/Samplesize.pdf> [Accessed: 29 May 2018].
Joan, F.G. 1995. Banks and their customers. Dobbs Ferry, NY: Oceana Publications.
Kayanula, D. & Quartey, P. 2000. The policy environment for promoting small and medium-sized enterprises in Ghana and Malawi. Finance and development research programme, Working Paper Series, Paper No. 15, IDPM, University of Manchester.
Kimutai, C.J. & Ambrose, J. 2013. Factors influencing credit rationing by commercial banks in Kenya. International Journal of Humanities and Social Science, 3(20), pp. 244-252.
Kira, R.A. & He, Z. 2012. The impact of firm characteristics in access of financing by small and medium-sized enterprises in Tanzania. International Journal of Business and Management, 7(24), pp. 108-119. https://doi.org/10.5539/ijbm.v7n24p108
Mandell, L. 1990. The credit card industry: A history. Boston: Twayne Publishers.
Martin, l. 2010. Challenges faced by South African emerging contractors: Review and update. In: Proceedings of the Construction, Building and Real Estate Research Conference of the Royal Institute of Chartered Surveyors, 2-3 September. Dauphine Université, Paris, France, CD-ROM.
Mazanai, M. & Fatoki, O. 2012. Access to finance in the SME sector: A South African perspective. Asian Journal of Business Management, 4(1), pp. 58-67.
Moyo, A. & Crafford, G.J. 2010. The impact of hyperinflation on Zimbabwean construction industry. Acta Structilia, 17(2), pp. 53-83.
Musamali, M.M. & Tarus, K.D. 2013. Does firm profile influence financial access among small and medium enterprises in Kenya? Asian Economic and Financial Review, 3(6), pp. 714-723.
Nagarajan, K.V. 2011. The Code of Hammurabi: An economic interpretation. International Journal of Business and Social Science, 2(8), pp. 108-117.
Nakano, M. & Nguyen, P. 2011. Do older boards affect firm performance? An empirical analysis based on Japanese firms. The

Acta Structilia 2018: 25(2)
92
6th Annual Conference on Asia-Pacific Financial Markets (CAFM), Seoul, Korea, 2 December 2011.
Nguyen, N. & Luu, N. 2013. Determinants of financing pattern and access to formal-informal credit: The case of small and medium sized enterprises in Vietnam. Journal of Management Research, 5(2), pp. 240-259. https://doi.org/10.5296/jmr.v5i2.3266
Nkuah, K.J., Tanyeh, P.J. & Gaeten, K. 2013. Financing small and medium enterprises (SMEs) in Ghana: Challenges and determinants in accessing bank credit. International Journal of Research in Social Sciences, 2(3), pp. 12-25.
OECD (Organization for Economic Cooperation and Development). 2006. The SMEs Financing Gap, Volume 1: Theory and evidence. Paris: OECD Publishing.
Ololade, R.A. & Olagunju, F.I. 2013. Determinants of access to credit among rural farmers in Oyo State, Nigeria. Global Journal of Science Frontier Research Agriculture and Veterinary Sciences, 13(2), pp. 17-22.
Pallant, J. 2013. SPSS, Survival manual: A step-by-step guide to data analysis using IBM, SPSS. 5th edition. London: Allen & Unwin.
Pandula, G. 2011. An empirical investigation of small and medium enterprises’ access to bank finance: The case of an emerging economy. In: Proceedings of the ASBBS, 18(1), 22-28 February, Las Vegas, USA. San Diego, CA: American Society of Business and Behavioural Sciences, pp. 255-273.
Roper, S. & Scott, J.M. 2009. Perceived financial barriers and the start-up decision: An econometric analysis of gender differences using GEM data. International Small Business Journal 27(2), pp. 149-171. https://doi.org/10.1177/0266242608100488
RSA (Republic of South Africa). 1996. National Small Business Act, Act 102 of 1996. Pretoria: Government Printer. [online]. Available at: <https://www.thedti.gov.za/sme_ development/docs/act.pdf> [Accessed: 28 May 2018].
SARS (South African Revenue Services). 2015. My small business, com-panies registering for income tax. [online]. Available at: <http://www.sars.gov.za/AllDocs/Documents/Small%20business/Companies%20registering%20for%20Income%20Tax.pdf> [Accessed: 14 April 2018].
SEFA (Small Enterprise Finance Agency). 2016. Investing in the growth and sustainability of SMMEs and co-operatives. Annual report. [online]. Available at: <http://www.sefa.org.za/Content/

Balogun, Agumba & Ansary • Evaluating credit accessibility...
93
Docs/2016%20sefa%20Annual%20Report.pdf> [Accessed: 14 April 2018].
SEFA (Small Enterprise Finance Agency). 2017. Investing in the growth and sustainability of SMMEs and co-operatives. Annual report.[online]. Available at: <http://www.sefa.org.za/Content/Docs/sefa%20Annual%20Report_2017.pdf> [Accessed: 14 April 2018].
Slavec, A. & Prodan, I. 2012. The influence of entrepreneurs’ characteristics on small manufacturing firm debt financing. Journal for East European Management Studies, 17(1), pp. 104-130. https://doi.org/10.5771/0949-6181-2012-1-104
Stiglitz, J. & Weis, A. 1981. Credit rationing in markets with imperfect information. The American Economic Review, 71(3), pp. 393-410.
Wilson, B. 2017. Farmer vs farm wife: Which is most highly valued, 3 August 2017. [online]. Available at: <https://www.facebook.com/notes/brad-wilson/farmer-vs-farm-wife-which-is-most-highly-valued/1388893231148421> [Accessed: 28 May 2018].
World Bank. 2014. Facilitating SME financing through improved credit reporting. Report of the International Committee on Credit Reporting, chaired by the World Bank, (Draft Version for Public Comments). [online]. Available at: <https://siteresources.worldbank.org/EXTFINANCIALSECTOR/Resources/282884-1395933501015/Facilitating_SME_financing_through_CR_public_comments_web.pdf> [Accessed: 10 April 2018].

94
Navorsingsartikels • Research articles
Tashmika Ramdav
Ms Tashmika Ramdav, Quantity Surveyor, LDM Consulting, 21 West Riding Row, Sherwood, Durban, 4001, South Africa. Phone: 031-2071340, email: <[email protected]>
Nishani Harinarain
Dr Nishani Harinarain, Senior Lecturer, University of KwaZulu-Natal, King George the V Avenue, Durban, 4001, South Africa. Phone: 031-2602687, email: <[email protected]>
DOI: http://dx.doi.org/10.18820/24150487/as25i2.4ISSN: 1023-0564e-ISSN: 2415-0487Acta Structilia 2018 25(2): 94-117© Creative Commons With Attribution (CC-BY)
The use and benefits of Quick Response Codes for construction materials in South Africa
Peer reviewed and revised
*The authors declared no conflict of interest for this title or article
Abstract This article explores the use and potential benefits of Quick Response (QR) Codes on construction materials in an attempt to ensure that the construction industry continues to be more technologically advanced. This qualitative research study consisted of interviews and case studies. A sample of 30 construction material suppliers in the Durban region were purposively selected and interviewed, using a semi-structured interview schedule. Five case studies were randomly sampled from the Durban region where QR Codes were implemented for selected material samples. Knowledge, experience and the impact of QR Codes on construction materials were examined. The investigation chiefly found that most of the participants are in favour of the concept of using QR Codes, even though these are currently not widely used for construction materials in South Africa. Positive feedback was obtained from those participants who are using QR Codes on products. The findings provided the opportunity to improve the construction materials sector by introducing and implementing QR Codes as a technological advancement in the construction industry.Keywords: QR Codes, construction industry, construction materials
AbstrakHierdie artikel ondersoek die gebruik en moontlike voordele van vinnige reaksie kodes (QR-kodes) op konstruksiemateriaal in ’n poging om te verseker dat die konstruksiebedryf steeds meer tegnologies gevorderd word. Die kwalitatiewe navorsingstudie het van onderhoude en gevallestudies gebruik gemaak.

Ramdav & Harinarain • The use and benefits of Quick Response...
95
Dertig konstruksiemateriaalverskaffers in die Durban-streek is doelbewus gekies en onderhoude is met hulle gevoer deur middel van ’n semi-gestruktureerde onderhoudskedule. Vyf gevallestudies is ewekansig uit die Durban-streek geneem waar QR-kodes vir geselekteerde materiaalmonsters geïmplementeer is. Kennis, ervaring en die impak van QR-kodes op konstruksiemateriaal is ondersoek. Die hoofbevinding van die ondersoek was dat meeste van die deelnemers ten gunste is van die gebruik van QR-kodering, alhoewel QR-kodes tans nie wyd vir konstruksiemateriaal in Suid-Afrika gebruik word nie. Deelnemers wat wel QR-kodes op produkte gebruik, het slegs positiewe terugvoer gegee. Die bevindings het die geleentheid gebied om die konstruksiemateriaalsektor te verbeter deur QR-kodes bekend te stel en te implementeer as tegnologiese vooruitgang in die konstruksiebedryf.Sleutelwoorde: Konstruksiemateriaal, konstruksiebedryf, vinnige reaksie kodes
1. IntroductionThe construction industry is extremely important in South Africa. The economic development of South Africa can be measured using the construction industry as one of the indices (Mewomo & Maritz, 2015: 8). Construction projects are complex in nature and take place in an unprepared, uncontrolled and dynamic environment. Each project goes through several phases towards completion. Construction project completion relies on the participation of all contracting parties and resources. Construction materials are a project resource that influences the quality of construction projects (Wibowo, Elizar, Sholeh & Adji, 2016: 187). Real-time and accurate information is, therefore, required for sharing data among all the parties involved for the purpose of efficient and effective planning (Sardroud, 2012: 382). Currently, the construction sector has been slow to adopt new digital technologies (Fuchs, Nowcke & Strube, 2017: online). One of the reasons for this trend might be the fragmented landscape of this sector, which includes various stakeholders that can make it difficult to explore new technologies. Another reason might be that companies are unfamiliar with the new digital technology available (Blanco, Mullin, Pandya & Sridhar, 2017: online). According to McKinsey Global Institute (MGI) (2017), one of the many new digital technologies available to the construction sector is sensors and communication (NFC) technology (MGI, 2017: 100). These capture real-time data from crews, equipment, and stores, enabling contractors to streamline their supply chains, reconcile material plans with physical availability, and analyse productivity (MGI, 2017: 100). One such sensor and communication technology is Quick Response (QR) Codes (Price, 2013: 1-2).
Building and construction materials are the primary sources and activities that define the quality of engineering and construction structures (Gulghane & Khandvi, 2015: 59, Wibowo et al., 2016:
Acta Structilia 2018: 25(2)
96
185). Currently, the construction materials sector is estimated at approximately R95 billion per annum, with 60% sold directly to end-users, and 40% sold through a distribution channel, of which there are roughly 10,000 outlets countrywide. Approximately R17 billion (18%) is used for additions and alterations, as well as for the home-improvement market (CIDB, 2007: 21). Materials account for up to 60% or more of the total cost of a construction project, depending on the type of project (Gulghane & Khandvi, 2015: 59). Construction materials are, therefore, an extremely critical element in all construction projects and can make significant contributions to the cost effectiveness of projects. Planning and managing the logistics of materials is critical, as they directly affect the cost and schedule of a construction project (Sardroud, 2012: 381). Cost imbursements due to delays, rework and unnecessary work may be a result of the inadequate identification of materials, lack of materials when required, re-handling, and insufficient storage. Material management plays a significant role in the success of any construction project. The most significant fragment of material management is its identification and tracking (Sardroud, 2012: 381). Automation technology allows for speedy and accurate data transfer that managers can use to identify and track construction materials from different locations (Sardroud, 2012: 381). One such technology is the use of QR Codes to improve the identification, tracking, delivery, receipt, and location of materials and components (Sardroud, 2012: 383).
To explore the benefits of using QR Codes in the South African construction materials sector, this article determines how QR Codes could convey information for construction materials in South Africa, and how QR codes on construction materials can assist the South African construction industry in becoming more technologically advanced.
2. Literature reviewThe built environment requires an estimate of over 100,000 different types of materials for construction, operation, and maintenance. Materials such as cement in the form of concrete is one of the most heavily consumed materials on the planet, more so than even food or fuel (Skanska, 2017). To understand the purpose for applying digital and automation technology in the construction materials industry, it is important to introduce its concepts to those who work in the construction industry.

Ramdav & Harinarain • The use and benefits of Quick Response...
97
2.1 QR Codes defined
QR Code, an abbreviation for Quick Response Code, is a machine-readable two-dimensional barcode (Price, 2013: 1-2). QR Codes form part of the matrix (two-dimensional) barcode technology and are usually attached to items as they contain information about the items. QR Codes use four standardised encoding modes (numeric, alphanumeric, byte/binary, and kanji) to store data efficiently (Wave, 2016). The QR Code was created for conveying data faster and at a high speed (Weir, 2010: 12). Both Wave (2016) and Chang (2014: 114) mention that QR Codes are readable from any angle and are dirt and damage resistant. QR Codes have a small printout size, with high-capacity encoding of data and a structured appending feature, making it suitable to use on construction materials (Wave, 2016). QR Codes are currently in their third generation. The storage capacity did not only increase with each generation, but new features such as the addition of company logos on QR Codes were also added (Demir, Kaynak & Demir, 2015: 406-407).
Figure 2: Third-generation QR Code (Demir et al., 2015: 407)
Figure 1: First-generation QR Code (Demir et al., 2015: 406)
2.2 The origin of QR Codes
QR Codes were first created by a Toyota subsidiary, Denso Wave, in 1994 (Weir, 2010: 11). According to Probst (2012: 2), Denso Wave developed the QR Code in an attempt to improve the manufacturing process and the tracking of vehicles and parts. QR Codes were designed to allow for fast decoding speeds and owe their existence to the development and success of barcodes (Wave, 2016).
In the 1960s, as barcodes were developed to help cashiers lighten their burden of manually keying in prices, their use spread. However, their limitations also became apparent in that a barcode can only hold 20 alphanumeric characters of information as the dominant factor. Users contacted Denso Wave Incorporated (then a division of Denso Corporation), who were developing barcode readers at that time, to develop barcodes that could hold more information. A development team embarked on a journey to develop these barcodes (Wave, 2016).

Acta Structilia 2018: 25(2)
98
After announcing the release of the QR Code in 1994, it was adopted by the auto industry and contributed considerably to the efficiency of their management work (Wave, 2016). Denso Wave then decided to make the specifications of the QR Code freely available to the general public. Patent rights to the QR Code were retained by Denso Wave. However, he chose not to exercise them; the QR code could thus be used by as many people as possible at no cost (Chang, 2014: 113-114).
The use of QR Codes, which became widespread in Japan in 2002, was facilitated by the trend of marketing mobile phones with a QR Code-reading feature. The popularity of the code among the general public was due to its sheer convenience, as the QR Code is an open code that anyone is allowed to use (Wave, 2016).
2.3 Advantages and disadvantages of QR codes
2.3.1 Advantages
The main advantage of QR Codes is their versatility, which makes them very easy to use. They can be used for nearly anything and are beneficial for both customers and businesses (Estate QR Codes, 2016). QR Codes can store a great deal of information such as text, videos, advertisements, business card information, personal information, and any other type of digital information (Demir et al., 2015: 406). QR Codes also combine different forms of marketing streams, thus maximising business exposure and generating more revenue (Estate QR Codes, 2016; Gramigna, 2016).
QR Codes are extremely cost effective, as there are no start-up costs or monthly fees, and many QR Code generators and readers are free (Price, 2013: 1-2). Using QR Codes can save paper, thereby displaying content in a green way (Price, 2013: 1-2). QR Codes are easily generated, can be customised to suit promotional items, provide an easier way to manage the return on investment of one’s marketing presence, and allow effective learning about the audience’s interests (Gramigna, 2016; QR Code Stickers, 2013).
2.3.2 Disadvantages
People’s lack of familiarity with the QR Code is one of the biggest disadvantages. Although QR Codes can be found nearly anywhere, people do not know how to obtain the information they require (Estate QR Codes, 2016). The other major disadvantage is that a mobile device or a smartphone as well as a QR Code reader are required in order to gain access to a QR Code (Gramigna, 2016).

Ramdav & Harinarain • The use and benefits of Quick Response...
99
2.4 QR codes and their use for construction materials
In a typical construction-material outlet, customers choose a product either subconsciously or at a speed, because time is of the essence. The shopping environment can sometimes be disorderly and complex, causing shoppers to use clues such as familiar brands or pricing displays instead of finding the best option (Kappa, 2017: 6). Shelf-ready packaging is an effective way of applying digital technology such as bar codes to products, as shoppers react instantly to what they see in front of them (QR Codes for Innovative Product Packaging, 2017). Using barcode technology in construction-material stores allows for materials managers to keep a centralised record on a computer system that tracks products, prices, and stock levels (Woodford, 2017: online). Managers can change prices as often as they like, without having to put new price tags on all the items on the shelves. One can instantly see when stock levels of certain items are running low and reorder. It also allows customers to read information about the materials such as their specification, source, fitting instructions, maintenance data, storage requirements, and safety information (Kappa, 2017: 6). Because barcode technology is so accurate, customers can use their smartphone devices to scan these codes (Marketing Natural Products Using QR Codes, 2017). Scanned codes link these devices to websites where customers can review products, manufacturers, brands, and companies before choosing to buy the products. Another reason why QR codes are put on products is to ensure that buyers can participate in rewards programmes and are given discounts, free goods, and premium prizes. QR Codes on packaging have also been used for promotions and raffles (QR Codes for Innovative Product Packaging, 2017).
3. Research methodologyWith a focus on the impact of QR Codes on construction materials in the construction industry, this study originates from an interpretative paradigm and follows a qualitative research approach (Yanow & Schwartz-Shea, 2011). This type of paradigm allows for exploring and understanding the meaning individuals or groups ascribe to a social or human problem (Creswell, 2014; Mertens, 2009; Welman, Kruger & Mitchell, 2005). It also allows for adopting a qualitative research design that justifies the use of semi-structured interviews and case studies (Creswell, 2014: 17). In this study, semi-structured interviews used open-ended interviewing to explore the participants’ views on the use of QR Codes in the South African construction-materials industry (Thanh & Thanh, 2015: 24). Various products from five

Acta Structilia 2018: 25(2)
100
selected building-material suppliers were issued with QR Codes and used as case studies to test the effectiveness of using QR Codes in construction-material outlets (Creswell, 2005). Another reason for using a qualitative research approach is that it supports thematic data analysis, which is the process of identifying patterns or themes within qualitative data (Creswell, 2014; Clarke & Braun, 2013). In this study, thematic data analysis was used, because it is not tied to a specific theoretical perspective. This flexible method is used to present a detailed and nuanced account of data by transcribing, coding and setting themes from the interviews and case studies (Braun & Clarke, 2006: 87; Clarke & Braun, 2013).
3.1 Sampling
A total of 30 interviews were conducted with construction-materials suppliers in the Durban region. The sample consisted of suppliers from the following building-material products: tiles, paint, bricks and precast cement, glass, timber, carpets and flooring, trusses, electrical and lighting, blinds, as well as plumbing. The construction-material suppliers were selected by means of the purposively sampling technique, using availability and willingness to participate as criteria (Cresswell & Plano Clark, 2011).
The case studies selected for this study consisted of five construction-material suppliers. However, as QR Codes are relatively new in South Africa and many people may not know their nature or benefits, it was necessary to select the construction-material suppliers to be used for the study based on “who are easily available and convenient to interview”. Therefore, five case study building-material suppliers were selected by means of the non-probabilistic convenience sampling technique and used as the source of data for this study (Etikan, Musa & Alkassim, 2016: 2). The suppliers used for the case studies were Corobrik, Precast Cement Products, Tile Africa, Timbercity, and Top Carpets & Floors.
3.2 Data collection
The QR Codes topics used in the interview survey were extracted from reviews of the literature. The interview survey contained open-ended questions. Respondents were asked to indicate the type of building construction material they supply: a) tiles, b) paint, c) bricks and precast cement, d) glass, e) timber, f) carpets and flooring, g) trusses, h) electrical and lighting, i) blinds, and j) plumbing. To understand the level of QR Codes technology in the construction-materials sector, respondents were asked to mention whether they knew what a QR

Ramdav & Harinarain • The use and benefits of Quick Response...
101
Code is; use QR Codes as a marketing tool; will continue to use QR Codes; can suggest other ways in which QR Codes can assist their company, and suggest implications with using QR Codes. Prior to the interviews, the researchers explained the following advantages and disadvantages of QR Codes to respondents: the way in which they can be incorporated in the construction-materials industry, and their effect on the industry. The researchers ensured that all participating interviewees were asked the same questions.
For the case studies, construction-material suppliers were selected where QR Codes could be implemented on products with the potential for testing the application and use of QR Codes and determining if they can make a positive difference in the industry. The researchers went to each supplier to obtain approval and were given samples of products on which to conduct the study. The researchers then collected information from the managers as well as from the websites and made the QR Codes for the sample products. After scanning the QR Code multiple times to ensure that it worked correctly, the researchers returned to the stores and inserted the QR Codes on the labels or placed them near the samples.
3.3 Data analysis and interpretation of the findings
Using thematic data analysis, a nuanced account of the data could be presented by transcribing, coding and setting themes from the responses of the interviews and case studies (Braun & Clarke, 2006: 87). The responses from the interview survey and case studies interviews with store managers and observations from customers form the data set for this study. Once all the responses in the data set were transcribed, codes could be generated and were set as: QR Codes general information; QR Codes as a marketing tool; QR Codes ease of use; QR Codes future use; QR Codes assist company, and QR Codes implications with use. From this set of codes preliminary themes were set as: QR Codes general information; QR Codes as a marketing tool; QR Codes use; QR Codes benefits, and QR Codes impact. Based on the entire data set, these codes were refined into three specific themes which are defined as: QR Codes convey information; QR Codes benefit the South African construction-materials sector, and QR codes on construction materials assist the South African construction industry to become more technologically advanced.

Acta Structilia 2018: 25(2)
102
4. Findings
4.1 Respondents
Respondents were asked to indicate the type of building construction material they supply. Table 1 shows the different suppliers from the sample that were used in the study.
Table 1: Suppliers in the sample
Suppliers Number
Tiles 5
Paint 3
Bricks and precast cement 2
Glass 1
Timber 5
Carpets and flooring 5
Trusses 1
Electrical and lighting 3
Blinds 2
Plumbing 3
Total 30
4.2 Interview analysis based on themes
4.2.1 QR Codes convey in♥formation
This theme captured the respondents’ general knowledge and trends regarding the concept of QR Codes. Figure 3 shows the interviewees’ general views on QR Codes.
Only one third of the interviewees knew what a QR Code is. After showing a picture of a QR Code and explaining to the twenty interviewees, who did not know what a QR Code is, the researchers found that only one respondent still did not know what it is. This shows that QR Codes are known, but that people do not necessarily know what it is called. Only 30% of the ten people, who knew what a QR Code is, are using them on products, while the other 30% use QR Codes for payments, advertising, or as a link to their website. This clearly indicates that, although some suppliers may use QR Codes, they have not yet experienced their full benefits.

Ramdav & Harinarain • The use and benefits of Quick Response...
103
Figure 3: Interviewees’ view on QR Codes
4.2.2 QR Codes as a marketing tool
This theme captured the respondents’ general knowledge regarding the concept of using QR Codes as a marketing tool.
When asked about the type of marketing tools their company currently uses, 74% of the respondents replied websites and print; 21% replied social media and television, and 6% replied by word of mouth. The literature review shows that different forms of marketing can be streamed together, as QR Codes can act as a link that exposes clients to many different ways of advertising the product. QR Codes can, therefore, maximise exposure and increase revenue.
Of the 24 interviewees who are not using QR Codes, only two did not see themselves using QR Codes as a marketing tool in the future for the following reasons: “customers already know what they are looking for when they come in the store”. Six of the interviewees said “maybe”. Sixteen interviewees perceived themselves as using QR Codes as a marketing tool in the future for the following reasons:
The company tries its best to keep up with technology.
I will know that it has been brought to my attention.
QR Codes are the next big thing.
It will definitely help.
I was just in a meeting about better ways to market and communicate, so QR Codes have definitely given me an idea.

Acta Structilia 2018: 25(2)
104
4.2.3 QR Codes use
This theme captured the respondents’ knowledge regarding the concept of using QR Codes in general in their companies. Table 4 shows the reason why some interviewees do not use QR Codes.
The suppliers who were not using QR Codes were then asked why they were not utilising them. Some (12.5%) mentioned that they do not see the need for it; 29.5% of them were not sure, and 58% stated that “it has not been introduced”; “they haven’t thought about it”, or “the lack of knowledge about it”. This indicates that more marketing about QR Codes and their benefits must be explained before they can be adopted in a company.
Figure 4: The reasons for some interviewees not using QR Codes
The interviewees, who are using QR Codes, were then asked if they see the company continuing to use QR Codes. A particularly happy respondent mentioned:
We have been using QR Codes for the past 8 years and it has really made a difference. It brought in a lot of business and clients are extremely satisfied with the company and the idea of being technologically advanced. QR codes are very attractive and clients always notice them and ask more about them. This makes them scan QR Codes. Therefore, I definitely see us continuing to use QR Codes as a marketing tool in the future.
The interviewees were asked if there are any implications of using QR Codes. Of the interviewees, 80% stated that there are no implications, while 20% believed that there are implications. The following explanations were given for the implications:
Sales representatives will no longer be needed.
Specifications on the QR Code may be found in the hands of competitors and lack of skills training as not everyone is technologically orientated.

Ramdav & Harinarain • The use and benefits of Quick Response...
105
4.2.4 QR Codes benefits
This theme captured the respondents’ knowledge of the ways in which the use of QR Codes can benefit their companies.
The respondents also discussed other ways in which QR codes can assist the company, including the following responses:
Brand awareness.
To assist with making more money and bringing in business.
Marketing.
Advertising.
For compliance, as the respondent believed that they fail in this regard. QR Codes can now be stamped on the product for effective tracking and communication.
On websites.
As a payment method.
When asked about the benefits of using technology in construction, the following responses were received:
Bringing in more business.
Being easier.
Saving time and paper.
Upgrading equipment and software.
Testing materials.
Cutting out human error.
Assisting with safety regulations.
Assisting the entire construction process.
The literature review indicated that QR Codes are a technological advancement of barcodes and thus a quick and efficient way to move information.
4.2.5 QR Codes impact
This theme captured the respondents’ knowledge on the possible impact of the use of QR Codes on the building and construction industry. Figure 5 shows the interviewees’ views on the current state of the South African construction industry.

Acta Structilia 2018: 25(2)
106
Of the respondents, 70% believe that QR Codes are in fashion. This implies that QR Codes are known and can certainly make an impact in the industry. Twenty-five respondents believed that QR Codes is a trend set to grow.
Figure 5: The interviewees’ views on the current state of the South African construction industry
The suppliers who were using QR Codes were asked if they measured the impact of QR codes. The following responses were provided:
No, as we just started using QR Codes.
It is definitely working.
It is effective.
It brought in business.
A positive response was received when asked about whether QR Codes can impact on construction materials in South Africa, with one of the respondents, who is currently using QR Codes, stating that “it impacted this company tremendously …”, thus indicating unanimously that the interviewees believe that QR Codes are the way forward for South Africa’s construction-materials sector.
Of the respondents, 90% believe that QR Codes should be implemented in the South African construction-materials sector. “They MUST”, emphasized one respondent. A negative comment was that “QR Codes should not be implemented in the construction materials sector of South Africa because there is no need for it.”

Ramdav & Harinarain • The use and benefits of Quick Response...
107
4.3 Analysis of case studies
Using the same preliminary themes, the analysis from the case studies is discussed under each of them, but without headings: QR Codes general information; QR Codes as a marketing tool; QR Codes use; QR Codes benefits, and QR Codes impact.
4.3.1 Corobrik
Corobrik is a manufacturer and supplier of face bricks, non-face bricks, clay pavers, concrete, masonry, pavers, and earth retaining systems (Corobrik, 2017). The researchers visited Corobrik and, upon obtaining the required approval, were given a sample of two bricks to conduct the study on namely Firelight and Nebraska. The researchers then collected information from both the manager of the store and the website and made the QR Codes fit on the label found in store. After scanning the QR Code multiple times to ensure that it is in correct working order, the researchers went to Corobrik and inserted the QR Codes on the labels of Firelight and Nebraska.
After using the QR Codes consistently for 20 days, Corobrik found that it was extremely quick and easy to scan and install the application. The responses from the interviews concerning the use of the QR codes were only positive ones; there were no complaints about the QR Codes. After seeing the QR Codes in action, the staff believed that there more signage should be provided, enabling more customers to take an interest in the QR codes. They opine that the QR Codes require a great deal of visibility to realise their full benefits. Corobrik liked the idea of QR Codes and the staff can view QR Codes as a permanent marketing tool in the company. Corobrik believes that QR Codes can assist the industry, as it is part of technology, which plays a big role in today’s world.
4.3.2 Precast Cement Products
Precast Cement Products supply concrete blocks to both the domestic and the industrial market and specialise in textured and coloured face blocks with a range of 13 colours (Precast Cement Products, 2017).
After gaining the required approval from the manager of Precast Cement Products, the researchers were given a sample of two blocks, namely Fairface Blocks and Splitface Blocks. The manager indicated that he would like the QR Codes to be framed, due to the lack of space in the shopfront. The researchers then collected information from both the manager of the store and the website. They fitted the

Acta Structilia 2018: 25(2)
108
QR Codes in an A5 frame, as requested by the store manager. After scanning the QR Code multiple times and with multiple QR Code readers to ensure their correct operation, the researchers contacted Precast Cement Products and placed the frame on the shopfront.
After having the QR Codes in the shopfront for 20 days, Precast Cement Products were happy with the effect QR Codes had on the company. They received no complaints; they thought that it was easy and effective to use, and they believed that they need to get more people involved in technology. They opined that it would assist their company if they get more people involved with scanning QR Codes. The only improvement they would like to make to the QR Code to increase its effectiveness is to insert pictures on the QR Code. Precast Cement Products is of the opinion that QR Codes will assist the industry when there is a shortage of staff and when customers are left waiting for a sales representative. The customers can simply scan the code and obtain the information they require.
4.3.3 Tile Africa
Tile Africa supplies local and imported floor and wall tiles in ceramic, polished or glazed porcelain, natural stone, slate, or decorative tiles (Tile Africa, 2017). Upon the required approval, a sample of two tiles, namely Houtbay Weathered and Houtbay Bleached, were used to conduct this study at Tile Africa. The store manager then emailed the required information he wished to have on the QR Code to the researchers. He wanted the QR Codes to fit in the label of the required tiles. The researchers then made the QR Codes and scanned them to ensure that they are operating correctly. The researchers then inserted the QR Codes on the labels of Houtbay Weathered and Houtbay Bleached.
Tile Africa used the QR Codes consistently for 20 days. Customers noted that the QR Codes were extremely easy to use. Tile Africa did not experience any problems in using them and had no suggestions for further improvement. The customers were curious about what the QR Code was about. This shows that QR Codes are attractive and catch the eye of people. Going forward, the company believes that it would be much easier to have a great deal of data accessible regarding specifications and technical information. Sales consultants can also use these codes to access information and confidently answer customers’ questions. Tile Africa believes that QR Codes can assist the construction industry if used by the right people, in the right way and for the right purpose. They agreed to have QR Codes on all their products.
Ramdav & Harinarain • The use and benefits of Quick Response...
109
4.3.4 Timbercity
Timbercity specialises in timber, board as well as hardware for cabinetry and carpentry. Related services such as board cutting, edging and the pre-drilling of hinge holes are also provided (Timbercity, 2015).
After obtaining the required approval from Timbercity, the researchers were given a sample of nine types and lengths of timber to conduct the study, namely 20x20 pine plain all round 1,800mm, 20x20 pine plain all round 2,400mm, 20x20 pine plain all round 3,000mm, 32x32 pine plain all round 1,800mm, 32x32 pine plain all round 2,400mm, 32x32 pine plain all round 3,000mm, 20x64 pine plain all round 1,800mm, 20x64 pine plain all round 2,400mm, and 20x64 pine plain all round 3,000mm. Information was collected from the store manager and the QR Codes were made to fit on the label found in store. After scanning the QR Code multiple times, the researchers went to Timbercity and inserted the QR Codes on the labels of the required timbers.
After having used the QR Codes for 20 days, Timbercity were of the opinion that the QR Codes are easy to use and that they have no complaints. They believe that the QR Codes were the ideal size for their company. So far, QR codes give customers more information. However, more advertising would have to be made available for customers to refer to. Self-service in Timbercity is a great help, as customers do not need the attention of a sales assistant to obtain information about a product.
4.3.5 Top Carpets and Floors
Top Carpets and Floors offer a wide range of carpets, laminates, vinyls, ceramic tiles, other floor coverings, and blinds (Top Carpets and Floors, 2017).
After obtaining the required approval, the researchers placed QR Codes on two types of laminate floors (Elegant Living and Liberty) at Top Carpets and Floors. The store manager then showed the researchers the required information to be placed on the QR Code from the website. He wanted the QR Codes to be on an A4 page, as the laminate flooring was displayed on the floor of the store. The manager intended to have the A4 page kept at the sales representatives’ desk near the laminate flooring. The researchers extracted the required information from the website and made the QR Codes. They then tested QR Codes several times with several

Acta Structilia 2018: 25(2)
110
different QR Code readers to ensure their correct operation and handed these over to the store manager.
The QR Codes were placed on pages on the sales consultant’s desk and not on labels or displayed for customers to view. Top Carpets and Floors did not use the QR Codes consistently for 20 days. They did admit that the QR Codes are easy to use and that the customers did not experience problems when scanning them. However, they realised that having it displayed would elicit more feedback. Top Carpets and Floors can perceive the company using QR Codes in the future, but these will have to be more visible to get their full benefit. They believe that QR Codes can assist the industry by providing much needed information to customers.
4.3 Final analysis and discussion
Based on the results from the entire data set, three specific themes are defined and discussed: QR Codes convey information; benefit the South African construction-materials sector, and assist the South African construction industry in becoming more technologically advanced.
4.3.1 QR Codes convey information
This theme captured the respondents’ existing knowledge on how QR Codes can help the construction industry convey information, by including as much information as possible to ensure effective communication and information-sharing.
During the interviews, the majority of the respondents expressed a positive experience with using QR Codes to convey information to customers:
QR Codes are the next big thing.
I was just in a meeting about better ways to market and communicate, so QR Codes has definitely given me an idea.
I definitely see us continuing to use QR Codes as a marketing tool in the future.
QR Codes can now be stamped on the product for effective tracking and communication.
The managers of the stores in the case studies believed that QR Codes can convey information; they expressed a positive experience during the trial period when using QR Codes on their products.

Ramdav & Harinarain • The use and benefits of Quick Response...
111
Precast Cement Products: “The customers can simply scan the code and gain the information they require”.
Tile Africa: “… it would be much easier to have a lot of data accessible regarding specifications and technical information. Sales consultants can also use these codes to access information and confidently answer customers’ questions.”
Top Carpets and Floors: “… QR codes are working by giving customers more information.”
The literature review shows that QR Codes convey information horizontally and vertically. Therefore, these codes store hundred times more information than normal barcodes (Chang, 2014: 114). QR Codes on products give customers a good reason to buy a product, as it can provide additional information as well as photos, videos and demos with user reviews, without crowding a store to ensure customers can confidently buy a product (QR Code Stickers, 2013).
The essential point is that the respondents had a positive experience and supported the use of QR Codes to convey information – for example, feeling positive – because they experienced that information can be sourced quickly and easily; information of products can easily be punched into a QR Code creator, which will then create the QR Code for fast and effective marketing and information-sharing; QR Codes eliminate human error, as a sales representative may forget an important feature or may mix up two products; customers obtain the correct information at the click of a button, and customers no longer need to wait to talk to a sales representative for product information, thus saving time.
4.3.2 QR Codes benefit the South African construction-materials sector
This theme captured the respondents’ existing knowledge on the benefits of using QR Codes in the South African construction-materials sector.
During the interviews, the majority of the respondents expressed positive views on the benefits of using QR Codes and on the ways in which QR Codes can assist companies in the construction-materials sector:
It brought in a lot of business.
Cutting out human error.
Assisting with safety regulations.
Brand awareness.

Acta Structilia 2018: 25(2)
112
For compliance - QR Codes can be stamped on products for effective tracking and communication.
Marketing and advertising.
As a payment method.
Saving time and paper.
The managers of the stores in the case studies believed that QR Codes can benefit their companies. They also expressed a positive experience during the trial period when using QR Codes on their products.
Corobrik: “QR Codes need a lot of visibility so that the full benefits can be realised.”
Precast Cement Products: “We are happy with the effect QR Codes had on the company … if more people scan QR Codes, it will assist our company.”
Precast Cement Products & Timbercity: “… QR Codes will assist the industry if there is a shortage of staff and customers are left waiting for a sales representative. The customers can simply scan the code and gain the information they require.”
Top Carpets and Floors: “… can see the company using QR Codes in the future but with it being more visible to get the full benefit of it … QR Codes can assist the industry by providing much needed information to customers.”
The literature review indicates that QR Codes can benefit the construction-materials sector, because QR Codes are versatile, user friendly and easy to use (QR Code Stickers, 2013). Generators and readers are free to install and, once the application is downloaded, QR Codes can be made by anyone and put anywhere, as they are relatively small in size (QR Code Stickers, 2013). There are no start-up costs or monthly fees, thus making QR Codes extremely cost effective (Price, 2013: 1-2).
A great deal of information can be stored on the code (Demir et al., 2015: 406). Different forms of marketing can be streamed together, as QR Codes can act as a link that exposes clients to many different ways of advertising the product or service. QR Codes can maximise exposure and produce revenue (Estate QR Codes, 2016). Responses on QR Codes can easily be tracked, based on specific objectives (Gramigna, 2016). The use of QR Codes eliminates the gap between offline print and online pages, thus saving paper and displaying information in a green way (Price, 2013: 1-2).
Ramdav & Harinarain • The use and benefits of Quick Response...
113
The important point is that the managers had a positive experience and supported the benefits of using QR Codes on construction materials not only for their stores, but also for the construction industry – for example, feeling positive – because they experienced that QR Codes can assist with brand awareness, marketing, advertising as well as a payment method. For compliance, QR Codes can be stamped on the product to ensure effective tracking and communication; bring in business, as they are attractive and customers want to know more about them when they see them; have made companies grow, extend themselves to the world with information that is accessible anywhere, and set themselves apart from the rest; are quick, easy and simple; eliminate human error; make a sales representative’s job easier, and is a great tool for marketing and information-sharing.
4.3.3 QR codes on construction materials help the South African construction industry become more technologically advanced
This theme captured the respondents’ existing knowledge on how the use of QR Codes on construction materials can help the South African construction industry become more technologically advanced.
During the interviews, the majority of the respondents expressed positive views on how the use of QR Codes on construction material can help the construction industry be more technologically advanced:
Easier store management.
Easier to click a button for information.
Saving time and paper.
Upgrading equipment and software.
Preview materials.
Cutting out human error.
Assist the entire construction process.
The company tries its best to keep up with technology.
Clients are extremely satisfied with the company and the idea of being technologically advanced.
The managers of the stores in the case studies believed that QR Codes on construction material can help the South African construction industry become more technologically advanced; they also expressed a positive experience during the trial period when using QR Codes on their products.

Acta Structilia 2018: 25(2)
114
Corobrik: “… QR Codes can assist the industry as it is part of technology and technology plays a big role in today’s world.”
Precast Cement Products: “… we are happy with the effect QR Codes had on the company… we will get more people involved in technology.”
The literature review indicates that QR Codes on construction material can help the construction industry become more technologically advanced, because using QR Code applications allows the industry to use matrix barcode technology and machine-readable barcodes that have advanced storage capacity (Demir et al., 2015: 406).
The widespread use of QR Code reading features on mobile phones made it easier for the construction industry to use the advanced features of QR technology. QR Codes use a software programme that is installed on smartphones to create, read and analyse the codes. Once the software analyses the code, the necessary information and actions are displayed on the screen (Chang, 2014: 114).
The essential point is that the respondents had a positive experience and support the display of QR Codes on construction material to help the construction industry become more technologically advanced – for example, feeling positive – because they experienced that QR Codes are extremely technologically advanced; are completely digital, and are created, read and analysed with the click of a button, and there is no waiting time, as the code is created within seconds. QR Codes can assist the industry in becoming more technologically advanced by moving away from paper. Customers would no longer need to ask sales representatives for information, as they can simply click a button and scan the QR Code to access information at their fingertips.
5. ConclusionQR Codes have the potential to take the construction industry to greater heights, not only by providing information at the click of a button, but also by being simple, easy, cost effective and technologically advanced. QR Codes ensure that customers have valuable information at all times. The use of QR Codes eliminates human error. With QR Codes, information is accurate, true and reliable.
This article described QR Codes as a technological advancement of the construction-materials sector. The findings show that the respondents are in favour of QR Codes and would like to adopt QR
Ramdav & Harinarain • The use and benefits of Quick Response...
115
Codes as a marketing tool on products, even though QR Codes are not currently widely used for construction materials. The case studies show that, once QR Codes are adapted in the company, it has the potential to make great strides towards becoming technologically advanced.
In conclusion, it is recommended that stakeholders implement QR Codes on some, if not all of their products, in order to gain a perspective of whether QR Codes can work for them and the products they supply and to reap the benefits described earlier. It is further recommended that this study be done over a longer period, in order to track QR code usage and its effectiveness in the industry.
ReferencesBlanco, J.L., Mullin, A., Pandya, K. & Sridhar, M. 2017. The new age of engineering and construction technology. [online]. Available at: <https://www.mckinsey.com/industries/capital-projects-and-infrastructure/our-insights/the-new-age-of-engineering-and-construction-technology> [Accessed: 24 November 2017].
Braun, V. & Clarke, V. 2006. Using thematic analysis in psychology. Qualitative Research in Psychology, 3, pp. 77-101. https://doi.org/10.1191/1478088706qp063oa
Chang, J.H. 2014. An introduction to using QR codes in scholarly journals. Science Editing, 1(2), pp. 113-117. https://doi.org/10.6087/kcse.2014.1.113
CIDB (Construction Industry Development Board). 2007. The building and construction materials sector, challenges and opportunities. The Construction Industry Development Board, pp. 1-40.
Clarke, V. & Braun, V. 2013. Teaching thematic analysis: Overcoming challenges and developing strategies for effective learning. The Psychologist, 26(2), pp. 120-123.
Corobrik - Clay brick and paving manufacturer and distributor. 2017. Corobrik - Clay brick and paving manufacturer and distributor. [online]. Available at: <http://www.corobrik.co.za/> [Accessed: 16 May 2017].
Creswell, J.W. 2005. Educational research. Planning, conducting, and evaluating quantitative and qualitative research. Thousand Oaks, CA: Sage.
Creswell, J.W. 2014. Research design: Qualitative, quantitative and mixed methods approaches. 4th edition. Thousand Oaks, CA: Sage.

Acta Structilia 2018: 25(2)
116
Creswell, J.W. & Plano Clark, V.L. 2011. Designing and conducting mixed methods research. 2nd edition. Thousand Oaks, CA: Sage.
Demir, S., Kaynak, R. & Demir, K.A. 2015. Usage level and future intent of use of quick response (QR) codes for mobile marketing among college students in Turkey. Procedia - Social and Behavioral Sciences, 181, pp. 405-413. https://doi.org/10.1016/j.sbspro.2015.04.903
Estate QR Codes. 2016. Advantages and disadvantages of QR code. [online]. Available at: <http://www.estateqrcodes.com/advantages-disadvantages.html.> [Accessed: 19 December 2016].
Etikan, I., Musa, S.A. & Alkassim, R.S. 2016. Comparison of convenience sampling and purposive sampling. American Journal of Theoretical and Applied Statistics, 5(1), pp. 1-4. https://doi.org/10.11648/j.ajtas.20160501.11
Fuchs, S., Nowicke, J. & Strube, G. 2017. Navigating the digital future: The disruption of capital projects. [online]. Available at: https://www.mckinsey.com/industries/capital-projects-and-infrastructure/our-insights/navigating-the-digital-future-the-disruption-of-capital-projects [Accessed: 24 November 2017].
Gramigna, K. 2016. Pros and cons of QR Codes for business. [online]. Available at: <http://www.business.com/online-marketing/pros-and-cons-of-qr-codes-for-small-business/> [Accessed: 19 December 2016].
Gulghane, A.A & Khandve, P.V. 2015. Management of construction materials and control of construction waste in construction industry: A review. International Journal of Engineering Research and Applications, 5(4), pp. 59-64.
Kappa, S. 2017. Marketing on the shelf. Exactly how in control are you? Open the Future, pp.1-14.
Marketing Natural Products Using QR Codes. 2017. Marketing Natural Products Using QR Codes. [online]. Available at: <http://www.nearfieldcommunicationnfc.org/natural-products.html.> [Accessed 2 June 2017].
Mertens, D. 2009. Transformative research and evaluation. New York: The Guilford Press.
Mewomo, M.C. & Maritz, M.J. 2015. An examination into the current status of adjudication practice on public sector construction contractors in South Africa. Journal of Construction, 8(3), pp. 8-13.

Ramdav & Harinarain • The use and benefits of Quick Response...
117
MGI (McKinsey Global Institute) 2017. Reinventing construction: A route to higher productivity. New York: McKinsey & Company.
Precast Cement Products. 2017. Precast Cement Products. [online]. Available at: <http://www.precast.co.za/> [Accessed: 18 May 2017].
Price, K. 2013. QR Codes for trainers. INFOLINE Tips, tools and intelligence for training, 30(1301). United States of America: Ana Foreman.
Probst, A. 2012. The expectations of Quick Response (QR) Codes in print media: An empirical data research anthology. Journal of Undergraduate Research, 15, pp. 1-13.
QR Code Stickers. 2013. Places where you can find QR codes. [online]. Available at: <http://www.qrcodestickers.org/applications-for-qr-codes/places-where-you-can-find-qr-codes.html> [Accessed: 20 December 2016].
QR Codes for Innovative Product Packaging. 2017. QR Codes for Innovative Product Packaging. [online]. Available at: <http://beqrioustracker.com/qr-codes-for-innovative-product-packaging/> [Accessed: 2 June 2017].
Sardroud, J.M. 2012. Influence of RFID technology on automated management of construction materials and components. Scientia Iranica, 19(3), pp. 381-392. https://doi.org/10.1016/j.scient.2012.02.023
Skanska. 2017. Sustainability of materials. [online]. Available at: <http://group.skanska.com/sustainability/green/materials/> [Accessed: 8 June 2017].
Thanh, N.C. & Thanh, T.T. 2015. The interconnection between interpretivist paradigm and qualitative methods in education. American Journal of Educational Science, 1(2), pp. 24-27.
Tile Africa. 2017. Welcome | Tile Africa. [online]. Available at: <http://www.tileafrica.co.za/> [Accessed: 20 May 2017].
Timbercity. 2015. Timber and Wood Suppliers for Your Building Needs | Timbercity. [online]. Available at: <http://timbercity.co.za/> [Accessed: 19 May 2017].
Top Carpets and Floors. 2017. Top Carpets & Floors Pinetown - Top Carpets and Floors. [online]. Available at: <http://www.topcarpetsandfloors.co.za/stores/top-carpets-and-floors-pinetown/> [Accessed: 8 May 2017].
Wave, D. 2016. History of QR Codes. [online]. Available at: <www.qrcode.com/en/about/.> [Accessed: 18 December 2016].

Acta Structilia 2018: 25(2)
118
Weir, M. 2010. QR codes and mobile marketing for the small business owner. United States of America: Michael Weir.
Welman, J.C., Kruger, F. & Mitchell, B. 2005. Research methodology. 3rd edition. Cape Town: Oxford University Press Southern Africa.
Wibowo, M.A, Elizar Sholeh, M.N & Adji, H.S. 2016. Supply chain management strategy for recycled materials to support sustainable construction. Sustainable Civil Engineering Structures and Construction Materials, 171, pp. 185-190.
Woodford, C. 2017. Barcodes and barcode scanners. [online]. Available at: <https://www.explainthatstuff.com/barcodescanners.html> [Accessed: 24 January 2018].
Yanow, D. & Schwartz-Shea, P. 2011. Interpretive approaches to research design: Concepts and processes. New York, USA: Routledge.

119
Navorsingsartikels • Research articles
Frank Ikechukwu Aneke
Mr Frank Ikechukwu Aneke, Department of Civil Engineering, Faculty of Engineering and Information Technology, Central University of Technology, Free State (CUT), Private Bag X20539, Bloemfontein, 9300, South Africa. Phone: 051-5073942, e-mail: <[email protected]> (corresponding author) ORCID: 0000-0002-7395-4900
Bankole Awuzie
Dr Bankole Osita Awuzie, Senior Lecturer, Department of Built Environment, Faculty of Engineering and Information Technology, Central University of Technology, Free State (CUT), Private Bag X20539, Bloemfontein, 9300, South Africa, Phone: +27 51 507 3532, e-mail: <[email protected]> ORCID: 0000-0003-3371-191x
DOI: http://dx.doi.org/10.18820/24150487/as25i2.5ISSN: 1023-0564e-ISSN: 2415-0487Acta Structilia 2018 25(2): 119-137© Creative Commons With Attribution (CC-BY)
Conversion of industrial wastes into marginal construction materials
Peer reviewed and revised
*The authors declared no conflict of interest for this title or article
AbstractThe circular economy concept (CE) makes a salient contribution towards resource efficiency through product-life extension, redistribution/reuse, remanufacturing, and recycling as well as re-engineering of organizational processes. The construction industry is renowned for its influence on the attainment of society’s sustainable development (SD) aspirations. As such, there is a need for the industry to embrace CE principles. Yet, the uptake of these principles has not been widely reported in the context of developing economies where greenfield construction activities are burgeoning. This observation gives rise to this study. This article reports on the findings of an investigation into the utility of industrial wastes in the production of marginal construction material. To achieve this objective, a thorough geotechnical evaluation of a selection of readily available industrial wastes such as dolomitic waste (DW), silica fume (SF), and river sand (RS) deployed in different ratios according to the mass percentage of the fly ash (FA) waste to produce FA bricks was conducted. Findings suggest that the utilization of these industrial wastes in the production of FA bricks did not only portray some outstanding characteristics but also showed potential to make salient contributions to society’s sustainable aspirations. Keywords: Bricks, circular economy, dolomitic waste, fly ash, South Africa
AbstrakDie konsep van sirkelekonomie lewer ’n belangrike bydrae tot hulpbrondoeltreffendheid deur produk-lewensuitbreiding, herverdeling/hergebruik, herverwerking en herwinning asook herontwerp van organisatoriese prosesse. Die konstruksiebedryf is bekend vir sy invloed op
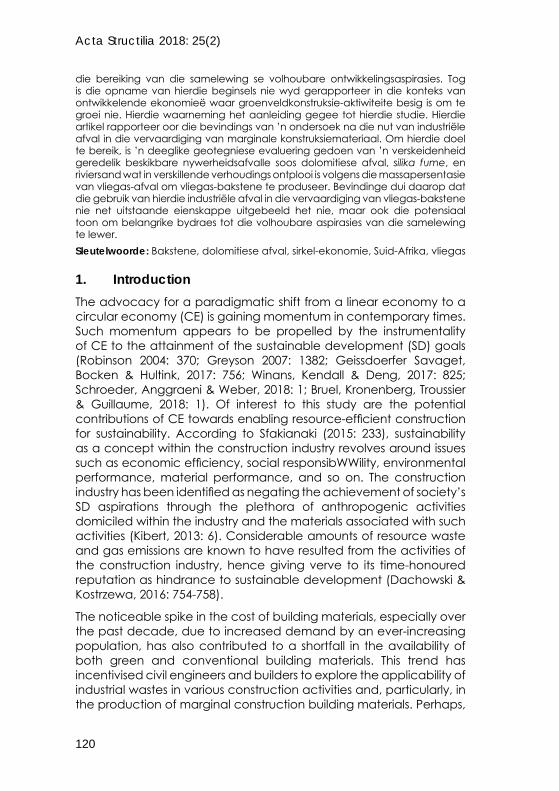
Acta Structilia 2018: 25(2)
120
die bereiking van die samelewing se volhoubare ontwikkelingsaspirasies. Tog is die opname van hierdie beginsels nie wyd gerapporteer in die konteks van ontwikkelende ekonomieë waar groenveldkonstruksie-aktiwiteite besig is om te groei nie. Hierdie waarneming het aanleiding gegee tot hierdie studie. Hierdie artikel rapporteer oor die bevindings van ’n ondersoek na die nut van industriële afval in die vervaardiging van marginale konstruksiemateriaal. Om hierdie doel te bereik, is ’n deeglike geotegniese evaluering gedoen van ’n verskeidenheid geredelik beskikbare nywerheidsafvalle soos dolomitiese afval, silika fume, en riviersand wat in verskillende verhoudings ontplooi is volgens die massapersentasie van vliegas-afval om vliegas-bakstene te produseer. Bevindinge dui daarop dat die gebruik van hierdie industriële afval in die vervaardiging van vliegas-bakstene nie net uitstaande eienskappe uitgebeeld het nie, maar ook die potensiaal toon om belangrike bydraes tot die volhoubare aspirasies van die samelewing te lewer.Sleutelwoorde: Bakstene, dolomitiese afval, sirkel-ekonomie, Suid-Afrika, vliegas
1. Introduction The advocacy for a paradigmatic shift from a linear economy to a circular economy (CE) is gaining momentum in contemporary times. Such momentum appears to be propelled by the instrumentality of CE to the attainment of the sustainable development (SD) goals (Robinson 2004: 370; Greyson 2007: 1382; Geissdoerfer Savaget, Bocken & Hultink, 2017: 756; Winans, Kendall & Deng, 2017: 825; Schroeder, Anggraeni & Weber, 2018: 1; Bruel, Kronenberg, Troussier & Guillaume, 2018: 1). Of interest to this study are the potential contributions of CE towards enabling resource-efficient construction for sustainability. According to Sfakianaki (2015: 233), sustainability as a concept within the construction industry revolves around issues such as economic efficiency, social responsibWWility, environmental performance, material performance, and so on. The construction industry has been identified as negating the achievement of society’s SD aspirations through the plethora of anthropogenic activities domiciled within the industry and the materials associated with such activities (Kibert, 2013: 6). Considerable amounts of resource waste and gas emissions are known to have resulted from the activities of the construction industry, hence giving verve to its time-honoured reputation as hindrance to sustainable development (Dachowski & Kostrzewa, 2016: 754-758).
The noticeable spike in the cost of building materials, especially over the past decade, due to increased demand by an ever-increasing population, has also contributed to a shortfall in the availability of both green and conventional building materials. This trend has incentivised civil engineers and builders to explore the applicability of industrial wastes in various construction activities and, particularly, in the production of marginal construction building materials. Perhaps,

Aneke & Awuzie • Conversion of industrial wastes...
121
this may be because of the increasing attention to the CE and SD principles by several sectors across the globe. The use of industrial wastes in the production of building materials can be described as conforming to the main thrust of CE and SD concepts; resource efficiency (Lieder & Rashid, 2016: 337; Urbinati, Chiaroni & Chiesa, 2017: 487; Zhu, Fan, Shi & Shi 2018: 2).
In South Africa, disposal of over 120 million metric tonnes of ash annually from seven different power stations, with each power station contributing over 22 million tonnes each year, posed a major environmental challenge (Reynolds-Clausen & Singh, 2017). This waste is often disposed of at dump sites, hence causing environmental problems that have, in turn, contributed to a preponderance of health issues being experienced by the populace (Rycroft, 2017). Therefore, channelling such industrial wastes towards more productive ventures such as the production of marginal construction materials for low-cost housing structures have advantageous implications for society. Although researchers have previously worked on the utility of FA bricks as veritable building components for the housebuilding context (Pimraksa, Wilhelm, Kochherger & Wruss, 2001; Rycroft, 2017), it has been noticed that these studies revolved around the various standards for brick utilization for single- and double-storey buildings used in construction work. For instance, Pimraksa et al. (2001) developed a novel approach in making bricks from 100% lignite FA. The FA bricks developed by Pimraksa et al. (2001) recorded more strength, when compared with red-fired clay brick.
Hamer and Karius (2002: 521-530) conducted a pilot test at full-scale, recycled waste from harbour sediments and blend it with clay and waste from bricks. The bricks leachate was not hazardous to soil or groundwater when used in masonry or deposited as mass mineral demolition. Cusido, Cremades and Gonzalez (2003: 273-280), produced lightweight clay brick, compared with traditional clay bricks by reasonable proportioning of clay with sewage sludge, and forest debris. It was recorded that the level of emissions of greenhouse gas was 20 times more than the conventional ceramic firing bricks, even though they are legally allowed within the limitation of Environmental Protection Agency recommendations. Carretero, Dondi, Fabbri & Raimondo (2002: 301-306) produced clay brick by fusing different clay, calcareous and non-calcareous limestone. This resulted in a brick strength that was within acceptable specification. In addition, Menzeses, Ferreira, Neves et al. (2005: 1149-1158) investigated the chances whereby sawing waste can be used as an alternative to ceramic raw materials to produce ceramic bricks and tile. The resultant ceramic compositions showed

Acta Structilia 2018: 25(2)
122
that results on the samples with 10%-30% granite waste portrayed some physical and mineralogical characteristics such as those of ceramic raw materials. Lin, Wu & Ho (2006: 970-978) reported on the levels of permeability properties experienced within bricks produced with water treatment sludge and bottom ash (BA) without adding artificial aggregate. It was discovered that 20% by weight content of BA under high temperature of 1150°C, produced a brick with a strength of 256kg/cm2 with moisture absorption ratio of 2.78% and a permeability with level of 0.016 cm/s. Bricks produced under this research conditions were considered to serve as water permeable bricks, on highway pavement.
In furtherance to these, Kavas (2006: 1779-1783) studied the possibility of using clay waste (CW) and waste from boron as a fluxing agent in the production of red-mud (RM) brick. Loryuenyong, Panyachai, Kaewsimork and Siritai (2009: 2717-2721) recycled glass waste from construction site wall fused with clay mixtures. Chan (2011: 7-13) studied the properties of clay brick made by adding two natural fibres, namely oil palm fruit (OF) and pineapple eaves (PE), to clay-water mixture with baked and non-baked conditions. Alonso-Santurde, Coz, Viguri and Andrés (2012: 96-106) conducted a comparative study to manufacture ceramic bricks from clay with two types of foundry sand (green and core sand). Faria, Gurgel and Holanda (2012: 7-12) produced bricks using recycled sugar cane bagasse as waste by replacing natural clay. Ahmari and Zhang (2012: 323-331) researched the feasibility of copper-mine tailings for producing bricks with reduced green gas emission based on the geo-polymerization technology. Results showed that copper-mine tailings have a strength of 18MPa and can be used to produce environmentally friendly bricks based on the geo-polymerization technology to meet the American Society Testing of Material (ASTM) requirements.
However, it appears that none of these studies considered aspects concerning combined resource use as described by Vivanco, Wang, Deetman and Hertwich (2018: 1-12) in the attempts to achieve sustainable low-cost housing in developing countries. This study intends to contribute towards bridging this gap. The study investigated the possible attributes of FA with the combination of other industrial waste such as DW and SF in varying proportions, and, most commonly, the probable utility of such resultant combinations in the development of sustainable low-cost housing in South Africa and the rest of the developing world.
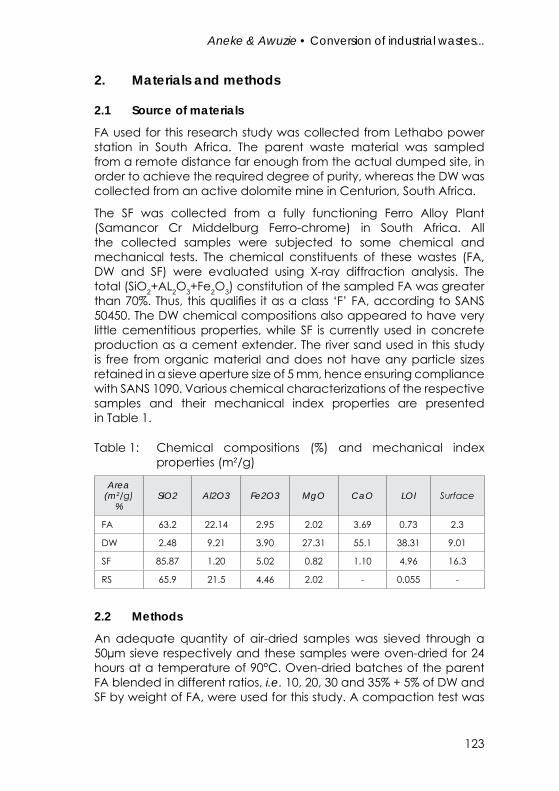
Aneke & Awuzie • Conversion of industrial wastes...
123
2. Materials and methods
2.1 Source of materials
FA used for this research study was collected from Lethabo power station in South Africa. The parent waste material was sampled from a remote distance far enough from the actual dumped site, in order to achieve the required degree of purity, whereas the DW was collected from an active dolomite mine in Centurion, South Africa.
The SF was collected from a fully functioning Ferro Alloy Plant (Samancor Cr Middelburg Ferro-chrome) in South Africa. All the collected samples were subjected to some chemical and mechanical tests. The chemical constituents of these wastes (FA, DW and SF) were evaluated using X-ray diffraction analysis. The total (SiO2+AL2O3+Fe2O3) constitution of the sampled FA was greater than 70%. Thus, this qualifies it as a class ‘F’ FA, according to SANS 50450. The DW chemical compositions also appeared to have very little cementitious properties, while SF is currently used in concrete production as a cement extender. The river sand used in this study is free from organic material and does not have any particle sizes retained in a sieve aperture size of 5 mm, hence ensuring compliance with SANS 1090. Various chemical characterizations of the respective samples and their mechanical index properties are presented in Table 1.
Table 1: Chemical compositions (%) and mechanical index properties (m2/g)
Area (m2/g)
%SiO2 Al2O3 Fe2O3 MgO CaO LOI Surface
FA 63.2 22.14 2.95 2.02 3.69 0.73 2.3
DW 2.48 9.21 3.90 27.31 55.1 38.31 9.01
SF 85.87 1.20 5.02 0.82 1.10 4.96 16.3
RS 65.9 21.5 4.46 2.02 - 0.055 -
2.2 Methods
An adequate quantity of air-dried samples was sieved through a 50µm sieve respectively and these samples were oven-dried for 24 hours at a temperature of 90°C. Oven-dried batches of the parent FA blended in different ratios, i.e. 10, 20, 30 and 35% + 5% of DW and SF by weight of FA, were used for this study. A compaction test was

Acta Structilia 2018: 25(2)
124
carried out in a laboratory to evaluate the relationship between the moisture content and corresponding dry unit weight for the mixed ratio, under specified compaction effort. However, this compaction test was done according to South Africa National Standard (SANS 30001-GR30). The maximum dry density (MDD) and optimum moisture content (OMC) were obtained by establishing moisture-density relationship of the materials that were prepared.
Subsequently, a desired level of water was added as was obtained from the compaction test, and the mixture was then thoroughly blended. Plastic bags were used to cover the samples for a day to allow mellowing to occur. The mix ratio for the FA parent material with DW and SF was key for novel brick-making process, due to the highly anticipated pozzolanic reactions (Pimraksa et al., 2001). The MDD and OMC for each mix were determined, using mould size of 152mm in diameter and 127mm in height. The compaction test was carried out to determine the adequate water level needed to mix each brick sample. To ensure uniform size of these bricks, a known weight of mixture was used each time to fill the mould cavity. The dimension of the mould used was 222mm x 106mm x 73mm. A hydraulic press was used to apply pressure of 30 MPa for a period of 15 seconds (Figure 1a). In the aftermath of this, the specimens (Figure 1b) were ejected and left in open air for three days to allow moisture equilibrium within the specimens.
Figure 1a: Hydraulic press machineSource: Authors
Figure1b: Prepared bricks specimensSource: Authors
The specimens were later transferred to the oven for 12 hours at temperature intervals of 600°C, 800°C, 1000°C and 1200°C, respectively. These specimens were allowed to cool for two days and their mechanical strength was measured according to SANS 5863 before and after curing for 7, 28, and 90 days. Table 2 shows the details of the trial mix bricks.

Aneke & Awuzie • Conversion of industrial wastes...
125
Table 2: Trial mixed design ratio for the studied bricks
Samples CompositionDensity
(Kg/m3)
Optimum H20
content (%)
Mass of
bricks (kg)
Mass of H20
(g)
FA1 FA70% + RS30% (Control) 1662 13 2.84 369.20
FA2 FA60% + DW10%+RS30% 1676 13.42 2.87 385.16
FA3 FA50% + DW10%+SF10%+RS30% 1687 13.64 2.88 393
FA4 FA40% + DW30%+RS30% 1705 13.78 2.92 402.4
FA5 FA30% + DW30% + SF10%+RS30% 1691 13.88 2.89 401.1
3. Discussion of findingsEfforts are made to highlight the utility of industrial wastes in the production of marginal green building material that can portray highly recommended levels of strength, within the allowable specified strength for building in South Africa, in a manner that is comparably better than conventional clay-fired brick. This was achieved with a view to producing suitable bricks such that the modified FA bricks may withstand loads from a single- and double-storey building and other strength-carrying capacity of masonry structure.
3.1 Sieve analysis
Figure 2 shows the obtained curves for the RS, FA and DW. The curve shows that the RS contains 34% fines passing through sieve # 200, and 66% sand passing through sieve #4, while FA and DW samples contain 97% and 96% fines passing through the same sieve #200, respectively. This result indicates that FA and DW are 63% and 64% more fines containing than the RS.

Acta Structilia 2018: 25(2)
126
FA3 FA50% + DW10%+SF10%+RS30% 1687 13.64 2.88 393 FA4 FA40% + DW30%+RS30% 1705 13.78 2.92 402.4 FA5 FA30% + DW30% + SF10%+RS30% 1691 13.88 2.89 401.1 3. Discussion of findings Efforts are made to highlight the utility of industrial wastes in the production of marginal green building material that can portray highly recommended levels of strength, within the allowable specified strength for building in South Africa, in a manner that is comparably better than conventional clay-fired brick. This was achieved with a view to producing suitable bricks such that the modified FA bricks may withstand loads from a single- and double-storey building and other strength-carrying capacity of masonry structure. 4.1 Sieve analysis Figure 2 shows the obtained curves for the RS, FA and DW. The curve shows that the RS contains 34% fines passing through sieve # 200, and 66% sand passing through sieve #4, while FA and DW samples contain 97% and 96% fines passing through the same sieve #200, respectively. This result indicates that FA and DW are 63% and 64% more fines containing than the RS.
Figure 2: Particle size analysis of RS, FA and DW The modulus properties of the RS and the tested waste materials were determined from the particle size distribution (PSD) curve shown in Figure 2. The major textural properties of brick material (i.e. the per cent fines; >0.425 mm), the particle sizes that permit 10%, 30%, 50% and 60% of the granular brick materials, the coefficient of uniformity (Cd), and the coefficient of curvature (Cc) are presented in Table 3. Table 3: Gradation properties of bricks materials Gradation properties River sand Fly ash Dolomitic waste
0102030405060708090
100
0.001 0.01 0.1 1 10 100
PERC
ENT
PASS
ING
BY
WEI
GHT
(%)
SIEVE SIZE (mm)
RSDWFA
FINE SAND GRAVEL
Figure 2: Particle size analysis of RS, FA and DW
The modulus properties of the RS and the tested waste materials were determined from the particle size distribution (PSD) curve shown in Figure 2. The major textural properties of brick material (i.e. the per cent fines; >0.425 mm), the particle sizes that permit 10%, 30%, 50% and 60% of the granular brick materials, the coefficient of uniformity (Cd), and the coefficient of curvature (Cc) are presented in Table 3.
Table 3: Gradation properties of bricks materials
Gradation properties River sand Fly ash Dolomitic waste
D10 (mm) 0.0073 0.001 0.001
D30(mm) 0.061 0.0026 0.0037
D50(mm) 0.18 0.0074 0.0082
D60(mm) 0.25 0.009 0.01
Cc 0.27 1.30 1.05
Cd 2.039 0.75 1.25
Fines (%) 34 97 96
#200 #4 3″

Aneke & Awuzie • Conversion of industrial wastes...
127
3.2 Chemistry and mechanism of reactions
FA has a reactive silica and aluminium of 63.2% and 22.14%, respectively, as presented in Table 1, while DW has 55.10% of free calcium in the form of [(CaMg(CO3)2)] and the samples were prepared at varying proportions (see Table 1). These brick specimens start to react slowly in the presence of water. Ultimately, a reaction was triggered off at a high temperature of 800oC, as illustrated in the chemical equations below:
2Ca + SiO2 + H2O 800°C
Ca2O (SiO2) H2O Pozzolanic equation (2)
Dicalcium Silicate
The slow reaction occurs during the first few days (two days) leading to a very micro-strength gain; however, the hydration reaction is similar to that of tricalcium silicate. But, dicalcium silicate contributes little to the initial strength of pozzolans; hence, it leads to a substantial contribution of strength after being subjected to a high temperature.
CaSO4.2H2O +Al2O3 + Ca3O 800°C
4CaOAl2O3.SO.2H2O Pozzolanic equation (4)
3Ca + Al2O3 +6H2O 800°C
Ca3O (Al2O2).6H2O Pozzolanic equation (3)
3Ca + SiO2 + 3[OH] 800°C
Ca3O2 (SiO2). H3O Pozzolanic equation (2)
Tricalcium Silicate
Tricalcium aluminate
(from Dolomite)
The pozzolanic reaction of aluminate minerals is somewhat more complex than that of the calcium silicates minerals, and it takes place depending on Ca+ ions that are present in the voids of the bricks. Tricalcium is soluble, even more so than dicalcium silicate. In a reaction that involves SF, this occurs with unduly reacted ettringite (Ca6Al2(SO4)3(OH)12.26(H2O) from C3A and C4AF when the SF is consumed, within the pores of the bricks, with the remaining C3A and C4AF forming a newly high strength matrix brick.

Acta Structilia 2018: 25(2)
128
3.3 Unconfined compressive strength
Figure 3 graphically presents the strength for tested specimens ranging from FA1 to FA5. It was observed that FA1 does not exhibit any significant increase in strength, irrespective of the sintered temperature and time duration in the oven. It was discovered that the specimens recorded an optimum strength of 2.2 MPa at a temperature of 1200°C from as little as 0.54 MPa at a temperature of 600°C on the average of two set specimens per test trial. The poor strength recorded was attributed to the low cementitious compound possessed by the FA. However, there were some great changes in morphology of specimen FA1 under SEM/EDx test, due to high temperature. This was to determine the effect of sintering temperature and time on the compressive strength of the produced bricks. The strength of FA1 brick is low compared to the brick strength reported by Lin et al. (2006: 970-978) in the literature that recorded strength of 25MPa/256kg/cm2. The huge difference in the strength value is attributed to FA type, as 70% class “F” FA and 30% were used in the production of FA1 bricks, whereas water treatment sludge and bottom ash (BA) were used for the brick reported in the literature. However, specimens FA2 and FA4 gained great values in strength compared to the FA1 specimen. Thus, FA3, which contains FA50% + DW10% + SF10% + RS30% recorded the highest strength among the tested bricks. This significant increase in strength was as a result of high temperature, heating hours, and the chemical composition of the studied waste (i.e. FA, DW and SF). The chemical composition of these wastes caused them to produce stronger matrix bricks under any form of curing condition than other trial mixtures, because of chemical reactions that occurred between these waste materials under high temperature and moisture.
The FA3 specimen contained FA50% + DW10% + SF10% + RS30% and it was observed that the strength of this mix was increasing as the sintering temperature increases. However, similar behaviour was recorded among the tested bricks, especially FA5. Nonetheless, FA5 mix did not increase in strength, as was anticipated, under 1200°C temperature. This response of FA5 under 1200°C confirms SANS which allows <10% SF to be incorporated in cement and concrete production. Nonetheless, in Figure 3, the curve shows a traditional trend of strength gain as sintering temperature and time increase for all mixtures. The improvement in mechanical strength with sand has been attributed to the increased amount of free SiO2, which reacts more easily with Fe2O3 in SF and CaO in DW (Cicek & Tanrıverdi, 2007). Figure 3 explains this further as it concerns strength. Generally, the tested bricks ranging from FA2 to FA5 gained strength under

Aneke & Awuzie • Conversion of industrial wastes...
129
sintering temperature. This result agrees with the results discussed in the literature, although the materials used in this study and the materials cited in the literature review are not the same, but portray the same behaviour under high temperature.
Figure 3: Twelve hours brick strength at various temperature 4.4 Effect of curing age on fly ash bricks The effects of curing period on compressive strength values of the tested bricks are summarized in Figure 4. The specimens were cured using the fully submerged method of curing at room temperature of 22°C for 7, 28, 56 and 90 days, in order to investigate the strength gain under the water-curing method. The bricks selected for this curing method were those produced under sintering temperature of 1200°C for all mixes. Based on the graphical result, it is observed that the early age of curing (i.e. (≤ 3-7 days) is practically inactive to trigger pozzolanic reaction, in order to give a reasonable amount of strength, even at higher dosage of FA and DW. As the curing period increases with higher dosage of DW, more vigorous pozzolanic reaction takes place, which improves the strength with curing time. Moreover, the studied bricks ranging from FA2 gave a gradual rising slope of strength up to 56 days of curing, and this trend describes the extent of curing with pozzolanic reaction. It was observed that the compressive strength of FA3 bricks recorded a significant gain in strength of 3.1% from 5.3MPa for seven days curing time to 16.2MPa. It was observed that the strength of this brick for specimen FA3 increased as the curing age increases. The reason for this was the release of free calcium hydroxide (Ca(OH)2) by the dolomite, which, upon crystallization, reacts with some active minerals in FA and SF to form calcium aluminium silicates. This reaction, in turn, contributed to the hardening of the brick, even at a later stage. The reaction occurred as the CaO in dolomite encountered the pore water in the brick mixture, resulting in the formation of (Ca(OH)2) ion. However, all the specimens invariably showed a similar trend of strength increase with increasing curing period, except FA1. This was caused by the crystalline phase of the FA that contained little quantities of CaO, and this resulted in low strength gain. The South African National Standards (SANS 2001.CM1: 2007) require minimum compressive strengths of 10.0 MPa after a 28-day curing period for double-storey
0
2
4
6
8
10
12
14
16
18
500 600 700 800 900 1000 1100 1200 1300
CO
MPR
ESSI
VE S
TREN
GTH
(NPa
)
SINTERING TEMPERATURE (0C)
FA1
FA2
FA3
FA4
FA5
Figure 3: Twelve hours brick strength at various temperature
3.4 Effect of curing age on fly ash bricks
The effects of curing period on compressive strength values of the tested bricks are summarized in Figure 4. The specimens were cured using the fully submerged method of curing at room temperature of 22°C for 7, 28, 56 and 90 days, in order to investigate the strength gain under the water-curing method. The bricks selected for this curing method were those produced under sintering temperature of 1200°C for all mixes. Based on the graphical result, it is observed that the early age of curing (i.e. (≤ 3-7 days) is practically inactive to trigger pozzolanic reaction, in order to give a reasonable amount of strength, even at higher dosage of FA and DW. As the curing period increases with higher dosage of DW, more vigorous pozzolanic reaction takes place, which improves the strength with curing time. Moreover, the studied bricks ranging from FA2 gave a gradual rising slope of strength up to 56 days of curing, and this trend describes the extent of curing with pozzolanic reaction. It was observed that the compressive strength of FA3 bricks recorded a significant gain in strength of 3.1% from 5.3MPa for seven days curing time to 16.2MPa. It was observed that the strength of this brick for

Acta Structilia 2018: 25(2)
130
specimen FA3 increased as the curing age increases. The reason for this was the release of free calcium hydroxide (Ca(OH)2) by the dolomite, which, upon crystallization, reacts with some active minerals in FA and SF to form calcium aluminium silicates. This reaction, in turn, contributed to the hardening of the brick, even at a later stage. The reaction occurred as the CaO in dolomite encountered the pore water in the brick mixture, resulting in the formation of (Ca(OH)2) ion. However, all the specimens invariably showed a similar trend of strength increase with increasing curing period, except FA1. This was caused by the crystalline phase of the FA that contained little quantities of CaO, and this resulted in low strength gain.
The South African National Standards (SANS 2001.CM1: 2007) require minimum compressive strengths of 10.0 MPa after a 28-day curing period for double-storey construction load-bearing masonry units. The FA3, FA4 and FA5 brick mixtures cured at a 28-day period described in this study, hence satisfying the SANS 2001.CM1: 2007 standards for compressive strength. After 90 days of curing, it was measured that the compressive strength of FA3 mixture containing FA50% + DW10% + SF10% + RS30% was 3.1 and 2.8 times greater than that of the control mix and red fired-bricks sample, respectively (see Figure 4). The compressive strength of the tested brick as a result of curing recorded strength values close to the strength values reported in the literature by Lin et al. (2006: 970-978) and Ahmari and Zhang (2012: 323-331).
construction load-bearing masonry units. The FA3, FA4 and FA5 brick mixtures cured at a 28-day period described in this study, hence satisfying the SANS 2001.CM1: 2007 standards for compressive strength. After 90 days of curing, it was measured that the compressive strength of FA3 mixture containing FA50% + DW10% + SF10% + RS30% was 3.1 and 2.8 times greater than that of the control mix and red fired-bricks sample, respectively (see Figure 4). The compressive strength of the tested brick as a result of curing recorded strength values close to the strength values reported in the literature by Lin et al. (2006: 970-978) and Ahmari and Zhang (2012: 323-331).
Figure 4: Twelve hours compressive strength of cured bricks 4.5 Durability results The specimens were cured in water at different curing ages, namely 7, 28 and 56 days, respectively. After several days of curing, the specimens were removed from the curing bath for two days and submerged in water at room temperature for a period of five hours. They were subsequently sent to the oven for 42 hours at a temperature of 71oC. They were then removed from the oven, giving each specimen two trim of strokes on all surface with the wire scratch brush. Care was taken to ensure that the brush was held with its long axis parallel to the end as required to cover all areas of the full height and width of each specimen, with a firm stroke corresponding to a force of approximately 13.5N. It took 24 hours of wet-dry durability test to complete one cycle. The specimens were once again submerged in water and the procedures were repeated until 12 cycles. After 12 cycles, the specimens were dried to a constant mass at 71oC and subsequently weighed to determine the oven-dry mass of the specimens. The data collected was allowed for calculation of losses in mass for the bricks after the prescribed 12 cycles. This test is only recommended for road pavement materials, but it was chosen in this research to determine the extent to which these FA bricks can withstand severe weather conditions.
0
5
10
15
20
25
0 10 20 30 40 50 60 70 80 90 100
CO
MPR
ESSI
VE S
TREN
GTH
(MPa
)
CURING TIME (DAYS)
FA1
FA2
FA3
FA4
FA5
Figure 4: Twelve hours compressive strength of cured bricks

Aneke & Awuzie • Conversion of industrial wastes...
131
3.5 Durability results
The specimens were cured in water at different curing ages, namely 7, 28 and 56 days, respectively. After several days of curing, the specimens were removed from the curing bath for two days and submerged in water at room temperature for a period of five hours. They were subsequently sent to the oven for 42 hours at a temperature of 71oC. They were then removed from the oven, giving each specimen two trim of strokes on all surface with the wire scratch brush. Care was taken to ensure that the brush was held with its long axis parallel to the end as required to cover all areas of the full height and width of each specimen, with a firm stroke corresponding to a force of approximately 13.5N. It took 24 hours of wet-dry durability test to complete one cycle. The specimens were once again submerged in water and the procedures were repeated until 12 cycles. After 12 cycles, the specimens were dried to a constant mass at 71oC and subsequently weighed to determine the oven-dry mass of the specimens. The data collected was allowed for calculation of losses in mass for the bricks after the prescribed 12 cycles. This test is only recommended for road pavement materials, but it was chosen in this research to determine the extent to which these FA bricks can withstand severe weather conditions.
Durability (wet-dry cycle) tests were conducted based on the TMH durability test method. However, most of the bricks satisfied the strength requirements, thus surviving the entire cycles, which proved their capability to withstand severe weather conditions. The results of the durability tests were reported in terms of weight and strength loss at the end of the 12 cycles.
It was observed that the mass of the specimens decreased on the average of 0.48 per specimen, except for specimen FA1 that recorded a decrease in mass by 1.8% from 2.84kg to 2.750kg. However, this implied that FA1 did not utilize 73% of its moisture content for hydration reaction, contrary to other mixes that used up to 72.1% of their moisture content for pozzolanic reaction at 56 days of curing.

Acta Structilia 2018: 25(2)
132
Durability (wet-dry cycle) tests were conducted based on the TMH durability test method. However, most of the bricks satisfied the strength requirements, thus surviving the entire cycles, which proved their capability to withstand severe weather conditions. The results of the durability tests were reported in terms of weight and strength loss at the end of the 12 cycles. It was observed that the mass of the specimens decreased on the average of 0.48 per specimen, except for specimen FA1 that recorded a decrease in mass by 1.8% from 2.84kg to 2.750kg. However, this implied that FA1 did not utilize 73% of its moisture content for hydration reaction, contrary to other mixes that used up to 72.1% of their moisture content for pozzolanic reaction at 56 days of curing.
Figure 5: Final mass studied brick specimens after 12cycles 4.6 Initial rate of absorption An effective laboratory test to determine the initial rate of absorption (IRA) was conducted for bricks cured for 7, 28 and 56 days, by pouring a measured volume of water from a graduated container into a pan. The base of the brick was inserted approximately 7mm into the water for one minute. The water was poured back into the graduated container and the amount of water absorbed was recorded. The IRA of the studied bricks was measured. It was observed that the IRA of all the studied bricks were within the range of 4 to 37ml/min. This implied that the studied bricks do not exceed IRA of 40ml/min stipulated according to SANS1058:2011. This means that these bricks should not be wetted before laying.
2500
2600
2700
2800
2900
3000
400 500 600 700 800 900 1000 1100 1200 1300
FIN
AL
MA
SS (g
)
SINTERING TEMPERATURE (0C)
FA1
FA2
FA3
FA4
FA5
Figure 5: Final mass studied brick specimens after 12cycles
3.6 Initial rate of absorption
An effective laboratory test to determine the initial rate of absorption (IRA) was conducted for bricks cured for 7, 28 and 56 days, by pouring a measured volume of water from a graduated container into a pan. The base of the brick was inserted approximately 7mm into the water for one minute. The water was poured back into the graduated container and the amount of water absorbed was recorded. The IRA of the studied bricks was measured. It was observed that the IRA of all the studied bricks were within the range of 4 to 37ml/min. This implied that the studied bricks do not exceed IRA of 40ml/min stipulated according to SANS1058:2011. This means that these bricks should not be wetted before laying.

Aneke & Awuzie • Conversion of industrial wastes...
133
Figure 6: Initial absorption rate of the bricks specimens 4.7 Morphology analysis Figure 7 illustrates the results from scanning electron microscope (SEM) analysis deployed in understanding the morphology of 56 days cured bricks produced in this study. The micrograph showed newly formed cementitious compounds that coated the surface of the sand particles and filled the voids, because it was still at mature stage. This was characterized by flocculated arrangements and contributed to an increase in strength. The same formation was picked up by SEM analysis for brick sample FA3 even at 7 days curing because of the addition of 10% SF. However, SEM micrograph of brick sample FA1 that contains FA70% + RS30% cured for 7 days showed little cementitious compounds because pozzolanic reaction coated and joined both FA and RS particles as a network. The microstructure is characterized by flocculated arrangements and has fine-like structures in the porous system. This proved the relatively high value of IRA and the low strength gained at seven days of curing. The microstructure of FA2, FA4 and FA5 showed both fibrous and gel hydration reaction products, i.e. 3CaOSiO2, CaSi6O16(OH), 3CaOAl2O3, 3CaOAl2O3(OH)6. These hydration reaction products coated the sand particles and filled the voids completely within the bricks.
FA1 FA2 FA3 FA4 FA5
0
5
10
15
20
25
30
35
40
FA1 FA2 FA3 FA4 FA5
INITI
AL
ABS
ORP
TION
RA
TE (m
l/min
)
BRICK SPECIMENS
7days
28days
Series 3
Figure 6: Initial absorption rate of the bricks specimens
3.7 Morphology analysis
Figure 7 illustrates the results from scanning electron microscope (SEM) analysis deployed in understanding the morphology of 56 days cured bricks produced in this study. The micrograph showed newly formed cementitious compounds that coated the surface of the sand particles and filled the voids, because it was still at mature stage. This was characterized by flocculated arrangements and contributed to an increase in strength. The same formation was picked up by SEM analysis for brick sample FA3 even at 7 days curing because of the addition of 10% SF. However, SEM micrograph of brick sample FA1 that contains FA70% + RS30% cured for 7 days showed little cementitious compounds because pozzolanic reaction coated and joined both FA and RS particles as a network. The microstructure is characterized by flocculated arrangements and has fine-like structures in the porous system. This proved the relatively high value of IRA and the low strength gained at seven days of curing. The microstructure of FA2, FA4 and FA5 showed both fibrous and gel hydration reaction products, i.e. 3CaOSiO2, CaSi6O16(OH), 3CaOAl2O3, 3CaOAl2O3(OH)6. These hydration reaction products coated the sand particles and filled the voids completely within the bricks.

Acta Structilia 2018: 25(2)
134
FA1 FA2 FA3 FA4 FA5
Figure 7: Morphology of the studied bricks from SEM analysis
4. Conclusions and recommendationThe majority of the FA generated at coal-fired power plants in South Africa remains unused and often ends up in landfills and slurry ponds. Using FA to manufacture bricks not only produces a valuable commercial product, but also reduces a major waste disposal problem for power plants in South Africa. Based on the results obtained in this study, the following conclusions were reached.
The densities of the tested bricks were close, irrespective of the percentages of FA, DW and SF, due to a constant percentage of RS.
Results from this study are indicative of the satisfactory performance of FA bricks as a load-bearing element, especially the bricks with mix ratio of FA50% + DW10% + SF10% + RS30%. It therefore provides an appropriate channel for the disposal of FA in a very efficient, useful and profitable way.
The increase in compressive strength, unit volume weight, decrease in IRA absorption capacity, apparent capacity and reduced pore volume observed during durability tests can be attributed to the brick-forming pressure as well as the pozzolanic reaction that occurred between the DW, FA and RS particles. The mixtures containing FA50% + DW10% + SF10% + RS30% and FA30% + DW30% + SF10% + RS30% are evaluated to be the most satisfactory to produce masonry bricks when compared to other mixtures containing FA40% + DW30% + RS30% and FA60% + DW10% + RS30%. The highest compressive strength was observed in FA3 and FA5: 20.31MPa and 18.74MPa, respectively.
In summary, utilization of industrial wastes such as FA, DW, and SF for the production of bricks was, to a great extent, proven to be cost-effective and eco-friendly. It serves as a cost-reducing and eco-friendly material when transformed into a useful construction resource in circular economy, although the manufacturing of the

Aneke & Awuzie • Conversion of industrial wastes...
135
bricks investigated in this study requires using high temperatures as in the production of ordinary clay-fired bricks, which is energy-intensive and costly. In contrast, the bricks produced in this study can be produced at seven different power stations in South Africa, since the high temperatures required to produce these bricks are being generated in different power stations without any use. Using only a fraction of this energy in the production of FA bricks, Electricity Supply Commission (ESCOM) can have their own brand of bricks that will be more cost effective and create job opportunities. Thus, the estimated production cost of this new masonry brick will be 7.5 times cheaper than that of traditional clay-fired bricks. Obviously, the use of such materials can make significant contributions towards resolving the attendant challenges associated with low-cost housing provision in South Africa.
References Ahmari, S. & Zhang, L. 2012. Production of eco-friendly bricks from copper-mine tailings through geo-polymerization. Construction and Building Material, 29 (April), pp. 323-331. doi.org/10.1016/j.conbuildmat.2011.10.048.
Alonso-Santurde, R., Coz, A., Viguri, J.R. & Andrés, A. 2012. Recycling of foundry by-products in the ceramic industry: Green and core sand in clay bricks. Journal of Construction and Building Material, 7(1), pp. 96-106. doi.org/10.1016/j.conbuildmat.2011.08.022.
Bruel, A., Kronenberg, J., Troussier, N. & Guillaume, B. 2018. Linking industrial ecology and ecological economics: A theoretical and empirical foundation for the circular economy. Journal of Industrial Ecology, (2018) pp. 1-10. DOI: 10.1111/jiec.12745.
Carretero, M.I., Dondi, M., Fabbri, B. & Raimondo, M. 2002. The influence of shaping and firing technology on ceramic properties of calcareous and non-calcareous illitic–chloritic clays. Applied Clay Science, 20(6), pp. 301-306. doi.org/10.1016/S0169-1317(01)00076-X.
Chan, C. 2011. Effects of natural fibres inclusion in clay bricks: Physic-mechanical properties. International Journal of Civil and Environmental Engineering, 5(1), pp. 7-13. doi:10.1999/1307-6892/4241.
Cicek, T. & Tanrıverdi, M. 2007. Lime-based steam autoclaved fly ash bricks. Construction and Building Materials, 21(6), pp. 1295-1300. doi.org/10.1016/j.conbuildmat.2006.01.005.
Cusido, J.A., Cremades, L.V. & Gonzalez, M. 2003. Gaseous emissions from ceramics manufactured with urban sewage sludge during firing

Acta Structilia 2018: 25(2)
136
processes. Waste Management, 23(3), pp. 273-280. doi.org/10.1016/S0956-053X(02)00060-0.
Dachowski, R. & Kostrzewa, P. 2016. The use of waste materials in the construction industry. Procedia Engineering, 161, pp. 754-758. doi: 10.1016/j.proeng.2016.08.764.
Faria, K.C., Gurgel, R.F. & Holanda, J.N. 2012. Recycling of sugar cane bagasse ash waste in the production of clay bricks. Journal of Environmental Management, 101(June), pp. 7-12. doi: 10.1016/j.jenvman.2012.01.032.
Geissdoerfer, M., Savaget, P., Bocken, N.M.P. & Hultink, E.J. 2017. The circular economy - A new sustainability paradigm? Journal of Cleaner Production, 143, pp. 757-768. doi.org/10.1016/j.jclepro.2016.12.048.
Greyson, J. 2007. An economic instrument for zero waste, economic growth and sustainability. Journal of Cleaner Production, 15, pp. 1382-1390. doi: 10.1016/j.jclepro.2006.07.019.
Hamer, K. & Karius, V. 2002. Brick production with dredged harbour sediments. An industrial-scale experiment. Waste Management, 22(5), pp. 521-530. doi.org/10.1016/S0956-053X (01)00048-4.
Kavas, T. 2006. Use of boron waste as a fluxing agent in production of red mud brick. Building and Environment, 41(12), pp. 1779-1783. doi.org/10.1016/j.buildenv.2005.07.019.
Kibert, C.J. 2013. Sustainable Construction: Green Building Design and Delivery. 3rd Edition. New Jersey: John Wiley & Sons, Inc
Lieder, M. & Rashid, A. 2016. Towards circular economy implementation: A comprehensive review in context of manufacturing industry. Journal of Cleaner Production, 115, pp. 336-51. doi.org/10.1016/j.jclepro.2015.12.042.
Lin, C., Wu, C. & Ho, H. 2006. Recovery of municipal waste incineration bottom ash and water treatment sludge to water permeable pavement materials. Waste Management, 26(9), pp. 970-978. doi.org/10.1016/j.wasman.2005.09.014.
Loryuenyong, V., Panyachai, T., Kaewsimork, K. & Siritai, C. 2009. Effects of recycled glass substitution on the physical and mechanical properties of clay bricks. Waste Management, 29(10), pp. 2717-2721. doi.org/10.1016/j.wasman.2009.05.015.
Menzeses, R.R., Ferreira, H.S., Neves, G.A., Lira, H. & Ferreira, H.C. 2005. Use of the granite sawing waste in the production of ceramic bricks and tiles. Journal of European Ceramic Society, 25(7), pp. 1149-1158. doi.org/10.1016/j.jeurceramsoc.2004.04.020.
Aneke & Awuzie • Conversion of industrial wastes...
137
Pimraksa, K., Wilhelm, M., Kochherger, M. & Wruss, W. 2001. A new approach to the production of bricks made of fly ash. In: Proceedings of International Ash Utilization Symposium, Centre for Applied Energy Research, 22-24 October 2001. University of Kentucky, Lexington, Kentucky, Paper#84. [online] Available at: <http://www.flyash.info/2001/conprod1/84pimras.pdf> [Accessed: 15 January 2018].
Reynolds-Clausen, K. & Singh, N. 2017. South Africa’s power producer’s revised coal ash strategy and implementation progress. In: Proceedings of the World of Coal Ash (WOCA) Conference, 9-11 May, Lexington, Kentucky. Lexington, KY: American Coal Ash Association. Available at: <http://www.flyash.info/2017/020-Singh-woca2017p.pdf> [Accessed: 15th May 2018]
Robinson, J. 2004. Squaring the circle? Some thoughts on the idea of sustainable development. Ecological Economics, 48(4), pp. 369-384. doi: 10.1016/j.ecolecon.2003.10.017.
Rycroft, M. 2017. Exploring the many uses of fly ash. Online. EE Publishers. Available at: <http://www.ee.co.za/article/exploring-many-uses-fly-ash.html> [Accessed: 21st April 2018].
SANS (South African National Standards). 2011. Specifications and conformity criteria for fly ash chemical classification (SANS 50450).
Schroeder, P., Anggraeni, K. & Weber, U. 2018. The relevance of circular economy practices to the sustainable development goals. Journal of Industrial Ecology, (2018) pp. 1-19. DOI: 10.1111/jiec.12732.
Sfakianaki, E. 2015. Resource-efficient construction: Rethinking construction towards sustainability. World Journal of Science, Technology and Sustainable Development, 12(3), pp. 233-242. doi.org/10.1108/WJSTSD-03-2015-0016.
Urbinati A., Chiaroni, D. & Chiesa, V. 2017. Towards a new taxonomy of circular economy business models. Journal of Cleaner Production, 168, pp. 487-498. doi.org/10.1016/j.jclepro.2017.09.047.
Vivanco, D.F., Wang, R., Deetman, S. & Hertwich, E. 2018. Unraveling the nexus: Exploring the pathways to combined resource use. International Journal of Industrial Ecology, (2018) pp. 1-12. DOI: 10.1111/jiec.12733.
Winans, K., Kendall, A. & Deng, H. 2017. The history and current applications of circular economy concept. Renewable and Sustainable Energy Reviews, 1 (2017), pp. 825-833. doi.org/10.1016/j.rser.2016.09.123.
Zhu, J., Fan, C., Shi, H. & Shi, L. 2018. Efforts for a circular economy in China: A comprehensive review of policies. Journal of Industrial Ecology, (2018), pp. 1-9. doi.org/10.1111/jiec.12754.

138
Navorsingsartikels • Research articles
Mandy Malindi
Mrs Mandy Malindi, Master’s graduate, Department of Construction Management, Nelson Mandela University, Port Elizabeth, South Africa. Phone: +27 0-11-682-0078, e-mail: <[email protected]>
John Smallwood
Prof. John Smallwood, Department of Construction Management, Nelson Mandela University, Port Elizabeth, South Africa. Phone: +27 0-41-504-2790, e-mail: <[email protected]>
DOI: http://dx.doi.org/10.18820/24150487/as25i2.6ISSN: 1023-0564e-ISSN: 2415-0487Acta Structilia 2018 25(2): 138-177© Creative Commons With Attribution (CC-BY)
The impact of the Construction Regulations 2014 on a water utility’s projects’ health and safety (H&S) performance in South Africa
Peer reviewed and revised
*The authors declared no conflict of interest for this title or article
AbstractThe construction industry plays a major role in South Africa’s economic development. Despite its importance, the poor health and safety (H&S) performance and associated costs to the industry are a concern. The literature review indicates that improved H&S performance can be achieved on a project where there is a collaborative approach among all stakeholders during the six project stages. This study focuses on the impact of the Construction Regulations 2014 on a water utility’s projects’ H&S performance. It determines the H&S involvement of client representatives and internal project stakeholders during the six project stages. It also addresses their commitment towards H&S, measures taken by them during planning and design, in contracts to improve H&S, and to select conscious contractors, and the extent of their H&S participation in construction H&S. Mixed methods research (a questionnaire survey and four case study projects) was used to collect the data required for the study. A total of 67 responses were obtained from the five stakeholder groups from the water utility, namely client representatives, designers, quantity surveyors (QSs), project managers (PMs), and construction H&S (CHS) professionals to obtain information regarding their H&S involvement during the six project stages. Four case study projects (three pre-Construction Regulations 2014 and one post-Construction Regulations 2014) were obtained, using a stratified random sampling technique and a checklist to obtain information regarding the stakeholder H&S involvement during the

Malindi & Smallwood • The impact of the Construction Regulations...
139
six project stages and the overall project performance. The study found that the Construction Regulations 2014 are perceived to have had an impact on the water utility’s H&S performance. There is a direct relationship between stakeholder H&S involvement and project H&S performance. The integration of H&S in the initial project phases; early involvement of CHS professionals, and H&S training for stakeholders are among the recommendations arising from this study.Keywords: Clients, construction health and safety professionals, designers, project managers, quantity surveyors
AbstrakDie konstruksiebedryf speel ’n belangrike rol in Suid-Afrika se ekonomiese ontwikkeling. Ten spyte van die belangrikheid daarvan, is die swak gesondheids- en veiligheids (G&V)-prestasie en verwante koste kommerwekkend. Die literatuuroorsig dui daarop dat verbeterde G&V-prestasie behaal kan word op ’n projek waar daar tydens die ses projekfases ’n samewerkende benadering onder alle belanghebbendes is. Hierdie studie fokus op die impak van die Konstruksie Regulasies 2014 op ’n watertoevoerprojek se G&V-vertoning. Dit bepaal die G&V-betrokkenheid van kliëntverteenwoordigers en interne projekbelanghebbendes gedurende die ses projekfases. Die artikel ondersoek ook hul verbintenis tot G&V en die maatreëls wat hulle tydens beplanning en ontwerp geneem het in kontrakte om G&V te verbeter. Verder ondersoek die artikel die kies van G&V-bewuste kontrakteurs asook die omvang van hul G&V-deelname aan konstruksie G&V. Die gemengde metode van navorsing (’n vraelysopname en vier gevallestudie-projekte) is gebruik om die data vir die studie te verkry. 67 Response is verkry vanuit die vyf watertoevoerprojekbelanghebbendes, naamlik kliëntverteenwoordigers, ontwerpers, bourekenaars (QS’s), projekbestuurders (PM’s) en konstruksie-G&V (GVP) professionele persone om inligting oor hul G&V-betrokkenheid te verkry gedurende die ses projekte stadiums. Vier gevallestudies (drie voor-Konstruksie Regulasies 2014 en een na-Konstruksie Regulasies 2014) is verkry deur gebruik te maak van ’n gestratifiseerde ewekansige steekproefnemingstegniek. ’n Kontrolelys is gebruik om inligting oor die belanghebbendes se G&V-betrokkenheid tydens die ses projekfases te verkry asook die algehele projekprestasie. Bevindinge toon dat die Konstruksie Regulasies 2014 ’n impak het op die G&V van die watertoevoerprojek. Daar is ’n direkte verhouding tussen die belanghebbendes se G&V-betrokkenheid en die projek se G&V-prestasie. Die integrasie van G&V in die aanvanklike projekfases; vroeë betrokkenheid van die GVP-professionele persone, en G&V-opleiding vir belanghebbendes is van die aanbevelings wat uit hierdie studie voortspruit.Sleutelwoorde: Bourekenaars, kliënte, konstruksie gesondheids- en veiligheidspersoneel, ontwerpers, projekbestuurders
1. IntroductionThe construction industry is considered to be risky, as it experiences high accident rates and ill-health problems (Muiruri & Mulinge, 2014: 2). The South African Department of Labour reported a rise in accidents during the period 2004/2005 to 2007/2008, with 162 fatalities in 2007/2008, excluding motor vehicle accidents, and 396 non-fatal accidents, namely temporary or permanent disablements (DoL, 2012: online; cidb, 2009: 2).

Acta Structilia 2018: 25(2)
140
To improve South African H&S performance, the Minister of Labour published a Government Notice under Section 43 of the OHS Act containing the Construction Regulations 2014, which repealed the Construction Regulations 2003 (RSA, 2014). In line with international trends, the Construction Regulations in South Africa include the client and the final end-user (cidb, 2009: 17). The intention of the Construction Regulations is to reduce the number of fatalities, injuries, and disease plaguing the construction industry. However, despite the promulgation of the Construction Regulations, a disproportionate number of accidents continue to occur in South Africa. The disabling injury incidence rate (DIIR) for the contractors undertaking work for the water utility, that is the subject of the study over the past three years, is above the industry average of 0.98 (cidb, 2009: 4), and a high level of H&S non-compliance is experienced on their related construction sites. This deficient performance, therefore, prompts the question as to whether clients and project stakeholders involved in the water utility’s projects become adequately involved in construction H&S during the six stages of the project. This study focuses on the impact of the Construction Regulations 2014 on a water utility’s projects’ H&S performance. The aim of this study is to determine the H&S involvement of client representatives and internal project stakeholders during the six project stages. The research objectives include their commitment towards H&S; measures taken by them during planning and design, in contracts to improve H&S, and to select conscious contractors, and the extent of their H&S participation in construction H&S.
Identification of such H&S involvement will ensure that proper strategies are put in place to deal with construction H&S issues during the six project stages, which, in the long term, will cause a reduction in accidents that occur on construction projects.
2. Literature review
2.1 Construction H&S management
The construction industry is regarded as the most hazardous industry with complex processes and unique challenges that influence H&S management and contribute to a high number of incidents, including fatalities (Saifullah & Ismail, 2012: 604; Kamardeen, 2013: 2; Sunindijo & Zou, 2015: 29). A report from the DoL (2012) states that the building and construction sector is one of the high-risk sectors that was compensated more than R287 million for occupational injuries in 2010/2011 and experienced 171 fatalities and 755 injuries from 2007 to 2010.

Malindi & Smallwood • The impact of the Construction Regulations...
141
According to Kikwasi (2009: 61), H&S management is inadequate in the industry, due to H&S not being taken seriously by parties involved in construction projects; clients and consultants being more concerned with quality of work than with H&S; inadequate H&S personnel and equipment; construction workers not trained or made aware with respect to the need to comply with H&S requirements; H&S not being budgeted for; H&S not being considered at the tendering stage and, as a result, clients expecting contractors to bear H&S-associated costs during project execution, and lastly, clients and contractors assuming that not making allowance for H&S reduces the project and construction cost.
The poor H&S performance and non-participation by key project stakeholders such as clients and designers motivated the promulgation of the construction H&S legislation in 2003 to foster multi-stakeholder interventions and participation (Agumba, Pretorius & Haupt, 2016: 70). The Construction Regulations (RSA, 2014) stipulate all H&S requirements in the construction industry that must be complied with by the client, the client’s agent, the designer, the principal contractor, and the contractors.
The 2014 amendments include the construction work permit (CWP), and the registration of construction H&S professionals with the South African Council for the Project and Construction Management Professions (SACPCMP) in terms of Act No. 48 (RSA, 2000). These changes are intended to drive a H&S cultural change to ensure collaboration of all key stakeholders on all matters of H&S throughout the project. However, the industry has not fully implemented the CWP process, due to the exemption notice given by the Minister in July 2015. The vast majority of organisations with construction projects of less than R40 million have not fully realised its impact.
The Construction Regulations are perceived to have had a positive impact in terms of reducing H&S accidents and have increased the level of H&S awareness. They have also increased PMs’ and general contractors’ consideration of, or reference to H&S (cidb, 2009: 11). However, they have not increased designers’ and QSs’ consideration of, or reference to H&S.
2.2 H&S in the six construction project stages
Figure 1 shows the project stages, as defined by the SACPCMP, used for this study.

Acta Structilia 2018: 25(2)
142
Proj
ect i
nitia
tion
and
brie
fing
Con
cept
and
fe
asib
ility
Des
ign
dev
elop
men
t
Tend
er
doc
umen
tatio
n an
d p
rocu
rem
ent
Con
stru
ctio
n d
ocum
enta
tion
and
man
agem
ent
Proj
ect c
lose
-out
Stage 1 Stage 2
pre-construction construction post- construction
Stage 3 Stage 4 Stage 5 Stage 6
Figure 1: Six project stagesSource: Authors
Various project stakeholders influence construction H&S throughout the six project stages. Research indicates that clients, designers, PMs, and QSs influence and can contribute to H&S. However, their involvement is not constant; it differs during the various project stages (Powell, 2012: 23). The client and the asset management staff are highly involved in Stages 1 and 2, less involved in Stage 3, and then more involved at take-over at the end of Stage 5; the designer is mostly involved in Stage 3, and usually involved in Stages 2, 4 and 5.
A study undertaken by Phoya & Eliufoo (2015: 424) among key project stakeholders such as clients, PMs, architects, engineers, QSs, site managers, and workers found that power is a predominant factor in terms of stakeholders’ participation in H&S management. It was also found that power has the potential to influence H&S performance. The diverse sources of power among project stakeholders created opportunities for them to participate in H&S in the various project stages. It was found that clients and PMs have substantial influence throughout the project stages, whereas other stakeholders such as architects, engineers, and QSs had substantial influence when they executed their duties in specific project stages. However, the use of influence was generally low, due to low levels of knowledge relative to H&S risk management among stakeholders. Their perception was that their participation would lead to increased cost, time wastage, and that it was not their responsibility. CHS professionals are not involved during the appropriate stages to influence the design or any critical H&S issues (Deacon & Smallwood, 2016: 6). The lack of knowledge of construction, formal and continued education, support from clients, and the buy-in at many levels are some of the barriers faced by CHS professionals, thus preventing them from ensuring adequate levels of H&S (Deacon, 2009: 3). This indicates that H&S involvement is “fragmented resulting in varying degrees of statutory compliance”,

Malindi & Smallwood • The impact of the Construction Regulations...
143
thus increasing project risk. The SACPCMP has developed professional roles and responsibilities that are aligned to the six project stages for each of the CHS professional categories to manage these challenges.
2.2.1 Stage 1 (project initiation and briefing) and Stage 2 (concept and feasibility)
Research confirms that clients play a key role in project implementation. This is also reflected in the United Kingdom’s CDM regulations of 2015, and the South African Construction Regulations 2014 that require them to manage H&S throughout the project (Phoya & Eliufoo, 2015: 424). Clients can positively influence project H&S performance, since they contribute to the funding of the project, and are able to include H&S during objective identification and project brief (Saifullah & Ismail, 2012: 606). Due to constraints during the development of a project brief, the client may reduce the project budget, add new project criteria, change project objectives, and accelerate the design or the construction efforts of the project that play an essential role in accident occurrences (Said, Shafiei & Omran, 2009: 128). According to Lopes, Haupt and Fester (2011: 9), common H&S problems encountered during construction could be avoided if H&S was considered during the project brief and design phase (Saifullah & Ismail, 2012: 606).
2.2.2 Stage 3 (design)
The design phase provides an opportunity to eliminate hazards before they appear on the construction site. The ability to eliminate hazards diminishes as the project progresses. Research indicates that QSs have a direct influence on construction H&S by drawing up specifications that ensure contractors make adequate provision for H&S, whereas designers have a direct influence on construction H&S when they consider H&S in their designs. Saifullah and Ismail (2012: 606) state that most of the H&S issues arise from inadequate design, due to design professionals not taking responsibility owing to a lack of H&S education and training, lack of H&S design tools, and their attempt to limit their liability exposure (Saifullah & Ismail, 2012: 606). Studies undertaken by Gambatese, Behm and Rajendran (2007: 676) and by Tymvios and Gambatese (2015: 1) provide evidence of the link between a project’s design and construction site injury and fatality incidents.

Acta Structilia 2018: 25(2)
144
2.2.3 Stage 4 (tender documentation and procurement)
According to Wells and Hawkins (2010: 3), procurement systems are instrumental in promoting H&S practices. However, minimum attention is paid to improve procurement standards. A study undertaken by Haupt and Hefer (2015: 456) found that H&S was not adequately addressed in standard forms of construction contracts used in South Africa. Similar studies found that contract documentation did not provide contractors with the opportunity to price for H&S for improving H&S performance (Kikwasi, 2009: 58), and the H&S specifications in the tender documents are marginally project-specific and relatively lengthy (Smallwood, 2007: 338). Research indicates that there is limited emphasis on H&S requirements, and that budgeting for H&S in the contract documents ranged from 0.21% to 1.99% of the contract value (Latib, Zahari, Hamid & Yee, 2016: 53). However, according to the cidb (2009: 9), the cost of H&S is approximately 5.0% of the value of a contract.
According to Saifullah and Ismail (2012: 608), the traditional procurement system focuses on tender cost, thus restricting contractors to work more efficiently. Such competitive tendering marginalises H&S (Smallwood & Venter, 2002: 59).
2.2.4 Stage 5 (construction)
PMs play a vital role in the execution of projects (Phoya & Eliufoo, 2015: 424) and are empowered by the conditions of the contract to issue instructions and inspect the contractor’s work on behalf of the client. Research indicates that continuous monitoring and reviewing of H&S management practices are required in order to improve the poor H&S record and to enhance overall legal compliance. A study revealed that 60% of clients conduct periodic job-site H&S inspections or H&S audits; 50% of them participate in contractor H&S meetings; 20% of them participate in the investigation of all lost workday injury accidents, and 3% of clients employ H&S personnel on the project site to monitor injury incidence rate (Said, Shafiei & Omran, 2009: 130).
2.2.5 Stage 6 (project close-out)
The last major phase of a construction project is when a client receives and approves all reports as required by the terms and conditions of the award, and notifies the contractor of the final acceptance and closure of the project (Mpanza, Mututo & Pearl, 2008: 134). A study conducted among PMs determined that inadequate or lack of H&S or H&S non-compliance indirectly impacts on the overall

Malindi & Smallwood • The impact of the Construction Regulations...
145
project performance parameters of productivity, quality, cost, client perceptions, environment, and schedule (cidb, 2009: 8). Research recommends that, at this stage, both successes and problems on the project should be identified through a ‘lessons learned’ process, which can be applied during Stage 1 of future projects, in order to improve project performance.
3. Research methodologyThis study focused on the impact of the Construction Regulations 2014 on a water utility’s projects’ H&S performance and addressed the H&S involvement of client representatives and internal project stakeholders during the six project stages. The study used a mixed methods design, in which quantitative and qualitative data were collected and analysed. Conclusions were then integrated (Leedy & Ormrod, 2015: 329). A questionnaire survey and four case study infrastructure projects were used to obtain data from a large water utility in South Africa, within which several substantial construction projects were undertaken. The case study is a type of applied qualitative research, in which in-depth data are gathered relative to a single individual programme or event for the purpose of learning more about an unknown or poorly understood situation (Leedy & Ormrod, 2015: 329). The case study was found most appropriate for investigating the extent of stakeholder H&S involvement during the six project stages over a period based on the overall project performance as a result of the Construction Regulations. This complemented the quantitative research.
3.1 Sampling method and size
A combined list of 137 staff members, consisting of client representatives and project stakeholders working within the water utility, was obtained from the internal online directory available on the intranet. The staff list was stratified in five stakeholder groups, namely client representatives (17), designers (49), QSs (4), PMs (53), and CHS professionals (14).
A simple stratified random sampling selection method resulted in a sample size of 67, representing client representatives (11), designers (14), QSs (4), PMs (27), and CHS professionals (11). The sample size for construction-related professionals was calculated in accordance with the table recommended by Krejcie & Morgan (1970: 608) and required sample size calculator by The Research Advisors (2006). The table gives recommended sample sizes for general research activities, applicable to any defined population. From the required

Acta Structilia 2018: 25(2)
146
sample size calculator based on the table, the recommended sample size for a population of 137, a confidence level of 95%, and a margin of error (degree of accuracy) of 8.6% would be 67. This recommendation validates the sample size of 67 as efficient for the population of 137.
The case study compared historic data from a sample of four projects based on a stratified random sample of projects selected by separating the projects into mutually exclusive sets, or strata and then drawing a simple random sample from each stratum. This list of projects was then generated from Systems Applications and Products (SAP), and the following criteria were used to separate the projects into strata:
A. Pre-Construction Regulations 2014 completed process plant construction projects;
B. Pre-Construction Regulations 2014 completed pipeline construction projects;
C. Pre-Construction Regulations 2014 completed upgrade of dam projects, and
D. Post-Construction Regulations 2014 construction projects falling under the Annexure 1 CWP requirement that is still in progress.
3.2 Data collection
The questionnaire was evolved based on the findings emanating from the literature review. It consisted of fifteen (15) questions, fourteen (14) being close ended, using a 5-point Likert scale, and one being open ended, the latter allowing for the recording of general comments. The survey used a single instrument for all respondent groups and was pre-tested. The questionnaire was e-mailed and posted to client representatives and project stakeholders to the target population within the water utility. Respondents were asked to indicate the importance of various parameters: the level of contribution by various stakeholders during the six project stages; the importance of H&S during the six project stages; the extent to which H&S can be influenced during the six project stages; the level of H&S involvement by various stakeholders during the six project stages; the frequency of H&S actions undertaken by the various stakeholders during the six project stages; the factors that contribute to optimum H&S, and the contribution of the Construction Regulations 2014 on a project. While 52 of the respondents completed the questionnaire via email and replied via email, 15 respondents hand-delivered the questionnaire
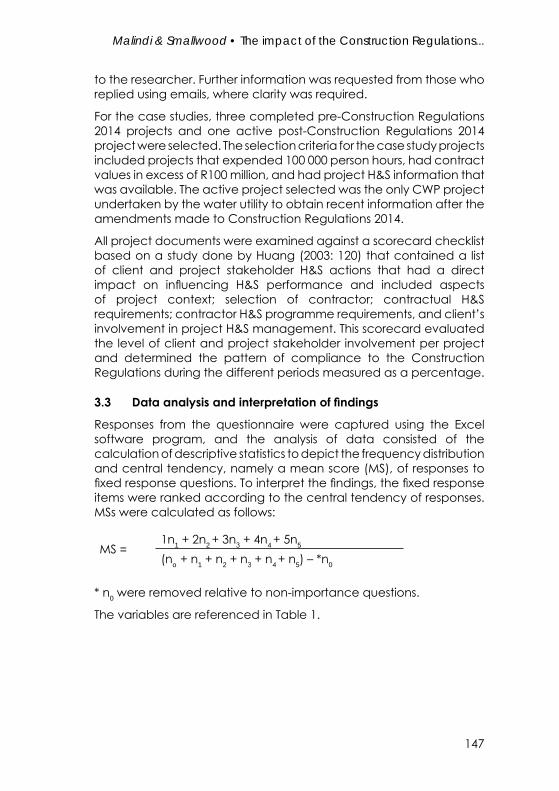
Malindi & Smallwood • The impact of the Construction Regulations...
147
to the researcher. Further information was requested from those who replied using emails, where clarity was required.
For the case studies, three completed pre-Construction Regulations 2014 projects and one active post-Construction Regulations 2014 project were selected. The selection criteria for the case study projects included projects that expended 100 000 person hours, had contract values in excess of R100 million, and had project H&S information that was available. The active project selected was the only CWP project undertaken by the water utility to obtain recent information after the amendments made to Construction Regulations 2014.
All project documents were examined against a scorecard checklist based on a study done by Huang (2003: 120) that contained a list of client and project stakeholder H&S actions that had a direct impact on influencing H&S performance and included aspects of project context; selection of contractor; contractual H&S requirements; contractor H&S programme requirements, and client’s involvement in project H&S management. This scorecard evaluated the level of client and project stakeholder involvement per project and determined the pattern of compliance to the Construction Regulations during the different periods measured as a percentage.
3.3 Data analysis and interpretation of findings
Responses from the questionnaire were captured using the Excel software program, and the analysis of data consisted of the calculation of descriptive statistics to depict the frequency distribution and central tendency, namely a mean score (MS), of responses to fixed response questions. To interpret the findings, the fixed response items were ranked according to the central tendency of responses. MSs were calculated as follows:
MS =1n1 + 2n2 + 3n3 + 4n4 + 5n5
(no + n1 + n2 + n3 + n4 + n5) – *n0
* n0 were removed relative to non-importance questions.
The variables are referenced in Table 1.

Acta Structilia 2018: 25(2)
148
Table 1: Definition of Likert scale points and related variables
Likert scale point Variable
Unsure Unsure Unsure Unsure n0
Not important Minor extent Very low Never n1
Less than important Near minor extent Low Rarely n2
Important Some extent Moderate Sometimes n3
More than important Near major extent High Often n4
Very important Major extent Very high Always n5
In order to describe the data in more detail, the following ranges and interpretation were used in analysing the weighted MS, as referenced in Table 2.
Table 2: Range and interpretation of the five-point Likert scale
Scale Range Interpretation
1 > 1.00 ≤ 1.80
Not important to less importantMinor extent to near minor extentVery low to lowNever to rarely
2 > 1.80 ≤ 2.60
Not important to less than important/less than importantMinor extent to near minor extent/near minor extentVery low to low/lowNever to rarely/rarely
3 > 2.60 ≤ 3.40
Less than important to important/importantNear minor extent to some extent/some extentLow to moderate/moderateRarely to sometimes/sometimes
4 > 3.40 ≤ 4.20
Important to more than important/more than importantSome extent to near major extent/near major extentModerate to high/highSometime to often/often
5 > 4.20 ≤ 5.00
More than important to very important/very importantNear major extent to major extent/major extentHigh to very high/very highOften to always/always
The documentation from the sampled case study projects was examined according to each of the 25 criteria on the checklist scorecard. The information reviewed was interpreted as criteria either being met, or not being met, respectively, by way of ‘yes’ and ‘no’ responses and captured using the Excel software program. The data

Malindi & Smallwood • The impact of the Construction Regulations...
149
for each project was given a percentage score to show the level of involvement in the project and grouped according to the bins as determined by Huang (2003: 120): < 52% (weak involvement); > 52% < 88% (moderate involvement); > 88% (strong involvement). This data was compared with the project performance for each project, i.e. on time, DIFR, within budget, and the percentage H&S constituted of the project.
4. Findings and discussion
4.1 Questionnaire results
4.1.1 The importance of project parameters
Table 3 indicates the importance of five parameters to the respondents on a scale of 1 (not important) to 5 (very important), and a MS ranging between 1.00 and 5.00.
Table 3: The importance of project parameters in terms of the stakeholder’s groups
Project parameter
CHS professional Clients Designers Project
managersQuantity surveyors Mean
MS R MS R MS R MS R MS R MS RProject H&S 5.00 1 4.82 2 4.71 1= 4.85 2 4.75 3= 4.84 1
Project quality 4.73 2= 4.91 1 4.50 3 4.89 1 4.50 5 4.76 2
Project cost 4.73 2= 4.45 3= 4.71 1= 4.78 3 5.00 1= 4.72 3Project time 4.73 2= 4.45 3= 4.23 4 4.63 4 5.00 1= 4.49 4Environment 4.55 5 4.45 3= 4.14 5 4.48 5 4.75 3= 4.43 5Respondent mean MS 4.75 4.62 4.46 4.73 4.80 4.65
The respondent mean MSs are all between > 4.20 ≤ 5.00, indicating that stakeholders perceive H&S, quality, cost, time, and environment as more than important to very important/very important parameters to measure successful projects.
Both clients and PMs perceive quality as the most important project parameter, and H&S as the second most important parameter. Designers perceive cost and H&S as the most important project parameter, and thereafter quality as the second most important parameter. QSs consider project cost and time as the most important project parameters, and CHS professionals perceive project H&S as the most important project parameter.

Acta Structilia 2018: 25(2)
150
4.1.2 The level of contribution of the various stakeholders to the implementation of the Construction Regulations 2014
Table 4 indicates the level of contribution of the various stakeholders to the implementation of the Construction Regulations 2014 in terms of the stakeholder’s groups on a scale of 1 (minor) to 5 (major), and a MS ranging between 1.00 and 5.00.
Table 4: The level of contribution of various stakeholders to the implementation of the Construction Regulations in terms of the stakeholder’s groups
StakeholderCHS
professional Clients Designers Project managers
Quantity surveyors Mean
MS R MS R MS R MS R MS R MS RConstruction H&S professional
4.73 1 4.82 1= 4.71 1 4.74 1= 4.33 2 4.73 1
Principal contractors 4.60 2 4.82 1= 4.14 4 4.74 1= 5.00 1= 4.62 2
Project managers 4.18 3 4.82 1= 4.29 3 4.59 3 5.00 1= 4.52 3
Designers 3.78 6 4.18 5 4.50 2 4.19 4 4.33 3= 4.20 4Clients 4.09 4 4.09 6 4.08 5 4.07 6 4.33 3= 4.09 5
Subcontractors 3.90 5 4.36 4 3.85 6 4.15 5 4.00 6 4.08 6
Suppliers 2.78 8 4.09 6 3.33 8 4.06 7 3.67 7 3.52 7Quantity surveyor 3.00 7 3.82 8 3.46 7 3.56 8 3.33 8 3.49 8
Respondent mean MS 3.88 4.38 4.05 4.26 4.25 4.16
The respondent mean MSs are > 3.00, indicating that respondents perceived all eight stakeholders to contribute to the implementation of the Construction Regulations. CHS professionals, principal contractors, and PMs are the only stakeholders with MSs > 4.20 ≤ 5.00, indicating that they are deemed to make between a near major to major/major contribution to the implementation of the regulations. PMs, designers, and CHS professionals view themselves as major contributors to the implementation of the Construction Regulations.
4.1.3 The importance of H&S; the extent to which project H&S can be influenced, and the level of H&S involvement during the six project stages
Table 5 indicates i) the importance of H&S; ii) the extent to which project H&S can be influenced, and iii) the level of H&S involvement during the six project stages on a scale of 1 (not important/minor/very low) to 5 (very important/major/very high), and a MS ranging between 1.00 and 5.00.

Malindi & Smallwood • The impact of the Construction Regulations...
151
Tabl
e 5:
Th
e im
porta
nce
of H
&S;
the
ext
ent
to w
hich
pro
ject
H&
S ca
n be
influ
ence
d, a
nd t
he le
vel o
f H&
S in
volv
emen
t dur
ing
the
six p
roje
ct st
ages
Stag
eC
HS p
rofe
ssio
nal
Clie
nts
Des
igne
rsPr
ojec
t man
ager
sQ
uant
ity su
rvey
ors
Mea
n
MS
RM
SR
MS
RM
SR
MS
RM
SR
(i) T
he im
porta
nce
of H
&S
dur
ing
the
six p
roje
ct st
ages
Stag
e 5
4.82
3=4.
274
4.62
14.
891
5.00
1=4.
661
Stag
e 6
4.91
1=4.
452
4.29
24.
194
5.00
1=4.
422
Stag
e 3
4.82
3=4.
551
4.14
34.
223
4.25
5=4.
363
Stag
e 4
4.91
1=3.
736
3.69
54.
592
4.75
34.
274
Stag
e 2
4.73
54.
095
4.00
43.
935
4.25
5=4.
125
Stag
e 1
4.45
64.
452
3.57
63.
746
4.75
34.
006
Resp
ond
ent
mea
n M
S 4.
774.
264.
054.
264.
674.
31
(ii) T
he e
xten
t to
whi
ch p
roje
ct H
&S
can
be in
fluen
ced
dur
ing
the
six p
roje
ct st
ages
Stag
e 5
4.55
1=4.
272
4.00
2=4.
412
5.00
1=4.
361
Stag
e 6
4.55
1=3.
915
3.31
63.
266
3.75
64.
302
Stag
e 3
4.36
44.
551
4.23
14.
193
4.50
34.
263
Stag
e 4
4.55
1=3.
826
3.77
54.
441
5.00
1=4.
084
Stag
e 2
4.09
54.
183
4.00
2=4.
044
4.25
4=3.
855
Stag
e 1
4.00
64.
094
3.85
43.
635
4.25
4=3.
626
Resp
ond
ent
mea
n M
S 4.
354.
143.
864.
004.
464.
08
(iii)
The
leve
l of H
&S
invo
lvem
ent d
urin
g th
e six
pro
ject
stag
esSt
age
54.
551
4.00
43.
312=
4.59
14.
251
4.21
1St
age
64.
092
4.18
1=3.
145
3.81
33.
003
3.73
2St
age
43.
273
3.36
63.
312=
3.93
24.
002
3.61
3St
age
31.
904
4.09
34.
001
3.26
42.
254=
3.29
4St
age
21.
705
3.55
53.
214
3.00
5=2.
254=
2.89
5St
age
11.
456
4.18
1=3.
145
3.00
5=1.
506
2.88
6Re
spon
den
t m
ean
MS
2.83
3.89
3.35
3.60
2.88
3.44

Acta Structilia 2018: 25(2)
152
The respondent mean MSs are > 3.00 for (i) and (ii), indicating that all stakeholders perceive H&S to be important, and that it can be influenced during the six project stages.
For item (i), Stages 5, 6, 3, and 4 have MSs that are > 4.20 ≤ 5.00; therefore, H&S can be deemed to be between more than important to very important/very important during these stages. It is notable that H&S is perceived to be more important in Stage 5 and ranked first among the other stages, whereas Stages 2 and 1 were ranked fourth and fifth based on their MSs.
For item (ii), Stages 5, 6, and 3 have MSs > 4.20 ≤ 5.00, indicating that H&S can be influenced between a near major to major/major extent during these stages. The vast majority of the stakeholders ranked Stage 5 as the first stage at which H&S can be influenced, and ranked Stages 2 and 1 as the stages when H&S can be least influenced.
For item (iii), the respondent mean MSs for clients, designers, PMS are > 3.00, indicating that these stakeholders are involved in H&S during the six project stages. Stages 3 to 6 have MSs above the mid-point score of 3.00, indicating H&S involvement during these stages. It is notable that Stage 5 has a MS > 4.20 ≤ 5.00, indicating high to very high/very high involvement during this stage.
The involvement of clients in construction H&S during the various project stages is between moderate to high/high, except for Stage 4, which is between low to moderate/moderate. The involvement of designers in construction H&S in Stage 3 is between moderate to high/high, and in the other remaining Stages it is between low to moderate/moderate. The involvement of PMs in construction H&S in Stages 4 and 6 is between moderate to high/high; Stage 5 is between high to very high/very high, and in Stages 1 to 3 it is between low to moderate/moderate. The involvement of QSs in construction H&S in Stages 1 to 3 is between very low to low/low; Stage 4 is between low to moderate/moderate; Stage 5 is between high to very high/very high, and Stage 6 is between moderate to high/high. The involvement of CHS professionals in construction H&S in Stages 1 and 2 is between low to very low/very low; Stage 3 is between very low to low/low; Stage 4 is between low to moderate/moderate; Stage 5 is between high to very high/very high, and Stage 6 is between moderate to high/high.

Malindi & Smallwood • The impact of the Construction Regulations...
153
4.1.4 The extent to which various H&S factors contribute to optimum H&S on a project
Table 6 indicates the extent to which various factors contribute to optimum H&S on a project, on a scale of 1 (minor) to 5 (major), and in terms of MSs ranging between 1.00 and 5.00.
Table 6: The extent to which various H&S factors contribute to optimum H&S on a project
H&S factors
Response (%)
MS RU
Minor…………….…………...Major
1 2 3 4 5
Consideration of H&S in construction contracts 4.5 0.0 0.0 3.0 16.4 76.1 4.77 1
Active client participation in H&S during construction
1.5 1.5 0.0 4.5 28.4 64.2 4.56 2
Active client participation in H&S prior to construction (project planning)
1.5 0.0 3.0 6.0 35.8 53.7 4.42 3
Encouraging designers to address H&S issues in the design phases
4.5 0.0 6.0 7.5 23.9 58.2 4.41 4
Client dedication of funds to support the contractor’s H&S efforts
10.4 0.0 6.0 3.0 31.3 49.3 4.38 5
Selection of contractors with good H&S performance records
10.4 4.5 7.5 9.0 17.9 50.7 4.15 6
Client H&S recognition and reward programme
13.4 3.0 7.5 23.9 20.9 31.3 3.81 7
Mean MS 4.36
The mean MS is > 3.00, showing that all stakeholders perceive the various H&S factors rated to contribute to optimum H&S on a project. It is notable that the top five ranked factors ‘Consideration of H&S in construction contracts’; ‘Active client participation in H&S during construction’; ‘Active client participation in H&S prior to construction (project planning)’; ‘Encouraging designers to address H&S issues in the design phases’, and ‘Client dedication of funds to support the contractor’s H&S efforts’ have > 4.20 ≤ 5.00, indicating a near major to major/major contribution to optimum H&S on a project.
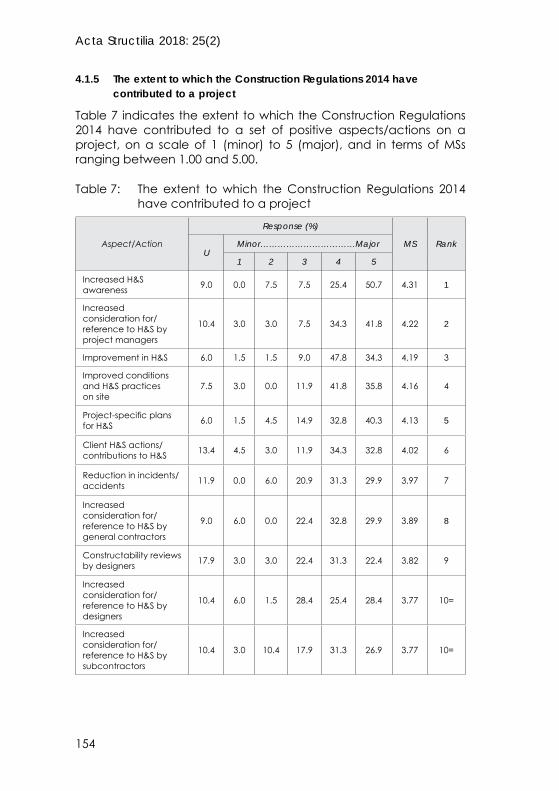
Acta Structilia 2018: 25(2)
154
4.1.5 The extent to which the Construction Regulations 2014 have contributed to a project
Table 7 indicates the extent to which the Construction Regulations 2014 have contributed to a set of positive aspects/actions on a project, on a scale of 1 (minor) to 5 (major), and in terms of MSs ranging between 1.00 and 5.00.
Table 7: The extent to which the Construction Regulations 2014 have contributed to a project
Aspect/Action
Response (%)
MS RankU
Minor……………………………Major
1 2 3 4 5
Increased H&S awareness 9.0 0.0 7.5 7.5 25.4 50.7 4.31 1
Increased consideration for/reference to H&S by project managers
10.4 3.0 3.0 7.5 34.3 41.8 4.22 2
Improvement in H&S 6.0 1.5 1.5 9.0 47.8 34.3 4.19 3
Improved conditions and H&S practices on site
7.5 3.0 0.0 11.9 41.8 35.8 4.16 4
Project-specific plans for H&S 6.0 1.5 4.5 14.9 32.8 40.3 4.13 5
Client H&S actions/contributions to H&S 13.4 4.5 3.0 11.9 34.3 32.8 4.02 6
Reduction in incidents/accidents 11.9 0.0 6.0 20.9 31.3 29.9 3.97 7
Increased consideration for/reference to H&S by general contractors
9.0 6.0 0.0 22.4 32.8 29.9 3.89 8
Constructability reviews by designers 17.9 3.0 3.0 22.4 31.3 22.4 3.82 9
Increased consideration for/reference to H&S by designers
10.4 6.0 1.5 28.4 25.4 28.4 3.77 10=
Increased consideration for/reference to H&S by subcontractors
10.4 3.0 10.4 17.9 31.3 26.9 3.77 10=

Malindi & Smallwood • The impact of the Construction Regulations...
155
Aspect/Action
Response (%)
MS RankU
Minor……………………………Major
1 2 3 4 5
Integration of design and construction in terms of H&S
7.6 4.5 6.1 22.7 33.3 25.8 3.75 12
Review of provision for H&S - Human Resources
13.4 3.0 6.0 25.4 31.3 20.9 3.71 13
Review of provision for H&S – Financial 19.4 4.5 7.5 22.4 25.4 20.9 3.63 14
Pre-qualification of contractors in terms of H&S
13.4 7.5 4.5 25.4 26.9 22.4 3.60 15
Increased consideration for/reference to H&S by quantity surveyors
16.4 6.0 17.9 16.4 26.9 16.4 3.36 16
Choice and review of procurement system and practices
32.8 7.5 10.4 20.9 11.9 16.4 3.29 17
Optimum project schedule (time) 16.4 9.0 11.9 34.3 19.4 9.0 3.09 18
Mean MS 3.82
The mean MS is > 3.00, showing that the respondents perceived the Construction Regulations 2014 to contribute to a set of positive aspects/actions on a project. It is notable that the top two ranked aspects/actions, namely ‘Increased H&S awareness’ and ‘Increased consideration for/reference to H&S by project managers’ have MSs > 4.20 ≤ 5.00, indicating between a near major to major/major contribution on a project. It is notable that 32.8% of the respondents were unsure as to the choice and review of procurement system and practices. This is attributed to the low to moderate/moderate involvement of stakeholders in Stage 4.
4.1.6 The frequency at which H&S actions are perceived to be undertaken during the six project stages
Tables 8 to 13 present the frequency at which the respondents perceive H&S actions to be undertaken during the six project stages in terms of a frequency range unsure, never, rarely, sometimes, often, and always. The H&S actions undertaken during the six project stages are ranked based upon a MS ranging between 1.00 and 5.00.

Acta Structilia 2018: 25(2)
156
Table 8 presents the frequency at which the respondents perceive the four H&S actions to be undertaken during Stage 1.
Table 8: The frequency at which H&S actions are perceived to be undertaken during Stage 1 (project initiation and briefing)
H&S actionCHS
professional Clients Designers Project managers
Quantity surveyors Mean
MS R MS R MS R MS R MS R MS R
Compile a preliminary project risk profile
3.22 2 4.09 1 4.07 1 3.41 1 3.25 3 3.63 1
Set project H&S goals 2.59 4 3.91 3 3.69 2 2.93 2 3.67 1= 3.24 2
Involve the H&S agent in project initiation meetings
2.63 3 4.00 2 3.50 3 2.81 3 3.00 4 3.16 3
Determine the optimum contract duration
3.44 1 3.36 4 3.33 4 1.38 4 3.67 1= 2.90 4
Respondent mean MS 2.97 3.84 3.65 2.63 3.40 3.23
Given that three of the four H&S actions’ MSs > 3.00, these actions can be deemed to be prevalent during this stage. It is notable that three H&S actions, namely ‘Set project H&S goals’, ‘Involve the H&S agent in project initiation meetings’ and ‘Determine the optimum contract duration’ fall within the range > 2.60 ≤ 3.40, between rarely to sometimes/sometimes. The respondent mean MS of all actions for CHS professionals, PMs, and QSs is perceived to be undertaken at a frequency between rarely to sometimes/sometimes, whereas clients and designers perceive these actions to be undertaken between sometimes to often/often.
Table 9 presents the frequency at which the respondents perceive the nine H&S actions to be undertaken during Stage 2.

Malindi & Smallwood • The impact of the Construction Regulations...
157
Tabl
e 9:
Th
e fre
quen
cy a
t whi
ch H
&S
actio
ns a
re p
erce
ived
to b
e un
der
take
n d
urin
g St
age
2 (p
roje
ct c
once
pt
and
feas
ibilit
y)
H&S
actio
nC
HS
prof
essio
nal
Clie
nts
Des
igne
rsPr
ojec
t m
anag
ers
Qua
ntity
su
rvey
ors
Mea
n
MS
RM
SR
MS
RM
SR
MS
RM
SR
Com
pile
a d
raft
H&S
spec
ifica
tion
4.00
13.
914
3.75
33.
041=
4.67
-3.
551
Iden
tify
gene
ral H
&S
issue
s in
the
proj
ect
ince
ptio
n re
port
3.63
24.
271
3.90
22.
744
4.50
-3.
412
Iden
tify
spec
ific
H&S
issue
s fro
m p
rior
expe
rienc
e3.
224
3.64
6=3.
504
2.89
34.
00-
3.24
3
Prod
uce
a ch
eckl
ist o
f pos
sible
H&
S ha
zard
s2.
906
4.00
2=3.
007
3.04
1=4.
50-
3.23
4
Con
sider
H&
S as
pect
s rel
ativ
e to
des
ign.
2.78
74.
002=
4.08
12.
595
4.00
-3.
215
Prep
are
cost
est
imat
es/
bud
get f
or H
&S
3.40
33.
646=
2.63
82.
586
4.50
-3.
056
App
rove
spec
ialis
ts’ H
&S
plan
s3.
005
3.80
53.
275
2.28
72.
00-
2.85
7
Aud
it sp
ecia
lists
und
erta
king
inve
stig
atio
ns2.
758
3.27
83.
136
2.11
8=-
-2.
598
Invo
lve
the
H&S
agen
t in
des
ign
mee
tings
2.60
92.
919
2.08
92.
118=
4.00
-2.
369
Resp
ond
ent m
ean
MS
3.14
3.72
3.26
2.60
4.02
3.05

Acta Structilia 2018: 25(2)
158
The CHS professionals’, designers’ and PMs’ mean MSs signify that they perceive all H&S actions to be undertaken at a frequency between rarely to sometimes/sometimes on average, whereas the clients’ and QSs’ mean MSs signify that they perceive all H&S actions to be undertaken between sometimes to often/often on average.
Six H&S actions (66.7%) have MSs of > 3.00. However, no H&S actions’ MSs fall within the range > 4.20 ≤ 5.00, between often to always/always. The MSs of ‘Compile a draft H&S specification’ and ‘Identify general H&S issues in the project inception report’ fall within the range > 3.40 ≤ 4.20, between sometimes to often/often. The MSs of five H&S actions that are ranked third to seventh fall within the range > 2.60 ≤ 3.40, between rarely to sometimes/sometimes. It is notable that the last two ranked H&S actions’ MSs, namely ‘Audit specialists undertaking investigations’ and ‘Involve the H&S agent in design meetings’ fall within the range > 1.80 ≤ 2.60, between never to rarely/rarely.
Table 10 presents the frequency at which the respondents perceive the seven H&S actions to be undertaken during Stage 3.

Malindi & Smallwood • The impact of the Construction Regulations...
159
Tabl
e 10
: Th
e fre
quen
cy a
t w
hich
H&
S ac
tions
are
per
ceiv
ed t
o be
und
erta
ken
dur
ing
Stag
e 3
(des
ign
dev
elop
men
t)
H&S
actio
nC
HS
prof
essio
nal
Clie
nts
Des
igne
rsPr
ojec
t m
anag
ers
Qua
ntity
su
rvey
ors
Mea
n
MS
RM
SR
MS
RM
SR
MS
RM
SR
Upd
ate
and
fina
lise
the
H&S
spec
ifica
tion
3.60
13.
911
3.25
23.
501
3.00
1=3.
531
Upd
ate
and
fina
lise
the
base
line
risk
asse
ssm
ent
afte
r the
des
ign
proc
ess
3.50
23.
822
2.67
32.
812
3.00
1=3.
082
Mod
ify d
esig
ns d
urin
g th
e d
esig
n ph
ase
to e
limin
ate
pote
ntia
l H&
S ris
ks2.
227
3.64
53.
381
2.58
43.
001=
2.90
3
Ass
ist th
e Q
S w
ith H
&S
item
s for
cos
t est
imat
es/
bud
gets
2.44
63.
366=
2.22
72.
683
2.50
62.
694
Agr
ee o
n th
e fo
rmat
of
the
H&S
file
2.60
43.
733=
2.40
52.
415
2.00
72.
685
Upd
ate
all H
&S
mat
ters
re
gula
rly a
nd in
corp
orat
e at
the
des
ign
stag
e2.
673
3.73
3=2.
644
2.22
63.
001=
2.66
6
Invo
lve
the
H&S
agen
t in
des
ign
mee
tings
2.45
53.
366=
2.38
61.
967
3.00
1=2.
417
Resp
ond
ent m
ean
MS
2.78
3.65
2.71
2.59
2.79
2.85
Acta Structilia 2018: 25(2)
160
Given that only 28.6% of the H&S actions have MSs > 3.00, these actions can be deemed to be little prevalent during the design development stage. It is notable that the last ranked H&S action’s MS, namely ‘Involve the H&S agent in design meetings’ falls within the range > 1.80 ≤ 2.60, between never to rarely/rarely. The CHS professionals’, designers’, and QSs’ mean MSs signify that they perceive all H&S actions to be undertaken between rarely to sometimes/sometimes on average, whereas the clients’ mean MS signifies that they perceive all H&S actions to be undertaken between sometimes to often/often on average. Lastly, the PMs’ mean MS signifies that they perceive these actions to occur between never to rarely/rarely.
Table 11 presents the frequencies at which the respondents perceive the seven H&S actions to be undertaken during Stage 4.
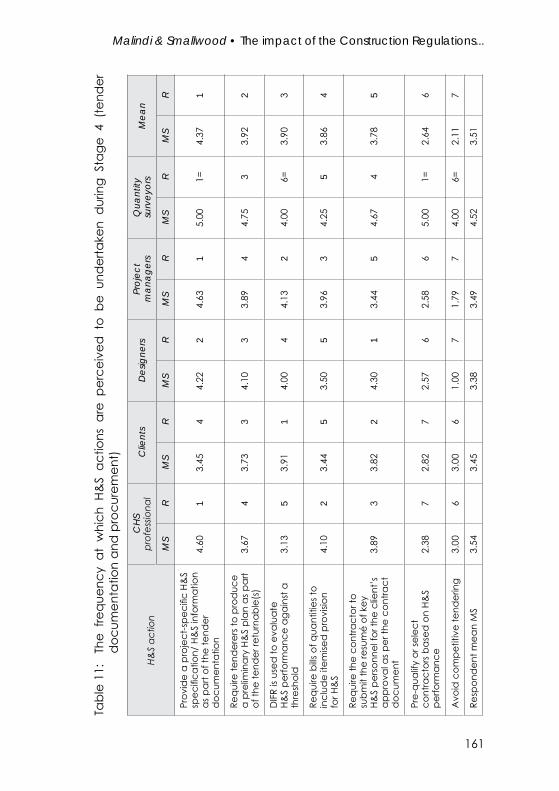
Malindi & Smallwood • The impact of the Construction Regulations...
161
Tabl
e 11
: Th
e fre
quen
cy a
t w
hich
H&
S ac
tions
are
per
ceiv
ed t
o be
und
erta
ken
dur
ing
Stag
e 4
(ten
der
d
ocum
enta
tion
and
pro
cure
men
t)
H&S
actio
nC
HS
prof
essio
nal
Clie
nts
Des
igne
rsPr
ojec
t m
anag
ers
Qua
ntity
su
rvey
ors
Mea
n
MS
RM
SR
MS
RM
SR
MS
RM
SR
Prov
ide
a pr
ojec
t-spe
cific
H&
S sp
ecifi
catio
n/ H
&S
info
rmat
ion
as p
art o
f the
tend
er
doc
umen
tatio
n
4.60
13.
454
4.22
24.
631
5.00
1=4.
371
Requ
ire te
nder
ers t
o pr
oduc
e a
prel
imin
ary
H&S
plan
as p
art
of th
e te
nder
retu
rnab
le(s
)3.
674
3.73
34.
103
3.89
44.
753
3.92
2
DIF
R is
used
to e
valu
ate
H&S
perfo
rman
ce a
gain
st a
th
resh
old
3.13
53.
911
4.00
44.
132
4.00
6=3.
903
Requ
ire b
ills o
f qua
ntiti
es to
in
clud
e ite
mise
d p
rovi
sion
for H
&S
4.10
23.
445
3.50
53.
963
4.25
53.
864
Requ
ire th
e co
ntra
ctor
to
subm
it th
e re
sum
é of
key
H&
S pe
rson
nel f
or th
e cl
ient
’s
appr
oval
as p
er th
e co
ntra
ct
doc
umen
t
3.89
33.
822
4.30
13.
445
4.67
43.
785
Pre-
qual
ify o
r sel
ect
cont
ract
ors b
ased
on
H&S
perfo
rman
ce2.
387
2.82
72.
576
2.58
65.
001=
2.64
6
Avo
id c
ompe
titiv
e te
nder
ing
3.00
63.
006
1.00
71.
797
4.00
6=2.
117
Resp
ond
ent m
ean
MS
3.54
3.45
3.38
3.49
4.52
3.51
Acta Structilia 2018: 25(2)
162
All stakeholder groups show a respondent mean MS of > 3.00, indicating that the respondents perceived H&S actions to be prevalent during the tender documentation and procurement stage. It is notable that one H&S action’s MS, namely ‘Provide a project-specific H&S specification/H&S information as part of the tender documentation’ falls within the range > 4.20 ≤ 5.00, between often to always/always. The sixth ranked H&S action’s MS, namely ‘Pre-qualify or select contractors based on H&S performance’ falls within the range > 2.60 ≤ 3.40, between sometimes to rarely/rarely. It is notable that the last ranked H&S action’s MS, namely ‘To avoid competitive tendering’ falls within the range > 1.80 ≤ 2.60, between never to rarely/rarely. It is notable that 46.3% of the respondents were unsure about ‘Avoid competitive tendering’.
Table 12 presents the frequencies at which the respondents perceive the twelve H&S actions to be undertaken during Stage 5.

Malindi & Smallwood • The impact of the Construction Regulations...
163
Tabl
e 12
: Th
e fre
quen
cy a
t w
hich
H&
S ac
tions
are
per
ceiv
ed t
o be
und
erta
ken
dur
ing
Stag
e 5
(con
stru
ctio
n m
anag
emen
t and
doc
umen
tatio
n)
H&S
actio
nC
HS
prof
essio
nal
Clie
nts
Des
igne
rsPr
ojec
t m
anag
ers
Qua
ntity
su
rvey
ors
Mea
n
MS
RM
SR
MS
RM
SR
MS
RM
SR
Ensu
re H
&S
file
is ap
prov
ed a
nd H
&S
ind
uctio
n is
cond
ucte
d b
efor
e ac
cess
to si
te is
gra
nted
4.91
2=4.
732=
4.86
1=4.
851
4.75
9=4.
841
Ensu
re th
e co
ntra
ctor
pre
pare
s HIR
As f
or th
e pr
ojec
t 5.
001
4.73
2=4.
5010
4.56
4=5.
001=
4.67
2
Ensu
re th
e co
ntra
ctor
app
oint
s a fu
ll-tim
e H&
S of
ficer
on
site
4.91
2=4.
554=
4.71
34.
564=
5.00
1=4.
673
Ensu
re H
&S
is on
e of
the
mai
n ag
end
a ite
ms f
or
each
pro
ject
site
mee
ting
4.73
64.
457=
4.57
94.
782
4.67
114.
674
Mon
itor i
njur
y ra
tes o
n ea
ch p
roje
ct4.
458=
4.82
14.
861=
4.44
85.
001=
4.63
5
Ensu
re n
o ac
cess
to si
te o
ccur
s by
any
pers
on
with
out t
he re
quire
d P
PE4.
824
4.55
4=4.
645=
4.48
74.
759=
4.60
6
Ensu
re th
e H&
S ag
ent c
ond
ucts
mon
thly
H&
S au
dits
/ in
spec
tions
4.60
74.
554=
4.62
74.
564
5.00
1=4.
597
Mon
itor n
ear m
isses
on
a pr
ojec
t4.
3610
4.45
7=4.
694
4.33
95.
001=
4.46
8
Incl
ude
the
cont
ract
or’s
H&
S pe
rform
ance
in th
e or
gani
satio
n’s H
&S
perfo
rman
ce st
atist
ics
4.80
53.
4511
4.58
84.
653
5.00
1=4.
459
App
ly p
enal
ties a
nd/o
r wor
k st
oppa
ges i
f co
ntra
ctor
s def
ault
4.45
8=4.
457=
4.64
5=4.
1110
5.00
1=4.
3410
Parti
cipa
te in
an
H&S
reco
gniti
on p
rogr
amm
e3.
4511
3.91
104.
0011
3.44
115.
001=
3.65
11
Prov
ide
fund
s abo
ve a
nd b
eyon
d th
e co
ntra
ct
valu
e to
pro
mot
e H&
S2.
7112
3.33
123.
8912
3.19
123.
5012
3.28
12
Resp
ond
ent m
ean
MS
4.43
4.33
4.55
4.33
4.81
4.40

Acta Structilia 2018: 25(2)
164
All stakeholder groups show a respondent mean MS of > 4.20, indicating that the respondents perceived H&S actions to be prevalent often to always/always during the construction management and documentation stage. The top ten H&S actions’ mean MSs fall within the range 4.20 and 5.00, between often to always. The last ranked H&S action’s mean MS, namely ‘Provide funds above and beyond the contract value to promote H&S’ falls within the range 2.60 and 3.40, between sometimes to rarely.
Table 13 presents the frequencies at which the respondents perceive the seven H&S actions to be undertaken during Stage 6.

Malindi & Smallwood • The impact of the Construction Regulations...
165
Tabl
e 13
: Th
e fre
quen
cy a
t w
hich
H&
S ac
tions
are
per
ceiv
ed t
o be
und
erta
ken
dur
ing
Stag
e 6
(pro
ject
cl
ose-
out)
H&S
actio
nC
HS
prof
essio
nal
Clie
nts
Des
igne
rsPr
ojec
t m
anag
ers
Qua
ntity
su
rvey
ors
Mea
n
MS
RM
SR
MS
RM
SR
MS
RM
SR
Retri
eve
as b
uilt
and
as l
aid
dra
win
gs4.
641
4.60
14.
002
4.16
1-
-4.
041
Retri
eve
the
H&S
plan
from
con
tract
ors
2.67
64.
002=
3.80
43.
524
--
3.88
2
Prep
are
an H
&S
proj
ect c
lose
-out
repo
rt4.
272
4.00
2=3.
715
3.62
2-
-3.
833
Cal
cula
te th
e D
IFR
for t
he p
roje
ct4.
203
3.70
54.
141
3.54
35.
00-
3.81
4
Eval
uate
the
proj
ect i
n te
rms o
f H&
S go
als
2.91
53.
646=
3.83
32.
776
--
3.09
5
Prep
are
H&S
oper
atio
ns a
nd m
aint
enan
ce re
ports
2.27
73.
646=
3.67
62.
965
--
3.04
6
Aud
it th
e co
ntra
ctor
s dur
ing
the
def
ects
liabi
lity
perio
d3.
004
3.82
43.
337
2.52
7-
-2.
987
Resp
ond
ent m
ean
MS
3.42
3.91
3.78
3.30
-3.
52

Acta Structilia 2018: 25(2)
166
All stakeholder groups show a respondent mean MS > 3.00, indicating that the respondents perceived H&S actions to be prevalent during the project close-out stage. The CHS professionals’, clients’, and designers’ mean MSs signify that they perceive all H&S actions to be undertaken between sometimes to often/often on average, whereas the PMs’ mean MS signifies that they perceive all H&S actions to be undertaken between rarely to sometimes/sometimes on average. The first four ranked H&S actions have MSs > 3.40 ≤ 4.20, between sometimes to often/often. The last three ranked H&S actions’ mean MSs fall within the range > 2.60 ≤ 3.40, between rarely to sometimes/sometimes.
4.2 Case study results
Figure 2 indicates the percentage scores of the level of H&S involvement of the stakeholders in the sampled projects and the year in which the projects commenced. Project A, undertaken in 2009, had a score of 44%, indicating a weak stakeholder involvement, and projects B and C, undertaken in 2012, had scores of 68% and 76%, respectively, indicating a moderate involvement. It is notable that project D, undertaken in 2015 after the promulgation of the Construction Regulations 2014, scored 80%, indicating a moderate involvement. This is, however, significantly higher than projects B and C.
Figure 2: The level of H&S involvement on different projects

Malindi & Smallwood • The impact of the Construction Regulations...
167
4.2.1 Pre-Construction Regulations 2014: Projects A, B and C
During the project file review for three sampled projects, it was noted that the ‘build only’ contract had little involvement across all project stages for projects A, B and C. PMs, QSs, and CHS professionals had little involvement during Stages 1 to 3. This is supported by questionnaire data where all three stakeholders ranked these stages as those with their least involvement. Research found that clients and project stakeholders did not realise the significance of placing H&S in the initial phases of a project.
Stage 4 of these projects indicated greater involvement, by making provision for CHS professionals, as well the requirement of an approved H&S policy to be part of tender submission. In addition, Projects B and C also required contractors to provide historic DIFRs to assist in tender adjudication.
Stages 5 and 6 of projects A to C indicated greatest involvement of stakeholders through the monitoring and enforcing of H&S requirements on projects sites, including the measurement of contractor H&S performance. This is further supported by questionnaire data that indicated greater involvement of CHS professionals and PMs during the last three stages of the project rather than in the first three. The significantly better scores for stakeholder involvement for projects B and C, undertaken in 2012, can be attributed to additional actions undertaken in all six project stages.
4.2.2 Post-Construction Regulations 2014: Project D
Project D, undertaken post-Construction Regulations 2014, had a 80% level of involvement, indicating a moderate involvement, but significantly higher than the projects undertaken pre-Construction Regulations 2014. As opposed to projects A to C, project D used a design and build contract that is more favourable. This is supported by literature, as this type of contract complements H&S through the integration of the design and construction processes.
4.2.3 Level of involvement vs. project performance
To determine the pattern of compliance with the Construction Regulations 2014, the project performance of the three completed sample projects was assessed using the project DIFR, and if the project was completed on time and within budget as reflected in Table 14. There is a direct relationship between stakeholder involvement and project H&S performance, also taking into consideration the
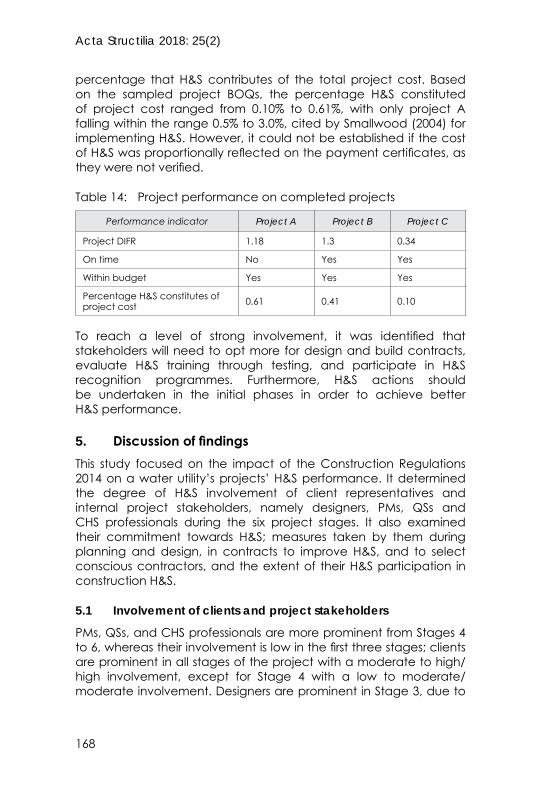
Acta Structilia 2018: 25(2)
168
percentage that H&S contributes of the total project cost. Based on the sampled project BOQs, the percentage H&S constituted of project cost ranged from 0.10% to 0.61%, with only project A falling within the range 0.5% to 3.0%, cited by Smallwood (2004) for implementing H&S. However, it could not be established if the cost of H&S was proportionally reflected on the payment certificates, as they were not verified.
Table 14: Project performance on completed projects
Performance indicator Project A Project B Project C
Project DIFR 1.18 1.3 0.34
On time No Yes Yes
Within budget Yes Yes Yes
Percentage H&S constitutes of project cost 0.61 0.41 0.10
To reach a level of strong involvement, it was identified that stakeholders will need to opt more for design and build contracts, evaluate H&S training through testing, and participate in H&S recognition programmes. Furthermore, H&S actions should be undertaken in the initial phases in order to achieve better H&S performance.
5. Discussion of findingsThis study focused on the impact of the Construction Regulations 2014 on a water utility’s projects’ H&S performance. It determined the degree of H&S involvement of client representatives and internal project stakeholders, namely designers, PMs, QSs and CHS professionals during the six project stages. It also examined their commitment towards H&S; measures taken by them during planning and design, in contracts to improve H&S, and to select conscious contractors, and the extent of their H&S participation in construction H&S.
5.1 Involvement of clients and project stakeholders
PMs, QSs, and CHS professionals are more prominent from Stages 4 to 6, whereas their involvement is low in the first three stages; clients are prominent in all stages of the project with a moderate to high/high involvement, except for Stage 4 with a low to moderate/moderate involvement. Designers are prominent in Stage 3, due to

Malindi & Smallwood • The impact of the Construction Regulations...
169
their expertise required during this stage and have low to moderate/moderate involvement in the other stages.
5.2 Stakeholder commitment towards H&S
All stakeholders can be deemed to be committed to H&S, as they not only perceive it as the most important project parameter, but also believe that it can be significantly influenced during all stages of a project. They regard H&S as important to very important across all phases of a project, but more so in the construction stage that was ranked first, followed by project close-out, design, tender documentation, concept and feasibility, and initiation and briefing stage. The stakeholders perceived H&S to be more influenced during the later stages rather than the earlier stages of projects. All stakeholders contribute to some extent to H&S. However, the vast majority of the respondents regard CHS professionals, contractors, and PMs as the primary stakeholders. Designers, PMs and CHS professionals perceived themselves as a major contributor to the implementation of Construction Regulations 2014.
5.3 Measures taken by stakeholders during the project planning and design stage
Measures taken by stakeholders during the project planning and design stage are inadequate to address project H&S needs, as only 20% of H&S actions are undertaken at frequencies between sometimes to often/often. The case study data confirmed that implementing H&S actions during project planning and design translated to better client involvement, and consequently better project performance, as observed from the sampled projects.
5.4 Measures taken by stakeholders in construction contracts to improve H&S
All stakeholders perceive ‘Provide a project specific H&S specification/H&S information as part of the tender documentation’ to be the measure most frequently taken during construction contracts to improve H&S. They also ranked first the ‘Consideration of H&S in construction contracts’ as the factor that contributes the most to optimum H&S on a project. Secondary data revealed that they have progressively improved in taking measures to improve H&S over time. Older contracts made no provision for review and approval of résumés of H&S personnel on projects as opposed to the ‘newer’ projects.

Acta Structilia 2018: 25(2)
170
5.5 Measures taken by stakeholders to select H&S-conscious contractors
All stakeholders perceive that the selection of contractors with good H&S performance records has the potential to make between some contribution to a near major/near major contribution to optimum H&S on a project. The case study data confirmed that projects, where H&S performance was used to select H&S-conscious contractors, showed both better stakeholder involvement and better project performance. It can be concluded that any measure taken to select H&S-conscious contractors improves project H&S.
5.6 The extent of their H&S participation in construction H&S
All stakeholders are regarded to participate in project H&S at varying levels during the six stages of projects. Clients are significantly involved in Stages 1 and 6; designers in Stage 3; QSs in Stages 4 and 5, and PMs and CHS professionals in Stage 5. In these respective stages, their involvement was deemed to be high to very high/very high. Active client participation in H&S during construction was found to make a near major to major/major contribution to optimum H&S on a project. The case study data confirmed that projects with greater client involvement were more likely to be finished on time and within budget.
5.7 The impact of Construction Regulations 2014 on H&S performance
The Construction Regulations 2014 are perceived to have had an impact. ‘Upstream activities’; ‘Increased H&S awareness on projects’, and having prompted for the need for PMs to consider/reference to H&S more frequently predominate. In addition, H&S actions are undertaken during all six stages of projects, but more significantly during Stage 5, and the frequency of H&S actions undertaken during the six project stages varies with each stakeholder, depending on the stage in which they are involved.
From the case study projects, the level of stakeholder involvement in H&S increased drastically over the years with improved project performance suggesting compliance, and the impact of the Construction Regulations on the project performance. The study also indicated that there is a direct relationship between stakeholder involvement and project H&S performance. The greatest H&S involvement of stakeholders in projects was during Stages 5 and 6, and the least during Stages 1 to 3.

Malindi & Smallwood • The impact of the Construction Regulations...
171
6. Conclusions Research indicates that improved H&S performance can be achieved on a project where there is a collaborative approach among all stakeholders during the project stages. Their attitude and involvement in H&S will impact on the H&S performance of contractors downstream. Based on the findings, it can be concluded that the clients’ and project stakeholders’ H&S involvement influences H&S performance. The impact of the Construction Regulations 2014 is evident in the water utility, as some of the H&S actions are undertaken during the six project stages, more so in Stage 5. In addition, the four case study projects provide evidence of their involvement in influencing project H&S performance. Furthermore, H&S awareness on projects, as well as having prompted for the need for project managers to consider/reference to H&S more frequently predominates among the list of ‘upstream’, ‘midstream’ and ‘downstream’ aspects/actions. This is significant, as PMs play a crucial role in driving further H&S improvements with the other stakeholders in order to integrate H&S in the design and construction phase, as revealed from the research. The study determined that the construction phase is still regarded as the most important stage to address H&S and this requires a mind-shift of the stakeholders to focus on the initial stages of the project in order to realise the benefits of H&S on a project. This will allow the water utility to progress to the transformative phase that will place emphasis on the integration of H&S into decision-making, eliminating H&S risks, and fostering a H&S culture.
7. RecommendationsH&S should be integrated in the initial stages of the project by streamlining all business processes to accommodate H&S in the planning and design phases of a project as well as to involve the CHS professionals to assist with the facilitation of H&S management. Literature confirms the gap in terms of built environment educational programmes not adequately addressing H&S. It is, therefore, necessary to plan for H&S training for stakeholders to improve their H&S contributions on a project. Cost estimates for H&S should be established at the design stage so that it is relevant to the project, and the evaluation process should be improved in order to select competent contractors. Follow-up research should be conducted to investigate if there are any improvements within the construction industry during the six project stages after the expiry of the CWP exemption period. Further research on the cost of H&S should be

Acta Structilia 2018: 25(2)
172
conducted to determine the costs of implementing H&S in order to establish cost estimates for H&S on future projects; a client and project stakeholder project H&S model for the six project stages based on best practices and legal requirements should be evolved, and the role of designers should be investigated to ascertain their contributions with respect to improving H&S performance, and their level of compliance to Construction Regulations 2014.
ReferencesAgumba, J., Pretorius, J.M. & Haupt, T. 2016. Health and safety management practices in small and medium enterprises in the South African construction industry. Acta Structilia, 20(1), pp. 66-88.
Cidb (Construction Industry Development Board). 2009. Construction Health and Safety in South Africa. Status & Recommendations. [online] Available at: <http://www.cidb.org.za/publications/Pages/Health-and-Safety.aspx> [Accessed: 10 December 2016].
Deacon, C. 2009. Linking H&S construction in the public sector: A case study. [online] Available at: <http://www.achasm.co.za/Portals/5/ACHASM_2013_CT_Linking-HS-to-Construction.pdf?ver=2015-08-13-133245-170> [Accessed: 10 December 2016].
Deacon, C. & Smallwood, J. 2016. The integration of design, procurement and construction relative to health and safety. In: Proceedings of the International Sustainability Ecology Engineering Design for Society (SEEDS) Conference, 14-15 September 2016, Leeds University. Leeds: LSI Publishing, pp. 329-340.
DoL (Department of Labour). 2012. Department of Labour meets chiefs of construction industry to improve the status of occupational health and safety in the industry. [online] Available at: <http://www.labour.gov.za/DOL/media-desk/media-alerts/department-of- labour-meets-chiefs-of-construction-industry-to-improve-the-status-ofoccupational-health-and-safety-in-the-industry>[Accessed: 8 November 2016].
Gambatese, J.A., Behm, M. & Rajendran, S. 2007. Design’s role in construction accident causality and prevention: Perspectives from an expert panel. Safety Science, 46(4), pp. 675-691. https://doi.org/10.1016/j.ssci.2007.06.010
Huang, X. 2003. The owner’s role in construction safety. PhD thesis. Florida, USA: University of Florida.

Malindi & Smallwood • The impact of the Construction Regulations...
173
Kamardeen, I. 2013. OHS electronic management systems for construction. New York: Routledge. https://doi.org/10.4324/ 9780203871522
Kikwasi, G.J. 2009. Client involvement in construction safety and health. In: Hinze, J., Bohner, S. & Lew, J. (Eds). Proceedings of the CIB W99 International Conference 14th Rinker International Conference on Evolution of, and Directions in Construction Safety and Health, 9-11 March 2009, Gainesville, Florida. Rotterdam, The Netherlands: CIB, pp. 55-69.
Krejcie, R.V. & Morgan, D.W. 1970. Determining sample size for research activities. Educational and Psychological Measurement, 30(3), pp. 607-610. https://doi.org/10.1177/001316447003000308
Latib, F.A., Zahari, H.Z.A., Hamid, A.R.A & Yee, K.C.W.H. 2016. Implementing occupational safety and health requirements in construction project. Journal of Advanced Research in Applied Sciences and Engineering Technology, 5(1), pp. 53-63.
Leedy, P.D. & Ormrod, J.E. 2015. Practical research: Planning and design. 11th edition. Harlow: Pearson.
Lopes, M., Haupt, T.C. & Fester, F.C. 2011. The influence of clients on construction health and safety conditions in South Africa. Occupational Health Southern Africa, March/April, pp. 9-14.
Mpanza, N., Mututo, J.G. & Pearl, R.G. 2008. Effectiveness of project debriefing procedures: A case study of the KZN region of South Africa. In: Proceedings of the 5th Postgraduate Conference on Construction Industry Development, 16-18 March 2008, Bloemfontein. Brooklyn Square: cidb, pp. 129-138.
Muiruri, G. & Mulinge, C. 2014. Health and safety management on construction projects sites in Kenya: A case study of construction projects in Nairobi county. In: Proceedings of the FIG Congress 2014: Engaging the Challenges – Enhancing the Relevance, 16-21 June, Malaysia. Malaysia: Pejuta, pp.1-14.
Phoya, S. & Eliufoo, H. 2015. Influences of stakeholders’ power on their participation in H&S risk management in construction projects in Tanzania. In: Proceedings of the 9th Built Environment Conference, 2-4 August 2015, Durban. Durban: Association of Schools of Construction of Southern Africa, pp. 421-434.
Powell, G. 2012. Construction contract preparation and management – From concept and completion. Hampshire: Palgrave Macmillan.

Acta Structilia 2018: 25(2)
174
RSA (Republic of South Africa). 2000. Project and Construction Management Professions Act, Act 48 of 2000. Pretoria: Government Printer.
RSA (Republic of South Africa). 2014. Construction Regulations. Regulation R. 84 in terms of the Occupational Health and Safety Act (Act 85 of 1993). Pretoria: Government Printer.
Said, I., Shafiei, M.W.M. & Omran, A. 2009. The roles of clients in enhancing construction safety. Annals of the Faculty of Engineering Hunedoara – Journal of Engineering, vii(2), pp.127-134.
Saifullah, N.M. & Ismail, F. 2012. Integration of occupational safety and health during preconstruction stage in Malaysia. Procedia – Social and Behavioral Sciences 35, pp. 603-610. https://doi.org/10.1016/j.sbspro.2012.02.127
Smallwood, J.J. 2004. The influence of clients on contractor health and safety (H&S). In: Khosrowshahi, F. (Ed.). Proceedings of the 20th Annual ARCOM Conference, 1-3 September 2004, Heriot Watt University. Association of Researchers in Construction Management, 2, pp.1095-105.
Smallwood, J.J. 2007. The nature and contents of health and safety (H&S) specifications. In: Proceedings of the 2nd Built Environment Conference, 17-19 June 2007, Port Elizabeth, South Africa. Association of Schools of Construction of Southern Africa, pp. 337-349.
Smallwood, J. & Venter, D. 2002. The influence of project managers on construction H&S in South Africa. The Australian Journal of Construction Economics and Building, 2(1), pp. 57-69. https://doi.org/10.5130/AJCEB.v2i1.2887
Sunindijo, R.Y. & Zou, P.X.W. 2015. Strategic safety management in construction and engineering. West Sussex: John Wiley & Sons, Ltd.
The Research Advisors. 2006. Required sample size. [online] Available at: <http:// research-advisors.com> [Accessed: 30 October 2018].
Tymvios, N. & Gambatese, J.A. 2015. Perceptions about design for construction worker safety: Viewpoints from contractors, designers, and university facility owners. Journal of Construction Engineering and Management, 142(2), pp. 1-11.
Wells, J. & Hawkins, J. 2010. Promoting construction health and safety through procurement: A briefing note for developing countries. London: Engineers against Poverty. Institution of Civil Engineers (ice).

Malindi & Smallwood • The impact of the Construction Regulations...
175
Appendix
PROJECT REVIEW: PROJECT H&S CRITERIA CHECKLIST SCORECARD
Project: A B C D
Project year start date:
Project context, contractor selection, contractual safety requirements and owner involvement in project safety
Tick appropriate block (Y/N)
A PROJECT CONTEXT:
1 Does the project work one shift? Y N
2 Does the project work five days a week or less? Y N
B SELECTION OF CONTRACTOR
3 Is the DIIR requirement for the contractor selection less than 2.0? Y N
4 Are the qualifications of the project team reviewed? Y N
5 Are the qualifications of the safety staff reviewed? Y N
6Does the evaluation of each contractor’s safety performance make a difference in awarding the contract?
Y N
C CONTRACTUAL SAFETY REQUIREMENTS
7 Does the project use a design-build contract? Y N
8Does the contract require the contractor to place at least one full-time safety representative on the project site?
Y N
9Does the contract require the contractor to submit all H&S personnel résumés for the owner’s approval?
Y N
10 Does the contract require the contractor to prepare a site-specific safety plan? Y N
11 Does the contract require the contractor to submit a safety policy signed by its CEO? Y N
12Does the contract require the contractor to provide minimum specified amount of training to construction workers?
Y N

Acta Structilia 2018: 25(2)
176
D CONTRACTOR SAFETY PROGRAMME REQUIREMENTS
D1 Which of the following are required to be included in the contractor’s H&S programme?
13 Contractor must prepare a plan for site emergencies Y N
14 Contractor must conduct pre-task H&S planning on the project site Y N
15 Contractor must implement a substance abuse testing programme Y N
D2 Owner’s involvement in project H&S management
16 Does the owner’s safety representative investigate near misses? Y N
17 Are injury statistics on the projects maintained separately on each contractor? Y N
18 Are all project injuries included in the owner’s overall measure of safety performance? Y N
19Does the owner actively participate (give presentations) during worker safety orientation/induction?
Y N
20 Is comprehension of safety training evaluated through testing? Y N
D3 Which of the following activities are performed by the owner’s site safety representative?
21 Enforcing safety rules and regulations Y N
22 Monitoring the implementation of pre-task planning/DSTI’s Y N
23 Participating in safety recognition programmes Y N
24 Participating in safety and/or toolbox meetings Y N
25Does the owner set zero injuries as its safety expectation before the commencement of site work?
Y N
Total count of Yes responses
% Involvement (Multiply the Yes count by 4) %

Malindi & Smallwood • The impact of the Construction Regulations...
177
What the score means:strong involvement moderate involvement
> 88 %> 52 % < 88 %
< 52 %
Strong involvement
Moderate involvement
Weak involvement
PROJECT PERFORMANCE OF THE SAMPLE PROJECTS:
No. IndicatorPerformance
Project A Project B Project C
1 Project DIFR
2 On time
3 Within budget
4 % H&S constitutes the project costs

178
Boekresensie • Book review
Pierre Oosthuizen
Mr Pierre Oosthuizen, Lecturer, Department of Quantity Surveying and Construction Management, University of the Free State, Bloemfontein 9301, South Africa. Phone: +27 (0) 51 401 3322 or +27 (0) 84 244 1344, email: <[email protected]>
DOI: http://dx.doi.org/10.18820/24150487/as25i2.7ISSN: 1023-0564e-ISSN: 2415-0487Acta Structilia 2018 25(2): 178-179© Creative Commons With Attribution (CC-BY)
Built: The hidden stories behind our structures by Roma Agrawal. Publisher: Bloomsbury. First publication: 2018
Bookstores and thunderstorms in Bloemfontein are few and scattered far apart. Whenever you find yourself in either of them, be grateful and cherish the moment. Global warming might explain scarcer thunderstorm activity, but to find the reason for the tragic declining demand for printed paper, we might have to ask the “millennials” to Google it.
My latest encounter with one of my favourite bookstores revealed the colourful cover of a newly released book entitled Built. This was neatly tucked away under the architecture section.
This book is a maiden voyage by an energetic and inspiring 35-year-old female engineer, originally from Mumbai, India. She is currently an associate director at AECOM and a fellow of the Institution of Civil Engineers. Roma Agrawal obtained her BA degree in Physics from the University of Oxford in 2004, and her MSc Structural Engineering degree from Imperial College London, in 2005. Her fascinating résumé includes the impressive “The Shard” building in London (the tallest building in western Europe). She shares her engineering knowledge and experience as well as some personal stories with her readers in a practical and educational book, written in the first-person.
Similar to the title, the chapter headings consist of single noun terms with no

Aneke & Awuzie • Conversion of industrial wastes...
179
numbering system. The introductory chapter, “Storey”, could also be spelled “Story”, as it tells the story of how the author fell in love with physics and engineering. The remainder of the chapters, “Force”, “Fire”, “Clay”, “Metal”, “Rock”, and so on relate to the content of the chapter, except for the “Clean” chapter dealing mainly with the ironically dirty London sewerage system. Each chapter opens with a personal experience that flows into an engineering problem. There is, however, hardly any reference to the invaluable role of other professions in the built environment. It would have been interesting to learn about the design, financial, and execution challenges encountered with “The Shard”. Chapters such as “Price”, “Design”, Space”, and “Time” would not have looked out of place. These may be the topics for her second book.
In my opinion, the perfect target market for this book would be the “millennial” or “Google” generation. Perhaps for tertiary scholars who consider a professional career in the built environment. (Does this generation read printed books?)
If you want to spoil your teenager this Christmas with a well put together vintage present, consider Built for R323 at Exclusive Books or R530 at Amazon.
Merry Christmas!

180
ACTA STRUCTILIA
INLIGTING AAN OUTEURS1. Acta Structilia publiseer artikels in
Afrikaans en Engels. Die verlangde lengte vir ’n artikel is tussen 4 000 en 12 000 woorde.
2. Voornemende outeurs moet ’n elektro-niese kopie van ’n artikel in MS Word formaat (oorspronklike word deur die outeur bewaar) voorlê deur dit per e-pos aan te stuur (sien e-pos adres by punt 28.).
3. Enige toepaslike artikel, in ’n verstaanbare skryfstyl, duidelik uiteengesit en reeds taalversorg, word verwelkom, vergesel van ’n verklaring dat dit die oorspronklike werk van die outeur(s) is en dat die artikel slegs aan Acta Structilia aangebied is.
4. Tabelle en figure: Daar moenie meer as 10 figure en tabelle in totaal per artikel wees nie. Alle onderskrifte moet in die teks verskaf word. Afkortings/akronieme wat in figure en tabelle gebruik word, moet in die opskrif/sleutel of voetnoot verduidelik word. Figure moet gestuur word in hoë resolusie TIFF formaat (vermy gekomprimeerde formate soos GIF en JPEG). Maak seker dat die figure duidelik en leesbaar sal wees wanneer dit verminder word. Tabelle moet in ’n geredigeerde formaat in Word of Excel ingedien word en nie as foto’s nie. Excel lêers moet opgelaai word as individuele spreivelle, nie die hele werkboek nie.
5. Die hoofredakteur behou die reg voor om die artikel(s) te verander waar nodig met betrekking tot die styl en aanbieding van die publikasie. As uitgebreide wysi-gings deur die beoordelaars aanbe veel word, sal die artikel(s) aan die outeur teruggestuur word.
6. Kopiereg word aan die outeur(s) by aanvaarding van die artikel oorgedra.
7. Teksgedeeltes van artikels moet in Microsoft Word, Ariel skrif, font grootte 12, enkel spasiëring gedoen word.
8. Die titel van die artikel moet kort en bondig wees en in beide Afrikaans en Engels aangebied word. Voorsien gepaste opskrifte en subopskrifte waar nodig.
9. ’n Kort opsomming (tussen 200-250 woorde), in beide Afrikaans en Engels, moet aan die begin van die teks aangebring word.
10. Toepaslike sleutelwoorde in Afrikaans en Engels moet onder die opsomming aangebring word.
11. Die opsomming moet begin met 2-3 sinne wat ’n inleiding tot die studieveld gee en die spesifieke probleem wat ondersoek word, gevolg deur ’n enkelsin oor die hoofbevindings (of gevolgtrekkings, in die geval van ’n oorsigartikel), en ’n verdere 2-3 sinne wat hierdie bevin-dinge/gevolgtrekkings in konteks plaas sodat lesers bewus gemaak word van die implikasies van die bevindings. Gewoonlik word bronverwysings nie in opsomming gegee nie.
12. Literatuuroorsigte moet internasionale navorsing oor soortgelyke onderwerpe identifiseer en ’n duidelike gaping in navorsingsartikels met betrekking tot internasionale voorpuntnavorsing aandui. Skrywers moet duidelik demon-streer hoe hul navorsing verband hou met dié van ander geleerdes oor soortgelyke onderwerpe.
13. Die belangrikheid van die hoofbe-vindinge of gevolgtrekkings behoort nie ’n opsomming van die resultate te wees nie, maar moet die bydrae wat die resultate tot die veld lewer, weerspieël en ook hoe die resultate in hulle onderskeie velde en op ander terreine van toepassing is. Die bevindinge moet begin met algemene bydraes en voort-gaan met meer spesifieke bydraes. Die belangrikheid van die bevindings sal gepubliseer word met die doel om groter belangstelling te bevorder, nie net onder lesers in die veld nie, maar ook vir ander lesers. Die belangrike bevindinge moet dus vir ’n nie-spesialis geskryf word.
14. Opskrifte en onderskrifte word in Arabiese syfers genommer, geskei deur ’n punt en hoogstens tot drie vlakke, waarna ’n letter in hakies gebruik word, bv. 1. en 1.1 gevolg deur 1.1.1 en daarna a) ens.
15. Bronverwysings in die teks geskied volgens die Harvardstyl van verwysing: (Outeur, datum: bladsynommer[s]): bv. (Schleien, 2014: 20-23).
16. Net egte voet- en eindnote met die tersaaklike inligting moet gebruik word. Die Harvardstyl van verwysing is hier van toepassing.
17. Die verwysingslys volgens die Harvardstyl van verwysing moet volledig in alfa-betiese volgorde aangebied word. Bv. Sun, M. & Howard, R. 2014. Understan-ding I.T. in construction. London: Spon Press.

181
18. ’n Kopie van alle internet dokumente wat in die teks verwys en gelys is in die bibliografie, moet die artikel vergesel.
19. Aanhalings word nie kursief gedruk nie, en word in dubbelaanhalingstekens aangedui. Invoegings binne aanhalings word in blokhakies aangedui. Aanhalings wat langer as drie reëls is, word geïn-denteer en het nie aanhalingstekens nie.
20. Slegs standaard-afkortings word aan-beveel. Afkortings vir instellings kan gebruik word nadat dit vir die eerste keer volledig uitgeskryf is, met die afkorting daarna in hakies, vir terugverwysing.
21. Kursief moet nie oormatig gebruik word nie, indien wel, slegs vir konvensionele Latynse uitdrukkings bv. per se en vir woorde in ander tale.
22. Beklemtonings kry enkelaanhalingstekens.
23. Besonderhede van die oorsprong van ’n artikel moet aangedui word, soos in die geval van ’n kongresreferaat. Artikels word net vir keuring oorweeg indien vergesel van ’n verklaring dat dit in geheel of gedeeltelik nie elders vir publikasie voorgelê is, of reeds gepubliseer is nie.
24. Artikels word anoniem gerefereer. Die outeur(s) kan die name en adresse van tot drie vakkundiges (nie aan outeur[s] se eie instansie van werk verbonde nie) voorstel wat as referente sou kon optree.
25. Die outeur(s) van artikels wat geplaas word, sal elk twee komplimentêre kopieë van die betrokke uitgawe van Acta Structilia ontvang.
26. ’n Artikel moet vergesel word van die volledige titel, kwalifikasie en affiliasie, adres, telefoon- en faksimiliee-nommers en indien moontlik ’n e-posadres van die betrokke outeur(s).
27. Neem kennis dat ’n publikasieheffing van R50 per bladsy op die artikels wat gepubliseer word, betaalbaar is. ’n Faktuur sal aan die hoofouteur ge stuur word.
28. Rig u bydrae(s) aan:
Die Redakteur: Acta Structilia Interne Posbus 47 Universiteit van die Vrystaat Posbus 339 Bloemfontein, 9300 Suid-Afrika
E-pos adres: [email protected]

182
ACTA STRUCTILIA
INFORMATION FOR AUTHORS1. An article may be submitted in Afrikaans
or English. The desired length for an article is between 4 000 en 12 000 words.
2. A copy of the typed article must be submitted (authors keep the original) in electronic format (MS Word) forwarded via email (see point 28.). The format must be kept as plain as possible for extracting and printing purposes.
3. An edited (proofread) article on any relevant topic, well presented and written in easy understandable style, will be considered for publishing on the understanding that they are the original work of the authors named, and that they are being offered only to Acta Structilia.
4. Tables and figures: There should be no more than 10 figures and tables in total per article. All captions must be provided in the text. Abbreviations/acronyms used in figures and tables must be explained in the heading/legend or footnote. Figures must be provided as high-resolution images in TIFF format (avoid compressed formats like GIF and JPEG). Ensure that your figures will be clear and legible when reduced in size. Tables must be submitted in editable format in Word or Excel and not as image files. Excel files should be uploaded as individual sheets, not the entire workbook.
5. The Editor-in-Chief reserves the right to alter the article(s) where necessary with regard to the style and presentation of the publication. If extensive alterations are advised by adjudicators the article(s) will be returned to the author.
6. Copyright is transferred to the author(s) when an article is accepted for publication.
7. Article content must be written in Microsoft Word, Ariel, font size 12, single spacing.
8. Titles must be short and concise, but informative. Supply suitable headings and sub-headings where necessary. The title must be in both Afrikaans and English.
9. A short abstract (between 200-250 words), in both Afrikaans and English, must be provided at the beginning of the text.
10. Applicable keywords in Afrikaans and English must be given after the summary.
11. The summary should start with 2–3 sentences that provide an introduction to the field and the particular problem investigated, followed by a one-sentence statement of your main findings (or conclusions, in the case of a Review Article), and a further 2–3 sentences placing these findings/conclusions in a general context so that readers are made aware of the implications of the findings. Summary paragraphs typically do not include references.
12. Literature reviews should identify inter-national research on similar topics and indicate a clear gap in research articles related to international cutting edge research. Authors should clearly demonstrate how their research relates to that of other scholars on similar topics.
13. The significance of the main findings or conclusions should not be a summary of the results, but should reflect the contribution the results make to the field, and how the results are applicable in their respective field and in other fields. The points of significance should start with general contributions and proceed with more specific contributions. The significance of the findings will be published with the aim of promoting greater interest not only from readers in the field but also from a wider readership. The points of significance should there-fore be written for a non-specialist.
14. Use Arabic numbers with full stops in between for headings and subheadings, i.e. 1. followed by 1.1 and 1.1.1 up to a maximum of three levels. After that use a) etc.
15. Source references in the text must be in the Harvard style of referencing (Author, date: pages). i. e. (Schleien, 2014: 20-40).
16. Foot- and endnotes are likewise done in the Harvard style of referencing.
17. The references list (Harvard style of referencing) should contain all the relevant information, and be listed alphabetically according to the names of the authors. i. e. Sun, M. & Howard, R. 2014. Understanding I.T. in construction. London: Spon Press.
18. A copy of internet documents cited in the text and listed in the references must accompany the article.
19. Quotations are not in italics and must be written in double inverted commas. Inserts in quotations are placed in block

183
brackets. Quotations longer than three lines are indented and are placed without quotations marks.
20. Avoid uncommon abbreviations and acronyms. Abbreviations should be limited to those in general use. Names of corporations, etc are at first written out in full with the abbreviation in brackets after which the abbreviated form may be used.
21. Italics are preferred for stereotyped Latin terms such as per se and for words in other languages.
22. Use single inverted commas to empha-sise words or phrases.
23. Details concerning the origin of the article should be indicated, i.e if it was presented at a congress. An article will only be referred to the panel of referees if the author clearly states that it had not received prior publication and is not under consideration for publication elsewhere; also that the research has not been submitted for publication nor has it been published in whole or in part elsewhere.
24. Authors may submit the names and addresses of three scholars (experts) in his field (not members at own place of work) as possible adjudicators.
25. The author(s) will receive two compli-mentary copies of the relevant issue of Acta Structilia.
26. The article must contain the title, qualifi cations and affiliations of the author(s), the address, telephone and facsimile numbers and if possible, the email address.
27. Note that a publication fee of R50-00 per page is payable for every article published. An invoice will be sent to the main author.
28. Editorial address:
The Editor-in-Chief: Acta Structilia Internal Post Box 47 University of the Free State PO Box 339 9300 Bloemfontein South Africa
E-mail address: [email protected]

Referente en konsultante • Referees and consultants
Prof. Chris Adendorff (NMU Business School, Nelson Mandela University, Port Elizabeth, South Africa)
Dr Justus Agumba (Department of Construction Management and Quantity Surveying, University of Johannesburg, South Africa)
Dr Kofi Agyekum (Department of Building Technology, Kwame Nkrumah University of Science and Technology, Kumasi, Ghana)
Mr Chris Allen (Department of Construction Management, Nelson Mandela University, Port Elizabeth, South Africa)
Dr Bankole Awuzie (Department of Built Environment, Central University of Technology, Bloemfontein, South Africa)
Prof. Hoffie Cruywagen (Department of Constuction Economics, University of Pretoria, South Africa)
Prof. Stephen de la Harpe (Faculty of Law, North-West University, Potchefstroom, South Africa)
Dr Oluwaseun Dosumu (Department of Building, University of Lagos, Nigeria)
Prof. Fidelis Emuze (Department of Built Environment, Central University of Technology, Free State, South Africa)
Dr Franco Geminiani (formerly from Department of Construction Management, NMU, Port Elizabeth, South Africa)
Dr Richard Jimoh (Department of Building, Federal University of Technology, Nigeria)
Dr Aly Karam (Department of Town and regional planning , University of the Witwatersrand, South Africa)
Dr Spencer Lazarus (Managing Director: SL Man Facilities and Project Management, Port Elizabeth, South Africa)
Prof. Kathy Michell (Deparment of Construction Economics and Management, University of Cape Town, South Africa)
Mr Lesetja Mabona (Senior Manager, Health Facilities Management, Department of Health, Northern Cape, Kimberley, South Africa)
Prof. Innocent Musonda (Department of the Quantity Surveying and Construction Management, University of Johannesburg, South Africa)
Prof. George Ofori (School of Built Environment and Architecture, London South Bank University, United Kingdom)
Dr Obinna Ozumba (School of Construction Economics and Management University of the Witwatersrand, South Africa)
Mr Massoud Shaker (Head: Infrastructure at National Department of Health, Pretoria, South Africa)
Ms Michélle Schoeman (Faculty of Law, North-West University, Potchefstroom, South Africa)
Prof. Van Aardt Smit (Department of Business Management, University of the Free State, South Africa)
Dr Werner Vermeulen (Department of Business Management, University of the Free State, South Africa)
Emeritus Prof. Basie Verster (Director: VersterBerryVerster QS, Bloemfontein, South Africa)
Prof. Abimbola Windapo (Department of Construction Economics and Management, University of Cape Town, South Africa)
Prof. Hendrik Wolmarans (Department of Financial Management, University of Pretoria, South Africa)

Acta Structilia 2018:25 (2) ISSN 1023-0564 e-ISSN 2415-0487
Acta Structilia is endorsed by the South African Council for the Quantity Surveying Profession (SACQSP) for promoting research and Continuing Professional Development (CPD).
Inhoud • Contents
Navorsingsartikels • Research articlesAdoption of BIM in the construction Mutonyi Nasila 1 industry in Kenya Chris Cloete
Factors influencing the performance of Kofi Agyekum 39 safety programmes in the Ghanaian Barbara Simons construction industry Yeboah Botchway
Evaluating credit accessibility predictors Olanrewaju Balogun 69 among small and medium contractors in Justus Agumba the South African construction industry Nazeem Ansary
The use and benefits of Quick Response Tashmika Ramdav 94 Codes for construction materials in Nishani Harinarain South Africa
Conversion of industrial wastes into Frank Ikechukwu Aneke 119 marginal construction materials Bankole Awuzie
The impact of the Construction Mandy Malindi 138 Regulations 2014 on a water utility’s John Smallwood projects’ health and safety (H&S) performance in South Africa
Boekresensie • Book reviewBuilt: The hidden stories behind our Pierre Oosthuizen 178 structures by Roma Agrawal
Inligting aan outeurs · Information for authors 180